
7$; 5$7( &$5' ,1&20( 7$; :,7++2/',1* 5$7(6 6$/(6 7$; :,7 ...
Upload
fabio-ramalhoCategory
view
8download
0
1
Part III Bioreaction Kinetics

2
Chapter 8 Kinetics of Homogeneous Bioreactions
The heart of a bioprocess is the bioreactor or fermenter, where the major biochemical reactions occur. In many bioprocesses, characteristics of the bioreaction determine to a large extent the economic feasibility of the project.
How fast a reaction is happening can be described by its kinetics, therefore, bioreaction kinetics is always playing most important role in Bioreaction Engineering.
Most bioreactions are carried out in a homogeneous system in which enzymes or cells are suspended within bioreactors. Kinetics of homogeneous reaction is also the basis of heterogeneous bioreactions.

3
8.1 Basic Reaction TheoryReaction theory has two fundamental parts: reaction thermodynamics and reaction kinetics. Reaction thermodynamics is concerned with how far the reaction can proceed; no matter how fast a reaction is, it cannot continue beyond the point of chemical equilibrium. On the other hand, reaction kinetics is concerned with how fast at which reactions occur.
8.1.1 Reaction Thermodynamics
A + bB ↔ Yy + zZ (8.1)
bBeAe
zZe
yYe
CCCCK = (8.2)
4
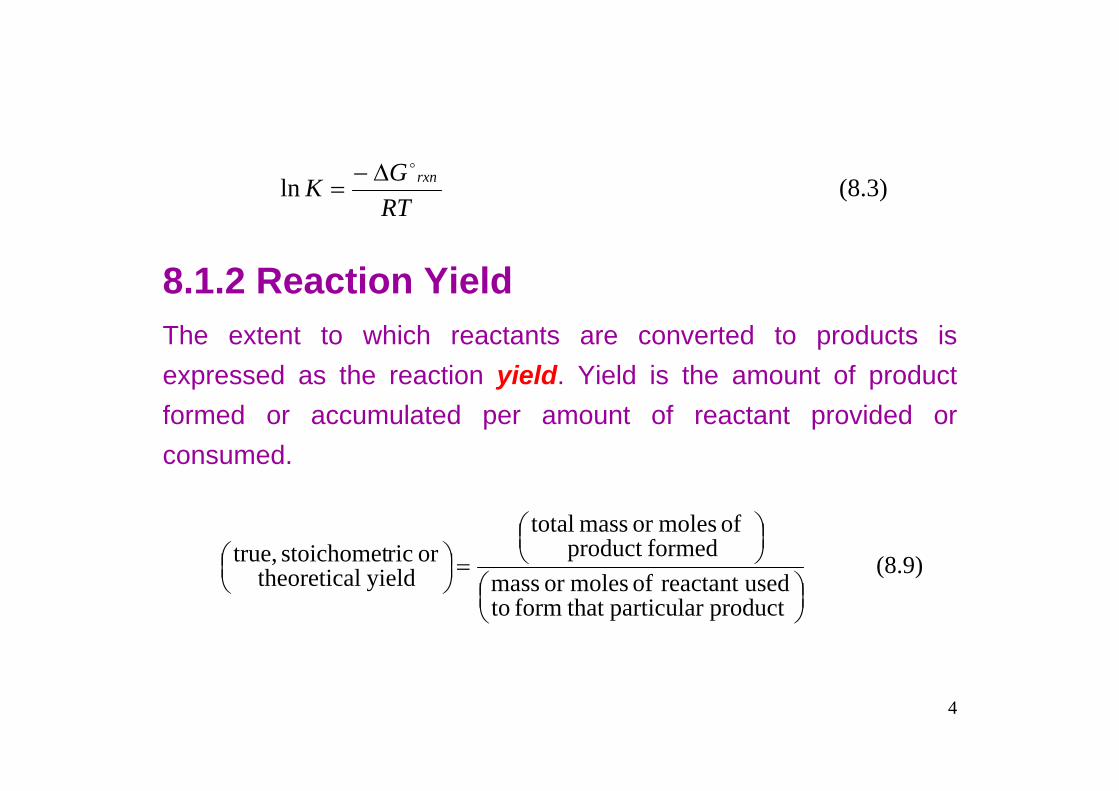
8.1.2 Reaction YieldThe extent to which reactants are converted to products is expressed as the reaction yield. Yield is the amount of product formed or accumulated per amount of reactant provided or consumed.
RTGK rxn
oΔ−=ln (8.3)
⎟⎠⎞⎜
⎝⎛
⎟⎠⎞⎜
⎝⎛
=⎟⎠⎞⎜
⎝⎛
product particular that form tousedreactant of molesor mass
formedproduct of molesor mass total
yieldtical theoreor ricstoichomet ,true (8.9)

5
8.1.3 Reaction Rate
⎟⎠⎞⎜
⎝⎛
⎟⎠⎞⎜
⎝⎛
=⎟⎠⎞⎜
⎝⎛
consumed reactant of molesor mass total
presentproduct of molesor mass
ieldapparent yor observed (8.10)
RA = − dtdM A (8.14)
RB = − dtdM B RY = dt
dMY RZ = dtdM Z (8.15)

6
Total rate
Total rate is useful for specifying the output of a particular reactor or plant. Production rate for a factory is often expressed as total rate.
Volumetric rate
Specific rate
μA = dt
dMEX
A)1or 1(− (8.18)
rA = dt
dCA− (8.17)

7
8.1.4 Reaction KineticsReaction kinetics refers to the relationship between rate of reaction and conditions which affect reaction velocity, such as reactant concentration and temperature. These relationships are conveniently described using kinetic expressions or kinetic equations.
8.1.5 Effect of Temperature on Reaction RateArrhenius equation
μA = dt
dCex
A)1or 1(− (8.19)
rA = kCAa CB
b (8.20)
RTE
Aek−
= (8.21)

8
Time,
Con
cent
ratio
n,A
Slope of tangentrA
t 1 t
C
Figure 8.1 The change of reactant (A)concentration with time during reaction
8.1.6 Calculation of Reaction Rate

9
8.2 General Reaction Kinetics
The kinetics of many biological systems is either zero- or first-orderor a combination of them called Michaelis-Menten kinetics for enzyme catalytic reactions and Monod equation for cell growths. Kinetics expressions for biological systems are discussed in this section.
8.2.1 Zero-Order Kinetics
If a reaction obeys zero-order kinetics, the reaction rate is independent of reactant concentration. The kinetic expression is:
rA = k0 (8.23)

10
and
If the reaction takes place in a closed, constant-volume system, that is:
Initial condition CA = CA0 at t = 0 gives:
k0 = k0’e or k0 = k0
’’x (8.24)
rA = k0 = dt
dCA− (8.25)
CA = ∫ −=− tkCdtr AA 00 (8.26)

11
8.2.2 First-Order KineticsIf a reaction obeys first-order kinetics, the relationship between reaction rate and reactant concentration is as follows:
and
or
rA = k1CA (8.27)
tkeCC 10AA
−= (8.28)
lnCA = lnCA0 − k1t (8.29)

12
8.2.3 Michaelis-Menten Kinetics The kinetics of most enzyme reactions are well reasonably represented by the Michaelis-Menten equation:
and
Usually, for biological systems:
Am
AmaxA CK
Cr
+ν
= (8.30)
νmax = kea (8.31)
SK
S+
ν=ν
m
max (8.32)

13
Zero-orderregion
First-orderregion
νmax
νmax
2
SKm
Figure 8.2 Michaelis-Menten plot
ν

14
For high substrate concentrations, S >> Km:
For low substrate concentrations, S << Km:
maxmax ν=
ν≈ν
SS (8.33)
SKm
maxν≈ν (8.34)

15
Table 8.1 Michaelis constants for some enzyme-substrate systems*
Enzyme Source SubstrateKm
(mM)
Alcohol dehydrogenase Saccharomyces cerevisiae Ethanol 13.0
α-AmylaseBacillusstearothermophilus
Porcine pancreas
StarchStarch
1.00.4
β-Amylase Sweet potato Amylose 0.07
Aspartase Bacillus cadaveris L-Aspartate 30.0
β-Galactosidase Escherichia coli Lactose 3.85
Glucose oxidase Aspergillus niger
Penicillium notatum
D-Glucose
D-Glucose
33.0
9.6
Histidase Pseudomonas fluorescens L-Histidine 8.9
Invertase Saccharomyces cerevisiae
Neurospora crassa
Sucrose
Sucrose
9.1
6.1
Lactate dehydrogenase Bacillus subtilis Lactate 30.0
Penicillinase Bacillus licheniformisBenzyl-penicillion 0.049
Urease Jack bean Urea 10.5

16
8.2.4 Effect of Conditions on Enzyme Reaction rate
Figure 8.3 Arrhenius plot for catalase
0
0.2
0.4
0.6
0.8
3.3 3.4 3.5 3.6
log(ν
)
T1 103 , K-1
107
1.0

17
Figure 8.4 Arrhenius plot for catalase
1.7
1.9
2.1
2.3
2.5
2.9 3.1 3.3 3.5 3.7
log
, (
mm
O m
in
)3
-12
ν
T1 103 , K-1
2.7

18
8.3 Kinetics of Enzyme Deactivation
Enzymes are protein molecules of complex configuration that can be destabilized by relatively weak forces. In the course of enzyme-catalyzed reactions, enzyme deactivation occurs at a rate which is dependent on the structure of the enzyme and the reaction condition. Environmental factors affecting enzyme stability include temperature, pH, ionic strength, mechanical forces and presence of denaturants such as solvents, detergents and heavy metals. Because the amount of active enzyme can decline considerably during reaction, in many applications the kinetics of enzyme deactivation are just as important as the kinetics of the reaction itself.

19
and
and
half-life
dt
dea− = rd = kdea (8.37)
tkaa
deee 0
−= (8.38)
νmax = tktka
dd eeke −− ν= 0max0 (8.39)
d
h kt 2ln
= (8.40)

20
Rate of enzyme deactivation is strongly dependent on temperature. This dependency is generally well described using the Arrheniusequation:
According to Eq.(8.41), a temperature rise of 10 °C between 30 °C and 40 °C will increase the rate of enzyme deactivation by a factor between 10 and 150. The stimulatory effect of increasing temperature on rate of enzyme reaction has already been discussed before. As shown here, raising the temperature also reduces the amount of active enzyme present. It is clear that temperature has a critical effect on enzyme kinetics.
RTE
d
d
Aek−
= (8.41)

21
8.4 Yields in Cell Culture
When we consider processes such as cell growth, we are in effectlumping together many individual enzyme and chemical conversions. Despite this complexity, yield principles can be applied to cell metabolism to relate flow of substrate in metabolic pathways to formation of biomass and other products. Yields which are frequently reported and of particular importance are expressed using yield coefficients or yield factors. Several yield coefficients, such as yield of biomass from substrate, yield of biomass from oxygen, and yield of product from substrate, are incommon use. Yield coefficients allow us to quantify the nutrientrequirements and production characteristics of an organism.

22
Table 8.2 Some metabolic yield coefficients
Yield symbol Definition
YX/SMass or moles of biomass produced per unit mass or moleof substrate consumed
YP/SMass or moles of product formed per unit mass or mole ofsubstrate consumed
YP/XMass or moles of product formed per unit mass or mole ofbiomass formed
YX/OMass or moles of biomass produced per unit mass or moleof oxygen consumed
YC/SMass or moles of carbon dioxide formed per unit mass ormole of substrate consumed
RQMoles of carbon dioxide formed per mole of oxygenconsumed
YATP Mass or moles of biomass formed per mole of ATP formed
YkcalMass or moles of biomass formed per kilocalorie of heatevolved during fermentation

23
8.4.1 Overall and Instantaneous YieldsFor a closed, constant-volume reactor in which the reaction between F and G is the only reaction involving these components,if rF and rG are volumetric rates of production and consumption of F and G, respectively, instantaneous yield can be calculated as follows:
For cell growth, YX/S is defined as:
G
F
GGF r
rdtdGdtdF
dGdF
GFY =−=−=
ΔΔ
−=→Δ /
/)(lim0
/ (8.43)
rate nconsumptio substrate
rate growth/ ==
S
XSX r
rY (8.44)

24
8.4.2 Theoretical and Observed Yields
This is particularly important for cell metabolism because there are always many reactions occurring at the same time; theoretical and observed yields are therefore very likely different. Consider the example of biomass yield from substrate, YX/S. If the total mass of substrate consumed is ST, some proportion of St equal to SG will be used for growth while the reminder, SR, is channeled into other products and metabolic activities not related to growth. Therefore, the observed biomass yield based on total substrate consumption is:
RGT
SXSS
XSXY
Δ+ΔΔ
−=ΔΔ
−=/' (8.45)

25
In comparison, the true or theoretical biomass yield from substrate is:
G
SX SXY
ΔΔ
−=/ (8.46)
Table 8.3 Observed biomass yields for several microorganisms*
Microorganism SubstrateObserved biomass yield, Y’
X/S(g g−1)
Aerobacter cloacae Glucose 0.44
Penicillium cbrysogenum Glucose 0.43
Candida utilisGlucose
Acetic acidEthanol
0.510.360.68
Candida intermedia n-Alkanes(C16 ~ C22)
0.81
Pseudomonas sp. Methanol 0.41
Methylococcus sp. Methane 1.01* From S. J. Pirt, 1975, Principles of Microbe and Cell Cultivation, Blackwell Scientific,

26
8.5 Cell Growth Kinetics
When a small quantity of living cells is inoculated into the medium contained essential nutrients at a suitable condition, such as temperature, pH, etc., the cells will grow. The growth processes of interest to us have two different manifestations according to the morphology of the cells involved. For unicellular organisms which divide as they grow, increase in biomass are accompanied by increases in the number of cells present. This case, which confronts us with a problem in population growth, will occupy most of our attention in this section. When considering growth of molds, however, the situation is quite different. Here, the length and number of mycelia increase as the organism grows. The growing mold thusincreases in size and density but not necessary in numbers.

27
irst we must recognize that two interacting systems are involved ⎯ the
Environment (medium) Multicomponent Reaction in solution Acid-base equilibria Variable pH, T, …… Changing rheological
properties Multiphase Spatial nonuniformity
Nutrients
Product
Heat
Mechanical
interactions
Cell population Multicomponent Cell-to-cell
heterogeneity Multireaction Internal controls Adaptability Stochastic Genetic drift
Figure 8.5 Summary of some of the important parameters,phenomena, and interactions which determine cell population kinetics
Substrates

28
Figure 8.6 Different perspectives for cell population kinetics
Unstructured StructuredU
nseg
rega
ted Most idealized case
Segr
egat
ed
Actual case
Cell populationtreated as one-component
Multicomponentbut average celldescription
individual cells
Multicomponentdescription of cell-to-cell heterogenerity
Balanced growth
Balanced growth
Average Average
but heterogeneousSingle component

29
8.5.1 Ideal Bioreactors for Kinetic MeasurementsIt is difficult to obtain useful kinetic information on cell populations from bioreactors that have spatially nonuniform conditions. Hence it is desirable to study kinetics in bioreactors that are well mixed. We examine here well-mixed batch bioreactors and well-mixed continuous flow bioreactors.
Many biochemical processes involve batch growth of cell populations. After seeding a liquid medium with an inoculum of living cells, nothing except possibly some gas is added to the culture or removed from it as growth proceeds. Typically in such a bioreactor, the concentrations of nutrients, cells, and metabolic products vary with time as growth proceeds.

30
For a steady-state continuous culture illustrated before, which is frequently called chemostat, the mass balance equation is as follows:
So,
The parameter D, called the dilution rate, is defined by
F(ci0 − ci) = VR(RG − RC) (8.48)
)()( 00 iiiiR
CG ccDccVFRR −=−=− (8.49)
RV
FD = (8.50)

31
FermenterMedium
Alkali
Product
Computer control unitGas mixer
RotametersFilters
AirCO2 N2
pHDOTRotating speed
Peristalticcollectionpump
Figure 8.7 The diagram for continuous cultivation of cells using CSTR

32
8.5.2 Batch Growth
Figure 8.7 Typical batch growth curveTime
ln(v
iabl
e ce
ll co
ncen
tratio
n)
Lag phaseAcceleration phase
Decline Stationary phaseDeath
phase
Growth phase
phase

33
Table 8.4 Summary of batch cell growth
Phase Description Specific growth rate
Lag Cells adapt to the new environment;no or very little growth μ ≈ 0
Acceleration Growth starts μ < μmax
Growth Growth achieves its maximum μ ≈ μmax
DeclineGrowth slows due to nutrientexhaustion or build-up of inhibitoryproducts
μ < μmax
Stationary Growth ceases μ = 0
Death Cells lose viability and lyse μ < 0

34
For growth phase,
(8.51)
⎯ first-order autocatalytic reaction
with initial condition x = x0 at t = 0, integrating gives:
(8.52)
or
(8.53)
The doubling time td
(8.54)
xdtdxrx μ==
texx μ0=
txx μ+= 0lnln
μ2ln
=dt

35
8.5.3 Balanced GrowthIn an environment favorable for growth, cells regulate their metabolism and adjust the rates of various internal reactions so that a condition of balanced growth occurs. During balanced growth, composition of the biomass remains constant. Balanced growth means that the cell is able to modulate the effect of external conditions and keep the cell composition steady despite changes in environmental conditions.
For biomass composition to remain constant during growth (unstructured model), the specific production rate of each component in the culture must be equal to the cell specific growth-rate μ.

36
(8.55)
where z is a cellular constituent such as protein, RNA, polysaccharide, etc., rZ is the volumetric rate of production of z, and z is the concentration in the reactor volume. Therefore, during balanced growth the doubling time for each cell component must be equal to td for growth. Balanced growth cannot be achieved if environmental changes affect rate of growth differently on individual cells. In most cases, balanced growth occurs at the same time as exponential growth.
zrz μ=

37
8.5.4 Effect of Substrate ConcentrationDuring the growth and decline phases of batch culture, the specific growth rate of cells is dependent on the concentration of many nutrients in the medium. But, in many cases, a single substrate exerts a dominant influence on the rate of growth; this component is known as the growth-rate-limiting substrate or, more simply, the growth-limiting substrate. The growth-limiting substrate is often a carbon or nitrogen source, although in some cases it maybe oxygen or another oxidant such as nitrate.
During balanced growth, the specific growth rate is related to the concentration of growth-limiting substrate by the Monod equation, a homologue of the Michaelis-Menten expression:

38
SKS
+μ
=μS
max (8.56)
Zero-orderregion
First-orderregion
μmax
μmax
2
SKS
Figure 8.8 Monod equation
μ

39
Table 8.5 KS values for several microorganismsMicroorganism
(genus)Limitingsubstrate
KS
mg l−1
Saccharomyces Glucose 25
EscherichiaGlucoseLactose
Phosphate
4.0201.6
Aspergillus Glucose 5.0
Candida GlycerolOxygen
4.50.042
Pseudomonas MethanolMethane
0.70.4
Hansenula MethanolRibose
120.03.0
Cryptococcus Thiamine 1.4×10⁻⁷
Klebsiella
CO2MagnesiumPotassiumSulphate
0.40.560.392.7

40
Verhulst
Contois
Tessier
)1(max
max xx
−μ=μ (8.57)
SBx
S+
μ=μ max (8.58)
)1(maxSK
S
e−
−μ=μ (8.59)

41
Moser
Typically, the values of KS are very small, of the order of mg per liter for carbohydrate substrates and μg per liter for other compounds such as amino acids. The level of growth-limiting substrate in culture media is normally much greater than KS. As a result, cell growth can be approximated using zero-order kinetics with growth rate independent of substrate concentration until Sreaches very low values.
If S is greater than about 10KS, μ ≈ μmax. S usually remains > 10KS
during most of the culture period, this means μ will remain
1max )1( −
λ+μ=μsKS (8.60)

42
relative constant and equal to μmax in batch culture until the medium is virtually exhausted of substrate. When S finally falls below 10KS, transition from growth to stationary phase can be very abrupt as the low level of substrate is rapidly consumed by the large number of cells present.
The Monod equation is by far the most frequently-used expression relating growth rate to substrate concentration. However, it is valid only for balanced growth and should not be applied when growth conditions are changing rapidly. There are also other restrictions, for example, the Monod equation has been found to have limited applicability at extremely low substrate levels.

43
When growth is inhibited by high substrate or product concentrations, extra terms can be added to the Monod equation to account for these effects.
If cells are cultured in a CSTR, the mass balance for biomass can be written as follows:
Usually x0 = 0, therefore:
D(x0 − x) + μx = 0 (8.61)
0)( max0 =
+μ
+− xSK
SxxDS
(8.62)
D = μ (8.65)

44
The mass balance on substrate at steady-state gives
The critical dilution rate, Dmax:
)(max
0/ DDKSYx S
SX −μ−= (8.67)
0)(
)(/
max0 =
+μ
−− xSKY
SSSDSSX
(8.64)
0)(/
0 =μ
−−SXY
xSSD (8.63)
D
DKS S
−μ=
max
(8.66)
0
0maxmax SK
SDS +
μ= (8.68)

45
5
4
2
3
0
1
0 0.2 0.4 0.6 0.8 1.0Dilution rate D, h
-1
1
2
3
4
5
0
2
4
6
8
10
Subs
trate
con
cent
ratio
n S,
g l
-1
Cel
l con
cent
ratio
n x,
g l-1
Cel
l pro
duct
ivity
Dx,
g l
h-1
-1
Figure 8.9 Dependence of effluent substrate concentration S, cellconcentration x, and cell productivity Dx on dilution rate D
S
Dx
x

46
This sensitivity must be keep in mind if production of cell mass is the objective of the continuous cultivation. The rate of cell production per unit bioreactor volume, biomass productivity, is Dx, which is also illustrated above and there is a maximum existing. We can calculate this maximal cell output rate by solving
and gives
0)(=
dDDxd (8.69)
)1(0
maxmax SKKD
S
S
+−μ= (8.70)

47
8.5.5 Kinetic Implications of Endogeneous and
Maintenance metabolism
eS
kSKS
−+
= maxμμ
5
4
2
3
0
1
0 2 4 6 8 10Reciprocal dilution rate D , h-1
Cel
l con
cent
ratio
n x,
g(d
.w.)
l-1
Figure 8.10 Cell concentration decreasesas the dilution rate is decreased
mY SX
S +=−/
μν
(8.71)
or
(8.76)

48
8.6 Production Kinetics in Cell CultureStructured and unstructured product formation kinetics are available. It is also possible to formulate useful models of protein synthesis kinetics at the molecular level, taking advantage of contemporary understanding of molecular controls.
The simplest types of product formation kinetics arise when there is a simple stoichiometric connection between product formation and substrate uptake or cell growth. The specific product formation rate qP may be written
qP = −YP/SνS (8.77)

49
or
⎯ growth associated model
qP = YP/Xμx (8.78)
50
40
20
30
0
10
0 2 4 6 8 10Fermentation time, h
0
1
2
3
4
5C
ell c
once
ntra
tion,
g (d
ry w
eigh
t) l-1
Suga
r con
sum
ed, g
l-1
Figure 8.12 The alcohol fermentation exhibts simplegrowth-associated product formation kinetics
60
12 14
6
10
0
5
15
20
25
30
Alc
ohol
pro
duce
d, g
l-1
x
P
S -S0

50
In many fermentations, especially those involving secondary metabolites, significant product formation does not occur until relatively late in a batch cultivation, perhaps approaching or into stationary phase.
If the production rate is proportional to cell concentration rather than growth rate, we have:
⎯ nongrowth associated model
Also,
qP = βx (8.79)
qP = αdtdx + βx (8.80)

51
25
20
10
15
0
5
0 20 40 60 80 100Fermentation time, h
and
suga
r con
sum
ed, g
l-1
Figure 8.13 More complex kinetics for production of penicillin
120 140
0.50
0
0.25
0.75
1.00
1.25
Peni
cilli
n, g
l-1
x PS -S0
Myc
elia
l con
cent
ratio
n (d
.w.)

52
8.7 Kinetics of Substrate Uptake in Cell CultureMany bioprocesses are designed to produce some aimed products. Patterns of substrate flow in cells synthesizing products depend on whether product formation is coupled with energy metabolism. When products are formed in energy-generating pathways, e.g. in anaerobic culture, product synthesis is an unavoidable consequence of cell growth and maintenance. Accordingly, as illustrated below, there is no separate flow of substrate into the cell for product formation; product is formed from the substrate taken up to support growth and maintenance. In contrast, when production is not linked or only partly linked to energy metabolism, all or some of the substrate required for product synthesis is additional to, and separate from, that needed for growth and maintenance.
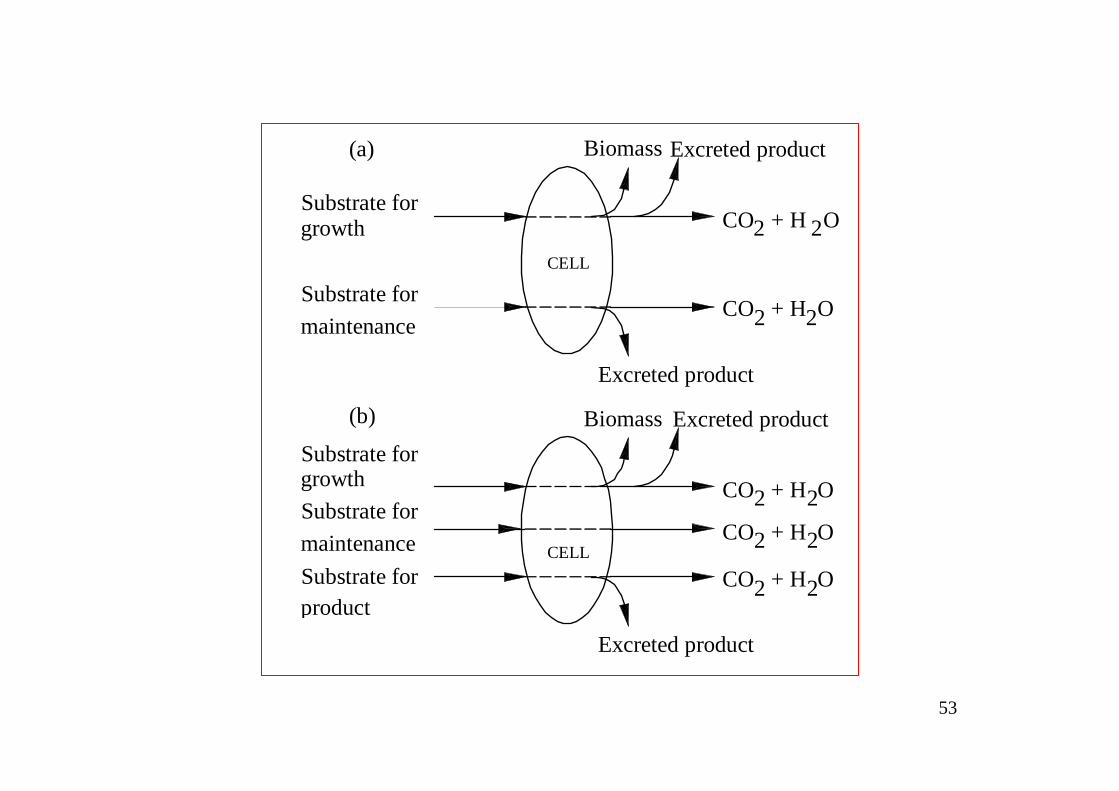
53
Substrate for
Substrate forproduct
growth
CELL
Excreted product
Biomass Excreted product
CO + H O2 2
CO + H O2 2
growth
Substrate formaintenance
Substrate for
Excreted product
CO + H O
CO + H O
Excreted productBiomass
2 2
2 2
CO + H O2 2Substrate formaintenance
(a)
(b)
CELL

54
In cultures where product synthesis is only indirectly coupled to energy metabolism, rate of substrate consumption is a function of three factors: cell growth, maintenance, and product formation. These different cell functions can be related using:
mYq
Y SP
P
SXS ++
μ=ν−
//
(8.81)

55
8.8 Effect of Culture Conditions on Cell Kinetics
Temperature has a marked effect on metabolic activities of cells. Temperature can change the configuration of cell constituents, especially proteins and membrane components. In general, the effect of temperature on growth is similar to that already described for enzymes. There is an approximate two fold increase in specific growth rate for every 10 °C rise in temperature, until structural breakdown of cell proteins starts to occur. Like other rate constants, the maintenance coefficient m has an Arrhenius-type temperature dependence; this can have a significant kinetic effect on cultures where turnover of macromolecules is an important contribution to maintenance requirements. In contrast, temperature has only a minor effect on the biomass yield coefficient, YX/S.

56
Growth rate depends on medium pH in much the same way as enzyme activity; maximum growth rate is usually maintained over 1~2 pH units but declines with further variation. pH also affects the profile of product synthesis in anaerobic culture and can changemaintenance-energy requirements.

57
8.9 Determining Kinetic ParametersDetermining growth rate in cell culture requires measurement of cell concentration. Many different experimental procedures are applied to do this. Direct measurement can be made of cell number, dry or wet weight of cells, packed cell volume or culture turbidity; alternatively, indirect estimates are obtained from measurements of product formation, heat evolution or cell composition. Cell viability is usually evaluated using plating or staining techniques. Each method for biomass estimation will give somewhat different results. Forexample, rate of growth determined using cell dry weight may differ from that obtained from cell number because dry weight in the culture can increase without a corresponding increase cell number.

58
Example 8.2 Hybridoma doubling timeA mouse-mouse hybrodoma cell line is used to produce monoclonal antibody. Growth in batch culture is monitored with the following data.
Time (d)
Cell concentration(cell number ml−1× 10⁶)
0.00.20.51.01.52.02.53.03.54.04.5
0.450.520.650.811.221.772.133.554.023.773.20
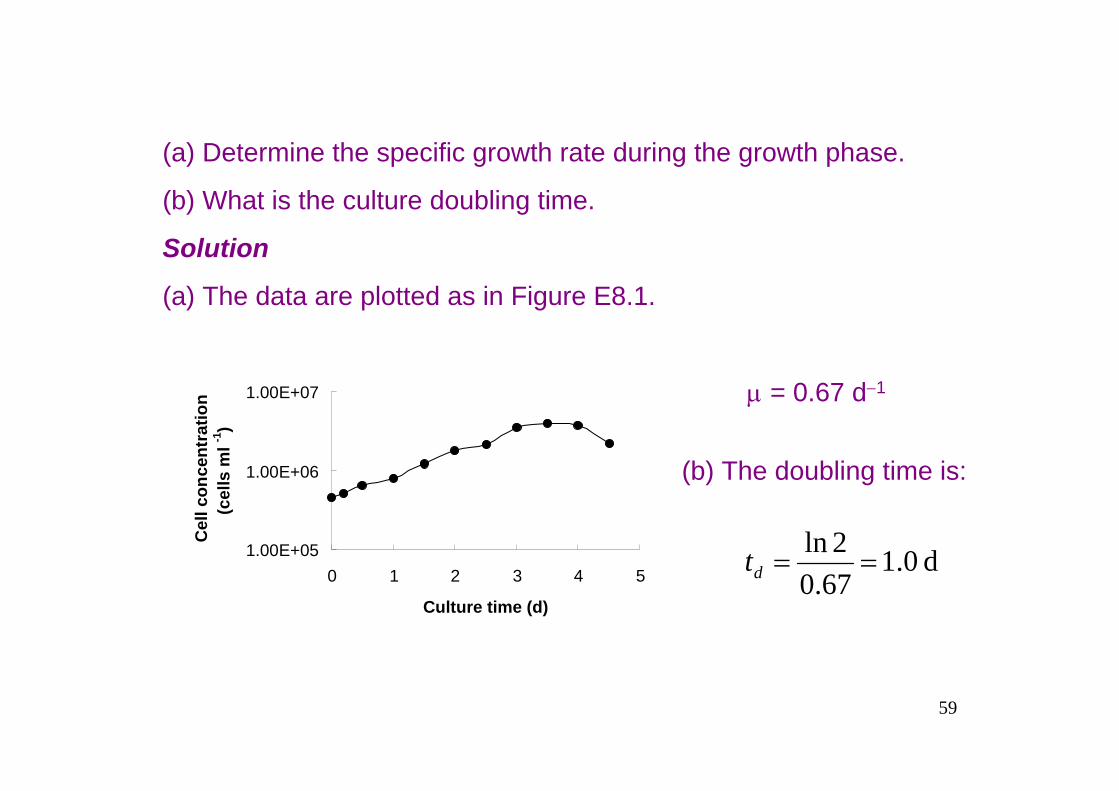
59
(a) Determine the specific growth rate during the growth phase.
(b) What is the culture doubling time.
Solution
(a) The data are plotted as in Figure E8.1.
μ = 0.67 d−1
(b) The doubling time is:
1.00E+05
1.00E+06
1.00E+07
0 1 2 3 4 5
Culture time (d)
Cel
l con
cent
ratio
n(c
ells
ml -1
)
d 0.167.02ln
==dt

60
8.10 Growth Kinetics with Plasmid InstabilityWhen recombinant organisms are cultured, a phenomena called plasmid instability usually occurs in individual cells which, byreproducing, can generate a large plasmid-free population in the bioreactors and reduce the overall rate of plasmid-encoded products. Plasmid instability results from DNA mutation or defective plasmid segregation. For segregation stability, the total number of plasmids present in the culture system must double once per generation, and the plasmid copies must be equally distributed between mother and daughter cells.
A simple model has been developed for batch culture to describe changes in the fraction of plasmid-bearing cells as a function of time.

61
The important parameters in this model are the probability of plasmid loss per generation of cells, and the difference in the growth rates of plasmid-bearing and plasmid-free cells. Exponential growth of the host cells is assumed. If x+ is the concentration of plasmid-carrying cells and x− is the concentration of plasmid-free cells, the rates at which the two cell populations grow are:
++μ−=+ xprX
)1( (8.82)

62
and
At any time, the fraction of cells in the culture system with plasmid is:
where
−−++ μ+μ=− xxprX
(8.83)
−+
+
+=
xxxF (8.84)
dt
dxrX
+
=+ (8.85)

63
and
with initial condition x+ = x+0 and x− = x−
0 at t = 0:
where
dt
dxrX
−
=− (8.86)
p
pF pn )1(211
−+α−α−−α−
= (8.87)
+
−
μμ
=α (8.88)

64
Figure 8.15 Fraction of plasmid-carrying cells in batch culture after 25n
2lntn
+μ= (8.89)
F25
0 1.0 2.0
0.5
α
1.0 p =0.00010.00020.0010.0030.010.020.03

65
Example 8.3 Plasmid instability in batch culture
A plasmid-containing strain of E. coli is used to produce recombinant protein in a 250 liter fermenter. The probability of plasmid loss per generation is 0.005. The specific growth rate of plasmid-free and plasmid-bearing cells are 1.4 and 1.2 h−1, respectively. Estimate the fraction of plasmid-bearing cells after 18 h growth if the inoculum contains only cells with plasmid.
Solution:
The number of generation of plasmid-carrying cells in 18 h is calculated:
312ln182.1
=×
=n

66
Together with p = 0.005 and α = 1.4/1.2 = 1.17 gives:
Therefore, after 18 h culture only 45% of the cells contain plasmid.
45.0005.0217.11
005.017.11)1005.017.1(31 =×−−
−−= −+F

67
8.11 Kinetics of Cell DeathThe kinetics of cell death is an important consideration in design of sterilization processes and in analysis of fermentations where substantial viability loss is expected. In a lethal environment, cells in a population do not die all at once; deactivation of the culture occurs over a finite period of time depending on the initial number of viable cells and the severity of the conditions imposed. Loss of cell viablitycan be described mathematically in much the same way as enzyme deactivation; cell death is assumed to be a first-order process:
rd = kdN (8.90)

68
Alternatively, rate of cell death can be expressed using cell concentration rather other cell number:
rd = kdx (8.91)
In a closed system with cell death the only process affecting viable cell concentration, rate of cell death is equal to the rate of decrease in cell number.
(8.92)
If kd is constant,
(8.93)
or
(8.94)
NkdtdNr dd =−=
tkdeNN −= 0
tkNN d−= 0lnln

69
10
0 2 4 6 8 10Time (min)
-4
-310
-1
-210
10
1
-510
54 C
56 C
58 C60 C
N/N
0
Figure 8.17 Rate of thermal death of E. coli

70
SummaryAt the end of this chapter you should:
Understand the basic concept of reaction rate, including total rate, volumetric rate, and specific rate;
Be familiar with kinetic expressions for zero-order, first-order, and Michaelis-Menten equation;
Be able to calculate reaction rate from batch enzyme catalytic reaction and batch culture of cells, and determine model parameters according corresponding kinetic expressions;
Understand proposed models which are used to describe cell growth and know how to simplify to make them suitable for real culture processes;

71
Understand the concept of dilution rate for continuous culture of cells and the conditions for steady-state operation;
Know the basic relationships for cell growth, product formations, and substrate consumption, also know how maintenance activities affect substrate utilization during the cultivation;
Be able to analyze growth in cultures with plasmid instability and predict possible plasmid loss effect on aimed product expression; and finally
Be able to describe the kinetics of cell death, especially during heating.


![University of Aveiro, Portugal palmeida@ua · 7 7 7 7 7 7 7 7 7 7 7 7 5: is LT-superregular by blocks. jFjis very large. Can be used in Network Coding [Mahmood, Badr, Khisti, 2015].](https://static.fdocuments.us/doc/165x107/5fd5938c11949f2fc04395ea/university-of-aveiro-portugal-palmeidaua-7-7-7-7-7-7-7-7-7-7-7-7-5-is-lt-superregular.jpg)


![[XLS]dev.eiopa.europa.eu · Web view2 6 6 7/7/2014 8 7/7/2014 1 7 7 7/7/2014 9 7/7/2014 1 8 8 7/7/2014 10 7/7/2014 1 9 9 7/7/2014 11 7/7/2014 1 10 10 7/7/2014 12 7/7/2014 1 11 11](https://static.fdocuments.us/doc/165x107/5ae5800d7f8b9a8b2b8bf1f3/xlsdeveiopa-view2-6-6-772014-8-772014-1-7-7-772014-9-772014-1-8-8-772014.jpg)


![[XLS] · Web view2 7 7 7 7 4 4 7 7 4 4 10 7 4 8 3 4 6 4 7 7 4 6 7 4 6 7 4 6 7 6 7 7 7 4 4 7 7 7 7 4 4 6 7 6 6 4 6 4 4 6 7 4 6 4 6 6 4 4 4 6 6 4 7 8 7 4 4 6 4 4 6 4 6 4 6 4 6 6 6 6](https://static.fdocuments.us/doc/165x107/5ad9b6107f8b9a137f8c8689/xls-view2-7-7-7-7-4-4-7-7-4-4-10-7-4-8-3-4-6-4-7-7-4-6-7-4-6-7-4-6-7-6-7-7-7-4.jpg)
