7-1 PowerPoint Authors: Susan Coomer Galbreath, Ph.D., CPA Charles W. Caldwell, D.B.A., CMA Jon A....
40
7-1 PowerPoint Authors: Susan Coomer Galbreath, Ph.D., CPA Charles W. Caldwell, D.B.A., CMA Jon A. Booker, Ph.D., CPA, CIA Cynthia J. Rooney, Ph.D., CPA Reporting and Interpreting Cost of Goods Sold and Inventory Chapter 07 McGraw-Hill/Irwin Copyright © 2011 by The McGraw-Hill Companies, Inc. All rights reserved.
-
date post
21-Dec-2015 -
Category
Documents
-
view
230 -
download
2
Transcript of 7-1 PowerPoint Authors: Susan Coomer Galbreath, Ph.D., CPA Charles W. Caldwell, D.B.A., CMA Jon A....
7-1
PowerPoint Authors:Susan Coomer Galbreath, Ph.D., CPACharles W. Caldwell, D.B.A., CMAJon A. Booker, Ph.D., CPA, CIACynthia J. Rooney, Ph.D., CPA
Reporting and Interpreting Cost of Goods Sold and Inventory
Chapter 07
McGraw-Hill/Irwin Copyright © 2011 by The McGraw-Hill Companies, Inc. All rights reserved.
7-2
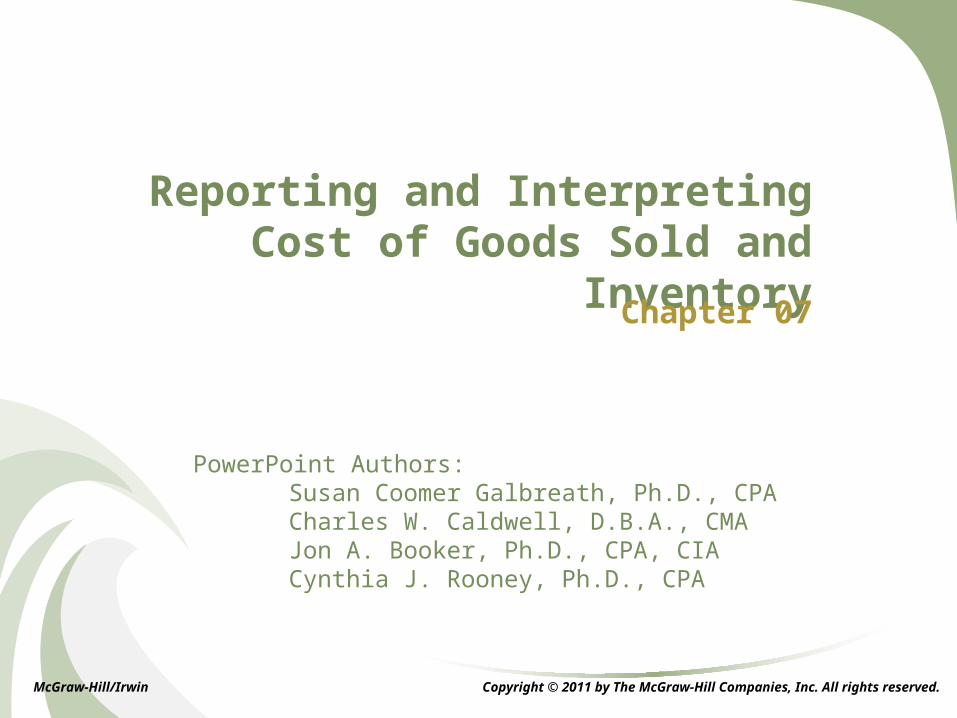
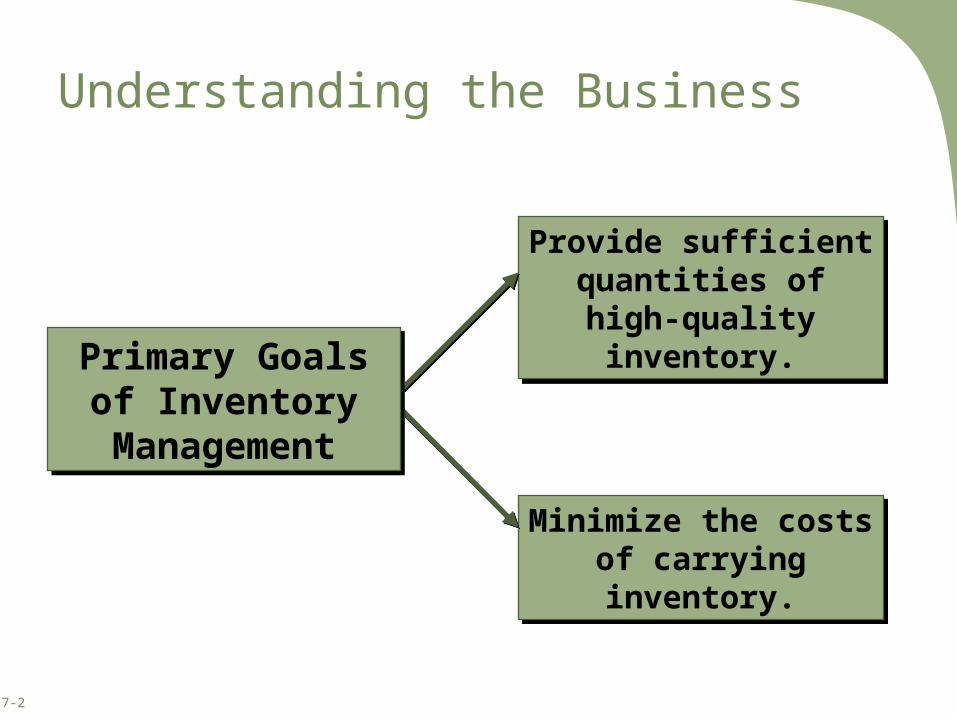
Understanding the Business
Provide sufficient quantities of high-quality inventory.
Provide sufficient quantities of high-quality inventory.
Minimize the costs of carrying inventory.
Minimize the costs of carrying inventory.
Primary Goals of Inventory
Management
Primary Goals of Inventory
Management
7-3
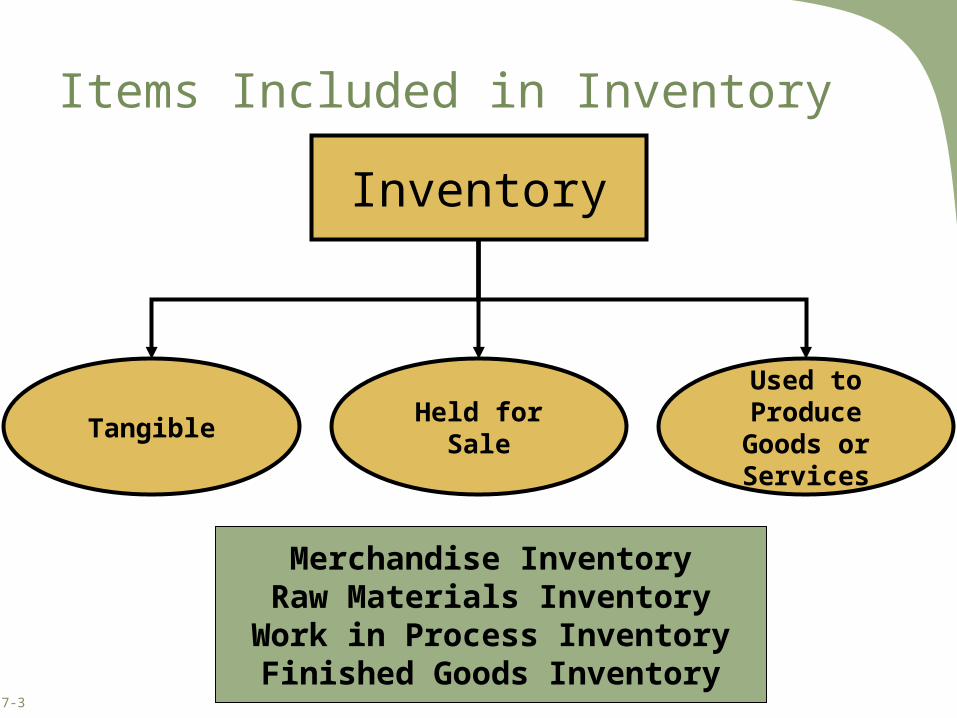
Items Included in Inventory
Inventory
Tangible Held for Sale
Used to Produce Goods or Services
Merchandise InventoryRaw Materials Inventory
Work in Process InventoryFinished Goods Inventory
7-4
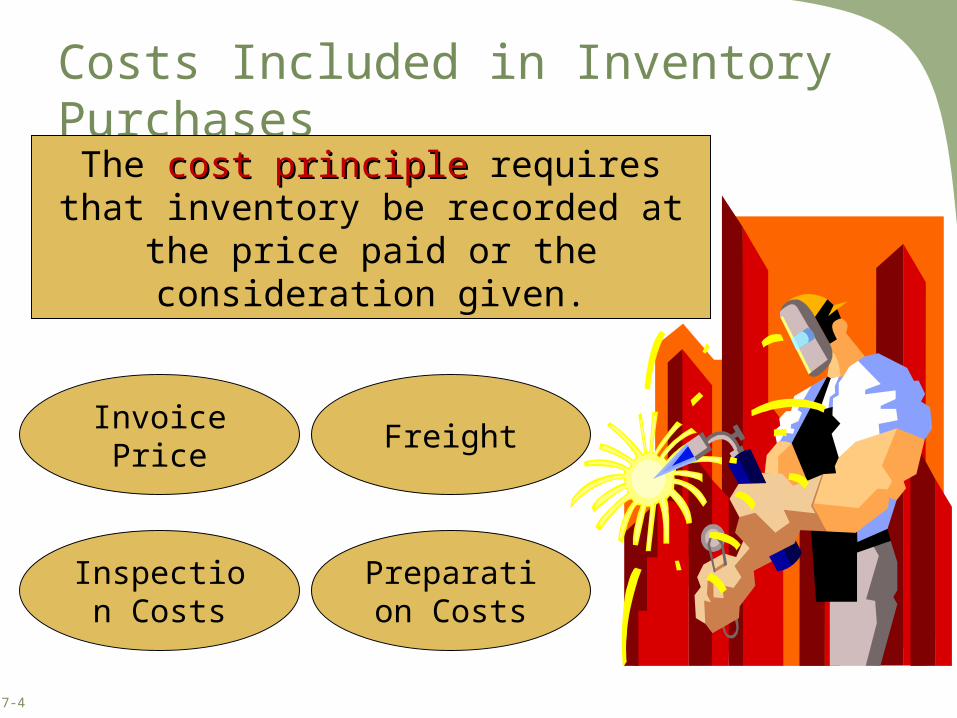
Costs Included in Inventory Purchases
The cost principlecost principle requires that inventory be recorded at the price paid or the
consideration given.
Invoice Price
Freight
Inspection Costs
Preparation Costs

7-5
Flow of Inventory Costs
MerchandiseMerchandisePurchasesPurchases
MerchandiseMerchandisePurchasesPurchases
Cost ofCost ofGoods SoldGoods Sold
Cost ofCost ofGoods SoldGoods Sold
MerchandiseMerchandiseInventoryInventory
MerchandiseMerchandiseInventoryInventory
Merchandiser
RawRawMaterialsMaterials
RawRawMaterialsMaterials
Raw MaterialsRaw MaterialsInventoryInventory
Raw MaterialsRaw MaterialsInventoryInventory
Work in ProcessWork in ProcessInventoryInventory
Work in ProcessWork in ProcessInventoryInventory
Finished GoodsFinished GoodsInventoryInventory
Finished GoodsFinished GoodsInventoryInventory
Cost ofCost ofGoods SoldGoods Sold
Cost ofCost ofGoods SoldGoods Sold
Manufacturer
DirectDirectLaborLaborDirectDirectLaborLabor
FactoryFactoryOverheadOverheadFactoryFactory
OverheadOverhead
7-6
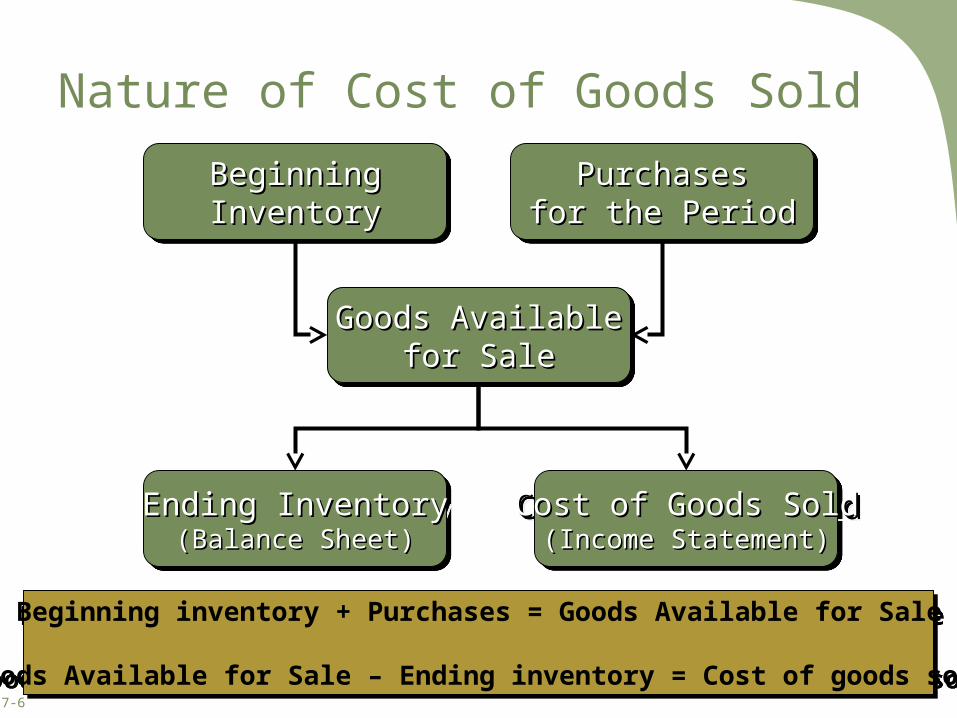
Nature of Cost of Goods Sold
BeginningBeginningInventoryInventory
BeginningBeginningInventoryInventory
PurchasesPurchasesfor the Periodfor the PeriodPurchasesPurchases
for the Periodfor the Period
Ending InventoryEnding Inventory(Balance Sheet)(Balance Sheet)
Ending InventoryEnding Inventory(Balance Sheet)(Balance Sheet)
Goods AvailableGoods Availablefor Salefor Sale
Goods AvailableGoods Availablefor Salefor Sale
Cost of Goods SoldCost of Goods Sold(Income Statement)(Income Statement)
Cost of Goods SoldCost of Goods Sold(Income Statement)(Income Statement)
Beginning inventory + Purchases = Goods Available for Sale
Goods Available for Sale – Ending inventory = Cost of goods sold
Beginning inventory + Purchases = Goods Available for Sale
Goods Available for Sale – Ending inventory = Cost of goods sold

7-7
Inventory Costing Methods
Total Dollar Amount of Goods Total Dollar Amount of Goods Available for SaleAvailable for Sale
Total Dollar Amount of Goods Total Dollar Amount of Goods Available for SaleAvailable for Sale
Ending InventoryEnding Inventory
Inventory Costing Method
Cost of Goods SoldCost of Goods Sold
Inventory Costing Methods1.Specific Identification2.First-in, First-out3.Last-in, First-out4.Weighted Average

7-8
Specific Identification
When units are sold, the
specific cost of the unit sold is
added to cost of goods sold.
When units are sold, the
specific cost of the unit sold is
added to cost of goods sold.

7-9
Cost Flow Assumptions
The choice of an inventory costing method is not based on the physical flow of goods
on and off the shelves.
LIFO
FIFOWeightedAverage
7-10
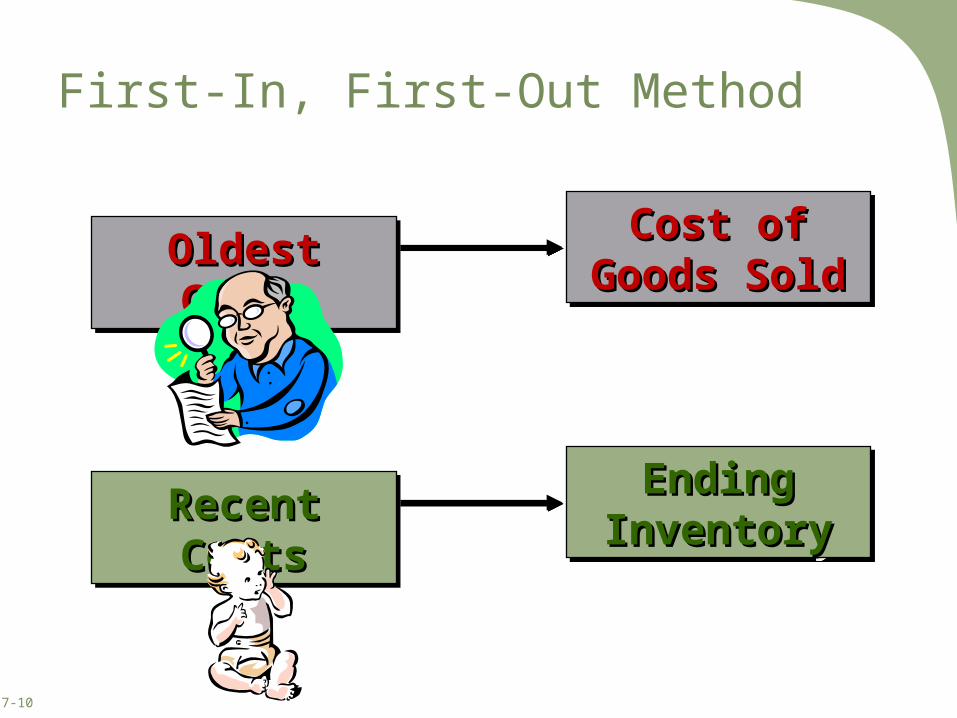
First-In, First-Out Method
Cost of Cost of Goods SoldGoods Sold
Cost of Cost of Goods SoldGoods SoldOldest CostsOldest CostsOldest CostsOldest Costs
Ending Ending InventoryInventoryEnding Ending
InventoryInventoryRecent CostsRecent CostsRecent CostsRecent Costs
7-11
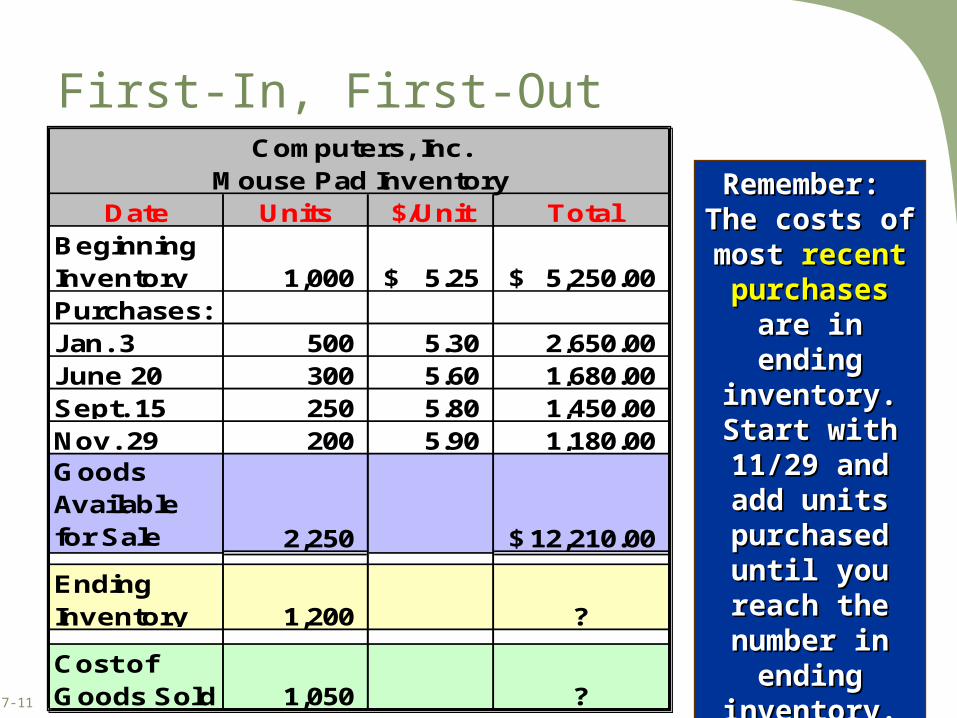
First-In, First-Out
Remember: Remember: The costs of The costs of most most recent recent
purchasespurchases are are in ending in ending inventory. inventory. Start with Start with
11/29 and add 11/29 and add units units
purchased purchased until you reach until you reach the number in the number in
ending ending inventory.inventory.
Computers, Inc.Mouse Pad Inventory
Date Units $/Unit TotalBeginning Inventory 1,000 5.25$ 5,250.00$ Purchases:Jan. 3 500 5.30 2,650.00 June 20 300 5.60 1,680.00 Sept. 15 250 5.80 1,450.00 Nov. 29 200 5.90 1,180.00 Goods Available for Sale 2,250 12,210.00$
Ending Inventory 1,200 ?
Cost of Goods Sold 1,050 ?
7-12
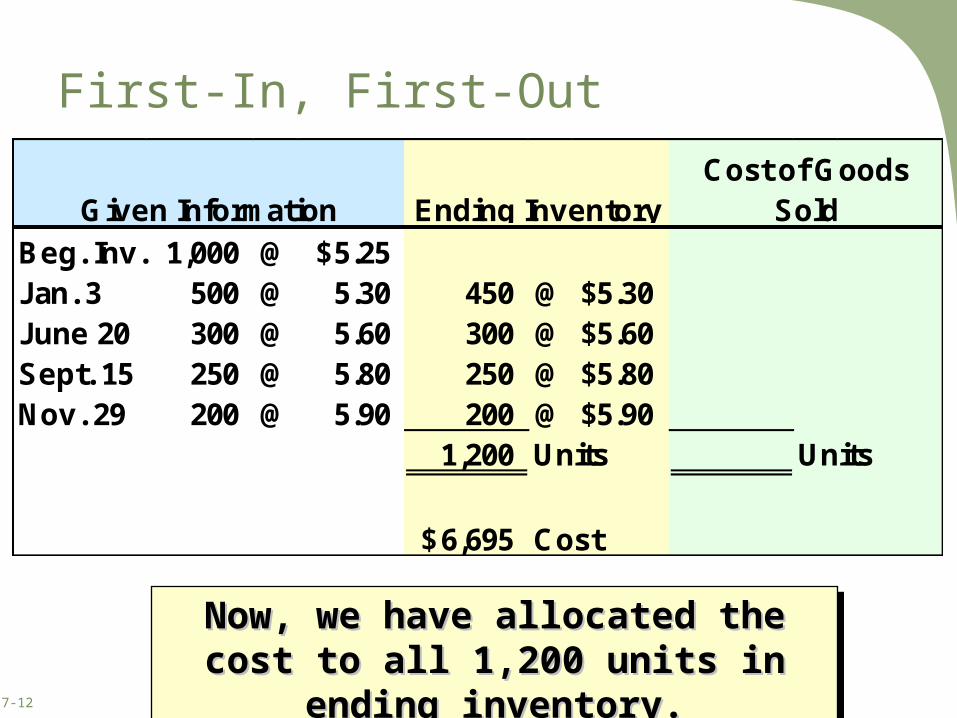
First-In, First-Out
Now, we have allocated the cost to all Now, we have allocated the cost to all 1,200 units in ending inventory.1,200 units in ending inventory.
Now, we have allocated the cost to all Now, we have allocated the cost to all 1,200 units in ending inventory.1,200 units in ending inventory.
Beg. Inv. 1,000 @ 5.25$ Jan. 3 500 @ 5.30 450 @ $5.30June 20 300 @ 5.60 300 @ $5.60Sept. 15 250 @ 5.80 250 @ $5.80Nov. 29 200 @ 5.90 200 @ $5.90
1,200 Units Units
6,695$ Cost
Ending InventoryCost of Goods
SoldGiven Information
7-13
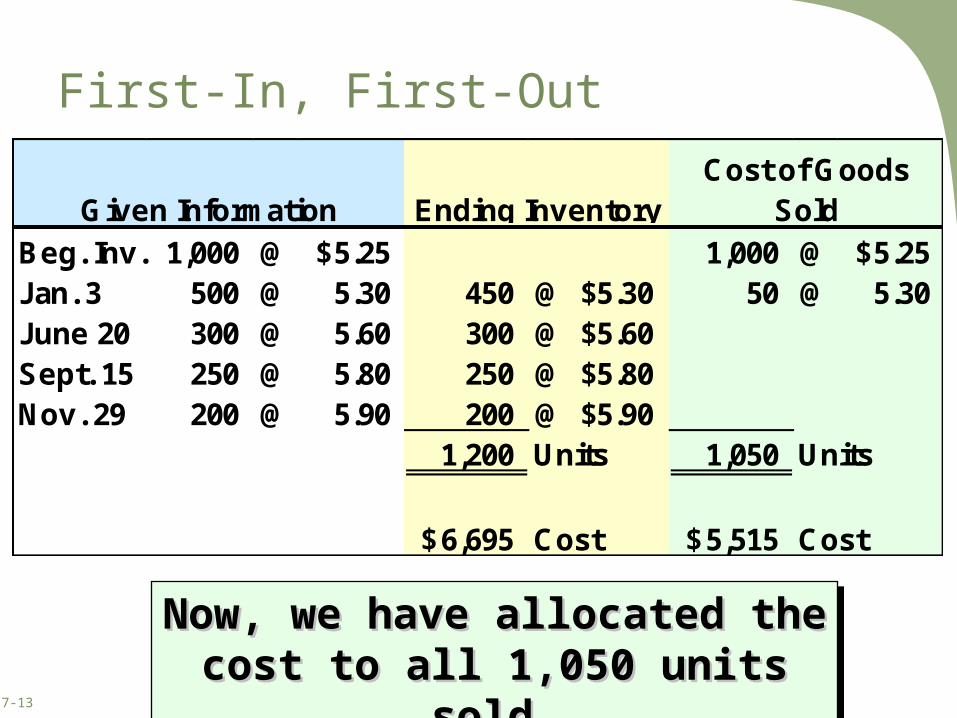
First-In, First-Out
Now, we have allocated the cost Now, we have allocated the cost to all 1,050 units sold.to all 1,050 units sold.
Now, we have allocated the cost Now, we have allocated the cost to all 1,050 units sold.to all 1,050 units sold.
Beg. Inv. 1,000 @ 5.25$ 1,000 @ 5.25$ Jan. 3 500 @ 5.30 450 @ $5.30 50 @ 5.30 June 20 300 @ 5.60 300 @ $5.60Sept. 15 250 @ 5.80 250 @ $5.80Nov. 29 200 @ 5.90 200 @ $5.90
1,200 Units 1,050 Units
6,695$ Cost 5,515$ Cost
Ending InventoryCost of Goods
SoldGiven Information
7-14
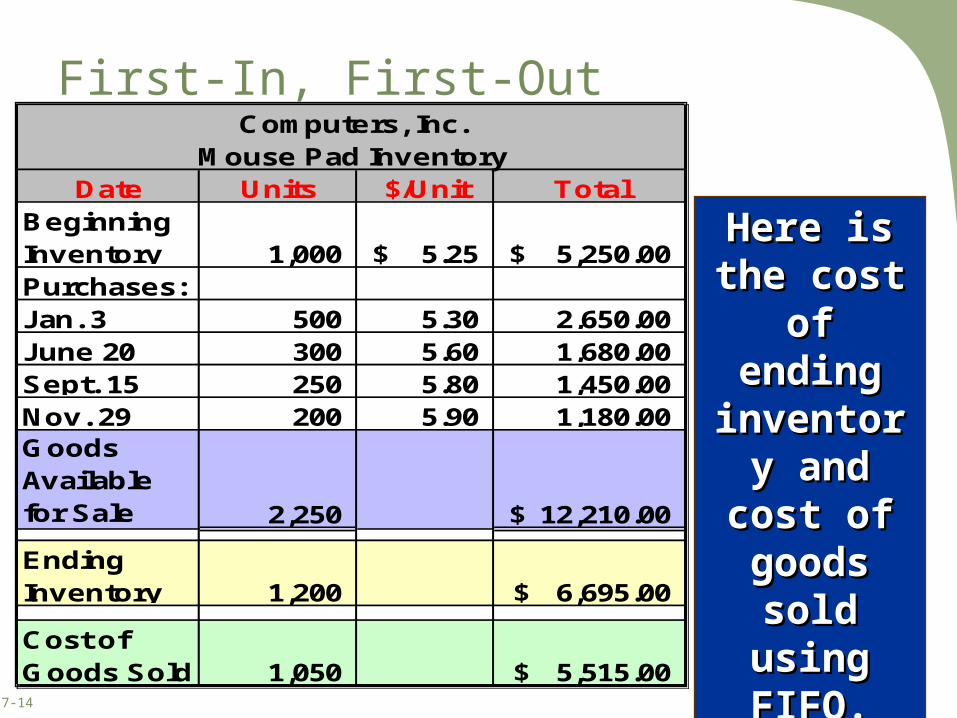
First-In, First-Out
Here is the Here is the cost of cost of ending ending
inventory inventory and cost and cost of goods of goods
sold using sold using FIFO.FIFO.
Computers, Inc.Mouse Pad Inventory
Date Units $/Unit TotalBeginning Inventory 1,000 5.25$ 5,250.00$ Purchases:Jan. 3 500 5.30 2,650.00 June 20 300 5.60 1,680.00 Sept. 15 250 5.80 1,450.00 Nov. 29 200 5.90 1,180.00 Goods Available for Sale 2,250 12,210.00$
Ending Inventory 1,200 6,695.00$
Cost of Goods Sold 1,050 5,515.00$

7-15
Last-In, First-Out Method
Ending Ending InventoryInventoryEnding Ending
InventoryInventory
Cost of Cost of Goods SoldGoods Sold
Cost of Cost of Goods SoldGoods Sold
Oldest CostsOldest CostsOldest CostsOldest Costs
Recent CostsRecent CostsRecent CostsRecent Costs
7-16
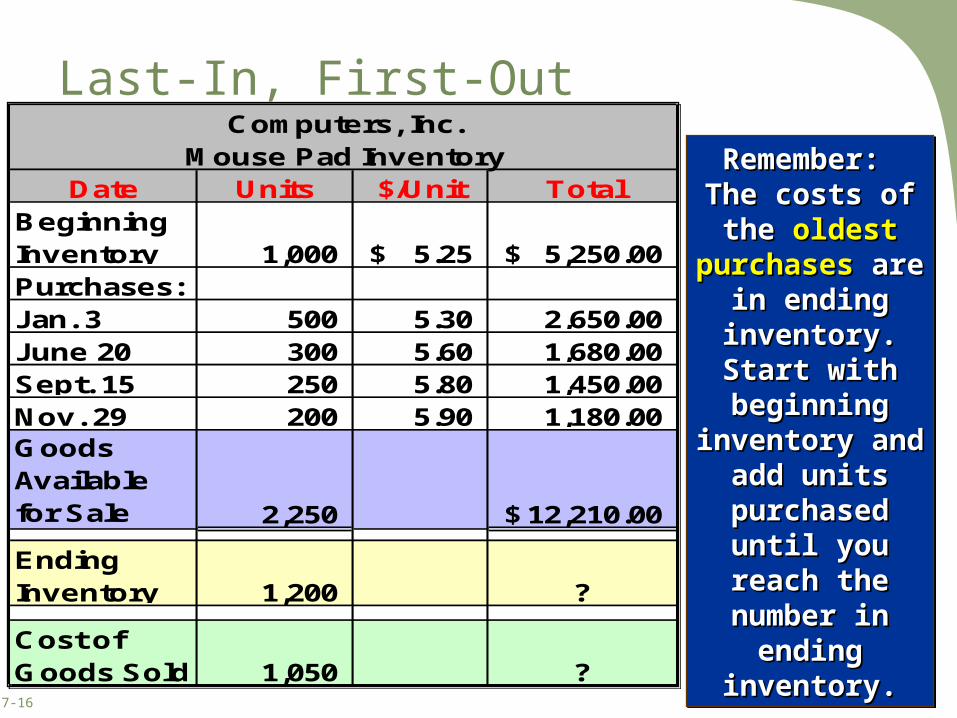
Last-In, First-Out
Remember: Remember: The costs of the The costs of the
oldest oldest purchasespurchases are are
in ending in ending inventory. Start inventory. Start with beginning with beginning inventory and inventory and
add units add units purchased until purchased until you reach the you reach the
number in number in ending ending
inventory.inventory.
Computers, Inc.Mouse Pad Inventory
Date Units $/Unit TotalBeginning Inventory 1,000 5.25$ 5,250.00$ Purchases:Jan. 3 500 5.30 2,650.00 June 20 300 5.60 1,680.00 Sept. 15 250 5.80 1,450.00 Nov. 29 200 5.90 1,180.00 Goods Available for Sale 2,250 12,210.00$
Ending Inventory 1,200 ?
Cost of Goods Sold 1,050 ?
7-17
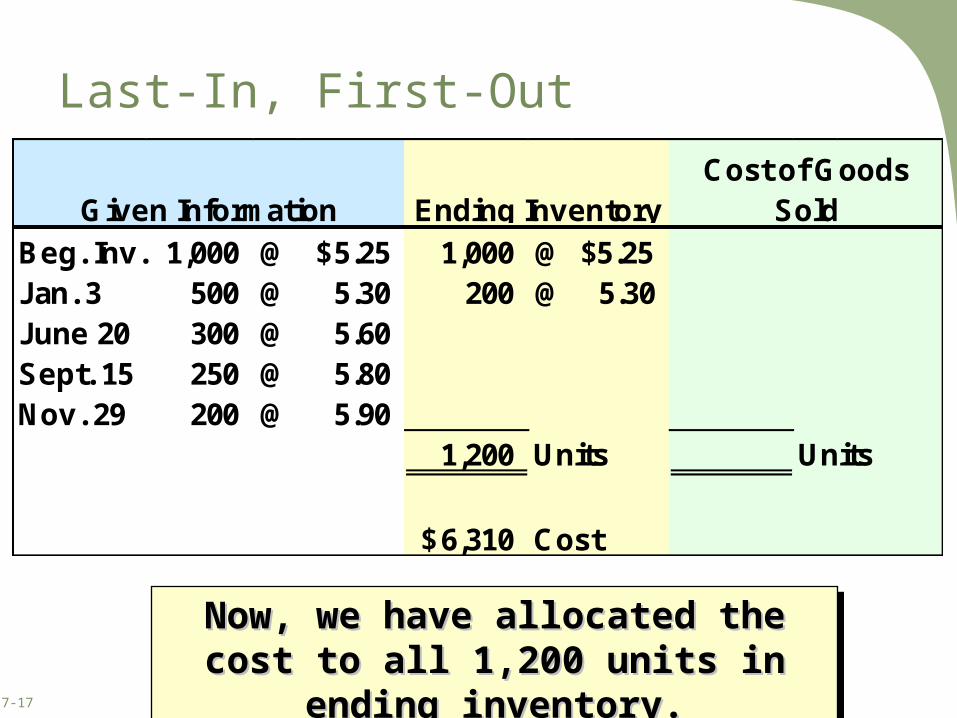
Last-In, First-Out
Now, we have allocated the cost to all Now, we have allocated the cost to all 1,200 units in ending inventory.1,200 units in ending inventory.
Now, we have allocated the cost to all Now, we have allocated the cost to all 1,200 units in ending inventory.1,200 units in ending inventory.
Beg. Inv. 1,000 @ 5.25$ 1,000 @ $5.25Jan. 3 500 @ 5.30 200 @ 5.30 June 20 300 @ 5.60 Sept. 15 250 @ 5.80 Nov. 29 200 @ 5.90
1,200 Units Units
6,310$ Cost
Ending InventoryCost of Goods
SoldGiven Information
7-18
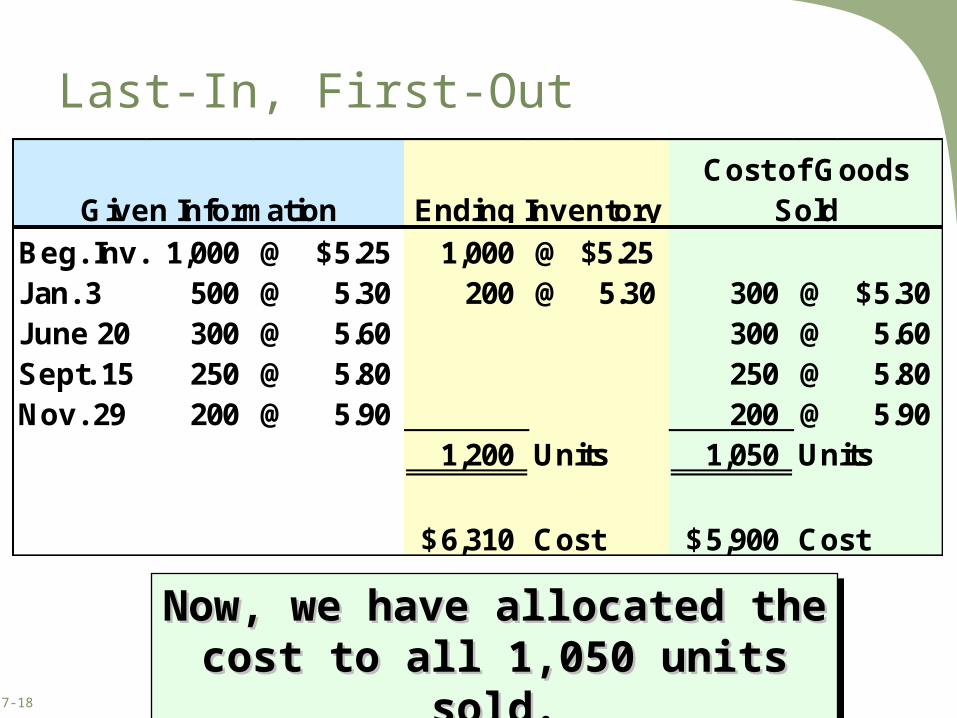
Last-In, First-Out
Now, we have allocated the cost Now, we have allocated the cost to all 1,050 units sold.to all 1,050 units sold.
Now, we have allocated the cost Now, we have allocated the cost to all 1,050 units sold.to all 1,050 units sold.
Beg. Inv. 1,000 @ 5.25$ 1,000 @ $5.25Jan. 3 500 @ 5.30 200 @ 5.30 300 @ 5.30$ June 20 300 @ 5.60 300 @ 5.60 Sept. 15 250 @ 5.80 250 @ 5.80 Nov. 29 200 @ 5.90 200 @ 5.90
1,200 Units 1,050 Units
6,310$ Cost 5,900$ Cost
Ending InventoryCost of Goods
SoldGiven Information
7-19
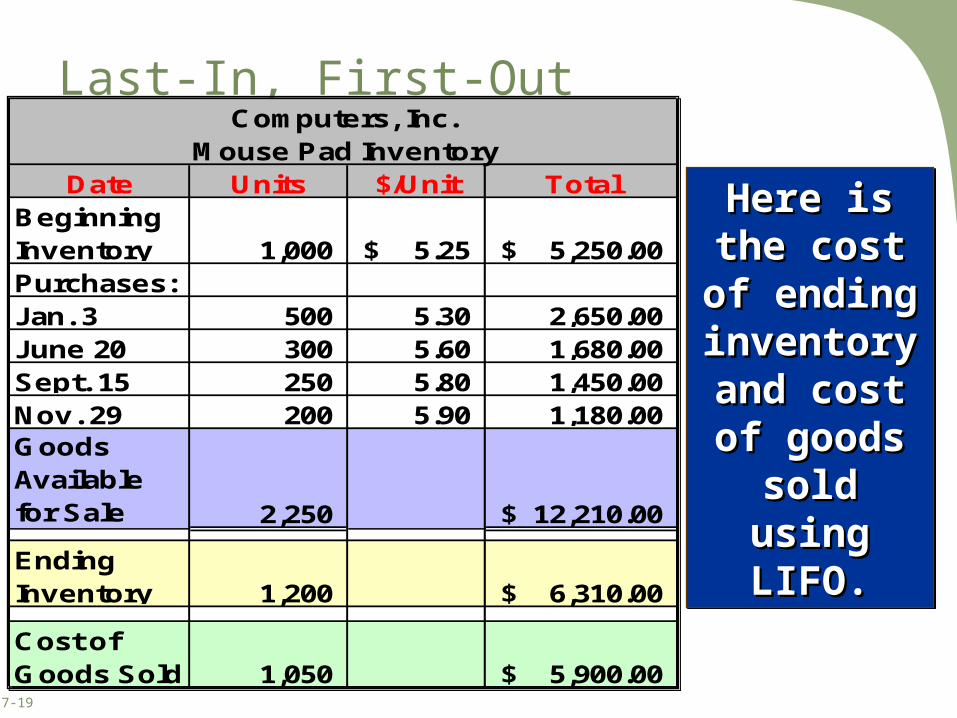
Last-In, First-Out
Here is the Here is the cost of cost of ending ending
inventory inventory and cost of and cost of goods sold goods sold using LIFO.using LIFO.
Here is the Here is the cost of cost of ending ending
inventory inventory and cost of and cost of goods sold goods sold using LIFO.using LIFO.
Computers, Inc.Mouse Pad Inventory
Date Units $/Unit TotalBeginning Inventory 1,000 5.25$ 5,250.00$ Purchases:Jan. 3 500 5.30 2,650.00 June 20 300 5.60 1,680.00 Sept. 15 250 5.80 1,450.00 Nov. 29 200 5.90 1,180.00 Goods Available for Sale 2,250 12,210.00$
Ending Inventory 1,200 6,310.00$
Cost of Goods Sold 1,050 5,900.00$
7-20
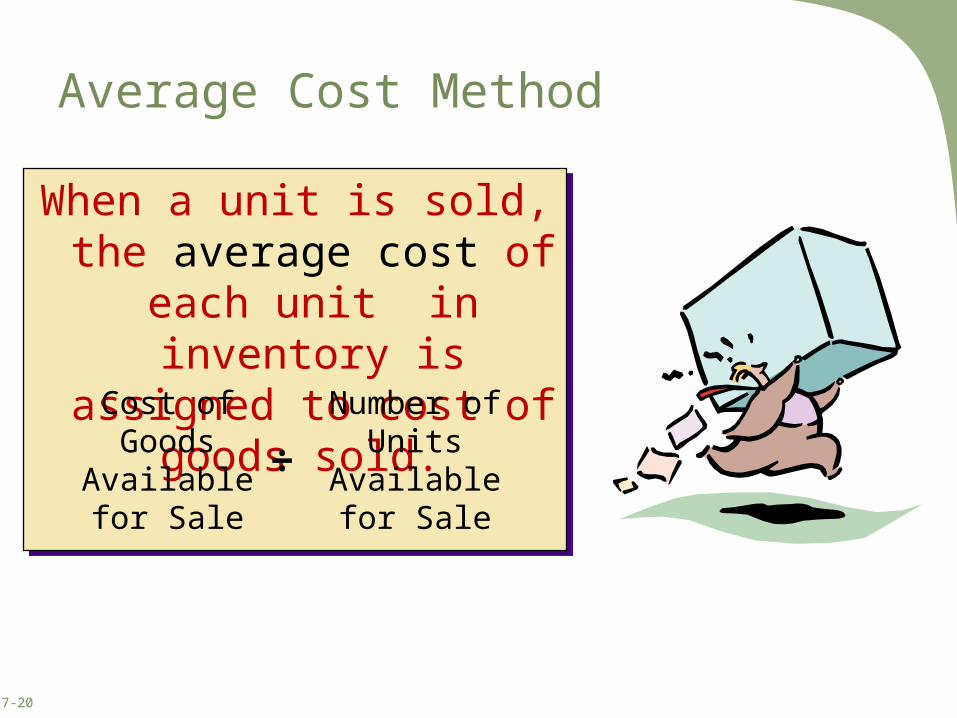
Average Cost Method
When a unit is sold, the average cost of each unit in inventory is assigned to cost of goods sold.
When a unit is sold, the average cost of each unit in inventory is assigned to cost of goods sold.
Cost of Goods Available for
Sale
Number of Units
Available for Sale
÷
7-21
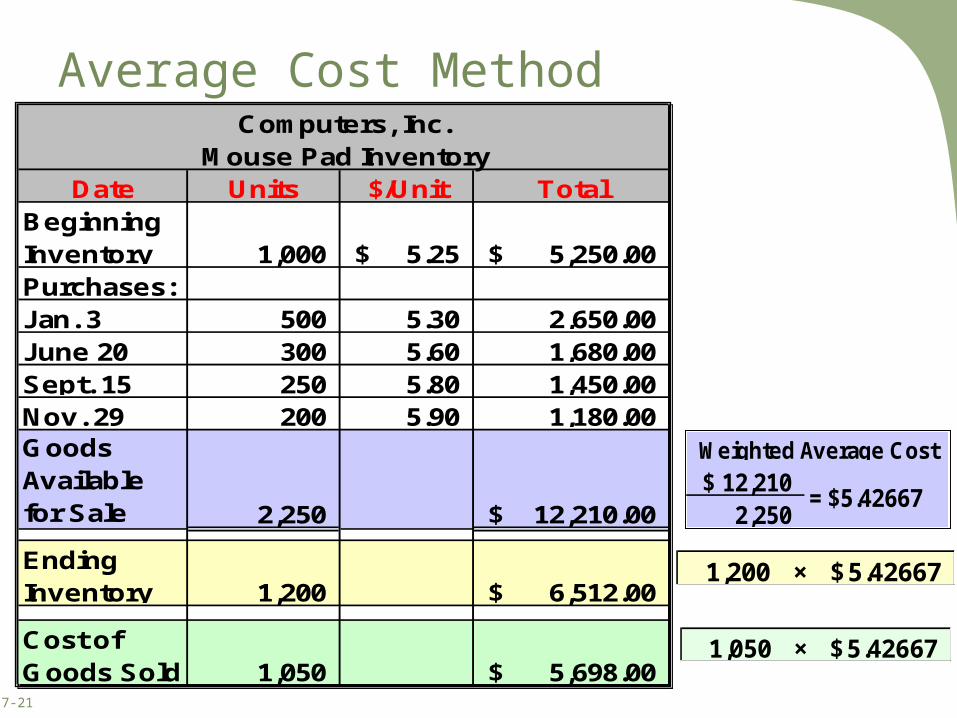
Average Cost Method
12,210$ 2,250
= $5.42667
Weighted Average Cost
1,200 × 5.42667$
1,050 × 5.42667$
Computers, Inc.Mouse Pad Inventory
Date Units $/Unit TotalBeginning Inventory 1,000 5.25$ 5,250.00$ Purchases:Jan. 3 500 5.30 2,650.00 June 20 300 5.60 1,680.00 Sept. 15 250 5.80 1,450.00 Nov. 29 200 5.90 1,180.00 Goods Available for Sale 2,250 12,210.00$
Ending Inventory 1,200 6,512.00$
Cost of Goods Sold 1,050 5,698.00$
7-22
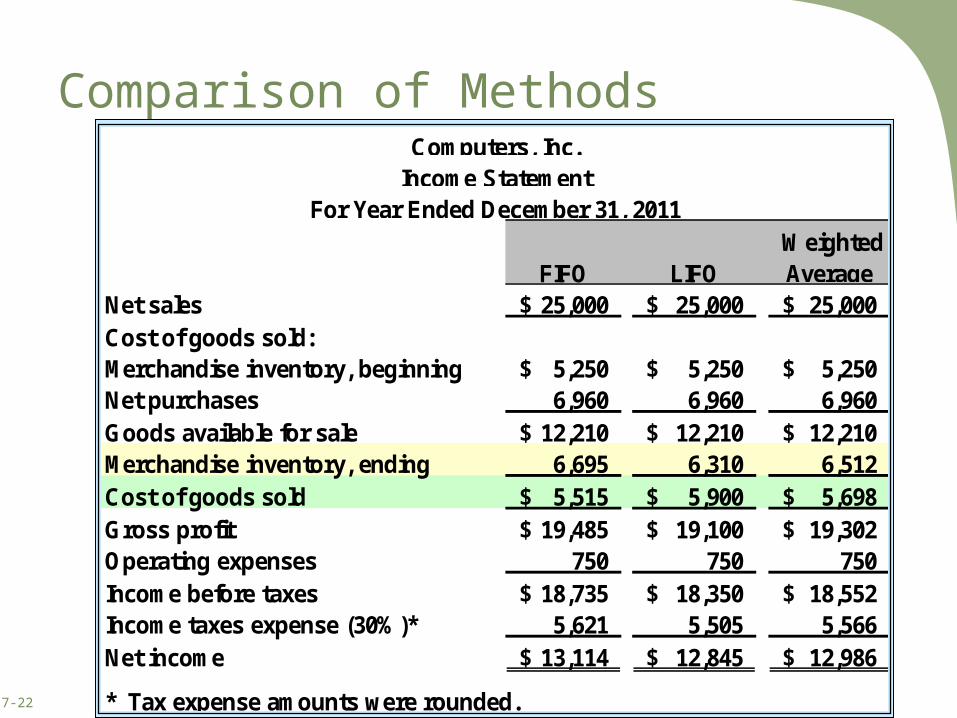
Comparison of Methods
FIFO LIFO Weighted Average
Net sales 25,000$ 25,000$ 25,000$ Cost of goods sold:Merchandise inventory, beginning 5,250$ 5,250$ 5,250$ Net purchases 6,960 6,960 6,960 Goods available for sale 12,210$ 12,210$ 12,210$ Merchandise inventory, ending 6,695 6,310 6,512 Cost of goods sold 5,515$ 5,900$ 5,698$ Gross profit 19,485$ 19,100$ 19,302$ Operating expenses 750 750 750 Income before taxes 18,735$ 18,350$ 18,552$ Income taxes expense (30%)* 5,621 5,505 5,566 Net income 13,114$ 12,845$ 12,986$
* Tax expense amounts were rounded.
Computers, Inc.Income Statement
For Year Ended December 31, 2011
7-23
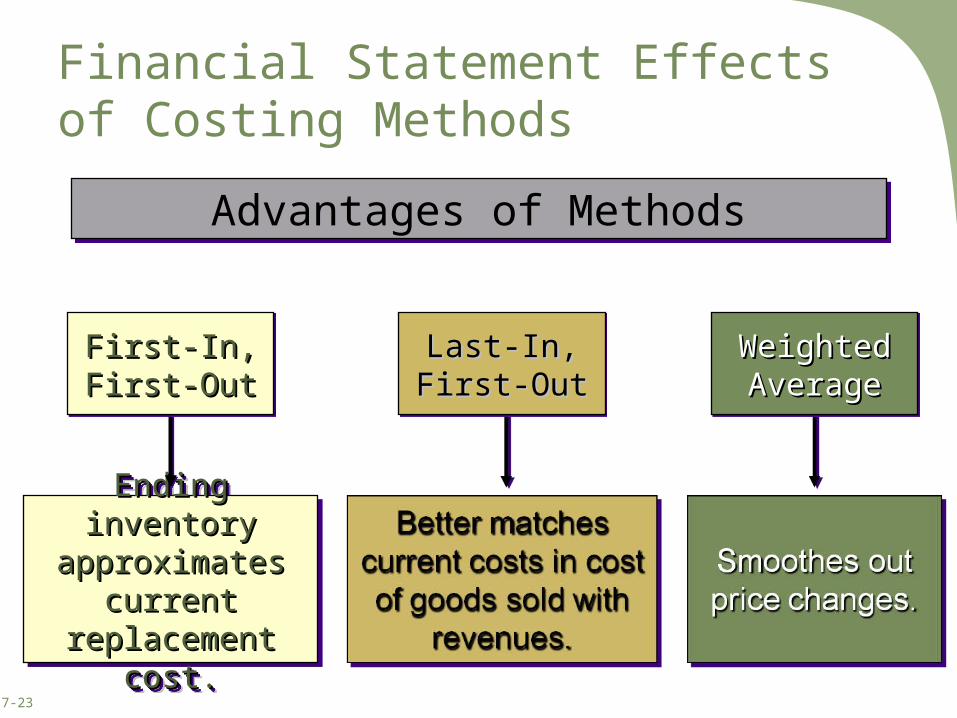
Financial Statement Effects of Costing Methods
Advantages of MethodsAdvantages of Methods
Ending inventory Ending inventory approximates approximates
current current replacement cost.replacement cost.
Ending inventory Ending inventory approximates approximates
current current replacement cost.replacement cost.
First-In, First-In, First-OutFirst-OutFirst-In, First-In, First-OutFirst-Out
Last-In, Last-In, First-OutFirst-OutLast-In, Last-In,
First-OutFirst-OutWeighted Weighted AverageAverage
Weighted Weighted AverageAverage

7-24
International PerspectiveLIFO and International Comparisons
While U.S. GAAP allows companies to choose between FIFO, LIFO, and weighted average inventory methods, International
Financial Reporting Standards (IFRS) currently prohibit the use of LIFO.
These differences can create comparability problems when one attempts to compare companies across international
borders.
IFRS requires that the same method be used for
all inventory items that have a similar nature and use.
GAAP allows different inventory accounting
methods to be used for different types of inventory
items.

7-25
Managers Choice of Inventory Methods
Net Income EffectsManagers prefer to report Managers prefer to report higher earnings for their higher earnings for their
companies.companies.
Net Income EffectsManagers prefer to report Managers prefer to report higher earnings for their higher earnings for their
companies.companies.
Income Tax EffectsManagers prefer to pay the Managers prefer to pay the
least amount of taxes least amount of taxes allowed by law as late as allowed by law as late as
possible.possible.
Income Tax EffectsManagers prefer to pay the Managers prefer to pay the
least amount of taxes least amount of taxes allowed by law as late as allowed by law as late as
possible.possible.
LIFO Conformity RuleIf last-in, first-out is used on the If last-in, first-out is used on the
income tax return, it must also be income tax return, it must also be used to calculate inventory and cost used to calculate inventory and cost
of goods sold for financial of goods sold for financial statements.statements.
7-26
Valuation at Lower of Cost or Market
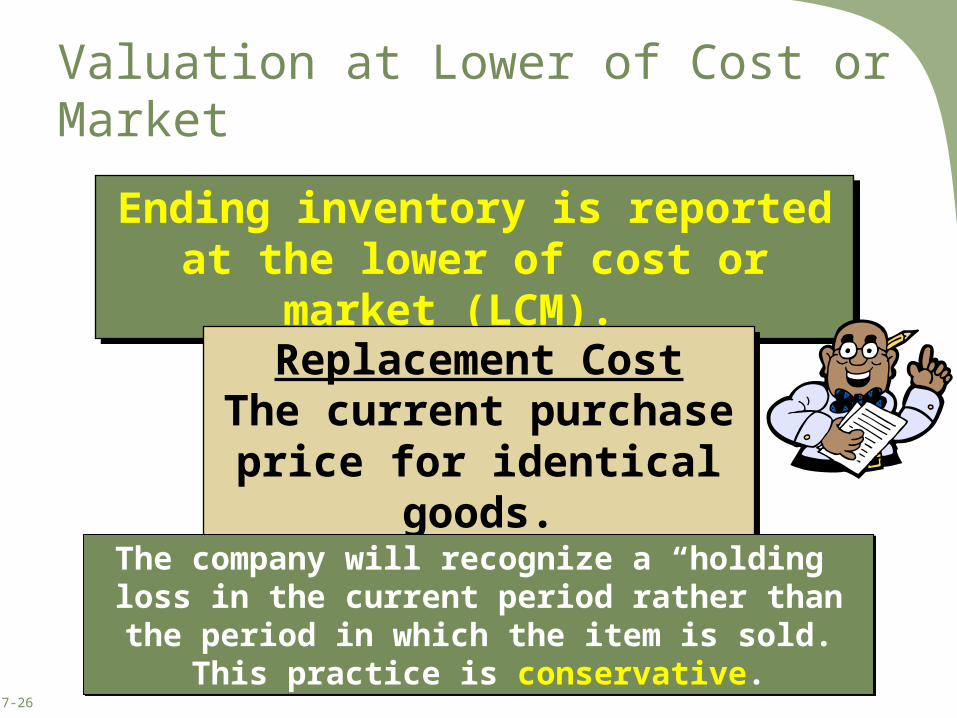
Ending inventory is reported at the lower of cost or market (LCM).
Ending inventory is reported at the lower of cost or market (LCM).
Replacement CostThe current purchase
price for identical goods.
Replacement CostThe current purchase
price for identical goods.
The company will recognize a “holding” loss in the current period rather than the period in which
the item is sold.This practice is conservative.
The company will recognize a “holding” loss in the current period rather than the period in which
the item is sold.This practice is conservative.
7-27
Valuation at Lower of Cost or Market
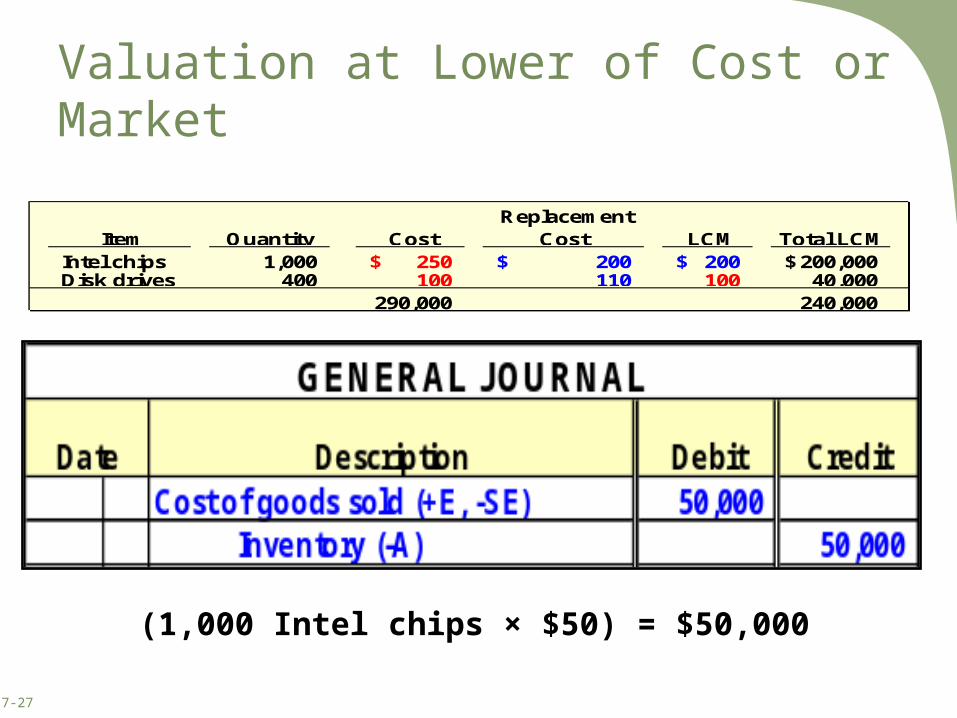
Item Quantity Cost Replacement
Cost LCM Total LCMIntel chips 1,000 250$ 200$ 200$ 200,000$ Disk drives 400 100 110 100 40,000
290,000 240,000
Item Quantity Cost Replacement
Cost LCM Total LCMIntel chips 1,000 250$ 200$ 200$ 200,000$ Disk drives 400 100 110 100 40,000
290,000 240,000
(1,000 Intel chips × $50) = $50,000

7-28
Inventory Turnover
Cost of Goods Sold = Average Inventory
Inventory Turnover
Average Inventory is . . .(Beginning Inventory + Ending Inventory) ÷ 2
Average Inventory is . . .(Beginning Inventory + Ending Inventory) ÷ 2
This ratio reflects how many times average inventory was produced and sold during the period. A higher ratio indicates that inventory moves more
quickly thus reducing storage and obsolescence costs.
This ratio reflects how many times average inventory was produced and sold during the period. A higher ratio indicates that inventory moves more
quickly thus reducing storage and obsolescence costs.
7-29
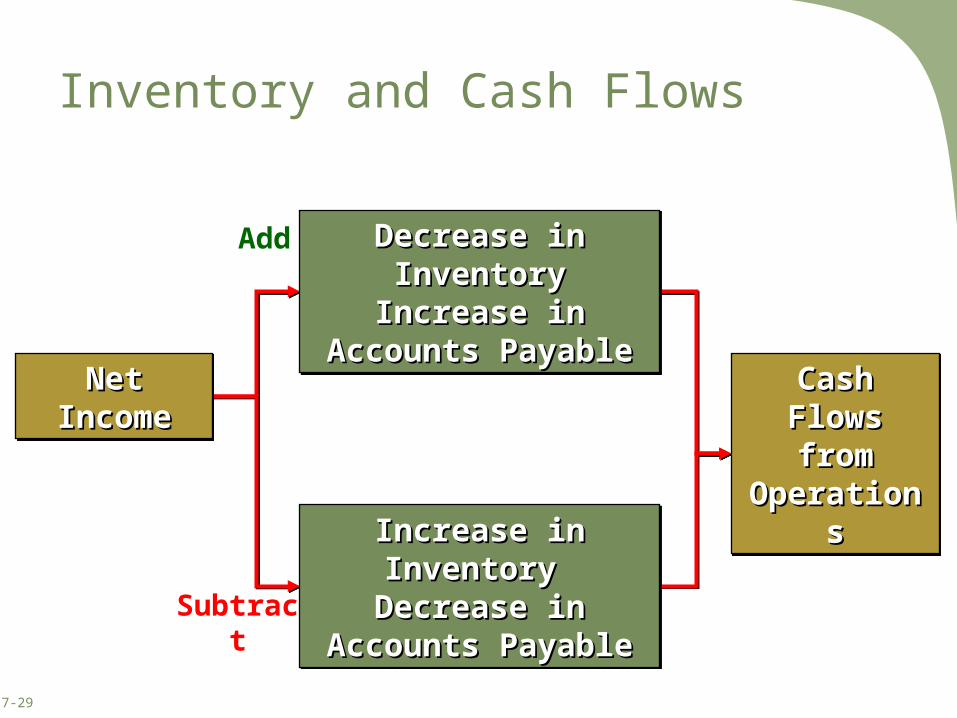
Inventory and Cash Flows
Add
Subtract
Cash Flows Cash Flows from from
OperationsOperations
Cash Flows Cash Flows from from
OperationsOperations
Net IncomeNet IncomeNet IncomeNet Income
Decrease in InventoryDecrease in InventoryIncrease in Accounts Increase in Accounts
PayablePayable
Decrease in InventoryDecrease in InventoryIncrease in Accounts Increase in Accounts
PayablePayable
Increase in Inventory Increase in Inventory Decrease in Accounts Decrease in Accounts
PayablePayable
Increase in Inventory Increase in Inventory Decrease in Accounts Decrease in Accounts
PayablePayable
7-30
Inventory Methods and Financial Statement Analysis
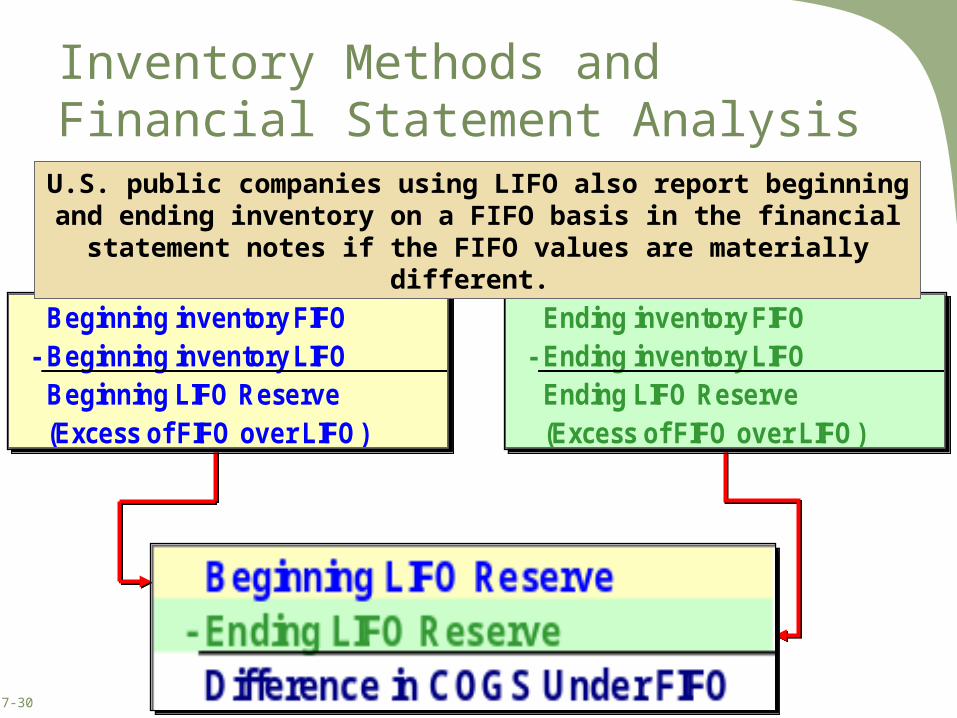
Beginning inventory FIFO- Beginning inventory LIFO
Beginning LIFO Reserve(Excess of FIFO over LIFO)
Beginning inventory FIFO- Beginning inventory LIFO
Beginning LIFO Reserve(Excess of FIFO over LIFO)
Ending inventory FIFO- Ending inventory LIFO
Ending LIFO Reserve(Excess of FIFO over LIFO)
Ending inventory FIFO- Ending inventory LIFO
Ending LIFO Reserve(Excess of FIFO over LIFO)
U.S. public companies using LIFO also report beginning and ending inventory on a FIFO basis in the financial statement notes if the
FIFO values are materially different.
7-31
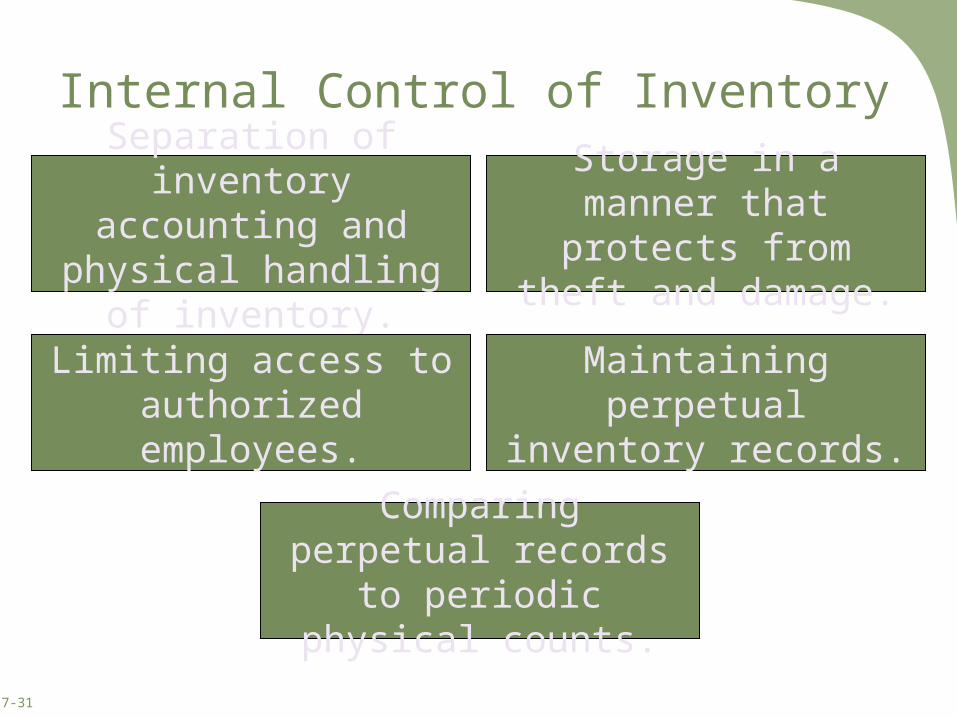
Internal Control of Inventory
Separation of inventory accounting and physical
handling of inventory.
Storage in a manner that protects from theft and
damage.
Limiting access to authorized employees.
Maintaining perpetual inventory records.
Comparing perpetual records to periodic
physical counts.

7-32
Perpetual and Periodic Inventory Systems
Provides Provides up-to-dateup-to-date inventory records.inventory records.
Provides Provides up-to-dateup-to-date inventory records.inventory records.
Provides Provides up-to-date up-to-date cost of sales records. cost of sales records. Provides Provides up-to-date up-to-date
cost of sales records. cost of sales records.
Perpetual Perpetual SystemSystem
Perpetual Perpetual SystemSystem
In a periodic inventory system, ending inventory and cost of goods sold are determined at the end of the accounting
period based on a physical count.

7-33
Perpetual and Periodic Inventory Systems
Inventory System
Item Periodic System Perpetual System
Beginning InventoryCarried over
from prior periodCarried over from
prior period
Add: PurchasesAccumulated in the Purchases
account
Accumulated in the Inventory
account
Less: Ending Inventory
Measured at end of period by
physical inventory count
Perpetual record updated at every
sale
Cost of Goods Sold
Computed as a residual amount at end of period
Measured at every sale based
on perpetual record

7-34
Errors in Measuring Ending Inventory
Errors in Measuring InventoryEnding Inventory Beginning Inventory
Overstated Understated Overstated Understated
Ending Inventory + - N/A N/A
Retained Earnings + - - +
Goods Available for Sale N/A N/A + -Cost of Goods Sold - + + -Gross Profit + - - +Net Income + - - +
Effect on Current Period's Balance Sheet
Effect on n Current Period's Income Statement
7-35
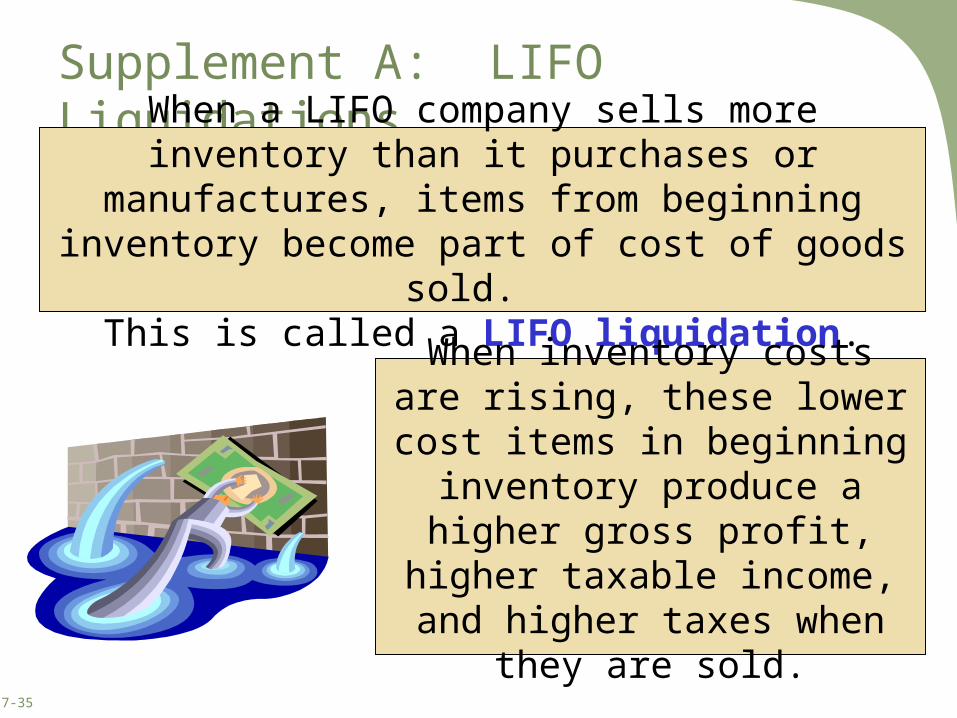
Supplement A: LIFO LiquidationsWhen a LIFO company sells more inventory than it purchases or manufactures, items from beginning
inventory become part of cost of goods sold. This is called a LIFO liquidation.
When inventory costs are rising, these lower cost items in
beginning inventory produce a higher gross profit, higher
taxable income, and higher taxes when they are sold.

7-36
Supplement B: Additional Issues in Measuring Purchases
Purchase returns and allowances are a reduction
in the cost of purchases associated with
unsatisfactory goods.
A purchase discount is a cash discount
received for prompt payment of an account.
7-37
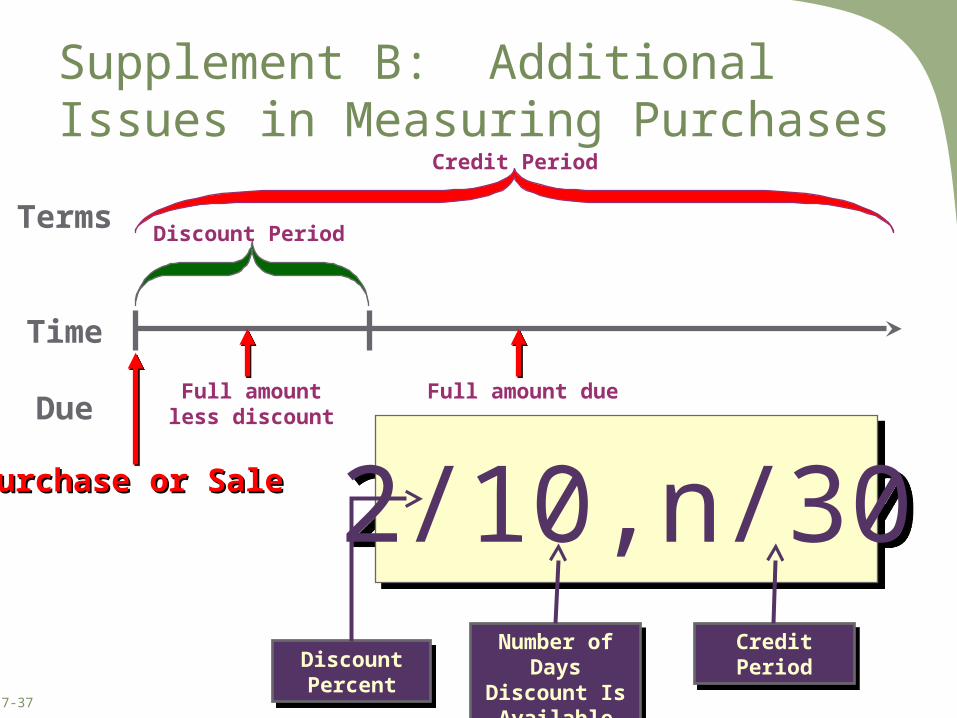
Supplement B: Additional Issues in Measuring Purchases
Terms
Time
Due
Discount Period
Full amountless discount
Credit Period
Full amount due
Purchase or SalePurchase or Sale 2/10,n/302/10,n/30Discount Percent
Discount Percent
Number of Days Discount
Is Available
Number of Days Discount
Is Available
CreditPeriod
CreditPeriod
7-38
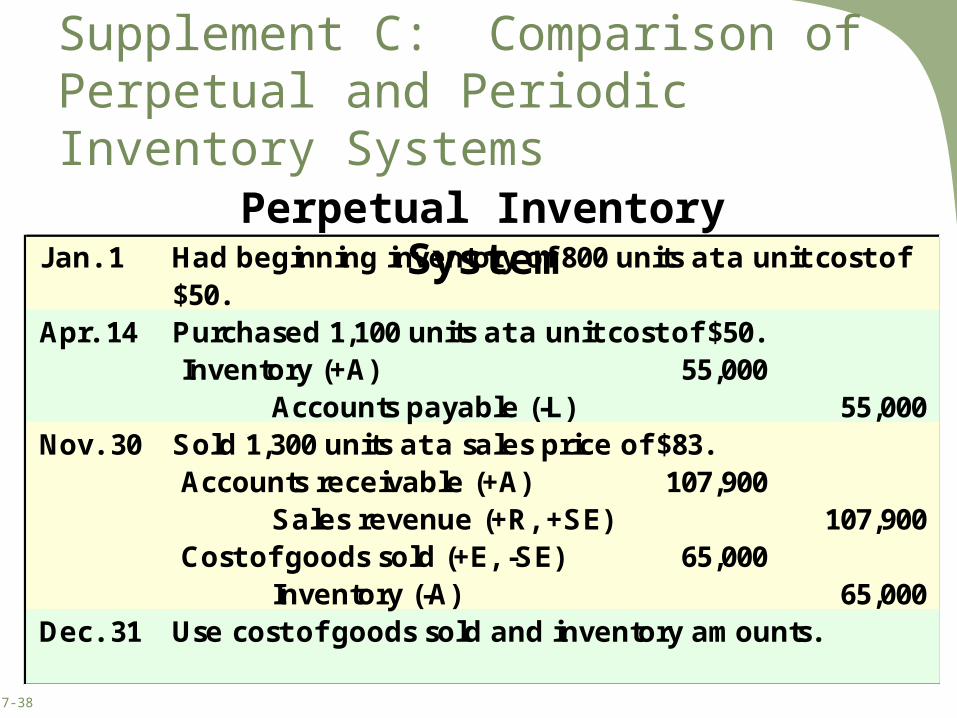
Supplement C: Comparison of Perpetual and Periodic Inventory Systems
Jan. 1
Apr. 14 Purchased 1,100 units at a unit cost of $50.Inventory (+A) 55,000
Accounts payable (-L) 55,000 Nov. 30 Sold 1,300 units at a sales price of $83.
Accounts receivable (+A) 107,900 Sales revenue (+R, +SE) 107,900
Cost of goods sold (+E, -SE) 65,000 Inventory (-A) 65,000
Dec. 31 Use cost of goods sold and inventory amounts.
Had beginning inventory of 800 units at a unit cost of $50.
Perpetual Inventory System

7-39
Supplement C: Comparison of Perpetual and Periodic Inventory Systems
Periodic Inventory System
7-40
End of Chapter 07