6B HUMAN BEHAVIOUR & COMMUNITY SAFETY · REPORT NO. A.000.000 6B HUMAN BEHAVIOUR & COMMUNITY SAFETY...
378
REPORT NO. A.000.000 6B HUMAN BEHAVIOUR & COMMUNITY SAFETY Research results from February 7th Victorian Fires – Final Report Authors John Handmer a , Anthony Bedford b, Monique Ladds b , Lyndsey Wright c , Joshua Whittaker a , Katharine Haynes d,a , Jim McLennan e , and Briony Towers a
Transcript of 6B HUMAN BEHAVIOUR & COMMUNITY SAFETY · REPORT NO. A.000.000 6B HUMAN BEHAVIOUR & COMMUNITY SAFETY...

REPORT NO. A.000.000
6B
HUMAN BEHAVIOUR & COMMUNITY SAFETY Research results from February 7th Victorian Fires – Final Report
Authors John Handmera, Anthony Bedfordb, Monique Laddsb, Lyndsey Wrightc, Joshua Whittakera, Katharine Haynesd,a,
Jim McLennane, and Briony Towersa


© Bushfire Cooperative Research Centre 2011.
No part of this publication must be reproduced, stored in a retrieval system or transmitted in any form without prior written permission from the copyright owner, except under the conditions permitted under the Australian Copyright Act 1968 and subsequent amendments.
Disclaimer: The Bushfire Cooperative Research Centre advises that the information contained in this publication comprises general statements based on scientific research. The reader is advised and needs to be aware that such information may be incomplete or unable to be used in any specific situation. No reliance or actions must therefore be made on that information without seeking prior expert professional, scientific and technical advice. To the extent permitted by law, the Bushfire Cooperative Research Centre (including its employees, partners and consultants) excludes all liability to any person for any consequences, including but not limited to all losses, damages, costs, expenses and any other compensation, arising directly or indirectly from using this publication (in part or in whole) and any information or material contained in it.
Publisher: Bushfire Cooperative Research Centre
March 2011
i
i
HUMAN BEHAVIOUR & COMMUNITY SAFETY Research results from February 7th Victorian Fires – Final Report
Authors John Handmera, Anthony Bedfordb, Monique Laddsb, Lyndsey Wrightc, Joshua Whittakera, Katharine
Haynesd,a, Jim McLennane, and Briony Towersa
cBushfire CRC; aCentre for Risk & Community Safety, School of Mathematics & Geospatial Sciences, RMIT
University; dRisk Frontiers, Macquarie University; eSchool of Psychological Science, La Trobe University; bStatistics Unit, School of Mathematics & Geospatial Sciences, RMIT University.
This work was undertaken for the Bushfire CRC as part of the Post-fire research program in Human
Behaviour.
Project leaders: John Handmer (RMIT) & Damien Killalea (Tasmania Fire Service)
This document was prepared by Anthony Bedford and Monique Ladds, statisticians at the School of
Mathematics and Geospatial Science, RMIT University, and by John Handmer of the same School. All other
listed authors were involved in survey design, data collection and the initial analysis.
This is the final report of the post 7 February 2009 Human Behaviour Project. The project was lead by John
Handmer of the Centre for Risk and Community Safety at RMIT University and Damien Killalea of Tasmania
Fire Service. Joshua Whittaker managed the fieldwork and survey administration. SPSS analysis for the
initial interim report was undertaken by Katherine Haynes (Whittaker et al, 2010)1.
1 Joshua Whittaker, Katharine Haynes, Jim McLennan, John Handmer, and Briony Towers. (2010) Research
results from February 7th Victorian Fires Second Report on: Human Behaviour & Community Safety.
Melbourne: Bushfire CRC.

ii

iii
CONTENTS EXECUTIVE SUMMARY 1 INTRODUCTION 4 PURPOSE AND LIMITATIONS 5 METHODOLOGY 6 RESULTS 10 Descriptive Statistics (following the questionnaire format) 10
Section 1: How the bushfire affected you and your property 10
Section 2: Information and warnings 22
Section 3: Before the bushfire 38
Section 4. During the bushfire 64
Section 5. Information about you and your household 112
CHI-SQUARE TESTS OF ASSOCIATION 124 Section 1: How the bushfires affected your property 125 Section 2: Information and Warnings 167 Section 3: Before the bushfire 216 Section 4: During the Bushfire – part 1 280 Section 4. During the Bushfire – part 2 310

iv
Acknowledgements
We acknowledge with gratitude the participation in this research of the residents of the bushfire affected areas, many of whom had suffered major losses. This project has many debts. Numerous people contributed to the research, including in the field, in logistics, intellectual support, leadership and countless other ways. Our sincere thanks go to all who contributed, including those not named below. The project began a few days after the February 7th bushfires. The first part of the project involved interviews with more than 600 residents who were affected by the February 7th fires. Field interviewers were drawn from agencies and groups across Australia, including: Terramatrix; the Tasmania Fire Service; NSW Rural Fire Service; SA Country Fire Service; CFA; DSE; CSIRO; and RMIT and La Trobe universities. The ‘Human Behaviour’ team worked collaboratively and productively with the ‘Building and Planning Issues’ team, led by Justin Leonard of CSIRO. Our sincere thanks are due to all who worked in our teams or who collaborated with us, in particular to Sarah McCaffrey who joined us from the US Forest Service and provided valuable advice at the critical, early stage. There were many teams in the field at fire sites across Victoria at any one time. Coordination of such large numbers of people in terms of logistics was a major task undertaken by the Bushfire CRC and AFAC. We thank these organisations sincerely for their leadership, patience and capabilities, in particular Lyndsey Wright, overall manager of the post-fire research program, Duncan Maughan of Terramatrix, who coordinated the fieldwork, and Richard Thornton, who oversaw the process. They were supported by staff from the CFA, DSE, OESC and elsewhere. The individuals who contributed are too numerous to mention, but include Alison Stone of DSE, Gary Morgan of the Bushfire CRC, Naomi Brown of AFAC, John Gledhill of the Tasmania Fire Service, Euan Ferguson of the SA Country Fire Service, Neil Bibby of the CFA and Bruce Esplin of the OESC. The ‘Householder response to the February 7th bushfires’ survey was developed from the initial field interview research. In addition to the individuals and groups mentioned above, many of whom contributed directly to the survey’s development, we would like to thank Michael Black of Spatial Vision, and Robert Pascale and Stephen Pittman of Datatime Services Pty Ltd. Finally, we acknowledge with appreciation our home institutions, which have provided consistently strong support for the research.

1
1
0BExecutive Summary
On Saturday the 7th of February, 2009, Victoria experienced the worst bushfires in Australia’s recorded history. 173
people lost their lives and more than 2000 homes were destroyed, in addition to substantial economic and
environmental impacts.
In response to these events, the Bushfire CRC established a Research Task Force to undertake research for the Fire
and Land Management sector and the fire research community in Australia and internationally. The Research Task
Force covers three key areas:
412BFire Behaviour
413BHuman Behaviour and Community Safety Issues
414BBuilding (infrastructure) and Planning Issues
This is the final report of the ‘Human Behaviour and Community Safety Issues’ team (hereafter referred to as the
‘Human Behaviour’ team), based on the results of the “Householder response to the February 7th bushfires’
survey”. The report is presented in the form of a databook setting out frequencies and some cross-tabulations from
a quantitative analysis of surveys mailed to households that were affected by the February 7th bushfires. An interim
report (Whittaker et al, 2010) set out preliminary findings based on analysis of 1104 surveys. This introductory text
is similar to that of the Interim Report, however the body of the report differs as it contains analysis of all usable
completed surveys – 1314 in total, additional frequency tables and cross tabulations as well as statistical tests for
all cross-tabs.
The survey form was developed from previous post-fire surveys and research needs arising from the 2009 fires. The
survey included questions requested by the stakeholders. Survey drafts were piloted.
Surveys were mailed to approximately 6000 addresses in areas that physically fell within the ‘burnt area’, as
defined by DSE (Victorian Department of Sustainability Environment. A response rate of approximately 25% was
obtained. This is generally considered sufficient to avoid sampling bias. This figure excludes 699 uncompleted
surveys that were returned to the Centre for Risk & Community Safety, the vast majority of which were
undeliverable. It is possible that more residents did not receive the survey. Approximately half of the final sample
was female (49%). Most respondents (72%) were aged between 35 and 64 and most owned their own homes.
The survey was divided into five sections, with section 5 covering demographics:
17BSection 1: How the bushfire affected you and your property
Approximately one-third (32%) of respondents reported that their house was destroyed in the bushfires. Rates of
house destruction were significantly higher among respondents in the Latrobe (42%), Murrindindi (38%), Mitchell
(35%) and Whittlesea (32%) local government areas (LGA).
The vast majority of respondents (88%) reported that their household was adversely affected by the bushfires.
Sixteen respondents (1%) reported that a member of their household had perished in the fires, and 7% of
respondents reported that a household member was injured in the fires.
Almost two-thirds of respondents reported that a household member had felt more sad or depressed (64%) and/or
more nervous or anxious than usual (61%). More than one-third of respondents (39%) reported increased strain
between members of their household as a result of the fires.
A significant proportion of respondents indicated that they had experienced financial strain due to job loss or loss
of livelihood (29%) and/or a lack of insurance (20%). A small number of respondents (4%) reported that they did not
have insurance.

2
18BSection 2: Information and warnings
Almost all respondents (97%) reported that they were aware that February 7th was a day of Total Fire Ban.
The majority of respondents (68%) expected to receive an official warning if there was a bushfire in their town or
suburb.
Respondents most commonly became aware of the fire through: sensory cues from the environment (i.e. smoke,
embers, fire; 33%); a warning from family, friends or neighbours (21%); or a radio announcement (6%).
Almost two-thirds (64%) reported that they did not receive an official warning. A majority of respondents in
Whittlesea (83%), Murrindindi (80%), Yarra Ranges (80%) and Mitchell (71%) report not receiving an official warning.
A majority of respondents (61%) reported that they received information and warnings about the fire from a family
member, friend or neighbour.
19BSection 3: Before the bushfire
The majority of all respondents (64%) claim to have had a firm plan about what to do if a bushfire occurred before
February 7th, with three quarters of residents (76%) acknowledging that it was likely or very likely for a bushfire to
occur in their area.
Nearly half of all respondents (48%) reported that, at the beginning of last summer (2008), they intended to stay
and defend their house or property from bushfires. 17% reported their intention to leave, including 16% who
planned to leave as soon as they knew a fire was threatening and 1% who planned to leave on all days of high fire
danger. Notably, a quarter of respondents (24%) reported that they were effectively undecided, including those
who planned to stay and defend but leave if threatened by fire (16%) and those who intended to see what the fire
was like before deciding whether to stay or leave (8%).
The majority of respondents (78%) reported discussing their intended response with members of their household.
More than two-thirds (68%) had thought about what each member of the household would do. Notably, fewer
respondents had considered how things could change if some members of the household were not at home during a
fire (42%) or written down important things to do and remember (26%).
Most frequently residents rated their level of preparedness as average (36%) and the majority wanted to be more
prepared than they were (69%).
20BSection 4: During the bushfire
Half of respondents (50%) reported that they stayed to defend their homes and properties from the February 7th
bushfires. 10% of these respondents left when they felt the danger was too great to stay, and 2% did not encounter
fire on their properties. 41% of respondents left their homes or properties either before or when the fires arrived in
their town or suburb. A small proportion (5%) reported that they sheltered inside a house, in a structure other than
a house, in a vehicle, or somewhere outside during the fire.
Over half of the respondents (54%) who left their homes and properties before or when the fires arrived considered
themselves to have left ‘Late’ or ‘Very late’. A large proportion of respondents (48%) left because they felt it was
too dangerous to stay and protect their house. In addition, seeing or smelling fire nearby (31%), advice from
relatives, friends or neighbours (25%) and the need to remove household members or visitors from danger (24%)
were major factors in motivating people to leave.
A significant proportion of respondents reported experiencing difficulties associated with leaving late, including:
smoke (45%); poor visibility (26%); traffic (24%); embers (22%); flames (17%); and fallen trees (12%).

3
The majority of respondents (77%) who stayed with their house or property during the bushfire did so to protect
their house, property and/or livestock. 72 people (11%) stayed because they felt it was too late to leave, or failed
in their attempt to leave.
One-third (34%) of respondents who stayed with their house or property reported leaving at some stage during the
fire. The most commonly cited reason for leaving was that it was too dangerous to stay and defend (42%). Other
commonly cited reasons were: there were flames in the immediate vicinity of the property (31%); to remove
household members or visitors from danger (24%). One quarter of these respondents (26%) reported leaving
because utilities or equipment failed and/or because their house caught fire (17%).
The majority of respondents (72%) who left their homes and properties before or when the fires arrived stated that
they would leave again if there was a similar fire in the future. A similar proportion (73%) of those who stayed with
their homes and properties declared their intention to stay and protect their homes and properties from future
bushfires.

4
1BIntroduction On Saturday the 7th of February, 2009, Victoria experienced the worst bushfires in Australia’s recorded history. 173
people lost their lives and more than 2000 homes were destroyed, in addition to substantial economic and
environmental impacts.
In response to these events, the Bushfire CRC established a Research Task Force to undertake research for the Fire
and Land Management sector and the fire research community in Australia and internationally. The initial scope of
the Task Force was determined by the Bushfire CRC, CFA and DSE on February 11th 2009. It was agreed that the
research would cover three key areas:
415BFire Behaviour
416BHuman Behaviour and Community Safety Issues
417BBuilding (infrastructure) and Planning Issues
The Task Force was led by a team of experienced bushfire researchers from Australia, New Zealand and the USA.
These researchers, supported by a large number of trained field staff from fire agencies throughout Australia,
gathered and collated as much information as was possible in a time-critical period to support the process of
learning lessons from the fires.
More details of the initiation and the broader outcomes of this work can be found in the Bushfire CRC Final Report
available on the Bushfire CRC websiteFF
2
All aspects of the research consider the question: ‘Was the impact of the fires of 7th February consistent with
established knowledge or was this the result of previously unidentified behaviours or factors?’ Due to the scale of
the events and the limited time frame, this was not a forensic investigation of any individual event, occurrence,
location or structure, but rather a consideration of the patterns evident as a result of these events.
This is the final report of the ‘Human Behaviour and Community Safety Issues’ team (hereafter referred to as the
‘Human Behaviour’ team). It is presented in the form of a databook setting out frequencies and some cross-
tabulations from a quantitative analysis of surveys mailed to households that were affected by the February 7th
bushfires. An interim report (Whittaker et al, 2010) set out preliminary findings based on analysis of 1104 surveys.
This introductory text is similar to that of the Interim Report, however the body of the report differs as it contains
analysis of all usable completed surveys – 1314 in total, additional frequency tables and cross tabulations as well as
statistical tests for all cross-tabs.
The following sections outline the purpose and limitations of the research and the methods that were used to
conduct it. The report then turns to the key quantitative findings, which are presented for each section of the
survey:
418BSection 1: How the bushfires affected you and your property
419BSection 2: Information and warnings
420BSection 3: Before the bushfire [Planning and preparedness]
421BSection 4: During the bushfire [Householder responses]
2 “Victorian 2009 Bushfire Research Response Final Report” October 2009, Bushfire CRC, ISBN: 978-0-9806759-8-6 (H HUhttp://www.bushfirecrc.com/research/taskforce2009.html UHH)

5
2BPurpose and limitations This is the Final Report of the post-fire research into human behaviour and community safety issues during the
February 7th bushfires. It presents findings from a quantitative analysis of surveys mailed to households that were
affected by the February 7th fires. It is important to recognise that the results presented are subject to some
limitations. The most obvious of these is that responses are likely to have been influenced by ‘hindsight effects’
involved in making judgements about the causes of events in the past with the knowledge of results from the
present.FF
3FF In particular, participants’ responses to the survey may have been influenced by the extensive media
publicity and public discussion arising from the 2009 Victorian Bushfires Royal Commission hearings and associated
developments. These include, for example, changes to government and agency policies concerning vegetation
clearing and community warnings, and criticism of fire agencies and the ‘Prepare, stay and defend or leave early’
policy.
This report presents only the findings of the quantitative research. Findings from the qualitative component of the
research are reported in the Report on Human Behaviour and Community Safety in the Bushfire CRC research
response final report, hereafter referred to as the ‘first report’.
3 For example: Pohl, R. F. (2004). Hindsight bias. In R. F. Pohl (ed.), Cognitive illusions: A handbook on fallacies and biases in thinking, judgement and memory (pp. 363-378). New York: Psychology Press.

6
3BMethodology The research was designed with distinct qualitative and quantitative components. This report presents findings
from an analysis of the quantitative data. The qualitative component of the research entailed interviews with
approximately 600 residents who were affected by the February 7th bushfires. Detail of the qualitative research,
including findings relating to human behaviour and community safety issues, can be found in the first report.
21B3.1 Survey rationale
The purpose of the first report was to provide qualitative insights into human behaviour and community safety
issues arising from the February 7th bushfires. Semi-structured interviewing was selected as the primary data
collection method for the first phase of the research as it enabled participants to freely share their experiences
and thoughts about the bushfires. This approach was sensitive to survivors’ needs to share and have their
experiences heard, but also enabled researchers to identify important issues and themes that may not have been
previously considered. The mail-out survey, which is the focus of this report, was developed to gather quantitative
data on the Taskforce Research Questions and the issues and themes that emerged from the qualitative component
of the research.
22B3.2 Survey design
The “Householder response to the February 7th bushfires’ survey” was developed from previous post-fire surveys
and research needs arising from the 2009 fires. Researchers from the Centre for Risk and Community Safety, RMIT
University, drafted a list of questions for possible inclusion in the survey. Based on internal assessment and
discussions with stakeholders, the list was redrafted before it was presented to the Bushfire CRC and stakeholders
for formal feedback. The survey was then revised to include a number of additional questions requested by the
stakeholders and was restructured to achieve a clearer and more logical layout. Survey drafts were piloted. The
survey was divided into five sections (see Appendix A for a copy of the survey):
367BSection 1: How the bushfires affected you and your property
o A series of questions about: the age and construction of respondents’ homes; whether their
homes were damaged or destroyed by fire or wind; and how members of the household were
affected by the fires.
368BSection 2: Information and warnings
o A series of questions about: general information people received about bushfires prior to
February 7th, such as information about how to plan and prepare for bushfires; warnings about
potential fire danger on February 7th; and information and warnings received during the February
7th bushfires.
369BSection 3: Before the bushfire
o A series of questions about householder planning and preparation for bushfires prior to and on
February 7th.
370BSection 4: During the bushfire
o A series of questions about householder responses to the February 7th bushfires. The first part of
this section is intended for respondents who left their home or property either before or when
the fire arrived in their town or suburb (and did not initiate defence). The second part of this
section is intended for respondents who stayed with their home or property for some or all of the
fire. This includes respondents who: stayed and defended throughout the fire; initiated defence
but left once the danger was too great; and those who did not initiate defence but sheltered
inside the house or elsewhere on the property.

7
371BSection 5: Information about you and your household
o A series of questions about the respondent’s: gender; age; type and tenure of property; length of
residence; insurance; household composition; and membership of CFA and Community Fire Guard
groups.
o The survey was again distributed to colleagues at RMIT University and the Bushfire CRC, as well
as to a number of contacts in high-fire risk areas, to gain feedback on its content and layout. It
was then pre-tested with ten Kinglake residents to ensure that respondents’ interpretations of
the questions were consistent with that intended in the research design and that the issues
covered were considered salient by respondents. However, because the survey was based on
issues identified from the semi-structured interviews and questions were phrased using the
language and terms used by respondents, only minor amendments were necessary.
3.3 Survey sample
Surveys were mailed to approximately 6000 addresses in areas affected by the February 7th bushfires. Addresses
that physically fell within the ‘burnt area’, as defined by DSE, were extracted from the Vicmap database.
Residents of fire-affected areas who did not receive a copy of the survey were invited to participate through a
series of press releases and radio announcements advising them to contact the Centre for Risk & Community Safety
for a copy of the survey. An online version of the survey was also made available.
A response rate of approximately 25% was obtained. This is generally considered sufficient to avoid sampling bias.
This figure excludes 699 uncompleted surveys that were returned to the Centre for Risk & Community Safety, the
vast majority of which were undeliverable. It is possible that more residents did not receive the survey.
The 1314 surveys included in this report were received from more than 40 postcode areas across Victoria. These
are located in each of the major fire complexes, including: Murrindindi, Yarra Ranges, Mitchell, Whittlesea,
Latrobe and Baw Baw.
Fire complex Postcodes
Murrindindi 3711, 3714, 3717, 3763, 3778, 3779
Yarra Ranges 3767, 3774, 3775, 3777, 3799
Mitchell 3658, 3660, 3758, 3764
Whittlesea 3757
Latrobe 3840, 3842, 3844
Baw Baw 3816, 3818
Other* 3099, 3171, 3340, 3400, 3401, 3478, 3551, 3568,
3660, 3673, 3691, 3737, 3749, 3761, 3873, 3878
Invalid postcode 5638, 5818
*Other includes Alpine, Benella, East Gippsland, Gannawarra, Greater Bendigo, Greater Dandenong, Horsham,
Loddon, Moorabool, Nillumbik, St Arnaud, Towong and Wellington
About half (49%) of respondents were female. Most respondents (76%) were aged between 35 and 64 and most
owned their own homes. A cross sectional analysis of respondent’s age and home ownership is shown below.
Further demographic and other information about the households represented in the survey sample can be found in
the Results section of this report.

8
2 = 50.136 P < 0.001 Owned or
buying Renting Other Total
18-24 Count 6 3 1 10
Expected 9.4 0.4 0.2
25-34 Count 69 10 6 85
Expected 79.6 3.8 1.7
35-44 Count 259 11 4 274
Expected 256.4 12.2 5.3
45-54 Count 312 15 7 334
Expected 312.6 14.9 6.5
55-64 Count 310 11 4 325
Expected 304.2 14.5 6.3
65-74 Count 154 2 1 157
Expected 146.9 7 3.1
75+ Count 44 3 1 48
Expected 44.9 2.1 0.9
Total Count 1154 55 24 1233
Q73. What is your age? By Q78 Did you own or rent propert?
24B3.4 Ethics and fieldwork risks
Ethics approval for the research was obtained from RMIT University’s Human Research and Ethics Committee. The
surveys were conducted and data were managed in accordance with the Committee’s requirements. The main
ethical issue facing the survey research was the need to engage sensitively with research participants, who may
have suffered trauma as a result of their experiences.
The survey form that was mailed to households included a brief introductory letter and a more detailed Project
Information Statement that explains the purpose of the research, the parties undertaking it, and the benefits and
risks of participating. These documents clearly state that participation in the survey is voluntary (See Appendix A).
Residents were informed that their address has been randomly selected from a list of fire affected properties
compiled using fire maps and government records, and that their names have not been obtained. The Project
Information Statement also states that only members of the household over the age of 18 should complete the
survey. Respondents were advised that recalling the events of February 7th may cause distress and were provided
with contact details for free counselling and support services. Respondents were informed that their responses to
the surveys will remain anonymous and that only the researchers undertaking the analysis will have access to the
raw data. Importantly, the Project Information Statement also included a statement about how the information
collected will be used to improve community bushfire safety.
The Project Information Statement provided respondents with contact details for researchers should they have any
concerns or questions about their participation in the research. Contact details were also provided for the
Executive Officer of the RMIT Human Research Ethics Committee should respondents have complaints about their

9
participation in the research. A number of residents made contact with researchers to request copies of the survey
and to discuss aspects of the survey.
25B3.4 Data collection and analysis
A data entry company was contracted to enter the survey data. The statistical analysis software SPSS (Version 17)
was used to analyse the data. The analysis for the interim report on the survey (Whittaker et al, 2010) was
coordinated by RMIT University’s Centre for Risk & Community Safety. Analysis for this final report was undertaken
by statisticians in RMIT’s School for Mathematics and Geospatial Science in conjunction with the Centre for Risk &
Community Safety. Handling and use of the dataset is subject to strict privacy and ethical considerations.
As discussed in the ‘Purpose and limitations’ section of this report, the findings presented in this report are based
on an analysis of 1314 of approximately 1350 returned surveys. This report presents basic frequencies for each
survey question, with cross-tabulations and statistical tests for key questions. Analysis of qualitative fields (‘Other
– please specify’ and text box questions) has not been undertaken for this report.
ADDITIONAL REFERENCE:
Joshua Whittaker, Katharine Haynes, Jim McLennan, John Handmer, and Briony Towers. (2010) Research results
from February 7th Victorian Fires Second Report on: Human Behaviour & Community Safety. Melbourne: Bushfire
CRC.

10
4BResults
6BDescriptive Statistics
12BSection 1: How the bushfire affected you and your property
26BQ1. What is your postcode?
Missing Baw Baw Latrobe Mitchell Murrindindi Whittlesea Yarra Ranges Other Total
Count 32 65 104 173 407 142 197 194 1314
Percent 2.4 4.9 7.9 13.2 31 10.8 15 14.8 100
In the table above, postcodes have been grouped into the main fire complexes using the fire progression maps
presented in the Interim Report of the 2009 Victorian Bushfires Royal Commission. The large proportion of surveys
returned from the Murrindindi fire complex reflects the large size of this fire complex and the effected population.

11
27BQ2. In what decade was the house built?
Before 1900
1900 - 1919
1920 – 1939
1940 - 1959
1960 - 1979
1980 - 1999
2000 - 2009
Valid Total
Missing Total
Count 15 23 40 98 315 548 169 1208 106 1314
Percent 1.2 1.8 3 7.5 24 41.7 12.9 91.9 8.1 100
Homes that were built in fire affected areas were largely built after 1980.

12
12
28BQ3. What is/was your bushfire-affected house made of?
Timber Cellulose cement Brick Mud Brick Aluminium siding PVC siding Other
Count 581 78 529 135 27 11 136
Percent 44.2 5.9 40.3 10.3 2.1 0.8 10.4

13
House was undamaged Minor damage Major damage Destroyed
Timber 42.3% (219) 36.8% (110) 31.6% (12) 56.8% (235)
Cellulose cement 4.4% (23) 6.0% (18) 2.6% (1) 8.5% (35)
Brick 45.8% (237) 45.5% (136) 57.9% (22) 31.4% (130)
Mud Brick 8.9% (46) 13.7% (41) 13.2% (5) 9.7% (40)
Aluminium siding 2.3% (12) 2.0% (6) .0% (0) 2.2% (9)
PVC siding 1.0% (5) 1.0% (3) .0% (0) .5% (2)
Other 11.4% (59) 11.4% (34) 10.5% (4) 8.9% (37)
Don't know .0% (0) .0% (0) .0% (0) .0% (0)
House was undamaged Minor damage Major damage Destroyed
Timber 38.0% 19.1% 2.1% 40.8%
Cellulose cement 29.9% 23.4% 1.3% 45.5%
Brick 45.1% 25.9% 4.2% 24.8%
Mud Brick 34.8% 31.1% 3.8% 30.3%
Aluminium siding 44.4% 22.2% .0% 33.3%
PVC siding 50.0% 30.0% .0% 20.0%
Other 44.0% 25.4% 3.0% 27.6%
Don't know .0% .0% .0% .0%
14
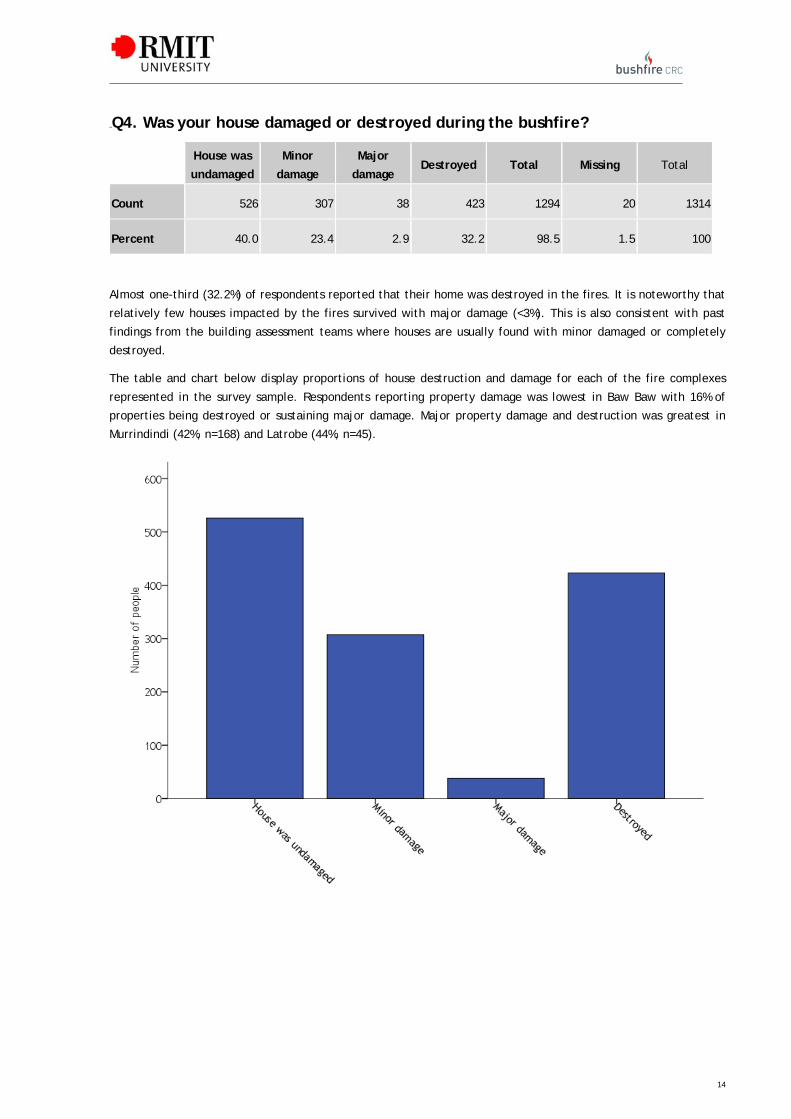
29BQ4. Was your house damaged or destroyed during the bushfire?
House was
undamaged
Minor
damage
Major
damage Destroyed Total Missing Total
Count 526 307 38 423 1294 20 1314
Percent 40.0 23.4 2.9 32.2 98.5 1.5 100
Almost one-third (32.2%) of respondents reported that their home was destroyed in the fires. It is noteworthy that
relatively few houses impacted by the fires survived with major damage (<3%). This is also consistent with past
findings from the building assessment teams where houses are usually found with minor damaged or completely
destroyed.
The table and chart below display proportions of house destruction and damage for each of the fire complexes
represented in the survey sample. Respondents reporting property damage was lowest in Baw Baw with 16% of
properties being destroyed or sustaining major damage. Major property damage and destruction was greatest in
Murrindindi (42%, n=168) and Latrobe (44%, n=45).

15
Baw Baw Latrobe Mitchell Murrindindi Whittlesea Yarra Ranges
Other
House was undamaged 57.8% (37) 15.4% (16) 40.2% (68) 37.7% (152) 35.5% (50) 49.7% (97) 52.2% (97)
Minor damage 26.6% (17) 40.4% (42) 23.1% (39) 20.6% (83) 24.1% (34) 25.6% (50) 18.8% (35)
Major damage 1.6% (1) 1.9% (2) 1.8% (3) 2.2% (9) 6.4% (9) 1.0% (2) 6.5% (12)
Destroyed 14.1% (9) 42.3% (44) 34.9% (59) 39.5% (159) 34.0% (48) 23.6% (46) 22.6% (42)
Total 100% (64) 100% (104) 100% (169) 100% (403) 100% (141) 100% (195) 100% (186)
0%
10%
20%
30%
40%
50%
60%
70%
80%
90%
100%
MURRI
NDINDI
YARR
A RA
NGES
MITCH
ELL
WHITT
LESE
A
LATR
OBE
BAW
BAW
OTHER
Destroyed
Major damage
Minor damage
House was undamaged

16
30BQ5. If known, how did the bushfire first ignite your house?
Embers Flames Other buildings Trees or bushes No fire Other Don't Know Total
Count 158 98 71 103 140 91 177 838
Percent 12.0 7.5 5.4 7.8 10.7 6.9 13.5 100
Consistent with findings from previous studies, the most common cause of house ignition was ember attack (19%).
The large number of ‘Don’t know’ is possibly due to many respondents leaving their homes before the fire
impacted (see Q35 & Q37).

17
31BQ6. Was the house damaged by wind at any time during the bushfire
Before the fire With the fire After the fire No Don't know Total Missing Total
Count 14 75 6 382 218 695 73 768
Percent 1.8 9.8 .8 49.7 28.4 90.5 9.5 100
Despite the many accounts of strong winds on February 7th, the majority of residents (49.7%) reported that their
house was not damaged by wind. Of those who indicated they were affected by wind damage, most said that it
occurred with the fire.

18
Not at all
To some
extent
To a moderate
extent
To a great
extent
Don't
know/Unsure
Before the fire .0% (0) 7.1% (1) .0% (0) 85.7% (12) 7.1% (1)
With the fire 2.6% (2) 1.3% (1) 3.8% (3) 91.0% (71) 1.3% (1)
After the fire .0% (0) .0% (0) .0% (0) 100.0% (5) .0% (0)
No 2.7% (11) 4.7% (19) 5.2% (21) 85.7% (349) 1.7% (7)
Don't know 2.3% (5) .0% (0) 3.2% (7) 88.0% (190) 6.5% (14)

19
32BQ7. To what extent do you think the following factors influenced how the fire affected your home and/or property?
Not at all To some extent
To a moderate extent
To a great extent
The actions I took to prepare before Feb 7
None or minor damage 12% (95) 16% (131) 18% (142) 53% (416)
Major damage or destroyed 62% (240) 15% (61) 9% (36) 12% (49)
My actions on the day
None or minor damage 20% (156) 10% (82) 9% (70) 59% (461)
Major damage or destroyed 65% (270) 10% (42) 5% (24) 13% (54)
Help of family, friends or neighbours on the day
None or minor damage 33% (253) 13% (100) 10% (81) 42% (324)
Major damage or destroyed 76% (312) 6% (28) 2% (11) 8% (35)
Construction of my home
None or minor damage 33% (250) 17% (129) 18% (140) 25% (191)
Major damage or destroyed 41% (173) 16% (67) 13% (58) 21% (91)
Fire agencies fire fighting activities
None or minor damage 69% (526) 7% (55) 5% (41) 14% (111)
Major damage or destroyed 76% (309) 4% (18) 2% (11) 8% (35)
Fire agencies fuel reduction activities
None or minor damage 84% (633) 5% (39) 2% (22) 3% (28)
Major damage or destroyed 67% (276) 5% (24) 2% (10) 15% (65)
Fuel (e.g. trees, bushes, leaves etc.)
None or minor damage 19% (146) 24% (180) 19% (142) 35% (263)
Major damage or destroyed 23% (100) 20% (87) 14% (61) 37% (161)
Topography/Landscape
None or minor damage 16% (126) 20% (156) 26% (196) 30% (224)
Major damage or destroyed 19% (83) 20% (86) 15% (64) 37% (159)
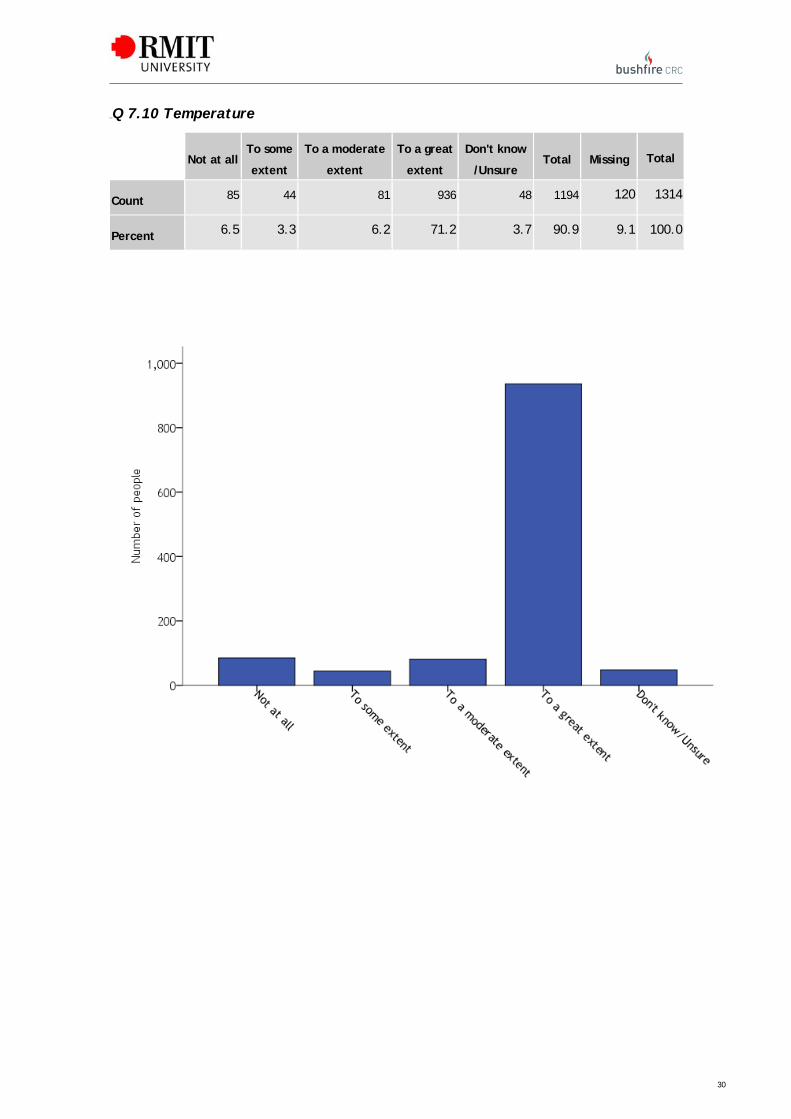
Temperature
None or minor damage 10% (79) 5% (38) 7% (56) 71% (531)
Major damage or destroyed 1% (6) 1% (5) 5% (23) 89% (393)
Wind
None or minor damage 5% (42) 5% (44) 7% (53) 77% (586)
Major damage or destroyed 1% (8) 1% (5) 3% (16) 90% (396)
Luck or chance
None or minor damage 13% (99) 23% (179) 13% (105) 47% (354)
Major damage or destroyed 25% (102) 12% (51) 10% (42) 38% (151)
Other
None or minor damage 8% (8) 1% (1) 4% (4) 81% (81)
Major damage or destroyed 3% (2) 1% (1) 3% (2) 79% (49)
Note that this Table contains two sets of responses for each factor: the upper set is from respondents whose house
was not damaged or sustained minor damage only; the lower set is from respondents whose house was destroyed
or sustained major damage.

20
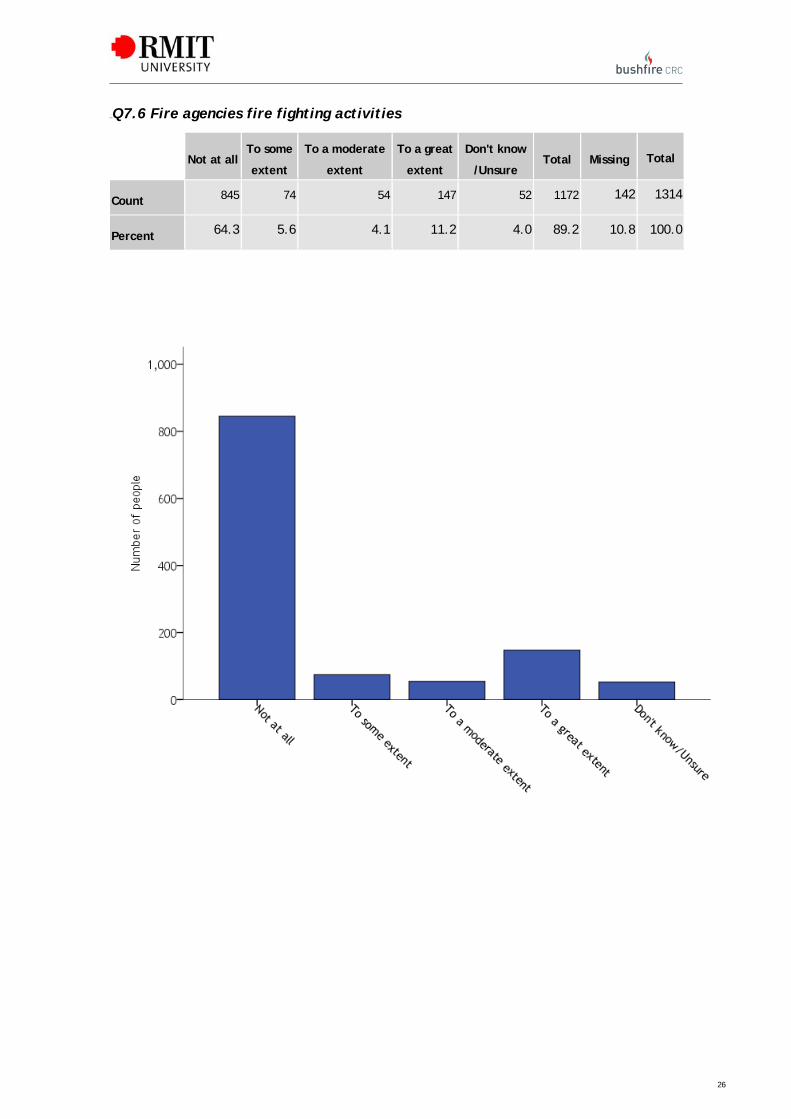
It is noteworthy that a large majority of both groups of respondents judged that the efforts of fire agencies on the
day were largely unrelated to the outcomes; and a majority of both groups judged that the high temperatures and
wind strengths were important determinants of how the fire affected respondents’ homes. Those whose houses
were destroyed or sustained major damage were rather more likely to report the high temperatures and winds as
contributing “to a great extent” (an external cause attribution) compared with those whose houses survived.
In particular, judgements reported about the first two factors (‘The actions I took to prepare before Feb 7’; and
‘My actions on the day’) appear to be strongly related to whether the house survived (with minor damage), or was
destroyed or sustained major damage (explored in greater depth in section 2). Those whose house was destroyed
or sustained major damage reported that both of these two factors were less influential in determining the impact
of the fire on the house compared with those whose house survived or sustained only minor damage. Such a
difference probably reflects a reasonably robust finding from social psychology: when actions are followed by
negative outcomes, responsibility for the negative outcome is more likely to be attributed to external factors
rather than personal endeavoursF
4FF Similar processes probably affected respondents’ answers to the 7th factor: item
‘Fire agencies’ fuel reduction activities’ — respondents whose house was destroyed or sustained major damage
were more likely to regard this factor as a significant influence on how the fire affected their home.
4 For example: Malle, B. (1999). How people explain behaviour: A new theoretical framework. Personality and Social Psychology Review, 3, 23-48.

21
372BQ7.1 The actions I took to prepare before February 7th
Not at allTo some
extent
To a moderate
extent
To a great
extent
Don't know
/Unsure Total Missing Total
Count 339 195 182 470 29 1215 99 1314
Percent 25.8 14.8 13.9 35.8 2.2 92.5 7.5 100.0

22
373BQ7.2 My actions on the day
Not at allTo some
extent
To a moderate
extent
To a great
extent
Don't know
/Unsure Total Missing Total
Count 431 124 96 521 30 1202 112 1314
Percent 32.8 9.4 7.3 39.6 2.3 91.5 8.5 100.0

23
374BQ7.3 The help of family, friends or neighbours on the day
Not at allTo some
extent
To a moderate
extent
To a great
extent
Don't know
/Unsure Total Missing Total
Count 575 128 93 360 26 1182 132 1314
Percent 43.8 9.7 7.1 27.4 2.0 90.0 10.0 100.0

24
375BQ7.4 The construction of my home
Not at allTo some
extent
To a moderate
extent
To a great
extent
Don't know
/Unsure Total Missing Total
Count 425 202 200 285 63 1175 139 1314
Percent 32.3 15.4 15.2 21.7 4.8 89.4 10.6 100.0

25
376BQ7.5 The position of my home
Not at allTo some
extent
To a moderate
extent
To a great
extent
Don't know
/Unsure Total Missing Total
Count 256 225 223 447 48 1199 115 1314
Percent 19.5 17.1 17.0 34.0 3.7 91.2 8.8 100.0
26
377BQ7.6 Fire agencies fire fighting activities
Not at allTo some
extent
To a moderate
extent
To a great
extent
Don't know
/Unsure Total Missing Total
Count 845 74 54 147 52 1172 142 1314
Percent 64.3 5.6 4.1 11.2 4.0 89.2 10.8 100.0

27
378BQ7.7 Fire agencies fuel reduction activities
Not at allTo some
extent
To a moderate
extent
To a great
extent
Don't know
/Unsure Total Missing Total
Count 922 64 32 93 59 1170 144 1314
Percent 70.2 4.9 2.4 7.1 4.5 89.0 11.0 100.0

28
379BQ7.8 Fuel (e.g. trees, bushes, leaves on ground etc)
Not at allTo some
extent
To a moderate
extent
To a great
extent
Don't know
/Unsure Total Missing Total
Count 247 271 208 428 27 1181 133 1314
Percent 18.8 20.6 15.8 32.6 2.1 89.9 10.1 100.0

29
380BQ 7.9 Topography/Landscape (e.g. hills, valleys, rivers etc)
Not at allTo some
extent
To a moderate
extent
To a great
extent
Don't know
/Unsure Total Missing Total
Count 210 247 263 389 72 1181 133 1314
Percent 16.0 18.8 20.0 29.6 5.5 89.9 10.1 100.0
30
381BQ 7.10 Temperature
Not at allTo some
extent
To a moderate
extent
To a great
extent
Don't know
/Unsure Total Missing Total
Count 85 44 81 936 48 1194 120 1314
Percent 6.5 3.3 6.2 71.2 3.7 90.9 9.1 100.0

31
382BQ7.11 Wind
Not at allTo some
extent
To a moderate
extent
To a great
extent
Don't know
/Unsure Total Missing Total
Count 50 50 71 994 42 1207 107 1314
Percent 3.8 3.8 5.4 75.6 3.2 91.9 8.1 100.0

32
383BQ 7.12 Luck or chance
Not at allTo some
extent
To a moderate
extent
To a great
extent
Don't know
/Unsure Total Missing Total
Count 201 233 150 511 68 1163 151 1314
Percent 15.3 17.7 11.4 38.9 5.2 88.5 11.5 100.0

33
33BQ8. Have members of your household experienced any of the following as a result of the fires?
Death Injury Financial strain
from job loss
Financial strain from
lack of insurance
Strained
relationships
Count 16 97 380 266 516
Percent 1.2 7.4 28.9 20.2 39.3
Nervous or
anxious
Sad or
depressed Health problems Other
None of the
above
Count 797 843 393 72 154
Percent 60.7 64.2 29.9 5.5 11.7
Only a small proportion of respondents (12%) reported that their household was not affected in some way by the
bushfires - death/injury, financial strain, emotionally, or health-wise. Clearly, adverse emotional responses, in the
form of anxiety and depression, were very common, with nearly two-thirds of respondents reporting a household
member(s) being affected emotionally. Financial problems accommodated around half (49%) of the respondents.
34
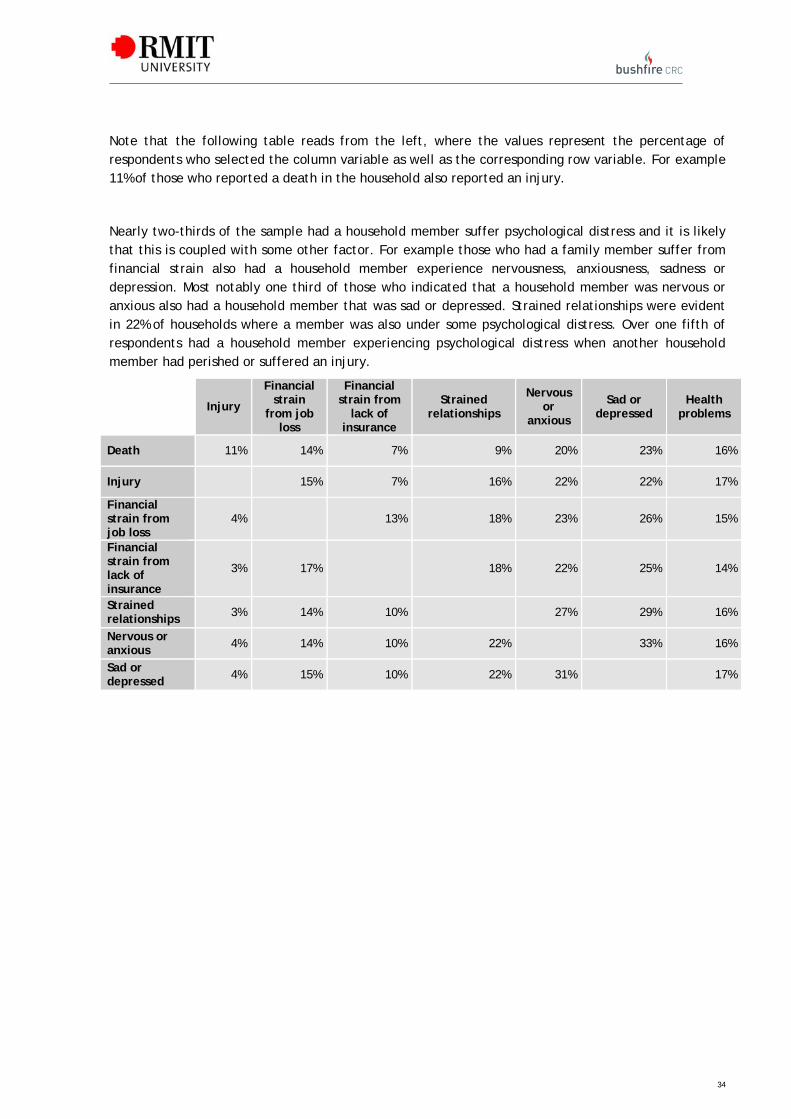
Note that the following table reads from the left, where the values represent the percentage of respondents who selected the column variable as well as the corresponding row variable. For example 11% of those who reported a death in the household also reported an injury.
Nearly two-thirds of the sample had a household member suffer psychological distress and it is likely that this is coupled with some other factor. For example those who had a family member suffer from financial strain also had a household member experience nervousness, anxiousness, sadness or depression. Most notably one third of those who indicated that a household member was nervous or anxious also had a household member that was sad or depressed. Strained relationships were evident in 22% of households where a member was also under some psychological distress. Over one fifth of respondents had a household member experiencing psychological distress when another household member had perished or suffered an injury.
Injury
Financial strain
from job loss
Financial strain from
lack of insurance
Strained relationships
Nervous or
anxious
Sad or depressed
Health problems
Death 11% 14% 7% 9% 20% 23% 16%
Injury 15% 7% 16% 22% 22% 17%
Financial strain from job loss
4% 13% 18% 23% 26% 15%
Financial strain from lack of insurance
3% 17% 18% 22% 25% 14%
Strained relationships 3% 14% 10% 27% 29% 16%
Nervous or anxious 4% 14% 10% 22% 33% 16%
Sad or depressed 4% 15% 10% 22% 31% 17%

35
13BSection 2: Information and warnings
This Section presents basic frequencies and percentages for a series of questions relating to bushfire information
and warnings. This includes general information, such how to plan and prepare for bushfires, and specific
information and warnings about the February 7th bushfires.
34BQ10. In the 12 months before the February 7th bushfire, did you get any information about how to prepare your household for bushfires from any of the following sources?
ABC Radio Other Radio Emergency
personnel
Friends, family or
neighbours
CFA
website
CFA community
meetings
Count 447 88 224 327 222 401
Percent 34.0 6.7 17.0 24.9 16.9 30.5
CFA
fireguard CFA
workbook DSE website Vic Bushfire
Info Line Television Did not get any
information Other
Count 238 434 84 39 461 154 169
Percent 18.1 33.0 6.4 3.0 35.1 12.9 11.7
Only 13% (n=154) of respondents claimed that they received no information on how to prepare for bushfires. The
most frequently reported sources of information were television and ABC radio followed closely by the CFA’s
community meetings and living in the bush workbook. It is also interesting to note that almost the same number of
respondents (25%, n=327) received information from family, friends or neighbours.

36
35BQ11. In the 12 months before the February 7th bushfire, did you get any information about what to do during a bushfire from any of the following?
ABC Radio Other Radio Emergency
personnel
Friends, family or
neighbours
CFA
website
CFA community
meetings
Count 377 67 186 263 155 370
Percent 28.7 5.1 14.2 20.0 11.8 28.2
CFA
fireguard
CFA
workbook DSE website
Vic Bushfire
Info Line Television
Did not get any
information Other
Count 221 420 43 23 353 130 210
Percent 16.8 32.0 3.3 1.8 26.9 9.9 16.0
The pattern of Count of source of information about what to do during bushfires above matches closely the pattern
of responses about sources of information about how to prepare for a bushfire.

37
36BQ12. Did you know that February 7th 2009 was a day of Total Fire Ban?
Yes No Total Missing Total
Count 1272 13 1285 29 1314
Percent 96.8 1.0 97.8 2.2 100
The findings support what seemed to emerge in the immediate aftermath of the 7th February 2009 fires: almost
everybody knew the day was a day of total fire ban. However, the events of 7th February 2009 suggest that there
was little connection between such awareness and individuals taking appropriate actions.

38
37BQ13. How did you FIRST find out that the February 7th bushfire was in your town or suburb?
Radio Internet TelevisionFamily, friends or
neighbours
Emergency
personnel
Smelled or saw
smoke
Count 72 11 7 270 24 251
Percent 5.5 0.8 0.5 20.5 1.8 19.1
Saw fire approach Saw embers Saw fire burning Other Total Missing Total
Count 107 33 36 92 903 411 1314
Percent 8.1 2.5 2.7 7.0 68.7 31.3 100
The majority of respondents noted that they first became aware of the bushfire through sensory cues from the
environment (smoke, fire embers: total n=427, 32%). The second most common form of first warning was from
family, friends or neighbours (21%). Only 8% were first alerted through ‘official’ warnings (radio, emergency
personnel, internet, television: total n=114). This is consistent with findings from the Bushfire CRC Investigation
Taskforce interviews.

39
38BQ14. After finding out the fire was in your town or suburb, how long was it before the fire reached your house?
Few
minutes <30mins
30mins
to 1 hour
1-2
hours >2hours
Fire did not
reach house
Don't
know Total Missing Total
Count 260 245 145 118 264 55 142 1229 85 1314
Percent 19.8 18.6 11.0 9.0 20.1 4.2 10.8 93.5 6.5 100
38% of respondents had less than 30 minutes in which to respond to the fires, with approximately 1 in 5
respondents (20%) only having a few minutes.

40
The more extreme the warning signs of fire were the less time people had before the fire reached their home.
Three quarters of those who saw the fire and two thirds of those who saw embers only had a few minutes before
the fire reached their property. Time lines for those who smelled or saw smoke was similar to those who were
informed of the fire by family friends or neighbours. The majority had less than two hours before the fire reached
their property.
Few
minutes <30mins
30mins to
1 hour 1-2 hours >2hours
Fire did not
reach house
Don't
know
Radio 13% (9) 13% (9) 5.8% (4) 7.2% (5) 29% (20) 1.4% (1) 30.4% (21)
Internet 0% (0) 30% (3) 10% (1) 0% (0) 30% (3) 0% (0) 30% (3)
Television 0% (0) 0% (0) 0% (0) 16.7% (1) 0% (0) 0% (0) 83.3% (5)
Family, friends
or neighbours 12.8% (33) 17.1% (44) 15.5% (40) 10.5% (27) 25.2% (65) 5.4% (14) 13.6% (35)
Emergency
personnel 0% (0) 4.2% (1) 20.8% (5) 12.5% (3) 33.3% (8) 4.2% (1) 25% (6)
Smelled or
saw smoke 12.9% (31) 23.7% (57) 10.4% (25) 12.4% (30) 28.6% (69) 5.4% (13) 6.6% (16)
Saw fire
approaching 43.7% (45) 24.3% (25) 10.7% (11) 4.9% (5) 3.9% (4) 5.8% (6) 6.8% (7)
Saw embers 63.3% (19) 20% (6) 10% (3) 0% (0) 3.3% (1) 0% (0) 3.3% (1)
Saw fire 75.8% (25) 6.1% (2) 9.1% (3) 0% (0) 0% (0) 3% (1) 6.1% (2)
Other 15.1% (13) 15.1% (13) 8.1% (7) 7% (6) 36% (31) 5.8% (5) 12.8% (11)

41
39BQ15. Did you EXPECT to receive an OFFICIAL warning if there was a bushfire in your town or suburb? Official warnings include those from authorities such as the CFA, the police or other emergency services, and ABC radio.
Yes No Total Missing Total
Count 891 358 1249 65 1314
Percent 67.8 27.2 95.1 4.9 100
The implication of the information in the table is clear: most respondents (68%) expected to receive some form of
an official warning if a bushfire threatened their home. Their actions on the day were, presumably, based on this
expectation.

42
42
40BQ16. Did you actually RECEIVE an OFFICIAL warning from any of the following?
ABC Radio Other Radio Emergency personnel
CFA website
DSE website
Victorian Bushfire Information Line
CFA community meetings Television Did not receive
warning
Count 218 27 104 44 17 7 42 14 841
Percent 16.6 2.1 7.9 3.3 1.3 0.5 3.2 1.1 64.0
The pattern of responses in the table above must be interpreted in light of the pattern of responses concerning expectations about warnings: nearly two-thirds (n=841, 64%) of
the 1314 respondents report not receiving an official warning; while 891 (68%) expected to. Consistent with findings from the Bushfire CRC Research Taskforce interviews, radio
was the most frequently reported source of official warnings which were reportedly received.
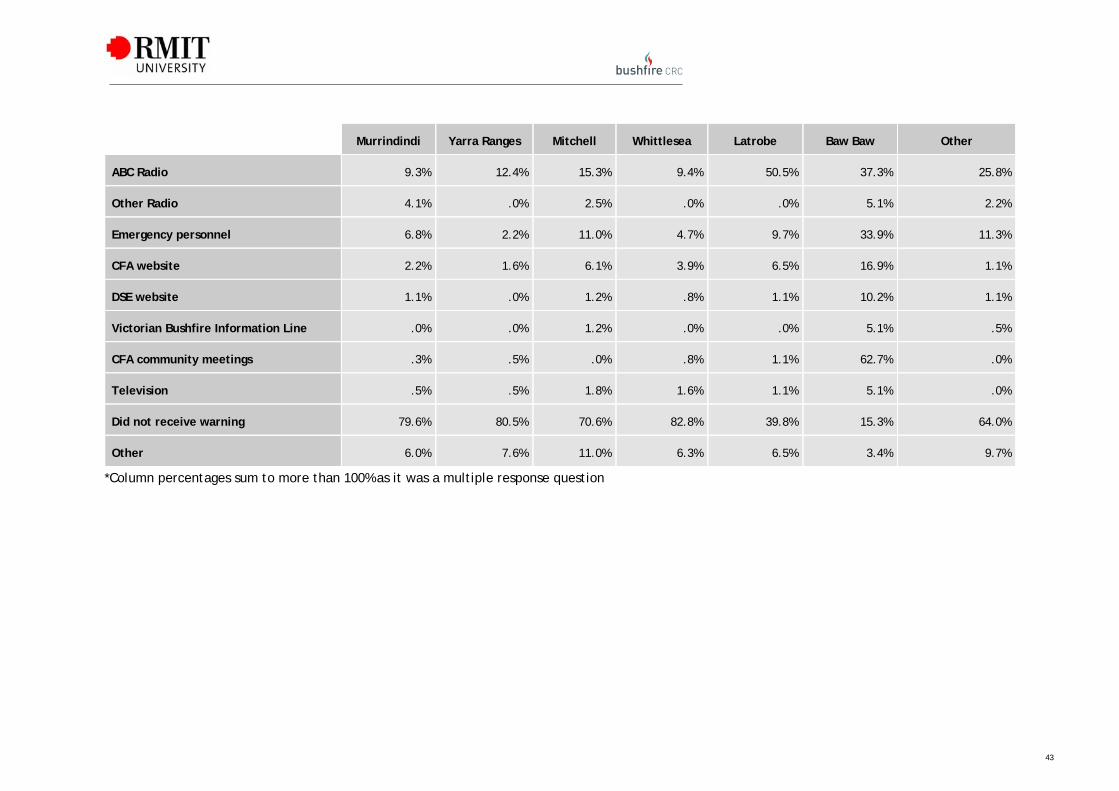
When sources of official warning are looked at by fire complex (table below), it can be seen that a significant proportion of respondents from Yarra Ranges (81%), Mitchell (71%),
Whittlesea (83%) and Murrindindi (80%) felt they did not receive an official warning. It is interesting to note the split in the data for Latrobe where, despite significant
proportions of respondents receiving official warnings from ABC Radio (51%), a high proportion also stated that they did not receive a warning (40%). Baw Baw’s respondents had
the highest proportion of warnings, nearly two-thirds of which were from CFA community meetings (63%) and many respondents had warnings from multiple sources.
43
Murrindindi Yarra Ranges Mitchell Whittlesea Latrobe Baw Baw Other
ABC Radio 9.3% 12.4% 15.3% 9.4% 50.5% 37.3% 25.8%
Other Radio 4.1% .0% 2.5% .0% .0% 5.1% 2.2%
Emergency personnel 6.8% 2.2% 11.0% 4.7% 9.7% 33.9% 11.3%
CFA website 2.2% 1.6% 6.1% 3.9% 6.5% 16.9% 1.1%
DSE website 1.1% .0% 1.2% .8% 1.1% 10.2% 1.1%
Victorian Bushfire Information Line .0% .0% 1.2% .0% .0% 5.1% .5%
CFA community meetings .3% .5% .0% .8% 1.1% 62.7% .0%
Television .5% .5% 1.8% 1.6% 1.1% 5.1% .0%
Did not receive warning 79.6% 80.5% 70.6% 82.8% 39.8% 15.3% 64.0%
Other 6.0% 7.6% 11.0% 6.3% 6.5% 3.4% 9.7%
*Column percentages sum to more than 100% as it was a multiple response question

44
44

45
430BThe next five questions refer only to those who received an official warning (question 16).
41BQ17. Which official source was the MOST IMPORTANT in helping you to respond to the bushfire?
ABC Radio Other Radio Emergency personnel CFA website DSE website
Count 186 16 52 16 2
Percent 39.3 3.4 11.0 3.4 .4
CFA Community meeting Television Other Total Missing Total
Count 35 3 55 365 108 473
Percent 7.4 .6 11.6 77.2 22.8 100
Not only was ABC radio the most frequently reported source of official warning (for those 36% of respondents who
received an official warning) but it was also reported to be the most important source of official warnings by many
of the respondents (39%). Please note that environmental cues (smoke, flames and embers etc) were the most
common form of first warning for respondents, followed by unofficial warnings from friends, family and
neighbours. Official sources only alerted 8% of respondents to the presence of danger. Interestingly only 4% of
respondents thought of the official websites as important sources of information.

46
42BQ18. Was the information you received about the LOCATION of the fire clear enough for you to understand the danger to your household?
Very Clear Clear Unclear No information Don't know Total Missing Total
Count 181 82 72 50 6 391 82 473
Percent 38.3 17.3 15.2 10.6 1.3 82.7 17.3 100
It is notable that over half (56%) of respondents found the information they received about the location of the fire
to be clear or very clear. At the same time, however, 26% felt that the information they received did not provide
clear or provided no information about the location of the fire and the danger to their household.

47
43BQ19. Was the information you received about the SEVERITY of the fire clear enough for you to understand the danger to your household?
Very Clear Clear Unclear No information Don't know Total Missing Total
Count 174 75 58 76 7 390 83 473
Percent 36.8 15.9 12.3 16.1 1.5 82.5 17.5 100
The percentage of respondents who received an official warning (36%) provided a somewhat mixed overall
appraisal of the quality of these warnings. (a) Location: 56% Very Clear or Clear, 10% No information about
location; Severity: 53% Very Clear or Clear, 16% No information about severity.

48
44BQ20. Did you receive the warning in enough time to respond to the bushfire safely?
Ample Just enough Not enough Don't know Total Missing Total
Count 177 119 89 18 403 70 473
Percent 37.4 25.2 18.8 3.8 85.2 14.8 100
In terms of the usefulness of warnings, more than one third of the respondents who received a warning reported
that their warning was timely. When this data is explored by respective fire complex (below) it can be seen that a
higher proportion of respondents in Yarra Ranges (46%) and Whittlesea (43%) reported that they did not receive the
warning in enough time to respond safely to the bushfire.

49
Murrindindi Yarra Ranges Mitchell Whittlesea Latrobe Baw Baw Other
Ample 34.1% 19.5% 50.0% 10.7% 61.7% 78.8% 39.1%
Just enough 34.1% 24.4% 35.4% 28.6% 23.3% 9.6% 40.6%
Not enough 27.5% 46.3% 10.4% 42.9% 15.0% 7.7% 18.8%
Don't know 4.4% 9.8% 4.2% 17.9% .0% 3.8% 1.4%

50
45BQ21. How long AFTER you got the warning did the fire reach your house or property?
Few
minutes <30mins
30mins to 1
hour
1-2
hours >2hours
Fire did not
reach house
Don't
know Total Missing Total
Count 63 71 59 53 163 28 57 494 820 1314
Percent 4.8 5.4 4.5 4.0 12.4 2.1 4.3 37.6 62.4 100.0

51
46BQ22. Did you receive an UNOFFICIAL warning about the fire from family, friends or neighbours?
Yes No Total Missing Total
Count 797 479 1276 38 1314
Percent 60.7 36.5 97.1 2.9 100
A majority of respondents (61%, n=797) stated they received a warning about the fire from a family member,
friend, or neighbour. As identified in Q13 1 in 5 residents received their first inkling of potential fire danger from
this unofficial source. This information is consistent with the Bushfire CRC Research Taskforce interviews, where
the residents were either first alerted by or confirmed warnings (particularly environmental cues) with a family
member, friend, or neighbour.
47BQ23. Please use the space below to describe any issues or difficulties you had with information or warnings before, during or after the bushfire.
This was an open ended question, the analysis of which is beyond the scope of this report.

52
14BSection 3: Before the bushfire
This Section presents basic frequencies and percentages for a series of questions relating to households’ planning
and preparedness for bushfires.
48BQ24. Before the February 7th bushfire, how likely did you think it was that a bushfire could occur in your town or suburb?
Very unlikely Unlikely Likely Very likely Not considered Total Missing Total
Count 117 161 462 537 10 1287 27 1314
Percent 8.9 12.3 35.2 40.9 .8 97.9 2.1 100
The vast majority of survey respondents (76%) claim to have thought, before the February 7th fires, that it was
‘likely’ or ‘very likely’ that a bushfire would occur in their town or suburb. Hindsight is likely to have affected
these results, with experiences of the February 7th bushfires influencing people’s recollections of the past.
53
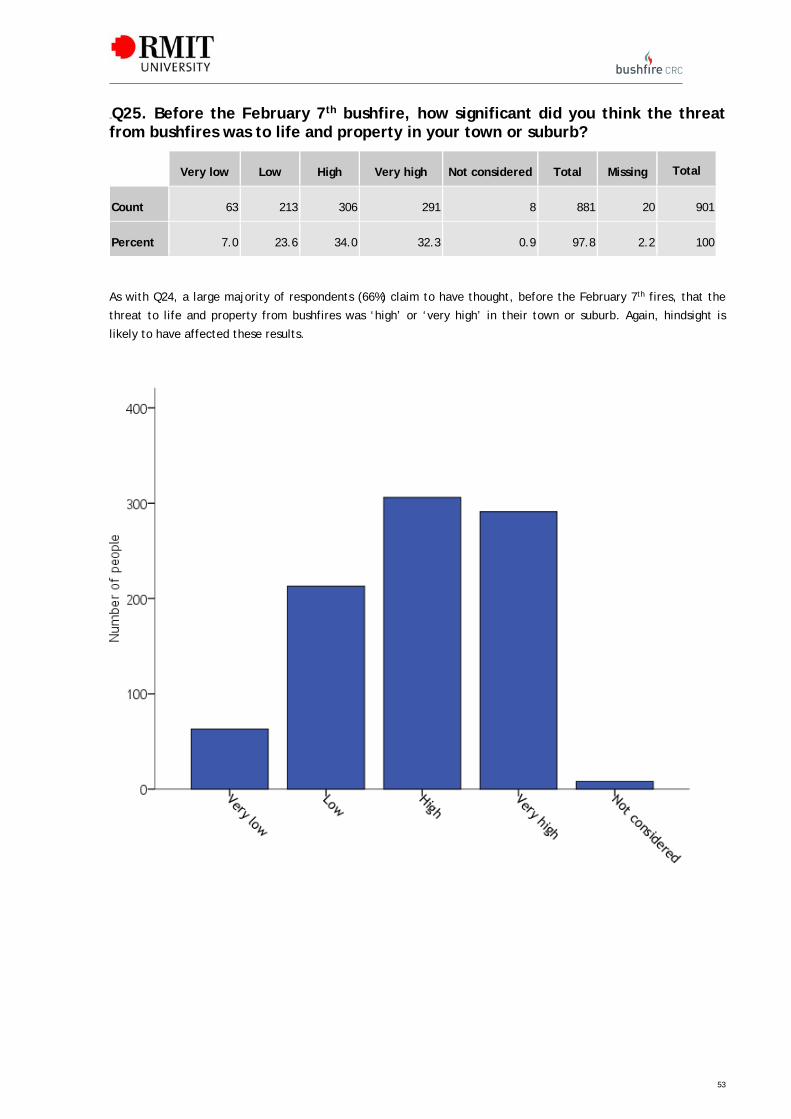
49BQ25. Before the February 7th bushfire, how significant did you think the threat from bushfires was to life and property in your town or suburb?
Very low Low High Very high Not considered Total Missing Total
Count 63 213 306 291 8 881 20 901
Percent 7.0 23.6 34.0 32.3 0.9 97.8 2.2 100
As with Q24, a large majority of respondents (66%) claim to have thought, before the February 7th fires, that the
threat to life and property from bushfires was ‘high’ or ‘very high’ in their town or suburb. Again, hindsight is
likely to have affected these results.
54
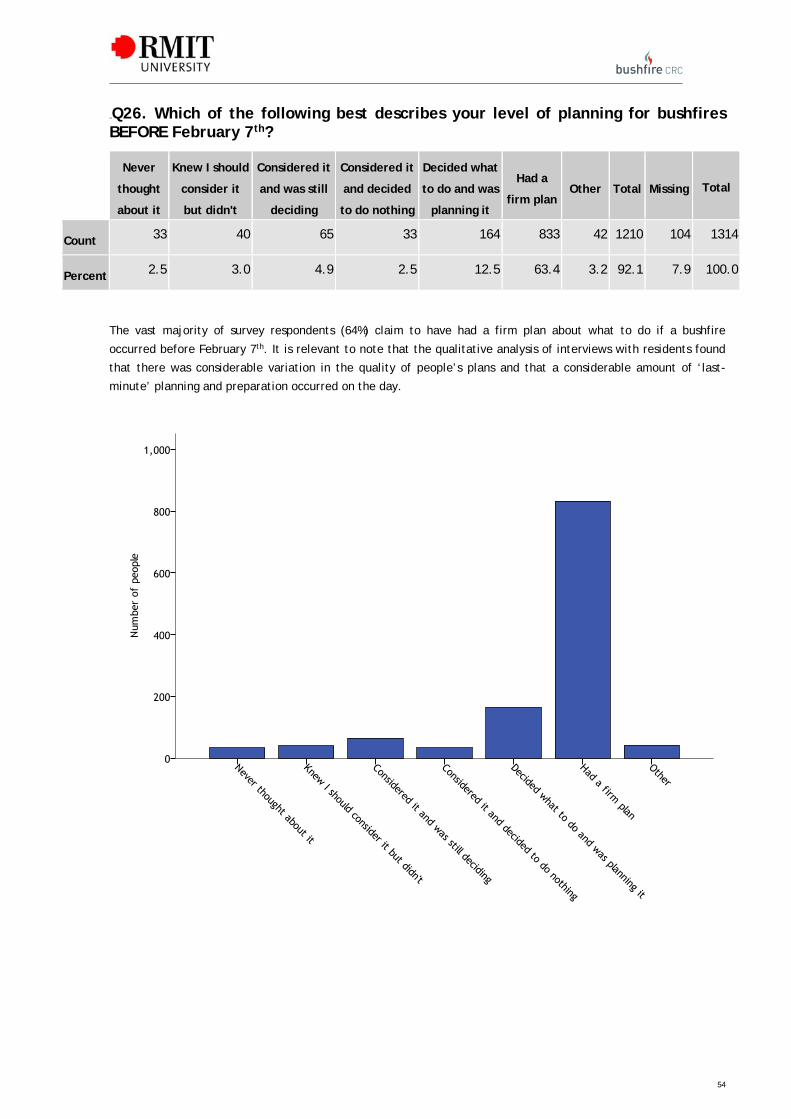
50BQ26. Which of the following best describes your level of planning for bushfires BEFORE February 7th?
Never
thought
about it
Knew I should
consider it
but didn't
Considered it
and was still
deciding
Considered it
and decided
to do nothing
Decided what
to do and was
planning it
Had a
firm planOther Total Missing Total
Count 33 40 65 33 164 833 42 1210 104 1314
Percent 2.5 3.0 4.9 2.5 12.5 63.4 3.2 92.1 7.9 100.0
The vast majority of survey respondents (64%) claim to have had a firm plan about what to do if a bushfire
occurred before February 7th. It is relevant to note that the qualitative analysis of interviews with residents found
that there was considerable variation in the quality of people’s plans and that a considerable amount of ‘last-
minute’ planning and preparation occurred on the day.

55
When responses to Q26 are looked at by fire complex, we note that Whittlesea yielded the highest proportion of
respondents in terms of had a firm plan.
Murrindindi Yarra
Ranges Mitchell Whittlesea Latrobe
Baw
Baw Other
Never thought about it 1.0% 2.3% 3.6% 3.1% .0% 4.1% 8.5%
Knew I should consider it
but didn't 4.8% 2.3% 3.6% 3.1% 3.1% 2.0% 4.2%
Considered it and was still
deciding 3.8% 4.5% 1.8% .0% 6.3% 2.0% 9.9%
Considered it and decided
to do nothing 2.9% 2.3% .0% 3.1% 1.6% 8.2% 4.2%
Decided what to do and
was planning it 19.2% 13.6% 14.5% 9.4% 10.9% 20.4% 8.5%
Had a firm plan 64.4% 68.2% 70.9% 81.3% 78.1% 59.2% 54.9%
Other 3.8% 6.8% 5.5% .0% .0% 4.1% 9.9%
When respondents’ perceptions of bushfire threat are compared with level of planning (below), it can be seen
that, as would be expected, respondents who perceived a ‘High’ or ‘Very high’ threat to life and property from
bushfires reported having firm plans to reduce their risks from bushfires.
Very low Low High Very high Not considered
Never thought about it 53.8% 38.5% .0% .0% 7.7%
Knew I should consider it but didn't 12.5% 56.3% 18.8% .0% 12.5%
Considered it and was still deciding 26.3% 47.4% 10.5% 10.5% 5.3%
Considered it and decided to do nothing 46.2% 30.8% 23.1% .0% .0%
Decided what to do and was planning it 6.6% 27.9% 42.6% 23.0% .0%
Had a firm plan 2.4% 17.7% 34.4% 45.5% .0%
Other 26.3% 21.1% 47.4% 5.3% .0%

56
56
51BQ27. At the beginning of last summer, which of the following did you think you were MOST LIKELY to do if a bushfire occurred in your town or suburb? Select ONE only.
Stay throughout
fire
Stay and protect but
leave if threatened
Wait and
see fire
Wait for emergency
services
Leave as soon as fire
threatens
No at home on high
fire danger days
Hadn't thought
about it Other Total Missing Total
Count 436 143 75 17 142 11 9 22 855 46 901
Percent 48.4 15.9 8.3 1.9 15.8 1.2 1.0 2.4 94.9 5.1 100
Nearly half of all survey respondents (48%) reported that, at the beginning of summer 2008, they intended to stay and defend their property throughout bushfires. 16% had
planned to leave as soon as they knew a fire was threatening and 1% planning to leave on all days of high fire danger.
It is significant that more than one-quarter of survey respondents (26%) were effectively undecided, planning to stay and defend but leave if threatened by fire (16%), to wait
and see what the fire is like before deciding to stay or leave (8%) or to wait for emergency services (2%).

57
57

58
52BQ28. Given what you intended to do if a bushfire occurred in your town or suburb, had you…
Discussed with all
household
members?
Thought about what
each person would
do?
Considered differences
if certain members were
not home?
Written down
important
things?
Let relatives and
neighbours know what
you would do?
Yes No NA Yes No NA Yes No NA Yes No Yes No
Count 948 151 112 709 236 99 416 483 104 247 718 569 461
Percent 78.3 12.5 9.2 67.9 22.6 9.5 41.5 48.2 10.4 25.6 74.4 55.2 44.8
*NA – Single member household.
The vast majority of respondents (78%) reported discussing their intended response with members of their
household. More than two-thirds (68%) had thought about what each member of the household would do.
It is significant that considerably fewer respondents had considered how things could change if some members of
the household were not at home during a fire (42%) or written down important things to do and remember (26%).
0%
20%
40%
60%
80%
100%
Discussed with all
household
members?
Thought about
what each person
would do?
Considered
differences if
certain members
were not home?
Written down
important things?
Let relatives and
neighbours know
what you would
do?
NA
No
Yes

59
53BQ29. Which of the following had you done to prepare for bushfires? Please indicate whether the action was taken prior to February 7th or on the day of the fire. If you took an action both PRIOR TO and ON FEB 7, please tick both boxes.
384BQ29.1 Cleared leaves, twigs and long grass for a distance of about 20-30m around the house
Prior to
Feb. 7
On
Feb. 7
Action not
taken
Not
applicable
Prior to and
on Feb. 7 Total Missing Total
Count 981 11 162 76 21 1251 63 1314
Percent 74.7 .8 12.3 5.8 1.6 95.2 4.8 100

60
385BQ29.2 Removed bushes close to the house and cut back overhanging tree branches
Prior to
Feb. 7
On
Feb. 7
Action not
taken
Not
applicable
Prior to and
on Feb. 7 Total Missing Total
Count 678 12 37 271 184 1182 132 1314
Percent 51.6 .9 2.8 20.6 14.0 90.0 10.0 100

61
386BQ29.3 Used landscaping or the layout of garden to reduce the fire risk
Prior to
Feb. 7
On
Feb. 7
Action not
taken
Not
applicable
Prior to and
on Feb. 7 Total Missing Total
Count 658 10 18 318 149 1153 161 1314
Percent 50.1 .8 1.4 24.2 11.3 87.7 12.3 100

62
387BQ29.4 Moved combustible materials such as firewood and wooden garden furniture away from the house
Prior to
Feb. 7
On
Feb. 7
Action not
taken
Not
applicable
Prior to and
on Feb. 7 Total Missing Total
Count 532 204 100 268 86 1190 124 1314
Percent 40.5 15.5 7.6 20.4 6.5 90.6 9.4 100

63
388BQ29.5 Cleared gutters of leaves
Prior to
Feb. 7
On
Feb. 7
Action not
taken
Not
applicable
Prior to and
on Feb. 7 Total Missing Total
Count 885 53 153 101 50 1242 72 1314
Percent 67.4 4.0 11.6 7.7 3.8 94.5 5.5 100

64
389BQ29.6 Installed gutter protection
Prior to
Feb. 7
On
Feb. 7
Action not
taken
Not
applicable
Prior to and
on Feb. 7 Total Missing Total
Count 228 31 11 723 80 1073 241 1314
Percent 17.4 2.4 .8 55.0 6.1 81.7 18.3 100

65
390BQ29.7 Covered underfloor spaces to prevent embers and flame entering
Prior to
Feb. 7
On
Feb. 7
Action not
taken
Not
applicable
Prior to and
on Feb. 7 Total Missing Total
Count 173 43 8 524 377 1125 189 1314
Percent 13.2 3.3 .6 39.9 28.7 85.6 14.4 100

66
391BQ29.8 Covered all gaps and vents to reduce the risk of embers entering the house or cavities (e.g. roof, wall, etc.)
Prior to
Feb. 7
On
Feb. 7
Action not
taken
Not
applicable
Prior to and
on Feb. 7 Total Missing Total
Count 217 121 16 657 117 1128 186 1314
Percent 16.5 9.2 1.2 50.0 8.9 85.8 14.2 100

67
392BQ29.9 Obtained and prepared fire fighting equipment (e.g. hoses and a pump)
Prior to
Feb. 7
On
Feb. 7
Action not
taken
Not
applicable
Prior to and
on Feb. 7 Total Missing Total
Count 617 59 112 373 32 1193 121 1314
Percent 47.0 4.5 8.5 28.4 2.4 90.8 9.2 100

68
393BQ29.10 Obtained and prepared equipment such as ladder, buckets and mops to put out spot fires
Prior to
Feb. 7
On
Feb. 7
Action not
taken
Not
applicable
Prior to and
on Feb. 7 Total Missing Total
Count 454 275 151 291 28 1199 115 1314
Percent 34.6 20.9 11.5 22.1 2.1 91.2 8.8 100

69
394BQ29.11 Installed seals and/or draft protectors around windows and doors
Prior to
Feb. 7
On
Feb. 7
Action not
taken
Not
applicable
Prior to and
on Feb. 7 Total Missing Total
Count 309 74 15 666 68 1132 182 1314
Percent 23.5 5.6 1.1 50.7 5.2 86.1 13.9 100

70
395BQ29.12 Installed a sprinkler system on or around the house
Prior to
Feb. 7
On
Feb. 7
Action not
taken
Not
applicable
Prior to and
on Feb. 7 Total Missing Total
Count 283 43 29 736 44 1135 179 1314
Percent 21.5 3.3 2.2 56.0 3.3 86.4 13.6 100

71
396BQ29.13 Installed shutters
Prior to
Feb. 7
On
Feb. 7
Action not
taken
Not
applicable
Prior to and
on Feb. 7 Total Missing Total
Count 32 7 2 963 93 1097 217 1314
Percent 2.4 .5 .2 73.3 7.1 83.5 16.5 100

72
397BQ29.14 Prepared a kit of personal protective clothing for each member of the household
Prior to
Feb. 7
On
Feb. 7
Action not
taken
Not
applicable
Prior to and
on Feb. 7 Total Missing Total
Count 395 184 42 491 37 1149 165 1314
Percent 30.1 14.0 3.2 37.4 2.8 87.4 12.6 100
73
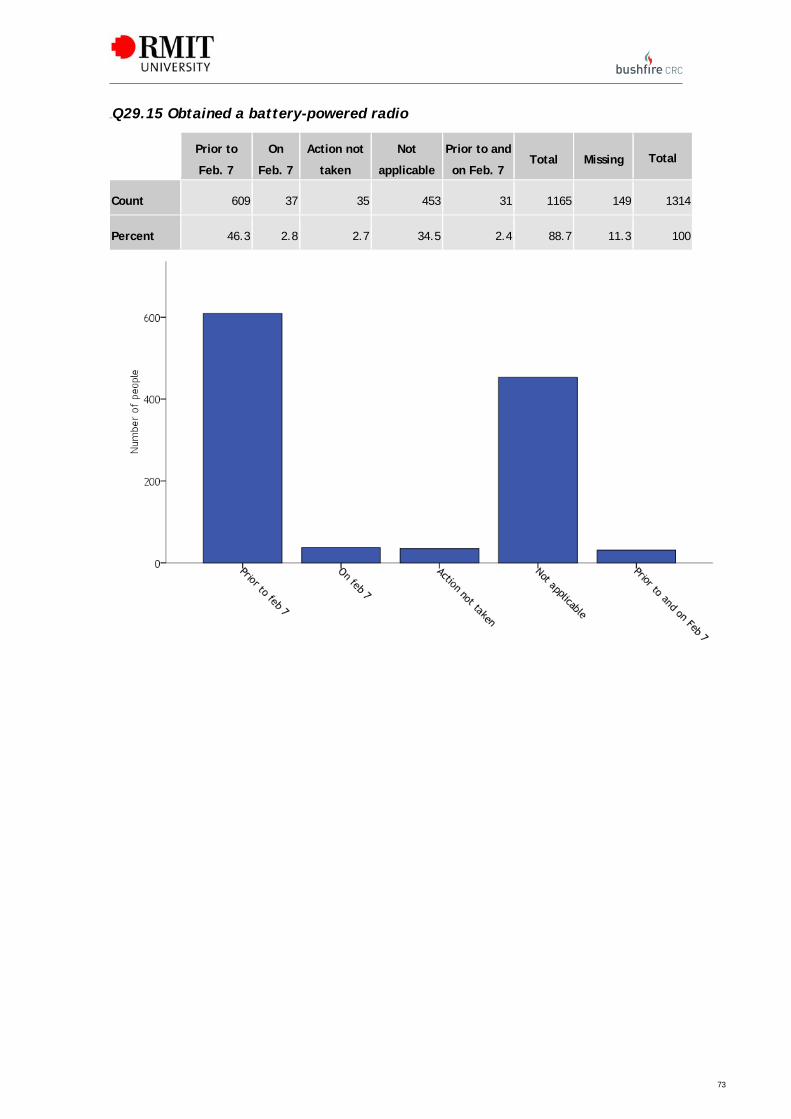
398BQ29.15 Obtained a battery-powered radio
Prior to
Feb. 7
On
Feb. 7
Action not
taken
Not
applicable
Prior to and
on Feb. 7 Total Missing Total
Count 609 37 35 453 31 1165 149 1314
Percent 46.3 2.8 2.7 34.5 2.4 88.7 11.3 100

74
399BQ29.16 Stored important documents and possessions off-site or in a fire safe compartment
Prior to
Feb. 7
On
Feb. 7
Action not
taken
Not
applicable
Prior to and
on Feb. 7 Total Missing Total
Count 308 168 26 640 20 1162 152 1314
Percent 23.4 12.8 2.0 48.7 1.5 88.4 11.6 100

75
54BQ30. How would you rate your preparedness for the February 7th bushfire?
Very high High Average Low Very Low Total Missing Total
Count 193 402 468 144 77 1284 30 1314
Percent 14.7 30.6 35.6 11.0 5.9 97.7 2.3 100
Almost half of all survey respondents (45%) rated their preparedness level as ‘High’ or ‘Very high’, 36% as ‘Average’
and 17% as ‘Low’ or ‘Very low’. It should be noted that many of those who were interviewed for the Taskforce
Research considered themselves to be well-prepared for a ‘normal’ bushfire, but not for fires of the severity
experienced on February 7th.

76
55BQ31. Did you want to be more prepared than you were?
Yes No Total Missing Total
Count 903 348 1251 63 1314
Percent 68.7 26.5 95.2 4.8 100

77
56BQ32. What prevented you from being more prepared?
This was an open ended question, the analysis of which is beyond the scope of this report.
57BQ33. Please use the space below if you would like to add any comments about your experience of preparing for bushfires.
This was an open ended question, the analysis of which is beyond the scope of this report.

78
15BSection 4. During the bushfire
This Section presents basic frequencies and percentages for a series of questions relating to household responses
during the February 7th bushfires.
58BQ34. If known, at what time did the bushfire arrive in your town or suburb? (e.g. ‘4.10pm’ or ‘About 4pm’)
This was an open ended question, the analysis of which is beyond the scope of this report.
59BQ35. What did OTHER members of your household do? You may select more than one.
This question has been filtered to exclude people from one person households. (The tables read as:
count/percentage – number of households; ledged – number of people).
400BQ35.1 Number of people who left my household before the fire arrived in my town or suburb.
Number of people
0 1 2 3 4 5 6+ Total Missing Total
Count 152 153 103 66 34 13 7 528 584 1112
Percent 13.7 13.8 9.3 5.9 3.1 1.2 0.6 47.5 52.5 100

79

80
401BQ35.2 Number of people who left when the fire arrived in my town or suburb
Number of people
0 1 2 3 4 5 6+ Total Missing Total
Count 140 113 83 43 30 14 3 426 686 1112
Percent 12.6 10.2 7.5 3.9 2.7 1.3 0.3 38.3 61.7 100

81
402BQ35.3 Number of people who stayed and actively defended the house and property
Number of people
0 1 2 3 4 5 6+ Total Missing Total
Count 79 170 188 70 43 16 18 584 528 1112
Percent 7.1 15.3 16.9 6.3 3.9 1.4 1.6 52.5 47.5 100

82
03BQ35.4 Number of people who began defending the house and property from the fire but left when they felt the danger was too great
Number of people
0 1 2 3 4 5 6+ Total Missing Total
Count 160 85 52 16 14 4 1 332 780 1112
Percent 14.4 7.6 4.7 1.4 1.3 0.4 0.1 29.9 70.1 100

83
404BQ35.5 Number of people who stayed to actively defend the house or property, but the fire never arrived
Number of people
0 1 2 3 4 5 6+ Total Missing Total
Count 124 13 11 4 2 2 1 157 955 1112
Percent 11.2 1.2 1.0 0.4 0.2 0.2 0.1 14.1 85.9 100

84
405BQ35.6 Number of people who did not actively defend the house and property but stayed throughout the fire and sheltered in the house
Number of people
0 1 2 3 4 5 6+ Total Missing Total
Count 136 33 18 16 4 1 1 209 903 1112
Percent 12.2 3.0 1.6 1.4 0.4 0.1 0.1 18.8 81.2 100
85
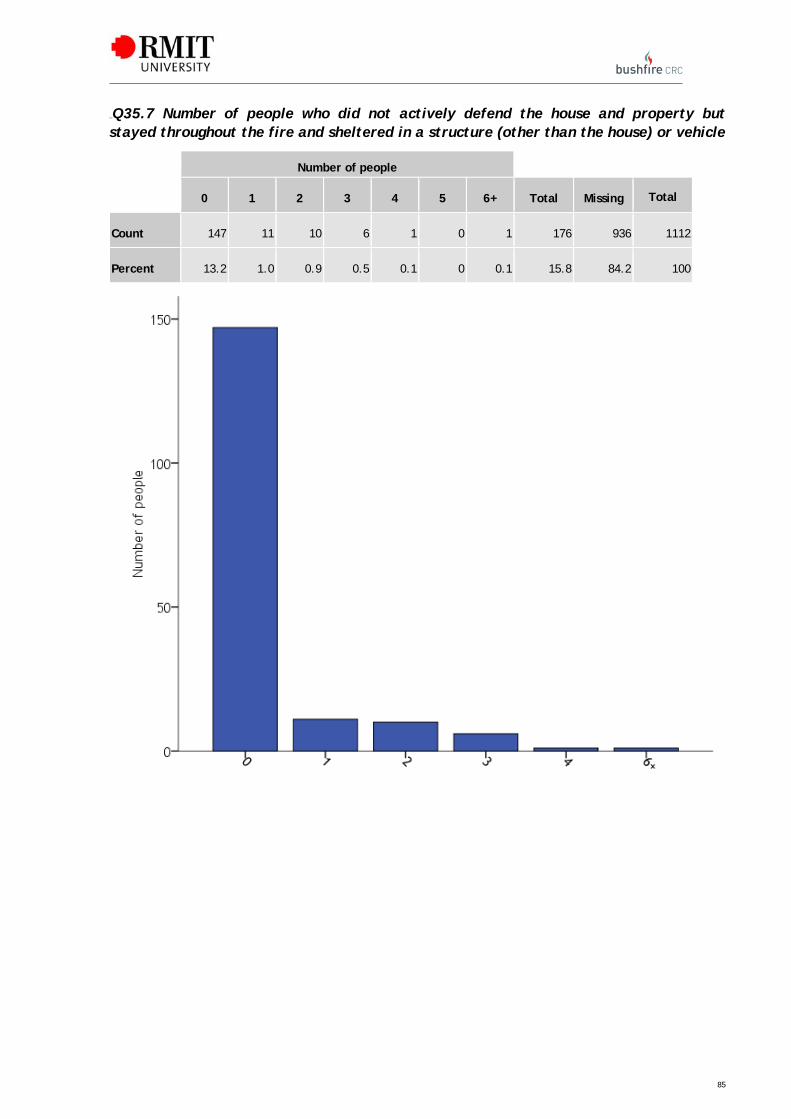
406BQ35.7 Number of people who did not actively defend the house and property but stayed throughout the fire and sheltered in a structure (other than the house) or vehicle
Number of people
0 1 2 3 4 5 6+ Total Missing Total
Count 147 11 10 6 1 0 1 176 936 1112
Percent 13.2 1.0 0.9 0.5 0.1 0 0.1 15.8 84.2 100

86
407BQ35.8 Number of people who did not actively defend the house and property but stayed throughout the fire and took refuge somewhere outside
Number of people
0 1 2 3 4 5 6+ Total Missing Total
Count 144 16 15 2 1 4 2 184 928 1112
Percent 12.9 1.4 1.3 0.2 0.1 0.4 0.2 16.5 83.5 100

87
60BQ36. Were there members of your household who needed looking after during the fire? You may select more than one.
Infants or
children
Elderly
persons
Disabled
persons
Ill
persons
Able bodied persons who
became sick Other
No one
needed care
Count 311 55 27 23 61 79 616
Percent 23.7% 4.2% 2.1% 1.8% 4.6% 6.0% 46.9%

88
88
61BQ37. Which one of the following best describes what YOU did DURING the bushfire? Select ONE only.
Left before the
fire arrived
Left when the
fire arrived
Stayed and
defended
Started to
defend but left
Stayed and defended
but no fire
No defence, but
sheltered in house
No defence, but
sheltered in structure
No defence, but
sheltered outsideTotal Missing Total
Count 270 265 501 128 22 17 12 19 1234 80 1314
Percent 20.5 20.2 38.1 9.7 1.7 1.3 0.9 1.4 93.9 6.1 100
Please note that Q37 directs respondents to one of two sets of questions that more fully explore their responses to the fires. The first set of questions (Q38 – Q50) is intended for
respondents who left their home either before or when the fire arrived in their town or suburb (and did not initiate defence). The second set of question (Q51 – 71) is intended
for respondents who stayed with their home or property for some or all of the fire. The Table for Q37 and the following paragraph provide an overview of respondents’
responses, which are examined in more detail in the corresponding sections.
The majority of survey respondents (50%) reported that they stayed to defend their homes and properties from the bushfires. 10% of these respondents left when they felt the
danger was too great to stay, and 2% did not encounter fire on their properties. 41% of respondents left their homes or properties either before or when the fires arrived in their
town or suburb. A small proportion (4%) reported that they sheltered inside a house, in a structure other than a house, in a vehicle, or somewhere outside.

89

90
90
431BThe following questions refer only to those who left their property (answered a or b at question 37).
62BQ38. On a scale of 1 to 5, where 1 is ‘very early’ and 5 is ‘very late’, when did you leave your home or property?
1 2 3 4 5 Total
Count 109 56 100 149 159 573
Percent 19.0 9.8 17.5 26.0 27.7 100
Just over half (54%) of the respondents who left their homes and properties considered themselves to have been
‘Late' or ‘Very late’ in leaving.
63BQ39. If known, at what time did you leave? (e.g. ‘4.10pm’ or ‘About 4pm’)
This was an open ended question, the analysis of which is beyond the scope of this report.

91
91
64BQ40. To the best of your knowledge, how long before the fire arrived in your town or suburb did you leave?
>8hrs 4-8hrs 2-4hrs 1-2hrs 20-60mins 10-20mins <10mins The fire already arrived Total Missing Total
Count 58 35 64 78 86 45 35 108 509 26 535
Percent 10.8 6.5 12.0 14.6 16.1 8.4 6.5 20.2 95.1 4.9 100
Just over half (51%) of respondents who left their homes and properties did so less than an hour before the fire arrived in their town or suburb. A significant proportion (35%) left
less than 20 minutes before the fire arrived, with 20% leaving when the fire had already arrived.

92
92
65BQ41. Why did you leave your house or property on Saturday February 7th? You may select more than one.
Other
reasons
High fire
danger day
Smelled smoke
near by
Flames
near by
Fire in immediate
vicinity
Emergency
services said to
Friends, relatives,
neighbours said to
Remove other household
members from danger
Too
dangerous
House caught
on fire Other
Count 78 37 164 112 124 47 131 130 254 7 60
Percent 14.6 6.9 30.7 20.9 23.2 8.8 24.5 24.3 47.5 1.3 11.2
Close to one half (46%) of the respondents who left their homes and properties before or when the fires arrived reported that they left because it was too dangerous to stay and
protect their house. In addition to seeing or smelling fire nearby (75%), advice from relative’s friends or neighbours (25%) was a significant factor in motivating people to leave.
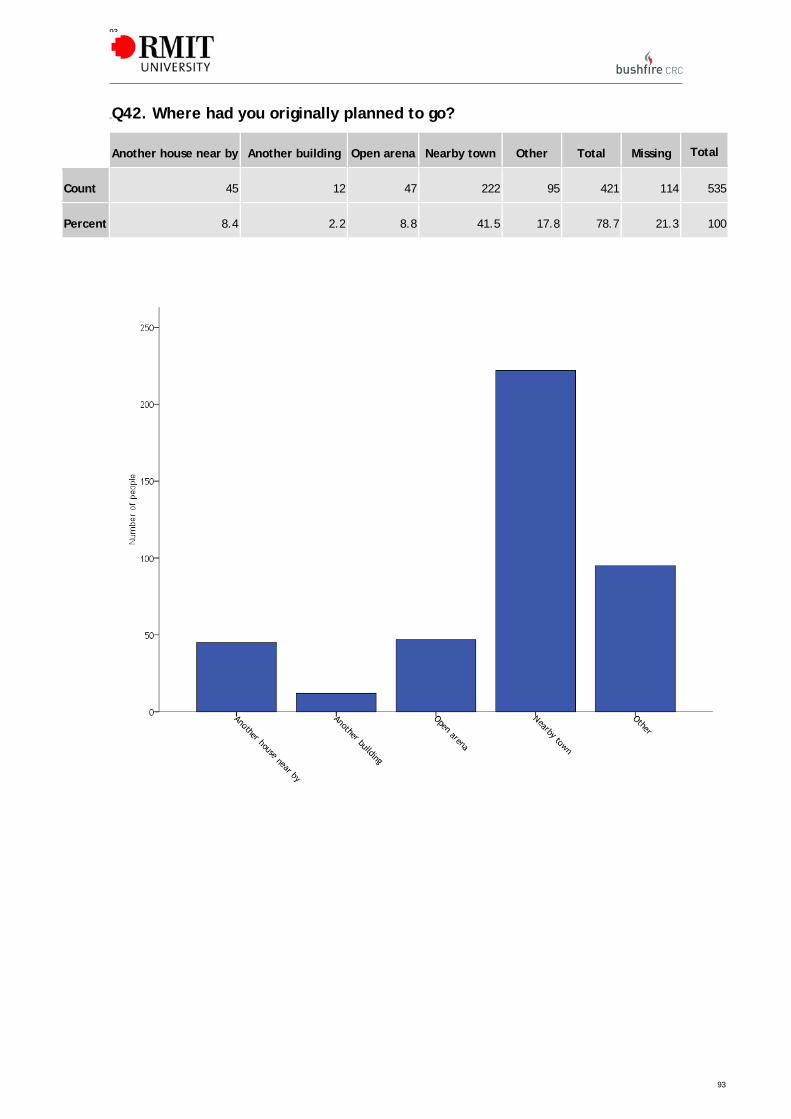
93
93
66BQ42. Where had you originally planned to go?
Another house near by Another building Open arena Nearby town Other Total Missing Total
Count 45 12 47 222 95 421 114 535
Percent 8.4 2.2 8.8 41.5 17.8 78.7 21.3 100

94
67BQ43. When you left, where did you actually go?
Another house near by Another building Open arena Nearby town Other Total Missing Total
Count 45 12 23 238 95 413 122 535
Percent 8.4 2.2 4.3 44.5 17.8 77.2 22.8 100
The roughly even proportions for Q42 and Q43 suggest that most of those who left their homes and properties
made it to their intended destination. In the majority of cases (45%), respondents left their homes for the safety of
a nearby town that was not impacted by bushfires.

95
68BQ44. How did you get there?
In my car Someone else's car Foot Other Total Missing Total
Count 425 17 2 7 451 84 535
Percent 79.4 3.2 .4 1.3 84.3 15.7 100
The vast majority of respondents (79%) travelled to their destination in their own cars.

96
69BQ45. When you left your house or property, did you feel that the danger was…?
Very high High Average Low Very Low Total Missing Total
Count 299 113 47 42 17 518 17 535
Percent 55.9 21.1 8.8 7.9 3.2 96.8 3.2 100
The vast majority of respondents (78%) perceived the level of danger to be ‘High’ or ‘Very high’ when they left
their house or property. This is consistent with the preliminary findings for Q38 and Q40: that many people left
their homes with little or no time before the bushfire arrived.
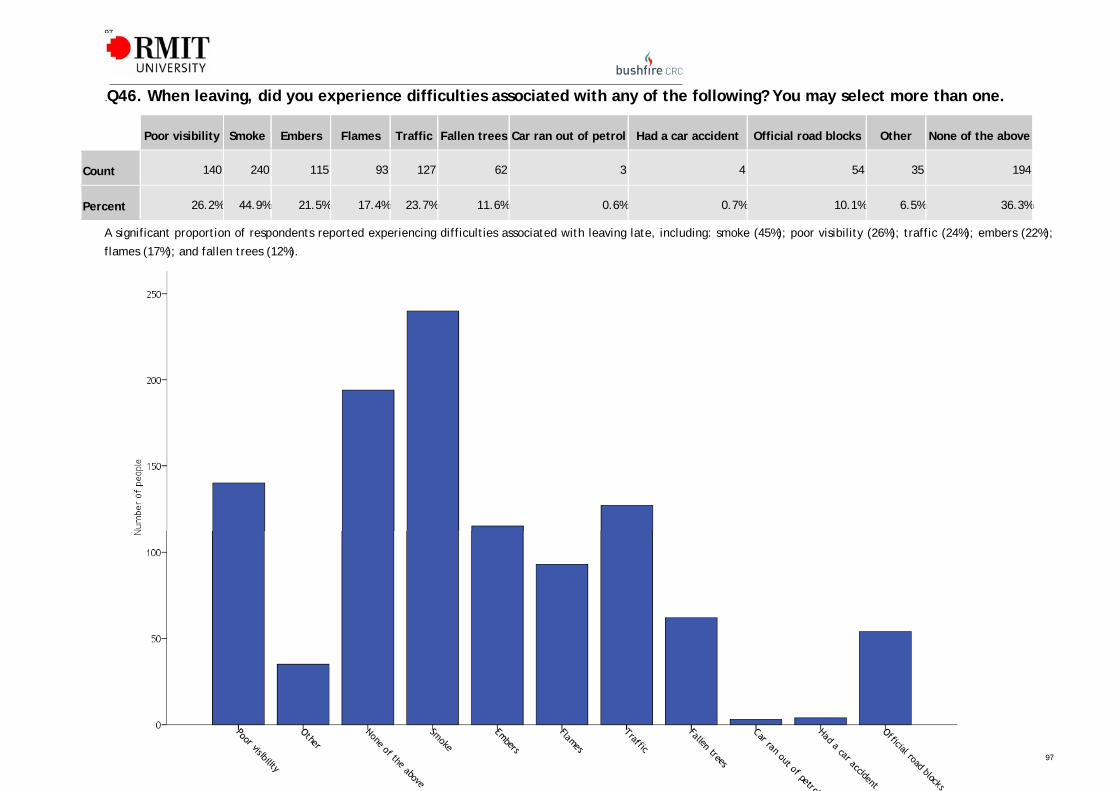
97
97
70BQ46. When leaving, did you experience difficulties associated with any of the following? You may select more than one.
Poor visibility Smoke Embers Flames Traffic Fallen trees Car ran out of petrol Had a car accident Official road blocks Other None of the above
Count 140 240 115 93 127 62 3 4 54 35 194
Percent 26.2% 44.9% 21.5% 17.4% 23.7% 11.6% 0.6% 0.7% 10.1% 6.5% 36.3%
A significant proportion of respondents reported experiencing difficulties associated with leaving late, including: smoke (45%); poor visibility (26%); traffic (24%); embers (22%);
flames (17%); and fallen trees (12%).
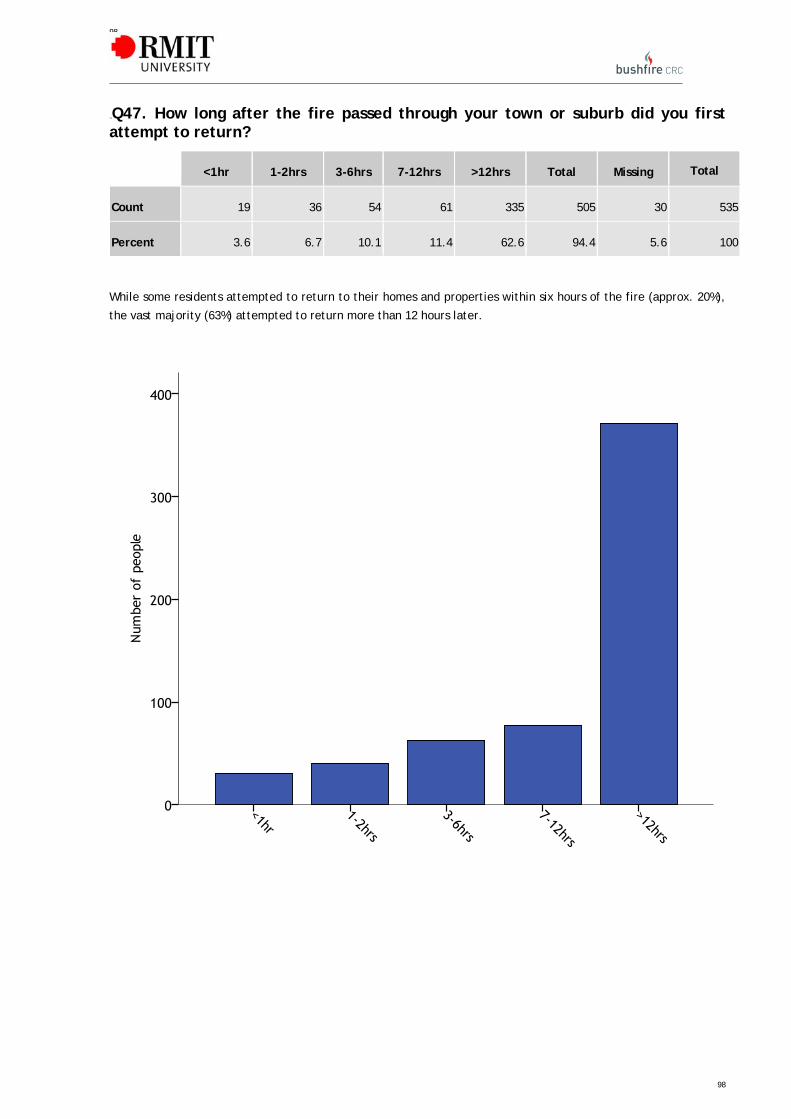
98
98
71BQ47. How long after the fire passed through your town or suburb did you first attempt to return?
<1hr 1-2hrs 3-6hrs 7-12hrs >12hrs Total Missing Total
Count 19 36 54 61 335 505 30 535
Percent 3.6 6.7 10.1 11.4 62.6 94.4 5.6 100
While some residents attempted to return to their homes and properties within six hours of the fire (approx. 20%),
the vast majority (63%) attempted to return more than 12 hours later.
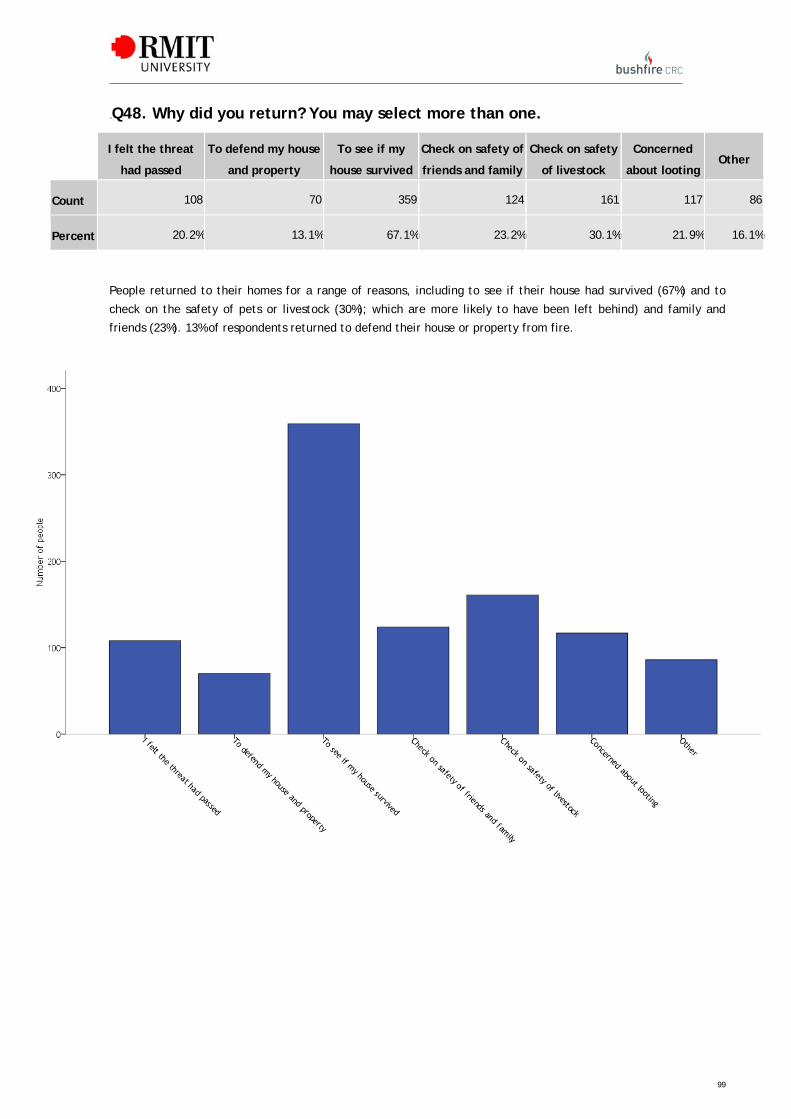
99
72BQ48. Why did you return? You may select more than one.
I felt the threat
had passed
To defend my house
and property
To see if my
house survived
Check on safety of
friends and family
Check on safety
of livestock
Concerned
about lootingOther
Count 108 70 359 124 161 117 86
Percent 20.2% 13.1% 67.1% 23.2% 30.1% 21.9% 16.1%
People returned to their homes for a range of reasons, including to see if their house had survived (67%) and to
check on the safety of pets or livestock (30%); which are more likely to have been left behind) and family and
friends (23%). 13% of respondents returned to defend their house or property from fire.

100
100
73BQ49. When returning, did you experience difficulties associated with any of the following? You may select more than one.
Poor visibility Smoke Embers Flames Traffic Fallen trees Car ran out of petrol Had a car accident Official road blocks Other None of the above
Count 48 160 83 70 53 190 0 10 302 27 91
Percent 9.0% 29.9% 15.5% 13.1% 9.9% 35.5% 0.0% 1.9% 56.4% 5.0% 17.0%
Respondents reported experiencing a range of difficulties when returning to their homes and properties. The most common reported difficulty was official road blocks (56%),
followed by fallen trees (36%) and smoke (30%). The significant proportion of respondents who reported experiencing difficulties associated with embers (16%) and flames (13%)
are likely to be those who returned to their properties within a few hours of the fire.

101
101
74BQ50. If there was another similar fire in your town or suburb would you take the same action in leaving?
Yes No Total Missing Total
Count 385 122 507 28 535
Percent 72.0 22.8 94.8 5.2 100
The majority of respondents who left their homes and properties (72%) declared their intention to leave if there was a similar fire in the future. The remainder (23%) stated that they would not take the same action. Analysis of the qualitative responses will provide insights into the reasons why people would/would not take the same action in future fires.
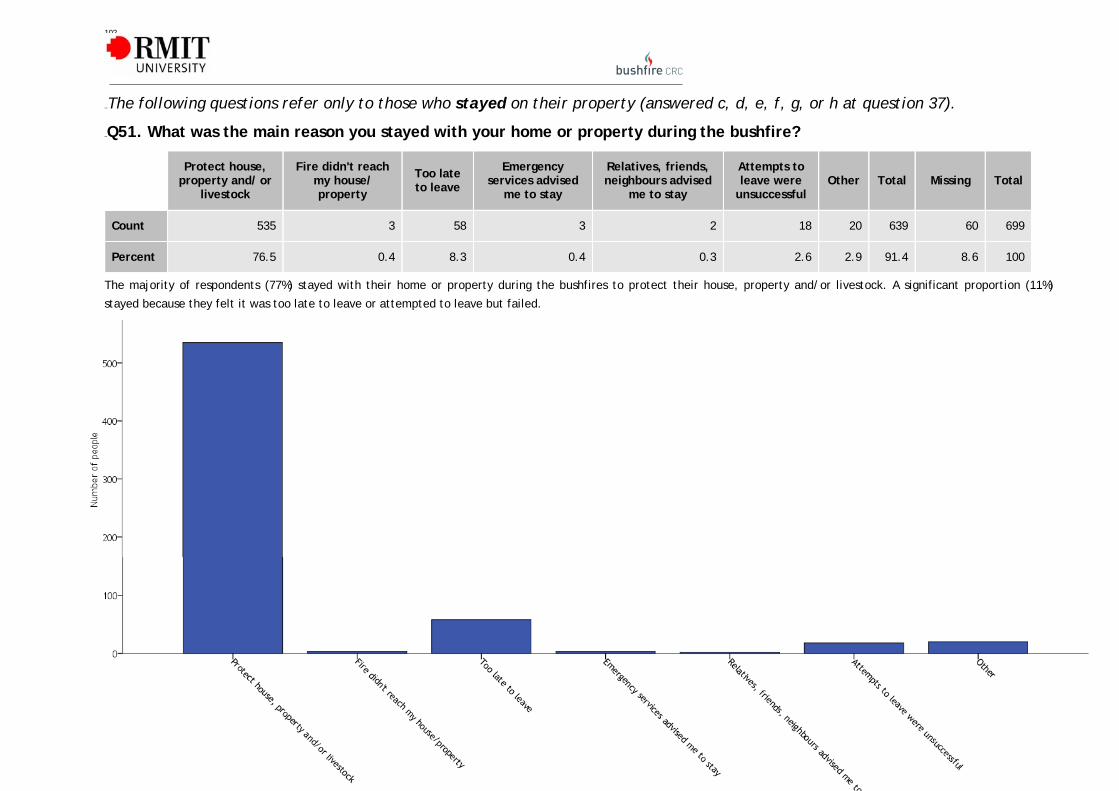
102
102
432BThe following questions refer only to those who stayed on their property (answered c, d, e, f, g, or h at question 37).
75BQ51. What was the main reason you stayed with your home or property during the bushfire?
Protect house,
property and/ or livestock
Fire didn't reach my house/ property
Too late to leave
Emergency services advised
me to stay
Relatives, friends, neighbours advised
me to stay
Attempts to leave were
unsuccessful Other Total Missing Total
Count 535 3 58 3 2 18 20 639 60 699
Percent 76.5 0.4 8.3 0.4 0.3 2.6 2.9 91.4 8.6 100
The majority of respondents (77%) stayed with their home or property during the bushfires to protect their house, property and/or livestock. A significant proportion (11%)
stayed because they felt it was too late to leave or attempted to leave but failed.

103
103
76BQ52. If known, from which direction did the fire approach your house or property? You can use descriptions such as ‘South-west’ or ‘The fire came up through Smith’s Gully’.
This was an open ended question, the analysis of which is beyond the scope of this report.
77BQ53. Did the fire reach your house or property?
Yes No Total Missing Total
Count 631 56 687 12 699
Percent 90.3 8.0 98.3 1.7 100

104
78BQ54. If known, at what approximate time did the fire reach your house or property? (e.g. ‘4.10pm’ or ‘About 4pm’)
This was an open ended question, the analysis of which is beyond the scope of this report.
79BQ55. How long did it take for the fire to pass over your property?
This was an open ended question, the analysis of which is beyond the scope of this report.

105
Q56. How safe did you feel while staying at your house?
Very safe Safe Neither safe or
unsafe Unsafe Very unsafe Total Missing Total
Count 48 158 250 86 116 658 41 699
Percent 6.9 22.6 35.8 12.3 16.6 94.1 5.9 100
Perceptions of personal safety were evenly distributed for those who stayed with their homes and properties during
the bushfire, with 30% feeling ‘Safe’ or ‘Very safe’, 36% feeling ‘Neither safe nor unsafe’, and 29% feeling ‘Unsafe’
or ‘Very unsafe’.
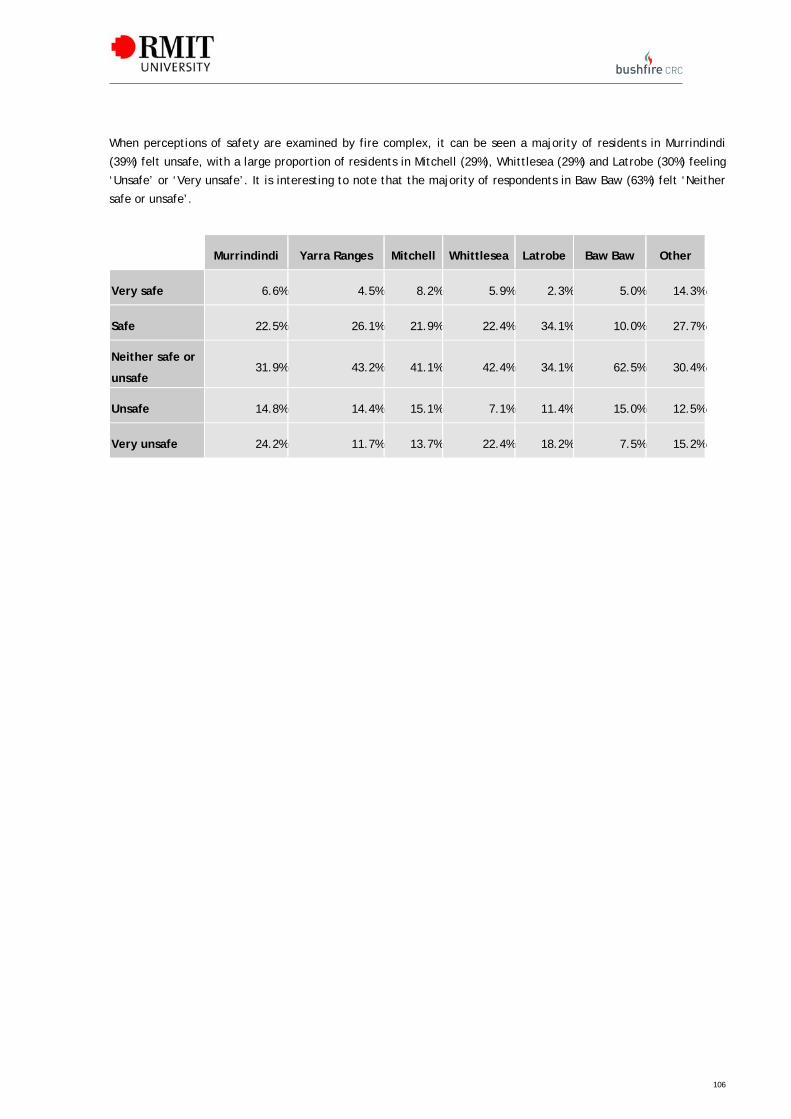
106
When perceptions of safety are examined by fire complex, it can be seen a majority of residents in Murrindindi
(39%) felt unsafe, with a large proportion of residents in Mitchell (29%), Whittlesea (29%) and Latrobe (30%) feeling
‘Unsafe’ or ‘Very unsafe’. It is interesting to note that the majority of respondents in Baw Baw (63%) felt ‘Neither
safe or unsafe’.
Murrindindi Yarra Ranges Mitchell Whittlesea Latrobe Baw Baw Other
Very safe 6.6% 4.5% 8.2% 5.9% 2.3% 5.0% 14.3%
Safe 22.5% 26.1% 21.9% 22.4% 34.1% 10.0% 27.7%
Neither safe or
unsafe 31.9% 43.2% 41.1% 42.4% 34.1% 62.5% 30.4%
Unsafe 14.8% 14.4% 15.1% 7.1% 11.4% 15.0% 12.5%
Very unsafe 24.2% 11.7% 13.7% 22.4% 18.2% 7.5% 15.2%

107
81BQ57. As the fire approached your property on February 7th, how confident were you that you…
On the whole, respondents were confident that they could do what was required to protect themselves and others
(74%) and their homes and properties (64%), but not confident that they would get help from other people (69%) or
fire and emergency services (76%).
408BQ57.1 Could do what was required to protect yourself and others?
Very confident Confident Not very confident Not confident at all Total Missing Total
Count 168 352 92 41 653 46 699
Percent 24.0 50.4 13.2 5.9 93.4 6.6 100

108
409BQ57.2 Could do what was required to protect your house and property?
Very confident Confident Not very confident Not confident at all Total Missing Total
Count 115 332 129 64 640 59 699
Percent 16.5 47.5 18.5 9.2 91.6 8.4 100

109
410BQ57.3 Would get help from other people? (e.g. neighbours, friends)
Very confident Confident Not very confident Not confident at all Total Missing Total
Count 40 100 120 361 621 78 699
Percent 5.7 14.3 17.2 51.6 88.8 11.2 100

110
411BQ57.4 Would get help from fire or emergency services?
Very confident Confident Not very confident Not confident at all Total Missing Total
Count 24 71 112 422 629 70 699
Percent 3.4 10.2 16.0 60.4 90.0 10.0 100

111
82BQ58. Did you receive help from any of the following sources when staying with your house? You may select more than one.
Other household
members
Family friends or
neighbours Emergency services Other None of the above
Count 337 307 82 47 154
Percent 48.2 43.9 11.7 6.7 22.0
As is to be expected in such large and extensive bushfires, significantly more respondents reported receiving help
from other household members (48%) and family, friends or neighbours (44%) than fire or emergency services
(12%). Almost one-quarter of respondents (22%) reported receiving no help at all when staying with their house.

112
83BQ59. Did you experience any difficulties while staying with your home or property? (e.g. lost electricity, suffered smoke inhalation)
This was an open ended question, the analysis of which is beyond the scope of this report.
84BQ60. Did you leave your property at any stage during the fire?
Yes No Total Missing Total
Count 234 445 679 20 699
Percent 33.5 63.7 97.1 2.9 100
One-third (34%) of respondents who stayed with their house and property during the bushfire reported leaving at some stage during the fire.
[Questions 61 through 69 include only the 277 respondents who selected ‘Yes’ in Question 60 to indicate that they left their property during the fire]

113
113
433BThe following questions only include those who stayed on their property (answered c, d, e, f, g, or h at question 37) and ‘yes’ at question 60
85BQ61. Why did you leave your house or property? You may select more than one.
Smelled smoke
near by
Flames
near by
Fire in immediate
vicinity
To get things
to defend
Emergency
services said to
Friends, relatives,
neighbours said to
Too
dangerous
Sustained
an injury
Remove household
members from danger
Fire fighting
equipment failed
House caught
on fire Other
Count 45 78 91 14 20 43 121 10 71 73 49 81
Percent 13.7% 26.0% 31.0% 4.3% 6.5% 14.1% 41.5% 3.6% 23.8% 25.6% 16.6% 26.0%
The most commonly cited reason for leaving a house or property during the bushfire was that it was too dangerous to stay and defend (42%). Other commonly cited reasons were
that there were flames in the immediate vicinity of the property (31%) or nearby (26%) and to remove other household members of visitors from danger (24%).
Almost one-quarter of these respondents reported leaving because utilities or equipment failed (26%) and/or because their house caught fire (17%).

114
114

115
115
86BQ62. Please use the box below if you would like to add comments about why you left your property.
This was an open ended question, the analysis of which is beyond the scope of this report.
87BQ63. Where was the fire when you left your house or property?
On my property <100m 100-500m >500m Other Total Missing Total
Count 114 52 29 22 22 239 38 277
Percent 41.2 18.8 10.5 7.9 7.9 86.3 13.7 100
Given that these respondents attempted to stay but had to leave for the reasons discussed above (Q61), it is not
surprising that many had fire within 500m of their house or property (70%), including 41% with fire already on their
property.

116
88BQ64. When you left, where did you go?
Another house
near by
Another
building
Open
arena
Nearby
town Other Total Missing Total
Count 76 11 25 57 53 222 55 277
Percent 27.4 4.0 9.0 20.6 19.1 80.1 19.9 100
Many of those who left their house or property after attempting to stay travelled to a nearby house (27%) or town
(21%). As a significant proportion of respondents selected ‘Other’ (19%), it is expected that analysis of the
qualitative will shed more light on where these respondents went.

117
89BQ65. How safe did you feel when travelling to your chosen location?
Very safe Safe Neither safe
or unsafe Unsafe Very unsafe Total Missing Total
Count 22 41 69 50 75 257 20 277
Percent 7.9 14.8 24.9 18.1 27.1 92.8 7.2 100
Almost half (45%) of respondents who left their house or property after attempting to stay did not feel safe travelling to the new location. This can be attributed to the close proximity of the fire for most of these people (see Q63), which is likely to have restricted their options for relocating.

118
118
90BQ66. When leaving, did you experience difficulties associated with any of the following? You may select more than one.
Poor
visibility Smoke Embers Flames Traffic Fallen trees
Car ran out
of petrol
Had a car
accident
Official road
blocks Other
None of the
above
Count 145 190 152 147 58 96 2 5 34 24 25
Percent 52.3% 68.6% 54.9% 53.1% 20.9% 34.7% 0.7% 1.8% 12.3% 8.7% 9.0%
A significant proportion of respondents who left their house or property after attempting to stay experienced a range of difficulties when leaving, including: smoke (69%); embers
(55%); flames (53%); poor visibility (52%); and fallen trees (35%).

119
119
91BQ67. When did you return to your property?
Before the
fire
During the
fire 1-2hrs 3-6hrs 7-12hrs >12hrs Other Total Missing Total
Count 12 9 35 36 29 52 56 229 48 277
Percent 4.3 3.2 12.6 13.0 10.5 18.8 20.2 82.7 17.3 100
20% were able to return before or within a couple of hours of the fire passing.

120
120
92BQ68. Why did you return? You may select more than one.
I felt the threat
had passed
To defend my house
and property
To see if my house
survived
Check on safety of friends
and family
Check on safety of
livestock
Concerned
about looting Other
Count 57 87 119 34 78 49 42
Percent 20.6% 31.4% 43.0% 12.3% 28.2% 17.7% 15.2%
As was the case for those who left before or when the bushfire arrived (Q48), the main reason respondents (who had originally attempted to stay) returned was to see if their house had survived (43%). A significantly greater proportion of these residents (31% compared to 13%) returned to defend their house and property, presumably because many relocated to a house or somewhere else nearby (Q64) and were able to return soon after the fire has passed (Q67).

121
93BQ69. When returning, did you experience difficulties associated with any of the following? You may select more than one.
Poor visibility Smoke Embers Flames Traffic Fallen
trees
Car ran out of
petrol
Had a car
accident
Official road
blocks Other None of the above
Count 67 138 84 85 20 114 1 0 81 34 67
Percent 24.2% 49.8% 30.3% 30.7% 7.2% 41.2% 0.4% 0.0% 29.2% 12.3% 24.2%
These respondents reported experiencing a range of difficulties when returning to their homes and properties, including: smoke (50%); fallen trees (41%); embers (30%); flames
(31%); and official roadblocks (29%).

122
122
434BThe following question only includes those who answered c, d, e, f, g, or h at question 37
94BQ70. If there was another similar fire in your town or suburb, would you take the same action in staying to protect your home and property?
Yes No Total Missing Total
Count 508 139 647 52 699
Percent 72.7 19.9 92.6 7.4 100
The majority of respondents who stayed with their homes and properties (73%) declared their intention to
stay and protect their home and property if there was a similar fire in the future. The remainder (20%)
stated that they would not take the same action. Analysis of the qualitative responses will provide insights
into the reasons why people would/would not take the same action in future fires.

123
95B71. Please use the space below if you would like to add any comments about your experience of staying with your home or property during the bushfire.
This was an open ended question, the analysis of which is beyond the scope of this report.

124
16BSection 5. Information about you and your household
96BQ72. Are you male or female?
Male Female Total Missing Total
Count 574 642 1216 98 1314
Percent 43.7 48.9 92.5 7.5 100

125
97BQ73. Which of the following age groups do you belong to?
18-24 25-34 35-44 45-54 55-64 65-74 75+ Total Missing Total
Count 10 86 276 335 327 159 49 1242 72 1314
Percent 0.8 6.5 21.0 25.5 24.9 12.1 3.7 94.5 5.5 100

126
98BQ74. On February 7th, what type of property did you have?
House or
unit
Hobby farm
and house
Large farm
and house
Land and
no house Other Total Missing Total
Count 298 713 205 10 28 1254 60 1314
Percent 22.7 54.3 15.6 0.8 2.1 95.4 4.6 100
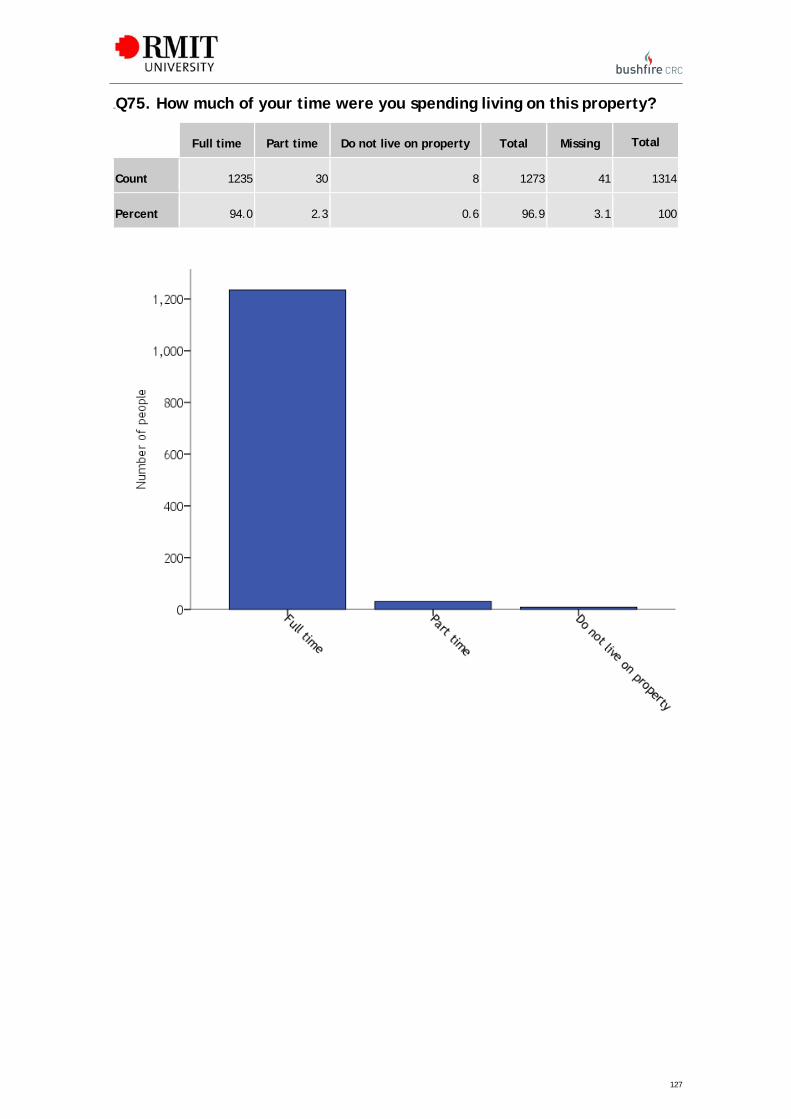
127
99BQ75. How much of your time were you spending living on this property?
Full time Part time Do not live on property Total Missing Total
Count 1235 30 8 1273 41 1314
Percent 94.0 2.3 0.6 96.9 3.1 100

128
100BQ76. How long had you had this property? (Note that the category 20+ should read >20.)
0-5 6-10 11-20 >20 Total Missing Total
Count 344 269 309 351 1273 41 1314
Percent 26.2 20.5 23.5 26.7 96.9 3.1 100

129
101BQ77. How long had you been living in this town or suburb? (Note that the category 20+ should read >20.)
0-5 6-10 11-20 >20 Total Missing Total
Count 290 244 309 425 1268 46 1314
Percent 22.1 18.6 23.5 32.3 96.5 3.5 100

130
102BQ78. Did you own your property or were you renting?
Owned or buying Renting Other Total Missing Total
Count 1190 56 25 1271 43 1314
Percent 90.6 4.3 1.9 96.7 3.3 100

131
103BQ79. What kind of insurance did you have on February 7th 2009? You may select more than one.
House and
contents House only Contents only Outbuildings Farm insurance None
Count 1101 54 49 321 236 58
Percent 83.8 4.1 3.7 24.4 18.0 4.4

132
104BQ80. What is the composition of your household?
Couple with
dependents
One adult and
dependents
Couple no
dependents
One
person
Share with
other adults Other Total Missing Total
Count 454 53 455 156 95 55 1268 46 1314
Percent 34.6 4.0 34.6 11.9 7.2 4.2 96.5 3.5 100

133
105BQ81. In the boxes below, please indicate how many children or dependents in each age category live in your household.
Age Category
0-5 6-11 12-18 65+
Num
ber
of
dep
endan
ts
1 64.0% (110) 68.3% (125) 55.3% (157) 59.3% (35)
2 34.9% (60) 27.3% (50) 33.1% (94) 37.3% (22)
3 0.6% (1) 4.4% (8) 8.8% (25) 0.0% (0)
4 0.6% (1) 0.0% (0) 2.1% (6) 3.4% (2)
5 0.0% (0) 0.0% (0) 0.4% (1) 0.0% (0)
6 0.0% (0) 0.0% (0) 0.4% (1) 0.0% (0)
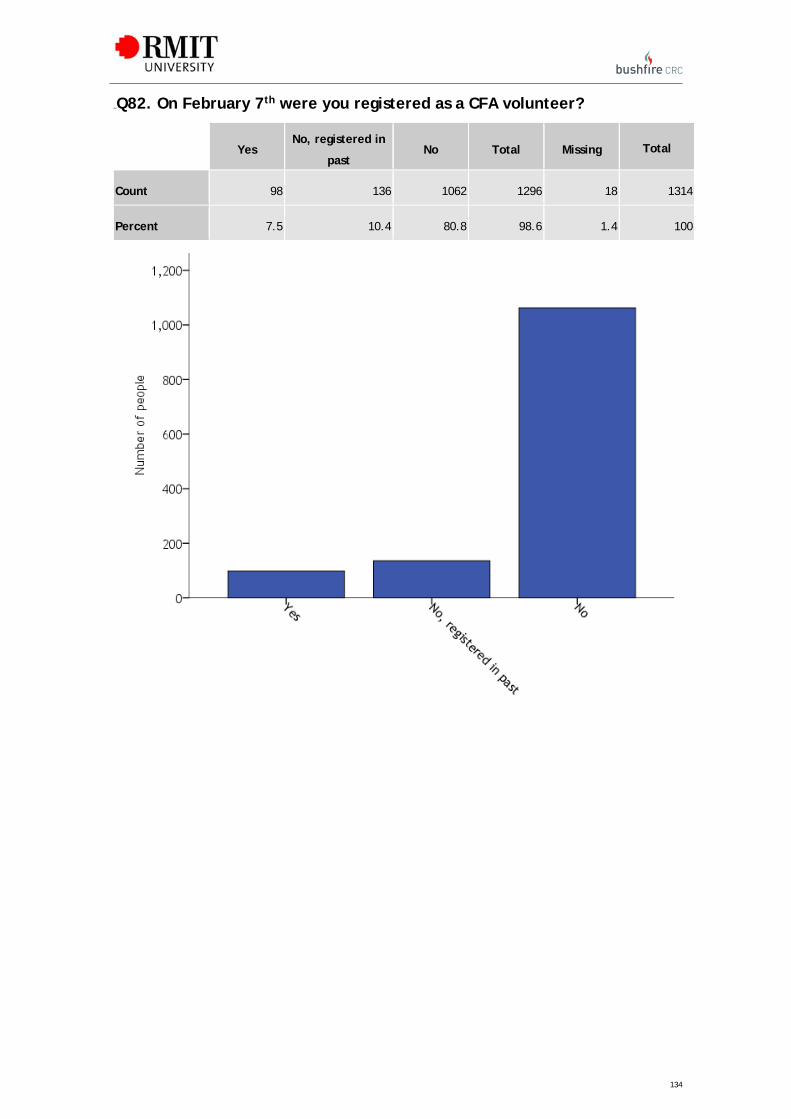
134
106BQ82. On February 7th were you registered as a CFA volunteer?
Yes No, registered in
past No Total Missing Total
Count 98 136 1062 1296 18 1314
Percent 7.5 10.4 80.8 98.6 1.4 100

135
107BQ83. On February 7th were you a member of a CFA community fire guard group?
Yes No, registered in
past No Total Missing Total
Count 198 88 995 1281 33 1314
Percent 15.1 6.7 75.7 97.5 2.5 100

136
5Bchi-square tests of association To assist in ascertaining any relationship between categorical (count) variables, a chi-square test of association is typically conducted. This test provides useful insight into the potential for associated variables; and if so associated, where this contribution to association is the greatest.
In order to assist in reading the information in the following tables, an example is shown below. The row labels (in green) refer to the possible responses to the item (in this case) Q4 Was your house damaged or destroyed in the bushfire? The column labels (in blue) refer to the possible responses to the item (in this case) Q7.1 The actions I took before February 7th (To what extent do you think the following factors influenced how the fire affected your home and/or property?). This test assesses whether there is an association between the two variables, and uses a comparison of what was observed against what we would expect if there was no association.
To begin, consider the Count. This is the number of people who responded to both categories. In the case
highlighted in brown and bold below, there were 95 people whose House had no/minor damage and
believed that the actions they took before February 7th did not contribute at all.
The Expected (in light blue and italics) count represents the amount we should expect if there was no
association between the two variables, that is, if the variables are independent or unrelated to each
other. It is calculated using the following Expected = (row total x column total) / grand total, where the
row total in our example is in orange, the column total is in light green and grand total is in purple double
underlined.
The statistics reported in the top left hand corner (in pink) is the chi-square value (2) and its associated
p-value (p). The chi-square value is large when there is an association between the variables and tends
towards zero when there is not. If there is as a large difference between what is counted and what is
expected, this reveals a potential link between categories. When the p-value is reported at less than 0.05,
we conclude that there is an association between the two variables.
Numbers highlighted in red underlined throughout the tables indicate where there is a large difference
between the count and the expected count and the standardised residual is greater than 1; this is useful is
ascertaining where greatest variation exists.
The p-value (significance value) represents where there is a significant association between the two
variables. A significant association represented by p < 0.05 is found when there is one or more categories
with a standardised residual of 1 or more. The more categories of this nature the greater the association.
2 = 374.779 p < 0.001 Not at all To some
extent
To a moderate
extent
To a great
extent
Don't
know/Unsure Total
House had
no/minor
damage
Count 95 131 142 416 4 788
Expected 220.2 126.2 117.0 305.6 19.1
House had major
damage or was
destroyed
Count 240 61 36 49 25 411
Expected 114.8 65.8 61.0 159.4 9.9

137
Total Count 335 192 178 465 29 1199
It is important to note that the chi-square test of association is a cross-sectional test which aids in determining possible relationships between variables. Great care must be taken in the interpretation of this data, and it is best viewed as an indicator of potential associations rather than proof of causal associations.

REPORT NO. A.000.000
138
7BSection 1: How the bushfires affected your property
Q1. What is the postcode of your bushfire affected property?
Q1 by Q4 Was your house damaged or destroyed in the bushfire?
An association is apparent between local government areas (LGA) and the extent to which a home was
damaged. An overrepresentation of homes with major damage or that were destroyed was found in the
Murrinidindi, Whittlesea and Latrobe areas. Yarra Ranges and Baw Baw shires had far fewer homes with
major damage or that were destroyed than was expected. However, in all LGA’s there were far more homes
with none or minor damage.
2 = 35.152 p < 0.001 House had
no/minor damage
House had major damage
or was destroyed Total
Murrindindi
Count 235 168 403
Expected 260.2 142.8
Yarra Ranges
Count 147 48 195
Expected 125.9 69.1
Mitchell
Count 107 62 169
Expected 109.1 59.9
Whittlesea
Count 84 57 141
Expected 91.0 50.0
Latrobe
Count 58 46 104
Expected 67.1 36.9
Baw Baw
Count 54 10 64
Expected 41.3 22.7
Other
Count 133 58 191
Expected 123.3 67.7
Total Count 818 449 1267
*Q1. Other includes Alpine, Benella, East Gippsland, Gannawarra, Greater Bendigo, Greater Dandenong,
Horsham, Loddon, Moorabool, Nillumbik, St Arnaud, Towong and Wellington

REPORT NO. A.000.000
139
Q1 by Q6 Was the house damaged by wind at any time during the bushfire?
There was no association between the amount of damage caused to a home by wind and LGA.
2 = 27.696 p = 0.067 Before the fire With the fire After the fire No Total
Murrindindi
Count 8 25 2 117 152
Expected 4.1 22.7 1.7 123.5
Yarra Ranges
Count 0 4 1 77 82
Expected 2.2 12.2 .9 66.6
Mitchell
Count 2 8 1 53 64
Expected 1.7 9.5 .7 52.0
Whittlesea
Count 0 16 0 51 67
Expected 1.8 10.0 .8 54.4
Latrobe
Count 3 13 0 47 63
Expected 1.7 9.4 .7 51.2
Baw Baw
Count 0 3 0 22 25
Expected .7 3.7 .3 20.3
Other
Count 1 9 2 58 70
Expected 1.9 10.4 .8 56.9
Total Count 14 78 6 425 523
*Q1. Other includes Alpine, Benella, East Gippsland, Gannawarra, Greater Bendigo, Greater Dandenong,
Horsham, Loddon, Moorabool, Nillumbik, St Arnaud, Towong and Wellington

REPORT NO. A.000.000
140
Q1 by Q7.1 The actions I took before February 7th (To what extent do you think the
following factors influenced how the fire affected your home and/or property?)
There was no statistically significant association found between the extent to which actions on the day
contributed to the outcome of a home and LGA. However, residents from Yarra Ranges, Whittlesea and Baw
Baw believed that their actions before February 7 influenced the outcome of their home to a great extent,
having an overrepresentation in this category despite it not being significant. Individuals from Murrindindi
were more likely to believe that their actions did not contribute to the outcome of their home.
2 = 34.120 p = 0.083 Not at all
To some
extent
To a moderate
extent
To a great
extent
Don't
know/Unsure Total
Murrindindi
Count 128 58 55 123 9 373
Expected 103.1 60.8 55.5 144.5 9.1
Yarra
Ranges
Count 40 34 32 82 3 191
Expected 52.8 31.1 28.4 74.0 4.7
Mitchell
Count 45 31 23 52 6 157
Expected 43.4 25.6 23.4 60.8 3.8
Whittlesea
Count 27 23 23 58 5 136
Expected 37.6 22.2 20.2 52.7 3.3
Latrobe
Count 31 16 10 39 2 98
Expected 27.1 16.0 14.6 38.0 2.4
Baw Baw
Count 12 6 11 32 2 63
Expected 17.4 10.3 9.4 24.4 1.5
Other
Count 46 26 23 75 2 172
Expected 47.6 28.0 25.6 66.6 4.2
Total Count 329 194 177 461 29 1190
* Q1. Other includes Alpine, Benella, East Gippsland, Gannawarra, Greater Bendigo, Greater Dandenong,
Horsham, Loddon, Moorabool, Nillumbik, St Arnaud, Towong and Wellington

REPORT NO. A.000.000
141
Q1 by Q7.2 My actions on the day (To what extent do you think the following factors
influenced how the fire affected your home and/or property?)
Residents from Murrindindi had an overrepresentation in the 'not at all' category, the only one for this
question. They were more likely than residents of other LGA's to believe their actions on the day made no
contribution to the outcome of their home. In comparison residents from Mitchell, Whittlesea and Baw Baw
stated that their actions on the day contributed to a great extent to the outcome of their homes. Baw Baw
exceeded the expected number in their community by 30%.
2 = 69.461 p < 0.001 Not at all
To some
extent
To a moderate
extent
To a great
extent
Don't
know/Unsure Total
Murrindindi
Count 164 40 28 126 11 369
Expected 132.0 38.5 29.4 160.1 9.1
Yarra
Ranges
Count 68 15 22 85 3 193
Expected 69.0 20.1 15.4 83.7 4.7
Mitchell
Count 59 12 4 73 5 153
Expected 54.7 15.9 12.2 66.4 3.8
Whittlesea
Count 42 12 7 65 7 133
Expected 47.6 13.9 10.6 57.7 3.3
Latrobe
Count 38 11 7 41 1 98
Expected 35.0 10.2 7.8 42.5 2.4
Baw Baw
Count 6 8 9 39 0 62
Expected 22.2 6.5 4.9 26.9 1.5
Other
Count 45 25 17 83 2 172
Expected 61.5 17.9 13.7 74.6 4.2
Total Count 422 123 94 512 29 1180
* Q1. Other includes Alpine, Benella, East Gippsland, Gannawarra, Greater Bendigo, Greater Dandenong,
Horsham, Loddon, Moorabool, Nillumbik, St Arnaud, Towong and Wellington

REPORT NO. A.000.000
142
Q1 by Q7.3 The help of family, friends or neighbours on the day (To what extent
do you think the following factors influenced how the fire affected your home and/or property?)
From this cross-tab we can identify that there is a significant association between LGA and help of family,
friends and neighbours on the day. Residents from Murrindindi and Yarra Ranges were far less likely to state
that the help of family, friends or neighbours influenced the outcome of their home than residents from
Whittlesea and Latrobe.
2 = 49.334 p = 0.002 Not at all
To some
extent
To a moderate
extent
To a great
extent
Don't
know/Unsure Total
Murrindindi
Count 205 33 31 87 7 363
Expected 177.1 39.7 28.5 109.8 7.8
Yarra
Ranges
Count 105 23 13 45 2 188
Expected 91.7 20.6 14.7 56.9 4.1
Mitchell
Count 72 22 10 47 5 156
Expected 76.1 17.1 12.2 47.2 3.4
Whittlesea
Count 61 10 10 44 5 130
Expected 63.4 14.2 10.2 39.3 2.8
Latrobe
Count 40 13 4 36 3 96
Expected 46.8 10.5 7.5 29.0 2.1
Baw Baw
Count 21 8 9 22 0 60
Expected 29.3 6.6 4.7 18.2 1.3
Other
Count 62 18 14 70 3 167
Expected 81.5 18.3 13.1 50.5 3.6
Total Count 566 127 91 351 25 1160
* Q1. Other includes Alpine, Benella, East Gippsland, Gannawarra, Greater Bendigo, Greater Dandenong,
Horsham, Loddon, Moorabool, Nillumbik, St Arnaud, Towong and Wellington

REPORT NO. A.000.000
143
Q1 by Q7.4 The construction of my home (To what extent do you think the following
factors influenced how the fire affected your home and/or property?)
Though the results of this cross-tab reveal no association between LGA and home construction, some
categories still show a large over/under representation. Home construction was not considered a
contributing factor of home outcome for respondents from the Murrindindi or Mitchell areas, with the count
higher than the expected in the ‘not at all’ category. This was not the case in Latrobe where an
overrepresentation was found in the 'to a great extent' category.
2 = 33.454 p = 0.095 Not at all
To some
extent
To a moderate
extent
To a great
extent
Don't
know/Unsure Total
Murrindindi
Count 149 60 58 78 22 367
Expected 132.8 62.9 62.6 89.3 19.4
Yarra
Ranges
Count 64 34 37 48 4 187
Expected 67.7 32.1 31.9 45.5 9.9
Mitchell
Count 63 25 24 24 10 146
Expected 52.8 25.0 24.9 35.5 7.7
Whittlesea
Count 40 26 22 34 10 132
Expected 47.8 22.6 22.5 32.1 7.0
Latrobe
Count 25 16 18 31 6 96
Expected 34.7 16.5 16.4 23.4 5.1
Baw Baw
Count 21 9 16 15 1 62
Expected 22.4 10.6 10.6 15.1 3.3
Other
Count 56 28 22 51 8 165
Expected 59.7 28.3 28.1 40.1 8.7
Total Count 418 198 197 281 61 1155
* Q1. Other includes Alpine, Benella, East Gippsland, Gannawarra, Greater Bendigo, Greater Dandenong,
Horsham, Loddon, Moorabool, Nillumbik, St Arnaud, Towong and Wellington

REPORT NO. A.000.000
144
Q1 by Q7.5 The position of my home (To what extent do you think the following factors
influenced how the fire affected your home and/or property?)
A strong association between LGA and home position was found in this cross-tab. Home position was
considered not a significant factor to the outcome of homes in the Murrindindi area (where an
overrepresentation of nearly 20% was found). This opinion was reversed for people of the Yarra Ranges and
Latrobe areas, where it was believed that home position contributed to the level of damage to their home
'to a great extent'.
2 = 47.061 p = 0.003 Not at all
To some
extent
To a moderate
extent
To a great
extent
Don't
know/Unsure Total
Murrindindi
Count 99 63 68 129 19 378
Expected 80.2 71.9 69.6 140.9 15.4
Yarra
Ranges
Count 30 27 44 86 3 190
Expected 40.3 36.1 35.0 70.8 7.7
Mitchell
Count 34 37 27 41 11 150
Expected 31.8 28.5 27.6 55.9 6.1
Whittlesea
Count 29 21 23 52 7 132
Expected 28.0 25.1 24.3 49.2 5.4
Latrobe
Count 15 19 17 43 3 97
Expected 20.6 18.4 17.9 36.1 4.0
Baw Baw
Count 10 15 15 23 0 63
Expected 13.4 12.0 11.6 23.5 2.6
Other
Count 33 42 23 65 5 168
Expected 35.7 31.9 30.9 62.6 6.8
Total Count 250 224 217 439 48 1178
* Q1. Other includes Alpine, Benella, East Gippsland, Gannawarra, Greater Bendigo, Greater Dandenong,
Horsham, Loddon, Moorabool, Nillumbik, St Arnaud, Towong and Wellington

REPORT NO. A.000.000
145
Q1 by Q7.6 Fire agencies fire fighting activities (To what extent do you think the
following factors influenced how the fire affected your home and/or property?)
A very strong association in opinion was apparent between LGA and fire agencies fire fighting activities.
Three of the six LGAs in this test were more likely to state that the activities of fire agencies did not
contribute to the outcome of their home. This is the only significant factor (for all of question 7) in which
Whittlesea shows an overrepresentation – the residents clearly indicate not at all. Mitchell respondents
were the only LGA to indicate that fire agencies activities had an impact on the outcome of their homes,
though the majority of respondents still stated ‘not at all’.
2 = 102.828 p < 0.001 Not at all
To some
extent
To a moderate
extent
To a great
extent
Don't
know/Unsure Total
Murrindindi
Count 291 13 7 29 20 360
Expected 259.6 22.8 16.3 45.4 16.0
Yarra Ranges
Count 141 10 5 23 6 185
Expected 133.4 11.7 8.4 23.3 8.2
Mitchell
Count 95 13 9 30 5 152
Expected 109.6 9.6 6.9 19.1 6.7
Whittlesea
Count 104 7 4 9 7 131
Expected 94.5 8.3 5.9 16.5 5.8
Latrobe
Count 71 4 1 11 9 96
Expected 69.2 6.1 4.3 12.1 4.3
Baw Baw
Count 33 6 9 12 0 60
Expected 43.3 3.8 2.7 7.6 2.7
Other
Count 95 20 17 31 4 167
Expected 120.4 10.6 7.5 21.0 7.4
Total Count 830 73 52 145 51 1151
* Q1. Other includes Alpine, Benella, East Gippsland, Gannawarra, Greater Bendigo, Greater Dandenong,
Horsham, Loddon, Moorabool, Nillumbik, St Arnaud, Towong and Wellington

REPORT NO. A.000.000
146
Q1 by Q7.7 Fire agencies fuel reduction activities (To what extent do you think the
following factors influenced how the fire affected your home and/or property?)
There was no association found between the influence fire agencies fuel reduction activities on property
and respondents LGA's. In every LGA over 75% of respondents stated that fuel reduction activities did not
contribute to the outcome of their home.
2 = 27.215 p = 0.295 Not at all
To some
extent
To a moderate
extent
To a great
extent
Don't
know/Unsure Total
Murrindindi
Count 274 24 9 33 21 361
Expected 284.1 20.1 9.7 28.9 18.2
Yarra
Ranges
Count 153 5 9 13 8 188
Expected 147.9 10.5 5.1 15.0 9.5
Mitchell
Count 115 8 2 8 12 145
Expected 114.1 8.1 3.9 11.6 7.3
Whittlesea
Count 104 6 3 13 4 130
Expected 102.3 7.2 3.5 10.4 6.6
Latrobe
Count 81 3 4 6 5 99
Expected 77.9 5.5 2.7 7.9 5.0
Baw Baw
Count 53 3 0 3 1 60
Expected 47.2 3.3 1.6 4.8 3.0
Other
Count 125 15 4 16 7 167
Expected 131.4 9.3 4.5 13.4 8.4
Total Count 905 64 31 92 58 1150
* Q1. Other includes Alpine, Benella, East Gippsland, Gannawarra, Greater Bendigo, Greater Dandenong,
Horsham, Loddon, Moorabool, Nillumbik, St Arnaud, Towong and Wellington

REPORT NO. A.000.000
147
Q1 by Q7.8 Fuel (e.g. trees, bushes, leaves on ground etc) (To what extent do you
think the following factors influenced how the fire affected your home and/or property?)
Fuel was seen as an influence to a great extent on damage to homes for residents of Yarra Ranges and
Whittlesea. Murrindindi residents responded that this factor had no influence (not at all) on their home in
greater numbers than expected: This contributes to the significant association found between the affect of
fuel on the home outcome and LGA.
2 = 38.813 p = 0.029 Not at all
To some
extent
To a moderate
extent
To a great
extent
Don't
know/Unsure Total
Murrindindi
Count 101 74 61 120 14 370
Expected 76.5 84.8 65.0 135.1 8.6
Yarra
Ranges
Count 25 40 40 79 4 188
Expected 38.9 43.1 33.0 68.7 4.4
Mitchell
Count 35 33 22 56 3 149
Expected 30.8 34.1 26.2 54.4 3.5
Whittlesea
Count 21 28 23 57 2 131
Expected 27.1 30.0 23.0 47.8 3.0
Latrobe
Count 14 27 17 36 1 95
Expected 19.6 21.8 16.7 34.7 2.2
Baw Baw
Count 15 14 12 19 0 60
Expected 12.4 13.7 10.5 21.9 1.4
Other
Count 29 50 29 57 3 168
Expected 34.7 38.5 29.5 61.4 3.9
Total Count 240 266 204 424 27 1161
* Q1. Other includes Alpine, Benella, East Gippsland, Gannawarra, Greater Bendigo, Greater Dandenong,
Horsham, Loddon, Moorabool, Nillumbik, St Arnaud, Towong and Wellington
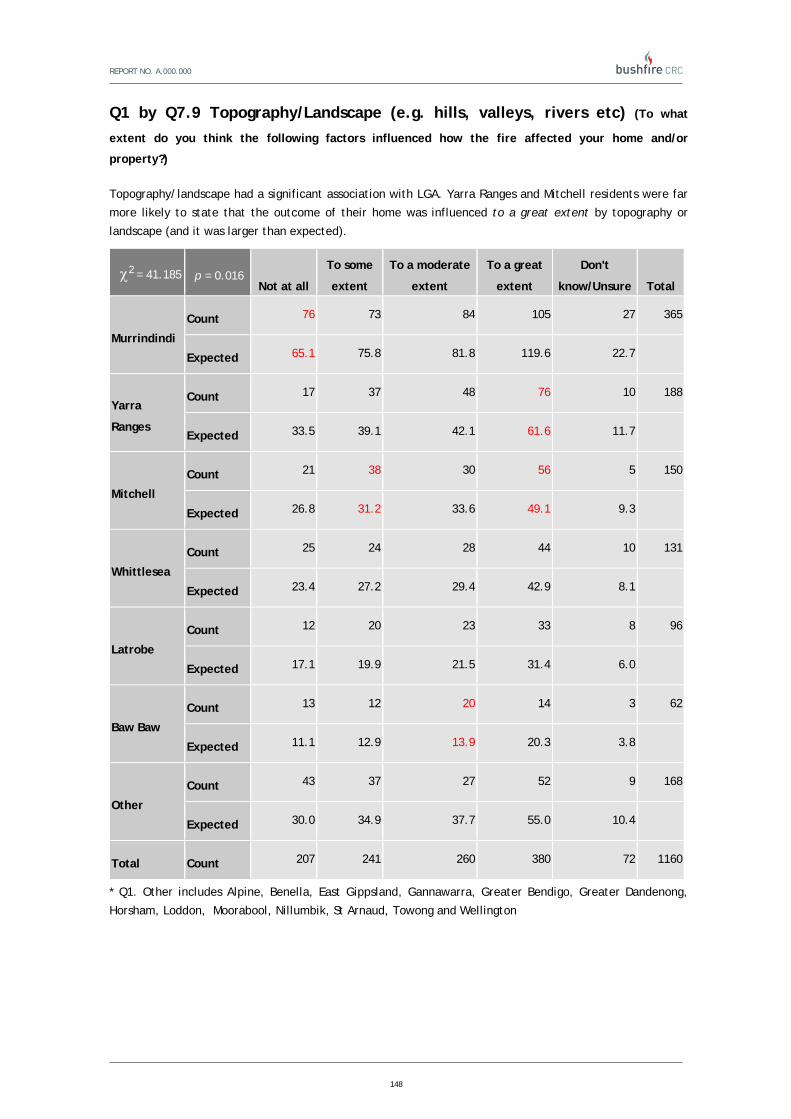
REPORT NO. A.000.000
148
Q1 by Q7.9 Topography/Landscape (e.g. hills, valleys, rivers etc) (To what
extent do you think the following factors influenced how the fire affected your home and/or
property?)
Topography/landscape had a significant association with LGA. Yarra Ranges and Mitchell residents were far
more likely to state that the outcome of their home was influenced to a great extent by topography or
landscape (and it was larger than expected).
2 = 41.185 p = 0.016 Not at all
To some
extent
To a moderate
extent
To a great
extent
Don't
know/Unsure Total
Murrindindi
Count 76 73 84 105 27 365
Expected 65.1 75.8 81.8 119.6 22.7
Yarra
Ranges
Count 17 37 48 76 10 188
Expected 33.5 39.1 42.1 61.6 11.7
Mitchell
Count 21 38 30 56 5 150
Expected 26.8 31.2 33.6 49.1 9.3
Whittlesea
Count 25 24 28 44 10 131
Expected 23.4 27.2 29.4 42.9 8.1
Latrobe
Count 12 20 23 33 8 96
Expected 17.1 19.9 21.5 31.4 6.0
Baw Baw
Count 13 12 20 14 3 62
Expected 11.1 12.9 13.9 20.3 3.8
Other
Count 43 37 27 52 9 168
Expected 30.0 34.9 37.7 55.0 10.4
Total Count 207 241 260 380 72 1160
* Q1. Other includes Alpine, Benella, East Gippsland, Gannawarra, Greater Bendigo, Greater Dandenong,
Horsham, Loddon, Moorabool, Nillumbik, St Arnaud, Towong and Wellington

REPORT NO. A.000.000
149
Q1 by Q7.10 Temperature (To what extent do you think the following factors influenced how
the fire affected your home and/or property?)
There was no association between the LGA a respondent lives in and the temperature on February 7th.
Residents of all LGAs overwhelmingly stated that temperature contributed to a great extent with over 70%
selecting this option.
2 = 29.652 p = 0.197 Not at all
To some
extent
To a moderate
extent
To a great
extent
Don't
know/Unsure Total
Murrindindi
Count 33 17 25 272 20 367
Expected 26.3 13.8 25.1 286.7 15.1
Yarra
Ranges
Count 16 6 14 144 8 188
Expected 13.5 7.1 12.9 146.9 7.7
Mitchell
Count 9 5 11 122 3 150
Expected 10.8 5.6 10.3 117.2 6.2
Whittlesea
Count 13 4 9 100 6 132
Expected 9.5 5.0 9.0 103.1 5.4
Latrobe
Count 1 2 8 79 8 98
Expected 7.0 3.7 6.7 76.6 4.0
Baw Baw
Count 1 3 2 53 1 60
Expected 4.3 2.3 4.1 46.9 2.5
Other
Count 11 7 11 144 2 175
Expected 12.6 6.6 12.0 136.7 7.2
Total Count 84 44 80 914 48 1170
* Q1. Other includes Alpine, Benella, East Gippsland, Gannawarra, Greater Bendigo, Greater Dandenong,
Horsham, Loddon, Moorabool, Nillumbik, St Arnaud, Towong and Wellington

REPORT NO. A.000.000
150
Q1 by Q7.11 Wind (To what extent do you think the following factors influenced how the fire
affected your home and/or property?)
There was no association between LGA and the wind on February 7th. Nearly 80% of all respondents from
each LGA stated that wind affected their homes ‘to a great extent’, thereby exhibiting no independency
between categories.
2 = 29.092 p = 0.217 Not at all
To some
extent
To a moderate
extent
To a great
extent
Don't
know/Unsure Total
Murrindindi
Count 21 18 20 297 16 372
Expected 15.7 15.4 22.0 305.7 13.2
Yarra
Ranges
Count 5 8 13 157 6 189
Expected 8.0 7.8 11.2 155.3 6.7
Mitchell
Count 4 6 9 129 5 153
Expected 6.5 6.3 9.1 125.7 5.4
Whittlesea
Count 10 7 8 103 5 133
Expected 5.6 5.5 7.9 109.3 4.7
Latrobe
Count 2 1 9 79 8 99
Expected 4.2 4.1 5.9 81.3 3.5
Baw Baw
Count 1 2 4 51 1 59
Expected 2.5 2.4 3.5 48.5 2.1
Other
Count 7 7 7 156 1 178
Expected 7.5 7.4 10.5 146.3 6.3
Total Count 50 49 70 972 42 1183
* Q1. Other includes Alpine, Benella, East Gippsland, Gannawarra, Greater Bendigo, Greater Dandenong,
Horsham, Loddon, Moorabool, Nillumbik, St Arnaud, Towong and Wellington

REPORT NO. A.000.000
151
Q1 by Q7.12 Luck or chance (To what extent do you think the following factors influenced
how the fire affected your home and/or property?)
There was no association between respondents LGA and luck or chance on February 7th. Notably most
respondents believed luck or chance was of greatest influence (to a great extent) in all LGAs.
2 = 34.646 p = 0.077 Not at all
To some
extent
To a moderate
extent
To a great
extent
Don't
know/Unsure Total
Murrindindi
Count 67 64 44 153 28 356
Expected 60.2 71.4 46.1 157.1 21.2
Yarra
Ranges
Count 26 46 25 83 3 183
Expected 30.9 36.7 23.7 80.8 10.9
Mitchell
Count 22 26 24 69 13 154
Expected 26.0 30.9 20.0 68.0 9.2
Whittlesea
Count 28 21 13 58 6 126
Expected 21.3 25.3 16.3 55.6 7.5
Latrobe
Count 19 25 12 34 7 97
Expected 16.4 19.5 12.6 42.8 5.8
Baw Baw
Count 5 13 13 28 1 60
Expected 10.1 12.0 7.8 26.5 3.6
Other
Count 26 34 17 79 10 166
Expected 28.1 33.3 21.5 73.3 9.9
Total Count 193 229 148 504 68 1142
* Q1. Other includes Alpine, Benella, East Gippsland, Gannawarra, Greater Bendigo, Greater Dandenong,
Horsham, Loddon, Moorabool, Nillumbik, St Arnaud, Towong and Wellington

REPORT NO. A.000.000
152
Q1 by Q24. Before the February 7th bushfire, how likely did you think it was that a bushfire could occur in your town or suburb?
Most people in the fire affected areas thought that it was likely a bushfire would occur in their area.
Despite this there was an overrepresentation of people in the Baw Baw shire who believed it was unlikely a
fire would occur in their area.
2 = 57.353 p < 0.001 Unlikely Likely Total
Murrindindi
Count 86 311 397
Expected 85.8 311.2
Yarra Ranges
Count 34 163 197
Expected 42.6 154.4
Mitchell
Count 26 140 166
Expected 35.9 130.1
Whittlesea
Count 17 123 140
Expected 30.2 109.8
Latrobe
Count 13 89 102
Expected 22.0 80.0
Baw Baw
Count 25 35 60
Expected 13.0 47.0
Other
Count 69 119 188
Expected 40.6 147.4
Total Count 270 980 1250

REPORT NO. A.000.000
153
Q1 by Q42 Where had you originally planned to go?
A strong association between LGA and where residents had originally planned to go is evident. We can see
that while on the whole individuals mostly planned to go to a nearby town, there was an overrepresentation
of people from Murrindindi who would go to an open arena. In Latrobe there were nearly no residents who
would go somewhere other than a nearby town.
2 = 45.152 p < 0.001 Another house
near by
Another
building Open arena Nearby town Total
Murrindindi
Count 14 4 31 92 141
Expected 20.5 4.3 21.2 95.0
Yarra Ranges
Count 9 2 10 38 59
Expected 8.6 1.8 8.9 39.7
Mitchell
Count 9 4 9 50 72
Expected 10.5 2.2 10.8 48.5
Whittlesea
Count 3 0 6 26 35
Expected 5.1 1.1 5.3 23.6
Latrobe
Count 4 1 4 44 53
Expected 7.7 1.6 8.0 35.7
Baw Baw
Count 4 0 1 13 18
Expected 2.6 .5 2.7 12.1
Other
Count 19 2 3 24 48
Expected 7.0 1.5 7.2 32.3
Total Count 62 13 64 287 426
* Q1. Other includes Alpine, Benella, East Gippsland, Gannawarra, Greater Bendigo, Greater Dandenong,
Horsham, Loddon, Moorabool, Nillumbik, St Arnaud, Towong and Wellington

REPORT NO. A.000.000
154
Q1 by Q42 Where did you actually go?
A strong association between LGA and where residents actually went is evident. We can see that while on
the whole individuals mostly went to a nearby town, there was an overrepresentation of people from Yarra
Ranges who went to an open arena or another building.
2 = 61.355 p < 0.001 Another house
near by
Another
building Open arena Nearby town Total
Murrindindi
Count 11 6 16 112 145
Expected 20.0 6.2 11.7 107.0
Yarra Ranges
Count 11 6 10 29 56
Expected 7.7 2.4 4.5 41.3
Mitchell
Count 7 2 3 58 70
Expected 9.7 3.0 5.7 51.7
Whittlesea
Count 5 2 1 29 37
Expected 5.1 1.6 3.0 27.3
Latrobe
Count 5 0 1 46 52
Expected 7.2 2.2 4.2 38.4
Baw Baw
Count 2 0 0 15 17
Expected 2.3 .7 1.4 12.5
Other
Count 17 2 3 21 43
Expected 5.9 1.8 3.5 31.7
Total Count 58 18 34 310 420
* Q1. Other includes Alpine, Benella, East Gippsland, Gannawarra, Greater Bendigo, Greater Dandenong,
Horsham, Loddon, Moorabool, Nillumbik, St Arnaud, Towong and Wellington

REPORT NO. A.000.000
155
Q1 by Q47 How long after the fire passed through your town or suburb did you first attempt to return? The highest proportions of people from all LGAs did not attempt to return to their properties until at least
12 hours after the fire had passed through the area. Still, there was a significant association between LGA
and the length of time that passed before residents attempted to return home. This can be seen in the
Yarra Ranges, Whittlesea and in Baw Baw where, even though slight, there were overrepresentations of
people who returned earlier (less than 2 hours) to their properties.
2 = 77.751 p < 0.001 <1hr 1-2hrs 3-6hrs 7-12hrs >12hrs Total
Murrindindi
Count 10 6 8 19 145 188
Expected 10.0 13.3 20.0 25.3 119.5
Yarra
Ranges
Count 8 3 9 10 49 79
Expected 4.2 5.6 8.4 10.6 50.2
Mitchell
Count 2 6 9 16 62 95
Expected 5.0 6.7 10.1 12.8 60.4
Whittlesea
Count 2 7 3 7 34 53
Expected 2.8 3.8 5.6 7.1 33.7
Latrobe
Count 1 5 7 12 35 60
Expected 3.2 4.2 6.4 8.1 38.1
Baw Baw
Count 3 3 4 4 9 23
Expected 1.2 1.6 2.4 3.1 14.6
Other
Count 4 10 20 8 25 67
Expected 3.6 4.7 7.1 9.0 42.6
Total Count 30 40 60 76 359 565
* Q1. Other includes Alpine, Benella, East Gippsland, Gannawarra, Greater Bendigo, Greater Dandenong,
Horsham, Loddon, Moorabool, Nillumbik, St Arnaud, Towong and Wellington

REPORT NO. A.000.000
156
Q1 by Q50 If there was another similar fire in your town or suburb would you take the same action in leaving?
There was no association between LGA and whether a respondent would take the same action in leaving.
Interestingly, there were more people than expected in the Yarra Ranges who would change their plans if a
similar fire were to occur. Comparatively, nearly no one in the Baw Baw shire would change their actions.
2 = 5.346 p = 0.5 Yes No Total
Murrindindi
Count 128 42 170
Expected 128.8 41.2 170.0
Yarra Ranges
Count 46 22 68
Expected 51.5 16.5 68.0
Mitchell
Count 61 19 80
Expected 60.6 19.4 80.0
Whittlesea
Count 33 9 42
Expected 31.8 10.2 42.0
Latrobe
Count 44 10 54
Expected 40.9 13.1 54.0
Baw Baw
Count 16 2 18
Expected 13.6 4.4 18.0
Other
Count 47 16 63
Expected 47.7 15.3 63.0
Total Count 375 120 495
* Q1. Other includes Alpine, Benella, East Gippsland, Gannawarra, Greater Bendigo, Greater Dandenong,
Horsham, Loddon, Moorabool, Nillumbik, St Arnaud, Towong and Wellington

REPORT NO. A.000.000
157
Q1 by Q73 Which of the following age groups do you belong to?
There was no significant association between these variables.
2 = 40.382 p = 0.283 18-24 25-34 35-44 45-54 55-64 65-74 75+ Total
Murrindindi Count 4 30 91 94 99 56 17 391
Expected 3.2 27.3 87.6 105.9 104.0 48.8 14.1
Yarra Ranges
Count 1 10 48 57 45 18 4 183
Expected 1.5 12.8 41.0 49.6 48.7 22.8 6.6
Mitchell Count 1 11 29 46 55 17 4 163
Expected 1.3 11.4 36.5 44.2 43.4 20.3 5.9
Whittlesea Count 1 10 37 45 29 10 2 134
Expected 1.1 9.4 30.0 36.3 35.6 16.7 4.8
Latrobe Count 1 8 22 28 27 9 6 101
Expected .8 7.0 22.6 27.4 26.9 12.6 3.6
Baw Baw Count 1 4 13 20 16 8 1 63
Expected .5 4.4 14.1 17.1 16.8 7.9 2.3
Other Count 1 12 33 40 53 34 10 183
Expected 1.5 12.8 41.0 49.6 48.7 22.8 6.6
Total Count 10 85 273 330 324 152 44 1218

REPORT NO. A.000.000
158
Q1 by Q77. How long had you been living in this town or suburb?
Murrindindi had an overrepresentation of residents who had lived in the area for less than 10 years. In all
other areas there were more people who had lived in the area for greater than 10 years. These two
associations contributed to an overall significant statistical association between LGA and length of residency
in their respective LGA.
2 = 46.98 p < 0.001 0-5 6-10 11-20 >20 Total
Murrindindi
Count 102 99 98 96 395
Expected 91.0 76.3 96.0 131.7 395.0
Yarra Ranges
Count 52 34 43 64 193
Expected 44.4 37.3 46.9 64.3 193.0
Mitchell
Count 37 36 41 53 167
Expected 38.5 32.3 40.6 55.7 167.0
Whittlesea
Count 29 19 34 54 136
Expected 31.3 26.3 33.1 45.3 136.0
Latrobe
Count 23 17 30 34 104
Expected 23.9 20.1 25.3 34.7 104.0
Baw Baw
Count 15 10 12 25 62
Expected 14.3 12.0 15.1 20.7 62.0
Other
Count 28 25 44 88 185
Expected 42.6 35.7 45.0 61.7 185.0
Total Count 286 240 302 414 1242
* Q1. Other includes Alpine, Benella, East Gippsland, Gannawarra, Greater Bendigo, Greater Dandenong,
Horsham, Loddon, Moorabool, Nillumbik, St Arnaud, Towong and Wellington

REPORT NO. A.000.000
159
Q1 by Q79. What kind of insurance did you have on February 7th 2009? You may select more than one. (Multiple Response)
An overrepresentation of residents from the Murrindindi area only had contents insurance. The Mitchell area
had the most individuals without insurance; this was an overrepresentation. Baw Baw had a far greater
number than expected of people with farm insurance. The majority of people had house and contents
insurance. The lowest number of responses in each area corresponded to no insurance.
2 = 92.815 p < 0.001 House and
contents House only
Contents only Outbuildings
Farm insurance None Total
Murrindindi Count 343 18 22 83 46 15 527
Expected 319.6 15.7 14.2 92.9 68.0 16.6
Yarra Ranges
Count 170 11 3 57 43 5 289
Expected 175.3 8.6 7.8 50.9 37.3 9.1
Mitchell Count 141 3 5 40 29 16 234
Expected 141.9 7.0 6.3 41.2 30.2 7.4
Whittlesea Count 121 5 6 26 28 5 191
Expected 115.8 5.7 5.2 33.7 24.6 6.0
Latrobe Count 95 4 2 24 12 1 138
Expected 83.7 4.1 3.7 24.3 17.8 4.4
Baw Baw Count 49 3 3 19 23 5 102
Expected 61.9 3.0 2.8 18.0 13.2 3.2
Other Count 158 9 7 64 48 9 295
Expected 178.9 8.8 8.0 52.0 38.0 9.3
Total Count 1077 53 48 313 229 56 1776
* Q1. Other includes Alpine, Benella, East Gippsland, Gannawarra, Greater Bendigo, Greater Dandenong,
Horsham, Loddon, Moorabool, Nillumbik, St Arnaud, Towong and Wellington

REPORT NO. A.000.000
160
Q1 by Q82. On February 7th were you registered as a CFA volunteer?
A significant association was found between LGA and registration as a CFA volunteer. Mitchell had a
significant overrepresentation of people who were registered or registered in the past. Baw Baw and
Whittlesea had the smallest representations of people who were registered or had registered in the past.
2 = 23.595 p = 0.023 Yes No, registered in past No Total
Murrindindi
Count 30 34 340 404
Expected 30.3 42.1 331.7
Yarra Ranges
Count 9 19 168 196
Expected 14.7 20.4 160.9
Mitchell
Count 18 24 127 169
Expected 12.7 17.6 138.7
Whittlesea
Count 3 12 125 140
Expected 10.5 14.6 114.9
Latrobe
Count 11 11 80 102
Expected 7.6 10.6 83.7
Baw Baw
Count 5 5 55 65
Expected 4.9 6.8 53.4
Other
Count 19 27 146 192
Expected 14.4 20.0 157.6
Total Count 95 132 1041 1268
* Q1. Other includes Alpine, Benella, East Gippsland, Gannawarra, Greater Bendigo, Greater Dandenong,
Horsham, Loddon, Moorabool, Nillumbik, St Arnaud, Towong and Wellington

REPORT NO. A.000.000
161
Q1 by Q83. On February 7th were you a member of a CFA community fire guard group?
Despite having a overrepresentation of people who were registered, or registered in the past as CFA
volunteers, Mitchell had an overrepresentation of people who were not registered as a part of the CFA
community fire guard group. Whittlesea had the opposite, where there were few people registered as a part
of the volunteers, but many people were registered as a part of the community fire guard group.
2 = 44.919 p < 0.001 Yes No, registered in past No Total
Murrindindi
Count 69 27 302 398
Expected 61.6 26.7 309.8
Yarra Ranges
Count 45 11 137 193
Expected 29.9 12.9 150.2
Mitchell
Count 5 17 146 168
Expected 26.0 11.3 130.8
Whittlesea
Count 30 4 106 140
Expected 21.7 9.4 109.0
Latrobe
Count 9 9 81 99
Expected 15.3 6.6 77.1
Baw Baw
Count 12 2 50 64
Expected 9.9 4.3 49.8
Other
Count 24 14 154 192
Expected 29.7 12.9 149.4
Total Count 194 84 976 1254
* Q1. Other includes Alpine, Benella, East Gippsland, Gannawarra, Greater Bendigo, Greater Dandenong,
Horsham, Loddon, Moorabool, Nillumbik, St Arnaud, Towong and Wellington
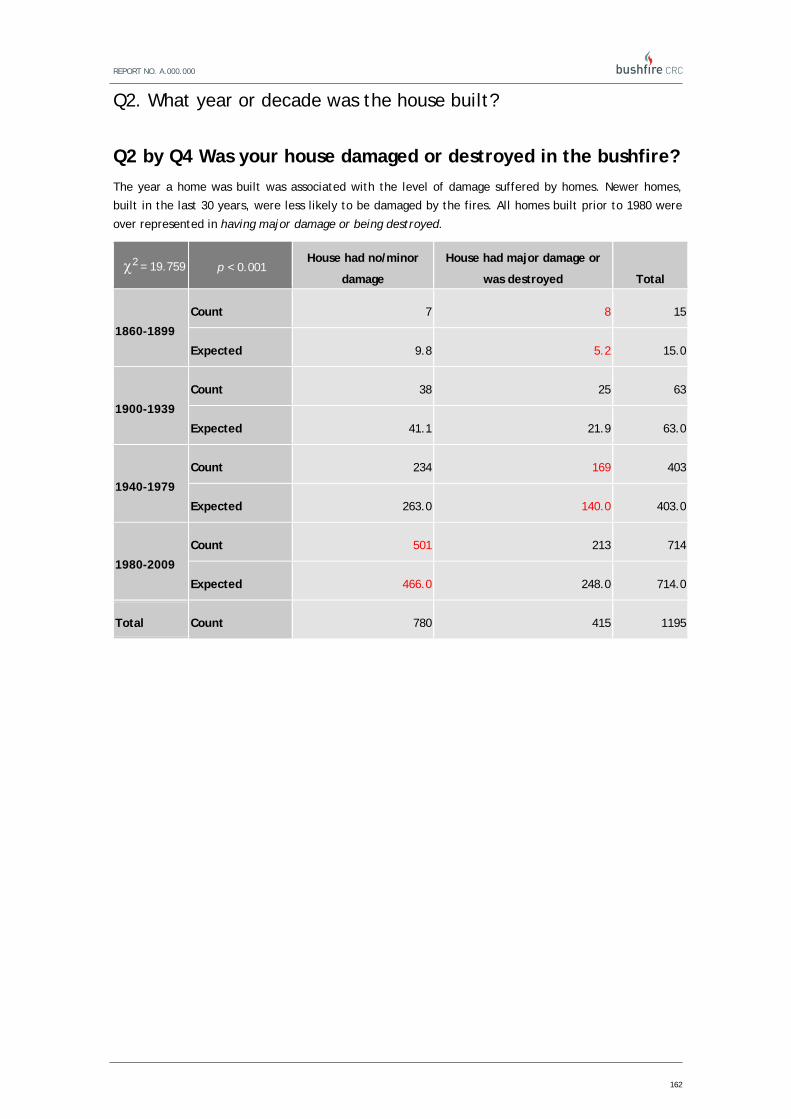
REPORT NO. A.000.000
162
Q2. What year or decade was the house built?
Q2 by Q4 Was your house damaged or destroyed in the bushfire?
The year a home was built was associated with the level of damage suffered by homes. Newer homes,
built in the last 30 years, were less likely to be damaged by the fires. All homes built prior to 1980 were
over represented in having major damage or being destroyed.
2 = 19.759 p < 0.001 House had no/minor
damage
House had major damage or
was destroyed Total
1860-1899
Count 7 8 15
Expected 9.8 5.2 15.0
1900-1939
Count 38 25 63
Expected 41.1 21.9 63.0
1940-1979
Count 234 169 403
Expected 263.0 140.0 403.0
1980-2009
Count 501 213 714
Expected 466.0 248.0 714.0
Total Count 780 415 1195

REPORT NO. A.000.000
163
Q2 by Q6 Was the house damaged by wind at any time during the bushfire?
There is no association between the year a home was built and the effect of wind on February 7th. Most
people stated no wind damage.
2 = 4.676 p = 0.862 Before the fire With the fire After the fire No Total
1860-1899
Count 0 1 0 10 11
Expected .3 1.6 .1 9.0 11.0
1900-1939
Count 1 3 0 11 15
Expected .5 2.1 .2 12.2 15.0
1940-1979
Count 6 24 4 144 178
Expected 5.4 25.3 2.1 145.2 178.0
1980-2009
Count 8 43 2 242 295
Expected 8.9 42.0 3.5 240.6 295.0
Total
Count 15 71 6 407 499
Expected 15.0 71.0 6.0 407.0 499.0

REPORT NO. A.000.000
164
Q4. Was house damaged or destroyed in bushfire
Q4 by Q6 Was the house damaged by wind at any time during the bushfire?
There was no association between the house damaged or destroyed in the bushfire and amount of damage
caused to a home by wind and by fire.
2 = 5.955 p = 0.114 Before the fire With the fire After the fire No Total
House had
no/minor damage
Count 9 35 3 258 305
Expected 8.7 44.6 3.5 248.3 305.0
House had major
damage or was
destroyed
Count 6 42 3 171 222
Expected 6.3 32.4 2.5 180.7 222.0
Total Count 15 77 6 429 527

REPORT NO. A.000.000
165
Q4 by Q7.1 The actions I took before February 7th (To what extent do you think the following factors influenced how the fire affected your home and/or property?)
From this table we can determine that there was an association between the level of damage to an
individual’s home and their opinion of how the actions they took before February 7th impacted that
outcome. When an individual’s home was undamaged or had minor damage they indicated that they
believed their actions taken before February 7th contributed to a great extent to that outcome. Very few
people believed it had nothing to do with the outcome.
Individuals whose homes were destroyed or suffered major damage had an over representation of cases in
the not at all category, showing their belief that actions taken before the fires had no impact on them
loosing their homes.
2 = 374.779 p < 0.001 Not at all
To some
extent
To a moderate
extent
To a great
extent
Don't
know/Unsure Total
House had
no/minor
damage
Count 95 131 142 416 4 788
Expected 220.2 126.2 117.0 305.6 19.1
House had major
damage or was
destroyed
Count 240 61 36 49 25 411
Expected 114.8 65.8 61.0 159.4 9.9
Total Count 335 192 178 465 29 1199
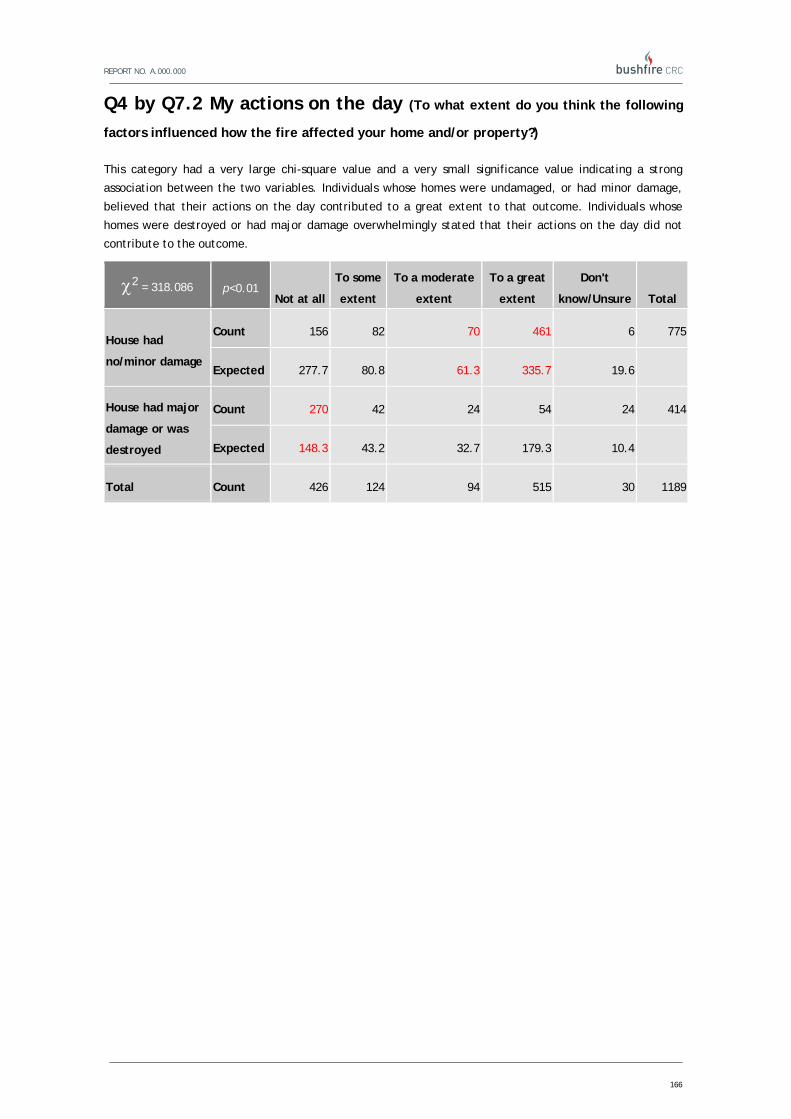
REPORT NO. A.000.000
166
Q4 by Q7.2 My actions on the day (To what extent do you think the following
factors influenced how the fire affected your home and/or property?)
This category had a very large chi-square value and a very small significance value indicating a strong
association between the two variables. Individuals whose homes were undamaged, or had minor damage,
believed that their actions on the day contributed to a great extent to that outcome. Individuals whose
homes were destroyed or had major damage overwhelmingly stated that their actions on the day did not
contribute to the outcome.
2 = 318.086 p<0.01 Not at all
To some
extent
To a moderate
extent
To a great
extent
Don't
know/Unsure Total
House had
no/minor damage
Count 156 82 70 461 6 775
Expected 277.7 80.8 61.3 335.7 19.6
House had major
damage or was
destroyed
Count 270 42 24 54 24 414
Expected 148.3 43.2 32.7 179.3 10.4
Total Count 426 124 94 515 30 1189

REPORT NO. A.000.000
167
Q4 by Q7.3 The help of family, friends or neighbours on the day
(To what extent do you think the following factors influenced how the fire affected your
home and/or property?)
A large chi-square value and a small significance level indicate that there is a strong association between
these two variables. Where a house was undamaged or suffered minor damage the help of friends, family
or neighbours was higher than expected. When a home was destroyed or had major damage this help was
viewed as having little to no impact on the outcome.
2 = 264.538 p<0.01 Not at all
To some
extent
To a moderate
extent
To a great
extent
Don't
know/Unsure Total
House had
no/minor damage
Count 253 100 81 324 3 761
Expected 367.8 83.3 59.9 233.7 16.3
House had major
damage or was
destroyed
Count 312 28 11 35 22 408
Expected 197.2 44.7 32.1 125.3 8.7
Total Count 565 128 92 359 25 1169

REPORT NO. A.000.000
168
Q4 by Q7.4 The construction of my home (To what extent do you think the following factors influenced how the fire affected your home and/or property?)
While there was a significant association between the damage sustained by a home and the extent to
which respondents believe the construction of their home contributed to this, it is not as obvious as in
previous questions. The no or minor damage category had an over representation that home construction
contributed to the outcome, however this is only by about 30 respondents.
2 = 11.012 P = .026 Not at all
To some
extent
To a moderate
extent
To a great
extent
Don't
know/Unsure Total
House had
no/minor damage
Count 250 129 140 191 37 747
Expected 271.9 126.0 127.3 181.3 40.5
House had major
damage or was
destroyed
Count 173 67 58 91 26 415
Expected 151.1 70.0 70.7 100.7 22.5
Total Count 423 196 198 282 63 1162

REPORT NO. A.000.000
169
Q4 by Q7.5 The position of my home (To what extent do you think the following factors influenced how the fire affected your home and/or property?)
A large association was evident between these two variables. The position of an individual’s home was
thought to be a great influence on those whose homes suffered minor damage, or no damage.
2 = 101.733 P < .001 Not at all
To some
extent
To a moderate
extent
To a great
extent
Don't
know/Unsure Total
House had
no/minor damage
Count 102 142 165 330 23 762
Expected 163.2 142.6 140.7 284.6 30.8
House had major
damage or was
destroyed
Count 152 80 54 113 25 424
Expected 90.8 79.4 78.3 158.4 17.2
Total Count 254 222 219 443 48 1186

REPORT NO. A.000.000
170
Q4 by Q7.6 Fire agencies fire fighting activities (To what extent do you think the following factors influenced how the fire affected your home and/or property?)
A moderate chi-square value and small significance level show that there is an association between these
two variables. When a home was undamaged or had minor damage, the surveyed individuals indicated that
fire fighting activities were attributable higher than expected, however it should be noted that the
majority still respondent resoundingly not at all.
2 = 35.581 P < .001 Not at all
To some
extent
To a moderate
extent
To a great
extent
Don't
know/Unsure Total
House had
no/minor damage
Count 526 55 41 111 19 752
Expected 542.2 47.4 33.8 94.8 33.8
House had major
damage or was
destroyed
Count 309 18 11 35 33 406
Expected 292.8 25.6 18.2 51.2 18.2
Total Count 835 73 52 146 52 1158

REPORT NO. A.000.000
171
Q4 by Q7.7 Fire agencies fuel reduction activities (To what extent do you think the following factors influenced how the fire affected your home and/or property?)
Individuals from homes that were undamaged or sustained minor damage believed that fuel reduction
activities had nothing to do with the outcome. Individuals from homes that were destroyed implied that
fuel reduction activities contributed substantially more than expected in the categories of “To a great
extent” or “Don’t know/unsure”. It is important to note that the majority of respondents still selected
not at all.
2 = 75.68 P < .001 Not at all
To some
extent
To a moderate
extent
To a great
extent
Don't
know/Unsure Total
House had
no/minor damage
Count 633 39 22 28 23 745
Expected 585.8 40.6 20.6 59.9 38.0
House had major
damage or was
destroyed
Count 276 24 10 65 36 411
Expected 323.2 22.4 11.4 33.1 21.0
Total Count 909 63 32 93 59 1156

REPORT NO. A.000.000
172
Q4 by Q7.8 Fuel (e.g. trees, bushes, leaves on ground etc) (To what extent do you think the following factors influenced how the fire affected your home and/or property?)
A significant association between fuel and home damage was found, however on inspection of the table
the association is not largely over or under represented in any category. The differences between count
and Expected are all less that 20 respondents. This suggests that individuals were unclear to a certain
extent as to how much fuel contributed to the outcome for their home. In general minor damage or less
thought that it had some or a moderate effect on the outcome. Respondents with major damage or greater
were split over the fuel having no contribution or contributing to a great extent.
2 = 11.875 P = .018 Not at all
To some
extent
To a moderate
extent
To a great
extent
Don't
know/Unsure Total
House had
no/minor damage
Count 146 180 142 263 12 743
Expected 156.6 170.0 129.2 270.0 17.2
House had major
damage or was
destroyed
Count 100 87 61 161 15 424
Expected 89.4 97.0 73.8 154.0 9.8
Total Count 246 267 203 424 27 1167

REPORT NO. A.000.000
173
Q4 by Q7.9 Topography/Landscape (e.g. hills, valleys, rivers etc) (To what extent do you think the following factors influenced how the fire affected your home and/or property?)
Those who had little or no damage to their home were fairly evenly divided in opinion as to whether
topography or landscape contributed to the outcome. However, large scale damage to a home yielded a
large proportion stating the topography contributed to a great extent or not at all.
2 = 21.492 P < .001 Not at all
To some
extent
To a moderate
extent
To a great
extent
Don't
know/Unsure Total
House had
no/minor damage
Count 126 156 196 224 43 745
Expected 133.5 154.6 166.1 244.7 46.0
House had major
damage or was
destroyed
Count 83 86 64 159 29 421
Expected 75.5 87.4 93.9 138.3 26.0
Total Count 209 242 260 383 72 1166

REPORT NO. A.000.000
174
Q4 by Q7.10 Temperature (To what extent do you think the following factors influenced how the fire affected your home and/or property?)
A significant association between temperature and damage to home was found. An under representation of
temperature contributing to a great extent is found for individuals whose homes suffered little impact
from the fires. It is interesting to note however, that this category was overwhelmingly chosen by this
category of individuals, despite the under representation. Similarly, respondents in the major damage or
destroyed category were over-represented in temperature contributed to a great extent.
2 = 61.583 P < .001 Not at all
To some
extent
To a moderate
extent
To a great
extent
Don't
know/Unsure Total
House had
no/minor damage
Count 79 38 56 531 36 740
Expected 53.4 27.0 49.6 579.9 30.1
House had major
damage or was
destroyed
Count 6 5 23 393 12 439
Expected 31.6 16.0 29.4 344.1 17.9
Total Count 85 43 79 924 48 1179

REPORT NO. A.000.000
175
Q4 by Q7.11 Wind (To what extent do you think the following factors influenced how the fire affected your home and/or property?)
The association between wind and amount of damage to home is significant. Over three quarters of both
categories of respondents chose that wind contributed to a great extent to the damage sustained by their
home. Notably, the significance is due to the over representation of responses in the to a great extent by
damage/destroyed category.
2 = 35.154 P < .001 Not at all
To some
extent
To a moderate
extent
To a great
extent
Don't
know/Unsure Total
House had
no/minor damage
Count 42 44 53 586 28 753
Expected 31.6 31.0 43.6 620.3 26.5
House had major
damage or was
destroyed
Count 8 5 16 396 14 439
Expected 18.4 18.0 25.4 361.7 15.5
Total Count 50 49 69 982 42 1192

REPORT NO. A.000.000
176
Q4 by Q7.12 Luck or chance (To what extent do you think the following factors influenced how the fire affected your home and/or property?)
Luck or chance was significantly associated with level of damage to a respondent’s home. Those with
minor damage or an undamaged home had an over representation in the ‘to a great extent’ category,
indicating they believed it had a large influence on the outcome.
2 = 99.316 P < .001 Not at all
To some
extent
To a moderate
extent
To a great
extent
Don't
know/Unsure Total
House had
no/minor damage
Count 99 179 105 354 15 752
Expected 131.6 150.5 96.2 330.5 43.2
House had major
damage or was
destroyed
Count 102 51 42 151 51 397
Expected 69.4 79.5 50.8 174.5 22.8
Total Count 201 230 147 505 66 1149

REPORT NO. A.000.000
177
435BThe following questions refer only to those who stayed on their property (answered c, d, e, f, g or h at question 37).
Q4 by Q56. How safe did you feel while staying at your house?
The amount of damage a home sustained was associated with how safe a person felt while staying on their
property. As anticipated, those with none or minor damage to their home felt safe, where as those who
sustained major damage or had their home destroyed felt unsafe.
2 = 36.578 P < 0.001 Safe Neither safe or unsafe Unsafe Total
House had no/minor
damage
Count 181 204 128 513
Expected 161.5 195.4 156.0
House had major
damage or was
destroyed
Count 24 44 70 138
Expected 43.5 52.6 42.0
Total Count 205 248 198 651

REPORT NO. A.000.000
178
Q4 by Q61. Why did you leave your house or property? You may select more than one. (Multiple Response)
A great number of people whose homes had major damage or were destroyed left because their house was on fire. The largest proportion of people left because they felt that it was too dangerous to stay. Another common outcome was that people had fire in the immediate vicinity and left.
2 = 120.643 P < .001 Smelled smoke near by
Flames near by
Fire in immediate
vicinity
To get things to defend
Emergency services said to
Friends, relatives,
neighbours said to
Too dangerous
Sustained an injury
Remove household members
from danger
Fire fighting equipment
failed
House caught on fire Other Total
House had no/minor damage
Count 19 36 40 11 10 17 51 2 32 26 1 56 301
Expected 14.7 32.1 37.5 7.1 7.1 16.8 54.3 4.3 32.6 33.1 22.8 38.6
House had major damage or was destroyed
Count 8 23 29 2 3 14 49 6 28 35 41 15 253
Expected 12.3 26.9 31.5 5.9 5.9 14.2 45.7 3.7 27.4 27.9 19.2 32.4
Total Count 27 59 69 13 13 31 100 8 60 61 42 71 554

REPORT NO. A.000.000
179
Q6 Was the house damaged by wind at any time during the bushfire?
Q6 by Q7.11 Wind (To what extent do you think the following factors influenced
how the fire affected your home and/or property?)
2 = 27.139 p = 0.04 Not at all
To some
extent
To a moderate
extent
To a great
extent
Don't
know/Unsure Total
Before the
fire
Count 0 1 0 12 1 14
Expected .4 .4 .6 12.2 .4
With the fire
Count 2 1 3 71 1 78
Expected 2.0 2.3 3.4 67.9 2.5
After the
fire
Count 0 0 0 5 0 5
Expected .1 .1 .2 4.4 .2
No
Count 11 19 21 349 7 407
Expected 10.2 11.9 17.5 354.4 13.0
Don't know
Count 5 0 7 190 14 216
Expected 5.4 6.3 9.3 188.1 6.9
Total Count 18 21 31 627 23 720
* Q1. Other includes Alpine, Benella, East Gippsland, Gannawarra, Greater Bendigo, Greater Dandenong,
Horsham, Loddon, Moorabool, Nillumbik, St Arnaud, Towong and Wellington

REPORT NO. A.000.000
180
Section 2: Information and Warnings
Q10. In the 12 months before the February 7th bushfire, did you get any information about how to prepare your household for bushfires from any of the following sources?
Q10 by Q26 Which of the following best describes your level of planning for bushfires BEFORE February 7th? (Multiple Choice)
Those who did not receive any information of how to prepare for the bushfires were overrepresented in
the categories of having no plans or being undecided in what they should do. Individuals who received
information of how to prepare from television were overrepresented in the categories of ‘Knew I should
consider it but didn't’ and ‘Considered it and was still deciding’. Most residents had made a firm plan of
what they were going to do. Most frequently the information came from ABC radio and the CFA workbook.
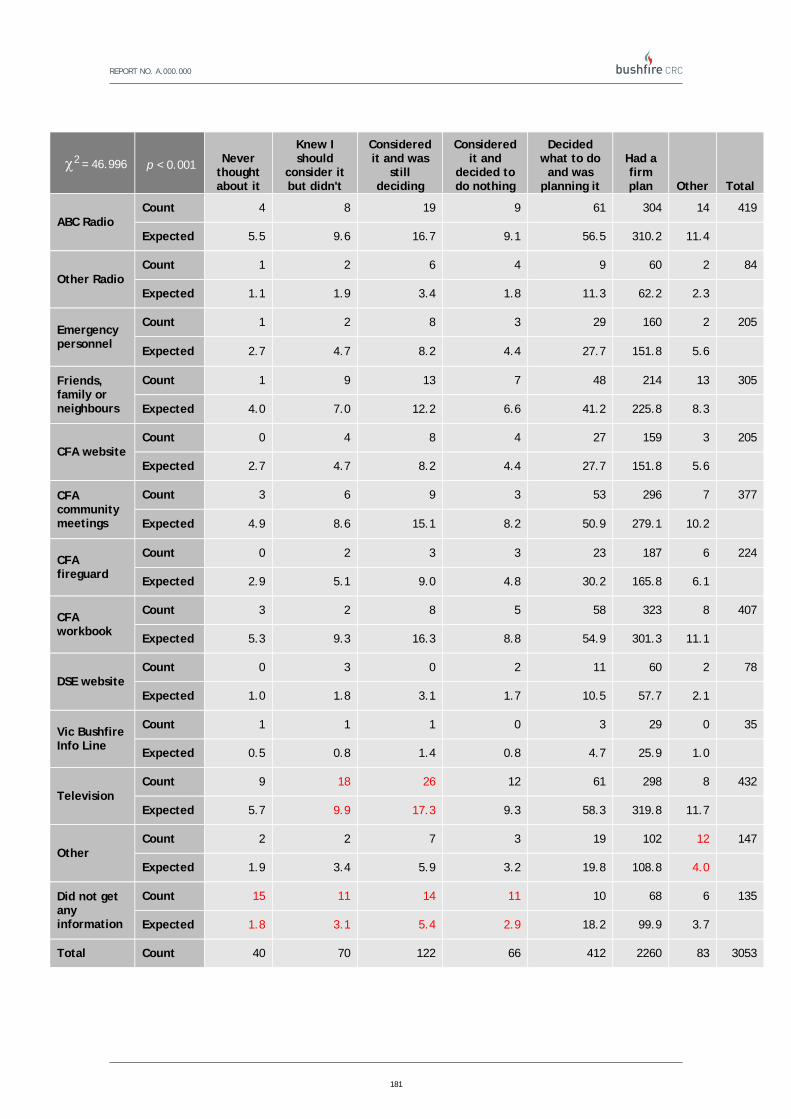
REPORT NO. A.000.000
181
2 = 46.996 p < 0.001 Never thought about it
Knew I should
consider it but didn't
Considered it and was
still deciding
Considered it and
decided to do nothing
Decided what to do
and was planning it
Had a firm plan Other Total
ABC Radio Count 4 8 19 9 61 304 14 419
Expected 5.5 9.6 16.7 9.1 56.5 310.2 11.4
Other Radio Count 1 2 6 4 9 60 2 84
Expected 1.1 1.9 3.4 1.8 11.3 62.2 2.3
Emergency personnel
Count 1 2 8 3 29 160 2 205
Expected 2.7 4.7 8.2 4.4 27.7 151.8 5.6
Friends, family or neighbours
Count 1 9 13 7 48 214 13 305
Expected 4.0 7.0 12.2 6.6 41.2 225.8 8.3
CFA website Count 0 4 8 4 27 159 3 205
Expected 2.7 4.7 8.2 4.4 27.7 151.8 5.6
CFA community meetings
Count 3 6 9 3 53 296 7 377
Expected 4.9 8.6 15.1 8.2 50.9 279.1 10.2
CFA fireguard
Count 0 2 3 3 23 187 6 224
Expected 2.9 5.1 9.0 4.8 30.2 165.8 6.1
CFA workbook
Count 3 2 8 5 58 323 8 407
Expected 5.3 9.3 16.3 8.8 54.9 301.3 11.1
DSE website Count 0 3 0 2 11 60 2 78
Expected 1.0 1.8 3.1 1.7 10.5 57.7 2.1
Vic Bushfire Info Line
Count 1 1 1 0 3 29 0 35
Expected 0.5 0.8 1.4 0.8 4.7 25.9 1.0
Television Count 9 18 26 12 61 298 8 432
Expected 5.7 9.9 17.3 9.3 58.3 319.8 11.7
Other Count 2 2 7 3 19 102 12 147
Expected 1.9 3.4 5.9 3.2 19.8 108.8 4.0
Did not get any information
Count 15 11 14 11 10 68 6 135
Expected 1.8 3.1 5.4 2.9 18.2 99.9 3.7
Total Count 40 70 122 66 412 2260 83 3053

REPORT NO. A.000.000
182
Q10 by Q27 At the beginning of last summer, which of the following did you think you were MOST LIKELY to do if a bushfire occurred in your town or suburb? Select ONE only.
Residents who received information of how to prepare from the CFA fireguard were most likely to stay
throughout the fire. There was an overrepresentation of people who received information from the
television who would wait and see before deciding whether to stay or go. An overrepresentation also
existed for those who did not receive any information who indicated that they had not thought about their
plans.

REPORT NO. A.000.000
183
2 = 46.996 p < 0.001
Stay
through
fire
Stay and
leave if
threat
Wait
and see
Wait for
emergency
services
Leave as
soon as fire
threatens
No at home
on high fire
danger days
Hadn't
thought
about it Other Total
ABC Radio Count 230 64 34 6 55 11 2 14 416
Expected 208.1 75.8 34.9 5.9 69.7 8.9 1.5 11.3
Other Radio Count 32 18 11 2 14 1 0 0 78
Expected 39.0 14.2 6.5 1.1 13.1 1.7 0.3 2.1
Emergency personnel
Count 101 37 18 2 33 6 0 7 204
Expected 102.1 37.2 17.1 2.9 34.2 4.3 0.7 5.5
Friends, family or neighbours
Count 138 62 24 1 60 6 1 10 302
Expected 151.1 55.0 25.3 4.3 50.6 6.4 1.1 8.2
CFA website Count 106 40 13 4 38 4 0 6 211
Expected 105.6 38.4 17.7 3.0 35.3 4.5 0.8 5.7
CFA community meetings
Count 197 68 26 5 62 9 1 10 378
Expected 189.1 68.9 31.7 5.3 63.3 8.1 1.4 10.3
CFA fireguard
Count 137 34 16 1 25 2 0 7 222
Expected 111.1 40.4 18.6 3.1 37.2 4.7 0.8 6.0
CFA workbook
Count 211 70 26 4 73 11 0 13 408
Expected 204.1 74.3 34.2 5.7 68.3 8.7 1.5 11.1
DSE website Count 37 18 5 0 15 2 0 3 80
Expected 40.0 14.6 6.7 1.1 13.4 1.7 0.3 2.2
Vic Bushfire Info Line
Count 12 8 1 1 10 1 0 2 35
Expected 17.5 6.4 2.9 0.5 5.9 0.7 0.1 1.0
Television Count 170 94 56 7 83 10 0 9 429
Expected 214.6 78.2 36.0 6.0 71.8 9.1 1.5 11.7
Other Count 91 22 12 3 18 2 0 2 150
Expected 75.0 27.3 12.6 2.1 25.1 3.2 0.5 4.1
Did not get any information
Count 65 21 14 7 25 0 7 0 139
Expected 69.5 25.3 11.7 2.0 23.3 3.0 0.5 3.8
Total Count 1527 556 256 43 511 65 11 83 3052

REPORT NO. A.000.000
184
Q10 by Q29.1 Cleared leaves, twigs and long grass for a distance
of about 20-30m around the house (Which of the following had you done to
prepare for bushfires?)
A quarter of people who obtained their information from the CFA website took no action in clearing
leaves, twigs and long grass from around their home.
2 = 98.981 P < 0.001 Prior to Feb 7 On Feb 7
Action not taken
Prior to and on Feb 7 Total
ABC Radio Count 329 0 71 5 405
Expected 325.4 3.2 69.5 6.9
Other Radio Count 62 0 15 3 80
Expected 64.3 0.6 13.7 1.4
Emergency personnel
Count 171 1 35 2 209
Expected 167.9 1.7 35.9 3.6
Friends, family or neighbours
Count 243 2 50 6 301
Expected 241.8 2.4 51.6 5.1
CFA website Count 145 2 51 3 201
Expected 161.5 1.6 34.5 3.4
CFA community meetings
Count 289 6 65 6 366
Expected 294.0 2.9 62.8 6.2
CFA fireguard
Count 184 2 40 3 229
Expected 184.0 1.8 39.3 3.9
CFA workbook
Count 326 4 69 6 405
Expected 325.4 3.2 69.5 6.9
DSE website Count 59 0 17 2 78
Expected 62.7 0.6 13.4 1.3
Vic Bushfire Info Line
Count 26 0 8 1 35
Expected 28.1 0.3 6.0 0.6
Television Count 330 4 65 11 410
Expected 329.4 3.3 70.3 7.0
Other Count 128 1 21 1 151
Expected 121.3 1.2 25.9 2.6
Did not get any information
Count 115 2 7 2 126
Expected 101.2 1.0 21.6 2.1

REPORT NO. A.000.000
185
Total Count 2407 24 514 51 2996
Q10 by Q29.2 Removed bushes close to the house and cut back overhanging tree branches (Which of the following had you done to prepare for bushfires?)
There was no association found between these questions.
2 = 41.206 P = 0.374 Prior to Feb 7 On Feb 7
Action not taken
Prior to and on Feb 7 Total
ABC Radio Count 227 4 14 66 311
Expected 233.0 2.5 15.2 60.3
Other Radio Count 50 1 3 14 68
Expected 50.9 0.6 3.3 13.2
Emergency personnel
Count 115 1 11 32 159
Expected 119.1 1.3 7.8 30.8
Friends, family or neighbours
Count 173 0 10 53 236
Expected 176.8 1.9 11.5 45.7
CFA website Count 135 1 10 23 169
Expected 126.6 1.4 8.3 32.8
CFA community meetings
Count 206 3 16 55 280
Expected 209.8 2.3 13.7 54.3
CFA fireguard
Count 131 1 9 31 172
Expected 128.9 1.4 8.4 33.3
CFA workbook
Count 239 2 18 55 314
Expected 235.2 2.6 15.3 60.9
DSE website Count 48 0 2 11 61
Expected 45.7 0.5 3.0 11.8
Vic Bushfire Info Line
Count 23 0 1 4 28
Expected 21.0 0.2 1.4 5.4
Television Count 245 3 11 55 314
Expected 235.2 2.6 15.3 60.9
Other Count 87 2 5 24 118
Expected 88.4 1.0 5.8 22.9
Did not get any information
Count 68 1 4 29 102
Expected 76.4 0.8 5.0 19.8
Total Count 1747 19 114 452 2332

REPORT NO. A.000.000
186

REPORT NO. A.000.000
187
Q10 by Q29.3 Used landscaping or the layout of garden to reduce the fire risk (Which of the following had you done to prepare for bushfires?) Though there was only a minor association found between information source and when preparations
were made, it is interesting to note that there was an overrepresentation of people who got information
from emergency personnel and using the layout of their garden on February 7 to reduce the fire risk.
2 = 60.047 P = 0.017 Prior to Feb 7 On Feb 7
Action not taken
Prior to and on Feb 7 Total
ABC Radio Count 247 4 10 39 300
Expected 241.3 4.3 7.4 47.0
Other Radio Count 48 2 2 6 58
Expected 46.7 0.8 1.4 9.1
Emergency personnel
Count 124 6 3 21 154
Expected 123.9 2.2 3.8 24.1
Friends, family or neighbours
Count 169 2 3 34 208
Expected 167.3 3.0 5.1 32.6
CFA website Count 122 1 5 23 151
Expected 121.5 2.2 3.7 23.7
CFA community meetings
Count 196 5 7 45 253
Expected 203.5 3.6 6.2 39.7
CFA fireguard
Count 135 0 5 30 170
Expected 136.7 2.4 4.2 26.7
CFA workbook
Count 239 4 7 44 294
Expected 236.5 4.2 7.2 46.1
DSE website Count 44 0 0 9 53
Expected 42.6 0.8 1.3 8.3
Vic Bushfire Info Line
Count 22 1 0 4 27
Expected 21.7 0.4 0.7 4.2
Television Count 234 3 8 48 293
Expected 235.7 4.2 7.2 45.9
Other Count 94 2 1 11 108
Expected 86.9 1.5 2.6 16.9
Did not get any information
Count 65 1 2 25 93
Expected 74.8 1.3 2.3 14.6
Total Count 1739 31 53 339 2162

REPORT NO. A.000.000
188
Q10 by Q29.4 Moved combustible materials such as firewood and wooden garden furniture away from the house (Which of the following had you done to prepare for bushfires?)
More people than expected to the action of moving combustible materials away from the house before
and on February 7 when they procured information from radio other than ABC. There were also more
people than expected who did not take this action when they used the CFA website for information.
2 = 104.86 P < 0.001 Prior to Feb 7 On Feb 7
Action not taken
Prior to and on Feb 7 Total
ABC Radio Count 190 67 43 26 326
Expected 182.4 74.9 44.6 24.1
Other Radio Count 29 10 9 9 57
Expected 31.9 13.1 7.8 4.2
Emergency personnel
Count 93 36 27 12 168
Expected 94.0 38.6 23.0 12.4
Friends, family or neighbours
Count 126 60 28 15 229
Expected 128.2 52.6 31.4 16.9
CFA website Count 91 41 35 10 177
Expected 99.1 40.6 24.2 13.1
CFA community meetings
Count 165 83 40 28 316
Expected 176.9 72.6 43.3 23.3
CFA fireguard
Count 106 43 32 12 193
Expected 108.0 44.3 26.4 14.2
CFA workbook
Count 188 89 51 18 346
Expected 193.6 79.4 47.4 25.5
DSE website Count 38 20 8 4 70
Expected 39.2 16.1 9.6 5.2
Vic Bushfire Info Line
Count 25 5 2 1 33
Expected 18.5 7.6 4.5 2.4
Television Count 173 73 36 25 307
Expected 171.8 70.5 42.0 22.7
Other Count 87 22 15 7 131
Expected 73.3 30.1 17.9 9.7
Did not get any information
Count 54 11 8 13 86
Expected 48.1 19.7 11.8 6.3
Total Count 1365 560 334 180 2439

REPORT NO. A.000.000
189
Q10 by Q29.5 Cleared gutters of leaves (Which of the following had you done to prepare for bushfires?)
An association was found between where residents obtained information about preparation and if they
took action to clean their gutters. Those who utilised the CFA website had an overrepresentation of people
who did not take this action.
2 = 67.324 P = 0.003 Prior to Feb 7 On Feb 7
Action not taken
Prior to and on Feb 7 Total
ABC Radio Count 312 18 62 16 408
Expected 309.2 17.4 64.0 17.4
Other Radio Count 65 1 12 2 80
Expected 60.6 3.4 12.6 3.4
Emergency personnel
Count 157 12 33 6 208
Expected 157.6 8.9 32.6 8.9
Friends, family or neighbours
Count 233 13 34 10 290
Expected 219.8 12.4 45.5 12.4
CFA website Count 140 9 46 13 208
Expected 157.6 8.9 32.6 8.9
CFA community meetings
Count 269 17 62 14 362
Expected 274.3 15.4 56.8 15.4
CFA fireguard
Count 155 9 44 11 219
Expected 166.0 9.3 34.4 9.3
CFA workbook
Count 306 13 65 19 403
Expected 305.4 17.2 63.2 17.2
DSE website Count 58 2 13 5 78
Expected 59.1 3.3 12.2 3.3
Vic Bushfire Info Line
Count 29 3 4 0 36
Expected 27.3 1.5 5.6 1.5
Television Count 311 18 56 15 400
Expected 303.1 17.0 62.8 17.0
Other Count 115 3 21 7 146
Expected 110.6 6.2 22.9 6.2
Did not get any information
Count 91 8 12 8 119
Expected 90.2 5.1 18.7 5.1
Total Count 2241 126 464 126 2957

REPORT NO. A.000.000
190
Q10 by Q29.6 Installed gutter protection (Which of the following had you done to prepare for bushfires?)
An association was found between these two items. Notably, slightly more people than expected installed
gutter protection on and prior to February 7 when listening to radio other than the ABC for information.
Most people prepared for this before Feb 7, and very few people did not install any gutter protection.
2 = 69.13 P = 0.002 Prior to Feb 7 On Feb 7
Action not taken
Prior to and on Feb 7 Total
ABC Radio Count 85 14 5 24 128
Expected 85.4 11.6 4.4 26.6
Other Radio Count 9 2 1 11 23
Expected 15.3 2.1 0.8 4.8
Emergency personnel
Count 55 8 2 14 79
Expected 52.7 7.2 2.7 16.4
Friends, family or neighbours
Count 62 7 3 14 86
Expected 57.4 7.8 3.0 17.9
CFA website Count 44 7 4 15 70
Expected 46.7 6.4 2.4 14.5
CFA community meetings
Count 88 16 5 24 133
Expected 88.7 12.1 4.6 27.6
CFA fireguard
Count 45 6 1 13 65
Expected 43.4 5.9 2.2 13.5
CFA workbook
Count 96 13 6 19 134
Expected 89.4 12.2 4.6 27.8
DSE website Count 17 1 1 4 23
Expected 15.3 2.1 0.8 4.8
Vic Bushfire Info Line
Count 11 1 1 2 15
Expected 10.0 1.4 0.5 3.1
Television Count 82 8 2 28 120
Expected 80.0 10.9 4.1 24.9
Other Count 25 4 2 11 42
Expected 28.0 3.8 1.4 8.7
Did not get any information
Count 20 0 0 20 40
Expected 26.7 3.6 1.4 8.3
Total Count 639 87 33 199 958

REPORT NO. A.000.000
191
Q10 by Q29.7 Covered underfloor spaces to prevent embers and flame entering (Which of the following had you done to prepare for bushfires?)
There was no association between these two items.
2 = 37.351 P = 0.545 Prior to Feb 7 On Feb 7
Action not taken
Prior to and on Feb 7 Total
ABC Radio Count 55 15 1 150 221
Expected 67.7 14.1 2.4 136.8
Other Radio Count 11 4 1 23 39
Expected 12.0 2.5 0.4 24.1
Emergency personnel
Count 40 7 2 72 121
Expected 37.1 7.7 1.3 74.9
Friends, family or neighbours
Count 50 15 2 101 168
Expected 51.5 10.7 1.8 104.0
CFA website Count 39 6 1 69 115
Expected 35.3 7.3 1.2 71.2
CFA community meetings
Count 68 16 3 134 221
Expected 67.7 14.1 2.4 136.8
CFA fireguard
Count 46 6 2 77 131
Expected 40.2 8.3 1.4 81.1
CFA workbook
Count 78 12 4 136 230
Expected 70.5 14.6 2.5 142.4
DSE website Count 17 2 1 28 48
Expected 14.7 3.1 0.5 29.7
Vic Bushfire Info Line
Count 9 1 0 12 22
Expected 6.7 1.4 0.2 13.6
Television Count 55 15 1 132 203
Expected 62.2 12.9 2.2 125.7
Other Count 28 3 0 63 94
Expected 28.8 6.0 1.0 58.2
Did not get any information
Count 15 4 0 35 54
Expected 16.6 3.4 0.6 33.4
Total Count 511 106 18 1032 1667

REPORT NO. A.000.000
192
Q10 by Q29.8 Covered all gaps and vents to reduce the risk of embers entering the house or cavities (e.g. roof, wall, etc.) (Which of the following had you done to prepare for bushfires?)
Most respondents covered all gaps and vents, with an overrepresentation of residents performing this
action both on and prior to February 7 when preparation information was given by emergency personnel.
2 = 69.41 P = 0.002 Prior to Feb 7 On Feb 7
Action not taken
Prior to and on Feb 7 Total
ABC Radio Count 91 39 3 43 176
Expected 85.3 43.1 5.7 41.9
Other Radio Count 18 11 2 7 38
Expected 18.4 9.3 1.2 9.0
Emergency personnel
Count 38 20 3 32 93
Expected 45.1 22.8 3.0 22.1
Friends, family or neighbours
Count 46 36 2 32 116
Expected 56.2 28.4 3.8 27.6
CFA website Count 59 26 6 16 107
Expected 51.8 26.2 3.5 25.5
CFA community meetings
Count 75 49 7 38 169
Expected 81.9 41.4 5.5 40.2
CFA fireguard
Count 56 26 4 21 107
Expected 51.8 26.2 3.5 25.5
CFA workbook
Count 95 47 5 34 181
Expected 87.7 44.3 5.9 43.1
DSE website Count 28 9 1 6 44
Expected 21.3 10.8 1.4 10.5
Vic Bushfire Info Line
Count 12 2 1 5 20
Expected 9.7 4.9 0.7 4.8
Television Count 72 37 5 43 157
Expected 76.1 38.4 5.1 37.4
Other Count 39 14 2 18 73
Expected 35.4 17.9 2.4 17.4
Did not get any information
Count 12 8 2 20 42
Expected 20.3 10.3 1.4 10.0
Total Count 641 324 43 315 1323

REPORT NO. A.000.000
193
Q10 by Q29.9 Obtained and prepared fire fighting equipment (e.g. hoses and a pump) (Which of the following had you done to prepare for bushfires?)
Three times as many people than were expected obtained and prepared fire fighting equipment on
February 7 when they did not receive any information on how to prepare.
2 = 81.553 P < 0.001 Prior to Feb 7 On Feb 7
Action not taken
Prior to and on Feb 7 Total
ABC Radio Count 234 19 44 10 307
Expected 231.1 17.7 46.8 11.5
Other Radio Count 33 6 12 0 51
Expected 38.4 2.9 7.8 1.9
Emergency personnel
Count 122 4 18 7 151
Expected 113.6 8.7 23.0 5.6
Friends, family or neighbours
Count 156 12 35 8 211
Expected 158.8 12.1 32.2 7.9
CFA website Count 115 7 22 3 147
Expected 110.6 8.5 22.4 5.5
CFA community meetings
Count 212 15 39 15 281
Expected 211.5 16.2 42.8 10.5
CFA fireguard
Count 144 7 29 4 184
Expected 138.5 10.6 28.1 6.9
CFA workbook
Count 241 12 39 10 302
Expected 227.3 17.4 46.0 11.3
DSE website Count 43 4 7 3 57
Expected 42.9 3.3 8.7 2.1
Vic Bushfire Info Line
Count 17 0 5 0 22
Expected 16.6 1.3 3.4 0.8
Television Count 178 20 49 13 260
Expected 195.7 15.0 39.6 9.7
Other Count 91 5 20 2 118
Expected 88.8 6.8 18.0 4.4
Did not get any information
Count 48 14 12 6 80
Expected 60.2 4.6 12.2 3.0
Total Count 1634 125 331 81 2171

REPORT NO. A.000.000
194
Q10 by Q29.10 Obtained and prepared equipment such as ladder, buckets and mops to put out spot fires (Which of the following had you done to prepare for bushfires?)
A third of those who received information of how to prepare from television and two-fifths of those who
did not procure any information took action on February 7 to obtain equipment to put out spot fires.
Nearly all residents who used the Victorian Bushfire information line had prepared the equipment prior to
February 7.
2 = 89.392 P < 0.001 Prior to Feb 7 On Feb 7
Action not taken
Prior to and on Feb 7 Total
ABC Radio Count 187 85 59 8 339
Expected 176.6 90.2 62.9 9.3
Other Radio Count 31 23 10 1 65
Expected 33.9 17.3 12.1 1.8
Emergency personnel
Count 93 45 31 6 175
Expected 91.2 46.6 32.5 4.8
Friends, family or neighbours
Count 107 68 42 5 222
Expected 115.7 59.1 41.2 6.1
CFA website Count 97 35 41 5 178
Expected 92.7 47.4 33.0 4.9
CFA community meetings
Count 163 77 59 8 307
Expected 159.9 81.7 56.9 8.5
CFA fireguard
Count 108 43 39 3 193
Expected 100.5 51.3 35.8 5.3
CFA workbook
Count 177 87 69 9 342
Expected 178.2 91.0 63.4 9.4
DSE website Count 40 16 10 3 69
Expected 35.9 18.4 12.8 1.9
Vic Bushfire Info Line
Count 24 1 4 2 31
Expected 16.2 8.2 5.7 0.9
Television Count 140 101 49 13 303
Expected 157.9 80.6 56.2 8.3
Other Count 63 33 27 1 124
Expected 64.6 33.0 23.0 3.4
Did not get any information
Count 37 33 11 3 84
Expected 43.8 22.3 15.6 2.3
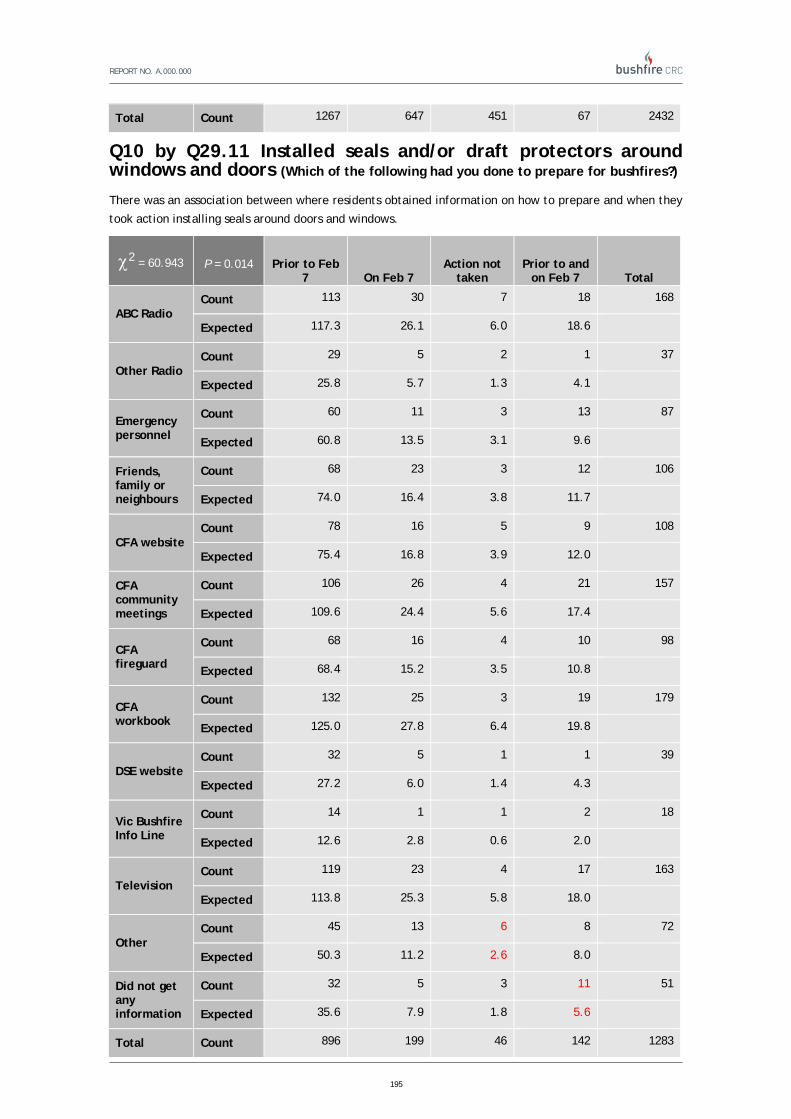
REPORT NO. A.000.000
195
Total Count 1267 647 451 67 2432
Q10 by Q29.11 Installed seals and/or draft protectors around windows and doors (Which of the following had you done to prepare for bushfires?)
There was an association between where residents obtained information on how to prepare and when they
took action installing seals around doors and windows.
2 = 60.943 P = 0.014 Prior to Feb 7 On Feb 7
Action not taken
Prior to and on Feb 7 Total
ABC Radio Count 113 30 7 18 168
Expected 117.3 26.1 6.0 18.6
Other Radio Count 29 5 2 1 37
Expected 25.8 5.7 1.3 4.1
Emergency personnel
Count 60 11 3 13 87
Expected 60.8 13.5 3.1 9.6
Friends, family or neighbours
Count 68 23 3 12 106
Expected 74.0 16.4 3.8 11.7
CFA website Count 78 16 5 9 108
Expected 75.4 16.8 3.9 12.0
CFA community meetings
Count 106 26 4 21 157
Expected 109.6 24.4 5.6 17.4
CFA fireguard
Count 68 16 4 10 98
Expected 68.4 15.2 3.5 10.8
CFA workbook
Count 132 25 3 19 179
Expected 125.0 27.8 6.4 19.8
DSE website Count 32 5 1 1 39
Expected 27.2 6.0 1.4 4.3
Vic Bushfire Info Line
Count 14 1 1 2 18
Expected 12.6 2.8 0.6 2.0
Television Count 119 23 4 17 163
Expected 113.8 25.3 5.8 18.0
Other Count 45 13 6 8 72
Expected 50.3 11.2 2.6 8.0
Did not get any information
Count 32 5 3 11 51
Expected 35.6 7.9 1.8 5.6
Total Count 896 199 46 142 1283

REPORT NO. A.000.000
196
Q10 by Q29.12 Installed a sprinkler system on or around the house (Which of the following had you done to prepare for bushfires?)
There was no association between these two items.
2 = 47.477 P = 0.165 Prior to Feb 7 On Feb 7
Action not taken
Prior to and on Feb 7 Total
ABC Radio Count 102 14 11 14 141
Expected 101.9 14.6 10.6 13.9
Other Radio Count 17 6 5 4 32
Expected 23.1 3.3 2.4 3.2
Emergency personnel
Count 52 6 6 6 70
Expected 50.6 7.2 5.3 6.9
Friends, family or neighbours
Count 73 11 8 12 104
Expected 75.2 10.7 7.9 10.2
CFA website Count 65 9 4 5 83
Expected 60.0 8.6 6.3 8.2
CFA community meetings
Count 94 14 5 15 128
Expected 92.5 13.2 9.7 12.6
CFA fireguard
Count 65 10 8 4 87
Expected 62.9 9.0 6.6 8.6
CFA workbook
Count 106 10 11 9 136
Expected 98.3 14.0 10.3 13.4
DSE website Count 26 3 1 5 35
Expected 25.3 3.6 2.6 3.4
Vic Bushfire Info Line
Count 10 1 0 1 12
Expected 8.7 1.2 0.9 1.2
Television Count 88 13 12 13 126
Expected 91.1 13.0 9.5 12.4
Other Count 40 3 4 7 54
Expected 39.0 5.6 4.1 5.3
Did not get any information
Count 18 8 4 8 38
Expected 27.5 3.9 2.9 3.7
Total Count 756 108 79 103 1046

REPORT NO. A.000.000
197
Q10 by Q29.13 Installed shutters (Which of the following had you done to prepare for bushfires?)
No significant association was found between these items, with a small response rate.
2 = 31.785 P = 0.787 Prior to Feb 7 On Feb 7
Action not taken
Prior to and on Feb 7 Total
ABC Radio Count 13 2 1 30 46
Expected 11.9 2.1 1.0 31.0
Other Radio Count 2 0 0 6 8
Expected 2.1 0.4 0.2 5.4
Emergency personnel
Count 6 1 0 14 21
Expected 5.5 0.9 0.4 14.2
Friends, family or neighbours
Count 11 1 0 22 34
Expected 8.8 1.5 0.7 22.9
CFA website Count 7 1 0 16 24
Expected 6.2 1.1 0.5 16.2
CFA community meetings
Count 10 4 2 34 50
Expected 13.0 2.2 1.0 33.7
CFA fireguard
Count 7 1 1 14 23
Expected 6.0 1.0 0.5 15.5
CFA workbook
Count 11 0 2 23 36
Expected 9.3 1.6 0.8 24.3
DSE website Count 2 1 0 8 11
Expected 2.9 0.5 0.2 7.4
Vic Bushfire Info Line
Count 2 0 0 2 4
Expected 1.0 0.2 0.1 2.7
Television Count 7 2 0 32 41
Expected 10.6 1.8 0.9 27.7
Other Count 6 1 1 10 18
Expected 4.7 0.8 0.4 12.1
Did not get any information
Count 3 1 0 15 19
Expected 4.9 0.9 0.4 12.8
Total Count 87 15 7 226 335

REPORT NO. A.000.000
198
Q10 by Q29.14 Prepared a kit of personal protective clothing for each member of the household (Which of the following had you done to prepare for bushfires?)
From three different information sources (other radio; friends, family or neighbours; television) there was
an overrepresentation of individuals who prepared protective clothing on February 7.
2 = 140.22 P < 0.001 Prior to Feb 7 On Feb 7
Action not taken
Prior to and on Feb 7 Total
ABC Radio Count 171 61 15 12 259
Expected 165.5 63.1 18.4 11.9
Other Radio Count 19 18 3 0 40
Expected 25.6 9.7 2.8 1.8
Emergency personnel
Count 92 28 11 9 140
Expected 89.5 34.1 10.0 6.5
Friends, family or neighbours
Count 102 58 11 6 177
Expected 113.1 43.1 12.6 8.2
CFA website Count 97 26 12 4 139
Expected 88.8 33.9 9.9 6.4
CFA community meetings
Count 161 60 16 9 246
Expected 157.2 59.9 17.5 11.3
CFA fireguard
Count 117 26 15 5 163
Expected 104.2 39.7 11.6 7.5
CFA workbook
Count 185 47 18 7 257
Expected 164.3 62.6 18.3 11.9
DSE website Count 34 9 2 5 50
Expected 32.0 12.2 3.6 2.3
Vic Bushfire Info Line
Count 14 6 0 1 21
Expected 13.4 5.1 1.5 1.0
Television Count 106 73 19 11 209
Expected 133.6 50.9 14.9 9.6
Other Count 54 23 4 5 86
Expected 55.0 21.0 6.1 4.0
Did not get any information
Count 26 14 5 11 56
Expected 35.8 13.6 4.0 2.6
Total Count 1178 449 131 85 1843

REPORT NO. A.000.000
199
Q10 by Q29.15 Obtained a battery-powered radio (Which of the following had you done to prepare for bushfires?)
A significant association was found between these items.
2 = 62.355 P = 0.01 Prior to Feb 7 On Feb 7
Action not taken
Prior to and on Feb 7 Total
ABC Radio Count 260 10 15 6 291
Expected 252.6 14.1 15.2 9.1
Other Radio Count 33 5 0 2 40
Expected 34.7 1.9 2.1 1.3
Emergency personnel
Count 119 10 6 7 142
Expected 123.3 6.9 7.4 4.5
Friends, family or neighbours
Count 155 10 8 8 181
Expected 157.1 8.8 9.4 5.7
CFA website Count 133 6 9 1 149
Expected 129.3 7.2 7.8 4.7
CFA community meetings
Count 211 17 14 11 253
Expected 219.6 12.3 13.2 7.9
CFA fireguard
Count 146 4 13 3 166
Expected 144.1 8.1 8.6 5.2
CFA workbook
Count 264 11 16 3 294
Expected 255.2 14.3 15.3 9.2
DSE website Count 47 3 2 2 54
Expected 46.9 2.6 2.8 1.7
Vic Bushfire Info Line
Count 21 0 0 0 21
Expected 18.2 1.0 1.1 0.7
Television Count 188 12 13 8 221
Expected 191.8 10.7 11.5 6.9
Other Count 77 6 4 5 92
Expected 79.9 4.5 4.8 2.9
Did not get any information
Count 62 2 3 6 73
Expected 63.4 3.5 3.8 2.3
Total Count 1716 96 103 62 1977

REPORT NO. A.000.000
200
Q10 by Q29.16 Stored important documents and possessions off-site or in a fire safe compartment (Which of the following had you done to prepare for bushfires?)
A significant association was found between these items.
2 = 71.272 P = 0.001 Prior to Feb 7 On Feb 7
Action not taken
Prior to and on Feb 7 Total
ABC Radio Count 124 53 10 9 196
Expected 124.3 51.6 13.2 7.0
Other Radio Count 29 8 4 1 42
Expected 26.6 11.1 2.8 1.5
Emergency personnel
Count 70 24 8 2 104
Expected 65.9 27.4 7.0 3.7
Friends, family or neighbours
Count 84 39 8 3 134
Expected 85.0 35.3 9.0 4.8
CFA website Count 64 25 7 4 100
Expected 63.4 26.3 6.7 3.6
CFA community meetings
Count 119 50 15 5 189
Expected 119.8 49.7 12.7 6.7
CFA fireguard
Count 65 25 9 4 103
Expected 65.3 27.1 6.9 3.7
CFA workbook
Count 124 41 14 5 184
Expected 116.7 48.4 12.4 6.6
DSE website Count 29 7 3 4 43
Expected 27.3 11.3 2.9 1.5
Vic Bushfire Info Line
Count 15 6 1 0 22
Expected 13.9 5.8 1.5 0.8
Television Count 118 59 8 8 193
Expected 122.4 50.8 13.0 6.9
Other Count 39 19 6 4 68
Expected 43.1 17.9 4.6 2.4
Did not get any information
Count 26 20 3 2 51
Expected 32.3 13.4 3.4 1.8
Total Count 906 376 96 51 1429

REPORT NO. A.000.000
201

REPORT NO. A.000.000
202
Q10 by Q30 How would you rate your preparedness for the February 7th bushfire?
Levels of preparedness were rated as high for residents who obtained information from the CFA fireguard.
Those who procured their information from television were far more likely to rate their preparation as
average or low. And a third of those who did not receive any information rated their preparation as low.
2 = 209.66 P < 0.001 High Average Low Total
ABC Radio Count 231 160 53 444
Expected 224.5 162.8 56.8
Other Radio Count 39 38 10 87
Expected 44.0 31.9 11.1
Emergency personnel
Count 116 89 15 220
Expected 111.2 80.6 28.1
Friends, family or neighbours
Count 148 125 45 318
Expected 160.8 116.6 40.7
CFA website Count 124 64 31 219
Expected 110.7 80.3 28.0
CFA community meetings
Count 205 149 37 391
Expected 197.7 143.3 50.0
CFA fireguard
Count 145 75 12 232
Expected 117.3 85.0 29.7
CFA workbook
Count 228 152 52 432
Expected 218.4 158.4 55.2
DSE website Count 47 30 6 83
Expected 42.0 30.4 10.6
Vic Bushfire Info Line
Count 24 11 3 38
Expected 19.2 13.9 4.9
Television Count 183 193 73 449
Expected 227.0 164.6 57.4
Other Count 89 54 23 166
Expected 83.9 60.8 21.2
Did not get any information
Count 54 44 53 151
Expected 76.3 55.4 19.3
Total Count 1633 1184 413 3230

REPORT NO. A.000.000
203
Q11. In the 12 months before the February 7th bushfire, did you get any information about what to do during a bushfire from any of the following?
Q11 by Q26 Which of the following best describes your level of planning for bushfires BEFORE February 7th? (Multiple Choice)
Those who did not receive any information of what to do during a bushfire bushfires were overrepresented
in the categories of having no plans or being undecided in what they should do. Individuals who received
information of what to do from television were overrepresented in the categories of ‘Knew I should
consider it but didn't’ and ‘Considered it and was still deciding’. Most residents had made a firm plan of
what they were going to do. Most frequently the information came from ABC radio, television and the CFA
workbook.

REPORT NO. A.000.000
204
2 = 319.9 p < 0.001 Never thought about it
Knew I should
consider it but didn't
Considered it and was
still deciding
Considered it and
decided to do nothing
Decided what to do
and was planning it
Had a firm plan Other Total
ABC Radio Count 2 7 12 7 52 259 13 352
Expected 5.0 8.0 14.6 7.4 46.0 261.4 9.6
Other Radio Count 1 0 5 4 8 44 1 63
Expected 0.9 1.4 2.6 1.3 8.2 46.8 1.7
Emergency personnel
Count 1 3 7 3 21 133 3 171
Expected 2.4 3.9 7.1 3.6 22.3 127.0 4.7
Friends, family or neighbours
Count 1 3 9 6 37 174 10 240
Expected 3.4 5.4 10.0 5.1 31.3 178.2 6.5
CFA website Count 0 1 0 2 20 118 1 142
Expected 2.0 3.2 5.9 3.0 18.5 105.5 3.9
CFA community meetings
Count 2 5 12 2 48 270 7 346
Expected 4.9 7.8 14.4 7.3 45.2 257.0 9.4
CFA fireguard
Count 0 1 3 2 22 174 6 208
Expected 3.0 4.7 8.6 4.4 27.2 154.5 5.7
CFA workbook
Count 3 3 10 5 56 309 7 393
Expected 5.6 8.9 16.3 8.3 51.3 291.9 10.7
DSE website Count 0 1 0 1 2 34 2 40
Expected 0.6 0.9 1.7 0.8 5.2 29.7 1.1
Vic Bushfire Info Line
Count 0 1 1 0 2 14 1 19
Expected 0.3 0.4 0.8 0.4 2.5 14.1 0.5
Television Count 5 17 26 8 46 222 6 330
Expected 4.7 7.5 13.7 7.0 43.1 245.1 9.0
Other Count 2 2 5 5 8 89 3 114
Expected 1.6 2.6 4.7 2.4 14.9 84.7 3.1
Did not get any information
Count 20 15 18 10 18 94 11 186
Expected 2.6 4.2 7.7 3.9 24.3 138.1 5.1
Total Count 37 59 108 55 340 1934 71 2604

REPORT NO. A.000.000
205
Q11 by Q27 At the beginning of last summer, which of the following did you think you were MOST LIKELY to do if a bushfire occurred in your town or suburb? Select ONE only.
More people than expected would stay throughout the fire when they obtained information of what to do
during a bushfire from CFA community meetings. More than double the number of people expected would
wait and see when they received information from radio other than the ABC. Interestingly most people
who did not receive any information of what to do during a bushfire would stay through the fire, though
there was an overrepresentation from this category of people who would ‘Leave as soon as fire threatens’,
‘Wait for emergency services’ or ‘Hadn't thought about it’.

REPORT NO. A.000.000
206
2 = 199.11 p < 0.001
Stay
through
fire
Stay and
leave if
threat
Wait
and see
Wait for
emergency
services
Leave as
soon as fire
threatens
No at home
on high fire
danger days
Hadn't
thought
about it Other Total
ABC Radio Count 187 57 35 6 50 9 1 9 354
Expected 177.5 63.9 32.5 4.6 58.5 7.3 1.8 8.1
Other Radio Count 27 8 12 1 11 1 0 0 60
Expected 30.1 10.8 5.5 0.8 9.9 1.2 0.3 1.4
Emergency personnel
Count 83 28 19 2 28 4 0 5 169
Expected 84.7 30.5 15.5 2.2 27.9 3.5 0.8 3.9
Friends, family or neighbours
Count 119 44 22 1 45 6 1 7 245
Expected 122.8 44.2 22.5 3.2 40.5 5.0 1.2 5.6
CFA website Count 73 30 8 2 24 4 0 3 144
Expected 72.2 26.0 13.2 1.9 23.8 3.0 0.7 3.3
CFA community meetings
Count 189 61 26 6 54 8 0 8 352
Expected 176.5 63.5 32.3 4.6 58.2 7.2 1.7 8.0
CFA fireguard
Count 128 33 13 1 20 3 0 6 204
Expected 102.3 36.8 18.7 2.6 33.7 4.2 1.0 4.7
CFA workbook
Count 210 72 29 4 65 7 0 10 397
Expected 199.0 71.6 36.4 5.1 65.6 8.2 2.0 9.1
DSE website Count 18 9 2 0 9 2 0 2 42
Expected 21.1 7.6 3.9 0.5 6.9 0.9 0.2 1.0
Vic Bushfire Info Line
Count 7 7 1 0 6 1 0 1 23
Expected 11.5 4.1 2.1 0.3 3.8 0.5 0.1 0.5
Television Count 129 76 44 4 64 7 1 5 330
Expected 165.4 59.5 30.3 4.3 54.5 6.8 1.6 7.5
Other Count 63 23 11 0 11 2 2 4 116
Expected 58.2 20.9 10.6 1.5 19.2 2.4 0.6 2.6
Did not get any information
Count 84 26 19 7 47 0 8 0 191
Expected 95.8 34.5 17.5 2.5 31.6 3.9 0.9 4.4
Total Count 1317 474 241 34 434 54 13 60 2627

REPORT NO. A.000.000
207
Q11 by Q29.1 Cleared leaves, twigs and long grass for a distance
of about 20-30m around the house (Which of the following had you done to
prepare for bushfires?)
An overrepresentation of residents who procured information of what to do during a bushfire from the
CFA website took no action in clearing around their home.
2 = 96.34 P < 0.001 Prior to Feb 7 On Feb 7
Action not taken
Prior to and on Feb 7 Total
ABC Radio Count 282 0 55 4 341
Expected 275.7 3.5 56.7 5.1
Other Radio Count 47 1 9 2 59
Expected 47.7 0.6 9.8 0.9
Emergency personnel
Count 139 2 26 1 168
Expected 135.8 1.7 28.0 2.5
Friends, family or neighbours
Count 191 5 40 6 242
Expected 195.7 2.5 40.3 3.6
CFA website Count 105 1 36 0 142
Expected 114.8 1.4 23.6 2.1
CFA community meetings
Count 269 6 63 3 341
Expected 275.7 3.5 56.7 5.1
CFA fireguard
Count 166 1 42 2 211
Expected 170.6 2.1 35.1 3.1
CFA workbook
Count 317 4 67 5 393
Expected 317.8 4.0 65.4 5.8
DSE website Count 32 0 7 0 39
Expected 31.5 0.4 6.5 0.6
Vic Bushfire Info Line
Count 15 0 5 0 20
Expected 16.2 0.2 3.3 0.3
Television Count 257 4 46 8 315
Expected 254.7 3.2 52.4 4.7
Other Count 99 0 16 2 117
Expected 94.6 1.2 19.5 1.7
Did not get any information
Count 151 2 14 5 172
Expected 139.1 1.7 28.6 2.6
Total Count 2070 26 426 38 2560
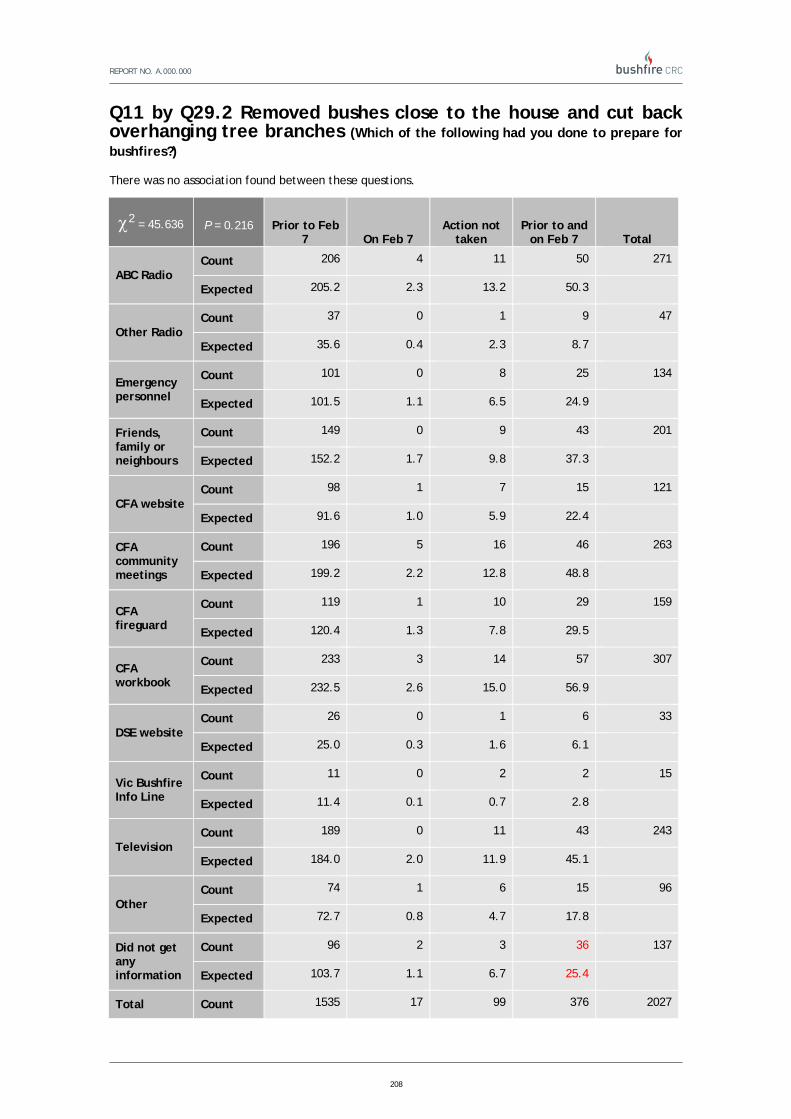
REPORT NO. A.000.000
208
Q11 by Q29.2 Removed bushes close to the house and cut back overhanging tree branches (Which of the following had you done to prepare for bushfires?)
There was no association found between these questions.
2 = 45.636 P = 0.216 Prior to Feb 7 On Feb 7
Action not taken
Prior to and on Feb 7 Total
ABC Radio Count 206 4 11 50 271
Expected 205.2 2.3 13.2 50.3
Other Radio Count 37 0 1 9 47
Expected 35.6 0.4 2.3 8.7
Emergency personnel
Count 101 0 8 25 134
Expected 101.5 1.1 6.5 24.9
Friends, family or neighbours
Count 149 0 9 43 201
Expected 152.2 1.7 9.8 37.3
CFA website Count 98 1 7 15 121
Expected 91.6 1.0 5.9 22.4
CFA community meetings
Count 196 5 16 46 263
Expected 199.2 2.2 12.8 48.8
CFA fireguard
Count 119 1 10 29 159
Expected 120.4 1.3 7.8 29.5
CFA workbook
Count 233 3 14 57 307
Expected 232.5 2.6 15.0 56.9
DSE website Count 26 0 1 6 33
Expected 25.0 0.3 1.6 6.1
Vic Bushfire Info Line
Count 11 0 2 2 15
Expected 11.4 0.1 0.7 2.8
Television Count 189 0 11 43 243
Expected 184.0 2.0 11.9 45.1
Other Count 74 1 6 15 96
Expected 72.7 0.8 4.7 17.8
Did not get any information
Count 96 2 3 36 137
Expected 103.7 1.1 6.7 25.4
Total Count 1535 17 99 376 2027

REPORT NO. A.000.000
209
Q11 by Q29.3 Used landscaping or the layout of garden to reduce the fire risk (Which of the following had you done to prepare for bushfires?) An association was found between where information was gained from of what to do during in a bushfire
and the use of landscaping to reduce fire risk. Most residents took this action prior to February 7.
2 = 72.353 P = 0.001 Prior to Feb 7 On Feb 7
Action not taken
Prior to and on Feb 7 Total
ABC Radio Count 215 2 8 27 252
Expected 204.1 3.6 6.4 37.8
Other Radio Count 37 0 2 4 43
Expected 34.8 0.6 1.1 6.5
Emergency personnel
Count 107 5 3 19 134
Expected 108.6 1.9 3.4 20.1
Friends, family or neighbours
Count 144 3 5 28 180
Expected 145.8 2.6 4.6 27.0
CFA website Count 86 1 2 16 105
Expected 85.1 1.5 2.7 15.8
CFA community meetings
Count 189 5 7 34 235
Expected 190.4 3.4 6.0 35.3
CFA fireguard
Count 122 0 6 28 156
Expected 126.4 2.2 4.0 23.4
CFA workbook
Count 240 3 6 41 290
Expected 234.9 4.2 7.4 43.5
DSE website Count 22 0 0 6 28
Expected 22.7 0.4 0.7 4.2
Vic Bushfire Info Line
Count 13 1 0 2 16
Expected 13.0 0.2 0.4 2.4
Television Count 176 3 5 37 221
Expected 179.0 3.2 5.6 33.2
Other Count 82 2 2 6 92
Expected 74.5 1.3 2.3 13.8
Did not get any information
Count 90 2 2 34 128
Expected 103.7 1.8 3.3 19.2
Total Count 1523 27 48 282 1880

REPORT NO. A.000.000
210
Q11 by Q29.4 Moved combustible materials such as firewood and wooden garden furniture away from the house (Which of the following had you done to prepare for bushfires?)
There was a significant association between sources of information respondents used for what to do during
a bushfire and moving combustible materials.
2 = 132.44 P < 0.001 Prior to Feb 7 On Feb 7
Action not taken
Prior to and on Feb 7 Total
ABC Radio Count 162 55 39 21 277
Expected 156.2 62.9 37.7 20.2
Other Radio Count 23 8 7 3 41
Expected 23.1 9.3 5.6 3.0
Emergency personnel
Count 76 28 24 12 140
Expected 79.0 31.8 19.0 10.2
Friends, family or neighbours
Count 105 53 29 9 196
Expected 110.5 44.5 26.7 14.3
CFA website Count 65 25 30 6 126
Expected 71.1 28.6 17.1 9.2
CFA community meetings
Count 152 77 33 22 284
Expected 160.2 64.5 38.6 20.7
CFA fireguard
Count 96 43 30 10 179
Expected 100.9 40.7 24.3 13.1
CFA workbook
Count 185 87 45 16 333
Expected 187.8 75.6 45.3 24.3
DSE website Count 20 10 5 2 37
Expected 20.9 8.4 5.0 2.7
Vic Bushfire Info Line
Count 15 2 2 1 20
Expected 11.3 4.5 2.7 1.5
Television Count 145 55 22 20 242
Expected 136.5 55.0 32.9 17.7
Other Count 67 16 9 5 97
Expected 54.7 22.0 13.2 7.1
Did not get any information
Count 71 17 10 26 124
Expected 69.9 28.2 16.9 9.1
Total Count 1182 476 285 153 2096

REPORT NO. A.000.000
211
Q11 by Q29.5 Cleared gutters of leaves (Which of the following had you done to prepare for bushfires?)
There was no association found between these questions.
2 = 48.12 P = 0.15 Prior to Feb 7 On Feb 7
Action not taken
Prior to and on Feb 7 Total
ABC Radio Count 260 15 53 15 343
Expected 262.8 14.6 51.6 14.0
Other Radio Count 49 1 9 1 60
Expected 46.0 2.6 9.0 2.5
Emergency personnel
Count 135 13 24 3 175
Expected 134.1 7.4 26.3 7.2
Friends, family or neighbours
Count 178 13 32 10 233
Expected 178.5 9.9 35.0 9.5
CFA website Count 105 3 28 8 144
Expected 110.3 6.1 21.6 5.9
CFA community meetings
Count 253 15 56 12 336
Expected 257.5 14.3 50.5 13.8
CFA fireguard
Count 145 8 40 10 203
Expected 155.5 8.6 30.5 8.3
CFA workbook
Count 299 16 60 18 393
Expected 301.1 16.7 59.1 16.1
DSE website Count 34 0 6 2 42
Expected 32.2 1.8 6.3 1.7
Vic Bushfire Info Line
Count 18 1 3 0 22
Expected 16.9 0.9 3.3 0.9
Television Count 242 15 38 13 308
Expected 236.0 13.1 46.3 12.6
Other Count 100 0 13 4 117
Expected 89.6 5.0 17.6 4.8
Did not get any information
Count 129 8 20 8 165
Expected 126.4 7.0 24.8 6.8
Total Count 1947 108 382 104 2541

REPORT NO. A.000.000
212
Q11 by Q29.6 Installed gutter protection (Which of the following had you done to prepare for bushfires?)
An association was found between these two items. Most people prepared for this before Feb 7, and very
few people did not install any gutter protection.
2 = 65.705 P = 0.005 Prior to Feb 7 On Feb 7
Action not taken
Prior to and on Feb 7 Total
ABC Radio Count 72 14 5 21 112
Expected 74.3 10.5 4.3 23.0
Other Radio Count 8 2 1 9 20
Expected 13.3 1.9 0.8 4.1
Emergency personnel
Count 45 8 2 15 70
Expected 46.4 6.5 2.7 14.4
Friends, family or neighbours
Count 47 6 2 16 71
Expected 47.1 6.6 2.7 14.6
CFA website Count 37 3 2 5 47
Expected 31.2 4.4 1.8 9.6
CFA community meetings
Count 81 16 5 23 125
Expected 82.9 11.7 4.8 25.6
CFA fireguard
Count 42 4 2 12 60
Expected 39.8 5.6 2.3 12.3
CFA workbook
Count 93 12 6 18 129
Expected 85.5 12.1 4.9 26.4
DSE website Count 11 1 0 1 13
Expected 8.6 1.2 0.5 2.7
Vic Bushfire Info Line
Count 6 1 2 2 11
Expected 7.3 1.0 0.4 2.3
Television Count 62 6 2 23 93
Expected 61.7 8.7 3.6 19.1
Other Count 24 3 1 5 33
Expected 21.9 3.1 1.3 6.8
Did not get any information
Count 25 2 2 21 50
Expected 33.2 4.7 1.9 10.3
Total Count 553 78 32 171 834

REPORT NO. A.000.000
213
Q11 by Q29.7 Covered underfloor spaces to prevent embers and flame entering (Which of the following had you done to prepare for bushfires?)
There was no association found between these two items.
2 = 33.713 P = 0.709 Prior to Feb 7 On Feb 7
Action not taken
Prior to and on Feb 7 Total
ABC Radio Count 49 11 2 130 192
Expected 59.7 12.1 2.1 118.1
Other Radio Count 9 3 1 20 33
Expected 10.3 2.1 0.4 20.3
Emergency personnel
Count 35 5 0 61 101
Expected 31.4 6.3 1.1 62.1
Friends, family or neighbours
Count 42 10 3 77 132
Expected 41.0 8.3 1.5 81.2
CFA website Count 33 4 1 49 87
Expected 27.0 5.5 1.0 53.5
CFA community meetings
Count 59 15 3 131 208
Expected 64.6 13.1 2.3 128.0
CFA fireguard
Count 45 6 2 72 125
Expected 38.8 7.9 1.4 76.9
CFA workbook
Count 71 14 3 133 221
Expected 68.7 13.9 2.5 136.0
DSE website Count 12 2 0 15 29
Expected 9.0 1.8 0.3 17.8
Vic Bushfire Info Line
Count 5 1 0 4 10
Expected 3.1 0.6 0.1 6.2
Television Count 43 10 1 98 152
Expected 47.2 9.6 1.7 93.5
Other Count 22 2 0 47 71
Expected 22.1 4.5 0.8 43.7
Did not get any information
Count 20 7 0 44 71
Expected 22.1 4.5 0.8 43.7
Total Count 445 90 16 881 1432

REPORT NO. A.000.000
214
Q11 by Q29.8 Covered all gaps and vents to reduce the risk of embers entering the house or cavities (e.g. roof, wall, etc.) (Which of the following had you done to prepare for bushfires?)
An association was found between sources of information of what to do during a bushfire and when action
was taken to cover gaps and vents. Very few people did not take this action.
2 = 67.87 P = 0.003 Prior to Feb 7 On Feb 7
Action not taken
Prior to and on Feb 7 Total
ABC Radio Count 83 27 3 37 150
Expected 74.9 35.6 4.2 35.2
Other Radio Count 10 8 1 6 25
Expected 12.5 5.9 0.7 5.9
Emergency personnel
Count 39 16 2 25 82
Expected 40.9 19.5 2.3 19.3
Friends, family or neighbours
Count 42 33 2 24 101
Expected 50.4 24.0 2.9 23.7
CFA website Count 40 15 6 14 75
Expected 37.4 17.8 2.1 17.6
CFA community meetings
Count 68 45 7 37 157
Expected 78.4 37.3 4.4 36.9
CFA fireguard
Count 59 21 4 19 103
Expected 51.4 24.5 2.9 24.2
CFA workbook
Count 84 48 4 35 171
Expected 85.3 40.6 4.8 40.2
DSE website Count 16 3 0 4 23
Expected 11.5 5.5 0.7 5.4
Vic Bushfire Info Line
Count 9 2 0 2 13
Expected 6.5 3.1 0.4 3.1
Television Count 56 27 1 33 117
Expected 58.4 27.8 3.3 27.5
Other Count 31 9 0 9 49
Expected 24.5 11.6 1.4 11.5
Did not get any information
Count 28 15 2 21 66
Expected 32.9 15.7 1.9 15.5
Total Count 565 269 32 266 1132

REPORT NO. A.000.000
215
Q11 by Q29.9 Obtained and prepared fire fighting equipment (e.g. hoses and a pump) (Which of the following had you done to prepare for bushfires?)
The number of people who did not receive any information on what to do during a bushfire but still
obtained fire fighting equipment on February 7 was four times the number expected.
2 = 116.87 P < 0.001 Prior to Feb 7 On Feb 7
Action not taken
Prior to and on Feb 7 Total
ABC Radio Count 200 9 40 8 257
Expected 193.9 11.7 41.5 9.9
Other Radio Count 26 1 8 0 35
Expected 26.4 1.6 5.7 1.3
Emergency personnel
Count 96 3 20 9 128
Expected 96.5 5.8 20.7 4.9
Friends, family or neighbours
Count 118 8 37 7 170
Expected 128.2 7.7 27.5 6.6
CFA website Count 87 1 19 2 109
Expected 82.2 5.0 17.6 4.2
CFA community meetings
Count 203 11 39 12 265
Expected 199.9 12.1 42.8 10.2
CFA fireguard
Count 130 4 30 5 169
Expected 127.5 7.7 27.3 6.5
CFA workbook
Count 231 11 42 10 294
Expected 221.8 13.4 47.5 11.3
DSE website Count 24 1 3 2 30
Expected 22.6 1.4 4.9 1.2
Vic Bushfire Info Line
Count 11 0 3 0 14
Expected 10.6 0.6 2.3 0.5
Television Count 136 12 35 11 194
Expected 146.3 8.8 31.4 7.5
Other Count 77 3 13 1 94
Expected 70.9 4.3 15.2 3.6
Did not get any information
Count 70 21 13 5 109
Expected 82.2 5.0 17.6 4.2
Total Count 1409 85 302 72 1868

REPORT NO. A.000.000
216
Q11 by Q29.10 Obtained and prepared equipment such as ladder, buckets and mops to put out spot fires (Which of the following had you done to prepare for bushfires?)
Those who did not receive any information of what to do during a bushfire were just as likely to prepare
spot fire equipment on February 7 and prior to that day.
2 = 109.08 P < 0.001 Prior to Feb 7 On Feb 7
Action not taken
Prior to and on Feb 7 Total
ABC Radio Count 150 66 55 6 277
Expected 145.9 69.3 53.8 8.0
Other Radio Count 25 13 7 2 47
Expected 24.8 11.8 9.1 1.4
Emergency personnel
Count 75 33 26 8 142
Expected 74.8 35.6 27.6 4.1
Friends, family or neighbours
Count 88 54 43 5 190
Expected 100.1 47.6 36.9 5.5
CFA website Count 73 17 32 3 125
Expected 65.8 31.3 24.3 3.6
CFA community meetings
Count 151 76 56 7 290
Expected 152.7 72.6 56.3 8.3
CFA fireguard
Count 102 36 37 3 178
Expected 93.7 44.6 34.6 5.1
CFA workbook
Count 178 86 66 7 337
Expected 177.5 84.4 65.5 9.7
DSE website Count 21 6 5 3 35
Expected 18.4 8.8 6.8 1.0
Vic Bushfire Info Line
Count 14 0 3 1 18
Expected 9.5 4.5 3.5 0.5
Television Count 113 71 38 9 231
Expected 121.6 57.8 44.9 6.6
Other Count 59 18 21 1 99
Expected 52.1 24.8 19.2 2.8
Did not get any information
Count 49 46 16 5 116
Expected 61.1 29.0 22.5 3.3
Total Count 1098 522 405 60 2085

REPORT NO. A.000.000
217
Q11 by Q29.11 Installed seals and/or draft protectors around windows and doors (Which of the following had you done to prepare for bushfires?)
There was no association between these variables.
2 = 48.279 P = 0.147 Prior to Feb 7 On Feb 7
Action not taken
Prior to and on Feb 7 Total
ABC Radio Count 99 25 5 12 141
Expected 96.8 22.5 5.7 16.0
Other Radio Count 14 4 1 1 20
Expected 13.7 3.2 0.8 2.3
Emergency personnel
Count 49 10 4 13 76
Expected 52.2 12.1 3.1 8.6
Friends, family or neighbours
Count 61 21 3 8 93
Expected 63.8 14.8 3.8 10.6
CFA website Count 57 6 4 9 76
Expected 52.2 12.1 3.1 8.6
CFA community meetings
Count 93 24 3 21 141
Expected 96.8 22.5 5.7 16.0
CFA fireguard
Count 62 15 5 9 91
Expected 62.5 14.5 3.7 10.3
CFA workbook
Count 125 27 5 17 174
Expected 119.5 27.8 7.0 19.8
DSE website Count 14 1 1 2 18
Expected 12.4 2.9 0.7 2.0
Vic Bushfire Info Line
Count 8 1 1 1 11
Expected 7.6 1.8 0.4 1.3
Television Count 81 23 4 13 121
Expected 83.1 19.3 4.9 13.8
Other Count 40 9 4 4 57
Expected 39.1 9.1 2.3 6.5
Did not get any information
Count 46 8 4 14 72
Expected 49.4 11.5 2.9 8.2
Total Count 749 174 44 124 1091

REPORT NO. A.000.000
218
Q11 by Q29.12 Installed a sprinkler system on or around the house (Which of the following had you done to prepare for bushfires?)
There was no association between these variables.
2 = 48.696 P = 0.137 Prior to Feb 7 On Feb 7
Action not taken
Prior to and on Feb 7 Total
ABC Radio Count 89 12 7 11 119
Expected 85.1 12.7 8.4 12.7
Other Radio Count 11 4 2 3 20
Expected 14.3 2.1 1.4 2.1
Emergency personnel
Count 37 4 5 10 56
Expected 40.1 6.0 4.0 6.0
Friends, family or neighbours
Count 61 12 8 12 93
Expected 66.5 9.9 6.6 9.9
CFA website Count 44 5 2 5 56
Expected 40.1 6.0 4.0 6.0
CFA community meetings
Count 94 14 6 12 126
Expected 90.2 13.5 8.9 13.5
CFA fireguard
Count 64 5 7 5 81
Expected 58.0 8.7 5.7 8.7
CFA workbook
Count 103 11 11 8 133
Expected 95.2 14.2 9.4 14.2
DSE website Count 13 2 0 5 20
Expected 14.3 2.1 1.4 2.1
Vic Bushfire Info Line
Count 10 1 0 1 12
Expected 8.6 1.3 0.8 1.3
Television Count 67 12 6 11 96
Expected 68.7 10.3 6.8 10.3
Other Count 30 4 4 5 43
Expected 30.8 4.6 3.0 4.6
Did not get any information
Count 26 11 6 9 52
Expected 37.2 5.6 3.7 5.6
Total Count 649 97 64 97 907

REPORT NO. A.000.000
219
Q11 by Q29.13 Installed shutters (Which of the following had you done to prepare for bushfires?)
No significant association was found between these items, with a small response rate.
2 = 42.347 P = 0.329 Prior to Feb 7 On Feb 7
Action not taken
Prior to and on Feb 7 Total
ABC Radio Count 12 2 1 22 37
Expected 10.1 1.4 0.9 24.7
Other Radio Count 2 0 0 5 7
Expected 1.9 0.3 0.2 4.7
Emergency personnel
Count 6 0 0 19 25
Expected 6.8 0.9 0.6 16.7
Friends, family or neighbours
Count 9 1 0 20 30
Expected 8.2 1.1 0.7 20.0
CFA website Count 4 0 0 11 15
Expected 4.1 0.6 0.4 10.0
CFA community meetings
Count 12 3 2 31 48
Expected 13.1 1.8 1.1 32.0
CFA fireguard
Count 6 0 1 13 20
Expected 5.4 0.7 0.5 13.3
CFA workbook
Count 12 0 2 24 38
Expected 10.3 1.4 0.9 25.3
DSE website Count 1 0 0 5 6
Expected 1.6 0.2 0.1 4.0
Vic Bushfire Info Line
Count 2 0 0 0 2
Expected 0.5 0.1 0.0 1.3
Television Count 4 2 0 25 31
Expected 8.4 1.2 0.7 20.7
Other Count 4 2 1 6 13
Expected 3.5 0.5 0.3 8.7
Did not get any information
Count 6 1 0 15 22
Expected 6.0 0.8 0.5 14.7
Total Count 80 11 7 196 294
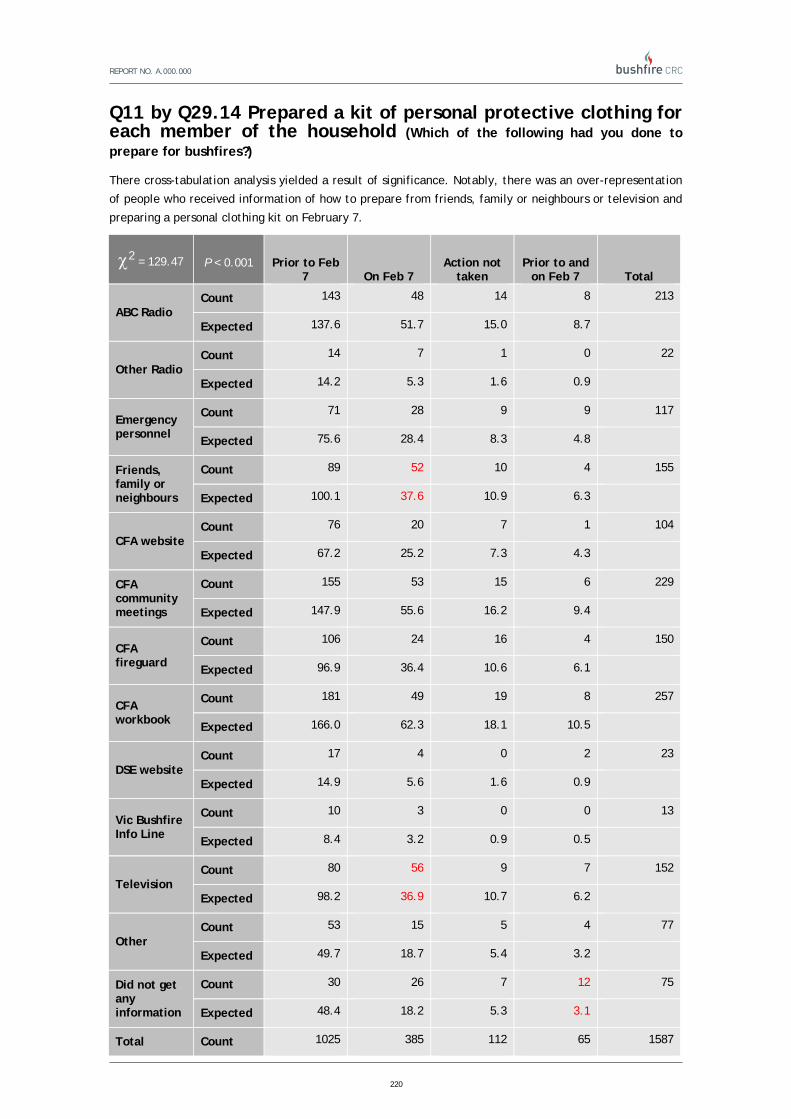
REPORT NO. A.000.000
220
Q11 by Q29.14 Prepared a kit of personal protective clothing for each member of the household (Which of the following had you done to prepare for bushfires?)
There cross-tabulation analysis yielded a result of significance. Notably, there was an over-representation
of people who received information of how to prepare from friends, family or neighbours or television and
preparing a personal clothing kit on February 7.
2 = 129.47 P < 0.001 Prior to Feb 7 On Feb 7
Action not taken
Prior to and on Feb 7 Total
ABC Radio Count 143 48 14 8 213
Expected 137.6 51.7 15.0 8.7
Other Radio Count 14 7 1 0 22
Expected 14.2 5.3 1.6 0.9
Emergency personnel
Count 71 28 9 9 117
Expected 75.6 28.4 8.3 4.8
Friends, family or neighbours
Count 89 52 10 4 155
Expected 100.1 37.6 10.9 6.3
CFA website Count 76 20 7 1 104
Expected 67.2 25.2 7.3 4.3
CFA community meetings
Count 155 53 15 6 229
Expected 147.9 55.6 16.2 9.4
CFA fireguard
Count 106 24 16 4 150
Expected 96.9 36.4 10.6 6.1
CFA workbook
Count 181 49 19 8 257
Expected 166.0 62.3 18.1 10.5
DSE website Count 17 4 0 2 23
Expected 14.9 5.6 1.6 0.9
Vic Bushfire Info Line
Count 10 3 0 0 13
Expected 8.4 3.2 0.9 0.5
Television Count 80 56 9 7 152
Expected 98.2 36.9 10.7 6.2
Other Count 53 15 5 4 77
Expected 49.7 18.7 5.4 3.2
Did not get any information
Count 30 26 7 12 75
Expected 48.4 18.2 5.3 3.1
Total Count 1025 385 112 65 1587

REPORT NO. A.000.000
221
Q11 by Q29.15 Obtained a battery-powered radio (Which of the following had you done to prepare for bushfires?)
Residents who procured information of what to do during a bushfire from emergency personnel had an
overrepresentation of people who obtained battery powered radios prior to and on February 7.
2 = 59.951 P = 0.017 Prior to Feb 7 On Feb 7
Action not taken
Prior to and on Feb 7 Total
ABC Radio Count 219 9 13 7 248
Expected 214.3 11.0 14.0 8.8
Other Radio Count 25 1 0 1 27
Expected 23.3 1.2 1.5 1.0
Emergency personnel
Count 92 6 5 10 113
Expected 97.6 5.0 6.4 4.0
Friends, family or neighbours
Count 127 8 10 9 154
Expected 133.0 6.8 8.7 5.4
CFA website Count 99 4 6 0 109
Expected 94.2 4.8 6.2 3.9
CFA community meetings
Count 199 15 13 10 237
Expected 204.8 10.5 13.4 8.4
CFA fireguard
Count 141 3 13 2 159
Expected 137.4 7.0 9.0 5.6
CFA workbook
Count 254 11 17 4 286
Expected 247.1 12.6 16.2 10.1
DSE website Count 24 1 0 1 26
Expected 22.5 1.1 1.5 0.9
Vic Bushfire Info Line
Count 15 0 0 0 15
Expected 13.0 0.7 0.8 0.5
Television Count 140 10 12 7 169
Expected 146.0 7.5 9.6 6.0
Other Count 67 3 5 4 79
Expected 68.3 3.5 4.5 2.8
Did not get any information
Count 65 4 2 5 76
Expected 65.7 3.4 4.3 2.7
Total Count 1467 75 96 60 1698

REPORT NO. A.000.000
222

REPORT NO. A.000.000
223
Q11 by Q29.16 Stored important documents and possessions off-site or in a fire safe compartment (Which of the following had you done to prepare for bushfires?)
Residents who did not receive any information of what to do during a bushfire had an overrepresentation
of people who stored documents on February 7.
2 = 77.356 P < 0.001 Prior to Feb 7 On Feb 7
Action not taken
Prior to and on Feb 7 Total
ABC Radio Count 109 40 8 7 164
Expected 106.2 41.9 10.5 5.4
Other Radio Count 22 6 2 0 30
Expected 19.4 7.7 1.9 1.0
Emergency personnel
Count 63 19 6 2 90
Expected 58.3 23.0 5.8 2.9
Friends, family or neighbours
Count 77 33 9 3 122
Expected 79.0 31.2 7.8 4.0
CFA website Count 54 13 5 4 76
Expected 49.2 19.4 4.9 2.5
CFA community meetings
Count 118 46 15 3 182
Expected 117.9 46.5 11.6 6.0
CFA fireguard
Count 64 22 9 3 98
Expected 63.5 25.0 6.3 3.2
CFA workbook
Count 116 44 11 4 175
Expected 113.4 44.7 11.2 5.7
DSE website Count 16 3 0 2 21
Expected 13.6 5.4 1.3 0.7
Vic Bushfire Info Line
Count 12 3 1 0 16
Expected 10.4 4.1 1.0 0.5
Television Count 92 50 8 7 157
Expected 101.7 40.1 10.0 5.1
Other Count 31 11 3 4 49
Expected 31.7 12.5 3.1 1.6
Did not get any information
Count 37 30 3 2 72
Expected 46.6 18.4 4.6 2.4
Total Count 811 320 80 41 1252

REPORT NO. A.000.000
224
Q11 by Q30 How would you rate your preparedness for the February 7th bushfire?
Information gained from the CFA fireguard lead to residents rating their level of preparedness as high. This
was not the case for people who obtained information on what to do during a bushfire from television or
did not receive any information where there was an overrepresentation of people who rated their level of
preparedness as low.
2 = 209.66 P < 0.001 High Average Low Total
ABC Radio Count 185 140 47 372
Expected 188.2 135.8 48.0
Other Radio Count 31 25 11 67
Expected 33.9 24.5 8.7
Emergency personnel
Count 94 78 9 181
Expected 91.5 66.1 23.4
Friends, family or neighbours
Count 128 97 30 255
Expected 129.0 93.1 32.9
CFA website Count 93 45 13 151
Expected 76.4 55.1 19.5
CFA community meetings
Count 190 137 35 362
Expected 183.1 132.1 46.8
CFA fireguard
Count 133 72 10 215
Expected 108.7 78.5 27.8
CFA workbook
Count 219 147 52 418
Expected 211.4 152.6 54.0
DSE website Count 26 15 2 43
Expected 21.7 15.7 5.6
Vic Bushfire Info Line
Count 15 6 2 23
Expected 11.6 8.4 3.0
Television Count 143 138 64 345
Expected 174.5 125.9 44.6
Other Count 74 38 16 128
Expected 64.7 46.7 16.5
Did not get any information
Count 67 71 66 204
Expected 103.2 74.5 26.3
Total Count 1398 1009 357 2764

REPORT NO. A.000.000
225
Q13. How did you FIRST find out that the February 7th bushfire was in your town or suburb?
Categories were combined for Q13 as follows:
Media consists of ‘Heard from radio announcement’, ‘Learned from the internet’ and ‘Saw television
announcement’
Direct contact consists of ‘Told by family, friends or neighbours’ and ‘Told by emergency personnel’
Physical signs of fire consists of ‘Smelled or saw smoke’, ‘Saw fire approaching’, ‘Saw embers landing near
house’ and ‘Saw fire burning near the house’
Q13 by Q17 Which official source was the MOST IMPORTANT in helping you to respond to the bushfire?
A near association was found between source of first fire knowledge and the most important official
source of information. Respondents who found out about the fire through media channels were more likely
to respond that the most important official source used to respond to the threat was the radio.
2 = 12.519 P = 0.051 Radio (ABC
and other)
Emergency
personnel
Website (CFA
and DSE)
CFA Community
meeting Total
Media
Count 40 1 5 6 52
Expected 35.4 7.9 4.4 4.4
Direct
contact
Count 50 18 7 9 84
Expected 57.1 12.8 7.1 7.1
Physical
signs of fire
Count 80 19 9 6 114
Expected 77.5 17.3 9.6 9.6
Total Count 170 38 21 21 250
*Q17. Television and Victorian Bushfire Information line were not included in this analysis as the total
count was less than 5
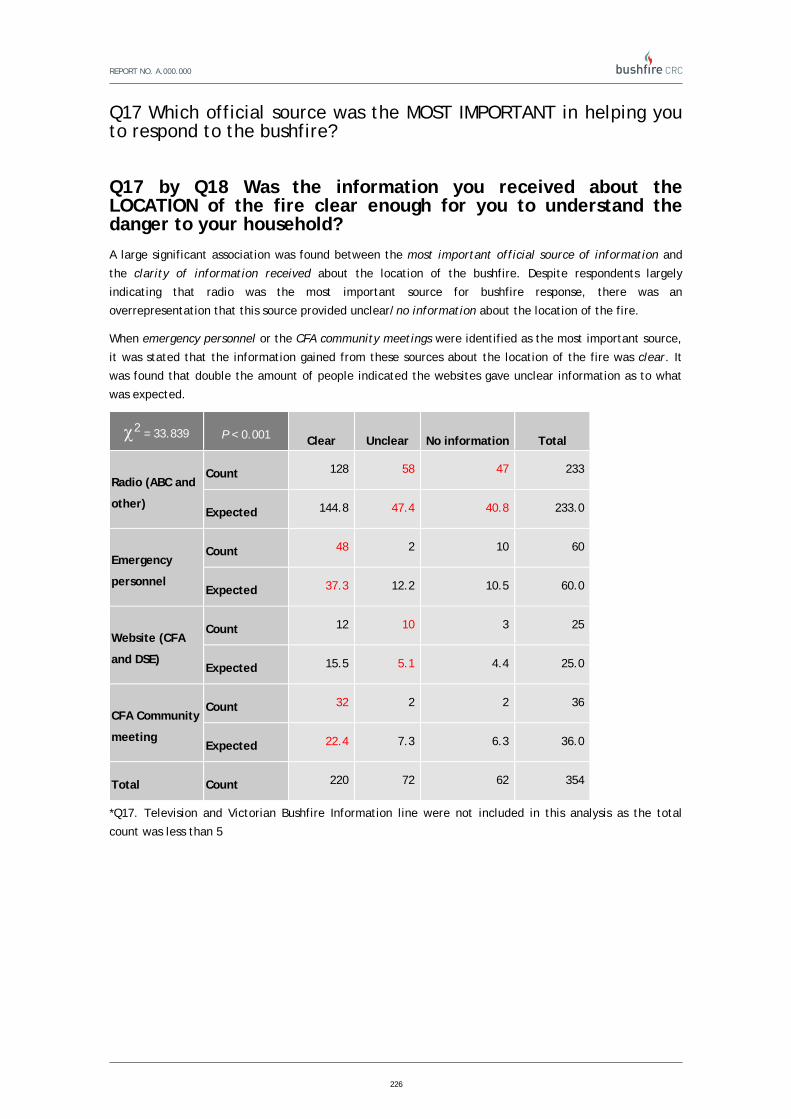
REPORT NO. A.000.000
226
Q17 Which official source was the MOST IMPORTANT in helping you to respond to the bushfire?
Q17 by Q18 Was the information you received about the LOCATION of the fire clear enough for you to understand the danger to your household?
A large significant association was found between the most important official source of information and
the clarity of information received about the location of the bushfire. Despite respondents largely
indicating that radio was the most important source for bushfire response, there was an
overrepresentation that this source provided unclear/no information about the location of the fire.
When emergency personnel or the CFA community meetings were identified as the most important source,
it was stated that the information gained from these sources about the location of the fire was clear. It
was found that double the amount of people indicated the websites gave unclear information as to what
was expected.
2 = 33.839 P < 0.001 Clear Unclear No information Total
Radio (ABC and
other)
Count 128 58 47 233
Expected 144.8 47.4 40.8 233.0
Emergency
personnel
Count 48 2 10 60
Expected 37.3 12.2 10.5 60.0
Website (CFA
and DSE)
Count 12 10 3 25
Expected 15.5 5.1 4.4 25.0
CFA Community
meeting
Count 32 2 2 36
Expected 22.4 7.3 6.3 36.0
Total Count 220 72 62 354
*Q17. Television and Victorian Bushfire Information line were not included in this analysis as the total
count was less than 5

REPORT NO. A.000.000
227
Q17 by Q19 Was the information you received about the SEVERITY of the fire clear enough for you to understand the danger to your household?
A highly significant association was found between the most important official source of information and
the clarity of information received about the severity of the bushfire. Despite respondents indicating that
the radio was the most important source for bushfire response, there was an overrepresentation in the No
information and Unclear categories.
When emergency personnel or the CFA community meetings were identified as the most important source,
it was stated that the information gained from these sources about the severity of the fire was clear
slightly above expectation.
2 = 36.302 P < 0.001 Clear Unclear No information Total
Radio (ABC
and other)
Count 118 50 62 230
Expected 135.4 41.4 53.2 230.0
Emergency
personnel
Count 50 2 10 62
Expected 36.5 11.2 14.3 62.0
Website
(CFA and
DSE)
Count 8 8 7 23
Expected 13.5 4.1 5.3 23.0
CFA
Community
meeting
Count 30 3 2 35
Expected 20.6 6.3 8.1 35.0
Total Count 206 63 81 350
*Q17. Television and Victorian Bushfire Information line were not included in this analysis as the total
count was less than 5

REPORT NO. A.000.000
228
Q17 by Q20 Did you receive the warning in enough time to respond to the bushfire safely?
This cross-tab reveals that there was a significant association between the most important official source
of information and the amount of time in which it gave to respond to the threat. When information about
the fire was gained from emergency personnel respondents were overrepresented in the just enough
category, suggesting respondents struggled for time to respond. Information gained from the website,
despite a small sample size, was nearly double the amount of people that were expected, stating they had
not enough time to respond. CFA community meetings were the only source of information that gave
respondents ample amount of time to respond to the bushfire threat well beyond expectation.
2 = 25.84 P < 0.001 Ample
Just
enough Not enough Total
Radio (ABC
and other)
Count 89 71 60 220
Expected 96.5 68.7 54.8
Emergency
personnel
Count 22 25 12 59
Expected 25.9 18.4 14.7
Website
(CFA and
DSE)
Count 9 3 9 21
Expected 9.2 6.6 5.2
CFA
Community
meeting
Count 26 5 2 33
Expected 14.5 10.3 8.2
Total Count 146 104 83 333
*Q17. Television and Victorian Bushfire Information line were not included in this analysis as the total
count was less than 5

REPORT NO. A.000.000
229
Q17 by Q21 How long AFTER you got the warning did the fire reach your house or property?
It was found that an association existed between the most important official source of information and the
length of time it took for the bushfire to reach the respondents property. Warnings from emergency
personnel or the website were most likely to result in respondents having less than an hour to respond to
the fire threat. Those who attended the CFA community meetings had greater than 2 hours to respond to
the bushfire threat.
2 = 39.448 P < 0.001 Less than
an hour
30 mins to
2 hours
More than 2
hours
The fire did
not reach
my house Total
Radio (ABC
and other)
Count 46 55 82 13 196
Expected 49.5 49.5 85.1 11.9
Emergency
personnel
Count 20 16 15 3 54
Expected 13.6 13.6 23.5 3.3
Website
(CFA and
DSE)
Count 8 3 6 2 19
Expected 4.8 4.8 8.3 1.2
CFA
Community
meeting
Count 1 1 26 0 28
Expected 7.1 7.1 12.2 1.7
Total Count 75 75 129 18 297
*Q17. Television and Victorian Bushfire Information line were not included in this analysis as the total
count was less than 5

REPORT NO. A.000.000
230
Q18. Was the information you received about the LOCATION of the fire clear enough for you to understand the danger to your household?
Q18 by Q19 Was the information you received about the SEVERITY of the fire clear enough for you to understand the danger to your household?
As expected, a significant association existed between those who received clear/unclear/no information
about the location of the fire also had clear/unclear/no information about the severity of the fire.
Interestingly, there were still some people who despite receiving clear information about the location of
the fire indicted they were given no information regarding its severity.
2 = 286.481 P < 0.001 Clear Unclear No information Total
Clear
Count 244 13 30 287
Expected 165.3 49.0 72.7
Unclear
Count 18 51 28 97
Expected 55.9 16.6 24.6
No information
Count 11 17 62 90
Expected 51.8 15.4 22.8
Total Count 273 81 120 474

REPORT NO. A.000.000
231
Q20. Did you receive the warning in enough time to respond to the bushfire safely?
Q20 by Q21 How long AFTER you got the warning did the fire reach your house or property?
A large association was found between the amount of warning a respondent received and the length of
time it took for the fire to reach their property. Respondents who had ample time to respond to the
bushfire threat stated the fire arrived at their property more than 2 hours later. Respondents who had just
enough time to respond to the bushfire threat had the fire arrive at their property between 30 minutes
and 2 hours later. Respondents who had not enough time to respond to the bushfire threat had the fire
arrive at their property less than 30 minutes later.
2 = 164.387 P < 0.001 Less than 30
minutes
30 mins to 2
hours
More than 2
hours
The fire did not
reach my house Total
Ample
Count 8 35 120 11 174
Expected 52.0 44.5 66.4 11.1
Just enough
Count 51 51 29 8 139
Expected 41.5 35.6 53.0 8.9
Not enough
Count 65 20 12 7 104
Expected 31.1 26.6 39.7 6.7
Don't know
Count 2 2 0 1 5
Expected 1.5 1.3 1.9 .3
Total Count 126 108 161 27 422

REPORT NO. A.000.000
232
9BSection 3: Before the bushfire
Q24. Before the February 7th bushfire, how likely did you think it was that a bushfire could occur in your town or suburb?
Q24 by Q25 Before the February 7th bushfire, how significant did you think the threat from bushfires was to life and property in your town or suburb?
In this cross-tabulation, we would expect an association, as those who believed a threat to their town was
likely would probably also believe that there was a threat to life and property. Any dissonance between
the responses to these two questions is of interest. Around 1/5 of respondents revealed this dissonance
which indicates that of those that rated it unlikely a bushfire would occur, 1/5th felt the danger was High;
and of those that rated a bushfire likely to occur, 1/5th felt the danger was Low to life and property.
2 = 384.776 P < 0.001 Low High Total
Unlikely
Count 217 53 270
Expected 84.6 185.4
Likely
Count 175 806 981
Expected 307.4 673.6
Total Count 392 859 1251
*’Had not thought about it’ was not included in this analysis as the total count was less than 5

REPORT NO. A.000.000
233
Q24 by Q26 Which of the following best describes your level of planning for bushfires BEFORE February 7th?
Those that believed a threat to their town was unlikely were over-represented in being under-prepared (i.e. no plan). However those that thought a threat was likely were over-
represented in having a firm plan. Clearly, those who believed a fire likely to be a threat also planned for bushfires before the day, however those that thought a fire unlikely
did not plan as expected. There is a clear association between opinion of a bushfire threat and peoples actions in terms of planning before February 7th.
2 = 172.516 P < 0.001 Never thought
about it
Knew I should
consider it but didn't
Considered it and
was still deciding
Considered it and
decided to do nothing
Decided what to do
and was planning it Had a firm plan Total
Unlikely
Count 25 19 22 24 34 122 246
Expected 6.2 8.3 13.7 6.8 34.8 176.2
Likely
Count 4 20 42 8 129 703 906
Expected 22.8 30.7 50.3 25.2 128.2 648.8
Total Count 29 39 64 32 163 825 1152

REPORT NO. A.000.000
234
Q24 by Q27 At the beginning of last summer, which of the following did you think you were MOST LIKELY to do if a bushfire occurred in your town or suburb? Select ONE only.
A little over half of those that thought that bushfire was likely to threaten their town had planned to stay throughout the fire. Interestingly, around the same proportion that
thought a bushfire unlikely to threaten their town were also most likely to stay throughout the fire at the beginning of last summer.
2 = 22.809 P = 0.001 Stay throughout
fire
Stay and leave
if threatened
Wait and
see fire
Wait for emergency
services
Leave as soon as
fire threatens
No at home on high
fire danger days
Hadn't thought
about it Total
Unlikely
Count 121 44 29 10 39 6 7 256
Expected 131.5 44.9 23.3 5.3 44.0 4.8 2.2
Likely
Count 477 160 77 14 161 16 3 908
Expected 466.5 159.1 82.7 18.7 156.0 17.2 7.8
Total Count 598 204 106 24 200 22 10 1164

REPORT NO. A.000.000
235
Q24 by Q29.1 Cleared leaves, twigs and long grass for a distance of about 20-30m around the house (Which of the following had you done to prepare for bushfires?)
A revealing finding from this table is that 1 in 7 respondents that thought that bushfire was likely to
threaten their town had not taken any action to clear leaves, twigs and long grass. Notably, a large
majority of respondents who thought a bushfire unlikely also took action to clear leaves, twigs and long
grass.
2 = 9.523 P = 0.023 Prior to Feb. 7 On Feb. 7
Action not
taken
Prior to and on
Feb. 7 Total
Unlikely
Count 203 2 27 9 241
Expected 201.4 2.1 33.5 4.0
Likely
Count 753 8 132 10 903
Expected 754.6 7.9 125.5 15.0
Total Count 956 10 159 19 1144

REPORT NO. A.000.000
236
Q24 by Q29.2 Removed bushes close to the house and cut back overhanging tree branches (Which of the following had you done to prepare for bushfires?)
There was no association found between these questions.
2 = 5.017 P = 0.171 Prior to Feb. 7 On Feb. 7
Action not
taken
Prior to and on
Feb. 7 Total
Unlikely
Count 124 3 8 46 181
Expected 135.3 2.4 7.3 35.9
Likely
Count 540 9 28 130 707
Expected 528.7 9.6 28.7 140.1
Total Count 664 12 36 176 888

REPORT NO. A.000.000
237
Q24 by Q29.3 Used landscaping or the layout of garden to reduce the fire risk (Which of the following had you done to prepare for bushfires?) An association was found between likelihood and landscaping and layout. A large majority of respondents
who thought a bushfire unlikely also took action to use the landscape or layout to reduce fire risk.
2 = 13.025 P = 0.003 Prior to Feb. 7 On Feb. 7
Action not
taken
Prior to and on
Feb. 7 Total
Unlikely
Count 120 5 5 40 170
Expected 135.1 2.1 3.6 29.2
Likely
Count 527 5 12 100 644
Expected 511.9 7.9 13.4 110.8
Total Count 647 10 17 140 814

REPORT NO. A.000.000
238
Q24 by Q29.4 Moved combustible materials such as firewood and wooden garden furniture away from the house (Which of the following had you done to prepare for bushfires?)
There was a significant association between respondents that thought that bushfire was likely/unlikely to
threaten their town and moved combustible materials. This association is due to the overrepresentation of
those who selected likely and taking no action on moving materials; and those that felt a bushfire Unlikely
and did move materials.
2 = 13.339 P = 0.004 Prior to Feb. 7 On Feb. 7
Action not
taken
Prior to and on
Feb. 7 Total
Unlikely
Count 103 36 8 24 171
Expected 98.5 38.4 18.5 15.6
Likely
Count 415 166 89 58 728
Expected 419.5 163.6 78.5 66.4
Total Count 518 202 97 82 899

REPORT NO. A.000.000
239
Q24 by Q29.5 Cleared gutters of leaves (Which of the following had you done to prepare for bushfires?)
There was no association found between these questions.
2 = 2.924 P = 0.404 Prior to Feb. 7 On Feb. 7
Action not
taken
Prior to and on
Feb. 7 Total
Unlikely
Count 170 13 32 14 229
Expected 177.4 10.5 30.8 10.3
Likely
Count 694 38 118 36 886
Expected 686.6 40.5 119.2 39.7
Total Count 864 51 150 50 1115

REPORT NO. A.000.000
240
Q24 by Q29.6 Installed gutter protection (Which of the following had you done to prepare for bushfires?)
An association was found between these two items. Notably, slightly more people than expected (who
deemed a bushfire likely to threaten their town) installed gutter protection. Most people prepared for this
before Feb 7, and very few people did not install any gutter protection.
2 = 8.386 P = 0.039 Prior to Feb. 7 On Feb. 7
Action not
taken
Prior to and on
Feb. 7 Total
Unlikely
Count 39 9 5 21 74
Expected 48.3 6.7 2.4 16.7
Likely
Count 184 22 6 56 268
Expected 174.7 24.3 8.6 60.3
Total Count 223 31 11 77 342

REPORT NO. A.000.000
241
Q24 by Q29.7 Covered underfloor spaces to prevent embers and flame entering (Which of the following had you done to prepare for bushfires?)
Most respondents covered underfloor spaces, with only 8 of 588 not taking this action. Most respondents
undertook this action on or before Feb 7. The association that exists between these two items is due to an
over-representation of people that thought a bushfire unlikely and took action on Feb 7.
2 = 10.989 P = 0.012 Prior to Feb. 7 On Feb. 7
Action not
taken
Prior to and on
Feb. 7 Total
Unlikely
Count 23 15 1 77 116
Expected 33.5 8.5 1.6 72.4
Likely
Count 147 28 7 290 472
Expected 136.5 34.5 6.4 294.6
Total Count 170 43 8 367 588

REPORT NO. A.000.000
242
Q24 by Q29.8 Covered all gaps and vents to reduce the risk of embers entering the house or cavities (e.g. roof, wall, etc.) (Which of the following had you done to prepare for bushfires?)
Most respondents covered all gaps and vents, with only 16 of 456 not taking this action at some point. The
dispersion on actions is interesting, with under half covering these gaps before the day, and slightly over
half undertaking this action on Feb 7 or prior to and on Feb 7.
2 = 14.933 P = 0.002 Prior to Feb. 7 On Feb. 7
Action not
taken
Prior to and on
Feb. 7 Total
Unlikely
Count 30 26 0 34 90
Expected 40.9 23.3 3.2 22.7
Likely
Count 177 92 16 81 366
Expected 166.1 94.7 12.8 92.3
Total Count 207 118 16 115 456

REPORT NO. A.000.000
243
Q24 by Q29.9 Obtained and prepared fire fighting equipment (e.g. hoses and a pump) (Which of the following had you done to prepare for bushfires?)
Two-thirds of respondents that stated it was unlikely that a bushfire would occur in their town had
obtained fire fighting equipment prior to Feb 7. Similarly, those who felt it likely, slightly under 5/6th of
people had also purchased fire-fighting equipment. The association here is predominately due to those
considering a fire in their town unlikely/likely purchasing equipment on the day.
2 = 22.785 P < 0.001 Prior to Feb. 7 On Feb. 7
Action not
taken
Prior to and on
Feb. 7 Total
Unlikely
Count 102 23 19 9 153
Expected 115.8 10.6 21.1 5.5
Likely
Count 508 33 92 20 653
Expected 494.2 45.4 89.9 23.5
Total Count 610 56 111 29 806

REPORT NO. A.000.000
244
Q24 by Q29.10 Obtained and prepared equipment such as ladder, buckets and mops to put out spot fires (Which of the following had you done to prepare for bushfires?)
Of respondents that stated it was unlikely that a bushfire was likely to occur in their town a large number
were overrepresented in obtaining equipment on the day. The association here is predominately due to
those considering a fire in their town unlikely purchasing equipment on the day and those likely purchasing
it before.
2 = 21.123 P < 0.001 Prior to Feb. 7 On Feb. 7
Action not
taken
Prior to and on
Feb. 7 Total
Unlikely
Count 65 76 28 8 177
Expected 88.5 53.7 29.5 5.3
Likely
Count 382 195 121 19 717
Expected 358.5 217.3 119.5 21.7
Total Count 447 271 149 27 894

REPORT NO. A.000.000
245
Q24 by Q29.11 Installed seals and/or draft protectors around windows and doors (Which of the following had you done to prepare for bushfires?)
Of respondents that stated it was unlikely that a bushfire likely to occur in their town a large number were
overrepresented in obtaining equipment on the day. The association here is predominately due to those
considering a fire in their town unlikely purchasing equipment on the day and those likely purchasing it
before.
2 = 10.56 P = 0.014 Prior to Feb. 7 On Feb. 7
Action not
taken
Prior to and on
Feb. 7 Total
Unlikely
Count 43 17 3 19 82
Expected 55.0 12.9 2.5 11.6
Likely
Count 264 55 11 46 376
Expected 252.0 59.1 11.5 53.4
Total Count 307 72 14 65 458

REPORT NO. A.000.000
246
Q24 by Q29.12 Installed a sprinkler system on or around the house (Which of the following had you done to prepare for bushfires?)
Approximately 83% of respondents to this question were people that thought a bushfire likely. The
association here is predominately due to those considering a fire in their town unlikely installing sprinkler
system on the day or before. Small numbers for unlikely make this association less reliable.
2 = 10.352 P = 0.016 Prior to Feb. 7 On Feb. 7
Action not
taken
Prior to and on
Feb. 7 Total
Unlikely
Count 38 13 7 10 68
Expected 48.5 7.3 5.1 7.1
Likely
Count 240 29 22 31 322
Expected 229.5 34.7 23.9 33.9
Total Count 278 42 29 41 390
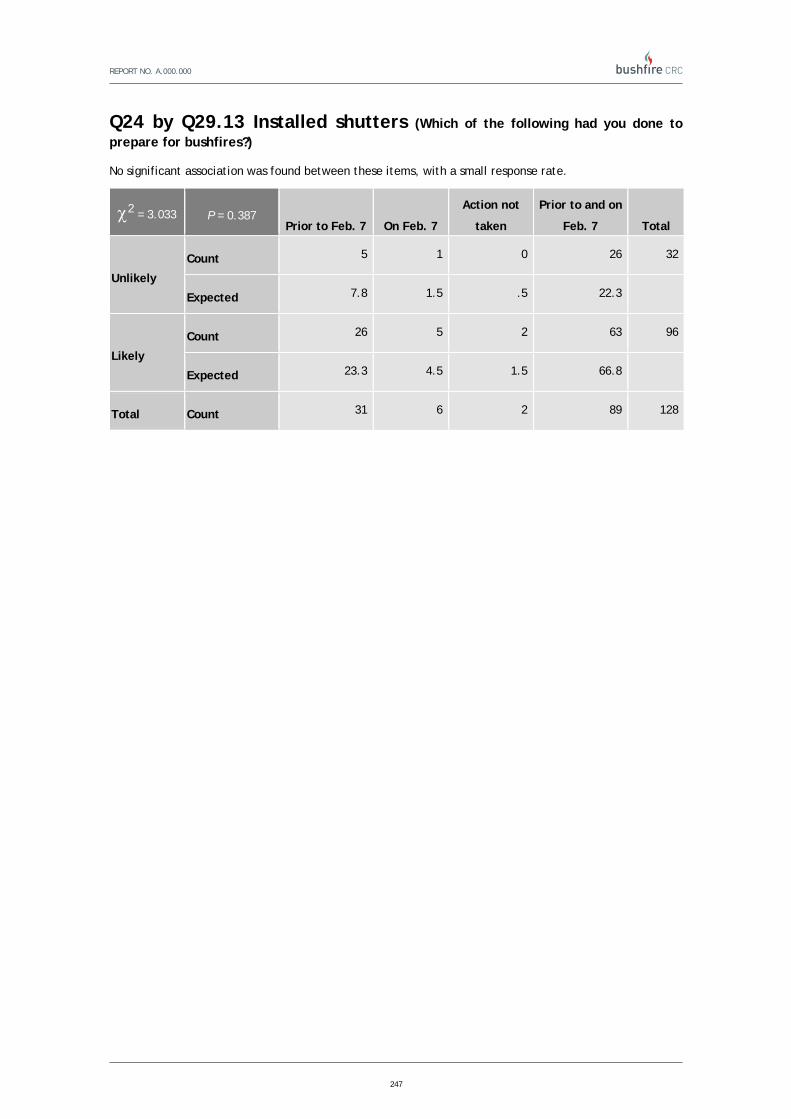
REPORT NO. A.000.000
247
Q24 by Q29.13 Installed shutters (Which of the following had you done to prepare for bushfires?)
No significant association was found between these items, with a small response rate.
2 = 3.033 P = 0.387 Prior to Feb. 7 On Feb. 7
Action not
taken
Prior to and on
Feb. 7 Total
Unlikely
Count 5 1 0 26 32
Expected 7.8 1.5 .5 22.3
Likely
Count 26 5 2 63 96
Expected 23.3 4.5 1.5 66.8
Total Count 31 6 2 89 128
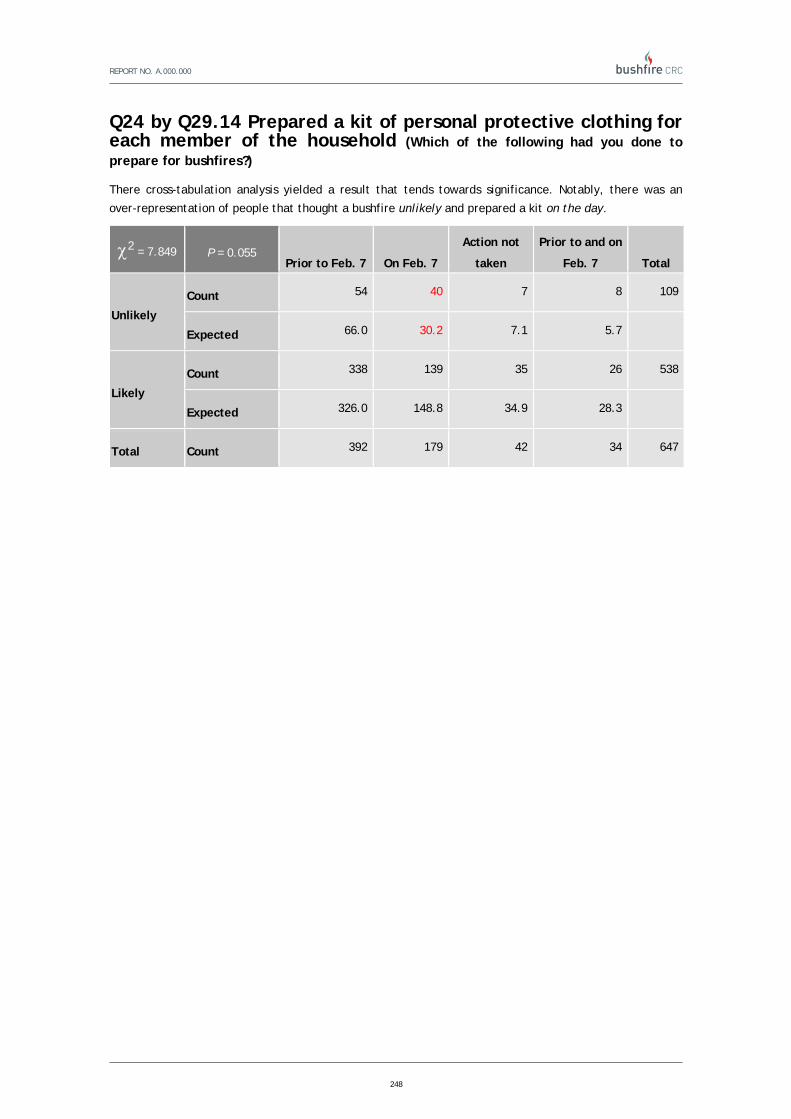
REPORT NO. A.000.000
248
Q24 by Q29.14 Prepared a kit of personal protective clothing for each member of the household (Which of the following had you done to prepare for bushfires?)
There cross-tabulation analysis yielded a result that tends towards significance. Notably, there was an
over-representation of people that thought a bushfire unlikely and prepared a kit on the day.
2 = 7.849 P = 0.055 Prior to Feb. 7 On Feb. 7
Action not
taken
Prior to and on
Feb. 7 Total
Unlikely
Count 54 40 7 8 109
Expected 66.0 30.2 7.1 5.7
Likely
Count 338 139 35 26 538
Expected 326.0 148.8 34.9 28.3
Total Count 392 179 42 34 647

REPORT NO. A.000.000
249
Q24 by Q29.15 Obtained a battery-powered radio (Which of the following had you done to prepare for bushfires?)
No significant association was found between these items.
2 = 2.841 P = 0.421 Prior to Feb. 7 On Feb. 7
Action not
taken
Prior to and on
Feb. 7 Total
Unlikely
Count 100 9 4 6 119
Expected 102.2 5.9 5.8 5.1 119.0
Likely
Count 503 26 30 24 583
Expected 500.8 29.1 28.2 24.9 583.0
Total Count 603 35 34 30 702
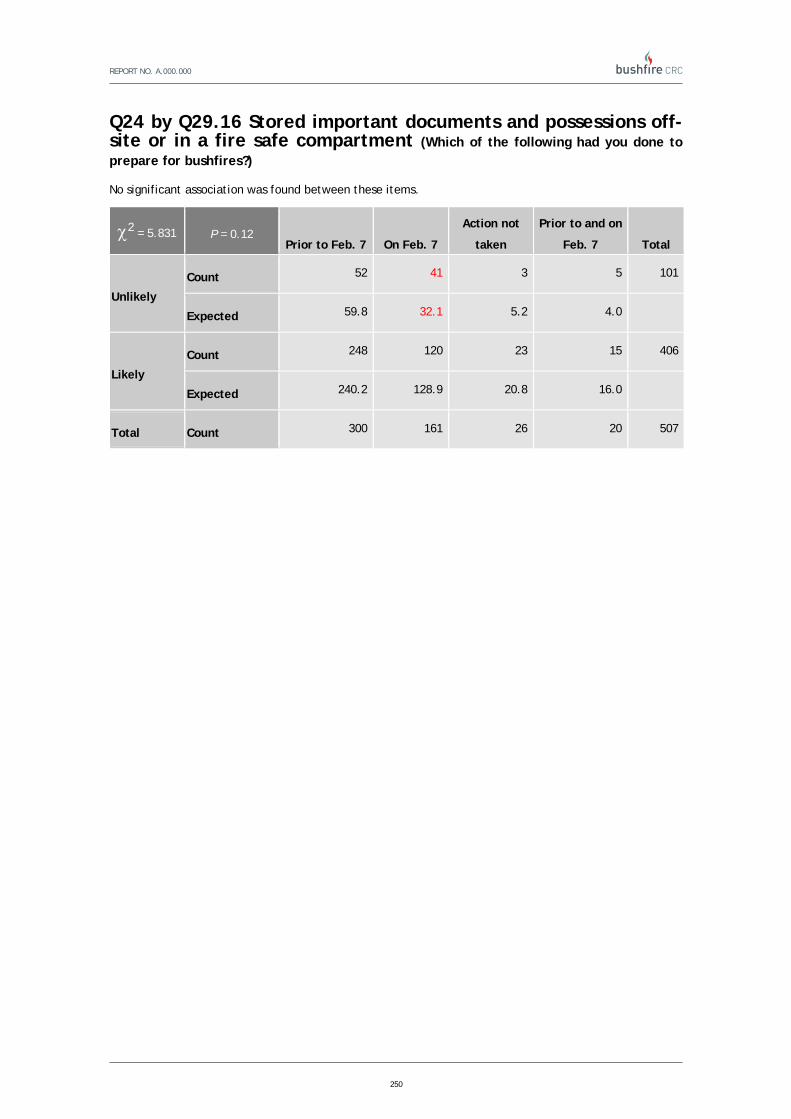
REPORT NO. A.000.000
250
Q24 by Q29.16 Stored important documents and possessions off-site or in a fire safe compartment (Which of the following had you done to prepare for bushfires?)
No significant association was found between these items.
2 = 5.831 P = 0.12 Prior to Feb. 7 On Feb. 7
Action not
taken
Prior to and on
Feb. 7 Total
Unlikely
Count 52 41 3 5 101
Expected 59.8 32.1 5.2 4.0
Likely
Count 248 120 23 15 406
Expected 240.2 128.9 20.8 16.0
Total Count 300 161 26 20 507
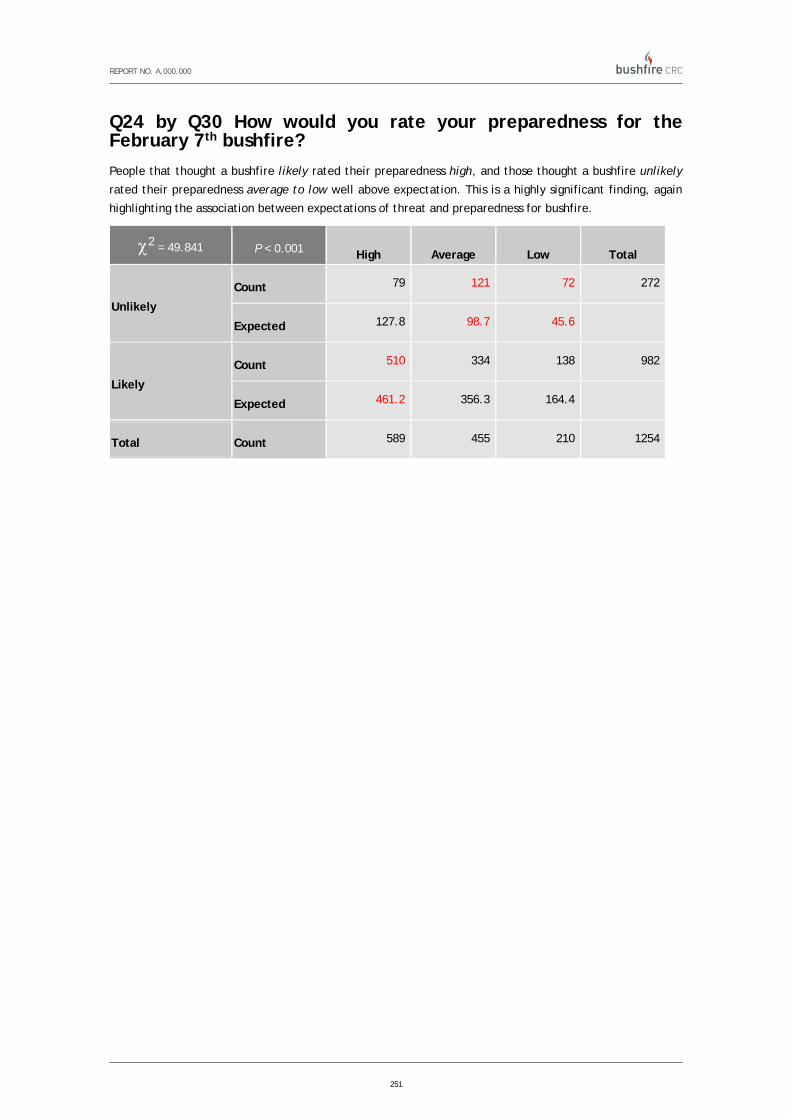
REPORT NO. A.000.000
251
Q24 by Q30 How would you rate your preparedness for the February 7th bushfire?
People that thought a bushfire likely rated their preparedness high, and those thought a bushfire unlikely
rated their preparedness average to low well above expectation. This is a highly significant finding, again
highlighting the association between expectations of threat and preparedness for bushfire.
2 = 49.841 P < 0.001 High Average Low Total
Unlikely
Count 79 121 72 272
Expected 127.8 98.7 45.6
Likely
Count 510 334 138 982
Expected 461.2 356.3 164.4
Total Count 589 455 210 1254

REPORT NO. A.000.000
252
Q25. Before the February 7th bushfire, how significant did you think the threat from bushfires was to life and property in your town or suburb?
Q25 by Q26 Which of the following best describes your level of planning for bushfires BEFORE February 7th?
People that thought a bushfire a low threat were significantly under-represented in had a firm plan and over-represented in never/didn’t/nothing/still deciding. A large number
of respondents that thought the threat high also had a firm plan, well above expectation.
2 = 171.802 P < 0.001 Never thought
about it
Knew I should
consider it but
didn't
Considered it and
was still deciding
Considered it and
decided to do
nothing
Decided what to do
and was planning it Had a firm plan Total
Low
Count 29 29 37 24 58 186 363
Expected 9.5 12.0 20.0 10.5 51.7 259.3
High
Count 1 9 26 9 105 632 782
Expected 20.5 26.0 43.0 22.5 111.3 558.7
Total Count 30 38 63 33 163 818 1145

REPORT NO. A.000.000
253
Q25 by Q27 At the beginning of last summer, which of the following did you think you were MOST LIKELY to do if a bushfire occurred in your town or suburb? Select ONE only. People that thought a bushfire a low threat were significantly under-represented in stay throughout the fire and over-represented in stay and leave if threatened/wait and
see/wait for emergency services. A large number of respondents that thought the threat high also stay throughout the fire or leave as soon as fire threatens above expectation.
Interestingly, of those that thought the threat low, 45% planned to stay; whilst of those that thought the threat high, 55% planned to stay.
2 = 41.416 P < 0.001 Stay throughout
fire
Stay and leave if
threatened
Wait and
see fire
Wait for emergency
services
Leave as soon as
fire threatens
No at home on high
fire danger days
Hadn't thought
about it Total
Low
Count 170 78 49 13 53 5 10 378
Expected 194.4 65.8 35.3 7.9 63.8 7.2 3.6
High
Count 424 123 59 11 142 17 1 777
Expected 399.6 135.2 72.7 16.1 131.2 14.8 7.4
Total Count 594 201 108 24 195 22 11 1155

REPORT NO. A.000.000
254
Q25 by Q29.1 Cleared leaves, twigs and long grass for a distance of about 20-30m around the house (Which of the following had you done to prepare for bushfires?) The association here is due to the low count differences in clearing leaves prior to and on Feb 7 for low
threat expectations.
2 = 11.991 P = 0.008 Prior to Feb. 7 On Feb. 7
Action not
taken
Prior to and
on Feb. 7 Total
Low
Count 282 3 38 12 335
Expected 280.3 3.2 45.7 5.8
High
Count 595 7 105 6 713
Expected 596.7 6.8 97.3 12.2
Total Count 877 10 143 18 1048

REPORT NO. A.000.000
255
Q25 by Q29.2 Removed bushes close to the house and cut back overhanging tree branches (Which of the following had you done to prepare for bushfires?) Significantly more people than expected who viewed the threat of bushfire as low cleared bushed and
overhanging tree branches prior to and on February 7. Those who felt the threat was high performed this
task before February 7.
2 = 13.135 P = 0.004 Prior to Feb. 7 On Feb. 7
Action not
taken
Prior to and
on Feb. 7 Total
Low
Count 173 5 9 73 260
Expected 191.3 3.2 10.5 54.9
High
Count 426 5 24 99 554
Expected 407.7 6.8 22.5 117.1
Total Count 599 10 33 172 814

REPORT NO. A.000.000
256
Q25 by Q29.3 Used landscaping or the layout of garden to reduce the fire risk (Which of the following had you done to prepare for bushfires?) People that thought a bushfire a low threat were significantly over-represented in using landscaping to
reduce fire risk prior to and on Feb 7.
2 = 8.679 P = 0.034 Prior to Feb. 7 On Feb. 7
Action not
taken
Prior to and
on Feb. 7 Total
Low
Count 171 5 4 52 232
Expected 184.5 3.1 4.6 39.8
High
Count 427 5 11 77 520
Expected 413.5 6.9 10.4 89.2
Total Count 598 10 15 129 752

REPORT NO. A.000.000
257
Q25 by Q29.4 Moved combustible materials such as firewood and wooden garden furniture away from the house (Which of the following had you done to prepare for bushfires?)
People that thought a bushfire a low threat were significantly over-represented in moving combustible
materials prior to and on Feb 7. There was an over-representation also in high threat and action not
taken; this may be indicative of people that either did not need to do anything or felt that doing this was
not possible or unhelpful
2 = 10.111 P = 0.018 Prior to Feb. 7 On Feb. 7
Action not
taken
Prior to and
on Feb. 7 Total
Low
Count 129 58 14 29 230
Expected 130.0 52.7 24.9 22.4
High
Count 335 130 75 51 591
Expected 334.0 135.3 64.1 57.6
Total Count 464 188 89 80 821

REPORT NO. A.000.000
258
Q25 by Q29.5 Cleared gutters of leaves (Which of the following had you done to prepare for bushfires?) There was no association found.
2 = 0.657 P = 0.883 Prior to Feb. 7 On Feb. 7
Action not
taken
Prior to and
on Feb. 7 Total
Low
Count 238 16 46 13 313
Expected 242.0 14.5 43.0 13.5 313.0
High
Count 549 31 94 31 705
Expected 545.0 32.5 97.0 30.5 705.0
Total Count 787 47 140 44 1018

REPORT NO. A.000.000
259
Q25 by Q29.6 Installed gutter protection (Which of the following had you done to prepare for bushfires?) No association was found.
2 = 6.34 P = 0.096 Prior to Feb. 7 On Feb. 7
Action not
taken
Prior to and
on Feb. 7 Total
Low
Count 49 9 6 24 88
Expected 56.5 7.5 3.1 20.9
High
Count 154 18 5 51 228
Expected 146.5 19.5 7.9 54.1
Total Count 203 27 11 75 316

REPORT NO. A.000.000
260
Q25 by Q29.7 Covered underfloor spaces to prevent embers and flame entering (Which of the following had you done to prepare for bushfires?)
People that thought a bushfire a low threat were significantly over-represented in moving combustible
materials prior to and on Feb 7. There was an over-representation also in high threat and prior to Feb 7;
this may be indicative of the preparedness of those expecting a high threat.
2 = 15.488
P = 0.001 Prior to Feb. 7 On Feb. 7
Action not
taken
Prior to and
on Feb. 7 Total
Low
Count 29 18 1 114 162
Expected 45.0 11.9 2.4 102.6
High
Count 122 22 7 230 381
Expected 106.0 28.1 5.6 241.4
Total Count 151 40 8 344 543
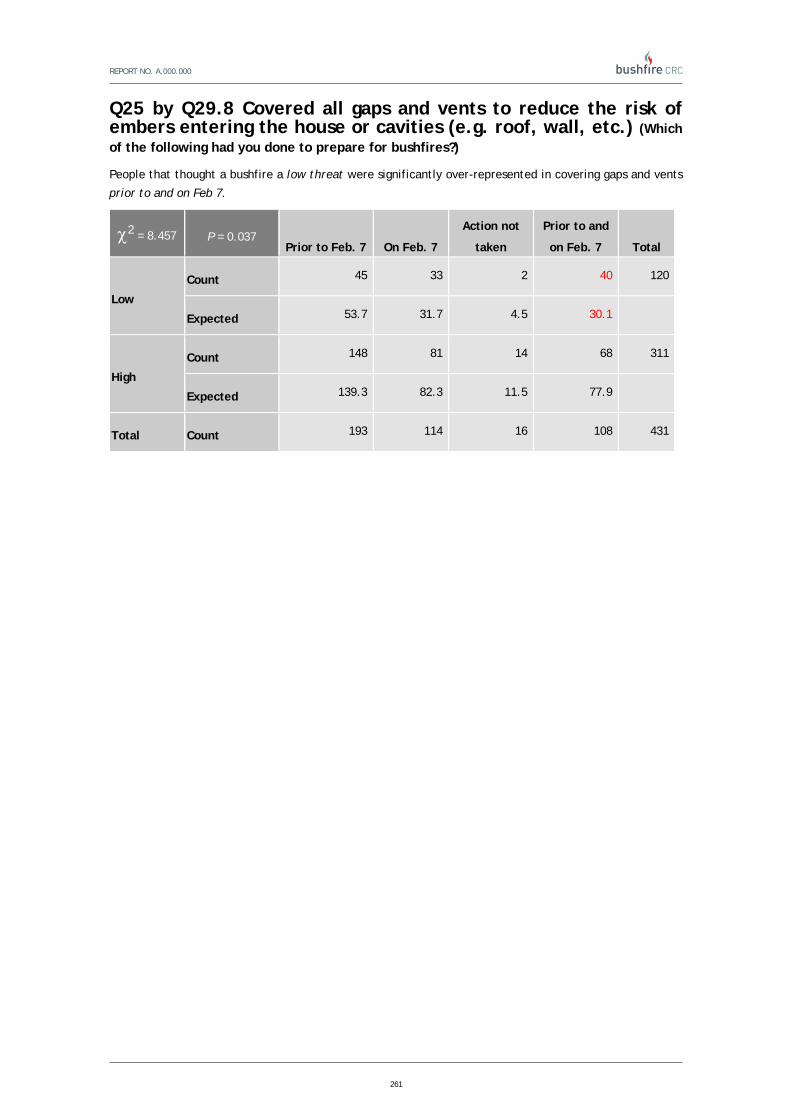
REPORT NO. A.000.000
261
Q25 by Q29.8 Covered all gaps and vents to reduce the risk of embers entering the house or cavities (e.g. roof, wall, etc.) (Which of the following had you done to prepare for bushfires?)
People that thought a bushfire a low threat were significantly over-represented in covering gaps and vents
prior to and on Feb 7.
2 = 8.457 P = 0.037 Prior to Feb. 7 On Feb. 7
Action not
taken
Prior to and
on Feb. 7 Total
Low
Count 45 33 2 40 120
Expected 53.7 31.7 4.5 30.1
High
Count 148 81 14 68 311
Expected 139.3 82.3 11.5 77.9
Total Count 193 114 16 108 431

REPORT NO. A.000.000
262
Q25 by Q29.9 Obtained and prepared fire fighting equipment (e.g. hoses and a pump) (Which of the following had you done to prepare for bushfires?)
People that thought a bushfire a low threat were significantly over-represented in obtaining fire fighting
equipment prior to and on Feb 7. There was an over-representation also in high threat and prior to Feb 7.
2 = 15.865 P = 0.001 Prior to Feb. 7 On Feb. 7
Action not
taken
Prior to and
on Feb. 7 Total
Low
Count 144 25 30 11 210
Expected 158.8 14.2 29.6 7.4
High
Count 415 25 74 15 529
Expected 400.2 35.8 74.4 18.6
Total Count 559 50 104 26 739

REPORT NO. A.000.000
263
Q25 by Q29.10 Obtained and prepared equipment such as ladder, buckets and mops to put out spot fires (Which of the following had you done to prepare for bushfires?)
People that thought a bushfire a low threat were significantly over-represented in preparing on Feb 7.
There was an over-representation also in high threat and Prior to Feb 7; this seems indicative of people
that thought a high threat important in terms of action to prepare.
2 = 18.54 P < 0.001 Prior to Feb. 7 On Feb. 7
Action not
taken
Prior to and
on Feb. 7 Total
Low
Count 94 96 38 8 236
Expected 117.7 72.1 39.8 6.3
High
Count 314 154 100 14 582
Expected 290.3 177.9 98.2 15.7
Total Count 408 250 138 22 818

REPORT NO. A.000.000
264
Q25 by Q29.11 Installed seals and/or draft protectors around windows and doors (Which of the following had you done to prepare for bushfires?)
There was no association between these questions.
2 = 4.467 P = 0.2 Prior to Feb. 7 On Feb. 7
Action not
taken
Prior to and
on Feb. 7 Total
Low
Count 65 24 3 20 112
Expected 73.8 19.0 3.3 16.0
High
Count 207 46 9 39 301
Expected 198.2 51.0 8.7 43.0
Total Count 272 70 12 59 413

REPORT NO. A.000.000
265
Q25 by Q29.12 Installed a sprinkler system on or around the house (Which of the following had you done to prepare for bushfires?)
There was no association between these questions.
2 = 1.944 P = 0.574 Prior to Feb. 7 On Feb. 7
Action not
taken
Prior to and
on Feb. 7 Total
Low
Count 55 10 7 12 84
Expected 59.9 8.8 6.2 9.2
High
Count 198 27 19 27 271
Expected 193.1 28.2 19.8 29.8
Total Count 253 37 26 39 355

REPORT NO. A.000.000
266
Q25 by Q29.13 Installed shutters (Which of the following had you done to prepare for bushfires?)
There was no association between these questions.
2 = 2.737 P = 0.434 Prior to Feb. 7 On Feb. 7
Action not
taken
Prior to and
on Feb. 7 Total
Low
Count 6 2 0 28 36
Expected 8.7 1.5 .6 25.2
High
Count 23 3 2 56 84
Expected 20.3 3.5 1.4 58.8
Total Count 29 5 2 84 120

REPORT NO. A.000.000
267
Q25 by Q29.14 Prepared a kit of personal protective clothing for each member of the household (Which of the following had you done to prepare for bushfires?) People that thought a bushfire a low threat were significantly over-represented in preparing on Feb 7 (or
prior and on). There was an over-representation also in high threat and Prior to Feb 7; this seems
indicative of people that thought a high threat important in terms of action to prepare.
2 = 15.873 P = 0.001 Prior to Feb. 7 On Feb. 7
Action not
taken
Prior to and
on Feb. 7 Total
Low
Count 70 56 9 11 146
Expected 88.7 40.5 9.6 7.2
High
Count 289 108 30 18 445
Expected 270.3 123.5 29.4 21.8
Total Count 359 164 39 29 591

REPORT NO. A.000.000
268
Q25 by Q29.15 Obtained a battery-powered radio (Which of the following had you done to prepare for bushfires?)
There was no association between these questions.
2 = 2.592 P = 0.459 Prior to Feb. 7 On Feb. 7
Action not
taken
Prior to and
on Feb. 7 Total
Low
Count 140 11 10 9 170
Expected 146.1 8.8 8.5 6.7
High
Count 409 22 22 16 469
Expected 402.9 24.2 23.5 18.3
Total Count 549 33 32 25 639

REPORT NO. A.000.000
269
Q25 by Q29.16 Stored important documents and possessions off-site or in a fire safe compartment (Which of the following had you done to prepare for bushfires?)
People that thought a bushfire a low threat were significantly over-represented in preparing on Feb 7.
There was an over-representation also in high threat and Prior to Feb 7; this seems indicative of people
that thought a high threat possible taking action to prepare in advance.
2 = 8.547 P = 0.036 Prior to Feb. 7 On Feb. 7
Action not
taken
Prior to and
on Feb. 7 Total
Low
Count 66 57 6 5 134
Expected 78.2 43.9 7.3 4.7
High
Count 203 94 19 11 327
Expected 190.8 107.1 17.7 11.3
Total Count 269 151 25 16 461

REPORT NO. A.000.000
270
Q25 by Q30 How would you rate your preparedness for the February 7th bushfire? People that thought a bushfire a low threat were significantly over-represented in average and low
preparedness for Feb 7. There was an over-representation also in high threat and High preparedness.
Notably, 57% of high threat rated themselves highly prepared, whereas only 28% of low threat rated
themselves highly prepared.
2 = 97.055 P < 0.001 High prep. Average Low prep. Total
Low
Count 102 159 108 369
Expected 173.1 132.2 63.7
High
Count 431 248 88 767
Expected 359.9 274.8 132.3
Total Count 533 407 196 1136

REPORT NO. A.000.000
271
Q26. Which of the following best describes your level of planning for bushfires BEFORE February 7th?
Q26 by Q27 At the beginning of last summer, which of the following did you think you were MOST LIKELY to do if a bushfire occurred in your town or suburb? People that had a firm plan were over-represented in stay throughout the fire, which is to be expected. Proportionally, 57% of those that had a firm plan, and 49% of those that
decided what to do and was planning it; and 48% of those considered it and decided to do nothing had thought they would be most likely to stay throughout the fire.
2 = 205.645 P < 0.001 Stay throughout
fire
Stay and leave
if threatened
Wait and see
fire
Wait for emergency
services
Leave as soon as
fire threatens
No at home on high
fire danger days
Hadn't thought
about it Total
Never thought about itCount 6 6 2 4 8 1 5 32
Expected 16.3 5.6 3.0 .7 5.6 .5 .3
Knew I should consider
it but didn't
Count 9 11 7 0 10 0 2 39
Expected 19.9 6.8 3.6 .8 6.8 .6 .4
Considered it and was
still deciding
Count 16 19 11 5 7 0 0 58
Expected 29.6 10.1 5.4 1.3 10.1 .9 .6
Considered it and
decided to do nothing
Count 14 3 8 2 1 0 1 29
Expected 14.8 5.1 2.7 .6 5.1 .5 .3
Decided what to do
and was planning it
Count 77 32 21 5 18 3 1 157
Expected 80.1 27.4 14.6 3.4 27.4 2.5 1.6
Had a firm plan Count 430 118 48 8 140 14 2 760
Expected 387.9 132.7 70.5 16.4 132.7 12.3 7.5
Other Count 15 5 6 0 10 0 0 36
Expected 18.4 6.3 3.3 .8 6.3 .6 .4
Total Count 567 194 103 24 194 18 11 1111

REPORT NO. A.000.000
272
Q26 by Q30 How would you rate your preparedness for the February 7th bushfire? People that had a firm plan were over-represented in high preparedness, which is to be expected. A clear
pattern in response is evident, with the low preparedness relating to low preparation.
2 = 378.55 P < 0.001 High Average Low Total
Never thought about it
Count 0 8 24 32
Expected 15.1 11.3 5.6
Knew I should consider
it but didn't
Count 3 9 27 39
Expected 18.4 13.7 6.9
Considered it and was
still deciding
Count 3 23 29 55
Expected 25.9 19.4 9.7
Considered it and
decided to do nothing
Count 6 16 7 29
Expected 13.7 10.2 5.1
Decided what to do
and was planning it
Count 27 92 36 155
Expected 73.1 54.5 27.3
Had a firm plan
Count 470 223 56 749
Expected 353.3 263.6 132.1
Other
Count 7 14 14 35
Expected 16.5 12.3 6.2
Total Count 516 385 193 1094

REPORT NO. A.000.000
273
Q27 At the beginning of last summer, which of the following did you think you were MOST LIKELY to do if a bushfire occurred in your town or suburb?
Q27 by Q30 How would you rate your preparedness for the February 7th bushfire? Those that thought they were most likely to stay throughout the fire were over-represented in the high
preparedness, again as we would expect. Of those that stated they would leave as soon as the fire
threatens, there was a clear over-representation of low preparedness.
2 = 224.332 P < 0.001 High Average Low Total
Stay throughout fire
Count 391 158 49 598
Expected 278.0 213.6 106.3
Stay and leave if
threatened
Count 67 98 39 204
Expected 94.9 72.9 36.3
Wait and see fire
Count 24 53 32 109
Expected 50.7 38.9 19.4
Wait for emergency
services
Count 5 9 10 24
Expected 11.2 8.6 4.3
Leave as soon as fire
threatens
Count 48 85 68 201
Expected 93.5 71.8 35.7
No at home on high fire
danger days
Count 8 12 2 22
Expected 10.2 7.9 3.9
Hadn't thought about it
Count 1 3 8 12
Expected 5.6 4.3 2.1
Total Count 544 418 208 1170

REPORT NO. A.000.000
274
Q27 by Q36. Were there members of your household who needed looking after during the fire? You may select more than one. (Multiple Response)
A significant association was found between those who needed care during the fire and what people would most likely do in the event of a bushfire. In most cases no one needed
care during the fire, and there was an overrepresentation of people who would stay throughout the fire in this category. The group that had the highest frequency of care were
infants and children. This group was overrepresented where people were most likely to leave as soon as the fire threatened.
2 = 87.954 P < 0.001 Infants or children
Elderly persons
Disabled persons Ill persons
Persons who became sick Other
No one needed care Total
Stay throughout fire Count 118 30 10 15 33 33 334 573
Expected 150.3 27.0 12.5 12.0 28.6 38.0 304.7
Stay and leave if threatened Count 58 8 3 3 13 12 80 177
Expected 46.4 8.4 3.9 3.7 8.8 11.7 94.1
Wait and see fire Count 23 3 2 2 2 8 54 94
Expected 24.7 4.4 2.0 2.0 4.7 6.2 50.0
Wait for emergency services Count 8 1 1 1 1 2 11 25
Expected 6.6 1.2 0.5 0.5 1.2 1.7 13.3
Leave as soon as fire threatens Count 68 8 5 2 4 15 78 180
Expected 47.2 8.5 3.9 3.8 9.0 11.9 95.7
No at home on high fire danger days
Count 5 1 0 0 0 2 11 19
Expected 5.0 0.9 0.4 0.4 0.9 1.3 10.1
Hadn't thought about it Count 1 0 2 0 1 0 5 9
Expected 2.4 0.4 0.2 0.2 0.4 0.6 4.8
Other Count 8 1 1 0 1 1 13 25
Expected 6.6 1.2 0.5 0.5 1.2 1.7 13.3
Total Count 289 52 24 23 55 73 586 1102
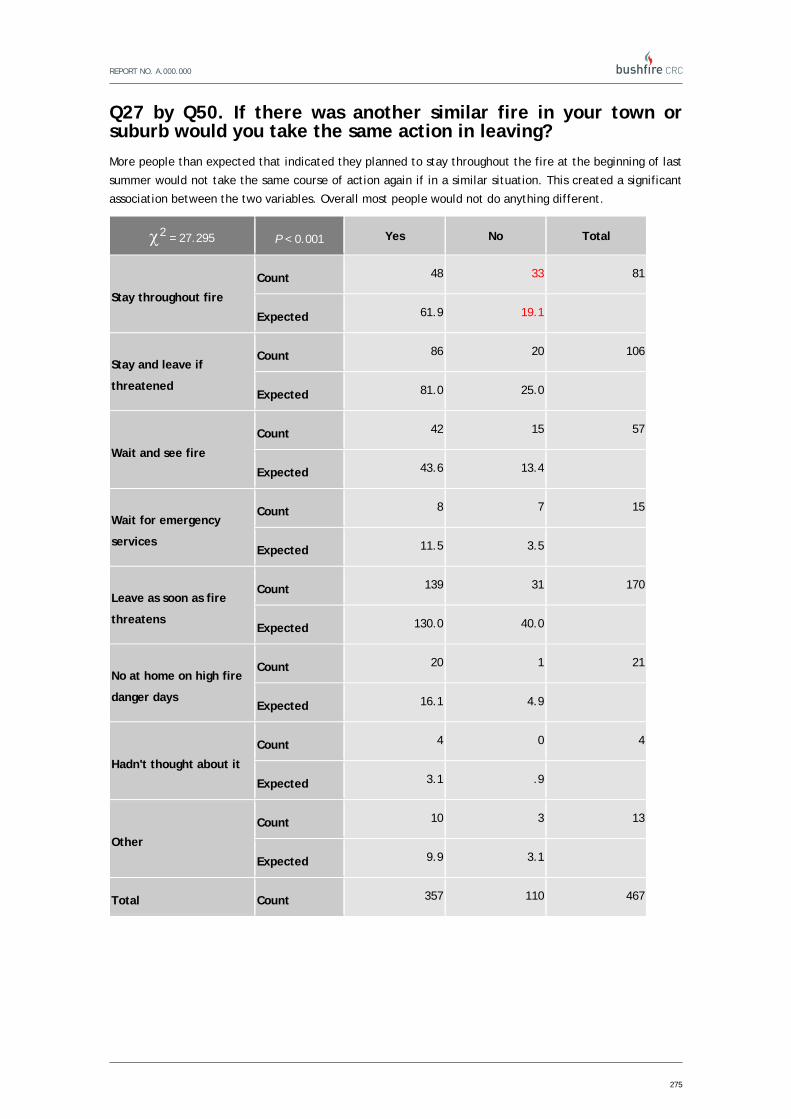
REPORT NO. A.000.000
275
Q27 by Q50. If there was another similar fire in your town or suburb would you take the same action in leaving?
More people than expected that indicated they planned to stay throughout the fire at the beginning of last
summer would not take the same course of action again if in a similar situation. This created a significant
association between the two variables. Overall most people would not do anything different.
2 = 27.295 P < 0.001 Yes No Total
Stay throughout fire
Count 48 33 81
Expected 61.9 19.1
Stay and leave if
threatened
Count 86 20 106
Expected 81.0 25.0
Wait and see fire
Count 42 15 57
Expected 43.6 13.4
Wait for emergency
services
Count 8 7 15
Expected 11.5 3.5
Leave as soon as fire
threatens
Count 139 31 170
Expected 130.0 40.0
No at home on high fire
danger days
Count 20 1 21
Expected 16.1 4.9
Hadn't thought about it
Count 4 0 4
Expected 3.1 .9
Other
Count 10 3 13
Expected 9.9 3.1
Total Count 357 110 467

REPORT NO. A.000.000
276
Q27 by Q79. What kind of insurance did you have on February 7th 2009? You may select more than one.
Residents who have outbuildings and farm insurance have more people than expected who were most likely to stay throughout the fire. Interestingly, no one with this kind of
insurance had not thought about what to do if a bushfire threatened their property. Those with contents only insurance were most likely to leave as soon as the fire threatens.
2 = 164.569 P < 0.001 House and contents House only Contents only Outbuildings Farm insurance None Total
Stay throughout fire Count 520 25 8 191 158 24 926
Expected 559.8 26.2 25.1 164.5 119.2 31.2
Stay and leave if threatened
Count 172 13 11 45 28 4 273
Expected 165.0 7.7 7.4 48.5 35.1 9.2
Wait and see fire Count 89 3 6 20 11 7 136
Expected 82.2 3.9 3.7 24.2 17.5 4.6
Wait for emergency services
Count 20 1 0 2 1 3 27
Expected 16.3 0.8 0.7 4.8 3.5 0.9
Leave as soon as fire threatens
Count 169 5 19 31 13 13 250
Expected 151.1 7.1 6.8 44.4 32.2 8.4
No at home on high fire danger days
Count 19 0 1 4 3 1 28
Expected 16.9 0.8 0.8 5.0 3.6 0.9
Hadn't thought about it
Count 9 0 0 0 0 3 12
Expected 7.3 0.3 0.3 2.1 1.5 0.4
Other Count 26 1 1 8 4 2 42
Expected 25.4 1.2 1.1 7.5 5.4 1.4
Total Count 1024 48 46 301 218 57 1694
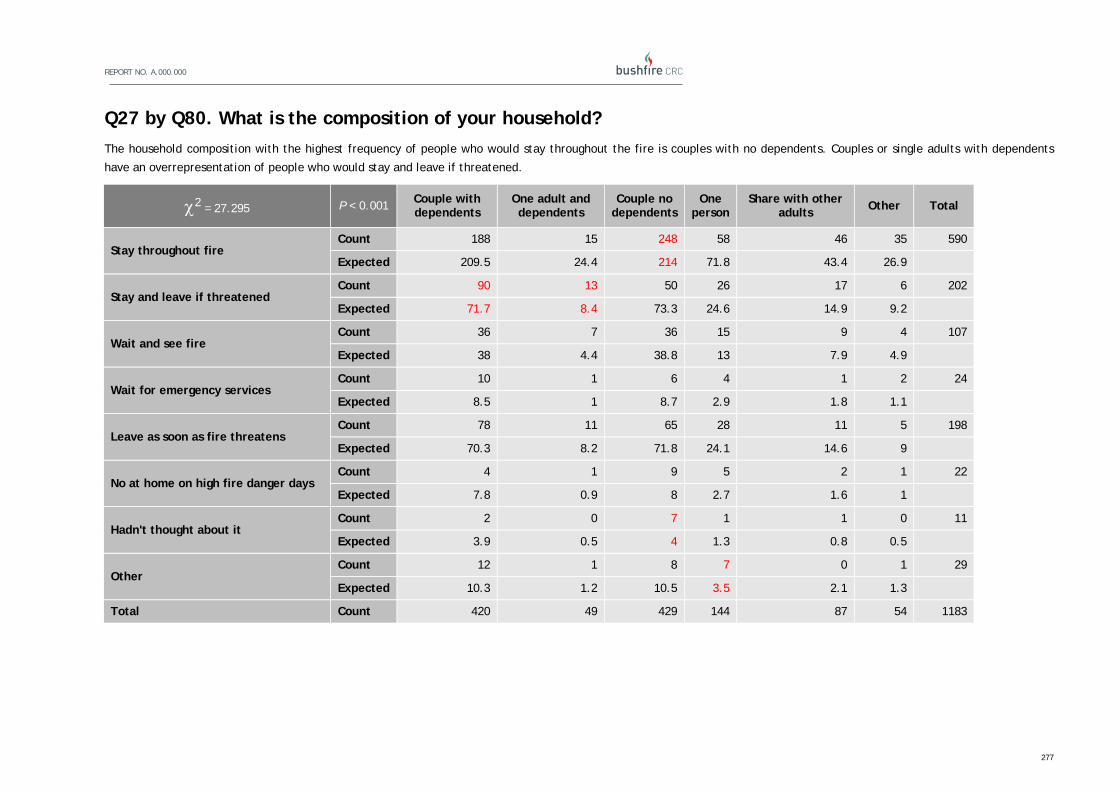
REPORT NO. A.000.000
277
Q27 by Q80. What is the composition of your household?
The household composition with the highest frequency of people who would stay throughout the fire is couples with no dependents. Couples or single adults with dependents
have an overrepresentation of people who would stay and leave if threatened.
2 = 27.295 P < 0.001 Couple with dependents
One adult and dependents
Couple no dependents
One person
Share with other adults Other Total
Stay throughout fire Count 188 15 248 58 46 35 590
Expected 209.5 24.4 214 71.8 43.4 26.9
Stay and leave if threatened Count 90 13 50 26 17 6 202
Expected 71.7 8.4 73.3 24.6 14.9 9.2
Wait and see fire Count 36 7 36 15 9 4 107
Expected 38 4.4 38.8 13 7.9 4.9
Wait for emergency services Count 10 1 6 4 1 2 24
Expected 8.5 1 8.7 2.9 1.8 1.1
Leave as soon as fire threatens Count 78 11 65 28 11 5 198
Expected 70.3 8.2 71.8 24.1 14.6 9
No at home on high fire danger days Count 4 1 9 5 2 1 22
Expected 7.8 0.9 8 2.7 1.6 1
Hadn't thought about it Count 2 0 7 1 1 0 11
Expected 3.9 0.5 4 1.3 0.8 0.5
Other Count 12 1 8 7 0 1 29
Expected 10.3 1.2 10.5 3.5 2.1 1.3
Total Count 420 49 429 144 87 54 1183

REPORT NO. A.000.000
278
Q27 by Q82. On February 7th were you registered as a CFA volunteer?
Of those who would stay throughout the fire, there was an overrepresentation of people who were
registered or had registered in the past as a CFA volunteer. 95% of people who were not registered as a
CFA volunteer would leave as soon as a fire threatened.
2 = 61.085 P < 0.001 Yes No, registered in past No Total
Stay throughout fire Count 60 83 457 600
Expected 44.2 63.6 492.2
Stay and leave if threatened Count 7 20 179 206
Expected 15.2 21.8 169
Wait and see fire Count 11 10 90 111
Expected 8.2 11.8 91.1
Wait for emergency services Count 0 0 25 25
Expected 1.8 2.6 20.5
Leave as soon as fire threatens Count 1 10 191 202
Expected 14.9 21.4 165.7
No at home on high fire danger days
Count 2 1 19 22
Expected 1.6 2.3 18
Hadn't thought about it Count 1 1 10 12
Expected 0.9 1.3 9.8
Other Count 7 3 20 30
Expected 2.2 3.2 24.6
Total Count 89 128 991 1208
139

REPORT NO. A.000.000
279
Q27 by Q83. On February 7th were you a member of a CFA community fire guard group?
Many more people than expected who were members of the CFA community fire guard group would stay
throughout a fire. The majority of those who were most likely to leave as soon as a fire threatens were not
members of the CFA community fire guard group.
2 = 50.806 P < 0.001 Yes No, registered in past No Total
Stay throughout fire Count 124 41 426 591
Expected 91.0 40.6 459.4
Stay and leave if threatened Count 24 19 163 206
Expected 31.7 14.1 160.1
Wait and see fire Count 13 8 88 109
Expected 16.8 7.5 84.7
Wait for emergency services Count 0 0 25 25
Expected 3.8 1.7 19.4
Leave as soon as fire threatens Count 13 11 178 202
Expected 31.1 13.9 157.0
No at home on high fire danger
days
Count 2 3 17 22
Expected 3.4 1.5 17.1
Hadn't thought about it Count 0 0 12 12
Expected 1.8 .8 9.3
Other Count 8 0 20 28
Expected 4.3 1.9 21.8
Total Count 184 82 929 1195
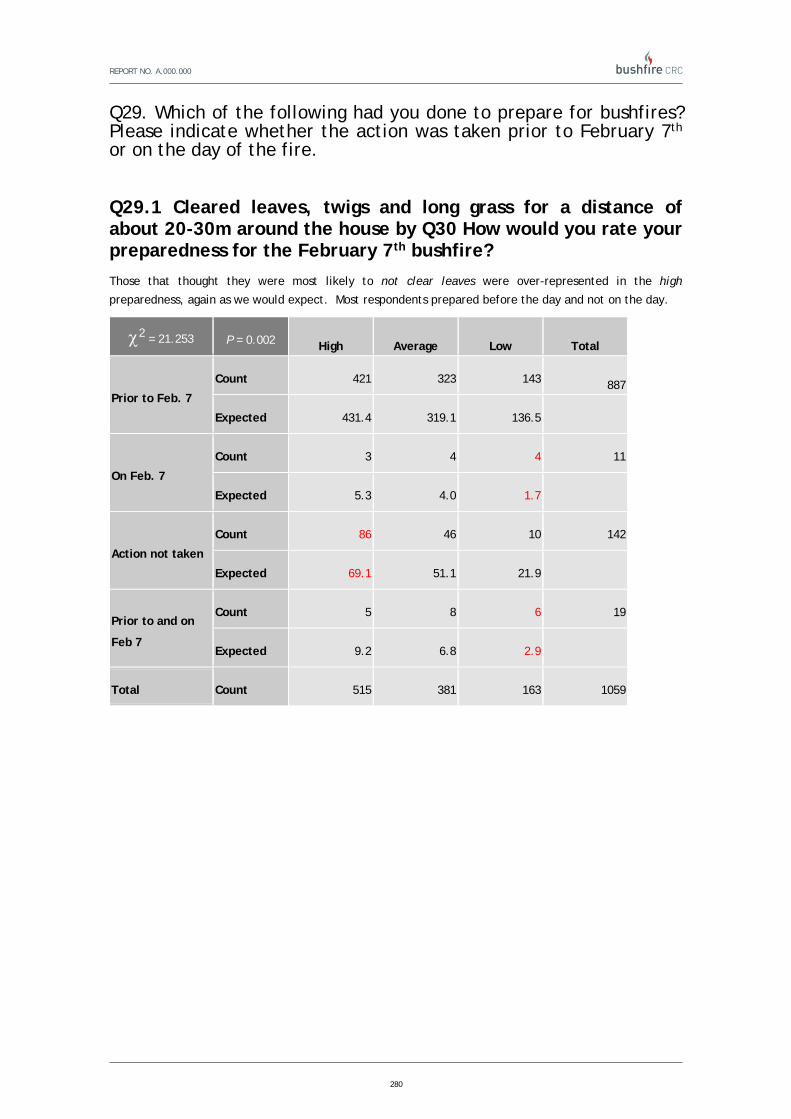
REPORT NO. A.000.000
280
Q29. Which of the following had you done to prepare for bushfires? Please indicate whether the action was taken prior to February 7th or on the day of the fire.
Q29.1 Cleared leaves, twigs and long grass for a distance of about 20-30m around the house by Q30 How would you rate your preparedness for the February 7th bushfire?
Those that thought they were most likely to not clear leaves were over-represented in the high
preparedness, again as we would expect. Most respondents prepared before the day and not on the day.
2 = 21.253 P = 0.002 High Average Low Total
Prior to Feb. 7
Count 421 323 143 887
Expected 431.4 319.1 136.5
On Feb. 7
Count 3 4 4 11
Expected 5.3 4.0 1.7
Action not taken
Count 86 46 10 142
Expected 69.1 51.1 21.9
Prior to and on
Feb 7
Count 5 8 6 19
Expected 9.2 6.8 2.9
Total Count 515 381 163 1059

REPORT NO. A.000.000
281
Q29.2 Removed bushes close to the house and cut back overhanging tree branches by Q30 How would you rate your preparedness for the February 7th bushfire?
Most respondents prepared before the day and not on the day.
2 = 17.092 P = 0.009 High Average Low Total
Prior to Feb. 7
Count 322 217 67 606
Expected 319.3 209.1 77.6
On Feb. 7
Count 9 1 0 10
Expected 5.3 3.5 1.3
Action not taken
Count 21 8 4 33
Expected 17.4 11.4 4.2
Prior to and on
Feb 7
Count 80 57 34 171
Expected 90.1 59.0 21.9
Total Count 432 283 105 820
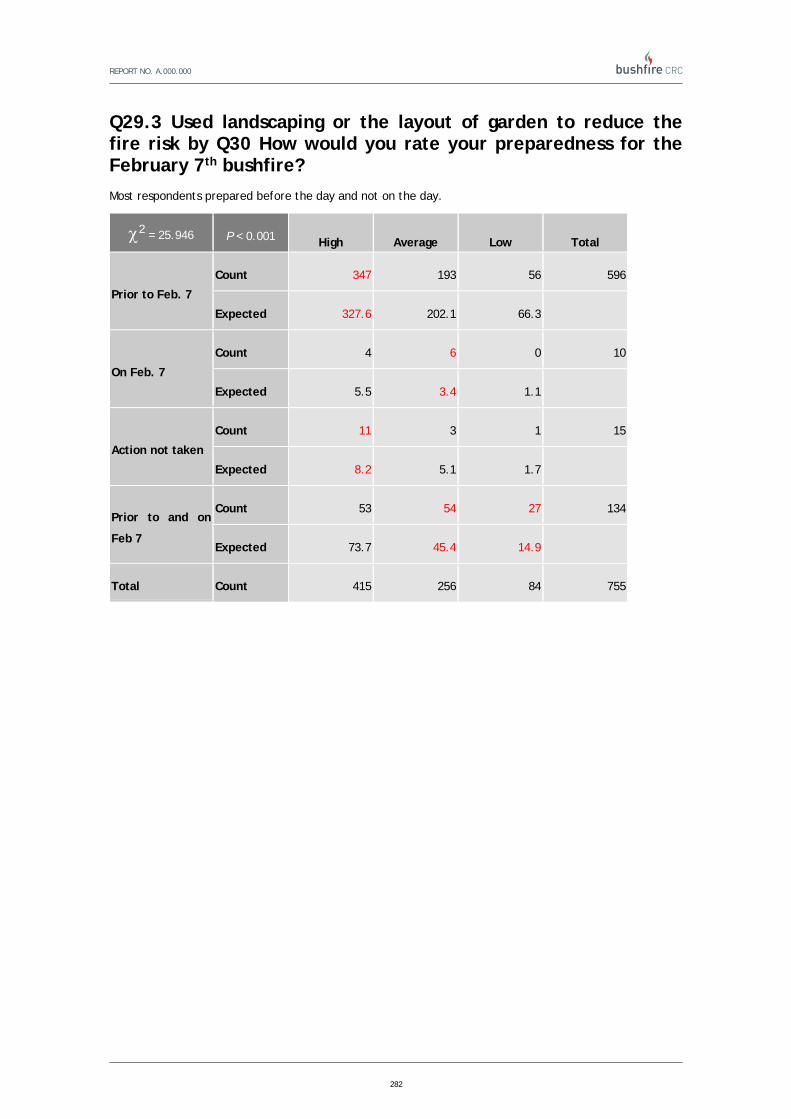
REPORT NO. A.000.000
282
Q29.3 Used landscaping or the layout of garden to reduce the fire risk by Q30 How would you rate your preparedness for the February 7th bushfire?
Most respondents prepared before the day and not on the day.
2 = 25.946 P < 0.001 High Average Low Total
Prior to Feb. 7
Count 347 193 56 596
Expected 327.6 202.1 66.3
On Feb. 7
Count 4 6 0 10
Expected 5.5 3.4 1.1
Action not taken
Count 11 3 1 15
Expected 8.2 5.1 1.7
Prior to and on
Feb 7
Count 53 54 27 134
Expected 73.7 45.4 14.9
Total Count 415 256 84 755
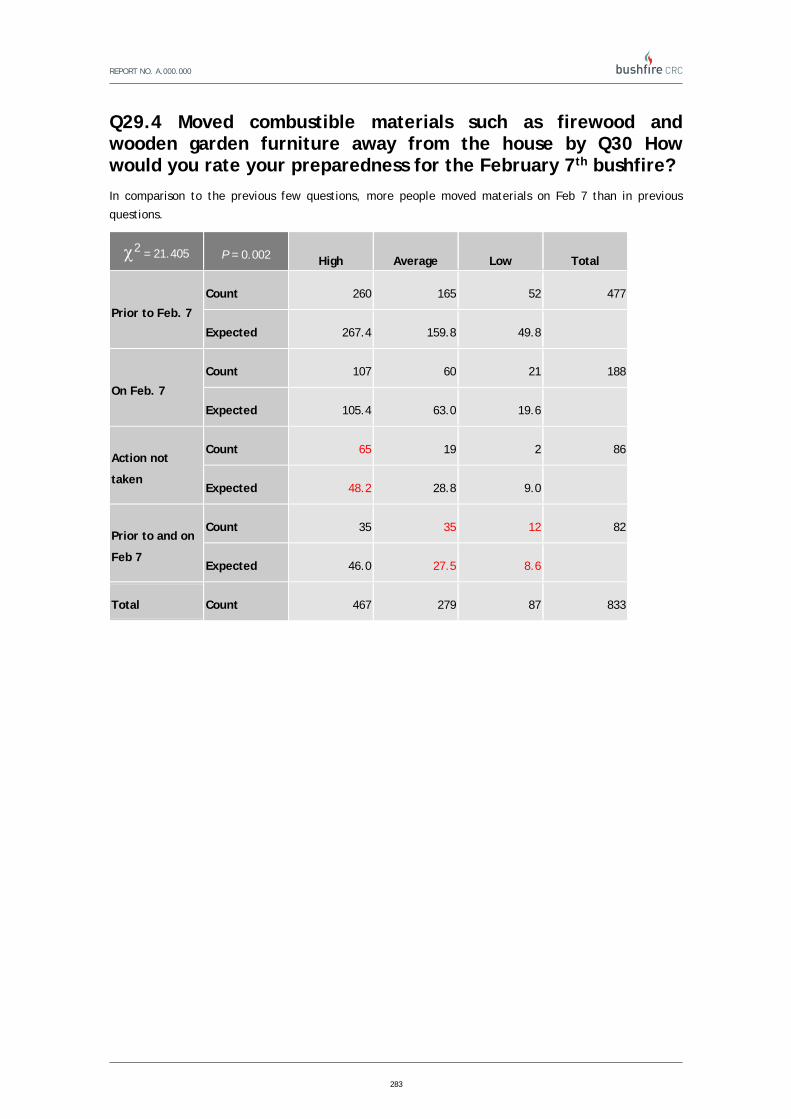
REPORT NO. A.000.000
283
Q29.4 Moved combustible materials such as firewood and wooden garden furniture away from the house by Q30 How would you rate your preparedness for the February 7th bushfire?
In comparison to the previous few questions, more people moved materials on Feb 7 than in previous
questions.
2 = 21.405 P = 0.002 High Average Low Total
Prior to Feb. 7
Count 260 165 52 477
Expected 267.4 159.8 49.8
On Feb. 7
Count 107 60 21 188
Expected 105.4 63.0 19.6
Action not
taken
Count 65 19 2 86
Expected 48.2 28.8 9.0
Prior to and on
Feb 7
Count 35 35 12 82
Expected 46.0 27.5 8.6
Total Count 467 279 87 833

REPORT NO. A.000.000
284
Q29.5 Cleared gutters of leaves by Q30 How would you rate your preparedness for the February 7th bushfire?
No significant association was found between these questions.
2 = 6.353 P = 0.385 High Average Low Total
Prior to Feb. 7
Count 387 292 123 802
Expected 396.3 289.1 116.6
On Feb. 7
Count 22 19 7 48
Expected 23.7 17.3 7.0
Action not
taken
Count 80 42 15 137
Expected 67.7 49.4 19.9
Prior to and on
Feb 7
Count 21 19 5 45
Expected 22.2 16.2 6.5
Total Count 510 372 150 1032
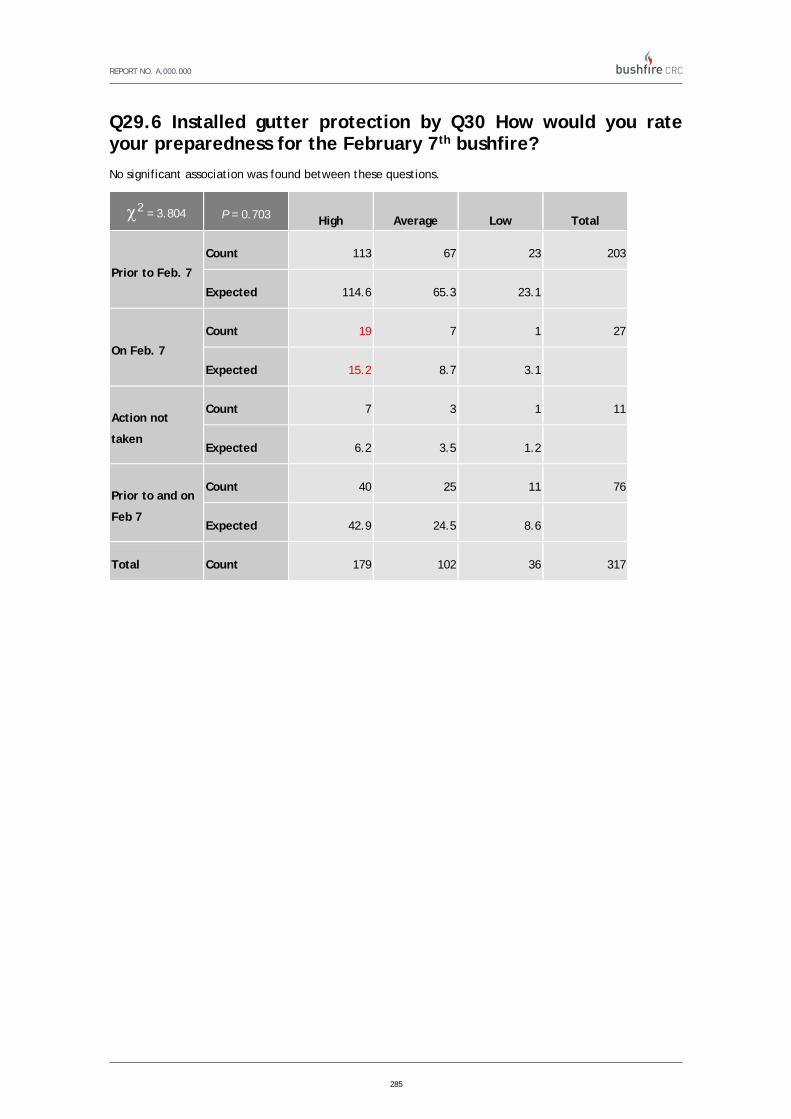
REPORT NO. A.000.000
285
Q29.6 Installed gutter protection by Q30 How would you rate your preparedness for the February 7th bushfire?
No significant association was found between these questions.
2 = 3.804 P = 0.703 High Average Low Total
Prior to Feb. 7
Count 113 67 23 203
Expected 114.6 65.3 23.1
On Feb. 7
Count 19 7 1 27
Expected 15.2 8.7 3.1
Action not
taken
Count 7 3 1 11
Expected 6.2 3.5 1.2
Prior to and on
Feb 7
Count 40 25 11 76
Expected 42.9 24.5 8.6
Total Count 179 102 36 317

REPORT NO. A.000.000
286
Q29.7 Covered underfloor spaces to prevent embers and flame entering by Q30 How would you rate your preparedness for the February 7th bushfire?
No significant association was found between these questions.
2 = 7.295 P = 0.294 High Average Low Total
Prior to Feb. 7
Count 101 42 9 152
Expected 90.1 46.7 15.1
On Feb. 7
Count 23 13 4 40
Expected 23.7 12.3 4.0
Action not
taken
Count 5 3 0 8
Expected 4.7 2.5 .8
Prior to and on
Feb 7
Count 193 109 41 343
Expected 203.4 105.5 34.1
Total Count 322 167 54 543

REPORT NO. A.000.000
287
Q29.8 Covered all gaps and vents to reduce the risk of embers entering the house or cavities (e.g. roof, wall, etc.) by Q30 How would you rate your preparedness for the February 7th bushfire?
No significant association was found between these questions.
2 = 3.777 P = 0.707 High Average Low Total
Prior to Feb. 7
Count 132 53 10 195
Expected 129.1 54.2 11.7
On Feb. 7
Count 75 30 7 112
Expected 74.1 31.1 6.7
Action not
taken
Count 12 3 0 15
Expected 9.9 4.2 .9
Prior to and on
Feb 7
Count 67 34 9 110
Expected 72.8 30.6 6.6
Total Count 286 120 26 432
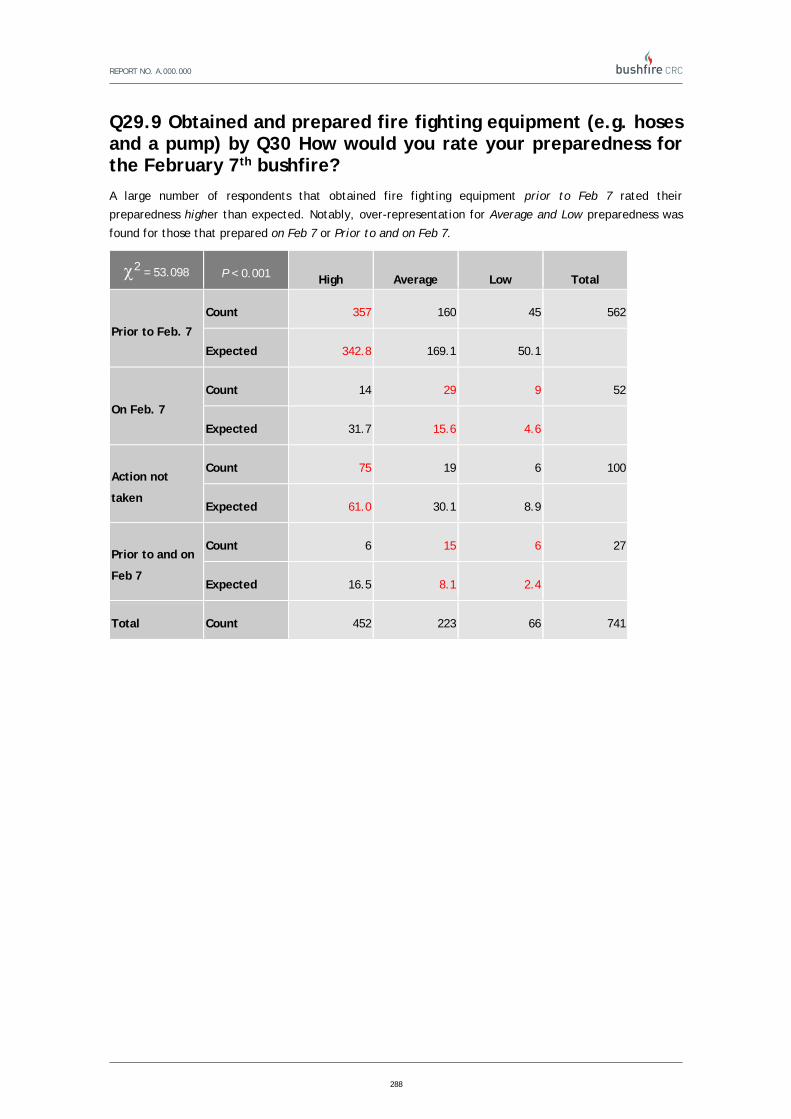
REPORT NO. A.000.000
288
Q29.9 Obtained and prepared fire fighting equipment (e.g. hoses and a pump) by Q30 How would you rate your preparedness for the February 7th bushfire?
A large number of respondents that obtained fire fighting equipment prior to Feb 7 rated their
preparedness higher than expected. Notably, over-representation for Average and Low preparedness was
found for those that prepared on Feb 7 or Prior to and on Feb 7.
2 = 53.098 P < 0.001 High Average Low Total
Prior to Feb. 7
Count 357 160 45 562
Expected 342.8 169.1 50.1
On Feb. 7
Count 14 29 9 52
Expected 31.7 15.6 4.6
Action not
taken
Count 75 19 6 100
Expected 61.0 30.1 8.9
Prior to and on
Feb 7
Count 6 15 6 27
Expected 16.5 8.1 2.4
Total Count 452 223 66 741

REPORT NO. A.000.000
289
Q29.10 Obtained and prepared equipment such as ladder, buckets and mops to put out spot fires by Q30 How would you rate your preparedness for the February 7th bushfire?
A large number of respondents that obtained ladders, buckets and mops prior to Feb 7 rated their
preparedness higher than expected. Over-representation for Average and Low preparedness was found for
those that prepared on Feb 7.
2 = 43.54 P < 0.001 High Average Low Total
Prior to Feb. 7
Count 256 128 24 408
Expected 236.1 134.0 37.9
On Feb. 7
Count 108 106 36 250
Expected 144.7 82.1 23.2
Action not
taken
Count 96 29 11 136
Expected 78.7 44.7 12.6
Prior to and on
Feb 7
Count 14 6 5 25
Expected 14.5 8.2 2.3
Total Count 474 269 76 819

REPORT NO. A.000.000
290
Q29.11 Installed seals and/or draft protectors around windows and doors by Q30 How would you rate your preparedness for the February 7th bushfire?
No significant association was found between these questions.
2 = 8.256 P = 0.22 High Average Low Total
Prior to Feb. 7
Count 178 66 27 271
Expected 175.8 70.1 25.1
On Feb. 7
Count 44 21 3 68
Expected 44.1 17.6 6.3
Action not
taken
Count 10 1 0 11
Expected 7.1 2.8 1.0
Prior to and on
Feb 7
Count 34 18 8 60
Expected 38.9 15.5 5.6
Total Count 266 106 38 410

REPORT NO. A.000.000
291
Q29.12 Installed a sprinkler system on or around the house by Q30 How would you rate your preparedness for the February 7th bushfire?
No significant association was found between these questions.
2 = 8.929 P = 0.178 High Average Low Total
Prior to Feb. 7
Count 175 60 19 254
Expected 171.9 64.4 17.7
On Feb. 7
Count 24 12 2 38
Expected 25.7 9.6 2.6
Action not
taken
Count 22 4 0 26
Expected 17.6 6.6 1.8
Prior to and on
Feb 7
Count 22 15 4 41
Expected 27.8 10.4 2.9
Total Count 243 91 25 359

REPORT NO. A.000.000
292
Q29.13 Installed shutters by Q30 How would you rate your preparedness for the February 7th bushfire?
No significant association was found between these questions.
2 = 5.476 P = 0.484 High Average Low Total
Prior to Feb. 7
Count 22 4 2 28
Expected 18.8 7.6 1.6
On Feb. 7
Count 5 1 0 6
Expected 4.0 1.6 .3
Action not
taken
Count 2 0 0 2
Expected 1.3 .5 .1
Prior to and on
Feb 7
Count 53 28 5 86
Expected 57.8 23.3 4.9
Total Count 82 33 7 122

REPORT NO. A.000.000
293
Q29.14 Prepared a kit of personal protective clothing for each member of the household by Q30 How would you rate your preparedness for the February 7th bushfire?
A large number of respondents that prepared personal protective equipment prior to Feb 7 rated their
preparedness higher than expected; and over-representation for Average and Low preparedness was found
for those that prepared on Feb 7.
2 = 52.037 P < 0.001 High Average Low Total
Prior to Feb. 7
Count 272 84 9 365
Expected 240.3 103.3 21.4
On Feb. 7
Count 79 64 20 163
Expected 107.3 46.1 9.6
Action not
taken
Count 29 9 1 39
Expected 25.7 11.0 2.3
Prior to and on
Feb 7
Count 13 12 5 30
Expected 19.7 8.5 1.8
Total Count 393 169 35 597

REPORT NO. A.000.000
294
Q29.15 Obtained a battery-powered radio by Q30 How would you rate your preparedness for the February 7th bushfire?
No significant association was found between these questions.
2 = 2.129 P = 0.907 High Average Low Total
Prior to Feb. 7
Count 311 175 67 553
Expected 311.6 174.6 66.8
On Feb. 7
Count 19 13 3 35
Expected 19.7 11.1 4.2
Action not
taken
Count 19 7 5 31
Expected 17.5 9.8 3.7
Prior to and on
Feb 7
Count 15 9 3 27
Expected 15.2 8.5 3.3
Total Count 364 204 78 646

REPORT NO. A.000.000
295
Q29.16 Stored important documents and possessions off-site or in a fire safe compartment by Q30 How would you rate your preparedness for the February 7th bushfire?
A large number of respondents that stored important documents prior to Feb 7 rated their preparedness
higher than expected. Over-representation for Average and Low preparedness was found for those that
prepared on Feb 7.
2 = 14.259 P = 0.027 High Average Low Total
Prior to Feb. 7
Count 157 92 22 271
Expected 142.4 99.6 29.0
On Feb. 7
Count 65 65 24 154
Expected 80.9 56.6 16.5
Action not
taken
Count 16 8 1 25
Expected 13.1 9.2 2.7
Prior to and on
Feb 7
Count 8 7 3 18
Expected 9.5 6.6 1.9
Total Count 246 172 50 468

REPORT NO. A.000.000
296
10BSection 4: During the Bushfire – part 1
Q36. Were there members of your household who needed looking after during the fire? You may select more than one.
Q36 by Q61. Why did you leave your house or property? You may select more than one.
From the significant association between those who needed looking after during the fire and why residents left their property there was only one overrepresentation. This was
that more people than expected left their property to remove infants or children from danger.
2=200.41 P < 0.001 Smelled smoke near by
Flames near by
Fire in immediate
vicinity
To get things to defend
Emergency services said to
Friends, relatives,
neighbours said to
Too dangerous
Sustained an injury
Remove household members
from danger
Fire fighting equipment
failed
House caught on fire
Other Total
Infants or children
Count 9 19 21 5 3 10 27 2 28 18 11 23 176
Expected 9.5 18.9 20.6 4.2 4.9 10.4 31.3 2.6 19.9 18.9 12.1 22.5
Elderly persons
Count 2 3 2 1 2 2 6 1 2 2 0 2 25
Expected 1.3 2.7 2.9 0.6 0.7 1.5 4.5 0.4 2.8 2.7 1.7 3.2
Disabled persons
Count 0 1 1 1 1 3 2 1 0 0 0 1 11
Expected 0.6 1.2 1.3 0.3 0.3 0.7 2.0 0.2 1.2 1.2 0.8 1.4
Ill persons
Count 0 1 0 0 0 1 2 0 2 1 1 1 9
Expected 0.5 1.0 1.1 0.2 0.3 0.5 1.6 0.1 1.0 1.0 0.6 1.2
Persons who became sick
Count 3 3 5 1 0 3 5 2 3 4 4 3 36
Expected 1.9 3.9 4.2 0.9 1.0 2.1 6.4 0.5 4.1 3.9 2.5 4.6
Other Count 5 4 5 1 1 2 10 2 10 6 3 13 62
Expected 3.3 6.7 7.2 1.5 1.7 3.7 11.0 0.9 7.0 6.7 4.3 7.9
No one needed care
Count 10 27 29 4 8 11 44 0 16 27 18 26 220
Expected 11.8 23.7 25.7 5.3 6.1 13.1 39.2 3.3 24.9 23.7 15.1 28.2
Total Count 29 58 63 13 15 32 96 8 61 58 37 69 539

REPORT NO. A.000.000
297
Q37. Which one of the following best describes what YOU did DURING the bushfire?
436BThe following questions refer only to those who left on their property (answered a or b at question 37).
422BQ37 a. Left before the fire arrived in my town or suburb
423BQ37 b. Left when the fire arrived in my town or suburb
Q37 by Q38. On a scale of 1 to 5, where 1 is ‘very early’ and 5 is ‘very late’, when did you leave your home or property?
Those who left before the fire arrived rated their timing of leaving as very early or early, while those who
left when the fire arrived rated their timing as late or very late.
200.406 P = 0.002 1 2 3 4 5 Total
Left before the fire arrived
Count 101 43 51 47 14 256
Expected 52.9 25.7 46 67.2 64.2
Left when the fire arrived
Count 6 9 42 89 116 262
Expected 54.1 26.3 47 68.8 65.8
Total Count 107 52 93 136 130 518
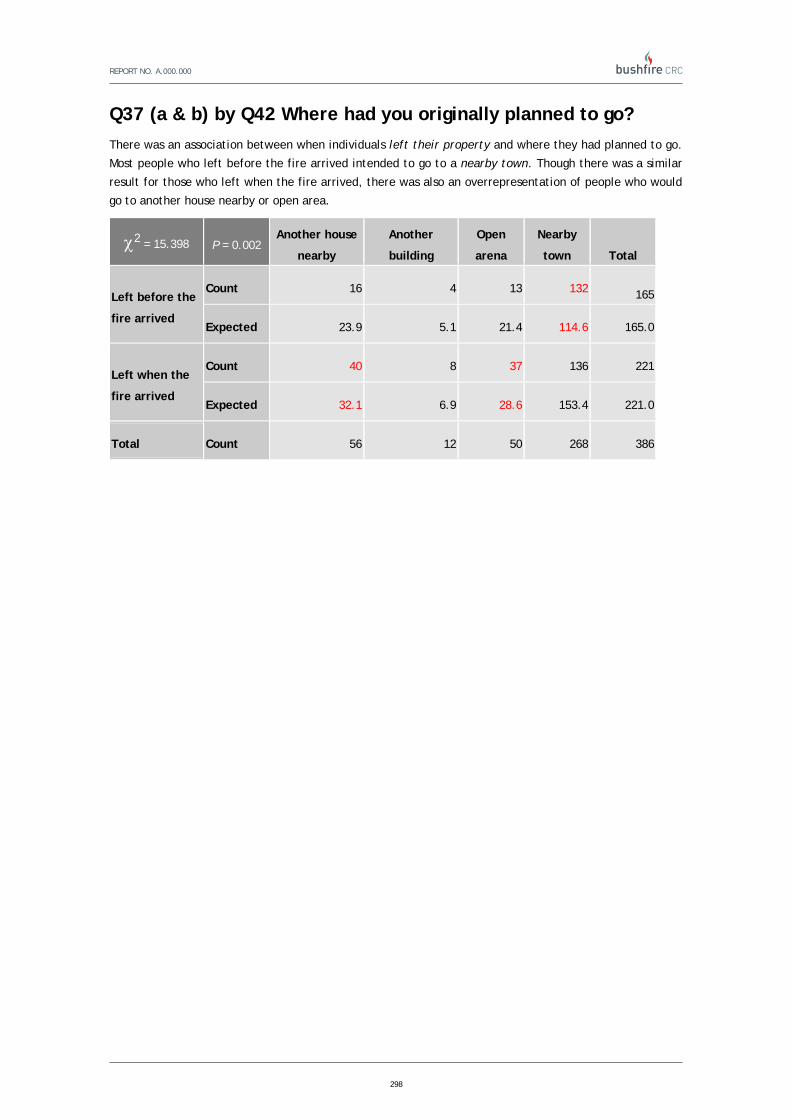
REPORT NO. A.000.000
298
Q37 (a & b) by Q42 Where had you originally planned to go?
There was an association between when individuals left their property and where they had planned to go.
Most people who left before the fire arrived intended to go to a nearby town. Though there was a similar
result for those who left when the fire arrived, there was also an overrepresentation of people who would
go to another house nearby or open area.
2 = 15.398 P = 0.002 Another house
nearby
Another
building
Open
arena
Nearby
town Total
Left before the
fire arrived
Count 16 4 13 132 165
Expected 23.9 5.1 21.4 114.6 165.0
Left when the
fire arrived
Count 40 8 37 136 221
Expected 32.1 6.9 28.6 153.4 221.0
Total Count 56 12 50 268 386

REPORT NO. A.000.000
299
Q37 (a & b) by Q43 When you left, where did you actually go?
An association is evident between where people went on the day of the bushfires and when they left their
homes. Most people went to a nearby town, and this was overrepresented for people that left before the
fire arrived. Respondents who left when the fire arrived had an overrepresentation in that they went to
another house nearby.
2 = 21.144 P < 0.001 Another house
nearby
Another
building
Open
arena
Nearby
town Total
Left before the
fire arrived
Count 11 7 5 144 167
Expected 22.4 6.6 11.4 126.6
Left when the
fire arrived
Count 40 8 21 144 213
Expected 28.6 8.4 14.6 161.4
Total Count 51 15 26 288 380

REPORT NO. A.000.000
300
Q37 (a & b) by Q44 How did you get there?
There is no association between when a respondent left their home and how they got to their destination.
Very few people left by any transportation other than their own car, irrespective of when they left.
2 = 0.341 P = 0.559 In my car Other Total
Left before the
fire arrived
Count 191 10 201
Expected 189.6 11.4
Left when the
fire arrived
Count 240 16 256
Expected 241.4 14.6
Total Count 431 26 457
*Other includes someone else’s car, foot, emergency services and any other transportation (including
motorbikes, trucks and planes)

REPORT NO. A.000.000
301
Q37 (a & b) by Q45 When you left your house or property, did you feel that the danger was…?
There was an association between when a resident left their home and the level of fire danger they felt.
Respondents who left before the fire arrived had an overrepresentation in feeling that the fire danger
level was moderate and low. Those who left when the fire arrived overwhelmingly rated the fire danger as
high.
2 = 49.28 P < 0.001 High Moderate Low Total
Left before the
fire arrived
Count 173 37 48 258
Expected 205.2 23.4 29.4
Left when the
fire arrived
Count 239 10 11 260
Expected 206.8 23.6 29.6
Total Count 412 47 59 518

REPORT NO. A.000.000
302
Q37 (a & b) by Q47 How long after the fire passed through your town or suburb did you first attempt to return?
An association does not exist between when an individual left their property and the length of time before
they attempted to returned. Despite this there was still some overrepresentation where those who left
before the fire arrived were more likely to attempt to go home less than an hour after the fire had passed
through.
2 = 15.24 P = 0.004 <1hr 1-2hrs 3-6hrs 7-12hrs >12hrs Total
Left before the
fire arrived
Count 16 13 21 32 177 259
Expected 9.7 18.5 27.7 31.3 171.8
Left when the
fire arrived
Count 3 23 33 29 158 246
Expected 9.3 17.5 26.3 29.7 163.2
Total Count 19 36 54 61 335 505

REPORT NO. A.000.000
303
Q37 (a & b) by Q50 If there was another similar fire in your town or suburb would you take the same action in leaving?
A significant discrepancy is found between when an individual left their property and whether or not they
would take the same action again. Those who left before the fire arrived would take the same course of
action again. And, although most people who left when the fire arrived would also take the same action
again, there were more people than expected who would change their actions.
2 = 8.274 P = 0.004 Yes No Total
Left before the
fire arrived
Count 209 48 257
Expected 195.2 61.8
Left when the
fire arrived
Count 176 74 250
Expected 189.8 60.2
Total Count 385 122 507

REPORT NO. A.000.000
304
Q40. To the best of your knowledge, how long before the fire arrived in your town or suburb did you leave?
Q40 (a & b) by Q45 When you left your house or property, did you feel that the danger was…?
This cross-tab shows a significant association between a persons estimation of when the fire arrived in
their suburb and the level of fire danger they felt when they left the property. Those who left more than
four hours before the fire arrived in their suburb had an overrepresentation in the moderate and low
categories. Individuals who left less than 4 hours before the fire arrived overwhelmingly stated that the
fire danger was high.
2 = 72.49 P < 0.001 High Moderate Low Total
>4hrs
Count 42 19 27 88
Expected 69.7 8.0 10.3
2-4hrs
Count 109 13 17 139
Expected 110.1 12.6 16.3
10 mins -
2hrs
Count 114 7 7 128
Expected 101.4 11.6 15.0
<10mins
Count 128 6 7 141
Expected 111.7 12.8 16.5
Total Count 393 45 58 496

REPORT NO. A.000.000
305
Q40 (a & b) by Q47 How long after the fire passed through your town or suburb did you first attempt to return?
There is no association between a respondent’s estimation of when the fire arrived in their town or suburb
and when they attempted to return to their home. In all categories, most people attempted to return
greater than 12 hours after the fire.
2 = 13.6 P = 0.327 <1hr 1-2hrs 3-6hrs 7-12hrs >12hrs Total
<4hrs
Count 7 8 8 10 56 89
Expected 3.1 6.6 9.4 10.9 58.9
2-4hrs
Count 4 10 15 19 91 139
Expected 4.9 10.4 14.7 17.0 92.0
10 mins - 2hrs
Count 5 5 13 18 82 123
Expected 4.3 9.2 13.0 15.1 81.4
<10mins
Count 1 13 15 12 90 131
Expected 4.6 9.8 13.9 16.0 86.7
Total Count 17 36 51 59 319 482

REPORT NO. A.000.000
306
Q40 (a & b) by Q50 If there was another similar fire in your town or suburb would you take the same action in leaving?
The time after a person left there property before the fire arrived and whether or not they would repeat
the same actions in similar circumstances are significantly associated. Most interestingly, people who left
with less than 10 minutes before the bushfire arrived showed a greater likelihood in not doing it again.
2 = 13.042 P = 0.005 Yes No Total
>4hrs
Count 66 23 89
Expected 67.1 21.9
2-4hrs
Count 117 20 137
Expected 103.3 33.7
10 mins - 2hrs
Count 92 31 123
Expected 92.8 30.2
<10mins
Count 90 45 135
Expected 101.8 33.2
Total Count 365 119 484

REPORT NO. A.000.000
307
Q42. Where had you originally planned to go?
Q42 by Q43 When you left, where did you actually go? An association is expected between where respondents had planned to go and where they actually went,
and in this case the expectation was met. Most residents were able to go to the location they had originally
planned.
2 = 309.987 P < 0.001 Another house
nearby
Another
building Open arena Nearby town Total
Another
house nearby
Count 33 1 1 9 44
Expected 5.8 1.5 3.2 33.5
Another
building
Count 1 5 0 4 10
Expected 1.3 .3 .7 7.6
Open arena
Count 2 3 17 24 46
Expected 6.0 1.6 3.4 35.0
Nearby town
Count 9 3 7 224 243
Expected 31.9 8.5 17.7 184.9
Total Count 45 12 25 261 343

REPORT NO. A.000.000
308
Q42 by Q44 How did you get there?
There was no association between where people had originally planned to go and how they got there.
2 = 4.025 P = 0.259 In my car Other Total
Another
house nearby
Count 52 4 56
Expected 53.1 2.9
Another
building
Count 10 2 12
Expected 11.4 .6
Open arena
Count 48 2 50
Expected 47.4 2.6
Nearby town
Count 254 12 266
Expected 252.1 13.9
Total Count 364 20 384
*Other includes someone else’s car, foot, emergency services and any other transportation (including
motorbikes, trucks and planes)

REPORT NO. A.000.000
309
Q42 by Q45 When you left your house or property, did you feel that the danger was…?
There was no association between where respondents had originally planned to go and how threatening
they felt the fire was.
2 = 4.423 P = 0.62 High Moderate Low Total
Another house
nearby
Count 48 4 4 56
Expected 48.1 3.5 4.4
Another
building
Count 10 1 1 12
Expected 10.3 .8 .9
Open arena
Count 44 5 1 50
Expected 42.9 3.1 3.9
Nearby town
Count 226 14 24 264
Expected 226.7 16.6 20.7
Total Count 328 24 30 382

REPORT NO. A.000.000
310
Q42 by Q50 If there was another similar fire in your town or suburb would you take the same action in leaving?
There was no association between where individuals had originally planned to go and whether they would
take the same action again.
2 = 1.562 P = 0.668 Yes No Total
Another house
nearby
Count 41 14 55
Expected 43.6 11.4
Another
building
Count 9 2 11
Expected 8.7 2.3
Open arena
Count 37 12 49
Expected 38.8 10.2
Nearby town
Count 206 49 255
Expected 201.9 53.1
Total Count 293 77 370

REPORT NO. A.000.000
311
Q42 by Q73 Which of the following age groups do you belong to?
The association between where individuals had originally planned to go and age is significant. Those
between 25 and 44 had mostly planned to go to another house nearby. Those who originally planned to an
open arena were most frequently aged between 55 and 64.
2 = 33.835 P = 0.013 18-24 25-34 35-44 45-54 55-64 65-74 75+ Total
Another house nearby
Count 1 9 23 9 8 4 1 55
Expected 0.6 5.3 13.9 12.7 12.6 6.7 3.2
Another building Count 0 2 1 2 3 2 2 12
Expected 0.1 1.1 3 2.8 2.7 1.5 0.7
Open arena Count 0 1 6 13 20 6 3 49
Expected 0.5 4.7 12.4 11.3 11.2 6 2.9
Nearby town Count 3 24 65 63 55 34 16 260
Expected 2.8 24.9 65.7 60.2 59.5 31.8 15.2
Total Count 4 36 95 87 86 46 22 376

REPORT NO. A.000.000
312
Q43. When you left, where did you actually go?
Q43 by Q44 How did you get there?
There was no association between where respondents had gone to escape the fire and how threatening
they felt the fire was.
2 = 0.758 P = 0.859 In my car Other Total
Another house
nearby
Count 47 4 51
Expected 48.2 2.8
Another
building
Count 14 1 15
Expected 14.2 .8
Open arena
Count 25 1 26
Expected 24.6 1.4
Nearby town
Count 273 15 288
Expected 272.1 15.9
Total Count 359 21 380
*Other includes someone else’s car, foot, emergency services and any other transportation (including
motorbikes, trucks and planes)

REPORT NO. A.000.000
313
Q43 by Q45 When you left your house or property, did you feel that the danger was…?
There was no association between where respondents had gone to escape the fire and how threatening
they felt the fire was.
2 = 6.253 P = 0.395 High Moderate Low Total
Another house
nearby
Count 41 4 5 50
Expected 41.6 3.7 4.6
Another
building
Count 12 2 1 15
Expected 12.5 1.1 1.4
Open arena
Count 22 4 0 26
Expected 21.7 1.9 2.4
Nearby town
Count 239 18 29 286
Expected 238.2 21.2 26.6
Total Count 314 28 35 377

REPORT NO. A.000.000
314
Q43 by Q47 How long after the fire passed through your town or suburb did you first attempt to return?
An association was found between where residents went when they left their homes on February 7th and
when they attempted to return. The main finding from this table is that people who were in other houses
nearby were more likely to try and return earlier (less than 12 hours after the fire passed through).
2 = 37.839 P < 0.001 <1hr 1-2hrs 3-6hrs 7-12hrs >12hrs Total
Another
house nearby
Count 0 10 9 9 21 49
Expected .5 2.9 4.8 6.4 34.3
Another
building
Count 0 0 1 1 13 15
Expected .2 .9 1.5 2.0 10.5
Open arena
Count 0 2 3 0 16 21
Expected .2 1.3 2.1 2.8 14.7
Nearby town
Count 4 10 23 38 206 281
Expected 3.1 16.9 27.6 36.9 196.5
Total Count 4 22 36 48 256 366

REPORT NO. A.000.000
315
Q43 by Q50 If there was another similar fire in your town or suburb would you take the same action in leaving?
There was no association between where individuals had gone to escape the fire and whether they would
take the same action again.
2 = 6.253 P = 0.395 Yes No Total
Another house
nearby
Count 43 7 50
Expected 39.5 10.5
Another
building
Count 10 5 15
Expected 11.8 3.2
Open arena
Count 14 9 23
Expected 18.1 4.9
Nearby town
Count 221 56 277
Expected 218.6 58.4
Total Count 288 77 365

REPORT NO. A.000.000
316
Q43 by Q73 Which of the following age groups do you belong to?
There was no significant association for this test.
2 = 14.162 P = 0.718 18-24 25-34 35-44 45-54 55-64 65-74 75+ Total
Another house
nearby
Count 1 4 20 8 10 4 2 49
Expected .9 4.5 12.3 10.6 11.8 6.0 2.9
Another building Count 0 1 4 5 3 0 2 15
Expected .3 1.4 3.8 3.2 3.6 1.8 .9
Open arena Count 1 2 6 4 6 4 2 25
Expected .5 2.3 6.3 5.4 6.0 3.0 1.5
Nearby town Count 5 27 63 63 70 37 16 281
Expected 5.3 25.8 70.6 60.8 67.6 34.2 16.7
Total Count 7 34 93 80 89 45 22 370
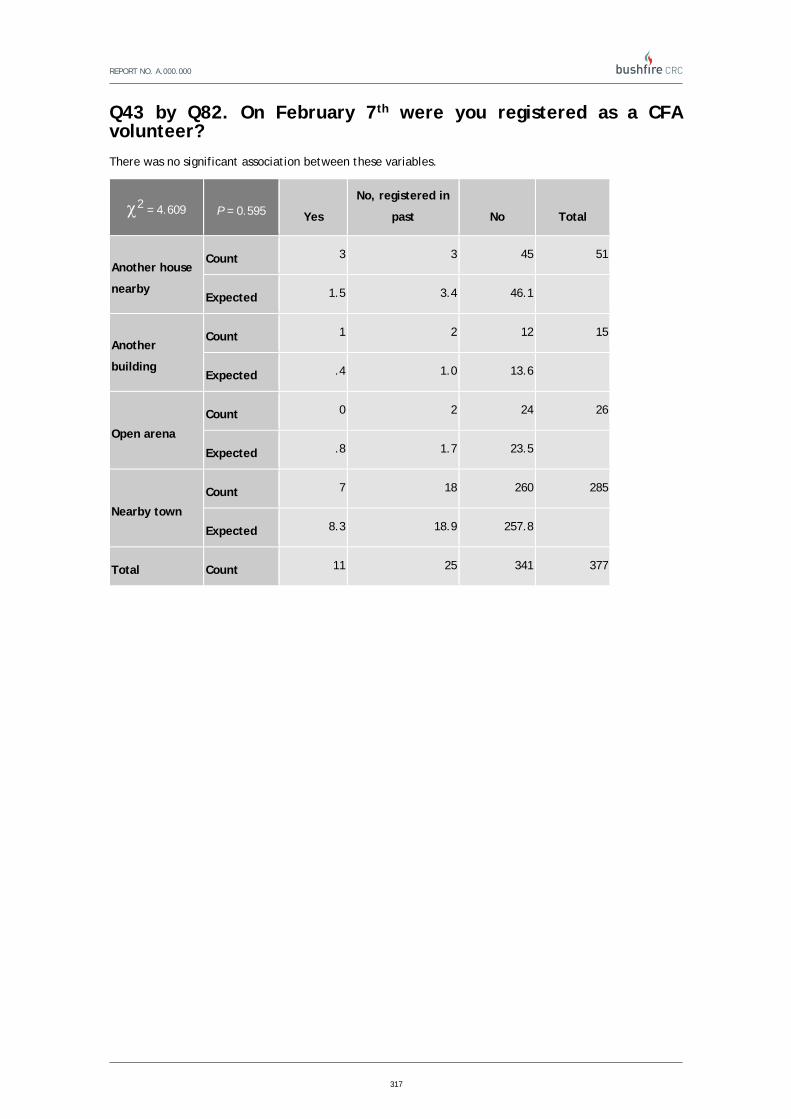
REPORT NO. A.000.000
317
Q43 by Q82. On February 7th were you registered as a CFA volunteer?
There was no significant association between these variables.
2 = 4.609 P = 0.595 Yes
No, registered in
past No Total
Another house
nearby
Count 3 3 45 51
Expected 1.5 3.4 46.1
Another
building
Count 1 2 12 15
Expected .4 1.0 13.6
Open arena
Count 0 2 24 26
Expected .8 1.7 23.5
Nearby town
Count 7 18 260 285
Expected 8.3 18.9 257.8
Total Count 11 25 341 377

REPORT NO. A.000.000
318
Q43 by Q83. On February 7th were you a member of a CFA community fire guard group?
There was no significant association between these variables.
2 = 1.349 P = 0.969 High Moderate Low Total
Another house
nearby
Count 5 3 42 50
Expected 5.2 4.0 40.8
Another
building
Count 1 1 13 15
Expected 1.6 1.2 12.2
Open arena
Count 4 2 20 26
Expected 2.7 2.1 21.2
Nearby town
Count 29 24 232 285
Expected 29.6 22.7 232.7
Total Count 39 30 307 376

REPORT NO. A.000.000
319
Q44. How did you get there?
Q44 by Q45 When you left your house or property, did you feel that the danger was…?
There was no association between how individuals travelled to their destination and their perception of
the fire danger.
2 = 0.699 P = 0.705 High Moderate Low Total
In my car
Count 362 29 36 427
Expected 362.9 29.2 34.9
Other
Count 23 2 1 26
Expected 22.1 1.8 2.1
Total Count 385 31 37 453
*Other includes someone else’s car, foot, emergency services and any other transportation (including
motorbikes, trucks and planes)

REPORT NO. A.000.000
320
Q44 by Q47 How long after the fire passed through your town or suburb did you first attempt to return?
There was no association between how individuals travelled to their destination and the length of time
that had passed before they attempted to return.
2 = 7.501 P = 0.823 <1hr 1-2hrs 3-6hrs 7-12hrs >12hrs Total
In my car
Count 10 31 43 50 281 415
Expected 9.5 31.3 42.7 50.3 281.1
Other
Count 0 2 2 3 15 22
Expected .5 1.7 2.3 2.7 14.9
Total Count 10 33 45 53 296 437
*Other includes someone else’s car, foot, emergency services and any other transportation (including
motorbikes, trucks and planes)

REPORT NO. A.000.000
321
Q44 by Q50 If there was another similar fire in your town or suburb would you take the same action in leaving?
There was no association between how individuals travelled to their destination and whether they would
take the same course of action again.
2 = 4.493 P = 0.213 Yes No Total
In my car
Count 324 89 413
Expected 323.0 90.0
Other
Count 17 6 23
Expected 18.0 5.0
Total Count 341 95 436
*Other includes someone else’s car, foot, emergency services and any other transportation (including
motorbikes, trucks and planes)

REPORT NO. A.000.000
322
Q45 When you left your house or property, did you feel that the danger was…?
Q45 by Q47 How long after the fire passed through your town or suburb did you first attempt to return?
There was no association between the level of fire threat felt and when an individual attempted to return
home. However, there were 5 more people than expected that attempted to return within an hour of the
fire passing through. Still, most of the people who thought the fire danger was low waited more than 12
hours before returning to their properties.
2 = 7.501 P = 0.823 <1hr 1-2hrs 3-6hrs 7-12hrs >12hrs Total
High
Count 9 30 43 48 266 396
Expected 14.3 28.7 42.2 48.6 262.1
Moderate
Count 2 2 6 8 24 42
Expected 1.5 3.0 4.5 5.2 27.8
Low
Count 7 4 4 5 39 59
Expected 2.1 4.3 6.3 7.2 39.1
Total Count 18 36 53 61 329 497

REPORT NO. A.000.000
323
Q45 by Q50 If there was another similar fire in your town or suburb would you take the same action in leaving?
The counts in this cross-tab nearly exactly match the expected counts, making this test highly
insignificant.
2 = 0.516 P = 0.773 Yes No Total
High
Count 303 90 393
Expected 300.3 92.7
Moderate
Count 32 11 43
Expected 32.9 10.1
Low
Count 41 15 56
Expected 42.8 13.2
Total Count 376 116 492

REPORT NO. A.000.000
324
Q47 How long after the fire passed through your town or suburb did you first attempt to return?
Q47 by Q50 If there was another similar fire in your town or suburb would you take the same action in leaving?
A significant interaction exists between when respondents attempted to return and whether they would
take the same actions in similar circumstances. When attempts were made to return early (less than two
hours after the fire had passed through) there was an overrepresentation that respondents would take a
different course of action. Particularly where people attempted to return less than an hour after it had
passed, 50% would change their minds.
2 = 11.131 P = 0.025 Yes No Total
<1hr
Count 9 9 18
Expected 13.7 4.3
1-2hrs
Count 21 11 32
Expected 24.4 7.6
3-6hrs
Count 37 14 51
Expected 38.9 12.1
7-12hrs
Count 44 14 58
Expected 44.3 13.7
>12hrs
Count 256 66 322
Expected 245.7 76.3
Total Count 367 114 481

REPORT NO. A.000.000
325
Q47 by Q48. Why did you return? You may select more than one. (Multiple Response)
There was a significant association between how long people waited to return to their properties and the reason they returned. People who attempted to return to their
properties less than 6 hours after the fire had passed though stated they had done so to defend their property.
2= 122.883 P < 0.001 I felt the threat had passed
To defend my house and property
To see if my house survived
Check on safety of friends and family
Check on safety of livestock
Concerned about looting Other Total
<1hr Count 2 9 10 6 10 1 4 42
Expected 4.5 2.9 14.8 5.1 6.6 4.8 3.3
1-2hrs Count 10 14 24 12 15 8 2 85
Expected 9.1 5.9 29.9 10.4 13.3 9.7 6.6
3-6hrs Count 18 16 38 15 15 12 5 119
Expected 12.8 8.2 41.9 14.6 18.6 13.6 9.3
7-12hrs Count 15 8 52 20 27 18 1 141
Expected 15.1 9.8 49.6 17.3 22.1 16.1 11.0
>12hrs Count 62 22 227 69 89 75 66 610
Expected 65.5 42.2 214.8 74.6 95.4 69.7 47.7
Total Count 107 69 351 122 156 114 78 997

REPORT NO. A.000.000
326
11BSection 4. During the Bushfire – part 2
Q37. Which one of the following best describes what YOU did DURING the bushfire?
437B3The following questions refer only to those who stayed on their property (answered c, d, e, f, g or h at question 37).
424BQ37 c. Stayed and actively defended the house and property
425BQ37 d. Began defending the house and property from the fire but left when they felt the danger was too great
426BQ37 e. Stayed to actively defend the house or property, but the fire never arrived
The three items below were collapsed into the category No defence but sheltered on the property.
427BQ37 f. Did not actively defend the house and property but stayed throughout the fire and sheltered in the house
428BQ37 g. Did not actively defend the house and property but stayed throughout the fire and sheltered in a structure (other than the house) or vehicle
429BQ37 h. Did not actively defend the house and property but stayed throughout the fire and took refuge somewhere outside

REPORT NO. A.000.000
327
Q37 by Q51 What was the main reason you stayed with your home or property during the bushfire?
A significant association exists between what individuals did during the bushfire and the reason they stayed
with their property. Those who stayed on their property without defending it felt it was too late to leave
or their attempts to leave failed. Only 12 of the 31 people who stayed and did not defend stated they
wanted to protect their property.
2 = 157.844 P < 0.001 Protect house, property
and/or livestock
Too late to
leave
Attempts to leave
were unsuccessful Total
Stayed and
defended
Count 412 43 5 460
Expected 402.8 43.7 13.6
Started to defend
but left
Count 94 6 1 101
Expected 88.4 9.6 3.0
Stayed and
defended but no
fire
Count 17 2 0 19
Expected 16.6 1.8 .6
No defence, but
sheltered on
property
Count 12 7 12 31
Expected 27.1 2.9 .9
Total Count 535 58 18 611
*Q51 ‘Stayed because the fire never reached my house or property’, ‘Stayed because fire or emergency
services advised me to stay’ and ‘Stayed because relatives, friends or neighbours advised me to stay’ were
not included in this analysis as the total count was less than 5

REPORT NO. A.000.000
328
Q37 by Q56 How safe did you feel while staying at your house?
The association between what people did during the bushfire and how safe they felt in their home was
significant. In particular, those who felt safe were likely to be those who stayed and actively defended.
Those who started to defend but left felt unsafe on their property. If individuals stayed to defend but the
fire never arrived they were most likely to feel safe, however 5 of the 22 in this category felt unsafe.
Those who did not defend but sheltered on their property had a large overrepresentation as feeling unsafe.
2 = 90.437 P < 0.001 Safe
Neither safe or
unsafe Unsafe Total
Stayed and defended
Count 180 199 106 485
Expected 151.8 184.3 148.9
Started to defend but left
Count 10 33 69 112
Expected 35.1 42.6 34.4
Stayed and defended but no
fire
Count 11 6 5 22
Expected 6.9 8.4 6.8
No defence, but sheltered on
property
Count 5 12 22 39
Expected 12.2 14.8 12.0
Total Count 206 250 202 658

REPORT NO. A.000.000
329
Q37 by Q57 A Could do what was required to protect yourself and others? (As the fire approached your property on February 7th, how confident
were you that you…)
The actions that people took on February 7th are significantly associated with the confidence people had to
protect themselves and others. Those who stayed and defended felt confident they could do what was
required; only 10 out of 476 people had no confidence in their abilities to protect. Those who started to
defend but left had more people than expected state that they weren’t confident in their ability to
protect themselves and others. Most people who stayed without defending, were not confident that they
could do what was required to protect themselves and others.
2 = 103.134 P < 0.001 Very
confident Confident
Not very
confident
Not confident
at all Total
Stayed and defended
Count 140 279 47 10 476
Expected 122.5 256.6 67.1 29.9
Started to defend but
left
Count 20 45 29 19 113
Expected 29.1 60.9 15.9 7.1
Stayed and defended
but no fire
Count 5 12 3 1 21
Expected 5.4 11.3 3.0 1.3
No defence, but
sheltered on property
Count 3 16 13 11 43
Expected 11.1 23.2 6.1 2.7
Total Count 168 352 92 41 653
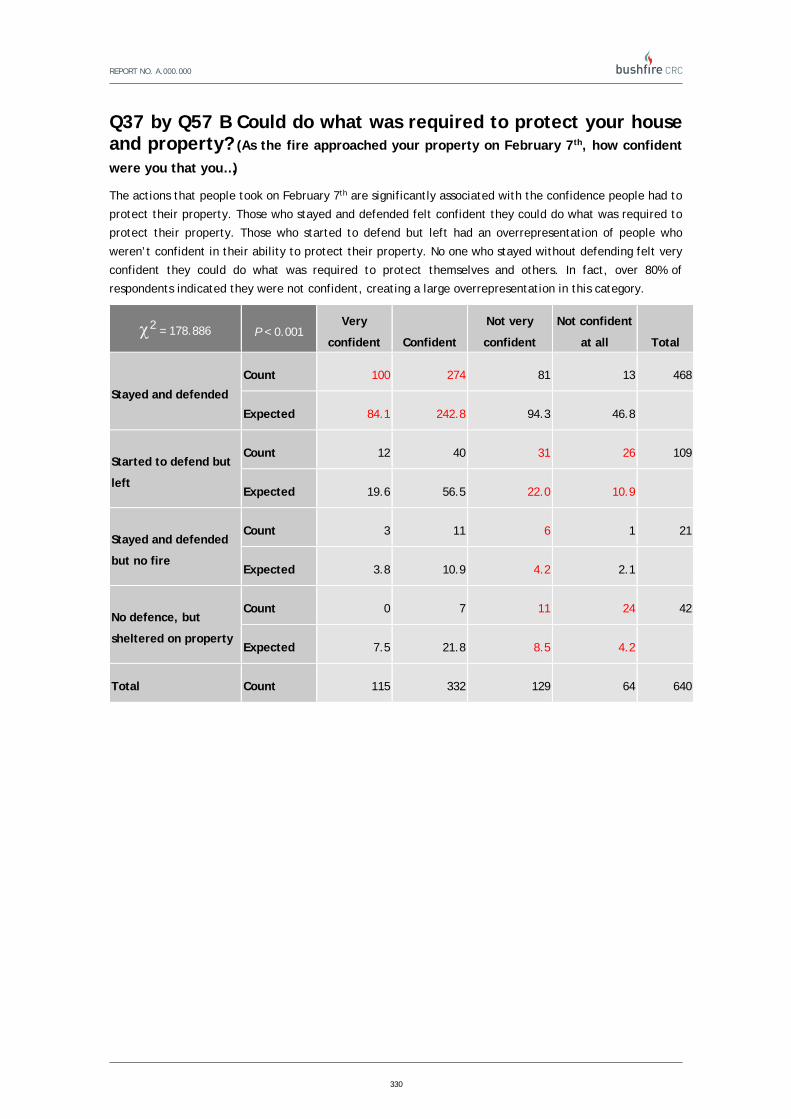
REPORT NO. A.000.000
330
Q37 by Q57 B Could do what was required to protect your house and property? (As the fire approached your property on February 7th, how confident
were you that you…)
The actions that people took on February 7th are significantly associated with the confidence people had to
protect their property. Those who stayed and defended felt confident they could do what was required to
protect their property. Those who started to defend but left had an overrepresentation of people who
weren’t confident in their ability to protect their property. No one who stayed without defending felt very
confident they could do what was required to protect themselves and others. In fact, over 80% of
respondents indicated they were not confident, creating a large overrepresentation in this category.
2 = 178.886 P < 0.001 Very
confident Confident
Not very
confident
Not confident
at all Total
Stayed and defended
Count 100 274 81 13 468
Expected 84.1 242.8 94.3 46.8
Started to defend but
left
Count 12 40 31 26 109
Expected 19.6 56.5 22.0 10.9
Stayed and defended
but no fire
Count 3 11 6 1 21
Expected 3.8 10.9 4.2 2.1
No defence, but
sheltered on property
Count 0 7 11 24 42
Expected 7.5 21.8 8.5 4.2
Total Count 115 332 129 64 640

REPORT NO. A.000.000
331
Q37 by Q57 C Would get help from other people? (e.g. neighbours, friends) (As the fire approached your property on February 7th, how
confident were you that you…)
No statistical association was found between people’s actions on February 7th and their confidence they
would receive help from other people. The majority of each category for what respondents did during the
bushfire indicated they were not confident they would get help.
2 = 15.907 P = 0.069 Very
confident Confident
Not very
confident
Not confident
at all Total
Stayed and defended
Count 28 71 87 273 459
Expected 29.6 73.9 88.7 266.8
Started to defend but
left
Count 6 14 24 58 102
Expected 6.6 16.4 19.7 59.3
Stayed and defended
but no fire
Count 4 7 5 6 22
Expected 1.4 3.5 4.3 12.8
No defence, but
sheltered on property
Count 2 8 4 24 38
Expected 2.4 6.1 7.3 22.1
Total Count 40 100 120 361 621

REPORT NO. A.000.000
332
Q37 by Q57 D Would get help from fire or emergency services? (As
the fire approached your property on February 7th, how confident were you that you…)
No association was found between what people did during the bushfires and confidence in getting help
from emergency services. Similarly to the previous question, respondents overwhelmingly stated they were
not confident that they would receive any help.
2 = 5.349 P = 0.803 Very
confident Confident
Not very
confident
Not confident
at all Total
Stayed and defended
Count 15 52 76 318 461
Expected 17.6 52.0 82.1 309.3
Started to defend but
left
Count 6 13 21 64 104
Expected 4.0 11.7 18.5 69.8
Stayed and defended
but no fire
Count 1 3 5 13 22
Expected .8 2.5 3.9 14.8
No defence, but
sheltered on property
Count 2 3 10 27 42
Expected 1.6 4.7 7.5 28.2
Total Count 24 71 112 422 629

REPORT NO. A.000.000
333
Q37 by Q60 Did you leave your property at any stage during the fire?
Those who stayed and defended mostly did not leave their property at any stage during the fire. As
expected people who started to defend but moved from their property, left during the fire. Respondents
who didn’t defend but stayed on their property were more likely to have left at some stage than not.
2 = 275.455 P < 0.001 Yes No Total
Stayed and defended
Count 88 409 497
Expected 171.3 325.7
Started to defend but left
Count 112 4 116
Expected 40.0 76.0
Stayed and defended but no
fire
Count 6 15 21
Expected 7.2 13.8
No defence, but sheltered on
property
Count 28 17 45
Expected 15.5 29.5
Total Count 234 445 679

REPORT NO. A.000.000
334
438BThis following questions were only answered by those who answered ‘yes’ at question 60.
Q37 by Q63 Where was the fire when you left your house or property?
Most people who left their property at some stage during the fire left when the fire was on their property.
The exception consisted of those who stayed to defend without the fire reaching their property left when
the fire was 100-500m away.
2 = 24.137 P = 0.004 On my property <100m 100-500m >500m Total
Stayed and defended
Count 36 18 4 7 65
Expected 34.1 15.1 9.1 6.7
Started to defend but
left
Count 50 22 17 9 98
Expected 51.4 22.8 13.8 10.1
Stayed and defended
but no fire
Count 0 0 3 0 3
Expected 1.6 .7 .4 .3
No defence, but
sheltered on property
Count 11 3 2 3 19
Expected 10.0 4.4 2.7 2.0
Total Count 97 43 26 19 185

REPORT NO. A.000.000
335
Q37 by Q64 When you left, where did you go?
Respondents who stayed to defend and left their property during the fire mainly went to another house
nearby. If individuals had started to defend but left they were most likely to go to a nearby town.
2 = 33.494 P < 0.001 Another house
nearby
Another
building
Open
arena
Nearby
town Total
Stayed and defended
Count 33 2 6 5 46
Expected 21.9 3.2 6.4 14.5
Started to defend but
left
Count 20 6 9 36 71
Expected 33.8 5.0 9.9 22.3
Stayed and defended
but no fire
Count 4 0 0 2 6
Expected 2.9 .4 .8 1.9
No defence, but
sheltered on property
Count 11 2 5 2 20
Expected 9.5 1.4 2.8 6.3
Total Count 68 10 20 45 143
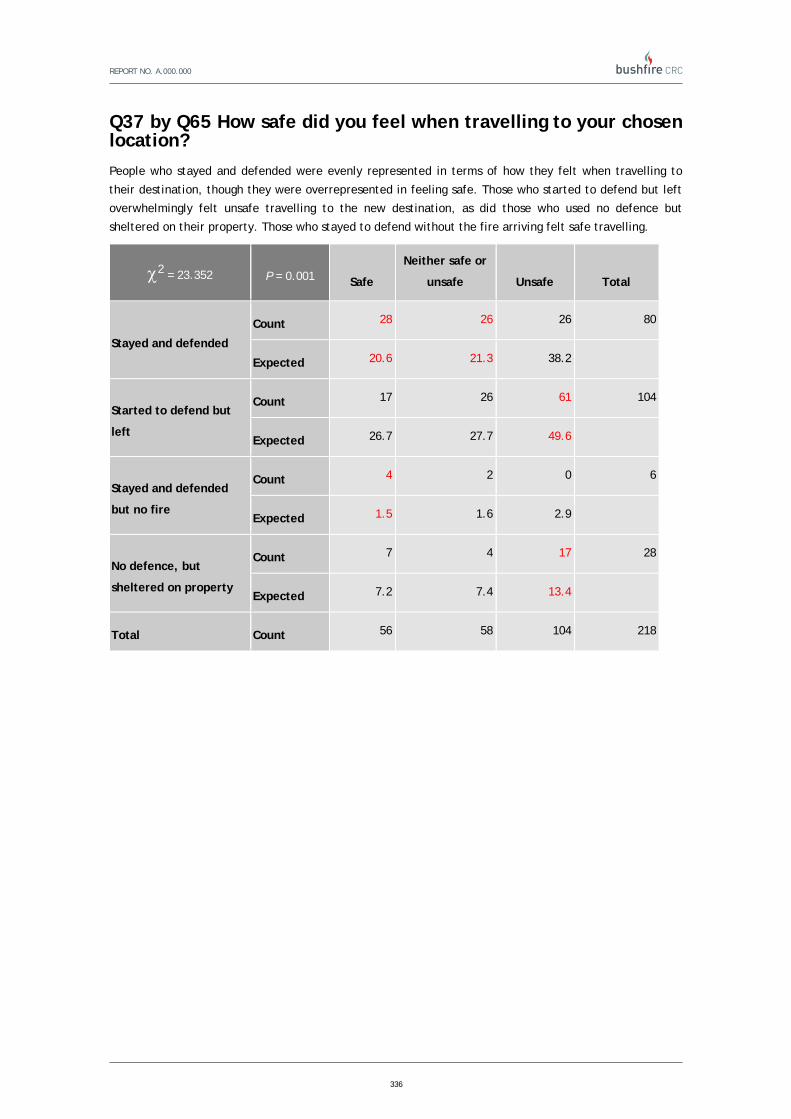
REPORT NO. A.000.000
336
Q37 by Q65 How safe did you feel when travelling to your chosen location?
People who stayed and defended were evenly represented in terms of how they felt when travelling to
their destination, though they were overrepresented in feeling safe. Those who started to defend but left
overwhelmingly felt unsafe travelling to the new destination, as did those who used no defence but
sheltered on their property. Those who stayed to defend without the fire arriving felt safe travelling.
2 = 23.352 P = 0.001 Safe
Neither safe or
unsafe Unsafe Total
Stayed and defended
Count 28 26 26 80
Expected 20.6 21.3 38.2
Started to defend but
left
Count 17 26 61 104
Expected 26.7 27.7 49.6
Stayed and defended
but no fire
Count 4 2 0 6
Expected 1.5 1.6 2.9
No defence, but
sheltered on property
Count 7 4 17 28
Expected 7.2 7.4 13.4
Total Count 56 58 104 218

REPORT NO. A.000.000
337
Q37 by Q67 When did you return to your property?
For respondents who stayed to defend their property but left at some stage had an overrepresentation of
returning before the fire or during the fire. All of those, except one, who stayed to defend but had no fire
left and returned to their property before the fire arrived. People who left their property after providing
no defence did not return before or during the bushfire, but were more likely to wait at least 3 hours
before returning.
2 = 73.842 P < 0.001 Before the
fire
During the
fire 1-2hrs 3-6hrs 7-12hrs >12hrs Total
Stayed and
defended
Count 5 6 10 6 5 9 41
Expected 2.9 2.6 9.0 8.4 6.4 11.8
Started to
defend but left
Count 0 3 18 16 12 24 73
Expected 5.1 4.6 15.9 14.9 11.3 21.1
Stayed and
defended but
no fire
Count 5 0 0 0 0 1 6
Expected .4 .4 1.3 1.2 .9 1.7
No defence, but
sheltered on
property
Count 0 0 3 7 5 7 22
Expected 1.5 1.4 4.8 4.5 3.4 6.4
Total Count 10 9 31 29 22 41 142

REPORT NO. A.000.000
338
Q37 by Q70 If there was another similar fire in your town or suburb, would you take the same action in staying to protect your home and property?
There is a strong association between what people did during the bushfire and whether they would take
the same course of action again. Those who stayed and defended had an over-representation in that they
would take the same course of action again. Those who started to defend but left had a majority of
people who would do the same again, however there was an overrepresentation of people who would do
something different. People who put up no defence but sheltered on their properties stated with the
majority that they would not take the same actions next time.
2 = 72.043 P < 0.001 Yes No Total
Stayed and defended
Count 409 67 409
Expected 373.7 102.3
Started to defend but left
Count 63 42 63
Expected 82.4 22.6
Stayed and defended but no
fire
Count 17 4 17
Expected 16.5 4.5
No defence, but sheltered
on property
Count 19 26 19
Expected 35.3 9.7
Total Count 508 139 647

REPORT NO. A.000.000
339
Q51 What was the main reason you stayed with your home or property during the bushfire?
Q51 by Q56 How safe did you feel while staying at your house?
People who felt it was too late to leave their property or failed in their attempts to leave felt unsafe
while in their home during the bushfire. Individuals who actively defended their property had an
overrepresentation of feeling safe, though the majority felt neither safe nor unsafe.
2 = 38.855 P < 0.001 Safe
Neither safe or
unsafe Unsafe Total
Protect house, property
and/or livestock
Count 184 202 130 516
Expected 168.5 196.6 150.9 516.0
Too late to leave
Count 8 18 31 57
Expected 18.6 21.7 16.7 57.0
Attempts to leave were
unsuccessful
Count 0 4 11 15
Expected 4.9 5.7 4.4 15.0
Total Count 192 224 172 588
*Q51 ‘Stayed because the fire never reached my house or property’, ‘Stayed because fire or emergency
services advised me to stay’ and ‘Stayed because relatives, friends or neighbours advised me to stay’ were
not included in this analysis as the total count was less than 5

REPORT NO. A.000.000
340
Q51 by Q57 A Could do what was required to protect yourself and others? (As the fire approached your property on February 7th, how confident
were you that you…)
For those who stayed to protect their property, most felt confident that they could protect themselves
and others. People who stayed because it was too late to leave or because their attempts to leave were
unsuccessful did not have confidence that they could protect themselves or others.
2 = 63.866 P < 0.001 Very
confident Confident
Not very
confident
Not confident
at all Total
Protect house,
property and/or
livestock
Count 150 285 58 17 510
Expected 138.6 277.2 67.1 27.0
Too late to leave
Count 7 30 12 8 57
Expected 15.5 31.0 7.5 3.0
Attempts to leave
were unsuccessful
Count 2 3 7 6 18
Expected 4.9 9.8 2.4 1.0
Total Count 159 318 77 31 585

REPORT NO. A.000.000
341
Q51 by Q57 B Could do what was required to protect your house and property? (As the fire approached your property on February 7th, how confident
were you that you…)
Confidence to protect homes and properties was felt by those who had stayed on their property to do that
specific task. This was not the case for people who had other reasons for staying (too late to leave and
attempts to leave were unsuccessful) as they lacked confidence in their abilities to perform this task.
2 = 76.97 P < 0.001 Very
confident Confident
Not very
confident
Not confident
at all Total
Protect house,
property and/or
livestock
Count 108 277 86 30 501
Expected 98.1 265.4 92.8 44.7
Too late to leave
Count 4 24 14 11 53
Expected 10.4 28.1 9.8 4.7
Attempts to leave
were unsuccessful
Count 0 2 6 10 18
Expected 3.5 9.5 3.3 1.6
Total Count 112 303 106 51 572

REPORT NO. A.000.000
342
Q51 by Q57 C Would get help from other people? (e.g. neighbours, friends) (As the fire approached your property on February 7th, how
confident were you that you…)
There was no association between the main reasons for staying on a property and confidence level of
receiving help from other people.
2 = 6.761 P = 0.343 Very
confident Confident
Not very
confident
Not confident
at all Total
Protect house,
property and/or
livestock
Count 34 74 101 276 485
Expected 32.4 77.9 97.2 277.5
Too late to leave
Count 3 13 8 28 52
Expected 3.5 8.4 10.4 29.8
Attempts to leave
were unsuccessful
Count 0 2 2 13 17
Expected 1.1 2.7 3.4 9.7
Total Count 37 89 111 317 554

REPORT NO. A.000.000
343
Q51 by Q57 D Would get help from fire or emergency services? (As
the fire approached your property on February 7th, how confident were you that you…)
The counts for this cross-tab virtually match the expected values exactly making this test non-significant.
2 = 1.933 P = 0.926 Very
confident Confident
Not very
confident
Not confident
at all Total
Protect house,
property and/or
livestock
Count 17 63 89 322 491
Expected 16.7 60.6 89.6 324.1
Too late to leave
Count 1 4 9 36 50
Expected 1.7 6.2 9.1 33.0
Attempts to leave
were unsuccessful
Count 1 2 4 11 18
Expected .6 2.2 3.3 11.9
Total Count 19 69 102 369 559

REPORT NO. A.000.000
344
Q51 by Q60 Did you leave your property at any stage during the fire? Those who stayed to protect their property mostly did not leave their property at any stage during the fire.
If respondent’s attempts to leave were unsuccessful they were less likely to have left their property at any
stage during the fire.
2 = 8.362 P = 0.015 Yes No Total
Protect house, property and/or livestock
Count 162 367 529
Expected Count 170.5 358.5
Too late to leave
Count 22 36 58
Expected Count 18.7 39.3
Attempts to leave were unsuccessful
Count 11 7 18
Expected Count 5.8 12.2
Total Count 195 410 605

REPORT NO. A.000.000
345
439BThis following questions were only answered by those who answered ‘yes’ at question 60.
Q51 by Q63 Where was the fire when you left your house or property?
There was no association between the main reason for staying on a property and where the fire was when
individuals left the property.
2 = 3.806 P = 0.703 On my
property <100m 100-500m >500m Total
Protect house,
property and/or
livestock
Count 68 27 23 12 130
Expected 67.1 29.0 20.7 13.2
Too late to leave
Count 9 5 2 3 19
Expected 9.8 4.2 3.0 1.9
Attempts to leave
were unsuccessful
Count 4 3 0 1 8
Expected 4.1 1.8 1.3 .8
Total Count 81 35 25 16 157
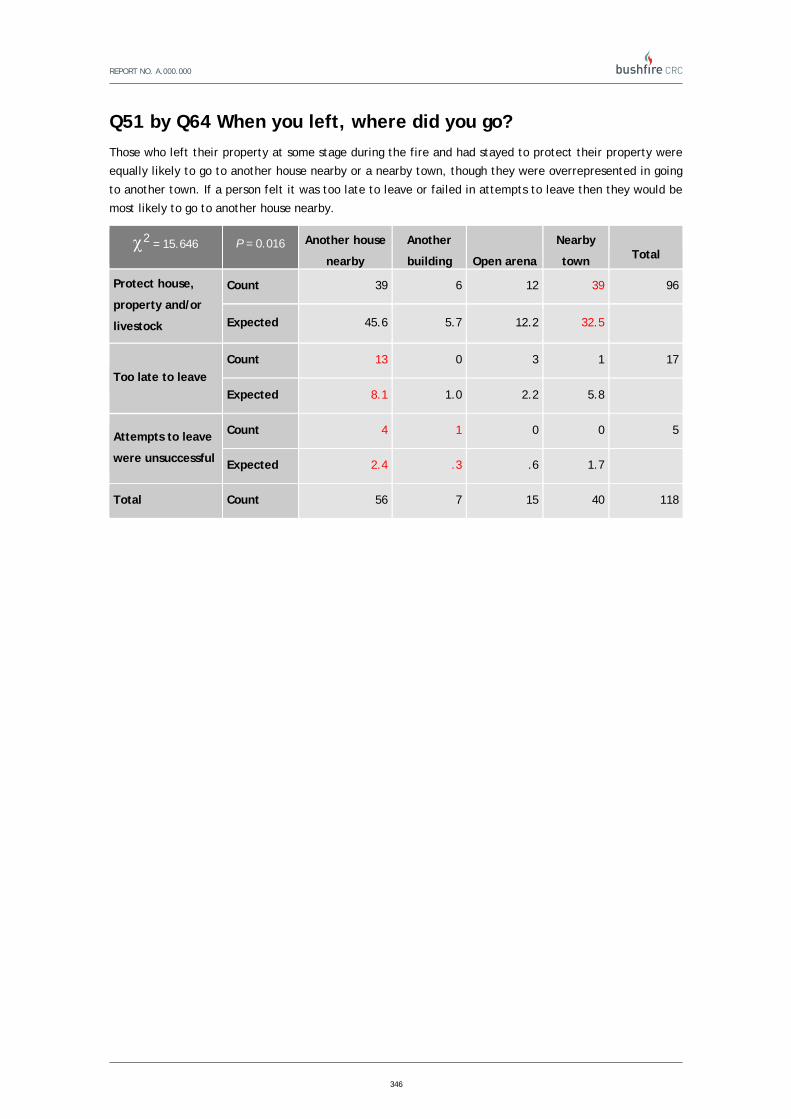
REPORT NO. A.000.000
346
Q51 by Q64 When you left, where did you go?
Those who left their property at some stage during the fire and had stayed to protect their property were
equally likely to go to another house nearby or a nearby town, though they were overrepresented in going
to another town. If a person felt it was too late to leave or failed in attempts to leave then they would be
most likely to go to another house nearby.
2 = 15.646 P = 0.016 Another house
nearby
Another
building Open arena
Nearby
town Total
Protect house,
property and/or
livestock
Count 39 6 12 39 96
Expected 45.6 5.7 12.2 32.5
Too late to leave
Count 13 0 3 1 17
Expected 8.1 1.0 2.2 5.8
Attempts to leave
were unsuccessful
Count 4 1 0 0 5
Expected 2.4 .3 .6 1.7
Total Count 56 7 15 40 118

REPORT NO. A.000.000
347
Q51 by Q65 How safe did you feel when travelling to your chosen location?
An association was found between reasons for staying on a property and level of safety felt when leaving
the property. When staying to protect property people felt safe in travelling to another location. If it was
too late to leave or attempts to leave failed then respondents felt unsafe in their travels.
2 = 15.943 P = 0.003
Safe
Neither safe or
unsafe Unsafe Total
Protect house,
property and/or
livestock
Count 48 41 59 148
Expected 40.3 39.5 68.2
Too late to leave
Count 1 4 16 21
Expected 5.7 5.6 9.7
Attempts to leave
were unsuccessful
Count 0 3 8 11
Expected 3.0 2.9 5.1
Total Count 49 48 83 180

REPORT NO. A.000.000
348
Q51 by Q70 If there was another similar fire in your town or suburb, would you take the same action in staying to protect your home and property?
When the main reason for staying was to protect the property respondents were very likely to want to take
the same action again, whereas those who stayed because it was too late to leave or were unsuccessful at
leaving were highly unlikely to do the same thing again.
2 = 101.524 P < 0.001 Yes No Total
Protect house,
property and/or
livestock
Count 436 67 503
Expected 405.9 97.1
Too late to leave
Count 26 30 56
Expected 45.2 10.8
Attempts to leave
were unsuccessful
Count 2 14 16
Expected 12.9 3.1
Total Count 464 111 575

REPORT NO. A.000.000
349
Q56 How safe did you feel while staying at your house?
Q56 by Q60 Did you leave your property at any stage during the fire? As expected, those who felt safe on their properties did not leave during the fire, whereas those who felt
unsafe left at some stage.
2 = 105.433 P < 0.001 Yes No Total
Safe
Count 40 165 205
Expected 69.2 135.8
Neither safe or unsafe
Count 75 173 248
Expected 83.7 164.3
Unsafe
Count 105 94 199
Expected 67.1 131.9
Total Count 220 432 652

REPORT NO. A.000.000
350
440BThis following questions were only answered by those who answered ‘yes’ at question 60.
Q56 by Q63 Where was the fire when you left your house or property?
There was no association between how safe a person felt on their property and how far away the fire was
when they left the property.
2 = 8.209 P = 0.223 On my
property <100m 100-500m >500m Total
Safe
Count 13 6 6 2 27
Expected 14.4 6.3 3.5 2.8
Neither safe or
unsafe
Count 25 12 9 9 55
Expected 29.4 12.8 7.2 5.6
Unsafe
Count 56 23 8 7 94
Expected 50.2 21.9 12.3 9.6
Total Count 94 41 23 18 176

REPORT NO. A.000.000
351
Q56 by Q64 When you left, where did you go?
There was no association between how safe a person felt on their property and where they went when
they left the property.
2 = 5.889 P = 0.435 Another house
nearby
Another
building Open arena Nearby town Total
Safe
Count 16 1 3 4 24
Expected 10.9 1.8 3.5 7.8
Neither safe or
unsafe
Count 19 3 6 16 44
Expected 20.1 3.2 6.5 14.2
Unsafe
Count 27 6 11 24 68
Expected 31.0 5.0 10.0 22.0
Total Count 62 10 20 44 136
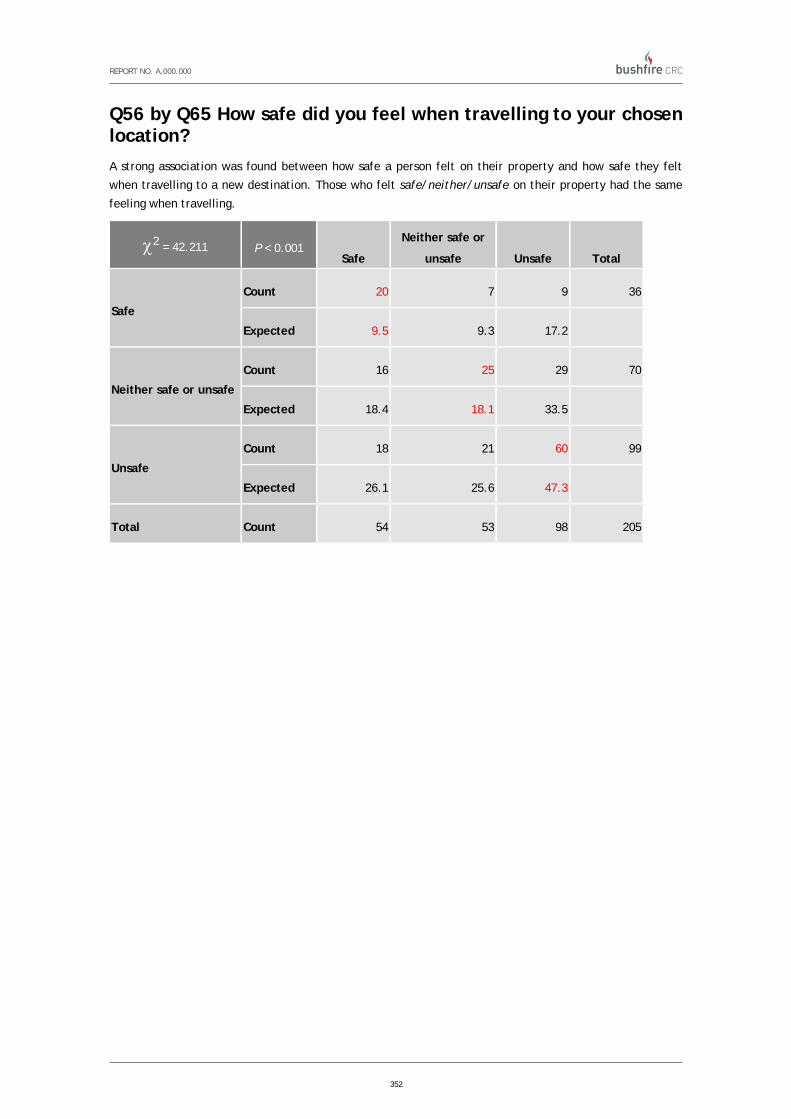
REPORT NO. A.000.000
352
Q56 by Q65 How safe did you feel when travelling to your chosen location?
A strong association was found between how safe a person felt on their property and how safe they felt
when travelling to a new destination. Those who felt safe/neither/unsafe on their property had the same
feeling when travelling.
2 = 42.211 P < 0.001 Safe
Neither safe or
unsafe Unsafe Total
Safe
Count 20 7 9 36
Expected 9.5 9.3 17.2
Neither safe or unsafe
Count 16 25 29 70
Expected 18.4 18.1 33.5
Unsafe
Count 18 21 60 99
Expected 26.1 25.6 47.3
Total Count 54 53 98 205

REPORT NO. A.000.000
353
Q56 by Q67 When did you return to your property?
An association exists between how safe a person felt on their property and when they returned to their
property after leaving during the bushfire. When an individual felt safe they returned to the property
before the fire arrived. Very few people who felt unsafe returned during the fire, and none returned
before it occurred.
2 = 36.991 P < 0.001 Before the
fire
During the
fire 1-2hrs 3-6hrs 7-12hrs >12hrs Total
Safe
Count 7 1 6 3 1 3 12
Expected 1.8 1.6 5.3 4.9 3.4 7.1
Neither safe
or unsafe
Count 3 6 5 8 9 13 17
Expected 3.4 3.0 9.7 9.0 6.4 13.1
Unsafe
Count 0 2 18 16 9 23 20
Expected 4.8 4.4 14.0 13.1 9.2 18.9
Total Count 10 9 29 27 19 39 49

REPORT NO. A.000.000
354
Q56 by Q70 If there was another similar fire in your town or suburb, would you take the same action in staying to protect your home and property?
People who felt safe or neither safe or unsafe indicated that in the event of a similar situation they would
take the same actions as in this instance. Those who felt unsafe had an overrepresentation of people who
would change their actions.
2 = 67.763 P < 0.001 Yes No Total
Safe
Count 182 16 198
Expected 155.4 42.6
Neither safe or unsafe
Count 192 39 231
Expected 181.3 49.7
Unsafe
Count 111 78 189
Expected 148.3 40.7
Total Count 485 133 618

REPORT NO. A.000.000
355
Q57 As the fire approached your property on February 7th, how confident were you that you…
Q57 A Could do what was required to protect yourself and others? by Q58. Did you receive help from any of the following sources when staying with your house? You may select more than one. (Multiple Response)
There was an association between an individual’s level of confidence in protecting themselves and others,
and receiving help.
2 = 38.593 P < 0.001 Other
household members
Family friends or neighbours
Emergency services Other
None of the above Total
Very confident
Count 86 76 21 13 36 232
Expected 85.9 76.7 20.9 12.3 36.3
Confident Count 186 169 47 28 61 491
Expected 181.7 162.4 44.2 26.0 76.8
Not very confident
Count 44 39 9 4 23 119
Expected 44.0 39.4 10.7 6.3 18.6
Not confident at all
Count 13 10 3 2 19 47
Expected 17.4 15.5 4.2 2.5 7.3
Total Count 329 294 80 47 139 889

REPORT NO. A.000.000
356
Q57 B Could do what was required to protect your house and property? by Q58 Did you receive help from any of the following sources when staying with your house? You may select more than one. (Multiple Response)
There was an association between an individual’s level of confidence in protecting their property and
receiving help. Those who did not feel confident that they could do enough to protect their property had
an overrepresentation that they did not receive any help from other sources. Residents who were
confident had help from other household members.
2 = 49.863 P < 0.001 Other
household members
Family friends or neighbours
Emergency services Other
None of the above Total
Very confident
Count 55 55 16 6 23 155
Expected 57.3 51.4 13.6 8.0 24.8
Confident Count 180 158 41 27 61 467
Expected 172.5 154.8 40.8 24.2 74.7
Not very confident
Count 68 54 15 10 26 173
Expected 63.9 57.3 15.1 9.0 27.7
Not confident at all
Count 18 21 4 2 29 74
Expected 27.3 24.5 6.5 3.8 11.8
Total Count 321 288 76 45 139 869

REPORT NO. A.000.000
357
Q57 C Would get help from other people? by Q58. Did you receive help from any of the following sources when staying with your house? You may select more than one. (Multiple Response)
A strong association was found between level of confidence of receiving help from other people and the
sources people received help from. Residents who were confident that they would get help from others
had an association with receiving help from family, friends or neighbours. Those who weren’t confident in
getting help had more people than expected who received no help from any source.
2 = 187.714 P < 0.001 Other
household members
Family friends or neighbours
Emergency services Other
None of the above Total
Very confident
Count 20 37 5 2 3 67
Expected 25.0 22.1 5.9 3.5 10.5
Confident Count 52 85 15 6 4 162
Expected 60.4 53.4 14.3 8.6 25.3
Not very confident
Count 65 57 18 9 22 171
Expected 63.8 56.3 15.1 9.1 26.8
Not confident at all
Count 180 101 37 28 104 450
Expected 167.8 148.2 39.7 23.8 70.4
Total Count 317 280 75 45 133 850

REPORT NO. A.000.000
358
Q57 D Would get help from fire or emergency services? by Q58. Did you receive help from any of the following sources when staying with your house? You may select more than one. (Multiple Response)
Most individuals had no confidence that they would be provided with help from emergency services. Those
who had confidence they would receive help actually did with a greater than expected frequency.
Surprisingly, residents who were not very confident that they would be provided with help had an
overrepresentation of help from emergency services.
2 = 121.867 P < 0.001 Other
household members
Family friends or neighbours
Emergency services Other
None of the above Total
Very confident
Count 8 16 11 0 3 38
Expected 13.9 12.6 3.4 2.0 6.1
Confident Count 38 38 23 5 10 114
Expected 41.8 37.7 10.1 6.0 18.4
Not very confident
Count 55 57 27 9 20 168
Expected 61.7 55.6 14.8 8.8 27.1
Not confident at all
Count 215 174 15 31 106 541
Expected 198.6 179.1 47.8 28.3 87.3
Total Count 316 285 76 45 139 861

REPORT NO. A.000.000
359
Q60 Did you leave your property at any stage during the fire?
Q60 by Q70 If there was another similar fire in your town or suburb, would you take the same action in staying to protect your home and property?
More people than expected who did not leave their property during the fires indicated that they would not
remain on their property given similar circumstances occurred again. Those who did leave their property
were more likely than expected to indicate that given similar circumstances they would leave their
property again.
Take same action?
2 = 67.763 P < 0.001 Yes No Total
Left
pro
pert
y?
No
Count 141 74 215
Expected 169.8 45.2
Yes
Count 362 60 422
Expected 333.2 88.8
Total Count 503 134 637

REPORT NO. A.000.000
360
Q61. Why did you leave your house or property? You may select more than one. (Multiple Response)
Q61 by Q63 Where was the fire when you left your house or property?
When a resident left their property because they smelt smoke there were more people than expected who
had the fire greater than 100 metres from their property. This was also true of the residents who had
flames near their property. Of those who left because the fire was in the immediate vicinity, over half had
the fire between 100 and 500 metres of the property.
Most of those who felt it was too dangerous to stay (56%) and left had the fire on their property. All of the
residents who left their property because they sustained an injury had the fire on their property. A large
proportion of residents who left to remove household members from danger had the fire on their property.
However, there was an overrepresentation of people who left for the same reason when the fire was more
than 500 metres away. All but 1 person who left because their home caught on fire left when the fire was
on their property.
2 = 93.388 P < 0.001 On my property <100m
100-500m >500m Total
Smelled smoke near by Count 6 8 6 5 25
Expected 9.3 4.4 2.3 1.4
Flames near by Count 22 15 12 3 52
Expected 19.3 9.2 4.8 3.0
Fire in immediate vicinity
Count 27 23 11 4 65
Expected 24.2 11.6 6.0 3.8
To get things to defend
Count 7 1 1 1 10
Expected 3.7 1.8 0.9 0.6
Emergency services said to
Count 4 3 2 2 11
Expected 4.1 2.0 1.0 0.6
Friends, relatives, neighbours said to
Count 11 9 4 3 27
Expected 10.0 4.8 2.5 1.6
Too dangerous Count 53 21 11 10 95
Expected 35.3 16.9 8.8 5.5
Sustained an injury Count 8 0 0 0 8
Expected 3.0 1.4 0.7 0.5
Remove household members from danger
Count 31 14 3 7 55
Expected 20.5 9.8 5.1 3.2
Fire fighting equipment failed
Count 33 13 4 3 53
Expected 19.7 9.4 4.9 3.1
House caught on fire Count 31 0 1 0 32
Expected 11.9 5.7 3.0 1.8

REPORT NO. A.000.000
361
Total Count 161 77 40 25 433

REPORT NO. A.000.000
362
Q63 Where was the fire when you left your house or property?
Q63 by Q65 How safe did you feel when travelling to your chosen location?
There was no association between the location of the fire when people left and how safe they felt
travelling to a new location.
2 = 3.505 P = 0.743 Safe
Neither safe or
unsafe Unsafe Total
On my property
Count 19 24 52 95
Expected 21.6 24.3 49.1
<100m
Count 9 9 22 40
Expected 9.1 10.2 20.7
100-500m
Count 7 9 10 26
Expected 5.9 6.6 13.4
>500m
Count 6 4 9 19
Expected 4.3 4.9 9.8
Total Count 41 46 93 180
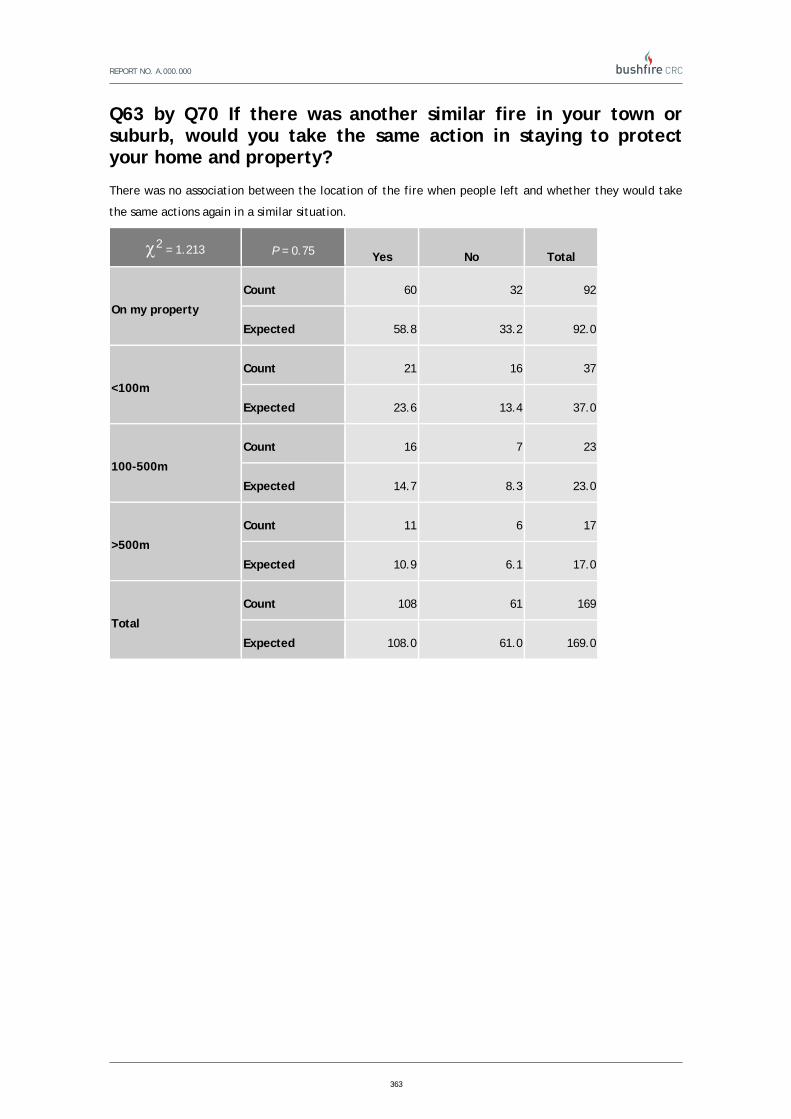
REPORT NO. A.000.000
363
Q63 by Q70 If there was another similar fire in your town or suburb, would you take the same action in staying to protect your home and property?
There was no association between the location of the fire when people left and whether they would take
the same actions again in a similar situation.
2 = 1.213 P = 0.75 Yes No Total
On my property
Count 60 32 92
Expected 58.8 33.2 92.0
<100m
Count 21 16 37
Expected 23.6 13.4 37.0
100-500m
Count 16 7 23
Expected 14.7 8.3 23.0
>500m
Count 11 6 17
Expected 10.9 6.1 17.0
Total Count 108 61 169
Expected 108.0 61.0 169.0

REPORT NO. A.000.000
364
Q64 When you left, where did you go?
Q64 by Q65 How safe did you feel when travelling to your chosen location?
There was no association between where people went to when they left and how safe they felt getting
there.
2 = 7.478 P = 0.279 Safe
Neither safe or
unsafe Unsafe Total
Another house nearby
Count 23 17 28 68
Expected 18.7 18.2 31.1 68.0
Another building
Count 1 5 4 10
Expected 2.7 2.7 4.6 10.0
Open arena
Count 7 4 9 20
Expected 5.5 5.4 9.2 20.0
Nearby town
Count 8 12 24 44
Expected 12.1 11.8 20.1 44.0
Total
Count 39 38 65 142
Expected 39.0 38.0 65.0 142.0

REPORT NO. A.000.000
365
Q64 by Q67 When did you return to your property?
When respondents went to another house nearby they were the most likely to return during the fire or
before the fire. If individuals went to an open arena or a nearby town then they were most likely to return
over 12 hours later.
2 = 36.991 P < 0.001 Before the
fire
During the
fire 1-2hrs 3-6hrs 7-12hrs >12hrs Total
Another house
nearby
Count 6 6 13 12 4 8 49
Expected 3.3 3.7 10.3 9.3 7.0 15.4
Another
building
Count 0 1 2 2 2 2 9
Expected 0.6 0.7 1.9 1.7 1.3 2.8
Open arena
Count 0 0 4 1 1 9 15
Expected 1.0 1.1 3.1 2.9 2.1 4.7
Nearby town
Count 1 1 3 5 8 14 32
Expected 2.1 2.4 6.7 6.1 4.6 10.1
Total Count 7 8 22 20 15 33 105

REPORT NO. A.000.000
366
Q64 by Q70 If there was another similar fire in your town or suburb, would you take the same action in staying to protect your home and property?
There was no association between where people went when they left their properties and whether or no
they would take the same course of action again in a similar situation.
2 = 4.094 P = 0.252 Yes No Total
Another house nearby
Count 44 19 63
Expected 39.8 23.2
Another building
Count 6 4 10
Expected 6.3 3.7
Open arena
Count 9 11 20
Expected 12.6 7.4
Nearby town
Count 25 15 40
Expected 25.3 14.7
Total Count 84 49 133
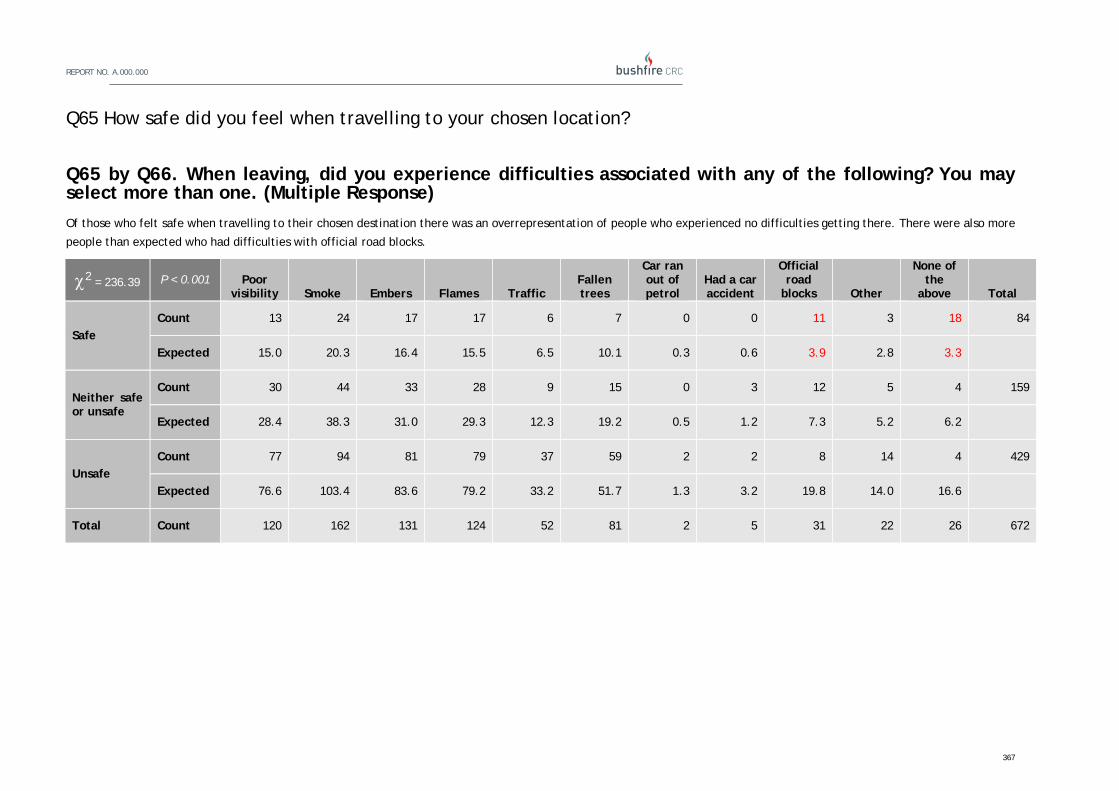
REPORT NO. A.000.000
367
Q65 How safe did you feel when travelling to your chosen location?
Q65 by Q66. When leaving, did you experience difficulties associated with any of the following? You may select more than one. (Multiple Response)
Of those who felt safe when travelling to their chosen destination there was an overrepresentation of people who experienced no difficulties getting there. There were also more
people than expected who had difficulties with official road blocks.
2 = 236.39 P < 0.001 Poor visibility Smoke Embers Flames Traffic
Fallen trees
Car ran out of petrol
Had a car accident
Official road
blocks Other
None of the
above Total
Safe Count 13 24 17 17 6 7 0 0 11 3 18 84
Expected 15.0 20.3 16.4 15.5 6.5 10.1 0.3 0.6 3.9 2.8 3.3
Neither safe or unsafe
Count 30 44 33 28 9 15 0 3 12 5 4 159
Expected 28.4 38.3 31.0 29.3 12.3 19.2 0.5 1.2 7.3 5.2 6.2
Unsafe Count 77 94 81 79 37 59 2 2 8 14 4 429
Expected 76.6 103.4 83.6 79.2 33.2 51.7 1.3 3.2 19.8 14.0 16.6
Total Count 120 162 131 124 52 81 2 5 31 22 26 672

REPORT NO. A.000.000
368
Q65 by Q67 When did you return to your property?
An association was found between feelings of safety when travelling to a new location and the time of
return to the property. If people felt safe they were the most likely to return to their properties before the
fire arrived.
2 = 21.839 P = 0.016 Before the
fire
During the
fire 1-2hrs 3-6hrs 7-12hrs >12hrs Total
Safe
Count 7 3 11 7 8 6 42
Expected 2.8 2.8 9.1 8.2 6.5 12.5
Neither safe
or unsafe
Count 2 4 8 6 8 9 37
Expected 2.5 2.5 8.0 7.3 5.8 11.0
Unsafe
Count 1 3 13 16 7 29 69
Expected 4.7 4.7 14.9 13.5 10.7 20.5
Total Count 10 10 32 29 23 44 148

REPORT NO. A.000.000
369
Q65 by Q70 If there was another similar fire in your town or suburb, would you take the same action in staying to protect your home and property?
Opposing views of whether the same actions would be taken again were held by those who felt safe and
unsafe when travelling to a new location creating a significant association. Those who felt safe would take
the same course of action while those who felt unsafe would do something different.
2 = 13.83 P = 0.001 Yes No Total
Safe
Count 46 12 58
Expected 37.4 20.6
Neither safe or
unsafe
Count 40 16 56
Expected 36.1 19.9
Unsafe
Count 50 47 97
Expected 62.5 34.5
Total Count 136 75 211

REPORT NO. A.000.000
370
Q67 When did you return to your property?
Q67 by Q68. Why did you return? You may select more than one. (Multiple Response)
Residents who returned to their property before or during the fire most frequently returned to defend their home and property. If returning later than 7 hours after the fire had
passed residents were mainly going back to see if their house had survived. When people returned more than 12 hours after the fire had passed there was an overrepresentation
of people who had returned to check on the safety of livestock or who were concerned about looting.
2 = 92.228 P < 0.001 I felt the threat had passed
To defend my house and property
To see if my house survived
Check on safety of friends and family
Check on safety of livestock
Concerned about looting Other Total
Before the fire
Count 0 9 1 2 1 1 0 14
Expected 1.5 2.2 2.6 0.9 1.3 0.7 0.8
During the fire
Count 4 9 5 3 3 0 0 24
Expected 2.6 3.8 4.5 1.5 2.2 1.2 1.3
1-2hrs Count 9 11 12 5 5 3 6 51
Expected 5.6 8.0 9.5 3.2 4.7 2.6 2.8
3-6hrs Count 11 8 17 4 9 5 6 60
Expected 6.6 9.4 11.2 3.7 5.5 3.1 3.3
7-12hrs Count 6 6 16 3 7 5 3 46
Expected 5.0 7.2 8.6 2.9 4.2 2.4 2.5
>12hrs Count 8 4 28 3 15 15 6 79
Expected 8.6 12.4 14.7 4.9 7.2 4.0 4.3
Total Count 30 43 51 17 25 14 15 274

REPORT NO. A.000.000
371
Q67 by Q70 If there was another similar fire in your town or suburb, would you take the same action in staying to protect your home and property?
There was no association between when a respondent returned to their property and whether or not they
would take the same course of action.
2 = 9.748 P = 0.083 Yes No Total
Before the fire
Count 9 1 10
Expected 6.5 3.5
During the fire
Count 8 1 9
Expected 5.8 3.2
1-2hrs
Count 22 8 30
Expected 19.4 10.6
3-6hrs
Count 16 13 29
Expected 18.8 10.2
7-12hrs
Count 13 9 22
Expected 14.3 7.7
>12hrs
Count 24 18 42
Expected 27.2 14.8
Total Count 92 50 142