67 Effects of fillers on the fracture behaviour of ...core.ac.uk/download/pdf/11040591.pdf ·...
12
Effects of fillers on the fracture behaviour of particulate polyester composites K J Wong 1 , B F Yousif 2 *, K O Low 1 , Y Ng 1 , and S L Tan 1 1 Faculty of Engineering and Technology, Multimedia University, Jalan Ayer Keroh Lama, Melaka, Malaysia 2 Faculty of Engineering, University of Nottingham Malaysia, Jalan Broga, Semenyih, Selangor, Malaysia The manuscript was received on 15 April 2009 and was accepted after revision for publication on 4 September 2009. DOI: 10.1243/03093247JSA553 Abstract: In the current work, the fracture toughness of sand-particle- and wood-flake- reinforced polyester composites was studied under a linear elastic fracture mechanics approach. The effects of the particulate volume fraction (0–60 vol %) were studied. Scanning electron microscopy was used to observe the damage features on the composite surface. Results showed that sand-particle- and fine-wood-flake-reinforced polymer composites exhibited better results at 40 vol % than at other particulate volume fractions. Meanwhile, coarse-wood-flake-reinforced polymer composites showed higher properties at 30 vol % than at other particulate volume fractions. Observation of the composite surface after tests showed that sand particles have poor interfacial adhesion compared with wood flakes. Keywords: sand particles, wood flakes, polyester composites, fracture toughness 1 INTRODUCTION Unsaturated polyester is widely used for pipes, tanks, boat hulls, architectural panels, car bodies, panels in aircraft, and stackable chairs [1, 2]. Many attempts have been made to improve the structural properties of polyester. One of the critical issues in unsaturated polyester is the poor mechanical resis- tance to cracks because it is difficult to produce flaw- free materials. To overcome the above problem, reinforcements (particles, fibres, etc.) have been used for polyester. Particulate composites have the advantage of simpli- city of fabrication and low cost compared with fibrous and laminate composites [3]. Particulates chosen as reinforcement are usually harder and stiffer than the matrix material. This improves the hardness and stiffness of polymeric composites. However, owing to the limited surface area of contact, the load transfer from matrix to particles occurs to a smaller extent. This could lead to insignificant improvement in strength and impact resistance [3, 4]. Several analyses have been carried out to study the effects of particulates on the mechanical properties of polymeric composites. For example, Zahran [5] studied the effects of sand particle size, shape, and content on the solid state deformation, flow, and fracture behaviour of polyethylene composites. In that work, smaller particles exhibited better reinfor- cing ability, while larger particles reduced the tensile modulus of the composites and decreased the tensile strength. In other words, sand fillers reduced the yield strength, ductility, and energy absorbed to fracture of the composites. Spanoudakis and Young [6] tested glass-particle-filled epoxy resin and reported that increasing the particle volume fraction increased both Young’s modulus and the fracture toughness. Also, increasing the particle size decreased Young’s modulus; this was due to the ‘skin’ effect. As for the fracture toughness, the highest value was obtained at the highest volume fraction of the largest particles. Moloney et al. [7] studied the effects of several parameters on the mechanical properties of particu- late composites. The results showed that the tensile strength, tensile modulus, flexural strength, flexural modulus, compressive yield strength, and fracture toughness improved with increasing volume fraction of silica particulates. However, the tensile strengths of the composites were always lower than that of the *Corresponding author: Faculty of Engineering, University of Nottingham Malaysia, Jalan Broga, Semenyih 43500, Selangor, Malaysia. email: [email protected]; [email protected] 67 JSA553 J. Strain Analysis Vol. 45
Transcript of 67 Effects of fillers on the fracture behaviour of ...core.ac.uk/download/pdf/11040591.pdf ·...

Effects of fillers on the fracture behaviour of particulatepolyester compositesK J Wong1, B F Yousif2*, K O Low1, Y Ng1, and S L Tan1
1Faculty of Engineering and Technology, Multimedia University, Jalan Ayer Keroh Lama, Melaka, Malaysia2Faculty of Engineering, University of Nottingham Malaysia, Jalan Broga, Semenyih, Selangor, Malaysia
The manuscript was received on 15 April 2009 and was accepted after revision for publication on 4 September 2009.
DOI: 10.1243/03093247JSA553
Abstract: In the current work, the fracture toughness of sand-particle- and wood-flake-reinforced polyester composites was studied under a linear elastic fracture mechanicsapproach. The effects of the particulate volume fraction (0–60 vol %) were studied. Scanningelectron microscopy was used to observe the damage features on the composite surface.Results showed that sand-particle- and fine-wood-flake-reinforced polymer compositesexhibited better results at 40 vol % than at other particulate volume fractions. Meanwhile,coarse-wood-flake-reinforced polymer composites showed higher properties at 30 vol % than atother particulate volume fractions. Observation of the composite surface after tests showedthat sand particles have poor interfacial adhesion compared with wood flakes.
Keywords: sand particles, wood flakes, polyester composites, fracture toughness
1 INTRODUCTION
Unsaturated polyester is widely used for pipes,
tanks, boat hulls, architectural panels, car bodies,
panels in aircraft, and stackable chairs [1, 2]. Many
attempts have been made to improve the structural
properties of polyester. One of the critical issues in
unsaturated polyester is the poor mechanical resis-
tance to cracks because it is difficult to produce flaw-
free materials.
To overcome the above problem, reinforcements
(particles, fibres, etc.) have been used for polyester.
Particulate composites have the advantage of simpli-
city of fabrication and low cost compared with fibrous
and laminate composites [3]. Particulates chosen as
reinforcement are usually harder and stiffer than the
matrix material. This improves the hardness and
stiffness of polymeric composites. However, owing to
the limited surface area of contact, the load transfer
from matrix to particles occurs to a smaller extent.
This could lead to insignificant improvement in
strength and impact resistance [3, 4].
Several analyses have been carried out to study the
effects of particulates on the mechanical properties
of polymeric composites. For example, Zahran [5]
studied the effects of sand particle size, shape, and
content on the solid state deformation, flow, and
fracture behaviour of polyethylene composites. In
that work, smaller particles exhibited better reinfor-
cing ability, while larger particles reduced the tensile
modulus of the composites and decreased the tensile
strength. In other words, sand fillers reduced the yield
strength, ductility, and energy absorbed to fracture of
the composites. Spanoudakis and Young [6] tested
glass-particle-filled epoxy resin and reported that
increasing the particle volume fraction increased
both Young’s modulus and the fracture toughness.
Also, increasing the particle size decreased Young’s
modulus; this was due to the ‘skin’ effect. As for the
fracture toughness, the highest value was obtained at
the highest volume fraction of the largest particles.
Moloney et al. [7] studied the effects of several
parameters on the mechanical properties of particu-
late composites. The results showed that the tensile
strength, tensile modulus, flexural strength, flexural
modulus, compressive yield strength, and fracture
toughness improved with increasing volume fraction
of silica particulates. However, the tensile strengths of
the composites were always lower than that of the
*Corresponding author: Faculty of Engineering, University of
Nottingham Malaysia, Jalan Broga, Semenyih 43500, Selangor,
Malaysia.
email: [email protected]; [email protected]
67
JSA553 J. Strain Analysis Vol. 45

neat epoxy when the volume fraction was lower than
50 vol %. Also, larger particle sizes decreased the
flexural strength of the composites. Nakamura and
Yamaguchi [8] reported that the fracture toughness
and energy release rate of spherical-silica-particle-
reinforced epoxy composites improved with increas-
ing particle size (between 6mm and 42mm). In other
research studies [9, 10], it has been reported that
increasing the particle size decreased the flexural
strength improved the fracture toughness of poly-
meric composites [10]. Kitey and Tippur [11, 12] have
studied the effects of the particle size (7–200mm) on
the dynamic fracture of glass-bead-filled epoxy
composites. In that research, the elastic properties
were unaffected by the particle size and bonding
strength. For untreated particulate composites, the
highest fracture toughness was obtained at a particle
size of 35mm. A further increase or decrease in the
particle size was found to cause the fracture tough-
ness to deteriorate further.
Mall et al. [13] studied the effects of the sand filler
size and ductility of polyester on the fracture
toughness of particulate composites. The fracture
toughness was directly influenced by the matrix
ductility. However, the filler size had less effect. Also,
Vipulanandan and Dharmarajan [14] studied the
fracture behaviour of sand-particle-filled epoxy and
polyester composites at various notch depths. The
results of that work showed that both epoxy and
polyester composites were sensitive to the notch
depth. Increasing the polymer content increased the
fracture toughness of both epoxy and polyester
composites. The impact fracture behaviour of high-
density polyethylene (HDPE) composites reinforced
with pine wood chips has been studied [15]. It was
found that large wood chips with a volume fraction
of 50–60 vol % increased the fracture energy of the
composites. In contrast, specimens with smaller
wood chips absorbed less energy.
Chtourou et al. [16] reinforced recycled polyolefins
with pulp fibres and reported that the strength and
toughness of the composite were increased with the
addition of fibre. Sawdust-reinforced post-consumer
HDPE composites were studied by Cui et al. [17]. The
results indicated that wood fibre reinforcement
introduced a higher melting point and a slower
crystallization rate. Increasing the wood fibre weight
fraction increased the flexural strength of the com-
posites. However, a longer fibre length had an adverse
effect on the flexural strength. Also, increasing the
wood fibre content decreased the Charpy impact
strength.
In this study, two types of filler were chosen: sand
particles and wood flakes. For wood flakes, two types
were selected (fine and coarse flakes). Three differ-
ent types of particulate composite were fabricated,
namely sand-particle-reinforced polyester (SPRP),
fine-wood-flake-reinforced polyester (FWFRP), and
coarse-wood-flake-reinforced polyester (CWFRP), at
different volume fractions. Linear elastic fracture
mechanics (LEFM) were adopted to study the
fracture behaviour of compact tension (CT) speci-
mens under mode I loading [18].
2 EXPERIMENTAL DETAILS
2.1 Materials
Unsaturated polyester (UP) resin (SYNOLAC
3317AW) was used as resin for the current work
and was supplied by Jiashan Anserly Glass Fibre Co.
Ltd, Malaysia. Sand particles were obtained from a
construction site in Melaka, Malaysia. Sand particles
were sieved by a filter net with a mesh size of
1 mm61 mm to eliminate rocks and impurities. For
impurities smaller than that, it is assumed that the
amount is less, thus having insignificant affect on
the properties of the composites. This will be further
verified in section 3.3 (see Fig. 16(b)). The filtered
particles were immersed in water and then washed
to clean the surfaces of the particles. This step was
repeated five times to ensure cleanliness. After that,
the particles were dried for 5 h. The size of the
particles was determined using an NJF-1 optical
microscope. Ten samples were chosen and the
average cross-sectional area was obtained as
0.022 ¡ 0.002 mm2 (Fig. 1). The sand particles were
categorized as fine particles according to the
Krumbein [19] scale.
Fig. 1 Average size of the sand particles used in thisstudy
68 K J Wong, B F Yousif, K O Low, Y Ng, and S L Tan
J. Strain Analysis Vol. 45 JSA553

Wood flakes were obtained locally from a wood-
manufacturing factory. The wood flakes were a waste
product from the sawdust of Chengal (Neobalano-
carpus heimii) wood pieces. Generally, the wood
flakes were categorized as fine (1.2 mm2) and coarse
(7.5 mm2) (Fig. 2). Table 1 shows some of the
physical and mechanical properties of UP, sand
particles, and wood flakes.
2.2 Fabrication of samples
Three different types of particulate composite were
fabricated at different volume fractions. These
composites are SPRP, FWFRP, and CWFRP. The
specimens were fabricated using the hand lay-up
technique. First, the inner surfaces of a metal mould
(the same size as the specimen) were coated with a
thin layer of wax as the release agent. The UP resin
was mixed with 1 vol % methyl ethyl ketone peroxide
catalyst as hardener. Sand particles or wood flakes
were added to the mixed resin and poured slowly
into the mould. The prepared samples were cured at
room temperature for 24 h. Specimens were fabri-
cated with different volume fractions ranging from
0 vol % to 60 vol % for all types of composite, in
increments of 10 vol %. The specimens were then
sawn with a saw blade of 0.5 mm thickness to initiate
sharp precracks.
A schematic diagram of a CT specimen is
illustrated in Fig. 3. The dimensions of the speci-
mens were determined according to ASTM D5045-99
[24]. The dimensions of the tensile specimens
(Fig. 4) were according to ASTM D638-99 [25], and
they were fabricated using a similar procedure to
that used for the CT specimens.
Fig. 2 Average size of the wood flakes used in thisstudy
Table 1 Physical and mechanical properties of UP and Chengal wood [20–23]
Tensile strength (MPa) Young’s modulus (GPa) Elongation at breaking point (%) Density (mg/m3)
UP 50 3.5 2–3 1.2–1.5Sand — 73.1 — —Chengal wood 149 19.6 — 0.915–0.980
Fig. 3 Schematic diagram of a CT specimen
Fig. 4 Schematic diagram of a tensile test specimen
Fracture behaviour of particulate polyester composites 69
JSA553 J. Strain Analysis Vol. 45

2.3 Experimental procedure
The fracture toughness and tensile tests were
conducted using a 100Q stand-alone universal test
system according to ASTM D5045-99 and ASTM
D638-99 respectively. Tensile tests were conducted
to obtain Young’s modulus as the input to determine
the critical energy release rate. The tests were
performed at room temperature, with cross-head
speed of 1.5 mm/min for all tests. The precrack for
fracture toughness tests was 3 mm. Each test was
repeated five times for each type of specimen, and
the average values were determined. The load P at
breaking point and the corresponding displacement
were recorded. The fracture toughness KIc was
calculated using the following equations. The critical
stress intensity factor or facture toughness is given
by
KIc~P
Bffiffiffiffiwp f
a
w
� �ð1Þ
For a CT specimen, the geometry factor f(a/w) is
given by
fa
w
� �~
2za=w
1{a=wð Þ1:50:866z4:64
a
w{13:32
a
w
� �2�
z14:72a
w
� �3
{5:6a
w
� �4�ð2Þ
where the relevant parameters are illustrated in
Fig. 3.
The particulate composites throughout this study
are assumed to be isotropic, which is a similar
assumption to that made by Silva et al. [18] for short-
fibre composites. The assumption is supported by
the fact that sand particles are essentially round.
Also, thin wood flakes, which are primarily two
dimensional, can be assumed to impart equal
strength in all directions in their plane [3]. Compar-
ing the current work with the sisal and coconut
fibres (1 cm long) used in the work reported in
reference [18], coarse wood flakes are considered
sufficiently small. Hence, it is assumed that the
random distribution of wood flakes does not affect
the properties of the composites in different planes.
Also, plane strain applies under the conditions
that both neat polyester and glass-fibre-reinforced
composites show a linear elastic material response
up to the peak load and satisfy the condition
Bw2:5K 2
Ic
s2yield
ð3Þ
2.4 Morphology study
The morphology of the fibre and matrix surfaces was
studied using scanning electron microscopy (JEOL-
JSM 840, Japan). All specimens were gold sputtered
using an auto fine coater (JEOL JFC-1600, Japan)
before the analysis.
3 RESULTS AND DISCUSSION
3.1 Tensile properties
Figure 5 represents the stress–strain curves of neat
polyester and all the composites (SPRP, FWFRP, and
CWFRP) at 50 vol % reinforcement. The figure shows
relatively linear curves until ultimate failure. This
Fig. 5 Stress–strain curves of neat polyester and of SPRP, FWFRP, and CWFRP composites with50 vol % of reinforcement
70 K J Wong, B F Yousif, K O Low, Y Ng, and S L Tan
J. Strain Analysis Vol. 45 JSA553

indicates that all the materials have a linear elastic
and brittle behaviour. Figures 6 and 7 show the
effects of the particulate volume fraction on the yield
strength and Young’s modulus of all types of
composite. The average yield strength of neat
polyester is about 49 MPa, which is close to the
value (50 MPa) established in references [20] and
[21]. Young’s modulus is about 3.55 GPa, which is
similar to the values reported in references [20] and
[21]. It can be seen that the highest yield strength is
achieved at 40 vol % for SPRP and FWFRP, while
30 vol % for CWFRP exhibits the best result. Regard-
ing the improvement gain in the yield strength of
polyester, the maximum is 123 per cent for SPRP, 88
per cent for CWFRP, and 62 per cent for FWFRP.
Similar observations are obtained for Young’s mod-
ulus, i.e. maximum improvements of 117 per cent for
SPRP, 75 per cent for FWFRP, and 56 per cent for
CWFRP. This could be because the fillers used in this
study have better mechanical properties than neat
polyester does.
According to Ishai and Cohen [26], the composite
modulus of cubic particle composites, for the iso-
strain condition, is described by
Ec~Em 1zVp
½m=(m{1){V1=3p �
( )ð4Þ
and, for the iso-stress condition, is given by
Ec~Em1z(m{1)V
2=3p
1z(m{1)(V2=3p {Vp)
ð5Þ
where
Ec 5 composite modulus
Em 5 matrix modulus
Vp 5 particulate volume fraction
m 5 modular ratio (i.e. ratio of the particulate
modulus to the matrix modulus)
Equations (4) and (5) with the composite modulus
obtained experimentally are plotted together, as
Fig. 6 Yield strength of SPRP, FWFRP, and CWFRP composites with different particulatecontents
Fig. 7 Young’s modulus of SPRP, FWFRP, and CWFRP composites with different particulatecontents
Fracture behaviour of particulate polyester composites 71
JSA553 J. Strain Analysis Vol. 45

shown in Figs 8 and 9. From Fig. 8, it is observed
that, up to 40 vol % of reinforcement, the experi-
mental data are closer to the iso-strain condition, i.e.
the sand particles and surrounding matrix experi-
enced uniform displacement upon loading. Beyond
40 vol %, the experimental data and the theoretical
expectation do not have the same trends and values.
This could be due to poor interfacial adhesion.
Further explanation will be given in section 3.3. In
Fig. 9, it seems that, up to 30 vol % reinforcement,
the data for FWFRP composites fit the iso-strain
condition better, whereas the data for CWFRP
composites fit the iso-stress condition better. This
suggests that fine wood flakes experience uniform
displacement with the matrix nearby, and coarse
wood flakes experience uniform stress at the parti-
culate–matrix boundary. However, the upper and
lower boundaries are close to each other; hence the
difference between them is not significant.
SPRP composites generally showed better proper-
ties than WFRP composites did. This indicates that
sand particles provide better support in terms of
strength and stiffness to neat polyester than wood
flakes do. CWFRP composites exhibit better results
than FWFRP composites. At the same volume
fraction, the quantity of coarse fibres is obviously
less than that of fine flakes. Hence, there are fewer
surfaces overlapping each other for CWFRP compo-
sites, thus increasing the surface area of contact with
the matrix for more effective load transfer; this could
be the reason for the better performance of CWFRP
compared with FWFRP. After the maximum values
Fig. 8 Variation in the composite modulus with different particulate contents for SPRPcomposites according to the Ishai–Cohen model
Fig. 9 Variation in the composite modulus with different particulate contents for FWFRP andCWFRP composites according to the Ishai–Cohen model
72 K J Wong, B F Yousif, K O Low, Y Ng, and S L Tan
J. Strain Analysis Vol. 45 JSA553
of the properties are attained, any further increase in
volume fraction weakens the respective properties;
this is due to the poor adhesive bonding between the
particulates and the polyester resin. Weak bonding
weakens the stress transmittance from matrix to
particulates. Also, it could be related to the surface
property, where a higher particulate content gives a
larger area of contact, allowing more skin depletion.
Thus, the stiffness of the composites decreases [27].
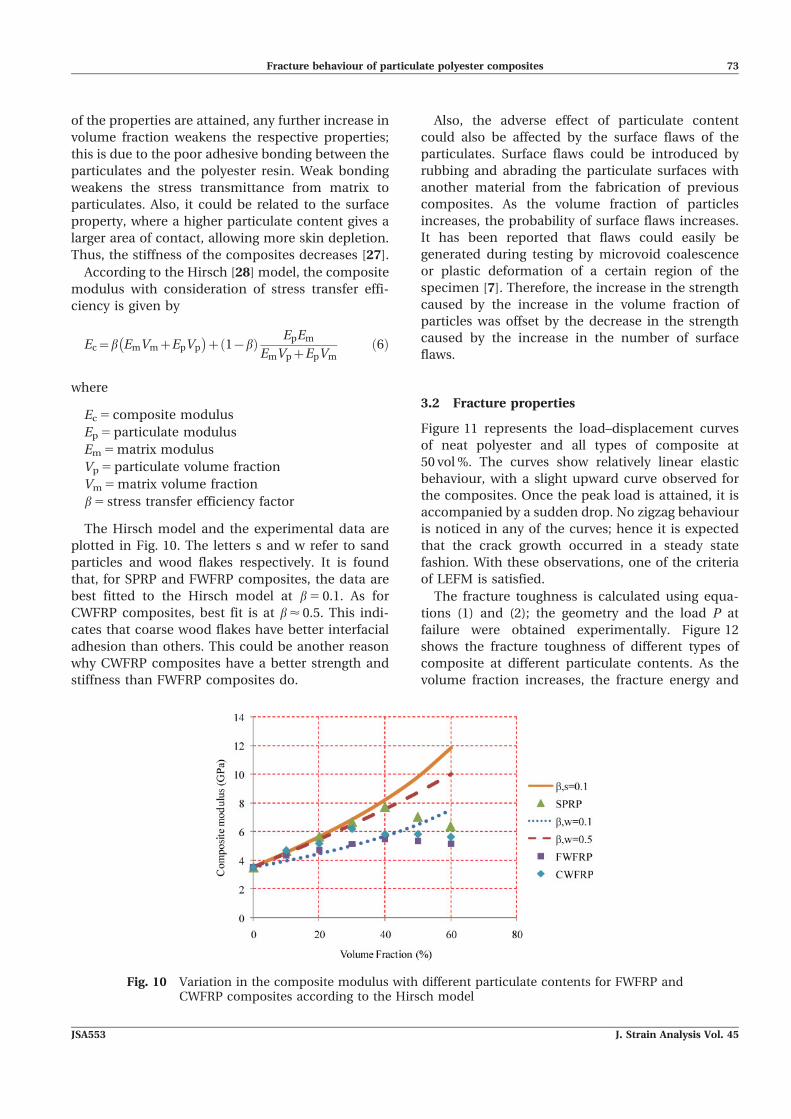
According to the Hirsch [28] model, the composite
modulus with consideration of stress transfer effi-
ciency is given by
Ec~b EmVmzEpVp
� �z 1{bð Þ EpEm
EmVpzEpVmð6Þ
where
Ec 5 composite modulus
Ep 5 particulate modulus
Em 5 matrix modulus
Vp 5 particulate volume fraction
Vm 5 matrix volume fraction
b 5 stress transfer efficiency factor
The Hirsch model and the experimental data are
plotted in Fig. 10. The letters s and w refer to sand
particles and wood flakes respectively. It is found
that, for SPRP and FWFRP composites, the data are
best fitted to the Hirsch model at b 5 0.1. As for
CWFRP composites, best fit is at b < 0.5. This indi-
cates that coarse wood flakes have better interfacial
adhesion than others. This could be another reason
why CWFRP composites have a better strength and
stiffness than FWFRP composites do.
Also, the adverse effect of particulate content
could also be affected by the surface flaws of the
particulates. Surface flaws could be introduced by
rubbing and abrading the particulate surfaces with
another material from the fabrication of previous
composites. As the volume fraction of particles
increases, the probability of surface flaws increases.
It has been reported that flaws could easily be
generated during testing by microvoid coalescence
or plastic deformation of a certain region of the
specimen [7]. Therefore, the increase in the strength
caused by the increase in the volume fraction of
particles was offset by the decrease in the strength
caused by the increase in the number of surface
flaws.
3.2 Fracture properties
Figure 11 represents the load–displacement curves
of neat polyester and all types of composite at
50 vol %. The curves show relatively linear elastic
behaviour, with a slight upward curve observed for
the composites. Once the peak load is attained, it is
accompanied by a sudden drop. No zigzag behaviour
is noticed in any of the curves; hence it is expected
that the crack growth occurred in a steady state
fashion. With these observations, one of the criteria
of LEFM is satisfied.
The fracture toughness is calculated using equa-
tions (1) and (2); the geometry and the load P at
failure were obtained experimentally. Figure 12
shows the fracture toughness of different types of
composite at different particulate contents. As the
volume fraction increases, the fracture energy and
Fig. 10 Variation in the composite modulus with different particulate contents for FWFRP andCWFRP composites according to the Hirsch model
Fracture behaviour of particulate polyester composites 73
JSA553 J. Strain Analysis Vol. 45

damage resistance of the composites increases,
which can be observed through the improvement
in the fracture toughness. Similar to the tensile
properties, the maximum fracture toughness is
exhibited at 40 vol % for SPRP and FWFRP compo-
sites, and at 30 vol % for CWFRP composites. Similar
results have been reported by Spanoudakis and
Young [6], where increasing the volume fraction
increased the fracture toughness. The most generally
accepted reason for this result is crack front pinning.
This is due to the obstructions to the propagation of
the crack front by the particulates and causes the
primary cracks to bow out between the particulates,
which forms secondary cracks and leads to an
increase in the toughness [29]. Figure 13 describes
this schematically. However, this fracture mechan-
ism is only suitable for low volume fractions. As the
volume fraction increases, there could be consider-
able breakdown of the particulate–matrix interface,
i.e. causing pinning is more difficult [11]. Another
fracture mechanism is crack tip blunting, where the
crack growth is retarded because of particulate
debonding (Fig. 14). Thus, this is expected for
composites at high particulate contents, i.e. the
fracture toughness is still increasing because of
higher blunting. Similar observations have been
reported by Owen [30] and Su and Suh [31], where
debonding of particulates gave rise to crack tip
blunting and unstable propagation. However, this is
Fig. 11 Load–displacement curves of neat polyester and of SPRP, FWFRP, and CWFRPcomposites with 50 vol % of reinforcement
Fig. 12 Fracture toughness of SPRP, FWFRP, and CWFRP composites at different particulatecontents
Fig. 13 Schematic representation of crack front pin-ning Fig. 14 Schematic representation of crack tip blunting
74 K J Wong, B F Yousif, K O Low, Y Ng, and S L Tan
J. Strain Analysis Vol. 45 JSA553

not always true, as shown by the experimental
results. Beyond the optimum fibre content, a further
increase in the volume fraction has an adverse effect
on the fracture toughness (Fig. 12). Hence, there
must be another mechanism for it.
This could be due to poorly bonded particulates
that link up to create larger flaws [7]. Hence, the
fracture toughness decreases as the particulate
content increases beyond the optimum value. Also,
Kitey and Tippur [12] proposed that crack front
twisting is the reason for this. For weak bonding, the
crack front goes through the particulates or particu-
late footprints. These form tail lines between
particulates, which indicate the crack propagation
direction as described in Fig. 15. Gradually, the crack
front is twisted until it reaches the maximum angle
wmax. Beyond this, tail lines emerge from two
neighbouring particulate sites. This creates an addi-
tional surface, dissipates additional energy, and
affects the surface features as well. It is suggested
that crack twisting happens more often at weak
interfaces.
At low particulate contents, the separation be-
tween particulates is larger, hence increasing the
probability that the crack travels through matrix
material. This in turn decreases the average value of
w. On the other hand, at higher particulate contents,
there is a larger number of particulates per unit
volume, i.e. the separation between particulates is
less. This reduces the difference in the elevations
between particulates during propagation, which in
turn reduces w as well. Neither condition contributes
to increasing the fracture toughness of the compo-
sites. The average w is near or equal to wmax at
optimum particulate content for each type of
composite, where the failure is primarily due to
crack twisting.
The results show that CWFRP composites exhibit
better fracture toughness than FWFRP composites
do. This could be due to the difference in the sizes of
the wood flakes used in this study. It has been
reported that there is an optimum particulate size to
obtain the highest fracture toughness [11]. An
increase or decrease in the particulate size decreases
the fracture toughness. Hence, it is proposed that
coarse wood flakes have a size that is closer to the
optimum value. However, it was not determined that
the coarse wood flakes used in this study are at the
optimum size since only two different sizes of wood
flakes were tested. It is recommended that further
experimental work is carried out on wood flakes of
different sizes.
In addition, SPRP composites show lower fracture
resistance than CWFRP composites do at a lower
volume fraction of 40 vol %. This could be due to the
size effect, where larger particulate surfaces allow
cracks to be deflected more effectively. This requires
more energy to be dissipated by friction and thus
results in a higher fracture energy. A larger chip size
could restrict the deformation of the specimen,
inducing internal frictional forces [15]. Energy
dissipation, through fibre debonding, can also delay
the crack growth owing to the decrease in the driving
force at the crack tip [32, 33].
To verify further that the plane strain condition
applies according to equation (3), calculations were
carried out as shown in Table 2, which demonstrates
that all types of composite are thick enough (16 mm)
to satisfy the plane strain condition.
3.3 Morphology study
Fracture surfaces of different tested materials are
given in Fig. 16. The micrographs show that there is
no agglomeration for all types of composite includ-
ing neat polyester. In neat polyester, the crack
surface is uniform along the crack path. Moreover,
cracks propagate directly and there is no retardation
in crack growth. This indicates the brittle behaviour
of the material, and there is no plasticity observed
before final failure. According to LEFM theory, when
the energy is sufficient to initiate crack growth for a
typical brittle material, catastrophic failure occurs,
and there is no crack deflection.Fig. 15 Schematic representation of crack front twist-
ing [12]
Table 2 Verification of specimen thicknesses for the plane strain condition
Specimen thickness (mm) for the following volume fractions
0 vol % 10 vol % 20 vol % 30 vol % 40 vol % 50 vol % 60 vol %
SPRP 0.32 0.66 0.81 0.82 0.78 0.83 0.94FWFRP 0.32 0.55 0.75 0.89 1.10 0.93 0.92CWFRP 0.32 2.01 2.33 1.82 1.18 0.90 0.57
Fracture behaviour of particulate polyester composites 75
JSA553 J. Strain Analysis Vol. 45

For the composites, as the crack reaches the
particulate–matrix interface, the crack either breaks
the particulate or is deflected along the interface,
which causes debonding. The mechanism strongly
depends on the bonding between the particulate and
the matrix. If the particulate strength is greater than
interfacial shear strength, the particulate is pulled
out before it is broken and vice versa. For better
fracture toughness, weaker interfacial adhesion is
desirable. This is because, as the crack is deflected,
energy is dissipated along the interface. This slows
down the crack growth rate and leads to a tortuous
crack path [18].
Figure 16(b) shows the fracture surface of a
50 vol % SPRP composite. Holes can be observed
on the surface, indicating particles that have been
pulled out from the matrix. The sizes of the holes are
similar to the particle sizes. This confirms the poor
particle–matrix interface bonding, where the max-
imum tensile stress is at the equators of particles and
holes [34, 35]. Hence, a crack is propagated around
the equators. Thus, the micrograph shows a surface
that consists of hemispherical holes and the top
surface of debonded particles. As the crack front
intersects the interface, the matrix surrounding the
filler is separated owing to weak bonding. It is
observed that the crack front bows out wherever it
interacts with the particles: i.e. the crack tip is being
blunted at discrete locations along the crack front.
The crack tip blunting is due to particle debonding,
which retards the crack growth and lowers the stress
intensification [11, 12]; this takes place through
localized shear yielding [36, 37]. In addition, it is
suggested that the high toughness is due to debond-
ing of particles that act as voids, causing more
localized energy-absorbing processes, such as plastic
deformation [38]. Also, additional energy is needed
to overcome blunting for crack re-initiation and
further propagation. This reduces the energy re-
leased for crack re-initiation, leading to microcrack
formation. Thus, the total dissipated energy is
consumed in crack propagation and the formation
of localized microcracks. Both phenomena increase
the fracture toughness.
Furthermore, interparticle cleavage fracture can
be observed, which is characterized by the presence
of ‘river lines’. On the surface, particles or particle
footprints are found left behind. The formation of
tail lines between the particles or cavities, which is
believed to be due to crack twisting, implied the
crack propagation direction [12].
As for FWFRP and CWFRP, particulates are found
to be strongly bonded with the resin (Figs 16(c) and
(d)). For FWFRP, the blunting effect and tail lines can
Fig. 16 Fracture surfaces of (a) neat polyester, (b) SPRP composite with 50 vol % reinforcement,(c) FWFRP composite with 50 vol % reinforcement, and (d) CWFRP with 50 vol %reinforcement
76 K J Wong, B F Yousif, K O Low, Y Ng, and S L Tan
J. Strain Analysis Vol. 45 JSA553

be observed (Fig. 16(c)). As for CWFRP composite,
crack tip blunting is obviously observed (Fig. 16(d)).
However, this does not mean that there is no
twisting effect because, for better bonding (b 5 0.5
as discussed earlier), cracks propagate above or
below particulate poles through the matrix [38].
Hence, the particulates and the tail lines are not
distinct. The better interfacial adhesion of wood
flakes to polyester is less likely due to the porosity of
the wood flakes which allows resin to seep into the
flakes and bond well with the resin because of
sufficiently high lignin amount [39–41].
The observations on the micrographs can be
further verified through the experimental results.
Comparing the fracture toughnesses of SPRP,
FWFRP, and CWFRP at 50 vol % (Fig. 12), SPRP has
the highest fracture toughness, followed by CWFRP,
whereas FWFRP has the lowest fracture toughness.
This is in agreement with the suggestion that poorer
interfacial adhesion leads to higher fracture tough-
ness. As for CWFRP, this could also be due to the
larger surface area, which allows more energy to be
dissipated along the interface, hence leading to
higher fracture toughness than for FWFRP.
4 CONCLUSIONS
Based on the work carried out in this study, the
following conclusions can be drawn.
1. The maximum tensile strength, Young’s modulus,
and fracture toughness are obtained at a volume
fraction of 40 vol % for SPRP and FWFRP compo-
sites, while 30 vol % is the optimum for CWFRP
composites. Hence, the corresponding volume
fractions are suggested to achieve optimum
performance of the respective composites.
2. SPRP composites are stronger and stiffer than
other composites. Meanwhile, CWFRP compo-
sites are better in terms of fracture resistance.
3. A surface morphology study shows that sand
particles have poorer interfacial adhesion than
wood flakes do.
F Authors 2010
REFERENCES
1 Philip, M. and Bolton, W. Technology of engineer-ing materials, 2002 (Butterworth–Heinemann, Ox-ford).
2 Groover, M. P. Fundamentals of modern manu-facturing, 2002 (John Wiley, New York).
3 Agarwal, B. D., Broutman, L. T., and Chandra-shekhara, K. Analysis and performance of fibrecomposites, 3rd edition, 2006 (John Wiley, NewYork).
4 Mallick, P. K. Fibre-reinforced composites: materi-als, manufacturing, and design, 1993 (MarcelDekker, New York).
5 Zahran, R. R. Effect of sand addition on the tensileproperties of compression moulded sand/poly-ethylene composite system. Mater. Lett., 1998,34(3–6), 161–167.
6 Spanoudakis, J. and Young, R. J. Crack propaga-tion in a glass particle filled epoxy resin. Part 1.Effect of particle volume fraction and size. J. Mater.Sci., 1984, 19, 473–486.
7 Moloney, A. C., Kausch, H. H., Kaiser, T., andBeer, H. R. Review – parameters determining thestrength and toughness of particulate filled epoxideresins. J. Mater. Sci., 1987, 22, 381–393.
8 Nakamura, Y. and Yamaguchi, M. Effects ofparticle size on the fracture toughness of epoxyresin filled with spherical silica. Polymer, 1992,33(16), 3415–3426.
9 Nakamura, Y., Okabe, S., and Iida, T. Effects ofparticle shape, size and interfacial adhesion on thefracture strength of silica-filled epoxy resin. Polym.Polym. Composites, 1999, 7(3), 177–186.
10 Imanaka, M., Takeuchi, Y., Nakamura, Y., Nishi-mura, A., and Iida, T. Fracture toughness ofspherical silica-filled epoxy adhesives. Int. J. Adhe-sion Adhes., 2001, 21(5), 389–396.
11 Kitey, R. and Tippur, H. V. Role of particle size andfiller–matrix adhesion on dynamic fracture ofglass-filled epoxy. I. Macromeasurements. ActaMater., 2005, 53, 1153–1165.
12 Kitey, R. and Tippur, H. V. Role of particle size andfiller–matrix adhesion on dynamic fracture ofglass-filled epoxy. II. Linkage between macro- andmicro-measurements. Acta Mater., 2005, 53, 1167–1178.
13 Mall, S., Newaz, G. M., and Farhadinia, M. Effectof filler size and matrix properties on fracturetoughness of particulate composites. J. Reinf. Plast.Composites, 1987, 6, 138–152.
14 Vipulanandan, C. and Dharmarajan, N. Fractureproperties of particle filled polymer composites. J.Composite Mater., 1989, 23, 846–860.
15 Razi, P. S. and Raman, A. Studies on impactfracture properties of wood–polymer composites. J.Composite Mater., 2000, 34, 980–997.
16 Chtourou, H., Riedl, B., and Ait-Kadi, A. Reinfor-cement of recycled polyolefins with wood fibres. J.Reinf. Plast. Composites, 1992, 11, 372–394.
17 Cui, Y. H., Tao, J., Noruziaan, B., Cheung, M., andLee, S. DSC analysis and mechanical properties ofwood–plastic composites. J. Reinf. Plast. Compo-sites, November 2008, Online first. DOI: 10.1177/0731684408097766.
18 Silva, R. V., Spinelli, D., Bose Filho, W. W., ClaroNeto, S., Chierice, G. O., and Tarpani, J. R.Fracture toughness of natural fibres/castor oil
Fracture behaviour of particulate polyester composites 77
JSA553 J. Strain Analysis Vol. 45

polyurethane composites. Composites Sci. Technol.,2006, 66(10), 1328–1335.
19 Krumbein, W. C. and Sloss, L. L. Stratigraphy andsedimentation, 2nd edition, 1963 (Freeman, SanFrancisco, California).
20 Dorf, R. C. The engineering handbook, 1996 (CRCPress, New York).
21 Hull, D. and Clyne, T. W. An introduction tocomposite materials, 1996 (Cambridge UniversityPress, Cambridge).
22 Spanoudakis, J. Fracture in particle-filled epoxyresins. PhD Thesis, University of London, London,UK, 1981.
23 Malaysian Timber Council, Specifications of pop-ular Malaysian timber: general properties, 4 August2008, available from http://www.mtc.com.my/industry/index.php?option5com_content&view5
article&id574&Itemid561.24 ASTM D5045-99 Standard test methods for plane-
strain fracture toughness and strain energy releaserate of plastic materials, 1999 (ASTM International,West Conshohocken, Pennsylvania).
25 ASTM D638-99 Standard test method for tensileproperties of plastics, 1999 (ASTM International,West Conshohocken, Pennsylvania).
26 Ishai, O. and Cohen, L. J. Elastic properties of filledand porous epoxy composites. Int. J. Mech. Sci.,1967, 9, 539–546.
27 Lewis, A. G. and Nielsen, L. E. Dynamic mechan-ical properties of particulate-filled composite. J.Appl. Polym. Sci., 1970, 14, 1449–1471.
28 Hirsch, T. J. Modulus of elasticity of concreteaffected by elastic moduli of cement paste matrixand aggregate. J. Am. Concr. Inst., 1962, 59,427–451.
29 Lange, F. F. The interaction of a crack front with asecond phase dispersion. Phil. Mag., 1970, 22,983–992.
30 Owen, A. B. Direct observations of debonding atcrack tips in glass bead-filled epoxy. J. Mater. Sci.,1979, 14, 2521–2523.
31 Su, K. B. and Suh, N. P. Void nucleation inparticulate-filled polymeric materials. In Proceed-
ings of the Annual Technical Conference of theSociety of Plastics Engineers (ANTEC 81), Boston,Massachusetts, USA, 1981, Vol. 27, pp. 46–48 (So-ciety of Plastics Engineers, Newtown, Connecti-cut).
32 Matthews, F. L. and Rawlings, R. D. Compositematerials: engineering and science, 1994 (Chapman& Hall, London).
33 Botsis, J. and Beldica, C. Strength characteristicsand fatigue crack growth in a composite with longaligned fibres. Int. J. Fracture, 1995, 69(1), 27–50.
34 Khaund, A. K., Krstic, V. D., and Nicholson, P. S.Influence of elastic and thermal mismatch on thelocal crack-driving force in brittle composites. J.Mater. Sci., 1977, 12, 2269–2273.
35 Goodier, J. N. Concentration of stress aroundspherical and cylindrical inclusions and flaws. J.Appl. Mech., 1933, 1, 39–44.
36 Yamini, S. and Young, R. J. The mechanicalproperties of epoxy resins. Part 2. Effect of plasticdeformation upon crack propagation. J. Mater. Sci.,1980, 15, 1823–1831.
37 Kinloch, J. G. and Williams, A. J. Crack bluntingmechanisms in polymers. J. Mater. Sci., 1980, 15,987–996.
38 Spanoudakis, J. and Young, R. J. Crack propaga-tion in a glass particle filled epoxy resin. Part 2.Effect of particle-matrix adhesion. J. Mater. Sci.,1984, 19, 487–496.
39 Sarkanen, K. V. and Ludwig, C. H. Lignins:occurrence, formation, structure, and reactions,1971 (Wiley–Interscience, New York).
40 Wong, A. H. H. Susceptibility to soft rot in untreatedand copper–chrome–arsenic treated Malaysian hard-woods. PhD Thesis, University of Oxford, Oxford,UK, 1993.
41 Singh, A. P., Wong, A. H. H., Kim, Y. S., Wi, S. G.,and Lee, K. H. Soft rot decay of cengal (Neobal-anocarpus heimii) heartwood in ground contact inrelation to extractive microdistribution. DocumentIRG/WP 03-10501, International Research Groupon Wood Preservation, Stockholm, Sweden, 2003.
78 K J Wong, B F Yousif, K O Low, Y Ng, and S L Tan
J. Strain Analysis Vol. 45 JSA553