67-2011 - EEESD11 - EKC_plenary_lecture
39
Plenary Lecture Plenary Lecture The Relationship between The Relationship between Economic Growth and Economic Growth and Economic Growth and Economic Growth and Environmental Degradation Environmental Degradation Environmental Degradation Environmental Degradation (Environmental Kuznets Curve Environmental Kuznets Curve) ) Dimitra Kaika and Efthimios Zervas* Dimitra Kaika and Efthimios Zervas* Hellenic Open University Hellenic Open University Plenary Lecture: Environmental Kuznets Curve EEESD’ 11, Angers, France, 17-19/11/2011
Transcript of 67-2011 - EEESD11 - EKC_plenary_lecture

Plenary LecturePlenary Lecture
The Relationship between The Relationship between Economic Growth andEconomic Growth andEconomic Growth and Economic Growth and
Environmental DegradationEnvironmental DegradationEnvironmental Degradation Environmental Degradation ((Environmental Kuznets CurveEnvironmental Kuznets Curve) )
Dimitra Kaika and Efthimios Zervas*Dimitra Kaika and Efthimios Zervas*Hellenic Open UniversityHellenic Open University
Plenary Lecture: Environmental Kuznets Curve EEESD’ 11, Angers, France, 17-19/11/2011

1.Introduction1.IntroductionF th l 1990 i b t lF th l 1990 i b t l•• From the early 1990s, serious concerns about several From the early 1990s, serious concerns about several environmental problems (climate changes, emissions of environmental problems (climate changes, emissions of industrial production air quality generation of wastes ) haveindustrial production air quality generation of wastes ) haveindustrial production, air quality, generation of wastes…) have industrial production, air quality, generation of wastes…) have been deployed. been deployed.
–– Such concerns lead to a rise of the relative literature about the Such concerns lead to a rise of the relative literature about the possible relationship between the pollution and the national income possible relationship between the pollution and the national income level (PIR, pollutionlevel (PIR, pollution--income relationship).income relationship).
•• According to the literature that relationship may take severalAccording to the literature that relationship may take several•• According to the literature, that relationship may take several According to the literature, that relationship may take several forms, from which the most widely supported is the forms, from which the most widely supported is the Environmental Kuznets Curve (EKC). Environmental Kuznets Curve (EKC). ( )( )
–– The EKC relationship took its name from the theory of Simon Kuznets The EKC relationship took its name from the theory of Simon Kuznets about the relationship between income inequality about the relationship between income inequality –– economic growth.economic growth.
•• The EKC literature inverts the basic concern about the The EKC literature inverts the basic concern about the exhaustion of resources and the limits of economic growth to exhaustion of resources and the limits of economic growth to concerns about the evolution of pollution as a consequence ofconcerns about the evolution of pollution as a consequence ofconcerns about the evolution of pollution as a consequence of concerns about the evolution of pollution as a consequence of economic growth. economic growth.
Plenary Lecture: Environmental Kuznets Curve EEESD’ 11, Angers, France, 17-19/11/2011

1.Introduction1.IntroductionTh hi t i t iti f d l ti i t thTh hi t i t iti f d l ti i t th
1972 Th Li it t G th1972 Th Li it t G th
•• The historic transition from resource depletion issues to the The historic transition from resource depletion issues to the EKC concept (1970EKC concept (1970--1990) 1990)
→→1972: The Limits to Growth1972: The Limits to Growth–– Future world will collapse. World economy will reach its physical Future world will collapse. World economy will reach its physical
limits in terms of nonlimits in terms of non--renewable resources, agricultural production renewable resources, agricultural production , g p, g pand excessive pollution.and excessive pollution.
→→1972: First UN Conference on Environment (Stockholm)1972: First UN Conference on Environment (Stockholm)1972: First UN Conference on Environment (Stockholm)1972: First UN Conference on Environment (Stockholm)–– Evolvement of the sustainability concept. Evolvement of the sustainability concept. –– 1983, 1983, BrundltandBrundltand report, definition of sustainability: meet the needs of report, definition of sustainability: meet the needs of
the present without compromising the ability of future generations tothe present without compromising the ability of future generations tothe present without compromising the ability of future generations to the present without compromising the ability of future generations to meet their own needs.meet their own needs.
→→ 1970s: Oil crises (1973 and 1979)1970s: Oil crises (1973 and 1979)( )( )–– The world is entering a future of increasing scarcity of energy use The world is entering a future of increasing scarcity of energy use
and of natural resources.and of natural resources.
Plenary Lecture: Environmental Kuznets Curve EEESD’ 11, Angers, France, 17-19/11/2011

1.Introduction1.IntroductionTh hi t i t iti f d l ti i t thTh hi t i t iti f d l ti i t th
→→1970s1970s 1980s: The Debate on substitution possibilities1980s: The Debate on substitution possibilities
•• The historic transition from resource depletion issues to the The historic transition from resource depletion issues to the EKC concept (1970EKC concept (1970--1990) 1990)
→→1970s 1970s –– 1980s: The Debate on substitution possibilities1980s: The Debate on substitution possibilities–– Two theoretical trends regarding the substitution possibilities of nonTwo theoretical trends regarding the substitution possibilities of non--
renewable resources and of sustainability appear renewable resources and of sustainability appear y ppy pp
Neoclassical economistsNeoclassical economists Ecological economistsEcological economistsSustainability is technical Sustainability is technical
feasible due to substitution feasible due to substitution (human(human--made capital or made capital or
th b d t b tit t )th b d t b tit t )
Ecological economistsEcological economistsSubstitution possibilities are Substitution possibilities are restricted by physical laws restricted by physical laws
(the environment can restrict (the environment can restrict i th)i th)other abundant substitutes)other abundant substitutes) economic growth)economic growth)
→→ 1992: World Development Report by World Bank1992: World Development Report by World BankToo poor to be greenToo poor to be green–– Too poor to be green. Too poor to be green.
–– Economic growth is needed to protect the environment.Economic growth is needed to protect the environment.–– Exhaustion of resources is no longer the main issue.Exhaustion of resources is no longer the main issue.gg–– Beginning of the EKC concept.Beginning of the EKC concept.
Plenary Lecture: Environmental Kuznets Curve EEESD’ 11, Angers, France, 17-19/11/2011

2. The EKC concept2. The EKC concept
An Environmental Kuznets CurveAn Environmental Kuznets Curve
Abundance of natural Abundance of natural resource stock and a resource stock and a
As industrialization takes As industrialization takes off, resource depletion and off, resource depletion and
The production process The production process becomes more becomes more
limited generation of limited generation of wastes because of wastes because of
limited economic activity.limited economic activity.
waste generation waste generation accelerate. Positive accelerate. Positive
relationship of economic relationship of economic growth and environmentalgrowth and environmental
information based and the information based and the service sector is boosted service sector is boosted
leading to a decline of leading to a decline of environmentalenvironmentalgrowth and environmental growth and environmental
degradation.degradation.environmental environmental degradationdegradation..
Plenary Lecture: Environmental Kuznets Curve EEESD’ 11, Angers, France, 17-19/11/2011

2. The EKC concept2. The EKC conceptTh EKC h th i i t t d i i ll i th f ll i d dTh EKC h th i i t t d i i ll i th f ll i d d ff
ββββ 32
The EKC hypothesis is tested empirically using the following reducedThe EKC hypothesis is tested empirically using the following reduced--form form model: model:
itititititiit ezβxβxβxβay +++++= 43
32
21WhereWhere::
(1)
yy= = indicator of environmental indicator of environmental degradationdegradation
xx== income per capitaincome per capita
ii= = countriescountries 1…Ν 1…Ν of the sampleof the samplett= = 1…Τ1…Τ yearsyearsαα== constant termconstant termxx income per capitaincome per capita
zz= = other parameters that may other parameters that may influence yinfluence y
αα== constant termconstant termββ== coefficients to estimatecoefficients to estimateee= = error termerror term
→ → Only if Only if ββ11>0, β>0, β22<0 <0 andand ββ33=0 =0 an EKC pattern exists.an EKC pattern exists.→ → Time seriesTime series--cross sectional data (TSCS) or panel data are mainly cross sectional data (TSCS) or panel data are mainly
used, while some studies use only time series data.used, while some studies use only time series data.
Plenary Lecture: Environmental Kuznets Curve EEESD’ 11, Angers, France, 17-19/11/2011

3. Indicators of environmental degradation3. Indicators of environmental degradation
•• Air pollutionAir pollutionCarbon dioxide (COCarbon dioxide (CO ) sulfur dioxide (SO) sulfur dioxide (SO ) suspended) suspended–– Carbon dioxide (COCarbon dioxide (CO22). sulfur dioxide (SO). sulfur dioxide (SO22), suspended ), suspended particulate matter (SPM), oxides of nitrogen (NOparticulate matter (SPM), oxides of nitrogen (NOXX), carbon ), carbon monoxide, lead, volatile organic compounds (VOC), …monoxide, lead, volatile organic compounds (VOC), …
•• Water pollutionWater pollution–– Fecal (FCOL) and total Fecal (FCOL) and total coliformscoliforms (TCOL), heavy metals (lead, (TCOL), heavy metals (lead,
cadmium, mercury, arsenic, nickel), dissolved oxygen (DO), cadmium, mercury, arsenic, nickel), dissolved oxygen (DO), biological and chemical oxygen demand (BOD, COD), biological and chemical oxygen demand (BOD, COD), nitratesnitratesnitrates,…nitrates,…
•• Other environmental indicatorsOther environmental indicators–– Municipal solid wastes urban sanitation access to safe drinkingMunicipal solid wastes urban sanitation access to safe drinkingMunicipal solid wastes, urban sanitation, access to safe drinking Municipal solid wastes, urban sanitation, access to safe drinking
water, rate of deforestation,…water, rate of deforestation,…
Plenary Lecture: Environmental Kuznets Curve EEESD’ 11, Angers, France, 17-19/11/2011

4. The first empirical studies of the EKC4. The first empirical studies of the EKC•• 1992 1992 -- ShaficShafic and and BondyopadhayBondyopadhay
–– Ten environmental indicators.Ten environmental indicators.–– Income has the most consistently significant effect on all indicatorsIncome has the most consistently significant effect on all indicatorsIncome has the most consistently significant effect on all indicators.Income has the most consistently significant effect on all indicators.–– Most indicators deteriorate initially but tend to improve as countries Most indicators deteriorate initially but tend to improve as countries
become richer.become richer.E ti di l d i i l t b i iE ti di l d i i l t b i i–– Exceptions: dissolved oxygen, municipal wastes, carbon emissions.Exceptions: dissolved oxygen, municipal wastes, carbon emissions.
•• 1991, 1995 1991, 1995 -- Grossman and KruegerGrossman and Krueger–– Many indicators of air and water quality, nature’s beauty, …Many indicators of air and water quality, nature’s beauty, …Many indicators of air and water quality, nature s beauty, …Many indicators of air and water quality, nature s beauty, …–– For most indicators, economic growth brings an initial phase of For most indicators, economic growth brings an initial phase of
deterioration followed by a phase of improvement.deterioration followed by a phase of improvement.These results reflect specific technological political and economicThese results reflect specific technological political and economic–– These results reflect specific technological, political and economic These results reflect specific technological, political and economic conditions of the given time.conditions of the given time.
•• 1994 1994 -- Selden and SongSelden and Song–– Four air pollutants.Four air pollutants.–– An invertedAn inverted--U relationship is confirmed but the turning point is out of U relationship is confirmed but the turning point is out of
the data range.the data range.gg–– Forecasts: increasing emissionsForecasts: increasing emissions
Plenary Lecture: Environmental Kuznets Curve EEESD’ 11, Angers, France, 17-19/11/2011

5. Possible causes of an EKC pattern5. Possible causes of an EKC pattern•• The EKC literature examines many factors as possible The EKC literature examines many factors as possible
causes leading to an EKCcauses leading to an EKC--pattern: pattern:
1.1. International trade and the pollution haven hypothesis International trade and the pollution haven hypothesis
2.2. Income distributionIncome distribution
3.3. Structural changes and technical progressStructural changes and technical progress
4.4. Energy issues (mix, price, dependence)Energy issues (mix, price, dependence)
5.5. Regulation, institutional conditionsRegulation, institutional conditions
66 Consumption consumer preferencesConsumption consumer preferences6.6.Consumption, consumer preferences Consumption, consumer preferences
Plenary Lecture: Environmental Kuznets Curve EEESD’ 11, Angers, France, 17-19/11/2011

5. Possible causes of an EKC pattern5. Possible causes of an EKC pattern5 1 International trade and PHH5 1 International trade and PHH5.1. International trade and PHH5.1. International trade and PHH
•• An EKC pattern is the result of imports and exports of goods An EKC pattern is the result of imports and exports of goods b t t ib t t ibetween countries.between countries.
•• Developed countries are oriented towards the service sector and Developed countries are oriented towards the service sector and high tech industries while developing countries are characterizedhigh tech industries while developing countries are characterizedhigh tech industries while developing countries are characterized high tech industries while developing countries are characterized by highly polluting industries. by highly polluting industries.
•• In fact developed countries move their pollutionIn fact developed countries move their pollution intensiveintensive•• In fact, developed countries move their pollutionIn fact, developed countries move their pollution--intensive intensive production to developing countries and they receive back their production to developing countries and they receive back their products through imports. products through imports. p g pp g p
•• Pollution Haven Hypothesis (PHH)Pollution Haven Hypothesis (PHH)–– Exports of goods from industrialized countries generate the upwardExports of goods from industrialized countries generate the upwardExports of goods from industrialized countries generate the upward Exports of goods from industrialized countries generate the upward
slope of the EKC while the imports from industrialized countries slope of the EKC while the imports from industrialized countries contribute to the downward slope of the EKC.contribute to the downward slope of the EKC.
Plenary Lecture: Environmental Kuznets Curve EEESD’ 11, Angers, France, 17-19/11/2011

5. Possible causes of an EKC pattern5. Possible causes of an EKC pattern5 1 International trade and PHH5 1 International trade and PHH5.1. International trade and PHH5.1. International trade and PHH
•• Many studies have attempted to test the influence of trade and Many studies have attempted to test the influence of trade and h th th th tshow that:show that:
–– Industrialization process in developing countries is based usually Industrialization process in developing countries is based usually on highly polluting industrieson highly polluting industrieson highly polluting industries.on highly polluting industries.
–– Developing countries account for an increasing part of the most Developing countries account for an increasing part of the most highly polluting industries.highly polluting industries.
LimitationsLimitations•• The PHH can explain an EKC for developed countries but The PHH can explain an EKC for developed countries but
developing countries are not expected to follow the same pattern developing countries are not expected to follow the same pattern in the future. There won’t be any pollution havens.in the future. There won’t be any pollution havens.Th PHH k d id i l h d i id dTh PHH k d id i l h d i id d•• The PHH takes under consideration only the production side and The PHH takes under consideration only the production side and ignores the consumption side. ignores the consumption side.
Plenary Lecture: Environmental Kuznets Curve EEESD’ 11, Angers, France, 17-19/11/2011

5. Possible causes of an EKC pattern5. Possible causes of an EKC pattern5 2 Equitable Income Distribution5 2 Equitable Income Distribution5.2. Equitable Income Distribution5.2. Equitable Income Distribution
•• An EKC pattern appears in highAn EKC pattern appears in high--income countries if the process income countries if the process f i th d t l d t i ifi t i ff i th d t l d t i ifi t i fof economic growth does not lead to a significant increase of of economic growth does not lead to a significant increase of
income inequality. income inequality. •• People’s perception on environmental issues depends on theirPeople’s perception on environmental issues depends on their•• People s perception on environmental issues depends on their People s perception on environmental issues depends on their
relative position in the income distribution.relative position in the income distribution.•• Comparison of the relative “power” between those who benefit Comparison of the relative “power” between those who benefit p pp p
from pollution and those who suffer from pollution. from pollution and those who suffer from pollution. –– Depending on the gap of those powers, pollution is increased or Depending on the gap of those powers, pollution is increased or
d dd ddecreased.decreased.•• Demand for environmental quality may be determined by Demand for environmental quality may be determined by
income distribution education and information accessibilityincome distribution education and information accessibilityincome distribution, education and information accessibility.income distribution, education and information accessibility.LimitationsLimitations•• Poor quality data to test whether income inequality affectsPoor quality data to test whether income inequality affects•• Poor quality data to test whether income inequality affects Poor quality data to test whether income inequality affects
environmental degradation. environmental degradation. Plenary Lecture: Environmental Kuznets Curve EEESD’ 11, Angers, France, 17-19/11/2011

5. Possible causes of an EKC pattern5. Possible causes of an EKC pattern5 3 Structural Change and Technical Progress5 3 Structural Change and Technical Progress5.3. Structural Change and Technical Progress5.3. Structural Change and Technical Progress•• Structural changesStructural changes is the transition from the industry sector to is the transition from the industry sector to
the more information based service sector in the productivethe more information based service sector in the productivethe more information based service sector in the productive the more information based service sector in the productive process of an economy (composition effect process of an economy (composition effect -- CE).CE).
•• Technological progressTechnological progress is any improvement of the productionis any improvement of the productionTechnological progressTechnological progress is any improvement of the production is any improvement of the production techniques in the production process (technique effect techniques in the production process (technique effect --TE).TE).
•• Composition and technique effect refer to the production side.Composition and technique effect refer to the production side.•• Many studies show that the improvement of some Many studies show that the improvement of some
environmental indicators was due to structural changes and environmental indicators was due to structural changes and t h l i l d t di tl d t it h l i l d t di tl d t itechnological progress and not directly due to income technological progress and not directly due to income accumulation. accumulation.
•• However according to other studies CE and TE may have aHowever according to other studies CE and TE may have a•• However, according to other studies, CE and TE may have a However, according to other studies, CE and TE may have a transient influence on the EKC. transient influence on the EKC.
•• Importance of the oil crises: changes due to technology ofImportance of the oil crises: changes due to technology ofImportance of the oil crises: changes due to technology of Importance of the oil crises: changes due to technology of energy use. energy use.
Plenary Lecture: Environmental Kuznets Curve EEESD’ 11, Angers, France, 17-19/11/2011

5. Possible causes of an EKC pattern5. Possible causes of an EKC pattern5 3 Structural Change and Technical Progress5 3 Structural Change and Technical Progress5.3. Structural Change and Technical Progress5.3. Structural Change and Technical Progress•• Recently, it is supported that an EKC may envelop subsequent Recently, it is supported that an EKC may envelop subsequent
EKCs which correspond to different subsequent techniques. EKCs which correspond to different subsequent techniques. This happens because new technology replaces old technology.This happens because new technology replaces old technology.Whether a new technology is about to be adopted isWhether a new technology is about to be adopted is•• Whether a new technology is about to be adopted, is Whether a new technology is about to be adopted, is determined by market forces and mechanisms. determined by market forces and mechanisms.
LimitationsLimitations•• Structural Changes and Technical Progress refer only to theStructural Changes and Technical Progress refer only to theStructural Changes and Technical Progress refer only to the Structural Changes and Technical Progress refer only to the
production side.production side.•• Market incentives and policy regulations must be taken into Market incentives and policy regulations must be taken into p y gp y g
consideration. consideration.
Plenary Lecture: Environmental Kuznets Curve EEESD’ 11, Angers, France, 17-19/11/2011

5. Possible causes of an EKC pattern5. Possible causes of an EKC pattern5 4 Energy issues5 4 Energy issues5.4. Energy issues5.4. Energy issues
•• Few studies attempted to study the implication of energy issues Few studies attempted to study the implication of energy issues to the EKC concept.to the EKC concept.to the EKC concept.to the EKC concept.
•• Energy is a necessary factor of economic activity for production Energy is a necessary factor of economic activity for production and consumption.and consumption.
•• Energy issues include energy prices, energy mix, energy Energy issues include energy prices, energy mix, energy dependence…dependence…E i i th EKC lit t id dE i i th EKC lit t id d•• Energy issues in the EKC literature are considered as:Energy issues in the EKC literature are considered as:
–– Energy consumption as depended variableEnergy consumption as depended variable–– Energy parameters as independent explanatory variablesEnergy parameters as independent explanatory variablesgy p p p ygy p p p y
→→Energy pricesEnergy prices–– Results indicate that energy prices affects energy demand and Results indicate that energy prices affects energy demand and
consequently carbon dioxide emissions.consequently carbon dioxide emissions.→→Fuel mixFuel mix→→Fuel mixFuel mix
–– Inclusion of fuel mix is of great significance.Inclusion of fuel mix is of great significance.Plenary Lecture: Environmental Kuznets Curve EEESD’ 11, Angers, France, 17-19/11/2011

5. Possible causes of an EKC pattern5. Possible causes of an EKC pattern5 4 Energy issues5 4 Energy issues5.4. Energy issues5.4. Energy issues
→→Energy dependenceEnergy dependence–– Energy dependent economies are more vulnerable to energyEnergy dependent economies are more vulnerable to energyEnergy dependent economies are more vulnerable to energy Energy dependent economies are more vulnerable to energy
shocks.shocks.–– A policy to reduce energy consumption in order to reduce A policy to reduce energy consumption in order to reduce
i i i lik l t h t i t th GDP f thi i i lik l t h t i t th GDP f themissions is likely to have a greater impact on the GDP of the emissions is likely to have a greater impact on the GDP of the developed rather the developing world.developed rather the developing world.
•• Some studies show that energy use per unit of economic Some studies show that energy use per unit of economic activity has declined due to a shift from direct use of fossil fuels activity has declined due to a shift from direct use of fossil fuels to the use of higher quality energy (electricity). But energy use to the use of higher quality energy (electricity). But energy use and economic activity are tightly coupled. and economic activity are tightly coupled.
•• If energy issues are taken into consideration an EKC patternIf energy issues are taken into consideration an EKC pattern•• If energy issues are taken into consideration, an EKC pattern If energy issues are taken into consideration, an EKC pattern may not appear at all, even if energy use is close related to may not appear at all, even if energy use is close related to economic activity.economic activity.yy
•• Energy has been scarcely examined in the EKC debate. Energy has been scarcely examined in the EKC debate. Plenary Lecture: Environmental Kuznets Curve EEESD’ 11, Angers, France, 17-19/11/2011

5. Possible causes of an EKC pattern5. Possible causes of an EKC pattern5 5 Regulations Institutional conditions5 5 Regulations Institutional conditions5.5. Regulations, Institutional conditions5.5. Regulations, Institutional conditions
•• Regulations/directives are necessary to regulate market failures Regulations/directives are necessary to regulate market failures which raise environmental degradation.which raise environmental degradation.
•• Environmental regulations may be imposed in an economy as a Environmental regulations may be imposed in an economy as a result of the rising public awareness for environmentalresult of the rising public awareness for environmentalresult of the rising public awareness for environmental result of the rising public awareness for environmental degradation.degradation.
•• For longFor long--termed pollutants shorttermed pollutants short--lived governments may avoidlived governments may avoidFor longFor long termed pollutants, shorttermed pollutants, short lived governments may avoid lived governments may avoid enacting environmental regulations due to political cost.enacting environmental regulations due to political cost.
•• CorruptionCorruptionpp–– Governments are supposed to respond and adjust to consumer’s Governments are supposed to respond and adjust to consumer’s
changing preferences for the environment.changing preferences for the environment.If government institutions are weaker less effective or generallyIf government institutions are weaker less effective or generally–– If government institutions are weaker, less effective or generally If government institutions are weaker, less effective or generally more corrupted as are in developing countries compared to more corrupted as are in developing countries compared to developed, then a possible EKC has a peak at higher income levels, developed, then a possible EKC has a peak at higher income levels, well above the social optimal income level.well above the social optimal income level.
Plenary Lecture: Environmental Kuznets Curve EEESD’ 11, Angers, France, 17-19/11/2011

5. Possible causes of an EKC pattern5. Possible causes of an EKC pattern5 5 Regulations Institutional conditions5 5 Regulations Institutional conditions5.5. Regulations, Institutional conditions5.5. Regulations, Institutional conditions
•• Some studies shows that countries (mainly the developed) with Some studies shows that countries (mainly the developed) with better governance, stronger political institutions, better better governance, stronger political institutions, better socioeconomic conditions and greater investment in education socioeconomic conditions and greater investment in education show lower COshow lower CO emissions levels over time (even if they did notemissions levels over time (even if they did notshow lower COshow lower CO22 emissions levels over time (even if they did not emissions levels over time (even if they did not show an unambiguous decline of COshow an unambiguous decline of CO22 emissions in total).emissions in total).
•• In general, the studies support that the agent’s willingness for In general, the studies support that the agent’s willingness for g , pp g gg , pp g gimproving environmental damage will not be taken into account improving environmental damage will not be taken into account from the governments, if the political system is highly corrupted from the governments, if the political system is highly corrupted
l ff til ff tior less effective.or less effective.
LimitationsLimitationsLimitationsLimitations•• It is difficult to find suitable measures of political institution’s It is difficult to find suitable measures of political institution’s
effectiveness or ineffectiveness in order to estimate the effect ofeffectiveness or ineffectiveness in order to estimate the effect ofeffectiveness or ineffectiveness in order to estimate the effect of effectiveness or ineffectiveness in order to estimate the effect of such sociosuch socio--political conditions to the environmental degradation.political conditions to the environmental degradation.
Plenary Lecture: Environmental Kuznets Curve EEESD’ 11, Angers, France, 17-19/11/2011

5. Possible causes of an EKC pattern5. Possible causes of an EKC pattern5 6 Consumption consumer preferences5 6 Consumption consumer preferences5.6. Consumption, consumer preferences 5.6. Consumption, consumer preferences
•• Some EKC studies focus on consumer preferences as a partial Some EKC studies focus on consumer preferences as a partial explanation of an EKCexplanation of an EKCexplanation of an EKC. explanation of an EKC.
•• When income rises, we have to examine the change of When income rises, we have to examine the change of environmental preferences of consumers (environmental preferences of consumers (ηη -- elasticity of elasticity of demand for environmental quality).demand for environmental quality).
–– If If ||ηη||>1 >1 then clean environment is a luxury good.then clean environment is a luxury good.–– IfIf ||ηη||<<11 then clean environment is a normal goodthen clean environment is a normal goodIf If ||ηη||<<11 then clean environment is a normal good. then clean environment is a normal good.
•• Spatial separationSpatial separation–– Consumers can spatially separate themselves from the source of Consumers can spatially separate themselves from the source of
ll till tipollution.pollution.–– Separation of production and consumption of the source of pollution.Separation of production and consumption of the source of pollution.
•• The studies show that a long time is necessary for an The studies show that a long time is necessary for an g yg yenvironmental problem to be solved after its appearance.environmental problem to be solved after its appearance.
LimitationsLimitations•• Hard to quantify the level of environmental preferences whenHard to quantify the level of environmental preferences when•• Hard to quantify the level of environmental preferences when Hard to quantify the level of environmental preferences when
income increases.income increases.Plenary Lecture: Environmental Kuznets Curve EEESD’ 11, Angers, France, 17-19/11/2011

6. EKC for CO6. EKC for CO22 emissionsemissions•• Many studies attempt to study a possible EKCMany studies attempt to study a possible EKC--pattern for COpattern for CO22
emissions. emissions. This is due to the great concern on climate changesThis is due to the great concern on climate changes–– This is due to the great concern on climate changes.This is due to the great concern on climate changes.
–– Research became more intense during the first decade of 2000sResearch became more intense during the first decade of 2000s..•• The results show that an EKC relationship in the case of COThe results show that an EKC relationship in the case of CO22 isisThe results show that an EKC relationship in the case of COThe results show that an EKC relationship in the case of CO22 is is
not sufficiently supported.not sufficiently supported.–– The relationship is rather positiveThe relationship is rather positive--monotonic. monotonic. –– This implies that economic growth is not expected to “improve” the This implies that economic growth is not expected to “improve” the
generation of COgeneration of CO22 emissions.emissions.Any sign of an EKCAny sign of an EKC pattern for COpattern for CO is related only to the mostis related only to the most–– Any sign of an EKCAny sign of an EKC--pattern for COpattern for CO2 2 is related only to the most is related only to the most developed countries of today, or the most developed regions of todaydeveloped countries of today, or the most developed regions of today..
•• The monotonic relationship arises probably due to the use of The monotonic relationship arises probably due to the use of p p yp p yenergy.energy.
–– Economic growth leads to increasing use of energy which Economic growth leads to increasing use of energy which consequently leads to higher emission of greenhouse gasesconsequently leads to higher emission of greenhouse gasesconsequently leads to higher emission of greenhouse gases.consequently leads to higher emission of greenhouse gases.
Plenary Lecture: Environmental Kuznets Curve EEESD’ 11, Angers, France, 17-19/11/2011
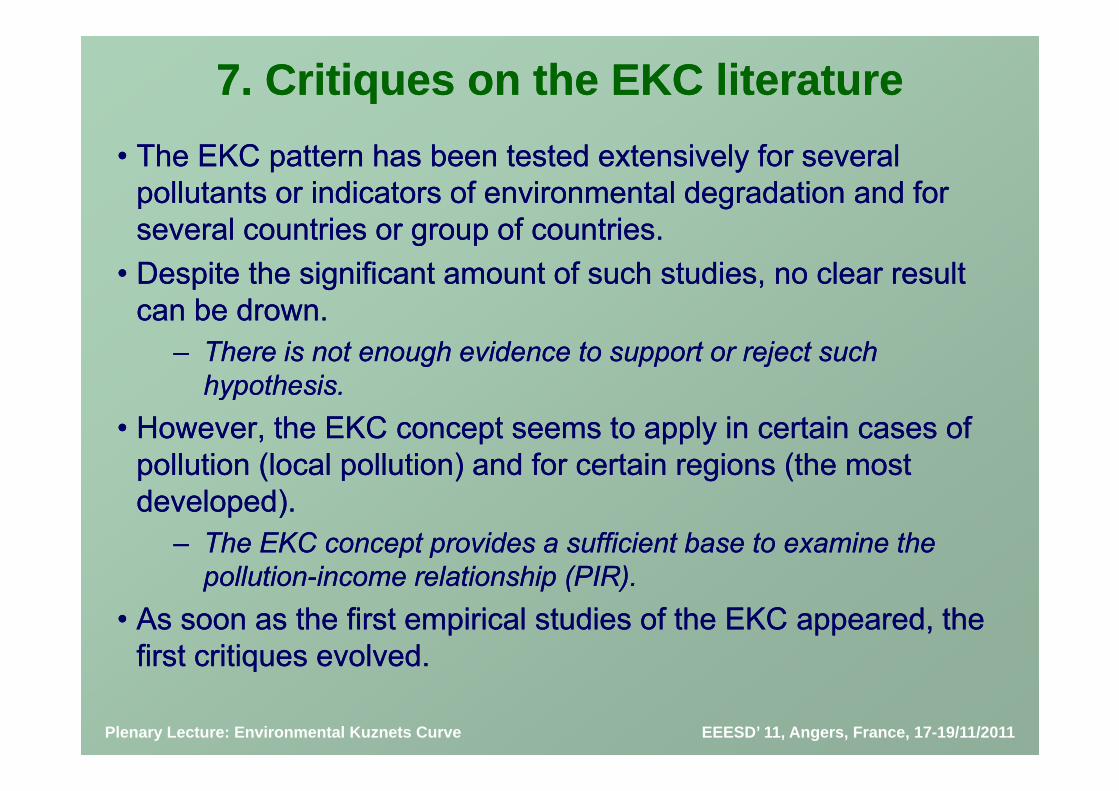
7. Critiques on the EKC literature7. Critiques on the EKC literature•• The EKC pattern has been tested extensively for several The EKC pattern has been tested extensively for several
pollutants or indicators of environmental degradation and for pollutants or indicators of environmental degradation and for several countries or group of countries. several countries or group of countries.
•• Despite the significant amount of such studies, no clear result Despite the significant amount of such studies, no clear result can be drowncan be drowncan be drown.can be drown.
–– There is not enough evidence to support or reject such There is not enough evidence to support or reject such hypothesis.hypothesis.ypyp
•• However, the EKC concept seems to apply in certain cases of However, the EKC concept seems to apply in certain cases of pollution (local pollution) and for certain regions (the most pollution (local pollution) and for certain regions (the most developed).developed).
–– The EKC concept provides a sufficient base to examine the The EKC concept provides a sufficient base to examine the pollutionpollution income relationship (PIR)income relationship (PIR)pollutionpollution--income relationship (PIR).income relationship (PIR).
•• As soon as the first empirical studies of the EKC appeared, the As soon as the first empirical studies of the EKC appeared, the first critiques evolved.first critiques evolved.first critiques evolved. first critiques evolved.
Plenary Lecture: Environmental Kuznets Curve EEESD’ 11, Angers, France, 17-19/11/2011

7. Critiques on the EKC literature7. Critiques on the EKC literature•• The main critiques on the EKC literature focus on the following The main critiques on the EKC literature focus on the following
issues: issues:
1.1. Equitable Income Distribution Equitable Income Distribution 2.2. One model for all economiesOne model for all economies
SCSSCS•• Time series versus panel data and TSCS dataTime series versus panel data and TSCS data•• Service sectorService sector
33 Feedback from environmental degradation to economicFeedback from environmental degradation to economic3.3. Feedback from environmental degradation to economic Feedback from environmental degradation to economic growthgrowth
4.4. Type of pollutant (local vs global pollution)Type of pollutant (local vs global pollution)4.4. Type of pollutant (local vs global pollution)Type of pollutant (local vs global pollution)5.5. Type of economy (rich or poor)Type of economy (rich or poor)6.6. Econometric issuesEconometric issues6.6. Econometric issuesEconometric issues7.7. Consumption patternConsumption pattern8.8. Income Distribution Kuznets theory vs Environmental Income Distribution Kuznets theory vs Environmental yy
Kuznets theory. Kuznets theory. Plenary Lecture: Environmental Kuznets Curve EEESD’ 11, Angers, France, 17-19/11/2011

7. Critiques on the EKC literature7. Critiques on the EKC literature7 1 Income distribution7 1 Income distribution7.1. Income distribution7.1. Income distribution
•• EKC studies assume implicitly that the world distribution of EKC studies assume implicitly that the world distribution of i i li i lincome is normal. income is normal.
•• However, world income distribution is highly skewed with much However, world income distribution is highly skewed with much larger number of people below world mean income than above itlarger number of people below world mean income than above itlarger number of people below world mean income than above it. larger number of people below world mean income than above it.
World distribution of World distribution of income 1970income 1970--20002000
S S lS S l ii M i XM i XSource: SalaSource: Sala--ii--Martin X., Martin X., 20052005
Plenary Lecture: Environmental Kuznets Curve EEESD’ 11, Angers, France, 17-19/11/2011

7. Critiques on the EKC literature7. Critiques on the EKC literature7.2. One model for all economies7.2. One model for all economies7.2. One model for all economies7.2. One model for all economies
-- Time series versus panel or TSCS dataTime series versus panel or TSCS data•• Most of the empirical EKC studies use panel data orMost of the empirical EKC studies use panel data orMost of the empirical EKC studies use panel data or Most of the empirical EKC studies use panel data or
combination of time series and cross sectional data and they combination of time series and cross sectional data and they include data from many countries.include data from many countries.
ff–– This indicates a hidden assumption that all countries of the sample This indicates a hidden assumption that all countries of the sample are homogenous and that they are expected to follow a common are homogenous and that they are expected to follow a common EKCEKC--pattern.pattern.
•• Some studies have used strictly time series data on one single Some studies have used strictly time series data on one single country for the most available time period. country for the most available time period.
–– Such studies show that there are differences between regions withSuch studies show that there are differences between regions with–– Such studies show that there are differences between regions with Such studies show that there are differences between regions with warmer climates and regions with colder climate.warmer climates and regions with colder climate.
–– Such studies indicate differences when the population density and Such studies indicate differences when the population density and the existence of large urban areas are countedthe existence of large urban areas are countedthe existence of large urban areas are counted. the existence of large urban areas are counted.
•• In general, a total EKC pattern is doubtful when time series data In general, a total EKC pattern is doubtful when time series data are used and different patterns appear depending on country's are used and different patterns appear depending on country's characteristics and on the pollutant under consideration. characteristics and on the pollutant under consideration.
Plenary Lecture: Environmental Kuznets Curve EEESD’ 11, Angers, France, 17-19/11/2011

7. Critiques on the EKC literature7. Critiques on the EKC literature7.3. One model for all economies7.3. One model for all economies7.3. One model for all economies7.3. One model for all economies
-- Service sectorService sector•• Two basic assumptions of the EKC are:Two basic assumptions of the EKC are:
–– The transition from the industry sector to the services sector leads to an The transition from the industry sector to the services sector leads to an EKC pattern. EKC pattern.
–– The service sector is less polluting since is more information based and The service sector is less polluting since is more information based and p gp guses less materialuses less material..
•• However, the historical examination of the GDP of developed However, the historical examination of the GDP of developed countries does not imply a gradual transition from industry tocountries does not imply a gradual transition from industry tocountries does not imply a gradual transition from industry to countries does not imply a gradual transition from industry to services: the service sector posses the biggest share of GDP.services: the service sector posses the biggest share of GDP.
Italy100%
Denmark100%
50%
60%
70%
80%
90%
100%
50%
60%
70%
80%
90%
100%
ServicesServices
0%
10%
20%
30%
40%
70 72 74 76 78 80 82 84 86 88 90 92 94 96 98 00 02 04 06 08
0%
10%
20%
30%
40%70 72 74 76 78 80 82 84 86 88 90 92 94 96 98 00 02 04 06 08
Industry Industry
197
197
197
197
197
198
198
198
198
198
199
199
199
199
199
200
200
200
200
200
197
197
197
197
197
198
198
198
198
198
199
199
199
199
199
200
200
200
200
200
Source: World Bank dataSource: World Bank dataPlenary Lecture: Environmental Kuznets Curve EEESD’ 11, Angers, France, 17-19/11/2011

7. Critiques on the EKC literature7. Critiques on the EKC literature7.3. One model for all economies7.3. One model for all economies7.3. One model for all economies7.3. One model for all economies
-- Service sectorService sectorSpain
100%Austria
100%
Services50%
60%
70%
80%
90%
50%
60%
70%
80%
90%
Services Services
0%
10%
20%
30%
40%
70 72 74 76 78 80 82 84 86 88 90 92 94 96 98 00 02 04 06 08
0%
10%
20%
30%
40%
70 72 74 76 78 80 82 84 86 88 90 92 94 96 98 00 02 04 06 08
Industry Industry
197
197
197
197
197
198
198
198
198
198
199
199
199
199
199
200
200
200
200
200
197
197
197
197
197
198
198
198
198
198
199
199
199
199
199
200
200
200
200
200
Belgium
90%
100%Greece
90%
100%
40%
50%
60%
70%
80%
90%
40%
50%
60%
70%
80%
90%Services Services
0%
10%
20%
30%
1970
1972
1974
1976
1978
1980
1982
1984
1986
1988
1990
1992
1994
1996
1998
2000
2002
2004
2006
2008
0%
10%
20%
30%19
70
1972
1974
1976
1978
1980
1982
1984
1986
1988
1990
1992
1994
1996
1998
2000
2002
2004
2006
2008
IndustryIndustry
Source: World Bank dataSource: World Bank dataPlenary Lecture: Environmental Kuznets Curve EEESD’ 11, Angers, France, 17-19/11/2011

7. Critiques on the EKC literature7. Critiques on the EKC literature7.3. One model for all economies7.3. One model for all economies7.3. One model for all economies7.3. One model for all economies
-- Service sectorService sector•• Is the service sector less polluting? Is the service sector less polluting?
–– Recent studies show that in order to carry out any work that belongs Recent studies show that in order to carry out any work that belongs to the service sector, a huge amount of energy and a great to the service sector, a huge amount of energy and a great production of supporting materials is needed. production of supporting materials is needed.
–– Still, the service sector includes transport which is responsible for Still, the service sector includes transport which is responsible for nearly ¼ of global energy related COnearly ¼ of global energy related CO22 emissions.emissions.
2 500 02 7000000t)
2.000,0
2.500,0
met
ric to
ns C
O2
Residential 5000000
6000000
7000000
emis
sion
s (k
t
1.000,0
1.500,0
mill
ion
m
Commercial
Industrial2000000
3000000
4000000CO2
0,0
500,0
90 91 92 93 94 95 96 97 98 99 00 01 02 03 04 05 06 07 08
Transportation
0
1000000
960
962
964
966
968
970
972
974
976
978
980
982
984
986
988
990
992
994
996
998
000
002
004
006
U.S. COU.S. CO22 emissionsemissionsSource: World Bank dataSource: World Bank data
199
199
199
199
199
199
199
199
199
199
200
200
200
200
200
200
200
200
200 19 19 19 19 19 19 19 19 19 19 19 19 19 19 19 19 19 19 19 19 20 20 20 20
U.S. energy related COU.S. energy related CO22 by end use sector by end use sector Source: IEASource: IEA
Plenary Lecture: Environmental Kuznets Curve EEESD’ 11, Angers, France, 17-19/11/2011

7. Critiques on the EKC literature7. Critiques on the EKC literature7 4 Feedback7 4 Feedback7.4. Feedback7.4. Feedback
•• Empirical EKC studies assume unidirectional causality from Empirical EKC studies assume unidirectional causality from economy to environment. economy to environment.
–– But they ignore that environmental degradation in turn is possible to But they ignore that environmental degradation in turn is possible to affect reversely the production capabilities of an economyaffect reversely the production capabilities of an economyaffect reversely the production capabilities of an economy.affect reversely the production capabilities of an economy.
EnvironmentEnvironmentIncome Income DeterioratesDeteriorates
EnvironmentEnvironment(Economic growth)(Economic growth)Deteriorates production capabilitiesDeteriorates production capabilities
•• Many studies examine the direction of causality between Many studies examine the direction of causality between income and environmental degradation for many countries. income and environmental degradation for many countries.
–– Results show that in some countries causality runs from income to Results show that in some countries causality runs from income to the environment, in other countries from environment to income and the environment, in other countries from environment to income and in some countries the causality is biin some countries the causality is bi--directional.directional.yy
Plenary Lecture: Environmental Kuznets Curve EEESD’ 11, Angers, France, 17-19/11/2011

7. Critiques on the EKC literature7. Critiques on the EKC literature7 5 Type of pollutant (local/global pollution)7 5 Type of pollutant (local/global pollution)7.5. Type of pollutant (local/global pollution)7.5. Type of pollutant (local/global pollution)
•• The EKC concept stands only for certain types of pollutants The EKC concept stands only for certain types of pollutants which have local shortwhich have local short--term cost (shortterm cost (short--lived air pollutants and lived air pollutants and water pollutants) water pollutants)
–– These pollutants can be reduced at relative small cost and theThese pollutants can be reduced at relative small cost and the–– These pollutants can be reduced at relative small cost and the These pollutants can be reduced at relative small cost and the change can be seen in relative short time period.change can be seen in relative short time period.
–– Action is taken when the negative effects of such pollutants are Action is taken when the negative effects of such pollutants are i d t th (l l) lit f lif t ff t hi d t th (l l) lit f lif t ff t hrecognized to worsen the (local) quality of life or to effect human recognized to worsen the (local) quality of life or to effect human
health directly.health directly.•• The EKC concept does not apply on global pollutants that have The EKC concept does not apply on global pollutants that have p pp y g pp pp y g p
longlong--term effects, currently little effect on human health and term effects, currently little effect on human health and relative high abatement cost.relative high abatement cost.
Thi i th ti l f COThi i th ti l f CO i i ( d GHG)i i ( d GHG)–– This is the particular case of COThis is the particular case of CO22 emissions (and GHG)emissions (and GHG)•• When the EKC concept is considered for a particular pollutant, When the EKC concept is considered for a particular pollutant,
we should take under examination the spatial effect of thiswe should take under examination the spatial effect of thiswe should take under examination the spatial effect of this we should take under examination the spatial effect of this pollutant. pollutant.
Plenary Lecture: Environmental Kuznets Curve EEESD’ 11, Angers, France, 17-19/11/2011

7. Critiques on the EKC literature7. Critiques on the EKC literature7 6 Type of economy (rich/poor)7 6 Type of economy (rich/poor)7.6. Type of economy (rich/poor)7.6. Type of economy (rich/poor)
•• An EKC pattern seems to appear for the most developed of all An EKC pattern seems to appear for the most developed of all th d l d ith d l d i d t f lld t f ll hi hhi h i t ii t ithe developed economiesthe developed economies and not for all and not for all highhigh--income countries.income countries.
–– Developing countries are in the upward side of an EKC Developing countries are in the upward side of an EKC –– Developed countries are in the downward side of an EKCDeveloped countries are in the downward side of an EKCDeveloped countries are in the downward side of an EKCDeveloped countries are in the downward side of an EKC
•• Again, Again, developing countries will not follow the rich countries’ developing countries will not follow the rich countries’ historical experiencehistorical experience..pp
–– Most of the developing countries are limited in terms of economic Most of the developing countries are limited in terms of economic growth due to their colonial history as hinterlands for exploitation, the growth due to their colonial history as hinterlands for exploitation, the continuing low prices of their exports unfavourable links with foreigncontinuing low prices of their exports unfavourable links with foreigncontinuing low prices of their exports, unfavourable links with foreign continuing low prices of their exports, unfavourable links with foreign corporations and banks, and their lack of geopolitical power.corporations and banks, and their lack of geopolitical power.
–– In a finite world, the poor countries of today will be unable to find In a finite world, the poor countries of today will be unable to find other countries to import pollution intensive products (pollution other countries to import pollution intensive products (pollution havens).havens).
•• Current international conditions and interplays are not expectedCurrent international conditions and interplays are not expectedCurrent international conditions and interplays are not expected Current international conditions and interplays are not expected to remain the same in the future. to remain the same in the future.
Plenary Lecture: Environmental Kuznets Curve EEESD’ 11, Angers, France, 17-19/11/2011

7. Critiques on the EKC literature7. Critiques on the EKC literature7 7 Some econometric issues7 7 Some econometric issues7.7. Some econometric issues7.7. Some econometric issues
•• Many critiques on the EKC literature on econometric issues Many critiques on the EKC literature on econometric issues have been exercised. have been exercised.
•• Econometric issues include:Econometric issues include:Q lit f d t (diff t lt h i t ti d tQ lit f d t (diff t lt h i t ti d t–– Quality of data (different results when using concentration data Quality of data (different results when using concentration data instead of emission data).instead of emission data).
–– No reports for No reports for heteroskedasticityheteroskedasticity tests.tests.pp yy–– Omitted variable bias.Omitted variable bias.–– CointegrationCointegration of per capita GDP and per capita environmental of per capita GDP and per capita environmental
d d tid d tidegradation.degradation.–– Spatial effects of emissions to neighboring countries are not Spatial effects of emissions to neighboring countries are not
accounted.accounted.–– The reduce form model of the EKC is not enough to accept or to The reduce form model of the EKC is not enough to accept or to
reject the EKC concept.reject the EKC concept.St t l l i i d dSt t l l i i d d•• Structural analysis is needed. Structural analysis is needed.
Plenary Lecture: Environmental Kuznets Curve EEESD’ 11, Angers, France, 17-19/11/2011

7. Critiques on the EKC literature7. Critiques on the EKC literature7 8 Consumption pattern7 8 Consumption pattern7.8. Consumption pattern 7.8. Consumption pattern
•• Economic activity includes production and consumption. The Economic activity includes production and consumption. The part of consumption in many EKC studies is generally ignoredpart of consumption in many EKC studies is generally ignoredpart of consumption in many EKC studies is generally ignored.part of consumption in many EKC studies is generally ignored.
•• The question turns out to be how the consumption pattern of the The question turns out to be how the consumption pattern of the representative agent will alter when his income rises. representative agent will alter when his income rises.
–– The positive effect of production improvements on pollution will be The positive effect of production improvements on pollution will be counterbalanced by the rise of demand for pollutioncounterbalanced by the rise of demand for pollution--intensive goods intensive goods (if the final consumption remains pollution(if the final consumption remains pollution--intensive). So, the wholeintensive). So, the whole(if the final consumption remains pollution(if the final consumption remains pollution intensive). So, the whole intensive). So, the whole effect may lead to rising environmental degradation.effect may lead to rising environmental degradation.
•• SoSo, , despite the significant progress towards sustainable despite the significant progress towards sustainable development developed countries still have unsustainabledevelopment developed countries still have unsustainabledevelopment, developed countries still have unsustainable development, developed countries still have unsustainable consumption patterns.consumption patterns.
•• EKC studies should count both the production pattern and the EKC studies should count both the production pattern and the p pp pconsumption pattern. consumption pattern.
Plenary Lecture: Environmental Kuznets Curve EEESD’ 11, Angers, France, 17-19/11/2011

7. Critiques on the EKC literature7. Critiques on the EKC literature7 9 Kuznets versus environmental Kuznets7 9 Kuznets versus environmental Kuznets7.9. Kuznets versus environmental Kuznets 7.9. Kuznets versus environmental Kuznets
•• The original Kuznets (1955) theory led many economists to The original Kuznets (1955) theory led many economists to assume that rapid economic growth will assume that rapid economic growth will ––in an automatic wayin an automatic way--eventually lead to a more equal income distribution after a eventually lead to a more equal income distribution after a meantime of rising income inequalitymeantime of rising income inequalitymeantime of rising income inequality.meantime of rising income inequality.
–– However, the income Kuznets hypothesis has not yet been proved However, the income Kuznets hypothesis has not yet been proved enough by empirical data.enough by empirical data.I t d i t i ith id i th th iI t d i t i ith id i th th i–– Instead, in countries with rapid economic growth, the income Instead, in countries with rapid economic growth, the income inequality grew substantiallyinequality grew substantially. .
•• Similarly the EKC concept, accepts that the process of Similarly the EKC concept, accepts that the process of economic growth will solve economic growth will solve ––somehow automaticallysomehow automatically--environmental degradation. Many scientists propose that all an environmental degradation. Many scientists propose that all an economy has to do is to groweconomy has to do is to grow this growth process willthis growth process willeconomy has to do, is to groweconomy has to do, is to grow· this growth process will · this growth process will eventually solve environmental problems. eventually solve environmental problems.
–– However, it is possible that rapid economic growth may lead to However, it is possible that rapid economic growth may lead to irreversible environmental damageirreversible environmental damage. .
Plenary Lecture: Environmental Kuznets Curve EEESD’ 11, Angers, France, 17-19/11/2011

7. Critiques on the EKC literature7. Critiques on the EKC literature7 9 Kuznets versus environmental Kuznets7 9 Kuznets versus environmental Kuznets7.9. Kuznets versus environmental Kuznets 7.9. Kuznets versus environmental Kuznets
•• Kuznets (1955) proposed that his income inequality theory was Kuznets (1955) proposed that his income inequality theory was suitable for UK, US and Germany but not for developing suitable for UK, US and Germany but not for developing countries in which different historic, economic and sociopolitical countries in which different historic, economic and sociopolitical conditions holdconditions holdconditions hold.conditions hold.
–– Therefore, the historical experience of some countries is not Therefore, the historical experience of some countries is not expected to be repeated for other countries tooexpected to be repeated for other countries too..p pp p
•• Similarly, a possible EKC pattern which appears in some Similarly, a possible EKC pattern which appears in some countries, should not be expected for other countries. Countries countries, should not be expected for other countries. Countries do not face the same conditions and the same problems. do not face the same conditions and the same problems.
–– Again, a possible EKC pattern for some pollutants does not imply an Again, a possible EKC pattern for some pollutants does not imply an EKC pattern for pollution as a wholeEKC pattern for pollution as a wholeEKC pattern for pollution as a whole.EKC pattern for pollution as a whole.
•• Therefore, it is crucial to limit the bounds in which the EKC Therefore, it is crucial to limit the bounds in which the EKC concept can be validconcept can be validconcept can be valid.concept can be valid.
Plenary Lecture: Environmental Kuznets Curve EEESD’ 11, Angers, France, 17-19/11/2011

8. Final Points8. Final Points•• The EKC concept may explain sufficiently the incomeThe EKC concept may explain sufficiently the income--
environmental degradation relationship, under certain environmental degradation relationship, under certain g pg passumptions and certain circumstances:assumptions and certain circumstances:
–– Transition of production from agriculture to industry and finally to Transition of production from agriculture to industry and finally to th i tth i tthe service sector.the service sector.
–– The service sector is less polluting. The service sector is less polluting. Shift f f t l ll tiShift f f t l ll ti i t i di t i d–– Shift of consumer preferences to less pollutionShift of consumer preferences to less pollution--intensive goods intensive goods when their income rises.when their income rises.
–– More equitable distribution of income when the economy growsMore equitable distribution of income when the economy growsMore equitable distribution of income when the economy grows.More equitable distribution of income when the economy grows.–– Technological improvements in energyTechnological improvements in energy--intensity.intensity.–– Elimination of corruption.Elimination of corruption.Elimination of corruption.Elimination of corruption.–– The pollutant under examination has local effect, low abatement The pollutant under examination has local effect, low abatement
cost and influences human health.cost and influences human health.
Plenary Lecture: Environmental Kuznets Curve EEESD’ 11, Angers, France, 17-19/11/2011
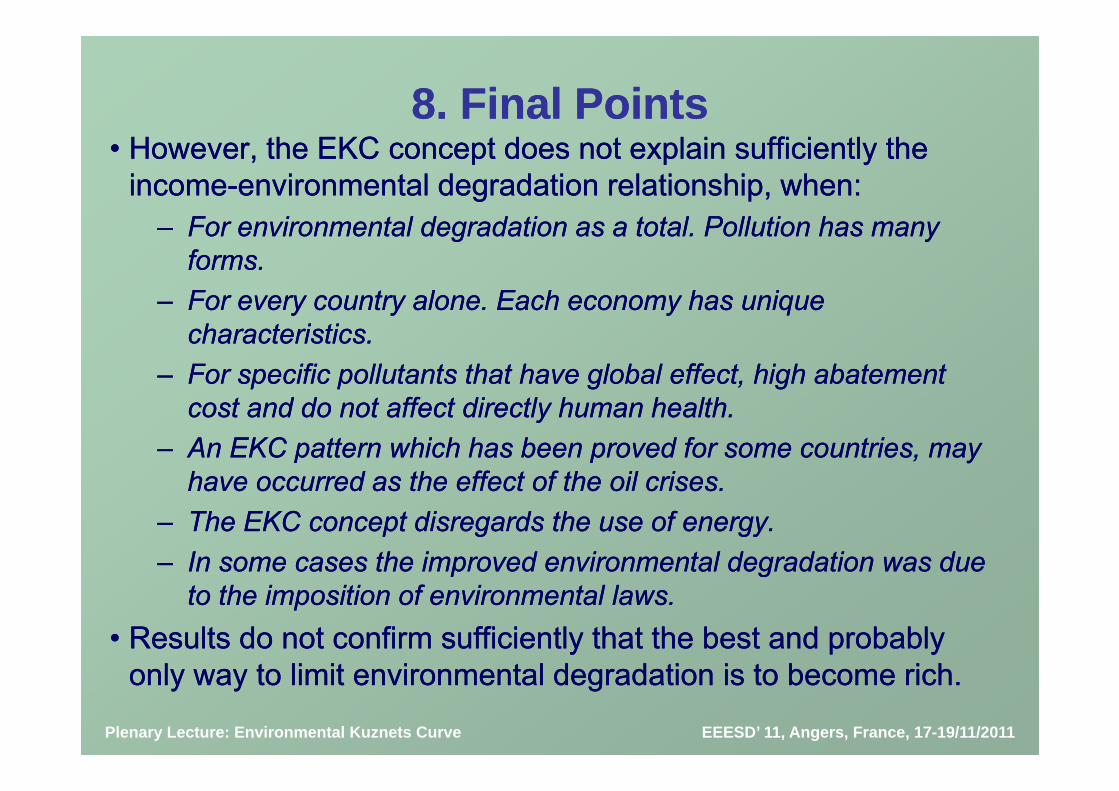
8. Final Points8. Final Points•• However, the EKC concept does not explain sufficiently the However, the EKC concept does not explain sufficiently the
incomeincome--environmental degradation relationship, when:environmental degradation relationship, when:–– For environmental degradation as a total. Pollution has many For environmental degradation as a total. Pollution has many
forms. forms. –– For every country alone Each economy has uniqueFor every country alone Each economy has uniqueFor every country alone. Each economy has unique For every country alone. Each economy has unique
characteristics. characteristics. –– For specific pollutants that have global effect, high abatement For specific pollutants that have global effect, high abatement
cost and do not affect directly human health.cost and do not affect directly human health.–– An EKC pattern which has been proved for some countries, may An EKC pattern which has been proved for some countries, may
have occurred as the effect of the oil criseshave occurred as the effect of the oil criseshave occurred as the effect of the oil crises.have occurred as the effect of the oil crises.–– The EKC concept disregards the use of energy. The EKC concept disregards the use of energy. –– In some cases the improved environmental degradation was due In some cases the improved environmental degradation was due p gp g
to the imposition of environmental laws.to the imposition of environmental laws.•• Results do not confirm sufficiently that the best and probably Results do not confirm sufficiently that the best and probably
l t li it i t l d d ti i t b i hl t li it i t l d d ti i t b i h
Plenary Lecture: Environmental Kuznets Curve EEESD’ 11, Angers, France, 17-19/11/2011
only way to limit environmental degradation is to become rich. only way to limit environmental degradation is to become rich.

9. Conclusions9. Conclusions•• The reduced EKC model does not provide an adequate The reduced EKC model does not provide an adequate
explanation on what reasons the inverted U relationship explanation on what reasons the inverted U relationship p pp pmay appear.may appear.
–– We do not still know clearly the underlying links.We do not still know clearly the underlying links.•• Each economy is well different from another. Each economy is well different from another.
–– The EKC concept does not account these particularities.The EKC concept does not account these particularities.–– Economic needs, geographic characteristics and climate Economic needs, geographic characteristics and climate
characteristics should be taken under consideration. characteristics should be taken under consideration. S l l i i d dS l l i i d d•• Structural analysis is needed.Structural analysis is needed.
–– We need to decode the underlying links of the economic We need to decode the underlying links of the economic activities with the special characteristics of each countryactivities with the special characteristics of each countryactivities with the special characteristics of each country.activities with the special characteristics of each country.
–– We need to account the energy needs that an economy may We need to account the energy needs that an economy may have.have.
Plenary Lecture: Environmental Kuznets Curve EEESD’ 11, Angers, France, 17-19/11/2011

9. Conclusions9. Conclusions•• Suitable and available data are necessary to test the Suitable and available data are necessary to test the
possible link of environmental degradation with income.possible link of environmental degradation with income.p gp g•• In any case, it is rather misleading to simply assume that In any case, it is rather misleading to simply assume that
“all an economy has to do is to grow”.“all an economy has to do is to grow”.–– The environmental damage will have become unavoidable The environmental damage will have become unavoidable
and irreversible by then.and irreversible by then.•• Environmental degradation affects reversely the process of Environmental degradation affects reversely the process of
economic growth. economic growth. Th i i i t h th i th dTh i i i t h th i th d•• The main issue is not whether economic growth and The main issue is not whether economic growth and environmental protection are conflicting targets. environmental protection are conflicting targets.
The main issue turns to be what happens when the EKCThe main issue turns to be what happens when the EKC–– The main issue turns to be what happens when the EKC The main issue turns to be what happens when the EKC concept does not fit. concept does not fit.
Plenary Lecture: Environmental Kuznets Curve EEESD’ 11, Angers, France, 17-19/11/2011

The Relationship between Economic Growth andThe Relationship between Economic Growth andThe Relationship between Economic Growth and The Relationship between Economic Growth and Environmental Degradation Environmental Degradation
((E i t l K t CE i t l K t C ))((Environmental Kuznets CurveEnvironmental Kuznets Curve) )
Dimitra Kaika and Efthimios ZervasDimitra Kaika and Efthimios Zervast a a a a d t os e ast a a a a d t os e asHellenic Open UniversityHellenic Open University
[email protected]@eap.gr
Thank you for your attention!Thank you for your attention!Thank you for your attention! Thank you for your attention!
Plenary Lecture: Environmental Kuznets Curve EEESD’ 11, Angers, France, 17-19/11/2011