National Weather Service WSR-88D Radar and Associated Features
Upload
dinhnguyetCategory
view
215download
1
Moore P. D., L. G. Lee, S. M. Zubrick, and L. B. Perry, 2013: Northwest flow snow aspects of Sandy. Part IV: Radar and satellite observations.
Extended Abstract, 38th Natl. Wea. Assoc. Annual Meeting, Charleston, SC, 6.4.
__________
Corresponding author address: Patrick D. Moore, National Weather Service, 1549 GSP Drive,
Greer, SC 29651
E-mail: [email protected]
6.4 Northwest Flow Snow Aspects of Sandy. Part IV:
Radar and Satellite Observations
PATRICK D. MOORE
LAURENCE G. LEE
NOAA/National Weather Service, Greer, South Carolina
STEVEN M. ZUBRICK
NOAA/National Weather Service, Sterling, Virginia
L. BAKER PERRY
Department of Geography and Planning, Appalachian State University, Boone, North Carolina
ABSTRACT
Cold air and moisture circulating around the western periphery of Hurricane and Post-tropical
Storm Sandy contributed to a period of primarily northwest flow snow (NWFS) in the southern
Appalachians during the last few days of October 2012. The NWFS phase of the event began on
29 October 2012 as a gradual increase in the coverage and intensity of radar echoes and an
increase in the coverage of cloud top temperatures favorable for dendritic ice crystal growth were
observed. The generally shallow nature of the precipitating clouds was revealed by vertically
pointing radar at Poga Mountain, North Carolina. During the early stage of the NWFS phase,
Morristown, Tennessee (KMRX), WSR-88D radar echoes with reflectivity greater than 20 dBZ
showed a pronounced northeast to southwest movement atypical of NWFS events. Strong terrain-
induced upward vertical motion and deep moisture were evident in a mountain wave signature in
the reflectivity detected by the KMRX radar. As the NWFS phase matured, numerous wave-like
features moving northeast to southwest also were noted in the reflectivity field. The widespread
light precipitation on the windward side of the Appalachians provided for an interesting
comparison of reflectivity values between the dual-polarized KMRX radar and the single-
polarized WSR-88D radar at Jackson, Kentucky (KJKL). The slight reflectivity difference
between the two radars possibly was caused by atmospheric propagation variability, frequency and
calibration differences, or minor signal loss in the dual-polarized radar compared to the single
polarized radar. Latter stages of the NWFS phase were dominated by a deep northwest flow after
the middle part of the day on 30 October. Infrared satellite imagery showed a plume of clouds
extending in an arc from Lake Michigan to the northern mountains of North Carolina coincident
with a channel of weak surface-based buoyancy. However, the reflectivity pattern did not display
a cellular structure often evident in more typical NWFS events with weak buoyancy during the
daytime, which might have contributed to higher snowfall totals over a larger area.
_______________
1. Introduction
The following is part four of a four-part
series in which aspects of the remnants of
hurricane and post-tropical storm Sandy are
investigated for a domain in the Southern
Appalachian Mountains (SAMs), following
Keighton et al. (2013), Miller et al. (2013),
and Hotz et al. (2013). The purpose of the
study is to highlight unusual aspects of the
2
event as observed in radar and satellite
imagery, during the time when a prolonged
period of northwesterly flow in the lower
troposphere combined with a deep layer of
moisture to cause a significant accumulation
of snow at elevations above approximately
900 meters above mean sea level (MSL) near
the Tennessee – North Carolina border (Miller
et al., 2013). The Northwest Flow Snow
(NWFS) phase of the event began with an
atypical radar echo movement, and as the
event matured, radar detected the presence of
a mountain wave to the lee of the SAMs.
There also was evidence to suggest the
passage of gravity waves on the west side of
the SAMs. Vertically pointing research radar
revealed the shallow nature of precipitation
echoes. Adjacent WSR-88Ds afforded a
comparison of reflectivity features detected by
a dual- and single-polarized beam. Finally, a
connection with the Great Lakes was observed
toward the end of the event.
2. Data collection
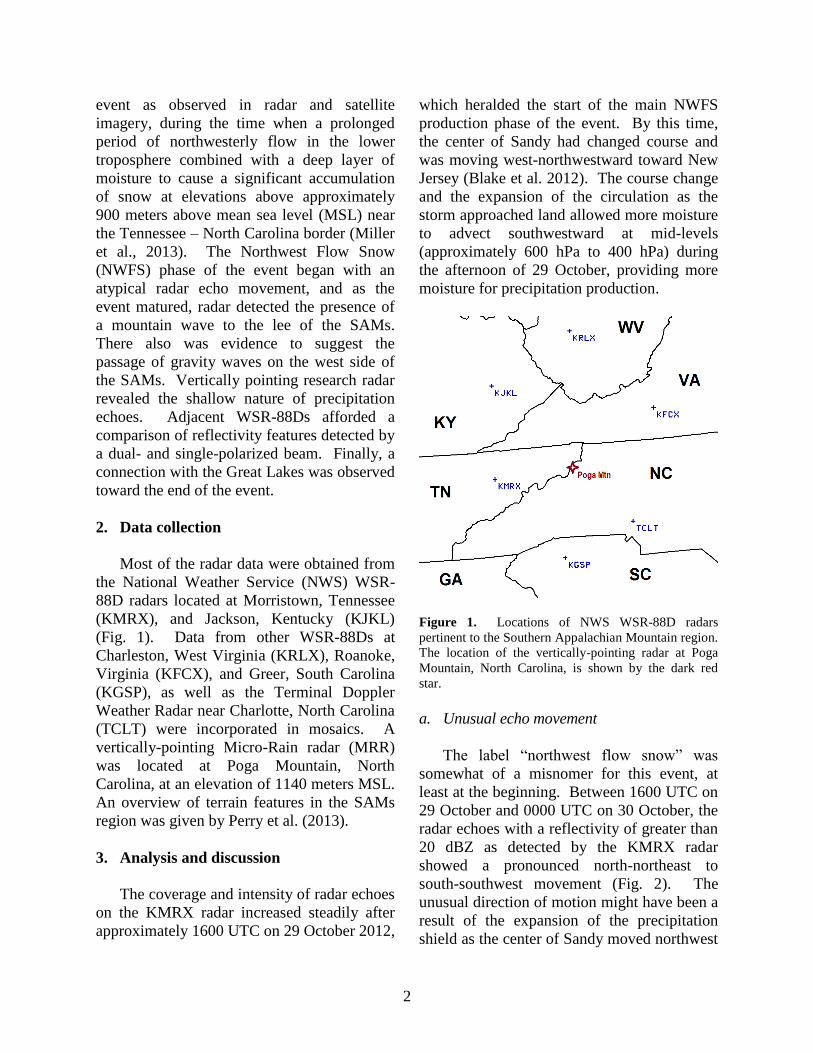
Most of the radar data were obtained from
the National Weather Service (NWS) WSR-
88D radars located at Morristown, Tennessee
(KMRX), and Jackson, Kentucky (KJKL)
(Fig. 1). Data from other WSR-88Ds at
Charleston, West Virginia (KRLX), Roanoke,
Virginia (KFCX), and Greer, South Carolina
(KGSP), as well as the Terminal Doppler
Weather Radar near Charlotte, North Carolina
(TCLT) were incorporated in mosaics. A
vertically-pointing Micro-Rain radar (MRR)
was located at Poga Mountain, North
Carolina, at an elevation of 1140 meters MSL.
An overview of terrain features in the SAMs
region was given by Perry et al. (2013).
3. Analysis and discussion
The coverage and intensity of radar echoes
on the KMRX radar increased steadily after
approximately 1600 UTC on 29 October 2012,
which heralded the start of the main NWFS
production phase of the event. By this time,
the center of Sandy had changed course and
was moving west-northwestward toward New
Jersey (Blake et al. 2012). The course change
and the expansion of the circulation as the
storm approached land allowed more moisture
to advect southwestward at mid-levels
(approximately 600 hPa to 400 hPa) during
the afternoon of 29 October, providing more
moisture for precipitation production.
Figure 1. Locations of NWS WSR-88D radars
pertinent to the Southern Appalachian Mountain region.
The location of the vertically-pointing radar at Poga
Mountain, North Carolina, is shown by the dark red
star.
a. Unusual echo movement
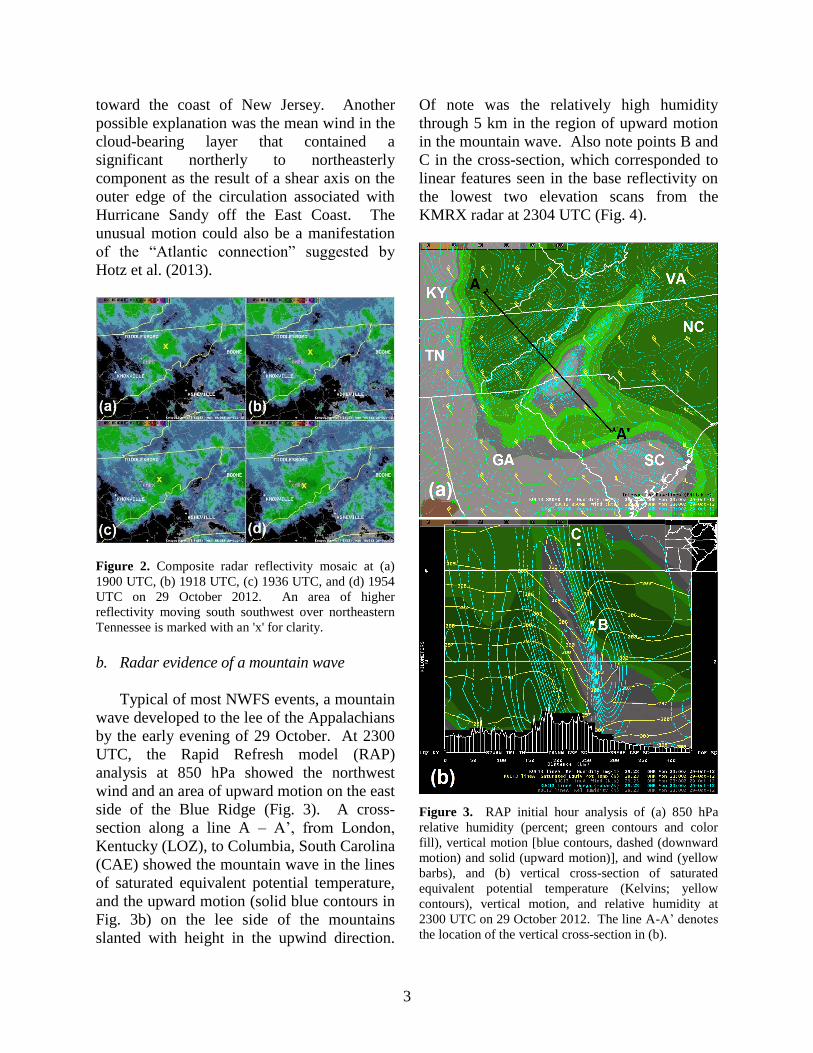
The label “northwest flow snow” was
somewhat of a misnomer for this event, at
least at the beginning. Between 1600 UTC on
29 October and 0000 UTC on 30 October, the
radar echoes with a reflectivity of greater than
20 dBZ as detected by the KMRX radar
showed a pronounced north-northeast to
south-southwest movement (Fig. 2). The
unusual direction of motion might have been a
result of the expansion of the precipitation
shield as the center of Sandy moved northwest
3
toward the coast of New Jersey. Another
possible explanation was the mean wind in the
cloud-bearing layer that contained a
significant northerly to northeasterly
component as the result of a shear axis on the
outer edge of the circulation associated with
Hurricane Sandy off the East Coast. The
unusual motion could also be a manifestation
of the “Atlantic connection” suggested by
Hotz et al. (2013).
Figure 2. Composite radar reflectivity mosaic at (a)
1900 UTC, (b) 1918 UTC, (c) 1936 UTC, and (d) 1954
UTC on 29 October 2012. An area of higher
reflectivity moving south southwest over northeastern
Tennessee is marked with an 'x' for clarity.
b. Radar evidence of a mountain wave
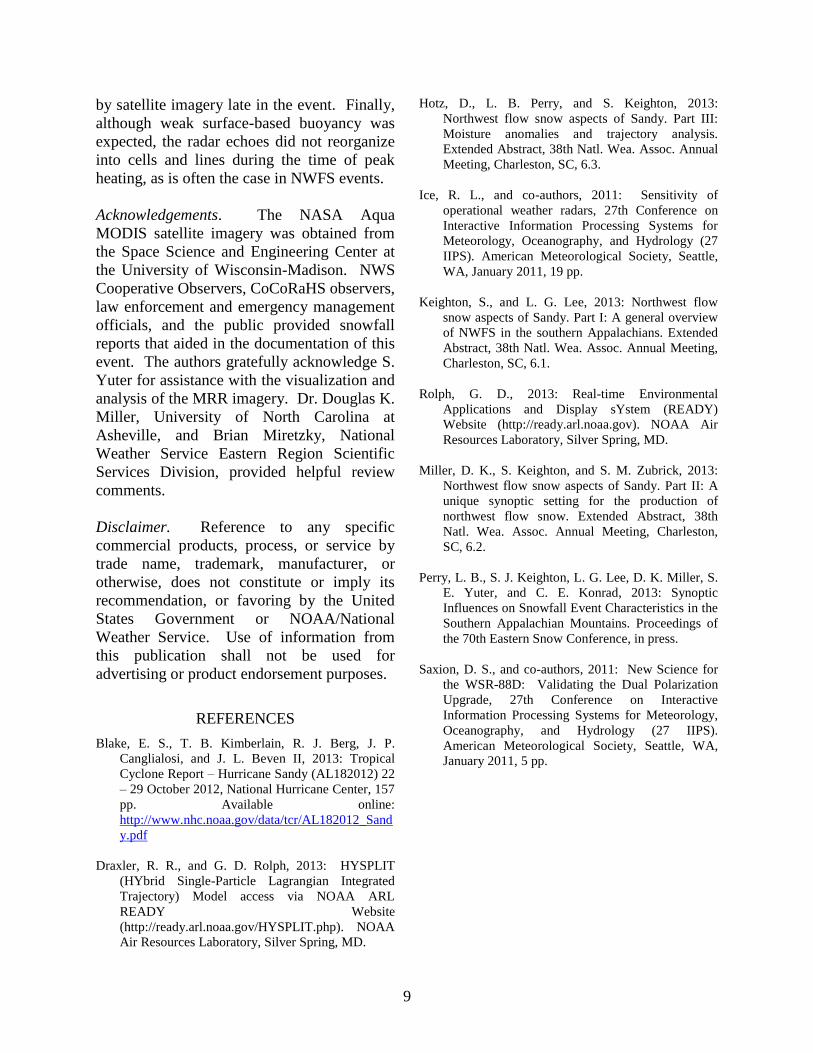
Typical of most NWFS events, a mountain
wave developed to the lee of the Appalachians
by the early evening of 29 October. At 2300
UTC, the Rapid Refresh model (RAP)
analysis at 850 hPa showed the northwest
wind and an area of upward motion on the east
side of the Blue Ridge (Fig. 3). A cross-
section along a line A – A’, from London,
Kentucky (LOZ), to Columbia, South Carolina
(CAE) showed the mountain wave in the lines
of saturated equivalent potential temperature,
and the upward motion (solid blue contours in
Fig. 3b) on the lee side of the mountains
slanted with height in the upwind direction.
Of note was the relatively high humidity
through 5 km in the region of upward motion
in the mountain wave. Also note points B and
C in the cross-section, which corresponded to
linear features seen in the base reflectivity on
the lowest two elevation scans from the
KMRX radar at 2304 UTC (Fig. 4).
Figure 3. RAP initial hour analysis of (a) 850 hPa
relative humidity (percent; green contours and color
fill), vertical motion [blue contours, dashed (downward
motion) and solid (upward motion)], and wind (yellow
barbs), and (b) vertical cross-section of saturated
equivalent potential temperature (Kelvins; yellow
contours), vertical motion, and relative humidity at
2300 UTC on 29 October 2012. The line A-A’ denotes
the location of the vertical cross-section in (b).

4
Figure 4. Base reflectivity from the KMRX radar at
2304 UTC on 29 October 2013 on the (a) 0.5 degree,
(b) 1.5 degree, (c) 2.4 degree, and (d) 3.4 degree scans.
The green line denotes the location of the vertical cross-
section in Fig. 2. The lines B-B’, C-C’, and D-D’
correspond to the mountain wave signature at that
elevation. The intersections of lines B-B’ and C-C’
with the vertical cross-section are shown as points ‘B’
and ‘C’ in Fig. 2.
The reflectivity images clearly show the
band of enhanced reflectivity oriented parallel
to the mountain chain denoting the upward
moving current in the lee side mountain wave,
tilted in the upstream direction with height.
The detection of the wave feature by radar
was significant because it was indicative of
the mechanical forcing provided by the strong
northwesterly upslope flow at low- to mid-
levels and the relatively deep moisture that
could fuel the production of light snow over
the western slopes of the mountains. The
radar signature of the mountain wave on the
KMRX radar persisted until the late afternoon
of 30 October, but could be seen once again as
it redeveloped during the early morning hours
on 31 October.
c. Radar evidence of gravity waves
During the overnight hours of 29-30
October, some interesting wave-like features
were seen on the KMRX and KJKL radar
imagery, but were not detected in radar
imagery east of the Appalachians. The wave
forms propagated from the northeast toward
the southwest and were evident on the 2.4
degree scans from KMRX at an elevation
between 1 km and 4 km above MSL from
approximately 0400 UTC to 0500 UTC on 30
October (Fig. 5). The cessation of these
wave-like features corresponded roughly to
the rapid backing of the flow from northeast to
northwest in the layer from 500 hPa to 300
hPa in the 1400 UTC to 1700 UTC time frame
seen on RAP initial hour soundings on 30
October (not shown).
Figure 5. KMRX base reflectivity on the 2.4 degree
elevation scan at (a) 0401 UTC, (b) 0418 UTC, (c)
0436 UTC, and (d) 0453 UTC on 30 October 2012.
The first wave-like feature is shown by the green line
and the second wave is shown by the pink line. The
approximate height of the radar beam in the vicinity of
the wave features is between 3 km and 4 km MSL.
One possible explanation for the wave-like
features might be inertial gravity waves from
Sandy. The RAP initial hour temperature
and dewpoint profile at Jackson, Kentucky, at
0400 UTC on 30 October (Fig. 6) showed a
stable layer through which waves could be
ducted between roughly 850 hPa and 725 hPa.
However, there does not appear to be a well-
defined and deep conditionally unstable layer
above the stable layer that would be needed to
trap the waves. There might be a small layer
between 500 hPa and 400 hPa that is

5
conditionally unstable. Surface observations
were not studied to see if there was evidence
of inertial gravity waves in the sea level
pressure. The nature of these waves remains a
topic for further investigation.
Figure 6. Skew-T log P diagram for RAP initial hour
profile of temperature and dew point at 0400 UTC at
Jackson, Kentucky.
d. Vertically pointing research radar
The MRR at Poga Mountain showed the
main NWFS production ongoing at 2100 UTC
on 29 October (data was missing between 1500
UTC and 2100 UTC), then continuing
unabated through about 1200 UTC on 30
October (Fig. 7). Although the reflectivity
during this event extended higher than that seen
during the 27 February 2008 event (see Miller
et al. 2013), it was still generally below 3 km
MSL. Note the “burst” of precipitation on the
reflectivity time series centered around 1000
UTC on 30 October. The fall velocity
associated with this reflectivity showed a
transition between values less than 2 m s-1
above 2 km MSL to values between 2 m s-1
and
4 m s-1
below this level. This might be due to
falling ice crystals growing through riming and
accretion as they fall through the very moist
and cold layer closer to the ground.
Figure 7. Time series of (A) reflectivity (dBZ) and
(B) Doppler velocity (m s-1
) from the MRR at Poga
Mountain, North Carolina. Time advances from left to
right (1500 UTC, 29 October 2012 to 0000 UTC, 31
October 2012). Data are missing between 1800 and
2100 UTC on 29 October.
As for the issue of dry v. wet snow, the
dual-polarization products from the 0.5 degree
scans from the KMRX radar at 1001 UTC on
30 October were inconclusive around the Poga
Mountain site. The differential reflectivity
(ZDR) showed values ranging from 0.25 to 1
dB and was noisy, indicating that some wet
snow might be present, as opposed to the
uniform values closer to zero around Hot
Springs, North Carolina, which indicated a dry
snow (Fig. 8). However, the Correlation
Coefficient values suggested a weak returned
signal (not shown), probably because the radar
was not effectively sampling the precipitation
over that part of northwest North Carolina.
The center of the radar beam from KMRX on
the 0.5 degree elevation scan was

6
approximately 2700 meters above MSL when it
reached Poga Mountain and the precipitation
could not be seen on the 1.5 degree scans. The
radar beam was probably overshooting the
shallow precipitation elsewhere across
northwestern North Carolina, as it often does in
NWFS events.
Figure 8. KMRX 0.5 degree scan of differential
reflectivity (dB) at 1001 UTC on 30 October. The
location labeled ‘P’ corresponds to the location of the
Poga Mountain site.
e. Comparison of dual- and single-
polarization radar data
The NWFS event on 30 October afforded a
comparison between the reflectivity observed
by a radar with a dual-polarized beam (KMRX)
and one that had not yet been upgraded (KJKL,
which at the time had a single-polarized beam).
Pre-deployment testing of the dual polarization
radars revealed a signal loss of approximately
3-4 dB compared to the single polarized radar
in weak signal areas (Saxion et al. 2011).
Scans from KMRX and KJKL at 1159 UTC on
30 October demonstrated a lower reflectivity
detected by the dual-polarized KMRX radar.
The center point of the radar beam on the 1.5
degree elevation scans from both radars passed
through approximately the same location
around 2850 m MSL in northwest Harlan
County, Kentucky (Fig. 9). The dual-polarized
KMRX radar detected a reflectivity of 19 dBZ
while the single-polarized KJKL radar showed
a reflectivity of 22 dBZ at the same
approximate location. Other nearby range
gates showed a similar reflectivity loss from
KMRX. A definitive reason for the unequal
values is not known. Contributions to the dBZ
difference in this case possibly were due to
atmospheric propagation variability or to
frequency and calibration differences between
the two radars (Ice et al. 2011).
Figure 9. Base reflectivity on the 1.5 degree elevation
scans from (A) the KJKL radar and (B) the KMRX
radar at 1159 UTC on 30 October 2012. The location
marked "X" corresponds to a point equidistant from
both radars where the beam passes through, at
approximately 2850 m MSL.
f. Great Lakes connection
The expanding shield of high cloudiness
around the remnant circulation of Sandy made
it difficult to discern the path of moisture
moving toward the North Carolina Mountains

7
at low and mid-levels. It was not until the
remnant circulation turned northward on the
morning of 30 October and the high clouds
thinned that a plume of cloudiness and
moisture was revealed in the infrared imagery
curving northwest and north from northwest
North Carolina to the vicinity of Lake
Michigan (Fig. 10). The visible imagery
continued to be masked by mid-level clouds.
The RAP initial hour analysis at 1700 UTC on
30 October showed a channel of surface-based
convective available potential energy (CAPE,
on the order of 25 J kg-1
to 50 J kg-1
) that
stretched from Lake Michigan to the northern
mountains of North Carolina. This band of
CAPE persisted from 1500 UTC to about
2300 UTC on 30 October. Wind streamlines
in the 0-1 km layer also showed the flow
moving down the long axis of Lake Michigan
and curving southeasterly to northwest North
Carolina. After 0000 UTC on 31 October, the
RAP indicated that any connection to the
Great Lakes would be directed toward West
Virginia and southwest Virginia. Backward
air parcel trajectories calculated from the
NOAA HYSPLIT model (Draxler and Rolph
2013; Rolph 2013) for the 48 hour period
leading up to 1800 UTC on 30 October also
showed the flow at 100 m, 500 m, and 1000 m
AGL could be traced to the area around Lake
Michigan (Fig. 11).
In spite of the low level connection to Lake
Michigan and the trajectory of air parcels
across a region with weak surface-based
buoyancy, the precipitation failed to organize
into cells and lines as observed in other
NWFS events in the presence of weak CAPE
during daylight hours (Fig. 12). At 1700 UTC
on 30 October, a large mass of light
precipitation was observed over northeast
Tennessee and eastern Kentucky with a
stratiform appearance. In contrast, the
precipitation elements in the 27 February 2008
NWFS case became loosely organized into
cells and lines during the time of peak heating
(Fig. 13), while satellite imagery (not shown)
gave the appearance of open cell convection
over northeast Tennessee.
Figure 10. GOES-13 satellite imagery in the (a) IR
window and (b) visible window, along with RAP initial
analysis of (c) surface based CAPE (J kg-1
; orange
contours and color fill) and (d) wind (kt; barbs and
streamlines) in the 0-1 km layer at 1700 UTC on 30
October 2012.
Figure 11. Backward air parcel trajectories at the Tri-
Cities airport, Tennessee, from the NOAA HYSPLIT
model at 100 m (red line), 500 m (blue line), and 1000
m (green line) for the 48 hour period ending at 1800
UTC on 30 October 2012.

8
Figure 12. Composite reflectivity mosaic at 1700 UTC
on 30 October 2012.
Figure 13. Composite reflectivity mosaic at 1700 UTC
on 27 February 2008.
4. Conclusions
An image from the Moderate Resolution
Imaging Spectroradiometer (MODIS) on the
Aqua satellite, taken about 24 hours after the
end of snow production, revealed the
dependence of the snow cover on elevation
(Fig. 14). Snow accumulation was limited to
elevations above at least 900 meters (about
3000 feet) above MSL mainly along the
Tennessee border and over the Black
Mountains of North Carolina.
Figure 14. NASA Aqua MODIS image at 1850 UTC
on 1 November 2012.
Some of the more unusual aspects of the
Sandy event, compared to the typical NWFS
event, were manifest in radar observations.
The anomalous northeast to southwest motion
of radar echoes above 20 dBZ early in the
event was evidence of an “Atlantic
connection” (Hotz et al. 2013). The deep
moisture allowed a mountain wave to the lee
of the Appalachians to be revealed in the
KMRX radar imagery as hydrometeors grew
to a detectable size in the upward-directed part
of the wave. A train of wave-like features was
observed moving through the radar imagery at
KMRX and KJKL during the main NWFS
production phase. The nature of the waves
and their cause remains an area for further
study. Vertically-pointing radar at Poga
Mountain, North Carolina, demonstrated the
shallow nature of radar echoes during the
event and suggested ice crystal growth
through riming and accretion. A comparison
of reflectivity detected by dual- and single-
polarized beams from adjacent radars resulted
in a 3 dBZ difference. The difference can be
attributed to some combination of atmospheric
propagation variability, frequency and
calibration differences, and possibly a slight
signal loss in the dual-polarized radar. A
connection to the Great Lakes suggested by
backward air parcel trajectories was inferred
9
by satellite imagery late in the event. Finally,
although weak surface-based buoyancy was
expected, the radar echoes did not reorganize
into cells and lines during the time of peak
heating, as is often the case in NWFS events.
Acknowledgements. The NASA Aqua
MODIS satellite imagery was obtained from
the Space Science and Engineering Center at
the University of Wisconsin-Madison. NWS
Cooperative Observers, CoCoRaHS observers,
law enforcement and emergency management
officials, and the public provided snowfall
reports that aided in the documentation of this
event. The authors gratefully acknowledge S.
Yuter for assistance with the visualization and
analysis of the MRR imagery. Dr. Douglas K.
Miller, University of North Carolina at
Asheville, and Brian Miretzky, National
Weather Service Eastern Region Scientific
Services Division, provided helpful review
comments.
Disclaimer. Reference to any specific
commercial products, process, or service by
trade name, trademark, manufacturer, or
otherwise, does not constitute or imply its
recommendation, or favoring by the United
States Government or NOAA/National
Weather Service. Use of information from
this publication shall not be used for
advertising or product endorsement purposes.
REFERENCES
Blake, E. S., T. B. Kimberlain, R. J. Berg, J. P.
Canglialosi, and J. L. Beven II, 2013: Tropical
Cyclone Report – Hurricane Sandy (AL182012) 22
– 29 October 2012, National Hurricane Center, 157
pp. Available online:
http://www.nhc.noaa.gov/data/tcr/AL182012_Sand
y.pdf
Draxler, R. R., and G. D. Rolph, 2013: HYSPLIT
(HYbrid Single-Particle Lagrangian Integrated
Trajectory) Model access via NOAA ARL
READY Website
(http://ready.arl.noaa.gov/HYSPLIT.php). NOAA
Air Resources Laboratory, Silver Spring, MD.
Hotz, D., L. B. Perry, and S. Keighton, 2013:
Northwest flow snow aspects of Sandy. Part III:
Moisture anomalies and trajectory analysis.
Extended Abstract, 38th Natl. Wea. Assoc. Annual
Meeting, Charleston, SC, 6.3.
Ice, R. L., and co-authors, 2011: Sensitivity of
operational weather radars, 27th Conference on
Interactive Information Processing Systems for
Meteorology, Oceanography, and Hydrology (27
IIPS). American Meteorological Society, Seattle,
WA, January 2011, 19 pp.
Keighton, S., and L. G. Lee, 2013: Northwest flow
snow aspects of Sandy. Part I: A general overview
of NWFS in the southern Appalachians. Extended
Abstract, 38th Natl. Wea. Assoc. Annual Meeting,
Charleston, SC, 6.1.
Rolph, G. D., 2013: Real-time Environmental
Applications and Display sYstem (READY)
Website (http://ready.arl.noaa.gov). NOAA Air
Resources Laboratory, Silver Spring, MD.
Miller, D. K., S. Keighton, and S. M. Zubrick, 2013:
Northwest flow snow aspects of Sandy. Part II: A
unique synoptic setting for the production of
northwest flow snow. Extended Abstract, 38th
Natl. Wea. Assoc. Annual Meeting, Charleston,
SC, 6.2.
Perry, L. B., S. J. Keighton, L. G. Lee, D. K. Miller, S.
E. Yuter, and C. E. Konrad, 2013: Synoptic
Influences on Snowfall Event Characteristics in the
Southern Appalachian Mountains. Proceedings of
the 70th Eastern Snow Conference, in press.
Saxion, D. S., and co-authors, 2011: New Science for
the WSR-88D: Validating the Dual Polarization
Upgrade, 27th Conference on Interactive
Information Processing Systems for Meteorology,
Oceanography, and Hydrology (27 IIPS).
American Meteorological Society, Seattle, WA,
January 2011, 5 pp.