6.3 CERES CLOUD PROPERTY DATABASE FROM VIRS AND MODIS
9
6.3 CERES CLOUD PROPERTY DATABASE FROM VIRS AND MODIS Sunny Sun-Mack, Yan Chen, Qing Z. Trepte SAIC, Hampton, VA 23666 Patrick Minnis, Erika Geier Atmospheric Sciences, NASA Langley Research Center, Hampton, VA 23681 Patrick W. Heck CIMSS, University of Wisconsin-Madison, Madison, WI, USA 1. INTRODUCTION The NASA Clouds and Earth’ s Radiant Energy System (CERES) is providing simultaneous measurement of the radiation and cloud fields on a global basis to improve the understanding and modeling of the interaction between clouds and radiation at the top of the atmosphere, at the surface, and within the atmosphere. CERES Project, begun in 1998, is meeting this need (Wielicki et al. 1998). Broadband shortwave (SW) and longwave radiance measurements taken by the CERES scanners at resolutions between 10 and 20 km on the Tropical Rainfall Measuring Mission (TRMM), Terra, and Aqua satellites are matched to simultaneous retrievals of cloud height, phase, particle size, water path, and optical depth OD from the TRMM Visible Infrared Scanner (VIRS) and the Moderate Resolution Imaging Spectroradiometer (MODIS) on Terra and Aqua . Besides aiding the interpretation of the broadband radiances, the CERES cloud properties are valuable for understanding cloud variations at a variety of scales. In this paper, the resulting CERES cloud data taken to date are averaged at spatial variability of the cloud properties on a global scale at a 1° resolution and several temporal scales to examine the temporal. It was demonstrated from earlier studies (Minnis et al. 2002, 2003, 2005) that the CERES cloud property retrievals from Terra MODIS, Aqua MODIS, and TRMM VIRS were very consistent with the most significant difference being the retrieval of smaller cloud droplet effective radii r e from the Terra data. Comparisons of other parameters with climatological data also showed that the cloud amounts from both TRMM and Terra were in good agreement with the zonal means from long-term surface observations and were typically 0.07 - 0.08 less than those from the International Satellite Cloud Climatology Project (ISCCP) dataset (Rossow and Schiffer, 1999) over the Tropics. Comparisons with surface-based retrievals showed that the mean CERES- derived cloud ODs for stratus clouds were within 6% of their surface counterparts. These cloud properties have been already been responsible for dramatically improving estimates of the Earth’s radiation budget *Corresponding author address: Patrick Minnis, NASA Langley Research Center, MS 420, Hampton, VA 23681-2199. email: [email protected]. (ERB) by facilitating the most accurate representation of the anisotropy of the radiance fields leaving the Earth- atmosphere system (Loeb at al. 2003). They will also be valuable for linking the hydrological cycle and ERB and for improving cloud processes in climate models. The importance of measuring cloud and radiation changes simultaneously was recently highlighted by measurements of Earth shine that were used to infer a 5 Wm -2 increase in the SW flux reflected from the Earth between 2000 and 2003 (Palle et al. 2004). Changes of that magnitude are comparable to those from a major volcanic eruption and should be apparent in the CERES cloud and radiation record and as well as in other measures of the state of the climate. Both the flux and cloud results from CERES do not support the Earthshine conclusions (Weilicki et al., 2005). This paper provides an update on the status of the cloud properties being derived for CERES. 2. DATA & METHODOLOGY Aqua has a 1330 LT equatorial crossing and began producing MODIS imagery in early summer 2002. Terra, which started producing usable MODIS data in late winter of 2000, nominally crosses the Equator at 1030 LT. The TRMM, launched during late 1997, continues to provide coverage at all local hours between 37°N and 37°S every 46 days. At the time of this writing, Terra data have been analyzed to produce the CERES Terra Edition 2 Single Scanner Footprint (SSF) dataset through June 2005 and CERES Aqua Edition 1a through March 2005. Every fourth 1-km MODIS pixel and every other scan line are sampled to minimize processing time and data storage. The SSF consists of the cloud properties, imager radiances, and other parameters convolved with the CERES scanner point spread function into the each CERES footprint to effect an optimal match between the cloud and radiation parameters. Each MODIS pixel is initially classified as clear or cloudy using updated versions of the CERES classification schemes that employ the 0.64 (visible), 1.6 or 2.1 (near infrared), 3.7 (solar infrared), 10.8 (infrared), and 12 (split window) μm radiances (Trepte et al., 1999, 2002). The 1.6-μm channel is used as the near-infrared data from VIRS and Terra, while the 2.1- μm channel is used for Aqua because of problems with AMS 14th Conference on Satellite Meteorology and Oceanography Atlanta, GA, 29 January - 2 February 2006
Transcript of 6.3 CERES CLOUD PROPERTY DATABASE FROM VIRS AND MODIS

6.3 CERES CLOUD PROPERTY DATABASE FROM VIRS AND MODIS
Sunny Sun-Mack, Yan Chen, Qing Z. TrepteSAIC, Hampton, VA 23666
Patrick Minnis, Erika GeierAtmospheric Sciences, NASA Langley Research Center, Hampton, VA 23681
Patrick W. HeckCIMSS, University of Wisconsin-Madison, Madison, WI, USA
1. INTRODUCTION
The NASA Clouds and Earth’s Radiant EnergySystem (CERES) is providing simultaneousmeasurement of the radiation and cloud fields on aglobal basis to improve the understanding and modelingof the interaction between clouds and radiation at thetop of the atmosphere, at the surface, and within theatmosphere. CERES Project, begun in 1998, is meetingthis need (Wielicki et al. 1998). Broadband shortwave(SW) and longwave radiance measurements taken bythe CERES scanners at resolutions between 10 and 20km on the Tropical Rainfall Measuring Mission (TRMM),Terra, and Aqua satellites are matched to simultaneousretrievals of cloud height, phase, particle size, waterpath, and optical depth O D from the TRMM VisibleInfrared Scanner (VIRS) and the Moderate ResolutionImaging Spectroradiometer (MODIS) on Terra andA q u a . Besides aiding the interpretation of thebroadband radiances, the CERES cloud properties arevaluable for understanding cloud variations at a varietyof scales. In this paper, the resulting CERES cloud datataken to date are averaged at spatial variability of thecloud properties on a global scale at a 1° resolution andseveral temporal scales to examine the temporal.
It was demonstrated from earlier studies (Minnis etal. 2002, 2003, 2005) that the CERES cloud propertyretrievals from Terra MODIS, Aqua MODIS, and TRMMVIRS were very consistent with the most significantdifference being the retrieval of smaller cloud dropleteffective radii re from the Terra data. Comparisons ofother parameters with climatological data also showedthat the cloud amounts from both TRMM and Terra werein good agreement with the zonal means from long-termsurface observations and were typically 0.07 - 0.08 lessthan those from the International Satellite CloudClimatology Project (ISCCP) dataset (Rossow andSchiffer, 1999) over the Tropics. Comparisons withsurface-based retrievals showed that the mean CERES-derived cloud ODs for stratus clouds were within 6% oftheir surface counterparts. These cloud properties havebeen already been responsible for dramaticallyimproving estimates of the Earth’s radiation budget *Corresponding author address: Patrick Minnis, NASALangley Research Center, MS 420, Hampton, VA23681-2199. email: [email protected].
(ERB) by facilitating the most accurate representation ofthe anisotropy of the radiance fields leaving the Earth-atmosphere system (Loeb at al. 2003). They will also bevaluable for linking the hydrological cycle and ERB andfor improving cloud processes in climate models. Theimportance of measuring cloud and radiation changessimultaneously was recently highlighted bymeasurements of Earth shine that were used to infer a 5Wm-2 increase in the SW flux reflected from the Earthbetween 2000 and 2003 (Palle et al. 2004). Changes ofthat magnitude are comparable to those from a majorvolcanic eruption and should be apparent in the CEREScloud and radiation record and as well as in othermeasures of the state of the climate. Both the flux andcloud results from CERES do not support theEarthshine conclusions (Weilicki et al., 2005). Thispaper provides an update on the status of the cloudproperties being derived for CERES.
2. DATA & METHODOLOGY
Aqua has a 1330 LT equatorial crossing and beganproducing MODIS imagery in early summer 2002. Terra,which started producing usable MODIS data in latewinter of 2000, nominally crosses the Equator at 1030LT. The TRMM, launched during late 1997, continues toprovide coverage at all local hours between 37°N and37°S every 46 days. At the time of this writing, Terradata have been analyzed to produce the CERES TerraEdition 2 Single Scanner Footprint (SSF) datasetthrough June 2005 and CERES Aqua Edition 1athrough March 2005. Every fourth 1-km MODIS pixeland every other scan line are sampled to minimizeprocessing time and data storage. The SSF consists ofthe cloud properties, imager radiances, and otherparameters convolved with the CERES scanner pointspread function into the each CERES footprint to effectan optimal match between the cloud and radiationparameters.
Each MODIS pixel is initially classified as clear orcloudy using updated versions of the CERESclassification schemes that employ the 0.64 (visible), 1.6or 2.1 (near infrared), 3.7 (solar infrared), 10.8(infrared), and 12 (split window) µm radiances (Trepte etal., 1999, 2002). The 1.6-µm channel is used as thenear-infrared data from VIRS and Terra, while the 2.1-µm channel is used for Aqua because of problems with
AMS 14th Conference on Satellite Meteorology and OceanographyAtlanta, GA, 29 January - 2 February 2006

the Aqua 1.6-µm channel. To detect cloudy pixels, theradiances are compared with predicted clear-skyradiances based on empirical estimates of spectralclear-sky albedo (Sun-Mack et al., 1999, 2003) and onskin temperatures from the CERES Meteorology,Ozone, and Aerosol (MOA) dataset adjusted usingempirical estimates of spectral surface emissivity (Chenet al., 2002) and atmospheric absorption calculated withthe MOA vertical profiles of temperature and humidity.The CERES MOA profiles are based on the EuropeanCenter for Medium-range Weather Forecasting(ECMWF) reanalyses for VIRS and on the GlobalModeling Assimilation Office GEOS 4.03 (DAO, 1997)reanalyses for Terra Edition 2a and Aqua Edition 1. Thedifferences between the 1.6- and 2.1-µm reflectancesfor clear snow surfaces necessitated some adjustmentsto the cloud mask algorithms that are described byMinnis et al. (2003).
Effective droplet radius re or effective ice crystaldiameter De, OD, water path WP, cloud temperature Tc,height zc, thickness, and cloud phase are derived fromthese same radiances using one of three differenttechniques. The visible infrared solar-infrared split-window technique (VISST), an updated version of the 3-channel daytime method of Minnis et al. (1995), is usedduring daytime, which is defined as the time when thesolar zenith angle SZA is less than 82°. At other times ofday, the solar-infrared infrared split-window technique(SIST) is used to determine all of the parameters. TheSIST, an improved version of the 3-channel nighttimemethod of Minnis et al. (1995), only uses thermal andsolar infrared data. Thus, its retrievals are valid only foroptically thin clouds. When the SIST is used, defaultvalues are used for all parameters except phase, Tc,and zc for clouds with OD < 8. The third method,developed by Platnick et al. (2001), is designated thesolar-infrared infrared near-infrared technique (SINT)and is only applied to MODIS data during the daytimefor clouds over snow or ice backgrounds. The 2.13-µmchannel on Aqua is used instead of the 1.6-µm channelin the SINT. Determination of the background surface assnow or ice can either come from the sceneclassification for adjacent clear pixels or from the snowand ice maps used in the CERES data stream (Trepteet al., 2002). All of the methods compute both ice andliquid water solutions that simultaneously determine Tc,OD, and particle size. Each method iteratively matchesthe observed radiances to TOA radiances calculatedusing emittance and reflectance parameterizations thataccount for atmospheric attenuation and surfacereflectance and emission. The cloud reflectances andemittances are included in the parameterizations(Minnis et al., 1998, Arduini et al., 2002) using updatedlookup tables for each specific channel. The phase isselected for each pixel based on the cloudtemperatures, the availability of a solution, bestconsistency with a solution, and the altitude of the cloud.
To provide the link between clouds and the radiationbudget, the pixel-level data are convolved with the
individual broadband CERES radiative fluxes. TheseSSF products include the cloud fraction and meanassociated properties for up to two cloud layers. Nocloud properties could be retrieved for ~6.7% of pixelsclassified as cloudy during the daytime. At night, only1.4% of the cloudy pixels are inconsistent with theparameterizations. Most of the no-retrieval pixels occurin polar regions over snow-covered surfaces or oververy bright deserts. In the former instance, the SINT isunable to find a match, probably because ofuncertainties in the clear-sky reflectance fields. In thelatter case, the pixels detected as clouds may actuallybe heavy concentrations of aerosols that aremisclassified as clouds. Over most ocean and landareas outside the polar regions and Saharan Desert, theno-retrievals account for 1 - 2% of the total number ofcloudy pixels. To account for the no-retrievals, the SSFconvolution assigns the mean cloud properties fromcloudy pixels in the footprint with retrieved values to theno-retrieval pixels, if more than 1/9 of pixels in thefootprint have valid cloud retrievals. Otherwise, only thevalid cloudy pixels are used and the no-retrieval pixelsare not considered as part of the total number of pixelsin the footprint.
Edition-2 VIRS cloud products are currentlyavailable for January 1998 - July 2001, but the CERESfluxes are only available for January - August 1998 andMarch 2000. As of this writing, the CERES Edition-2Terra cloud properties have been completed for theperiod March 2000 through June 2005. Edition-1 Aquaproducts have been produced for July 2002 - March2005.
3. RESULTS AND DISCUSSION
The 5-year time series of monthly mean cloudamounts from Terra are plotted in Fig. 1 and Fig. 2, for 5different latitude zones, where Fig. 1 is for liquid waterclouds over land and Fig. 2 is for ice clouds. Theseresults represent the daytime retrieval ( nighttime resultsare not shown). In this paper, the seasons are definedrelative to the Northern Hemisphere with winter definedby December, January, and February. The 5 latitudezones are defined as Northern Hemisphere Polar (NHP,60°N - 90°N), Northern Hemisphere (NH) Midlatitude(NHM, 30°N - 60°N), Tropics (TP: 30°S - 30°N),Southern Hemisphere (SH) Midlatitude (SHM, 30°S -60°S), and Southern Hemisphere Polar (SHP, 60°S -90°S). Liquid water clouds (Fig. 1a) are most prevalentin the NH during summer and, conversely, are foundleast often in the SH during the same season exceptover the SHP. It appears that SHP zone has the mostcloud cover during spring and the least during fall. Themovement of the Intertropical Convergence Zone (ITCZ)is evident in the shift from maximum cloud cover duringthe summer and fall to a minimum during the winter forall zones except in the SHP zone. The seasonal cycleresults from changing temperature patterns and, insome part, to the variations in ice cloud cover that canblock the satellite view of underlying water clouds. For
AMS 14th Conference on Satellite Meteorology and OceanographyAtlanta, GA, 29 January - 2 February 2006
2
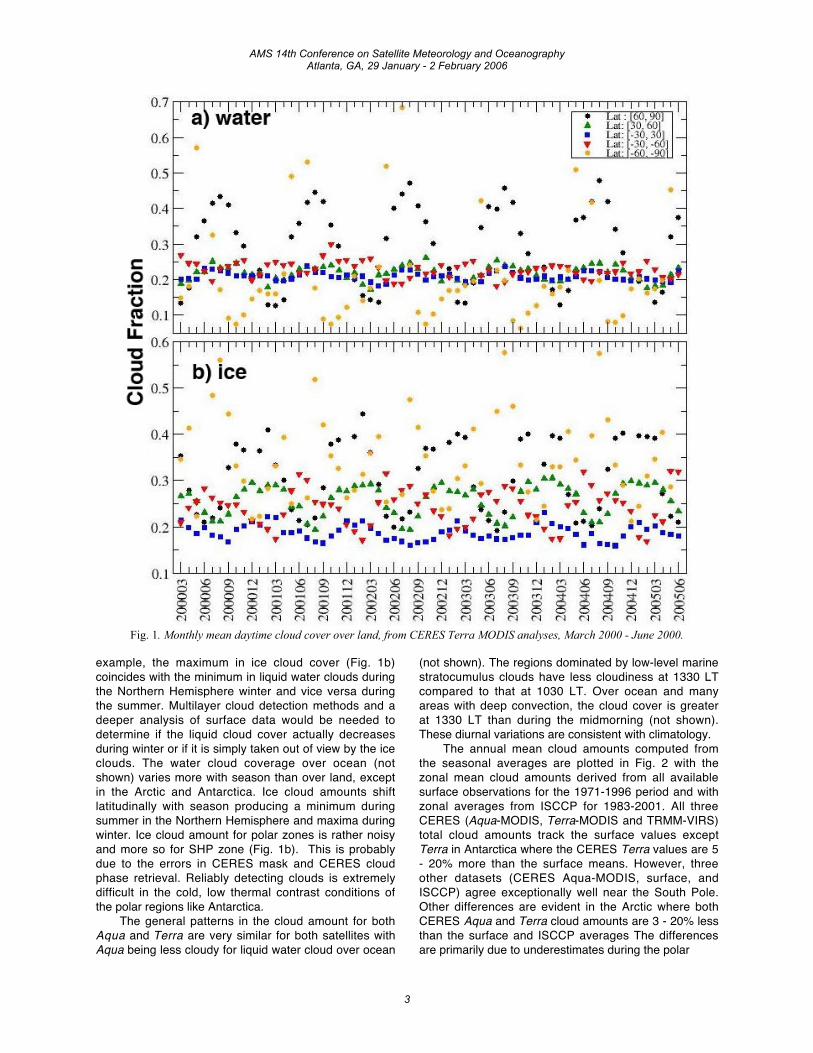
Fig. 1. Monthly mean daytime cloud cover over land, from CERES Terra MODIS analyses, March 2000 - June 2000.
example, the maximum in ice cloud cover (Fig. 1b)coincides with the minimum in liquid water clouds duringthe Northern Hemisphere winter and vice versa duringthe summer. Multilayer cloud detection methods and adeeper analysis of surface data would be needed todetermine if the liquid cloud cover actually decreasesduring winter or if it is simply taken out of view by the iceclouds. The water cloud coverage over ocean (notshown) varies more with season than over land, exceptin the Arctic and Antarctica. Ice cloud amounts shiftlatitudinally with season producing a minimum duringsummer in the Northern Hemisphere and maxima duringwinter. Ice cloud amount for polar zones is rather noisyand more so for SHP zone (Fig. 1b). This is probablydue to the errors in CERES mask and CERES cloudphase retrieval. Reliably detecting clouds is extremelydifficult in the cold, low thermal contrast conditions ofthe polar regions like Antarctica.
The general patterns in the cloud amount for bothAqua and Terra are very similar for both satellites withAqua being less cloudy for liquid water cloud over ocean
(not shown). The regions dominated by low-level marinestratocumulus clouds have less cloudiness at 1330 LTcompared to that at 1030 LT. Over ocean and manyareas with deep convection, the cloud cover is greaterat 1330 LT than during the midmorning (not shown).These diurnal variations are consistent with climatology.
The annual mean cloud amounts computed fromthe seasonal averages are plotted in Fig. 2 with thezonal mean cloud amounts derived from all availablesurface observations for the 1971-1996 period and withzonal averages from ISCCP for 1983-2001. All threeCERES (Aqua-MODIS, Terra-MODIS and TRMM-VIRS)total cloud amounts track the surface values exceptTerra in Antarctica where the CERES Terra values are 5- 20% more than the surface means. However, threeother datasets (CERES Aqua-MODIS, surface, andISCCP) agree exceptionally well near the South Pole.Other differences are evident in the Arctic where bothCERES Aqua and Terra cloud amounts are 3 - 20% lessthan the surface and ISCCP averages The differencesare primarily due to underestimates during the polar
AMS 14th Conference on Satellite Meteorology and OceanographyAtlanta, GA, 29 January - 2 February 2006
3

Fig. 2. Mean total cloud cover from surface (sfc) observations(1971-1996), CERES Terra MODIS (2000-2005), CERESAqua MODIS (2002-2005), CERES TRMM VIRS (1998-2001), and ISCCP (1983-2001).
night (Uttal et al., 2005). The surface and ISCCP meansare larger than their CERES counterparts for alllatitudes north of 30°S. The CERES averages areslightly larger in the southern midlatitudes and over theSouth Pole. Despite substantial zonal differencesbetween the five datasets, the annual mean global cloudcover from the surface, CERES Aqua-MODIS, CERES
Terra-MODIS, and ISCCP, are quite close with values of0.614, 0.592, 0.595, 0.504, and 0.666, respectively.Between 37.5° and 37.5°S, the respective mean annualcloud amounts are 0.554, 0.545, 0.538, and 0.628compared to 0.504 from the VIRS.
The time series of monthly mean daytime effectivecloud height from Terra over ocean are plotted in Fig. 3.Seasonal variations in cloud height over ocean for theperiod of record show the seasonal shift of the ITCZ.The seasonal variations of liquid water cloud height (Fig.3a) for the NHP, SHP and NHM zones are much larger(up to 1 km) than the SHM and TP zones ( up to 250 m).Mean liquid water cloud heights under the marinesubtropical high pressure system are generally less than2.5 km. Over the Arctic Ocean and the seas surroundingAntarctica, the water cloud height varies between 1 and2.5 km, heights consistent with the predominance ofstratus, altostratus, and nimbostratus in those area(Warren et al., 1988). Increases in the average heightsof water clouds for NHM zone occur in winter anddecrease in summer. Ice cloud height for the same zonevaries in the opposite fashion (Fig. 3b). Ice cloudheights over ocean for the TP zone are well separatedfrom and much higher, at 9.8 km, than over the otherzones, about 9.8 km. The seasonal variation for allzones, except the TP zone, is about 2-3 km.
Fig. 3. Monthly mean daytime cloud height over ocean from CERES Terra MODIS analyses, March 2000 - June 2005.
AMS 14th Conference on Satellite Meteorology and OceanographyAtlanta, GA, 29 January - 2 February 2006
4

Fig. 5. Monthly mean daytime cloud effective height cloud over non-polar land from CERES Terra and Aqua MODIS analyses.
The time series of cloud heights over land from Aquaand Terra are shown in Fig. 5. The regions dominatedby low-level clouds over land or desert areas havingmore cloudiness at 1330 LT have lower liquid watercloud heights (Fig. 5a) than those at 1030 LT. Thediurnal water cloud height differences range from 0.5 kmto 1 km for the zones shown, and almost no differenceswere found for the polar regions (not shown). Theopposite effect can be seen for ice cloud height (Fig.5b), where the Aqua cloud heights track their Terracounterparts closely with Aqua ice clouds about 0.5 kmhigher than those from Terra. Over the deserts of NorthAfrica and southwestern Asia, the cloud amounts areslightly greater during the afternoon. Ice cloud heightsover those deserts are generally around 8 km, onaverage, consistent with the predominance of the cirrusand altocumulus cloud types there (Warren et al., 1986).Ice cloud height is also higher at 1330 LT than duringmidmorning for the two polar zones (not shown) withnoisier monthly means than for the three non-polarzones.
The distributions of linearly averaged liquid cloudoptical depth for the 2 example months are shown Fig.6. The average values for the stratocumulus clouds inthe subtropical high areas are around 10, while thetrade cumulus cloud OD ranges from 3 to 8. The stratusclouds in the NH storm tracks during January have the
largest optical depths averaging between 16 and 32.The thickest water clouds are found at similar latitudes
Fig. 6. Mean water cloud optical depth from CERES Aquadata, January 2005 and July 2004.
AMS 14th Conference on Satellite Meteorology and OceanographyAtlanta, GA, 29 January - 2 February 2006
5

Fig. 7. Same as Fig. 5, except for cloud optical depth.
in the SH during July. This seasonal switch in O D ismore readily seen in Fig. 7, which shows the seasonalvariability in water (Fig. 7a) and ice cloud (Fig. 7b) ODfor non-polar land areas for Terra and Aqua. The largestwater cloud OD and smallest ice cloud OD occur duringthe NH winter . This behavior reverses during the NHsummer. The SHM is noisier because of the lack of landsamples compared with other latitude zones. The iceOD in land polar regions (not shown) decreases duringnon-summer seasons and the water OD increases inthe NHP zone. This behavior may be related to the useof the SINT over snow-covered surfaces. Because themethod has not been examined in depth yet, it cannotbe concluded whether the drop is an artifact or an actualdecrease in OD. The afternoon liquid water clouds(Aqua 1330 LT) are slightly thinner than the morningclouds (Terra 1030 LT). There are almost no diurnaldifferences in ice cloud OD for the NH zones (Fig. 7b)between 1030 LT and 1330 LT for all seasons, exceptfall when the afternoon clouds are thicker.
Figure 8 shows the mean cloud water droplet radiusdistribution for January 2005 and July 2004 from Aqua.The values of re are smallest over land and desertareas. Over water, re is least near coastal areas andgreatest over open ocean. During January, strongwesterly flow off the North American and Asian coasts is
westerly flow off the North American and Asian coasts isprobably responsible for the smaller values of re east ofthose continents while an increase in burning over
Fig. 8. Same as Fig. 6, except for water cloud optical depth.
AMS 14th Conference on Satellite Meteorology and OceanographyAtlanta, GA, 29 January - 2 February 2006
6

Fig. 9. Seasonal variation in re over ocean from Aqua MODIS (solid) 2002-2005, Terra MODIS (open) 2000-2005, and VIRS (X),1998-2001. NH winter (blue), spring (red), summer (green), and fall (gold).
southern Africa during July may be the source of thedecreased re over the South Atlantic. Similar burningover South America may also help reduce re over Brazilduring July. The very large values of re over the oceansare probably linked to drizzling clouds in those pristineareas. The even greater values near the terminator linesare likely due to ice contamination or to the effects oflower sun angles and shadowing.
The seasonal variations in zonal mean re in Fig. 9 forocean areas. Maximum values of re occur in the SHduring the boreal summer over all surfaces (land notshown). The maximum variations are also found in theSH. Variations in the Tropics are relatively small for reand D e (not shown) over all surfaces. The meaneffective radius changes very little with season, exceptfor winter, over NH land (not shown), but over ocean itvaries 2 µm with a peak during fall and winter and amaximum during summer. The mean value of De in theTropics over land is around 45 µm compared toapproximately 51 µm over water.
The SZA varies seasonally with latitude and mightbe related to the extreme seasonal variation in re overthe SH oceans even though preliminary analysesindicate very little dependence of re on SZA (Heck et al.,2002). If anything, it decreases slightly with increasingSZA. The VIRS samples all available SZAs for a given
zone during a season and should cover the same rangeof SZA in a given latitude belt in both hemispheres. Ifthe variations are due to angular effects, then the NHand SH should produce the same type of seasonalvariability. Figure 18 shows that the VIRS and MODISdata produce similar zonal patterns of mean re and thatthe extreme variation in re over the SH is probably dueto some other effect, which is probably related to theavailability of more cloud condensation nuclei during theaustral summer. Determining why this variability occursshould greatly advance our understanding of cloudprocesses and the natural production of aerosols.
There are many more parameters that could beexamined. However, a complete analysis of the CEREScloud dataset is beyond the scope of this paper.
4. CONCLUDING REMARKS
This paper has presented a brief summary of 5years of cloud properties derived from Terra MODISdata and 3 years from Aqua MODIS for CERES. Theresults are consistent between satellites and withsurface measurements, in general, with someexceptions in the Arctic. Much more validation workremains but the data are already proving valuable forradiation budget studies and should be especially usefulfor studying cloud and aerosol interactions and
AMS 14th Conference on Satellite Meteorology and OceanographyAtlanta, GA, 29 January - 2 February 2006
7

performing climate model validations. The data arepublicly available at the NASA Langley Research CenterDistributed Active Archive. Additional data from Terraand Aqua will be archived as data processing continues.Shortcomings in the datasets will be addressed in futureeditions of the analyses.
ACKNOWLEDGEMENTS
This research was supported by the NASA ScienceDirectorate through the CERES Project.
REFERENCES
Arduini, R. F., P. Minnis, and D. F. Young, 2002:Investigation of a visible reflectance parameterizationfor determining cloud properties in multi-layeredclouds. Proc. 11th AMS Conf. Cloud Physics., Ogden,UT, June 3-7, CD-ROM, P2.4.
Chen, Y., S. Sun-Mack, P. Minnis, D. F. Young, and W.L. Smith, Jr., 2002: Surface spectral emissivityderived from MODIS data. Proc. SPIE 3rd Intl. Asia-Pacific Environ. Remote Sensing Symp.: RemoteSens. of Atmos., Ocean, Environment, and Space,Hangzhou, China, October 23-27, 4891, 361-369.
DAO, 1997: GEOS-3 Data Assimilation SystemArchitectural Design. DAO Office Note 97-06. DataAssimilation Office, Goddard Space Flight Center,Greenbelt, MD 20771.
Hahn, C. J., and S. G. Warren, 1999: Extended EditedSynoptic Cloud Reports from Ships and Land StationsOver the Globe, 1952-1996. NDP026C, CarbonDioxide Information Analysis Center, Oak RidgeNational Laboratory, Oak Ridge, TN.
Heck, P. W., P. Minnis, D. F. Young, and S. Sun-Mack,2002: Angular variations of cloud properties fromVIRS and MODIS data. Proc. 11th AMS Conf. Atmos.Rad., Ogden, UT, June 3-7, 148-151.
Huang, J., P. Minnis, B. Lin, Y. Yi, M. M. Khaiyer, R. F.Arduini, and G. G. Mace, 2004: Advanced retrievals ofmultilayered cloud properties using multi-sensor andmulti-spectral measurements. Accepted, J. Geophys.Res., 10.1029/2004JD005101.
Loeb, N. G., N. Manalo-Smith, S. Kato, W. F. Miller, S.Gupta, P. Minnis, and B. A. Wielicki, 2003: Angulardistribution models for top-of-atmosphere radiativeflux estimation from the Clouds and the Earth’sRadiant Energy System instrument on the TropicalRainfall Measuring Mission satellite. Part I:Methodology. J. Appl. Meteorol., 42, 240-265.
Minnis, P., D. P. Garber, D. F. Young, R. F. Arduini, andY. Takano, 1998: Parameterization of reflectance andeffective emittance for satellite remote sensing ofcloud properties. J. Atmos. Sci., 55, 3313-3339.
Minnis, P., et al., 1995: Cloud Optical Property Retrieval(Subsystem 4.3). "Clouds and the Earth's RadiantEnergy System (CERES) Algorithm Theoretical BasisDocument, Volume III: Cloud Analyses and RadianceInversions (Subsystem 4)", NASA RP 1376 Vol. 3, pp.135-176.
Minnis, P., D. F. Young, S. Sun-Mack, P. W. Heck, D. R.Doelling, and Q. Z. Trepte, 2003: CERES cloudproperty retrievals from imagers on TRMM, Terra, andAqua. SPIE 10th Intl. Symp Remote Sens., Conf.Remote Sens. Clouds and Atmos., Barcelona, Spain,September 8-12, 37-48.
Minnis, P., D. F. Young, B. A. Weilicki, S. Sun-Mack, Q.Z. Trepte, Y. Chen, P. W. Heck, and X. Dong, 2002: Aglobal cloud database from VIRS and MODIS forCERES. Proc. SPIE 3rd Intl. Asia-Pacific Environ.Remote Sensing Symp. 2002: Remote Sens. ofAtmosphere, Ocean, Environment, and Space,Hangzhou, China, October 23-27, Vol. 4891, 115-126.
Pallé, E., P. R. Goode, P. Montañés-Rodríguez, and S.E. Koonin, 2004: Changes in Earth's reflectance overthe past two decades. Science, 304, 1299-1301
Platnick, S., J. Y. Li, M. D. King, H. Gerber, and P. V.Hobbs, A solar reflectance method for retrieving cloudoptical thickness and droplet size over snow and icesurfaces. J. Geophys. Res., 106, 15185-15199, 2001.
Rossow, W. B. and R. A. Schiffer, 1999: Advances inunderstanding clouds from ISCCP. Bull Am. Meteor.Soc., 80, 2261-2287.
Spangenberg, D. A., Q. Trepte, P. Minnis, and T. Uttal,2004: Daytime cloud property retrievals over theArctic from multispectral MODIS data. Proc. 13th AMSConf. Satellite Oceanogr. and Meteorol., Norfolk, VA,Sept. 20-24, CD-ROM, P7.11.
Sun-Mack, S., Y. Chen, T. D. Murray, P. Minnis, and D.F. Young, 1999: Visible clear-sky and near-infraredsurface albedos derived from VIRS for CERES. Proc.AMS 10th Conf. Atmos. Rad., Madison, WI, June 28 –July 2, 422-425.
Sun-Mack, S., P. Minnis, Y. Chen, and R. F. Arduini,2003: Clear-sky narrowband albedos derived fromVIRS and MODIS. SPIE 10th Intl. Symp RemoteSens., Conf. Remote Sens. Clouds and Atmos.,Barcelona, Spain, September 8-12, 101-109.
Trepte, Q., Y. Chen, S. Sun-Mack, P. Minnis, D. F.Young, B. A. Baum, and P. W. Heck, 1999: Sceneidentification for the CERES cloud analysissubsystem. Proc. AMS 10th Conf. Atmos. Rad.,Madison, WI, June 28 – July 2, 169-172.
Trepte, Q., P. Minnis, and R. F. Arduini, 2002: Daytimeand nighttime polar cloud and snow identificationusing MODIS data. Proc. SPIE 3rd Intl. Asia-PacificEnviron. Remote Sensing Symp. 2002: Remote Sens.of Atmosphere, Ocean, Environment, and Space,Hangzhou, China, October 23-27, Vol. 4891, 449-459.
Uttal, T., S. Frisch, X. Wang, J. Key, A. Schweiger, S.Sun-Mack, and P. Minnis, 2005: Comparison ofmonthly mean cloud fraction and cloud optical depthdetermined from surface cloud radar, TOVS, AVHRR,and MODIS over Barrow, Alaska. Proc. AMS 8th Conf.Polar Meteorol., San Diego, CA, January 9-13, CD-ROM, P1.27.
Warren, S. G., C. J. Hahn, J. London, R. M. Chervin,and R. L. Jenne, Global distribution of total clouf
AMS 14th Conference on Satellite Meteorology and OceanographyAtlanta, GA, 29 January - 2 February 2006
8
cover and cloud type amounts over ocean, NCARTech. Note NCAR/TN-317+STR, 212 pp.,1988.
Warren, S. G., C. J. Hahn, J. London, R. M. Chervin,and R. L. Jenne, Global distribution of total cloufcover and cloud type amounts over ocean, NCARTech. Note NCAR/TN-273+STR, 229 pp.,1986.
Wielicki, B. A., et al., 1998: Clouds and the Earth'sRadiant Energy System (CERES): Algorithmoverview. IEEE Trans. Geosci. Remote Sens., 36,1127-1141.
Wielicki, B. A., T. Wong, N. Loeb, P. Minnis, K.Priestley, and R. Kandel, 2005: Changes in Earth’salbedo measured by satellites. Science, 308, 825.
AMS 14th Conference on Satellite Meteorology and OceanographyAtlanta, GA, 29 January - 2 February 2006
9