6.0 POTENTIAL SOURCES OF GROUNDWATER DEGRADATION
43
WYA—September 2006 6-1 City Lodi of White Slough WPCF 711\04-05-02 Soil and Groundwater Investigation Existing Conditions Report Final Report 6.0 POTENTIAL SOURCES OF GROUNDWATER DEGRADATION A discussion of the detailed evaluation assessing the potential sources of groundwater degradation in the vicinity of the WPCF site is presented in this section. The major topics are: 6.1 Subsurface Conveyance Facilities 6.2 Treatment Processes 6.3 Storage Facilities 6.4 Irrigation Water Distribution and Tailwater Collection Facilities 6.5 Irrigation Reuse and Land Application Areas 6.6 Onsite Sources not associated with the WPCF 6.7 Offsite Sources 6.8 Potential BPTCs 6.9 Summary and Recommendations The specific items of concern that are addressed in this report are nitrogen and salinity. Each of the potential sources listed above are discussed in this section with respect to these constituents. However, in a soil environment, nitrogen is transformed through a complex network of physical, chemical, and biological reactions collectively called the nitrogen cycle. An understanding of this cycle is needed when assessing the potential sources of nitrogen loadings to groundwater. Therefore, an overview of this cycle is provided in Appendix F. 6.1 SUBSURFACE CONVEYANCE FACILITIES As shown on Figure 2-5, the influent municipal and industrial sewers both transect the City’s land application area. These two influent concrete sewer lines at the WPCF were constructed over 40 years ago. The deterioration of the cementitious material that comprises these subsurface conveyance facilities can reduce the thickness of the concrete and, in time, expose the steel reinforcement of the pipeline, eventually reducing the strength. Corrosion at the joints can expose the rubber gasket. If such corrosion becomes severe enough, infiltration of groundwater into the pipe could occur; and in surcharged conditions, exfiltration of raw sewage into the soil surrounding the pipeline could occur, potentially degrading the groundwater. Additional discussion regarding the known conditions of these two facilities is provided below.
Transcript of 6.0 POTENTIAL SOURCES OF GROUNDWATER DEGRADATION

WYA—September 2006 6-1 City Lodi of White Slough WPCF 711\04-05-02 Soil and Groundwater Investigation Existing Conditions Report Final Report
6.0 POTENTIAL SOURCES OF GROUNDWATER DEGRADATION
A discussion of the detailed evaluation assessing the potential sources of groundwater degradation in the vicinity of the WPCF site is presented in this section. The major topics are:
6.1 Subsurface Conveyance Facilities
6.2 Treatment Processes
6.3 Storage Facilities
6.4 Irrigation Water Distribution and Tailwater Collection Facilities
6.5 Irrigation Reuse and Land Application Areas
6.6 Onsite Sources not associated with the WPCF
6.7 Offsite Sources
6.8 Potential BPTCs
6.9 Summary and Recommendations
The specific items of concern that are addressed in this report are nitrogen and salinity. Each of the potential sources listed above are discussed in this section with respect to these constituents.
However, in a soil environment, nitrogen is transformed through a complex network of physical, chemical, and biological reactions collectively called the nitrogen cycle. An understanding of this cycle is needed when assessing the potential sources of nitrogen loadings to groundwater. Therefore, an overview of this cycle is provided in Appendix F.
6.1 SUBSURFACE CONVEYANCE FACILITIES
As shown on Figure 2-5, the influent municipal and industrial sewers both transect the City’s land application area. These two influent concrete sewer lines at the WPCF were constructed over 40 years ago. The deterioration of the cementitious material that comprises these subsurface conveyance facilities can reduce the thickness of the concrete and, in time, expose the steel reinforcement of the pipeline, eventually reducing the strength. Corrosion at the joints can expose the rubber gasket. If such corrosion becomes severe enough, infiltration of groundwater into the pipe could occur; and in surcharged conditions, exfiltration of raw sewage into the soil surrounding the pipeline could occur, potentially degrading the groundwater. Additional discussion regarding the known conditions of these two facilities is provided below.
WYA—September 2006 6-2 City Lodi of White Slough WPCF 711\04-05-02 Soil and Groundwater Investigation Existing Conditions Report Final Report
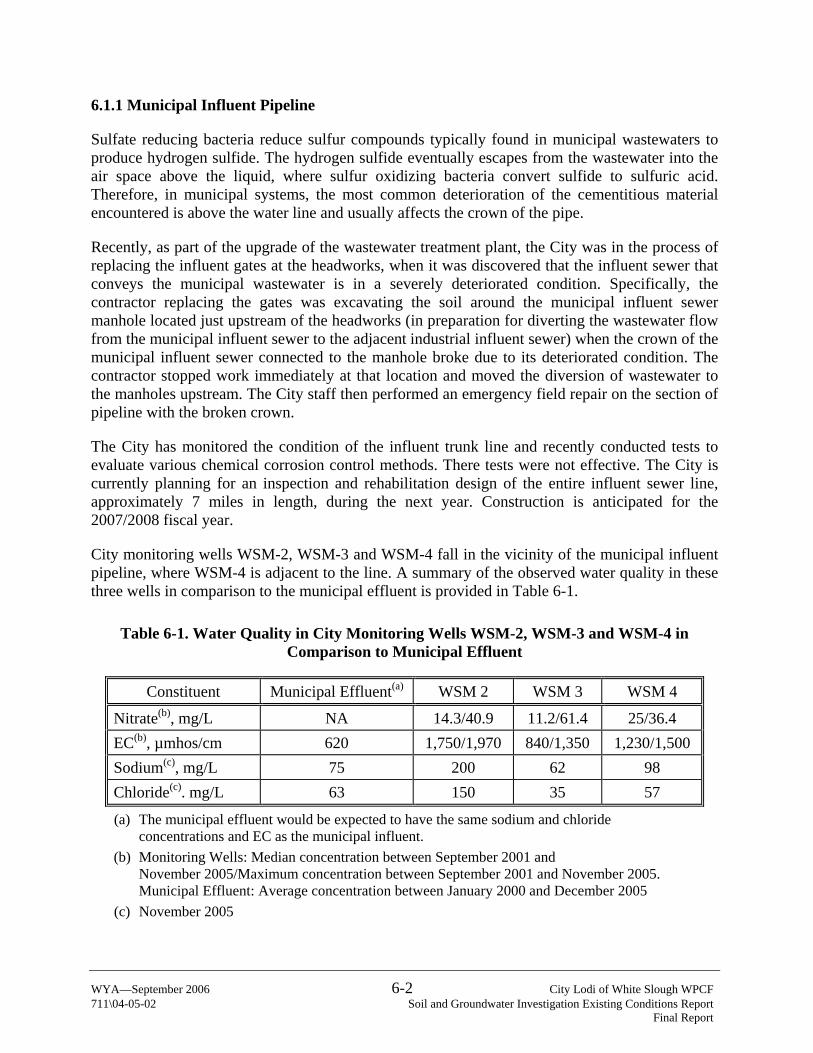
6.1.1 Municipal Influent Pipeline
Sulfate reducing bacteria reduce sulfur compounds typically found in municipal wastewaters to produce hydrogen sulfide. The hydrogen sulfide eventually escapes from the wastewater into the air space above the liquid, where sulfur oxidizing bacteria convert sulfide to sulfuric acid. Therefore, in municipal systems, the most common deterioration of the cementitious material encountered is above the water line and usually affects the crown of the pipe.
Recently, as part of the upgrade of the wastewater treatment plant, the City was in the process of replacing the influent gates at the headworks, when it was discovered that the influent sewer that conveys the municipal wastewater is in a severely deteriorated condition. Specifically, the contractor replacing the gates was excavating the soil around the municipal influent sewer manhole located just upstream of the headworks (in preparation for diverting the wastewater flow from the municipal influent sewer to the adjacent industrial influent sewer) when the crown of the municipal influent sewer connected to the manhole broke due to its deteriorated condition. The contractor stopped work immediately at that location and moved the diversion of wastewater to the manholes upstream. The City staff then performed an emergency field repair on the section of pipeline with the broken crown.
The City has monitored the condition of the influent trunk line and recently conducted tests to evaluate various chemical corrosion control methods. There tests were not effective. The City is currently planning for an inspection and rehabilitation design of the entire influent sewer line, approximately 7 miles in length, during the next year. Construction is anticipated for the 2007/2008 fiscal year.
City monitoring wells WSM-2, WSM-3 and WSM-4 fall in the vicinity of the municipal influent pipeline, where WSM-4 is adjacent to the line. A summary of the observed water quality in these three wells in comparison to the municipal effluent is provided in Table 6-1.
Table 6-1. Water Quality in City Monitoring Wells WSM-2, WSM-3 and WSM-4 in Comparison to Municipal Effluent
Constituent Municipal Effluent(a) WSM 2 WSM 3 WSM 4
Nitrate(b), mg/L NA 14.3/40.9 11.2/61.4 25/36.4 EC(b), µmhos/cm 620 1,750/1,970 840/1,350 1,230/1,500 Sodium(c), mg/L 75 200 62 98 Chloride(c). mg/L 63 150 35 57
(a) The municipal effluent would be expected to have the same sodium and chloride concentrations and EC as the municipal influent.
(b) Monitoring Wells: Median concentration between September 2001 and November 2005/Maximum concentration between September 2001 and November 2005. Municipal Effluent: Average concentration between January 2000 and December 2005
(c) November 2005

WYA—September 2006 6-3 City Lodi of White Slough WPCF 711\04-05-02 Soil and Groundwater Investigation Existing Conditions Report Final Report
Municipal influent, in general, has very high levels of ammonia nitrogen but very low levels of nitrate nitrogen. Ammonia nitrogen is not very mobile in a soil-water. However, ammonia nitrogen has the potential to be converted to nitrate nitrogen in aerobic environments, which could occur in an unsaturated vadose zone. Nitrate is mobile in a soil-water environment. Therefore, elevated nitrate levels in the monitoring wells could indicate an ammonia source associated with seasonal exfiltration from the influent line.
As discussed in Section 3.5.2.2, WSM-2 and WSM-4 are located in a region with relatively thick layer of sand, while the sand layer at WSM-3 is relatively small. As such, there may be a greater potential for degradation associated wit the influent line to affect WSM-2 and WSM-4.
As shown in Table 6-1, the median nitrate concentrations in WSM-4 are over twice the nitrate concentrations in WSM-2 and WSM-3. However, the maximum nitrate concentrations have been observed in WSM-3.
As discussed in Section 5.5.3.2 the nitrate variability in WSM-3 and WSM-4 is seasonal, while the variability in WSM-2 is uniformly increasing (a very similar uniform increase is seen in WSM-9, which is downgradient of the influent sewer). The seasonal variability observed in WSM-3 and WSM-4 would be consistent with exfiltration resulting from surcharges in the municipal line (where surcharging would be expected to occur primarily under high influent flow conditions in the winter months). The uniform increases observed in WSM-2 and WSM-9 could also be caused by exfiltration from the influent line if:
1. The gradient is such that the groundwater plume would be moving in the direction of these wells, and
2. The gradient is low enough that the shorter term fluctuations that are seen in wells WSM-3 and WMS-4 would be dampened.
Additional monitoring wells located near the WPCF main facilities have been recommended to help resolve local variations in gradient; and CPT in conjunction with hydropunch has been recommended between the area of the municipal influent line and Thornton Road, just south of WSM-9 to help define the vertical and lateral extent of the observed plume.
Well WSM-3 also has the lowest sodium and chloride concentrations and EC of any of the monitoring wells located on the City’s property. Furthermore, as shown in Figures 5-8 and 5-9, there appears to be a region encompassed by Wells WSM-3, WSM-4 and WSM-8 within the City’s property where the groundwater has relatively low sodium and chloride concentrations. As shown in Table 6-1, the sodium and chloride concentrations and EC are also relatively low in the municipal effluent. However, the chloride concentrations are greater than those observed in WSM-3. Therefore, other factors may be contributing to the low concentrations observed in WSM-3. As discussed in Section 5.5.2.2, the similarity between the data from WSM-3 and the monitoring wells RMW-1, RMW-2 and RMW-3 implies a surface water influence at this well. (Note that WSM-3 is also located adjacent to the unnamed channel of the Delta that transects the western portion of he City’s property). WSM-2 has sodium and chloride concentrations that are much higher than WSM-3 and WSM-4. This could indicate that the water quality in this well is influenced by the regional groundwater quality conditions discussed in Section 5.4.2.

WYA—September 2006 6-4 City Lodi of White Slough WPCF 711\04-05-02 Soil and Groundwater Investigation Existing Conditions Report Final Report
The minerals information provided in this report is based on preliminary data provided by the City and is subject to additional evaluation once more data become available. Nevertheless, this available data suggests that leakage from the municipal could be affecting the water quality in WSM-3 and WSM-4; but does not appear to be strongly affecting the water quality in WSM-2.
The City has committed to repairing the municipal sewer. Therefore, once the City has completed these efforts, any impacts to groundwater quality as the result of leakage from this sewer will be eliminated and additional controls should not be necessary.
6.1.2 Industrial Influent Pipeline
This line was initially constructed to convey secondary treated wastewater from the municipal wastewater treatment plant located within the City limits to the land application area. In the late 1960’s, shortly after the existing WPCF facilities were constructed, this line was converted to convey industrial wastewater. This line has not conveyed untreated domestic waste.
In typical industrial systems, corrosion results from direct aggression by the chemicals and their reaction products present in various discharge streams serviced by the system. Therefore, corrosion in industrial systems usually occurs below the water line and tends to be more predictable in nature.
The types of industrial discharges common to the City’s industrial sewer are not likely to lead to significant deterioration. However, in late 2002 the City discovered that a significant portion of the industrial influent pipeline on the eastern side of the WPCF property had been deteriorated. The cause of the deterioration was determined to be due to excessive turbulence caused by a partially closed valve located in a manhole on the City’s property. By late 2003, several sections of the pipeline and the suspect manhole were all replaced.
During the non-canning season, flows (and constituent concentrations) in the industrial line are very low. Therefore, significant exfiltration is not expected to have occurred during these periods. However, during the canning season, flows can be significant. The primary pollutant of concern during this time is EC and organic nitrogen. However, due to the nitrogen transformation processes in the soil environment and the variable nature of potential organic nitrogen loading from the industrial line, distinguishing the impacts of a nitrogen plume associated with the industrial line from other sources in the area would be difficult.
City monitoring wells WSM-8 and WSM-9 fall in the relative vicinity of the industrial influent pipeline. Both of these wells have only been monitored since August 2001. Therefore, an extensive record prior to the industrial line repairs in not available. Nevertheless, both of these wells exhibited occasional elevated levels of EC before the industrial line was repaired in early 2004. Furthermore, some of the most elevated EC levels were measured during the canning season. However, elevated EC levels were also measured during other times of the year and in the years following the repair. Therefore, a direct correlation between the elevated EC levels in the wells and the high salinity in the industrial line is not clear. Nevertheless, at least some impacts associated with the deteriorated industrial line are expected to have occurred.

WYA—September 2006 6-5 City Lodi of White Slough WPCF 711\04-05-02 Soil and Groundwater Investigation Existing Conditions Report Final Report
The City has since performed a closed circuit television inspection of the industrial influent line, and there were no apparent sign that infiltration or exfiltration was occurring from this line. Therefore, this facility is not expected to be currently leading to degradation of groundwater quality beneath the WPCF site.
6.2 TREATMENT PROCESSES
A detailed description of the onsite treatment processes was provided in Section 2.0. These processes can generally be classified as follows:
• Municipal Wastewater Treatment Process
• Solids Treatment Process
• Industrial Wastewater Treatment Process
All of the treatment processes discussed in Section 2.0 of this report are contained in structures that are either concrete or stainless steel. There is the potential for the concrete basins associated with the WPCF treatment processes to have major cracks that could lead to significant leakage of untreated wastewater flows to groundwater. However, the WPCF is currently undergoing a major upgrade and expansion of the municipal wastewater treatment processes, and no leaks, cracks, or other structural imperfections in the basins have been observed. Therefore, even though the untreated waste streams have significant nitrogen and salinity loads, the municipal facilities contain all of the control measures needed to ensure that these loads would not be transported to the groundwater beneath the WPCF site.
One facility that may be of concern for cracks or accidental leakage is the onsite biosolids storage lagoon due to volume and strength associated the waste held within this facility. The steel reinforced concrete lining for the biosolids lagoon was constructed in 1975, and is likely still intact. However, the City has not recently drained and inspected the integrity of this facility.
A summary of the selected constituent data for the treated biosolids and biosolids lagoon supernatant are provided in Table 6-2. The biosolids and biosolids supernatant, the two waste streams held within the lagoons, have concentrations of ammonia, organic nitrogen and salinity much higher than have been observed in any of the onsite monitoring wells. Therefore, leakage from this facility is not indicated. Furthermore, the City would need to have an alternative storage location for the treated biosolids until they could be land applied in order to inspect the biosolids lagoon. As such a location is not currently available, cleaning and inspection of the biosolids lagoon would be difficult. Therefore, cleaning and inspecting the biosolids lagoon is not recommended at this time because this facility is not suspected of having any type of major leakage based on available data.

WYA—September 2006 6-6 City Lodi of White Slough WPCF 711\04-05-02 Soil and Groundwater Investigation Existing Conditions Report Final Report
Table 6-2. Biosolids Lagoon Quality Data, August 2005 through January 2006
Constituent Biosolids Biosolids
Supernatant
Ammonia, mg/L as N 580 475 Nitrate, mg/L as N <0.2 <0.8 Organic Nitrogen, mg/L as N 887 733 EC, µmhos/cm 5067 5400 TDS, mg/L 1767 2000
As discussed in Section 2.3.1, the City is currently working to complete the Improvements Project 2007. Under this project the City’s municipal wastewater treatment facilities will be upgraded to meet future NPDES permit limits. Following the completion of this project, the WPCF treatment facilities would satisfy all of the reasonable treatment measures applicable to such a municipal facility.
6.3 STORAGE FACILITIES
The storage facilities associated with the WPCF agricultural reuse system include four storage ponds and three equalization (EQ) ponds. These ponds were originally constructed in the 1960’s, with no liner provided. As such, there is likely some leakage of stored water to underlying groundwater. Therefore ponds have the potential to be a source of groundwater degradation.
During the winter months (typically November through March), the storage ponds are used to hold the industrial flows and other captured flows that cannot be discharged to Dredger Cut. During the summer irrigation months (typically April through October), the ponds are used as operational storage for irrigation of the City-owned agricultural reuse facilities. Therefore, the water quality within the storage ponds is likely to vary throughout the year. Additional information regarding the sources and volumes of the flows directed to these ponds were provided in Section 2.0.
This section provides a summary of the potential impacts to groundwater quality that may be associated with leakage from the storage ponds. The following parameters are addressed:
• EC
• General Chemistry
• Nitrogen
Note that the City has only completed an initial analysis of the water quality in the storage ponds. Therefore the discussion presented below is based on limited data, and additional monitoring and analysis is needed to verify the conclusions presented.

WYA—September 2006 6-7 City Lodi of White Slough WPCF 711\04-05-02 Soil and Groundwater Investigation Existing Conditions Report Final Report
6.3.1 Electrical Conductivity
The City collected five monthly water quality samples in the storage ponds between September 2005 and March 2006 to evaluate the EC levels typical of the water stored in this facility. Based on this preliminary data, the salinity levels in the holding ponds decreased significantly in January through March in comparison to the concentrations measures in September through December. A summary of this data is provided in Table 6-3.
Table 6-3. Storage Pond Salinity
Constituents September through
December 2005 January through
March 2006
EC, µhos/cm 813 593
TDS, mg/L 530 377
Hardness, mg/L as CaCO3 163 117
The water quality variation in the storage pond shown in Table 6-3 can be attributed to the different sources of flows directed to this facility at different times throughout the year. During December and January period, stormwater runoff and municipal effluent flows (both of which have relatively low salinity levels) are the predominant source discharged to the storage ponds. During the September through December period, runoff and first-flush stormwater from the irrigation areas (which would have relatively high salinity levels due to the late-season irrigation of cannery wastewater) are the predominant source flows discharged to the ponds.
During both monitoring periods, the EC levels in the storage ponds are significantly lower than the EC levels observed in the underlying wells (Figure 5-7). Therefore, the storage ponds are not expected to be the primary cause of elevated EC levels observed in the monitoring wells. In fact, leakage from the storage ponds could be helping to reduce the elevated EC levels common in the regional groundwater. The City should continue to provide monitoring of the EC levels in the storage ponds to ensure levels stay below background groundwater quality.
6.3.2 General Chemistry
Consideration of the dissolved constituents contributing to EC can also be used to help resolve whether the storage ponds have a significant effect on water quality in the monitoring wells. During the same monitoring period discussed above, the City collected general chemistry data for the storage ponds to assess the major cations and anions common to the water stored in this facility.
Stiff diagrams showing the major cations and anions measured in the storage ponds during the September through December and January through March sampling periods are provided in Appendix G. For both of periods of sampling, the primary cation contributing to EC in the storage ponds is sodium, followed by lower concentrations of magnesium and calcium. By far, the major anion concentrations are from bicarbonate. This is also common to the regional conditions observed in the areas east of the City’s properties.

WYA—September 2006 6-8 City Lodi of White Slough WPCF 711\04-05-02 Soil and Groundwater Investigation Existing Conditions Report Final Report
Comparing the Stiff diagrams for the downgradient monitoring wells to the Stiff diagram generated for the onsite storage ponds shows that the general composition of the water chemistry observed in the storage ponds most resembles that found in WSM-1, and to a somewhat lesser extent, WSM-9. However, calcium was much more predominant in monitoring wells WSM-7 and WSM-8 than has been observed in the storage ponds to date.
A comparison of the sodium, calcium and chloride concentrations measured in the storage ponds during the two sampling periods to the concentrations measured in the monitoring wells downgradient of this facility in November 2005 are shown in Table 6-4.
Table 6-4. Comparison of Water Quality in the WPCF Storage Ponds to Downgradient Monitoring Wells (a)
Storage Ponds Monitoring Wells, November 2005
Constituent
September through
December, 2005
January through March, 2006 WSM–1 WSM–7 WSM–8 WSM–9
Sodium, mg/L 56 96 200 98 88 160 Calcium, mg/L 27 34 58 88 95 100 Chloride, mg/L 50 79 69 96 50 110 (a) The City has only recently initiated sampling for these constituents. Therefore, the
information presented in this table should be considered preliminary.
As shown in Table 6-4, the sodium concentrations in WSM 7 and WSM 8 are most similar to those measured in the storage ponds, while WSM-1 and WSM-9 both exhibit elevated levels of sodium in comparison to the storage ponds. As discussed in Section 5.5.2.1, the somewhat elevated sodium concentrations observed in WSM-1 and WSM-9 may be partially attributable to underlying regional groundwater conditions. The chloride concentrations in WSM 1 and WSM 8 are most similar to those observed in the storage ponds.
The calcium concentrations in all of the downgradient monitoring wells are greater in the concentrations observed in the storage ponds. As discussed in Section 3.4 the soils on the City’s properties have a calcareous component that would lead to the natural calcification of the underlying groundwater. Note, however, that the lowest observed calcium concentrations in any of the monitoring wells located east of the peripheral canal were observed in WSM-1.
Although this data is preliminary, it does suggest that water percolation from the storage ponds could be affecting (at least partially) the groundwater quality in the wells located in the northeastern corner of the City’s property. Well WSM-1, WSM-7 and WSM-8, in particular, appear to be affected by the storage ponds. However, at least with respect to chloride and sodium

WYA—September 2006 6-9 City Lodi of White Slough WPCF 711\04-05-02 Soil and Groundwater Investigation Existing Conditions Report Final Report
concentrations, the storage ponds appear to have a beneficial impact on underlying groundwater quality; and may be helping to reduce the impacts of salinity intrusion observed in the region.
The City should be able to maintain the salinity of the water stored in the ponds such that it is better than the underlying groundwater and it would not lead to exceedance of applicable water quality objectives in the groundwater. Under such conditions, the percolation from the ponds would likely result in beneficial water quality impacts to the underlying groundwater salinity.
6.3.3 Nitrogen
The potential for nitrogen loading to groundwater from the storage ponds is discussed below under the following topics:
• Typical Storage Pond Nitrogen Concentrations
• Comparison to Downgradient Monitoring Wells
• Sources of Storage Pond Nitrogen
• Storage Pond Nitrogen Transformations
The City has monitored the concentrations of nitrate, ammonia and total nitrogen in the four onsite holding ponds 26 times since June 2003. Furthermore, the City has monitored the nitrate, ammonia and total nitrogen in the municipal effluent, which is the major sources of flow directed ponds. Therefore, the most of the analyses presented in this section are based on a significant body of data, and should provide a reasonable picture of the potential nitrogen impacts associated with the storage facilities.
6.3.3.1 Typical Storage Pond Nitrogen Concentrations
A summary of the average monthly concentrations of the nitrogen compounds in the City’s storage ponds are shown on Figure 6-1. As shown, the nitrogen concentrations in the storage ponds vary seasonally, as follows:
1. Ammonia is the dominant form of nitrogen in the ponds during the non-irrigation season.
2. Ammonia concentrations typically increase through the fall months, and stay relatively high through the spring.
3. Organic nitrogen is the dominant form of nitrogen during the irrigation season.
4. Organic nitrogen concentrations vary throughout the year, with the highest concentrations observed in the late summer through fall, and in the late spring.
5. Nitrate nitrogen concentrations are typically low year round, but are the highest in the spring months.
6. The total nitrogen concentrations in the storage ponds are somewhat elevated, particularly during the winter months. However, most of the nitrogen is either in the form of ammonia or organic nitrogen, neither of which is very mobile in soil/water environments (unlike nitrate).

Figure 6-1. Average Storage Pond Nitrogen Concentrations (June 2003 - March 2006)
0
10
20
30
40
50
Jan Feb Mar Apr May June Jul Aug Sept Oct Nov Dec
Con
cent
ratio
n, m
g/L
as N
Ammonia Organic Nitrogen Nitrate

WYA—September 2006 6-11 City Lodi of White Slough WPCF 711\04-05-02 Soil and Groundwater Investigation Existing Conditions Report Final Report
6.3.3.2 Comparison to Downgradient Monitoring Wells
As discussed in Section 6.3.2, the storage ponds appear to have an impact on the water quality observed in WSM-1 and WSM-8, and to a lesser extent WSM-7 and WSM-9. Table 6-5 presents a comparison of the concentrations of ammonia-nitrogen, organic-nitrogen, and nitrate-nitrogen in these monitoring to the concentrations measured in the storage ponds during the following three periods:
• January through April
• May through August
• September through December
Note that the City has collected a considerable body of nitrogen data from the storage ponds and has collected nitrate data in the monitoring wells for over 10 years. However, only a limited amount of ammonia and organic nitrogen data has been collected from the onsite monitoring wells. Therefore, the groundwater data presented regarding these constituents should be considered preliminary.
Table 6-5. Comparison of Nitrogen in the WPCF Storage Ponds to Nitrate in Downgradient Monitoring Wells
Storage Ponds Monitoring Wells
Constituent
January through April
May through August
Septemberthrough
December WSM–1 WSM–7 WSM–8 WSM–9
Ammonia(a), mg/L 20.6 1.2 11.9 <0.5 <0.5 <0.5 <0.5 Organic Nitrogen(a), mg/L 8.6 7.8 9.8 2.1 3.0 1.9 3.5 Nitrate(b), mg/L 4.2 2.0 1.4 22/25 25/40.9 11/17 10/32
(a) Storage Ponds: Average Concentration between June 2003 and March 2006 Monitoring Wells: November 2005.
(b) Storage Ponds: Average Concentration between June 2003 and March 2006 Monitoring Wells: Median concentration between September 2001 and November 2005/Maximum concentration between September 2001 and November 2005.
Nitrate is very mobile in soil-water systems. However, the nitrate concentrations are much lower in the storage ponds than they are in the underlying groundwater. Therefore, nitrate in the storage ponds is not expected to be contributing to underlying elevated nitrate levels. There could be the potential for ammonia nitrogen and to some extent organic nitrogen (which are not typically mobile in soil-water systems) to be converted to nitrate nitrogen in aerobic environments. The area beneath the storage pond is likely to stay saturated for most of the year due to the presence of

WYA—September 2006 6-12 City Lodi of White Slough WPCF 711\04-05-02 Soil and Groundwater Investigation Existing Conditions Report Final Report
water in the ponds. Such conditions would result in a low oxygen environment. However, there are limited times during the year when the ponds are fairly empty. Therefore, the appropriate conditions for the ammonia and organic nitrogen to be converted to nitrate in the groundwater beneath the ponds do not clearly exist.
As noted in Section 5.5.3.2.4 and shown in Table 6-5, there is limited temporal variability in the nitrate concentrations observed in WSM-1 and WSM-8. Such behavior may be attributable to relatively uniform source contributions, which would be indicative of an influence from the storage ponds. The variability in the nitrate concentrations observed in WSM-7 and WSM-9 is much greater (Section 5.5.3.2.2). However, WSM-7 exhibits seasonal variability, while the nitrate levels in WSM-9 have been increasing uniformly. These factors suggest that some different sources may be influencing the water quality in these wells. As noted in Section 5.5.3.2.2, WSM-7 is located near an unlined irrigation ditch. Therefore, the seasonal variability observed in this well may be at least partially attributed to this factor.
Based on the information presented above it appears that the ponds have the potential to be contributing to elevated groundwater nitrate levels in the wells located in the northeastern corner of the City’s property. Therefore, additional control measures are recommended to reduce the potential for such impacts. Additional discussion regarding such measures is provided in Section 6.5.
6.3.3.3 Sources of Storage Pond Nitrogen
The average monthly ammonia-nitrogen, organic-nitrogen, and nitrate-nitrogen loadings from the various sources that are discharged to the storage ponds are shown on Figures 6-2, 6-3 and 6-4, respectively. As shown, the majority of nitrogen loading to the storage ponds is organic nitrogen.
The primary source of ammonia loading to the storage ponds is from the biosolids supernatant, which is directed to the ponds during the non-irrigation season. Therefore, the discharge of supernatant flows to the storage ponds is at least partially the cause of the elevated ammonia concentrations observed in the storage ponds during the winter months.
The primary source of organic nitrogen loading to the storage ponds is runoff from the City-owned properties during the months from June through September (when the cannery wastewater flows are being applied to the land application areas). The elevated organic nitrogen concentrations observed in the storage ponds during the late summer through fall months correlate with the elevated organic nitrogen loadings associated with the runoff from the City-owned properties (Figures 6-1 and 6-3). However, the municipal effluent and biosolids supernatant also contribute organic nitrogen to the storage ponds. These loads could be contributing to the elevated concentrations of organic nitrogen observed in the late spring.
The majority of nitrate load to the ponds is from treated municipal effluent. The nitrate load associated the municipal flows that are periodically discharged to the ponds during the winter months at least partially contribute to the observed high nitrate concentrations observed in the storage ponds during the late spring (noted in observation 5 in Section 6.3.1.1.1).
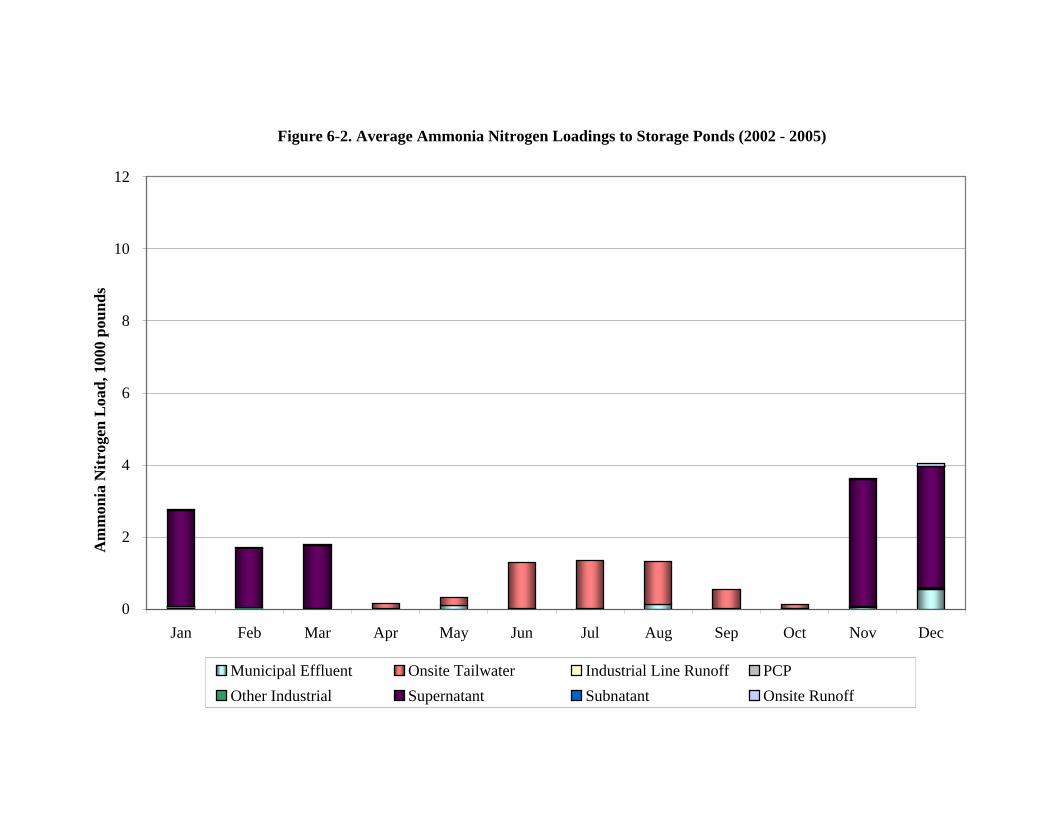
Figure 6-2. Average Ammonia Nitrogen Loadings to Storage Ponds (2002 - 2005)
0
2
4
6
8
10
12
Jan Feb Mar Apr May Jun Jul Aug Sep Oct Nov Dec
Am
mon
ia N
itrog
en L
oad,
100
0 po
unds
Municipal Effluent Onsite Tailwater Industrial Line Runoff PCPOther Industrial Supernatant Subnatant Onsite Runoff

Figure 6-3. Average Organic Nitrogen Loading to Storage Ponds (2002 - 2005)
0
2
4
6
8
10
12
Jan Feb Mar Apr May Jun Jul Aug Sep Oct Nov Dec
Org
anic
Nitr
ogen
Loa
d, 1
000
poun
ds
Municipal Effluent Onsite Tailwater Industrial Line Runoff PCPOther Industrial Supernatant Subnatant Onsite Runoff

Figure 6-4. Average Nitrate Nitrogen Loading to Storage Ponds (2002 - 2005)
0
1
2
3
4
5
6
7
8
9
10
11
12
Jan Feb Mar Apr May Jun Jul Aug Sep Oct Nov Dec
Nitr
ate
Nitr
ogen
Loa
d, 1
000
poun
ds
Municipal Effluent Onsite Tailwater Industrial Line Runoff PCPOther Industrial Supernatant Subnatant Onsite Runoff

WYA—September 2006 6-16 City Lodi of White Slough WPCF 711\04-05-02 Soil and Groundwater Investigation Existing Conditions Report Final Report
6.3.3.4 Storage Pond Nitrogen Transformations
Nitrogen transformations are also likely to occur in the storage ponds, and should also be considered in addition to the loading information provided in Figures 6-2 through 6-4. Amongst other factors, the nitrogen transformations in the storage ponds would be affected by the amount of dissolved oxygen in the ponds. Under conditions where dissolved oxygen is present, excess ammonia would typically be converted to nitrate. Under conditions where dissolved oxygen levels are low; nitrate would be converted to nitrogen gas and organic nitrogen would be converted to ammonia via mineralization/ammonification.
The average storage pond nitrogen concentrations that were presented in Figure 6-1 reflect the concentrations in the top 1-foot elevation of the storage ponds. Typically, the top few feet of the ponds have a measurable dissolved oxygen level and the bottom part is undergoing anaerobic digestion with no dissolved oxygen. The upper pond layers will typically not have more than 10 mg/L of dissolved oxygen. If the surface concentrations of dissolved oxygen drop to 2 to 3 mg/L of dissolved oxygen, the waste in the ponds putrefies and the lack of oxygen creates an anaerobic zone on the surface, causing denitrification. These anaerobic bacteria also liberate hydrogen sulfide gas and methane (the cause of odor), and without a protective oxygenated layer, these odors would be released to the environment. For this reason, the City is required to monitor dissolved oxygen in the top 1-foot of the ponds on a monthly basis.
The average dissolved oxygen concentrations observed within the top 1-foot of elevation in the storage ponds between January 2000 and February 2006 are shown on Figure 6-5. The dissolved oxygen levels in Pond #1 (which, as shown on Figure 2-7, first receives the majority of the flow directed to the storage ponds during the summer months) drop significantly during August and September. This is because during the late summer months, the BOD load associated with the onsite runoff can be significant (similar to the organic nitrogen load). During the remainder of the year, the dissolved oxygen levels at the surface of the ponds are relatively high.
The elevated ammonia concentrations observed in the late fall (prior to the input of a significant volume of supernatant flows) could be contributed to by the mineralization/ammonification of organic material at the bottom of the ponds that would occur in an anoxic environment that typically occurs during this period. Such activity could also account for the slight decrease in organic nitrogen concentrations observed in the ponds in October (Figure 6-1).
The nitrate loads directed to the ponds during the late summer months are also likely at least partially converted to nitrogen gas via denitrification due to the low dissolved oxygen levels during this period. As discussed in Section 6.4.3.2 below, a comparison of the nitrate loads directed to the City’s storage ponds to the nitrate loads applied to the field areas confirms that at least a portion of the nitrate is lost to nitrogen gas via denitrification.
Another process that could result in nitrogen concentrations changes in the storage ponds is the re-suspension of solids from the bottom of the ponds, which is common in pond systems during the early spring. This re-suspension is a result of a process known as turnover, when surface water is cooled quickly to a temperature near that of the deep water, allowing them to mix. Thus a turnover can happen if a cold rain and wind cools the surface water. The increase in total and organic nitrogen concentrations in the storage ponds in the early spring (March and April) may be partially attributed to this factor.

Figure 6-5. Average Dissolved Oxygen Concentrations in the Surface of the Storage Ponds (January 2000 - February 2006)
0
2
4
6
8
10
12
Jan Feb Mar Apr May June July Aug Sept Oct Nov Dec
Dis
solv
ed O
xyge
n, m
g/L
Four-Pond Average Pond 1Note: Storage Pond 1 is typically empty during October

WYA—September 2006 6-18 City Lodi of White Slough WPCF 711\04-05-02 Soil and Groundwater Investigation Existing Conditions Report Final Report
6.4 IRRIGATION WATER DISTRIBUTION AND TAILWATER COLLECTION FACILITIES
This section provides a summary of the potential impacts to groundwater quality that may be associated with the irrigation water distribution and tailwater collection facilities. However, distinguishing between potential impacts associated with the irrigation water distribution and tailwater collection facilities from the potential impacts associated with land application would be difficult. Therefore, this section provides an overview of what aspects of the existing irrigation water distribution and tailwater collection facilities may be leading to groundwater impacts. The two major areas of concern are as follows:
• Earthen conveyance ditches
• Irrigation water and biosolids distribution
Additional assessment of the potential Best Practicable Treatment and Controls (BPTCs) that could be applied to reduce the potential for impacts associated with these facilities is provided in Section 6.8.
6.4.1 Earthen Conveyance Ditches
Irrigation water is distributed to the irrigation area via a series of concrete-lined and earthen irrigation ditches and subsurface pipelines; the major distribution facilities are concrete lined or piped. Therefore, the major distribution facilities ensure that the loads associated with the irrigation water would not be transported to the groundwater beneath the WPCF site.
However, the ditches used to convey irrigation flows to the individual field areas are not concrete lined. Well WSM-7 is located adjacent to one of these smaller, unlined ditches. As discussed in Section 5.5.3.2.1, nitrate data collected from this well shows significant seasonal variation, unlike other wells located within the agricultural ruse area. Therefore, this evidence suggests that the water quality observed in this well may be affected by some other source that does not appear to be affecting other wells within the land application areas. The unlined ditch could be this source.
All of the tailwater collection facilities are also earthen ditches. As demonstrated in this report, tailwater flows can be significant source of nitrogen, particularly during the canning season. However, these loads are only a fraction of the applied irrigation water loadings. Furthermore, per the Waste Discharge Requirements prescribed to the WPCF land application area, the City must ensure that no standing water is left within the return flow ditches during the irrigation season. Therefore, the tailwater return flows are only held within the tailwater and stormwater conveyance facilities for short periods of time. During the winter months, large volumes of stormwater runoff can be held within the City’s field and stormwater collection facilities for long periods of time. However, this flow has relatively low loadings associated with it. Therefore, the tailwater and stormwater collection facilities are not expected to be a significant source of groundwater degradation at the WPCF site.

WYA—September 2006 6-19 City Lodi of White Slough WPCF 711\04-05-02 Soil and Groundwater Investigation Existing Conditions Report Final Report
6.4.2 Irrigation Water and Biosolids Distribution
The individual field areas are irrigated via furrow irrigation for row crops (such as corn) and border check (graded basin or flood) irrigation for field crops (such as alfalfa). As documented in the City’s Wastewater Mater Plan (WYA, 2001), this existing irrigation system is not capable of evenly distributing the applied irrigation water. This is because the amount of time allowed for water infiltration (or irrigation) at the head end of the field must be greater than what is necessary to meet crop demands to ensure that adequate infiltration (or irrigation) occurs at the tail end of a field. Therefore, the amount of water that infiltrates below the root zone (and therefore not taken up by the crop) at the head end of the field could be significant, which could lead to overloading of the underlying groundwater.
Furthermore, applied solids, either biosolids or organic solids associated with the PCP cannery flows, have been observed to settle out near the head of the field rather than being distributed through the length of the furrow and/or graded basins (WYA, 2001). Therefore, nitrogen loadings at the head end of the irrigation fields could be in excess of the capacity for the crops and soil to filter, remediate, and absorb these loadings without degradation of groundwater quality.
6.5 IRRIGATION AND LAND APPLICATION AREAS
This section provides a summary of the potential impacts to groundwater quality that may be associated with the City’s recycled water irrigation reuse and biosolids land application practices. The following topics are addressed:
• Overview of Potential Impacts
• Salinity
• General Chemistry
• Nitrogen
• Summary of Soil Data
6.5.1 Overview of Potential Impacts
Effective irrigation reuse of recycled water and biosolids land application is dependent on the ability of soil and crops to filter, assimilate, and transform nitrogen species without degradation of groundwater quality. To ensure that these processes are effective, the irrigation application rate and field loadings of nitrogen species must not exceed the assimilative capacity of the root and unsaturated zones.
Since 2000 the City has been monitoring the irrigation application rates and total nitrogen loadings to each of the individual field areas to verify that they do not exceed the estimated annual crop uptake rates for that field. (Prior to this time, the City was monitoring these loadings to the entire land application area as a whole.) As discussed in Section 2.4.3.1, the field nitrogen loading rates are assumed to be equal to the sum of the total nitrogen in the applied irrigation water and the EPA recommended biosolids plant available nitrogen (PAN). However, a site-specific evaluation of the allowable monthly loading rates is currently being developed. Therefore, the available information does not clearly demonstrate whether the City’s current land

WYA—September 2006 6-20 City Lodi of White Slough WPCF 711\04-05-02 Soil and Groundwater Investigation Existing Conditions Report Final Report
application practices have the potential to lead to elevated levels of nitrogen in the underlying groundwater.
Nevertheless, as discussed in Section 2.0, the City has been practicing agricultural reuse and biosolids land application on the properties surround the WPCF since the early 1950’s.Therefore, there may be the potential that the historic land application practices (prior to the initiation of the monitoring and controls that have occurred since 2000) to have lead to some impacts to underlying groundwater.
6.5.2 Salinity
Only a portion of inorganic mineral salts dissolved in the applied irrigation water and biosolids would be taken up by plants. Therefore, if the salinity in the applied irrigation water is greater than the underlying groundwater, there could be the potential for the City’s land application practices to lead to increased salinity in groundwater. However, as discussed in Section 5 the regional groundwater conditions also have an affect on the salinity of the underlying groundwater. Therefore, the application of irrigation water and biosolids cannot clearly be demonstrated to be leading to an increase in the levels of salinity in the groundwater. An evaluation of the potential for the City’s land application practices to lead to an increase in groundwater salinity is discussed below under the following topics:
• Sources of Irrigation Water Salinity
• TDS Field Loadings
6.5.2.1 Sources of Irrigation Water Salinity
The salinity of the irrigation water varies throughout the irrigation season, depending on the source of the irrigation flows. Furthermore, several of the low-volume flows have elevated levels of salinity. Therefore, total salinity loads must be considered when assessing the relative salinity contribution associated with each source.
Both EC and TDS are a measure of the salinity. However, only the TDS can be combined with flow data to determine the total salinity load associated with a given source. The TDS load associated with each of the salinity load sources that are discharged to the City’s field areas (including biosolids) are shown on Figure 6-6. Note that agricultural return flows were not included in this assessment because these loads are actually just a portion of the total applied load, and inclusion in this assessment would be misleading. As shown, the municipal discharge and cannery flows are, by far, the most significant source of TDS to the land application area. Therefore, these two sources would have the biggest potential to impact to the salinity levels in the groundwater.
Note that the TDS loading data presented in Figure 6-6 can be misleading. This is because a portion of the measured TDS is from organic compounds that would readily breakdown in the soil environment. This would likely be the case with the cannery wastewater flows. These organic dissolved solids would have very little electric charge. The measured EC of the applied irrigation water would not be significantly affected by the presence of organic dissolved solids and would provide a better indication of the inorganic minerals associated with the municipal and industrial flows.

6-6. Estimated Total Dissolved Solids Loading From All Sources that are Applied to the City's Field Areas and Storage Ponds
(1000 lb/yr)
2,02336%
2,56045%
11 6%
Domestic Effluent
PCP
Industrial Line WinterRunoff
Onsite Winter Runoff
Other Industrial
Supernatant
Subnatant
Biosolids

WYA—September 2006 6-22 City Lodi of White Slough WPCF 711\04-05-02 Soil and Groundwater Investigation Existing Conditions Report Final Report
A summary of the average monthly EC in the applied irrigation water in comparison to the EC in the municipal effluent and industrial wastewater flows is provided in Table 6-6. As shown, the EC of the industrial wastewater can be somewhat elevated, particularly during the late irrigation season when the cannery is in full operation. However, because these flows are combined with a significant volume of municipal effluent that has relatively low EC, the EC in the combined irrigation flow is always less than the EC levels observed in the underlying wells (Figure 5-7).
Table 6-6. Average Irrigation Water EC (2002-2005)
Month Irrigation Water Municipal Effluent Industrial Wastewater
April 840 630 850
May 700 620 900 June 690 610 940
July 800 620 1200 August 860 620 1070
September 820 660 1210 October 780 660 860
6.5.2.3 TDS Field Loadings
Since the 2000 irrigation season, the City has been monitoring the TDS loading of the combined recycled water flow applied to the field areas. A graphical comparison of these TDS field loadings in each of the major quadrants of the City’s land application area to the EC measured in the monitoring wells located in these quadrants is provided in Appendix H. Figures depicting the measured TDS loadings in each of the field areas are also provided in Appendix H. The following observations can be made from these figures:
• TDS loadings have decreased significantly since 2000 and 2001. This correlates with the decrease in flows from the PCP cannery that have occurred since 2002.
• TDS loadings in the southeastern quadrant have consistently been greater than the loadings to the other quadrants, yet the lowest EC levels in the groundwater monitoring wells are the lowest in this quadrant.
• The EC levels in the monitoring do not appear to have a seasonal variability, which would be expected if they were largely influenced by field loadings.
Based on this information, the City’s land application practices are not the primary cause of elevated EC levels observed in the monitoring wells. In fact, irrigation on the City’s property could be helping to reduce the elevated EC levels common in the regional groundwater. As discussed in Section 5, further work is needed to evaluate background concentrations of EC in groundwater in comparison to the levels measured on the City’s property.

WYA—September 2006 6-23 City Lodi of White Slough WPCF 711\04-05-02 Soil and Groundwater Investigation Existing Conditions Report Final Report
6.5.3 General Chemistry
Consideration of the dissolved constituents contributing to EC can also be used to help resolve whether the land application on the City’s property has had a significant effect on water chemistry in the monitoring wells. As discussed in Section 5.5.2, the general chemistry in the onsite monitoring wells appears to be strongly influenced by regional conditions, particularly in the western half of the City’s property.
Another complicating factor in this assessment is the fact that the vast majority of flow applied to the City’s property is municipal effluent, which is originally derived as a local groundwater source. Therefore it would be expected that the general chemistry of the applied flows would be characteristic of the regional groundwater conditions located east of the WPCF. Therefore, it will likely be difficult to distinguish the potential impacts associated with land application from the regional influences.
The City has collected some initial general chemistry data for the various sources of irrigation flow. The data collected for the municipal effluent, the industrial line flows during the canning season, and combined irrigation flow during the canning season been used to develop Stiff Diagrams, which are provided in Appendix G.
The primary cation contributing to the salinity in both the municipal effluent and the industrial flows is sodium, followed by lower concentrations of magnesium and calcium. However, the sodium levels in the industrial discharge during the canning season are very high. This is largely to the fact that the PCP cannery relies on sodium hydroxide in their canning process to help remove the skins from the fruits and vegetables prior to canning. As discussed in Section 2.3.3, the PCP cannery is planning to change their existing process to use potassium hydroxide in lieu of sodium hydroxide. This will result in a significant decrease in the sodium loadings on the City’s properties. Further, potassium is a beneficial nutrient to crops and will generally be assimilated into the plant material that is removed from the field areas.
The major anion concentrations are from chloride in the industrial influent during canning season and bicarbonate in the municipal flows; however, chloride is also prominent in this source.
A comparison of the sodium and chloride concentrations in these two major sources of irrigation water in comparison to the combined flow during the PCP canning season is provided in Table 6-7.
Table 6-7. Irrigation Source Water Sodium and Chloride Concentrations
Constituent
Irrigation Water DuringPCP Canning
Season(a) MunicipalEffluent(b)
Industrial Flows During PCP
Canning Season(a)
Sodium, mg/L 107 75 315 Chloride, mg/L 77 64 145 (a) August – September, 2005 (b) August 2005 – February 2006

WYA—September 2006 6-24 City Lodi of White Slough WPCF 711\04-05-02 Soil and Groundwater Investigation Existing Conditions Report Final Report
As shown in Figures 5-8 and 5-9, the chloride and sodium concentrations are slightly more elevated in wells WSM-1, WSM-9 and WSM-10 in comparison to wells WSM-8 and WSM-6. This could indicate the elevated concentrations of chloride and sodium in the applied irrigation water has had an affect on the concentrations in the groundwater beneath the City’s property.
However, as discussed in Section 5.4.2, there are also significant regional influences that appear to be affecting the levels of these constituents in the underlying groundwater. Furthermore, the City has collected very limited general chemistry data for the monitoring wells and the potential sources that may affect these wells. Therefore, additional monitoring is needed to draw any definite conclusions.
6.5.4 Nitrogen
This section provides a summary of the following topics with respect to the nitrogen applied to the City’s irrigation areas:
• Typical Irrigation Water Nitrogen Concentrations • Sources of Land Applied Nitrogen • Historic Nitrogen Field Loadings
6.5.4.1 Typical Irrigation Water Nitrogen Concentrations
A summary of the average monthly nitrogen concentration speciation in the combined recycled water flows is shown on Figure 6-7 (note that this is different from Figure 6-1, which shows the nitrogen concentration speciation in the flows stored in the City’s ponds). As shown, the nitrogen concentrations in the recycled water applied to the City’s property vary seasonally as follows:
• Total nitrogen concentrations in the applied irrigation flows are the highest in April and October, when irrigation flows are the lowest.
• In April, the City is relies on flow stored over the winter months as a major source of irrigation flows and ammonia is the dominant form of nitrogen at this time (Figure 6-1).
• In October, the predominant source of irrigation flow is also from storage. At this time, storage volumes are dominated by irrigation return flows and domestic effluent.
• During the majority of the year, organic nitrogen is the dominant form of nitrogen in the applied flows, and it is the greatest when in the late summer months when a large portion of the irrigation flows are from the PCP cannery.
• Nitrate is the dominant form of nitrogen in May, when municipal effluent is the dominant source of irrigation flows. However, irrigation flow nitrate concentrations are typically less than the concentrations observed in the monitoring wells (Figure 5-4).
The elevated nitrogen concentrations in the irrigation water late in the growing season could be of concern due to the fact that crop nutrient uptake is typically limited during this period. The monthly crop nutrient uptake rates currently being developed for the City’s property can be used to assess whether late season nitrogen loadings are of concern.

Figure 6-7. Average Land Applied Irrigation Water Nitrogen Concentrations (2002 - 2005)
0
10
20
30
40
50
Apr May June July Aug Sept Oct
Con
cent
ratio
n, m
g/L
as N
Ammonia Nitrate Organic Nitrogen

WYA—September 2006 6-26 City Lodi of White Slough WPCF 711\04-05-02 Soil and Groundwater Investigation Existing Conditions Report Final Report
6.5.4.2 Sources of Land Applied Nitrogen
The nitrogen loads from the biosolids applied to the City’s properties are monitored to ensure that the applications of biosolids are in accordance with the EPA guidelines. Based on available data organic nitrogen and ammonia are the predominant form of nitrogen in the applied biosolids.
Historically, only a very small fraction of total nitrogen applied to the irrigation areas from commercial fertilizers. Furthermore, such applications are coordinated with the City such that they do not result in an exceedance of the crop demands. Therefore, such applications are not expected to be contributing to elevated levels observed in the underlying groundwater.
The sources of nitrogen loadings associated with the irrigation flow directed to the City’s irrigation reuse facilities are as follows:
• Treated domestic effluent.
• Industrial line flows, which primarily consist of discharges from the PCP cannery but also include winter stormwater runoff and captured stormwater runoff from the agricultural area located east of the City’s property.
• Captured stormwater runoff from the City-owned property.
• Supernatant flows from the onsite biosolids lagoon.
• Subnatant from the DAF thickener.
However, the nitrogen transformations and losses that occur in the storage ponds need to be considered to determine the field loadings attributed to each of these various sources. To better understand such transformations, the nitrogen loadings from all the sources (including biosolids) that are directed to the agricultural reuse system as a whole have been combined and compared to measured nitrogen loadings that are applied to the irrigation areas. This comparison is presented on Figure 6-8 (a) and (b).
Note that the nitrogen loads shown in these figures that are associated with each individual source are either directly monitored by the City or have been estimated for purposes of the evaluations presented in this report, and the total nitrogen loads applied to the field areas are directly monitored by the City. Also note that the loads associated with the biosolids are not the PAN loads presented in Section 2.4.3.1, but rather the actual loadings applied and, therefore, do not account for denitrification losses and mineralization. This is because the PAN loads would change if in the future an alternative means of biosolids treatment and disposal were employed. Therefore, an understanding of the entire potential loading from this source is necessary. Finally, agricultural return flows were not included in this assessment because these loads are actually just a portion of the total applied load, and inclusion in this assessment would be misleading.

Figure 6-8. Irrigation Area Nitrogen Loading Sources
(c). Estimated Total Nitrogen Loading From All Sources that are Applied to the City's Field Areas and Storage Ponds
Designated by Individual Sources(1000 lb/yr)
8331%
4918%19
7%
10138%
11 6%
Domestic Effluent
PCP
Industrial Line WinterRunoff
Onsite Winter Runoff
Other Industrial
Supernatant
Subnatant
Biosolids
(a). Estimated Nitrogen Loading From All Sources that are Applied to the City's Field Areas and Storage Ponds
(1,000 lb/yr)
8028%
8028%
12444%
NO3LoadingNH4LoadingON Loading
(b). Total Nitrogen Loading To City Fields(1,000 lb/yr)
3715%
8634% 128
51%
NO3Loading
NH4Loading
ON Loading
Total Measured Load = 251Total Estimated Load = 284
(d). Estimated Nitrate Nitrogen Loading From All Sources that are Applied to the City's Field Areas and Storage Ponds
Designated by Individual Sources(1000 lb/yr)
7291%
Domestic Effluent
PCP
Industrial Line WinterRunoff
Onsite Winter Runoff
Other Industrial
Subnatant
Biosolids
(e). Estimated Ammonia Nitrogen Loading From All Sources that are Applied to the City's Field Areas and Storage Ponds
Designated by Individual Sources(1000 lb/yr)
5570%
1215%
67%
Domestic Effluent
PCP
Industrial Line WinterRunoff
Onsite Winter Runoff
Other Industrial
Supernatant
Subnatant
Biosolids
(f). Estimated Organic Nitrogen Loading From All Sources that are Applied to the City's Field Areas and Storage
Ponds Designated by Individual Sources(1000 lb/yr)
2520%
4537%
4234%7
5% 43%
Domestic Effluent
PCP
Industrial LineWinter Runoff
Onsite WinterRunoff
Other Industrial
Supernatant
Subnatant
Biosolids

WYA—September 2006 6-28 City Lodi of White Slough WPCF 711\04-05-02 Soil and Groundwater Investigation Existing Conditions Report Final Report
The following observations can be made from these figures:
• Organic nitrogen is the primary source of nitrogen loading to the field areas.
• The loading of nitrate to the agricultural reuse system is significantly greater than the total nitrate loading applied to the field areas. This is attributed to the denitrification within the ponds. Approximately half of the agricultural reuse system nitrate appears to be lost to denitrification in the storage ponds per year.
• The organic and ammonia nitrogen loadings directed to the agricultural reuse system are slightly lower than the loadings that are measured as being applied to the field areas. This difference is attributed to the fact that the combined agricultural reuse system source loadings do not include agricultural return flows, which are included in the field loadings. As discussed in Section 2.4.3.4, the City is currently over-estimating the total volume of flow (and therefore loads) that is applied to the field areas by double counting these flows.
Figures 6-8 (c) through (f) show the total nitrogen, ammonia nitrogen, nitrate nitrogen, organic nitrogen load associated with each of the sources that contribute to the irrigation reuse system as a whole. Also note that the loads associated with the captured agricultural return flows were not included in the presented loads. The following observations can be made from these figures:
• 6-8 (c): Biosolids and domestic effluent are the primary source of total nitrogen loading to the irrigation system as a whole. However, denitrification losses in the storage ponds would result in the nitrate-nitrogen loading to the field areas associated with the municipal effluent to be less than what is shown on this figure. Therefore, biosolids are concluded to be the primary sources of total nitrogen loading to the City’s agricultural reuse system, followed by domestic effluent and PCP cannery flows.
• 6-8 (d): Municipal effluent is the dominant source of nitrate to the agricultural reuse system. Approximately half of this loading is estimated to be lost within the storage ponds via denitrification.
• 6-8 (e): Biosolids and biosolids lagoon supernatant are the primary source of ammonia loading to the irrigation areas. However, at least a portion of the applied ammonia will likely volatilize upon application to the City’s fields. As discussed in Section 2.4.3.1, EPA guidelines dictate that approximately 50 percent of the ammonia applied to the land application areas from the biosolids is lost to volatilization. Similar losses are expected from the applied irrigation flows.
• 6-8 (f): PCP flows and biosolids each contribute approximately one third of the organic nitrogen loading to the field areas. Municipal effluent contributes approximately one sixth of the total organic nitrogen loading.
6.5.4.3 Nitrogen Field Loadings
The City has been monitoring the ammonia, nitrate, and organic nitrogen loading of the combined recycled water flow and biosolids applied to the field areas since 2000 to avoid exceedances of the nitrogen agronomic uptake rates. A discussion of these field loadings presented below, and is based on the following information that is included in Appendix I:

WYA—September 2006 6-29 City Lodi of White Slough WPCF 711\04-05-02 Soil and Groundwater Investigation Existing Conditions Report Final Report
1. A graphical comparison of these total nitrogen and nitrate field loading between 2000 and 2005 in each of the major quadrants of the City’s land application area to the nitrate concentrations measured in the monitoring wells located in these quadrants.
2. A summary table showing the total nitrogen loadings to the individual field areas (Note that the total biosolids loadings included in this Appendix are assumed to be equivalent to the PAN discussed in Section 2.4.3.1, because these are the loads that were actually applied to the City’s properties.)
3. Figures depicting these total nitrogen field loadings by field area.
The following observations can be made from this information:
• Total nitrogen loadings met or exceeded the estimated crop demands for the majority of the field areas in 2000 and 2001.
• Since 2001, the total nitrogen loadings have exceeded the estimated crop demand for nitrogen less frequently. Note that starting in 2002; the PCP cannery reduced their flows and loads to the City’s industrial sewer by approximately on half.
• Although the total nitrogen and nitrate loadings have significantly decreased since 2001, the nitrate levels observed in the monitoring wells, generally, have not. Therefore, a direct correlation between the total nitrogen and nitrate loadings in a given quadrant and the nitrate levels measured in the groundwater wells is not apparent.
• Nevertheless, Fields 1A through 1D (in the northwest quadrant of the City’s property) and 4A through 4D (in the northeast quadrant) have received the highest total nitrogen loadings between 2001 and 2005 and the wells located in this region also exhibit some of the highest nitrate concentrations on the City’s property.
With respect to the potential correlations between the loadings on Fields 1A through 1D and the monitoring well nitrate concentrations in the northwestern quadrant of the City’s property, the nitrate concentrations in WSM-15 were higher in 2001 and 2004, which correspond to years when the field nitrogen loadings in this quadrant were also higher. The depth to groundwater in the northwestern quadrant of the City’s property where WSM-15 is located can be as low as 2 feet. Therefore, there would be less opportunity for the soil to attenuate and breakdown the applied nitrogen such that it would be available for plant uptake. Note that WSM-16, located north of the City’s property also exhibits elevated levels of nitrate.
With respect to the potential correlations between the loadings on Fields 4A and 4D and the monitoring well nitrate concentrations in the northeastern quadrant of the City’s property, the wells located in this quadrant are likely also be affected by nitrogen loading from the storage ponds as discussed in Section 6.3.3.2.
Also note that the elevated loadings in 2001 on Fields 4A and 4D are attributed to the percolation pilot testing. During this testing, these fields were continuously flooded with treated municipal effluent. The purpose of this project was to develop the appropriate loading rates for percolation basins that were being considered for the fields surrounding the plant. The pilot project was also used to evaluate the potential effects of percolation on groundwater quality and water table height.

WYA—September 2006 6-30 City Lodi of White Slough WPCF 711\04-05-02 Soil and Groundwater Investigation Existing Conditions Report Final Report
As part of this testing, eight monitoring wells, six temporary and two permanent, were installed to monitor the onsite groundwater quality. Based on the groundwater quality data collected during the testing, percolation of the treated municipal effluent resulted in a significant decrease in the groundwater nitrate levels beneath Field 4A in comparison to surrounding wells. Nitrate concentrations were slightly higher in the groundwater beneath Field 4D. Nevertheless, nitrate concentrations beneath this field were still less than in surrounding wells. It was determined that the abundance of organic carbon in the Field 4A from the residue of the previous season’s corn crop combined with anoxic conditions led to denitrification in the soil, whereas less carbon was available in 4D because it had previously been planted in alfalfa. The results from this testing demonstrates the potential for denitrification losses in the City’s soils.
During the period of pilot testing there did appear to be a spike in groundwater nitrate levels in WSM-7. However, this well is also located next to an unlined irrigation supply ditch, which was full of municipal effluent throughout the percolation testing. As discussed previously, the apparent seasonality of the nitrate levels observed in this well could be due leakage from this ditch. The nitrate concentrations in WSM-9, located on the eastern border of Field 4D, do not appear to have been impacted from the pilot testing.
Another factor that could be affecting the relationship between applied loads and observed concentrations groundwater is that organic nitrogen is the dominant form of nitrogen applied to the City’s field areas (which is primarily associated with biosolids and applied PCP cannery wastewater). The availability of the organic nitrogen to either be taken up by plants and/or converted to nitrate would be subject to the rate at which it mineralizes to an ammonia form. Therefore, there could be a lag between the time the nitrogen loadings were applied and when nitrate appears in the groundwater wells. Better understanding of the site-specific soil nitrogen transformation processes may be needed to correlate the loading data to the nitrate levels observed in the monitoring wells.
In conclusion, the field nitrogen loadings cannot be readily correlated with nitrate levels observed in the onsite monitoring wells. Nevertheless, the available data demonstrates that the City has, on occasion, historically overloaded the field areas with respect to nitrogen. However, revised allowable loadings rates based site-specific nitrogen uptake and losses due to transformations in the soil are needed to better evaluate impacts associated with historic loadings.
6.5.5 Summary of Soils Data
The City has collected soil samples at eight different locations between 2000 and 2006. Samples have been collected each January at one-foot intervals to a total depth of four feet for each location. In addition to this monitoring, the City completed a one-time soil monitoring event in June 2006 to assess the potential impacts that may have occurred to the soil with respect its suitability for agricultural production. Additional discussion of the soil data collected under these two monitoring programs is provided below.
6.5.5.1 2000 through 2006 Annual Monitoring
The data collected as part of the City’s annual soils monitoring program was used to develop total soluble salt, total Kjeldahl nitrogen (TKN), and nitrate nitrogen profiles with soil depth. These profiles, along with a map showing the soil sampling locations are included in Appendix J. Note that

WYA—September 2006 6-31 City Lodi of White Slough WPCF 711\04-05-02 Soil and Groundwater Investigation Existing Conditions Report Final Report
one of the soil sample locations (Monitoring Location 6E) is in a field area where the City has not historically applied recycled water or biosolids. Therefore a comparison of the soils at this site to the soils sampled from the land application sites could be used to identify potential impacts.
Total soluble salt concentrations in the upper four feet of the soil horizon ranged from roughly 100 mg/kg to almost 2,000 mg/kg, with average concentration slightly less than 500 mg/kg. Variability (both annually and with depth) in the soil total soluble salt levels is apparent both on the land application areas and on the portion of the City’s property where no land application has occurred. Some of the highest total soluble salt levels were measured in 2004, which would correlate to the loadings that occurred in 2003 since the soil samples were taken in January. However, some of the greatest TDS field loadings occurred in 2000 and 2001. Therefore, no clear trends in the total soluble salt concentrations are apparent. Location 6E represents a site where no land application occurred and total soluble salt values can represent indigenous background values. For the other locations the total soluble salt values, especially for the most recent years, are not dissimilar from the undisturbed site.
TKN is generally defined as the organic nitrogen plus the ammonium nitrogen. The soil profiles showed that the soil TKN concentrations and variability decreased with depth. This is expected in agricultural soils since organic matter decreases with depth. In the first foot of the soil horizon the soil TKN concentrations generally range from 250 mg/kg to 1,800 mg/kg. At a depth of four feet, the TKN concentrations generally range from 0 to 370 mg/kg. Annual variability also occurred with respect to the soil TKN levels for many of the sampling locations within the land application areas. However, in the soil samples taken from the portion of the City’s property where no land application has occurred, less variability was apparent. There was no clear correlation between the recorded field loadings and the elevated TKN levels measured in the soils. Overall, the TKN profiles are not supportive of the downward movement of nitrogen due to field loadings.
The depth profiles of nitrate-nitrogen showed that in the upper four feet of the soil horizon the nitrate-nitrogen concentrations generally ranged from less than 1 mg/kg to 36 mg/kg, with average concentration slightly less than 10 mg/kg. At some of the sampling locations there was a modest decrease in concentration with depth, as would be expected based on the limited soil adsorption that would occur for nitrate. Excluding the elevated level observed at monitoring location 6E in 2006, the nitrate-nitrogen levels exhibited very little variability in the soils within the area were irrigation reuse and biosolids applications do not occur in comparison to the other soil sampling locations. However, less variability in location 6E cannot be interpreted to mean that the greater variability for the other locations indicated nitrate-nitrogen was leaching out of the soil profile. Similar to the TKN data, there was no clear correlation between the recorded field loadings and the elevated soil nitrate-nitrogen levels measured in the soils.
6.5.5.2 June 2006 Monitoring Event
Relevant soil analysis results from the June 2006 sampling event are provided in Appendix J. Note that Fields 6F and 6G are sites where no land application of agricultural re-use water or biosolids has ever occurred. These fields can be used for comparison against the other fields listed in the appendix where agricultural re-use water and biosolids have been applied in the past. Based on such a comparison, the City’s land application practices have not resulted in degradation of the soils with respect to agricultural production and soil quality.

WYA—September 2006 6-32 City Lodi of White Slough WPCF 711\04-05-02 Soil and Groundwater Investigation Existing Conditions Report Final Report
The soil pHs of the field soils are alkaline except for several surface observations which were slightly acid. The soil pHs are being primarily control by calcium carbonate which is the result of the indigenous calcareous surface and subsurface horizons that are common in many of the WPCF fields. Several of the higher soil pHs (i.e., pH > 8.5) are likely the result of sodium hydrolysis even though the exchangeable sodium percentage (ESP) remains generally low (less than 10) in most of the fields and depths. A consequence of the alkaline pHs is the very little likelihood that metals are being solubilized and moving downward.
The organic matter levels found in the onsite soils are common for agricultural soils and no evidence is seen of a build-up of organic matter due to overloading by land application of re-use water and biosolids. Similarly, the electrical conductivity levels found are common for agricultural soils. There were some instances of relatively high soil NO3-N (e.g., Fields 1D and 4C) at the lower depths, but overall the fields the values seen are agronomically common where crop production and reuse water irrigation are occurring. Although there were these observations of higher nitrogen levels at deeper depths, there is no evidence of trends amongst the irrigated fields that nitrogen either as Kjeldahl N, NO3-N, or exchangeable NH4
+ is moving downward in concentrated strength. Soil surface phosphorus was high in many of the fields and this should be agronomically advantageous for crop production.
6.6 OTHER ONSITE SOURCES
In addition to the Cities facilities, there are two other potential sources of groundwater degradation located within the City’s property boundary:
• Northern California Power Authority (NCPA) Power Plant
• San Joaquin County Mosquito and Vector Control District (SJCM&VCD) Fish Rearing Ponds
As discussed in Section 2.5, both of these facilities are part of the City’s receive treated municipal effluent from the WPCF and are operated as part of the City’s reuse system.
6.6.1 NCPA Power Plant
As discussed in Section 2.5.1, the NCPA power plant receives treated municipal effluent from the WPCF to be used primarily for cooling water. Based on a review of facility data provided by NCPA, there are no apparent sources of groundwater degradation that could be associated with the NCPA power plant.
6.6.2 Mosquito Abatement District Fish Rearing Ponds
Similar to the City’s onsite storage ponds, the SJCM&VCD fish rearing ponds are likely to have some groundwater recharge associated with their use. The water in these ponds is made up entirely of effluent from the WPCF. As expected, the Stiff diagram for these fish rearing ponds is almost identical to the Stiff diagram for the treated municipal effluent (Appendix G). Therefore, with respect to salinity, the fish rearing ponds are expected to have a beneficial impact on underlying groundwater quality.

WYA—September 2006 6-33 City Lodi of White Slough WPCF 711\04-05-02 Soil and Groundwater Investigation Existing Conditions Report Final Report
Data collected by the City shows that the mosquito ponds have lower levels of nitrogen than the municipal effluent. Furthermore, the SJCM&VCD ponds are smaller and much shallower than the WPCF storage ponds. Therefore, the fish rearing ponds are not a significant source of groundwater impacts with respect to nitrogen.
6.7 OFFSITE SOURCES
As shown on Figure 4-2, there are several dairies located to the east and north of the WPCF property. Table 6-8 provides a summary of these dairies, with respect to their size and volume of wastewater generated. As shown, the Lima Ranch, located adjacent to the WPCF property, is one of the largest dairies in the area. Also note that the agricultural and stormwater drainage canal that is located just to the north of the WPCF properties conveys flows from the area where the Lima Ranch is located (Figure 2-5). Therefore, the water in this drainage could be a potential source of the sporadic elevated nitrate levels observed in Wells WSM-15 and WSM-16.
Table 6-8. Summary of Dairies Located Near the Lodi WPCF
Dairy Name Location
Total Number
of MatureCattle
Daily WastewaterProduction,gallons per
day
Total Land Application
Area, acres
Solid WasteTransferred
Offsite, cubic feet per year
Lima Ranch
Adjacent to Northeastern WPCF Property 1,600 64,000 500 800
Simoes Dairy North of WPCF Property, West of I-5 650 25,000 315 —
Everett Luiz & Sons Dairy
North of WPCF Property, West of I-5 1,165 47,000 800(a) —
Castelanelli Bros
East of WPCF Property, Eastern Side of Western Pacific Railroad 1,850 50,000 1,200 1,000
Martin Dairy Southeast of WPCF Property 720 20,000 288 Varies
Lodi Home Dairy
East of WPCF Property, Western Side of Western Pacific Railroad 100 4,000 0 100
Total 6,085 210,000 3,103 Varies (a) A portion of this land application area located on the eastern side of the Western Pacific Railroad

WYA—September 2006 6-34 City Lodi of White Slough WPCF 711\04-05-02 Soil and Groundwater Investigation Existing Conditions Report Final Report
In June 2005, a committee of experts on dairy manure management formed established by the University of California determined that the average excretion of nitrogen by lactating dairy cows in California is approximately 1 pound of nitrogen per head per day (University of California Division of Agriculture and Natural Resources, June 2005). Therefore, based on the data shown in Table 6-8, the total nitrogen produced and land applied by local dairies is approximately 6,000 pounds per day, or 2.2 million pounds per year (over eight times the amount of nitrogen land applied on the WPCF property). The Lima Ranch alone is estimated to produce and apply over twice the nitrogen that is applied on the WPCF property, yet only 500 acres are used for this land application.
Furthermore, in a recent study completed on behalf of the State Water Resources Control Board, it was found that the existing regulatory requirements are insufficient to prevent groundwater degradation from confined animal facilities, particularly in vulnerable geologic environments (Brown, Vance, and Associates, 2003). For purposes of this study “vulnerable” geologic environments were defined to typically include areas where subsurface materials underlying the facility are relatively coarse-grained, where groundwater occurs at shallow depth, where contaminants may impact groundwater over time, or where other geologically unsuitable conditions are present. As discussed in Section 3 of this report, these “vulnerable” conditions are indicative of the area to the east and north of the WPCF.
These conclusions presented in the 2003 State Board study were supported by the results of a multi-year study of dairies in the Central Valley that show shallow groundwater quality below the dairies is degraded by high levels of nitrate and salts and by a USGS study that show median nitrate concentrations in shallow groundwater wells in the San Joaquin Valley have increased significantly since the 1950s. Although there are limitations associated with the available data, taken as a whole, it indicates that groundwater in the Central Valley has been locally affected by releases from confined animal facilities (Brown, Vance, and Associates, 2003).
Based on this information, it can be concluded that the local dairies are likely source of groundwater degradation with respect to nitrate and salts. Due to the proximity of these dairies to the WPCF, it may be difficult to discern sources of degradation without additional analysis. As discussed in Section 5.5.3.1, cone penetrometer technology (CPT) in conjunction with Hydropunch is recommended to extract groundwater samples for analyses of nitrogen and oxygen isotopes to help differentiate sources and assess the extent of nitrate transport from the sources.
6.8 POTENTIAL BEST PRACTICABLE TREATMENT AND CONTROLS (BPTCs)
If the additional data collected from the three recommended background monitoring wells discussed in Section 5.0 demonstrates that the City’s practices have led to an increase in certain water quality parameters above background, the City may be required by the Regional Board to either cease land discharge, implement Best Practicable Treatment and Control (BPTCs), or take other action to prevent groundwater degradation. These BPTCs could include source control and/or improved treatment and disposal methods.

WYA—September 2006 6-35 City Lodi of White Slough WPCF 711\04-05-02 Soil and Groundwater Investigation Existing Conditions Report Final Report
Although the background conditions have not been determined to date, the following is an overview of the following treatment and land application facilities that may require additional BPTCs:
• WPCF Subsurface Conveyance and Treatment Facilities
• Storage Ponds
• Irrigation Reuse Areas
The information presented below with respect to these facilities will serve as the basis for a more detailed BPTC assessment, which will be completed by early 2007. This evaluation will account for all flows and loads anticipated at the WPCF build-out of 8.5 million gallons per day. Additional this analysis will asses the loading changes associated with the planned system modifications discussed in this report (as well as any other potential future modifications that are not identified in this report). This detailed study will include an evaluation of the ability to implement, effectiveness, and cost of each of the potential BPTCs presented below. Effectiveness will be measured by reduction of impacts to groundwater including estimated concentration or mass loading reductions for each BPTC measure. The detailed loading information presented in this Section will be used as the basis for such analyses. Each potential BPTC measures will be compared in a cost versus benefit analysis, such that appropriate recommendations can be made. Recommended BPTC’s and a BPTC implementation schedule will be proposed.
6.8.1 WPCF Subsurface Conveyance and Treatment Facilities
As discussed in Section 6.1.1, the City has observed deterioration in the WPCF influent municipal and industrial sewers. However, the City has already repaired the influent industrial sewer and is committed to repairing the sewer in the 2007 to 2008 timeframe. Therefore, once the City has completed these efforts, any impacts to groundwater quality as the result of leakage from this sewer will be eliminated. Therefore, additional BPTCs are not recommended for the WPCF subsurface conveyance facilities.
As discussed in Section 6.2, all of the WPCF treatment facilities are contained in structures that are either concrete or stainless steel, and no leaks, cracks, or other structural imperfections in the basins are suspected. Therefore, even though the untreated waste streams have significant nitrogen loads, the municipal facilities contain all of the control measures needed to ensure that these loads would not be transported to the groundwater beneath the WPCF site.
Furthermore, as discussed in Section 2.3.1, the City is currently working to complete the Improvements Project 2007. Under this project the City’s municipal wastewater treatment facilities will be upgraded to meet future NPDES permit limits, including nitrate limitations. Therefore, significant reductions in the total nitrogen discharged from the WPCF will be achieved. Following the completion of this project, the WPCF treatment facilities would satisfy all of the reasonable treatment measures applicable to such a municipal facility.
Therefore, no additional BPTCs are recommended for the WPCF treatment facilities.

WYA—September 2006 6-36 City Lodi of White Slough WPCF 711\04-05-02 Soil and Groundwater Investigation Existing Conditions Report Final Report
6.8.2 Storage Ponds
The City’s storage ponds are not lined. Therefore, one potential BPTC that could be implemented to help reduce the potential for groundwater degradation would be line the ponds with a geomembrane synthetic liner. This measure would eliminate the potential for flows stored in the ponds to migrate to underlying groundwater.
However, as discussed in section 6.3.1, the WPCF storage ponds have a beneficial impact on the underlying groundwater with respect to salinity. This is because the stored flows have better water quality than the regional groundwater. Therefore, another potential BPTC measure would be to ensure that the ponds are only used to hold flows where the concentrations of the constituents of concern (in this case nitrogen) are lower than what would be expected in the underlying groundwater.
As discussed in Section 6.3.3.3, the biosolids supernatant and agricultural return flows contribute, by far, the greatest loads of ammonia-nitrogen and organic-nitrogen to the storage ponds. The municipal effluent contributes the vast majority of nitrate loads.
As discussed in Section 2.3.2, the City is planning to construct the facilities needed to redirect the biosolids lagoon supernatant flows to a location upstream of the municipal treatment system aerations basins in conjunction with Improvements Project 2007. This modification would eliminate the discharge of supernatant flows and associated organic and ammonia nitrogen loads to the storage ponds (and the City’s land application facilities).
As discussed in Section 2.2.2, the City is planning to construct the facilities needed to provide improve denitrification of the WPCF municipal flows in conjunction with Improvements Project 2007. This treatment improvement would result in the average total nitrogen concentrations of less than 5 mg/L for the treated effluent discharged to the ponds, which are significantly lower than underlying groundwater.
Following the completion of these two measures the total nitrogen loading to the storage ponds will be significantly reduced. If necessary, the following two potential options could be implemented for further reducing the loadings to the storage ponds from the agricultural area return flows:
1. Redirect the return flows back to the irrigation reuse areas by blending with applied irrigation water.
2. Modify the system to provide spray irrigation, thereby eliminating significant volumes of return flow.
Both of these potential modifications would eliminate (or significantly reduce) the discharge of agricultural return flows and associated organic and ammonia nitrogen loads to the storage ponds. However, the first option would be considerably less expensive. Nevertheless, the second option could provide other benefits with respect to distribution of irrigation water within the City’s reuse system.

WYA—September 2006 6-37 City Lodi of White Slough WPCF 711\04-05-02 Soil and Groundwater Investigation Existing Conditions Report Final Report
Additional evaluation of the groundwater loading impacts associated with these potential BPTCs will be completed based on the information presented in this report to identify the recommended measures that will be implemented by the City.
6.8.3 Agricultural Reuse Facilities
This report presents a detailed evaluation of the City’s existing agricultural reuse facilities. Based on the information presented, several modifications could be implemented to reduce the potential for groundwater impacts associated with these facilities. Specifically, the following system modifications should be considered through a more detailed BPTC assessment:
• Field Loading Rates
• Irrigation Flow Metering
• Earthen Conveyance Ditches
• Irrigation Water Distribution
• Biosolids Distribution
6.8.3.1 Field Loading Rates
Based on the available data the City has, on occasion, historically overloaded the field areas with respect to nitrogen. However, this assessment is based on theoretical nitrogen loading rates. Therefore, the actual amount of potential overloading that has occurred cannot be clearly demonstrated.
As discussed in Section 2.6.3, monthly site-specific field loading rates are currently being developed for the WPCF site. The developed site-specific loading rates will account for soil permeability and other soil properties; depth to groundwater; site-specific crop evapotranspiration rates; historic planting and harvest dates; nitrogen uptake rates based on WPCF land area yield records and NRCS crop nutrient uptake information; and the fraction of applied nitrogen removed by denitrification and ammonia volatilization. This analysis will also include an assessment of potential loading rates applicable to other crops that could be grown on the WPCF property.
Once the values are available, the City may need to modify and/or expand the existing reuse system (i.e. acquire additional land for irrigation) to ensure these rates are not exceeded. Such modifications will need to account for all anticipated loads following the proposed WPCF modifications and at the 8.5 million gallons per day build-out flow rate. These modifications could result in increased summer season municipal discharges. Groundwater monitoring should continue such that the changes associated with these modifications to the underlying groundwater quality can be documented.
6.8.3.2 Irrigation Flow Metering
As discussed in Section 2.4.3.4, the City calculates the total irrigation volume as the sum of the flows recorded from the industrial line meter, which is upstream of the biosolids lagoon supernatant and the DAF subnatant inputs, and the irrigation pump meter. Therefore, this flow calculation does not account for biosolids lagoon supernatant and the DAF subnatant inputs or the flow returned to the ponds from the irrigation area. Therefore, a BPTC measure that is

WYA—September 2006 6-38 City Lodi of White Slough WPCF 711\04-05-02 Soil and Groundwater Investigation Existing Conditions Report Final Report
appropriate, regardless of the identified groundwater impacts, will be for the City staff to provide the facilities to allow better calculations of the irrigation flows.
Regarding the biosolids lagoon supernatant, the City is planning to redirect these flows to a location upstream of the municipal treatment system aerations basins in conjunction with Improvements Project 2007. This modification would eliminate the discharge of supernatant flows directly to the irrigation area. Furthermore, these flows only comprise approximately 0.3% of the applied irrigation water. Therefore, flow metering of this component is not likely necessary in the interim period before the Improvements Project 2007 is completed.
The City currently can determine the DAF subnatant flows by subtracting the thickened waste activated sludge volume from the waste activated sludge volume, both of which are metered and recorded on a daily basis. Note that the DAF subnatant flows are only 3 percent of the total annual irrigation volume; however, on a daily basis, they may comprise a significant portion of the applied irrigation water. Such measurements could potentially be completed using the WPCF SCADA system.
Finally, as discussed in Section 2.4.3.4, the City has recently modified the existing WPCF control system to record the irrigation return flow pump run time and to calculate a daily return flow volume. This flow volume should be subtracted from the total daily irrigation flow, to provide a better estimate of applied irrigation water. The City’s existing land management spreadsheet tool could be modified to allow for such calculations to be readily made. In addition, the City should begin monitoring the water quality of this return flow to determine the loads returned from the irrigation area. Using this data the City can provide better estimates of the actual total applied field loadings.
6.8.3.3 Earthen Conveyance Ditches
As discussed in Section 6.4.1, some of the ditches used to convey irrigation flows to the City’s field areas are not lined and some of the data suggests that the water conveyed in these ditches may be impacting groundwater. This issue would be of particular concern when the City is applying biosolids to the land application areas via these conveyances.
However, distinguishing between potential impacts associated with the irrigation water distribution and tailwater collection facilities from the potential impacts associated with land application is difficult. Therefore, the City should first evaluate the whether historic loadings have been excessive based on the site-specific rates that are being developed. If necessary, the future loadings should be adjusted appropriately before to investing in modifications to the existing distribution system. Such modifications should also be justified through an analysis of the anticipated reduction in loadings to groundwater that would occur.
6.8.3.4 Irrigation Water Distribution
As discussed in Section 6.4.2, the existing furrow and border check irrigation system is not capable of evenly distributing the applied irrigation water, and the amount of water that infiltrates below the root zone (and therefore not taken up by the crop) at the head end of the field could be significant, which could lead to overloading of the underlying groundwater.

WYA—September 2006 6-39 City Lodi of White Slough WPCF 711\04-05-02 Soil and Groundwater Investigation Existing Conditions Report Final Report
One potential BPTC practice for reducing excessive deep percolation at the head end of the field would be to reduce the check length and/or decrease the irrigation water cutoff time (Hanson and Putnum, 2004). Note that reducing check lengths could result in an increase in the total amount of tailwater. However, the City currently maintains a tailwater collection and re-distribution system. Therefore, such measures would result in an overall increase to the irrigation efficiency (and therefore less potential for groundwater impacts associated with over-irrigation).
A second potential BPTC for reducing excessive deep percolation would be for the City to construct a sprinkler irrigation system that would allow for even distribution of the irrigation water over the field areas. This modification would also eliminate the potential for leaking from the existing earthen conveyance ditches. However, such a modification would result in the requirement that the City provide year-round filtration and UV disinfection in order to meet the State mandated reuse requirements. Additionally, these modifications would result in the need for the City to develop an alternative means of biosolids distribution. Additional discussion of the potential alternative biosolids distribution options is presented in Section 6.6.2.5.
Both of the potential BPTCs discussed above would require significant capital costs (and in the case of the second option would result in a significant increase in operations costs). Therefore, field loadings should first be evaluated before to investing in modifications to the existing distribution system. Furthermore, additional analysis is needed to determine whether the cost of modifying the existing irrigation system would result in significant benefit to underlying groundwater quality.
6.8.3.5 Biosolids Distribution
Also discussed in Section 6.4.2 is the fact that applied solids tend to settle out near the head end of the field area, which could lead to excessive nitrogen loadings in these areas. Furthermore, as discussed in Section 2.4.3.2, the application of biosolids is limited to areas where a corn crop is grown. Consequently, the City requires that the farmers that lease the WPCF properties maintain a corn crop on at least 200 acres of the irrigation area. However, alfalfa, the other crop primarily grown on the City’s property, has a three to four year cycle. Therefore, the same land area is likely to be planted in a corn crop for several years in a row, limiting the City’s ability to distribute the biosolids over different areas of the WPCF property from year to year. Figures depicting the historic annual field biosolids loadings (in dry tons per acre) are provided in Appendix K. As shown, the City’s biosolids applications are typically limited to just a few fields each year.
One potential BPTC that would address the biosolids distribution issues would be to store the biosolids onsite until they could be distributed evenly over a large area at the beginning of the irrigation season. If liquid biosolids were stored, the City would need to purchase several tanker injection trucks that would allow for even distribution over a short period of time. Note, however, that the application of liquid biosolids with a tanker injection truck would result in significant crop damage. Therefore, it may not be feasible to use a tanker injection truck for field areas that are planted in an alfalfa crop. If the stored biosolids were dewatered, land application would likely require less equipment for distribution due to the lesser volume of product. The dewatered biosolids would need to be incorporated into the fields in the early spring prior to the onset of the irrigation season. Therefore, as with the tanker injection truck option, it may not be feasible to apply dewatered biosolids in field areas that are planted in an alfalfa crop.

WYA—September 2006 6-40 City Lodi of White Slough WPCF 711\04-05-02 Soil and Groundwater Investigation Existing Conditions Report Final Report
If either of the two potential biosolids modifications discussed above were developed by the City, the farming practices employed by the farmers that lease the WPCF property may need to be modified to accommodate such applications. These modifications may require that alfalfa crop not be grown on the City’s property. In addition to these two potential measures, the City could dewater the biosolids and dispose of them an approved landfill or some other approved offsite location; or the City could compost biosolids to provide a Class A material that could be sold as a nutrient supplement. Additional analysis is needed to determine whether the cost of modifying the biosolids treatment and land application practices would result in significant benefit to underlying groundwater quality.
6.9 SUMMARY AND RECOMMENDATIONS
A detailed assessment of the potential sources groundwater degradation associated with the WPCF facilities and the irrigation reuse area that receive treated effluent from these facilities demonstrates that additional controls may be needed to reduce the potential for nitrate impacts associated with the City’s facilities and land application practices. However, the City’s WPCF facilities and land application practices are not likely to be causing groundwater degradation with respect to EC, sodium, chloride. In fact, these facilities and practices may actually be improving underlying groundwater quality for these constituents.
There is also a significant potential for groundwater nitrate degradation to occur from the dairies located adjacent to and in the region of the WPCF. Furthermore, as discussed in Section 5.0, the groundwater in the area of the WPCF is strongly impacted by regional conditions. Additional evaluation is needed to discern the impacts associated with these sources from the potential impact associated with the City’s facilities and land application practices. Nevertheless, additional controls have been proposed for the following:
• Influent Municipal Sewer
• Storage Facilities
• Land Application Practices
• Irrigation Facilities
Additional discussion of these controls is presented below. The information presented in this report will serve as the basis for a more detailed assessment of these controls. However, additional assessment of the background conditions is also warranted before definite conclusions can be made regarding impacts associated with the WPCF and its associated land application areas. Recommended BPTC’s will be developed based on the BPTC evaluation and the additional groundwater investigation efforts discussed in Section 5.0 of this report.
6.9.1 Influent Municipal Sewer
Exfiltration associated with the deterioration of the influent municipal sewer is expected to have led to the groundwater nitrate impacts observed in the area immediately south of the WPCF treatment facilities that were discussed in Section 5.0. The City is committed to repairing and/or replacing this sewer in the 2007 to 2008 timeframe. Following the complete of these repairs, additional impacts are not expected.

WYA—September 2006 6-41 City Lodi of White Slough WPCF 711\04-05-02 Soil and Groundwater Investigation Existing Conditions Report Final Report
Additionally, deterioration identified in a portion of influent industrial sewer (repaired in 2003) is expected to have resulted in some exfiltration of the PCP cannery wastewater flows to groundwater. Although the extent of the exfiltration is not apparent from the available data, there is the potential for some groundwater impacts to have historically occurred, particularly with respect to EC. The City has since examined the remainder of this sewer and has not identified any other indications of deterioration. Therefore, future impacts associated with this facility are not expected.
6.9.2 Storage Facilities
Based on available data, the storage ponds may have an impact on the water quality observed in wells located in the northeastern corner of the City’s property, and the total nitrogen concentrations in the storage ponds are somewhat elevated, particularly during the winter months. However, the nitrate concentrations are much lower in the storage ponds than they are in the underlying groundwater. Therefore, nitrate in the storage ponds is not contributing to underlying elevated nitrate levels. Nevertheless, there could be the potential for ammonia nitrogen and to some extent organic nitrogen (which are not typically mobile in soil-water systems) to be converted to nitrate nitrogen in aerobic environments. However, the appropriate conditions for the ammonia and organic nitrogen to convert to nitrate in the groundwater beneath the ponds do not clearly exist.
The City currently is planning to reduce the nitrate loads to the storage ponds by upgrading the treatment facilities to provide improved denitrification. Additionally, the City is planning to redirect the biosolids lagoon supernatant to a point upstream of the aeration basins. This will result in a significant reduction in the ammonia and organic nitrogen loadings to the ponds during the winter months. Additional assessment is needed to determine whether these changes will be adequate to address potential groundwater impact issues associated with the storage ponds. If necessary, the following additional BPTC measures to reduce the potential for groundwater impacts could be developed:
• Lining the ponds with a synthetic geomembrane liner to ensure that the nitrogen in the storage ponds is not leading to elevated groundwater nitrate levels.
• Modify the agricultural reuse system to further reduce the nitrogen loadings to the ponds.
6.9.3 Land Application Areas
Effective land application of recycled water and biosolids is dependent on the ability of soil and crop to filter, remediate, and absorb nitrogen without degradation of groundwater quality. To ensure adequate time is available for such activities, the irrigation application rate and field loadings must not be excessive to a point where untreated constituents can move beyond the root zone or immediate surface soil layers.
The City monitors the irrigation application rates and total nitrogen loadings to the field areas to verify that they do not exceed the estimated annual crop uptake rates. Since this practice has improved, the total nitrogen and nitrate loadings to the field areas have decreased. Nevertheless, the nitrate levels observed in the monitoring wells, generally, have not. Furthermore, no discernable patterns have been observed in the available soils data, and this data does not demonstrate that the soil nitrogen within the land application areas is unusually elevated.

WYA—September 2006 6-42 City Lodi of White Slough WPCF 711\04-05-02 Soil and Groundwater Investigation Existing Conditions Report Final Report
Therefore, a direct correlation between the total nitrogen and nitrate field loadings and the potential for groundwater nitrate impacts is not apparent.
Nevertheless, a site-specific evaluation of the appropriate monthly loading rates is currently being developed. Once this evaluation is completed, the City can provide a better determination as to whether the current land application practices have the potential to lead to elevated levels of nitrogen in the underlying groundwater.
If necessary, the City will modify and/or expand the existing reuse system to ensure these rates are not exceeded. However, the nitrogen concentrations in the recycled water applied to the City’s property vary seasonally depending on the source of irrigation flow. Therefore, the detailed loading information developed for this report can be used to make assessments regarding the affects of potential system modifications on the overall loadings to the land application area. Groundwater monitoring should continue such that the changes associated with these modifications to the underlying groundwater quality can be documented.
Finally, the City should begin calculating the daily DAF subnatant flows that are applied to the irrigation area. Additionally, the City should begin subtracting the measured return flow volume and loads from the total daily irrigation flow and loads to provide a better estimate of loadings in the applied irrigation water.
6.9.4 Irrigation Facilities
Several potential concerns regarding the City’s current facilities were identified. Specifically, there is a concern that the City’s existing facilities may not allow for even distribution of the applied irrigation water and biosolids. Additionally, there is a concern that the earthen conveyance ditches could be allowing for excessive infiltration. Several potential BPTCs that would address these issues have been identified. However, the costs to implement the BPTCs would be significant.
Distinguishing between potential impacts associated with the irrigation water distribution and tailwater collection facilities from the potential impacts associated with land application practices is difficult. Historic field loadings, on occasion, have exceeded the theoretical uptake rates of the crops. Therefore, the City is currently developing site-specific field loading rates for the land application area and plans to develop the modifications needed to ensure that these loading rates are not exceeded. If these efforts do not demonstrate that historic loadings have been excessive, additional irrigation system modifications may be necessary.
With respect to irrigation water distribution, one potential BPTC practice would be to reduce the check length and/or decrease the irrigation water cutoff time (Hanson and Putnum, 2004). A second potential BPTC would be for the City to construct a sprinkler irrigation system that would allow for even distribution of the irrigation water over the field areas. This modification would also eliminate the potential for leakage from the existing earthen conveyance ditches. However, such a modification would also result in the requirement that the City provide year-round filtration and UV disinfection in order to meet the State mandated reuse requirements. Additionally, these modifications would result in the need for the City to develop an alternative means of biosolids distribution.

WYA—September 2006 6-43 City Lodi of White Slough WPCF 711\04-05-02 Soil and Groundwater Investigation Existing Conditions Report Final Report
With respect to biosolids distribution, one potential BPTC would be to store either liquid or dewatered biosolids onsite until they could be distributed evenly over a large area at the beginning of the irrigation season using trucks. An alternative BPTC would be for the City to treat the biosolids so they could be disposed of offsite.