6 Evaluating Transit-Oriented Development Using a ... · Sustainable development seeks to create an...
34
6 Evaluating Transit-Oriented Development Using a Sustainability Framework: Lessons from Perth’s Network City John L. Renne Planners and urban designers across the globe are promoting transit- oriented development (TOD) to encourage sustainable precincts around public transport stations. TODs are compact, mixed-use developments that facilitate walking, bicycling, and use of public transport through its urban design. This chapter presents a method to evaluate the sustainability of TODs based on six aspects of outcomes, including 1. Travel Behaviour, 2. The Local Economy, 3. The Natural Environment, 4. The Built Environ- ment, 5. The Social Environment, and 6. The Policy Context. Data were collected in five rail precincts across Perth, Western Australia. The major goal of the study was to determine which indicators were possible to col- lect and establish baseline data. Introduction Transit-oriented development is gaining popularity as a tool to achieve sustainable development, particularly in Western Australia. Hope for the Future: The Western Australian State Sustainability Strategy (2003) dis- cusses the need to manage urban and regional growth, revitalise declining centres and suburbs, and integrate land use with balanced transport to re- duce automobile dependence. TOD seeks to accomplish these goals, creat- ing compact, mixed-use, pedestrian-friendly precincts around major public transport stations. This chapter presents a tool to measure the outcomes of TOD using a sustainability framework. Sustainable development seeks to create an urban environment which maximises economic development and social equity, whilst minimising negative externalities upon the natural environment (see Figure 6.1). From a land use and transport perspective, this means reducing automobile de-
Transcript of 6 Evaluating Transit-Oriented Development Using a ... · Sustainable development seeks to create an...
6 Evaluating Transit-Oriented Development Using a Sustainability Framework: Lessons from Perth’s Network City
John L. Renne Planners and urban designers across the globe are promoting transit-oriented development (TOD) to encourage sustainable precincts around public transport stations. TODs are compact, mixed-use developments that facilitate walking, bicycling, and use of public transport through its urban design. This chapter presents a method to evaluate the sustainability of TODs based on six aspects of outcomes, including 1. Travel Behaviour, 2. The Local Economy, 3. The Natural Environment, 4. The Built Environ-ment, 5. The Social Environment, and 6. The Policy Context. Data were collected in five rail precincts across Perth, Western Australia. The major goal of the study was to determine which indicators were possible to col-lect and establish baseline data.
Introduction
Transit-oriented development is gaining popularity as a tool to achieve sustainable development, particularly in Western Australia. Hope for the Future: The Western Australian State Sustainability Strategy (2003) dis-cusses the need to manage urban and regional growth, revitalise declining centres and suburbs, and integrate land use with balanced transport to re-duce automobile dependence. TOD seeks to accomplish these goals, creat-ing compact, mixed-use, pedestrian-friendly precincts around major public transport stations. This chapter presents a tool to measure the outcomes of TOD using a sustainability framework.
Sustainable development seeks to create an urban environment which
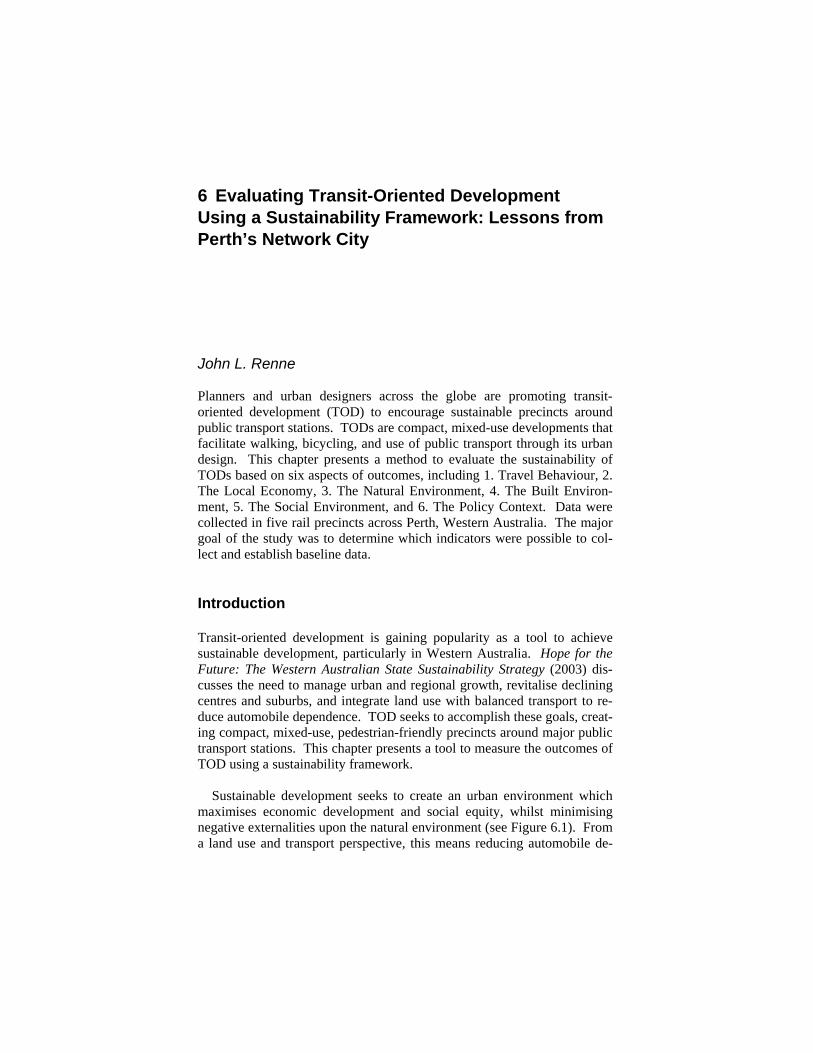
maximises economic development and social equity, whilst minimising negative externalities upon the natural environment (see Figure 6.1). From a land use and transport perspective, this means reducing automobile de-
116 Transit-Oriented Development and Sustainability
pendence through mixed use and compact cities with an array of travel al-ternatives focused on walking, bicycling, and public transport (Newman and Kenworthy, 1999, Banister et al., 2006). Figure 6.1. Theoretical Model of Sustainable Development
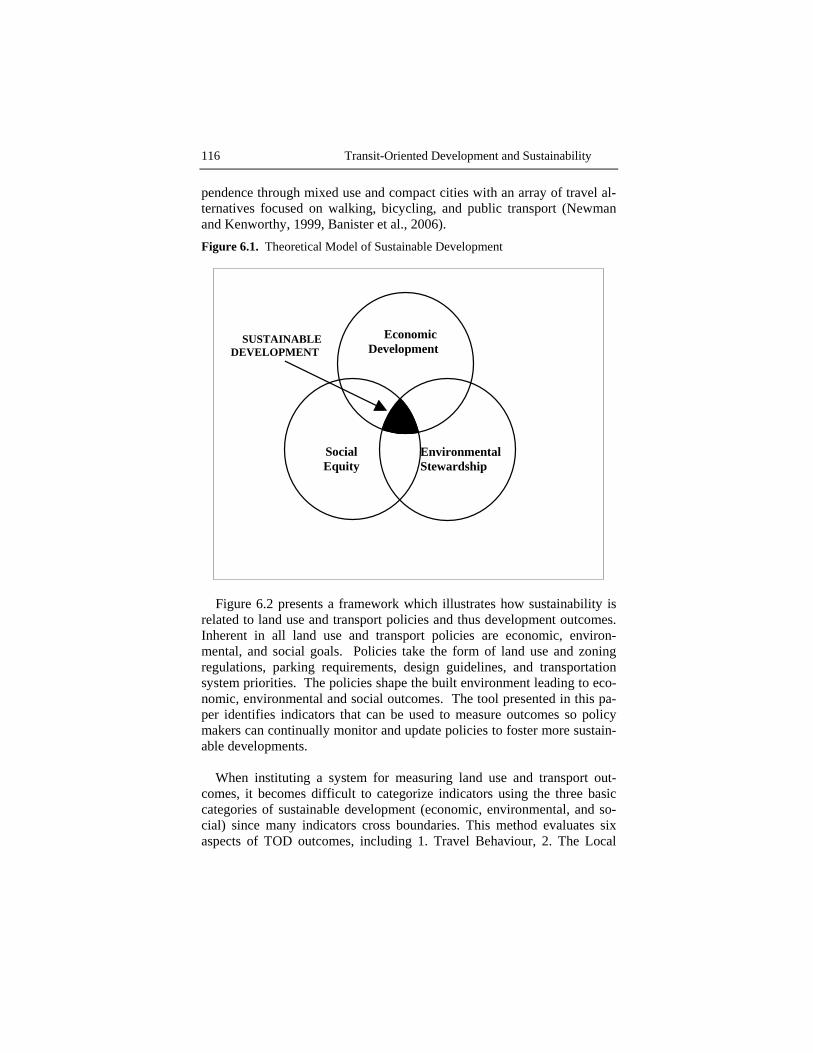
Figure 6.2 presents a framework which illustrates how sustainability is
related to land use and transport policies and thus development outcomes. Inherent in all land use and transport policies are economic, environ-mental, and social goals. Policies take the form of land use and zoning regulations, parking requirements, design guidelines, and transportation system priorities. The policies shape the built environment leading to eco-nomic, environmental and social outcomes. The tool presented in this pa-per identifies indicators that can be used to measure outcomes so policy makers can continually monitor and update policies to foster more sustain-able developments.
When instituting a system for measuring land use and transport out-
comes, it becomes difficult to categorize indicators using the three basic categories of sustainable development (economic, environmental, and so-cial) since many indicators cross boundaries. This method evaluates six aspects of TOD outcomes, including 1. Travel Behaviour, 2. The Local
Economic Development
Social Equity
Environmental Stewardship
SUSTAINABLE DEVELOPMENT
Transit-Oriented Development and Sustainability 117
Economy, 3. The Natural Environment, 4. The Built Environment, 5. The Social Environment, and 6. The Policy Context. Figure 6.2. Framework for Evaluating Sustainable Development Policies
Background
Measuring Success and TOD Outcomes
Success is subjective. One TOD may yield a high transit mode share but lacks social diversity. Another might be deficient in shopping and enter-tainment choices but provides affordable housing on reclaimed brown-fields. Moreover, a myriad of goals for TOD obfuscates success. A recent study found that planners in Perth felt TOD was important towards in-creasing transit ridership, spurring economic development, increasing housing choice, relieving traffic congestion, reducing sprawl, creating a diverse community, improving neighbourhood quality, and increasing po-litical support for transit (Renne, 2005a). With so many goals for TOD, measuring success becomes a matter of perspective.
The evaluation of TOD should be both cross-sectional and longitudinal.
Indicators of performance can compare the TOD with regional and sub-regional averages, since TODs function as part of a larger whole. This ap-proach is better than a matched-pair analysis, which is sometimes sug-
118 Transit-Oriented Development and Sustainability
gested for comparing TODs to similar developments not built near a transit node. The problem with matched-pair analysis is that it is often impossible to find two developments that exhibit similar characteristics for compari-son purposes and when a comparison is made it is usually only one or two-dimensional. After creating baseline data, future TOD outcome analyses should compare longitudinally to determine if a TOD is becoming more sustainable over time.
A Focus on Travel Behaviour, Vehicle Ownership, Property Values, and Markets
Past studies have focused mainly on just a few aspects of success – travel behaviour, vehicle ownership, property values and understanding markets. Several studies have looked at commuting in TODs. A 2003 study of TODs across California found that residents were up to five times more likely to commute via transit compared to non-TOD areas (Lund et al., 2004). In the San Francisco Bay Area, Cervero (1994) found that, “[o]n average, residents living near stations were five times as likely to commute by rail transit as the average worker living in the same city, and in some cases as much as seven times as likely” (Cervero, 1994, p. 177). Another study of 103 TODs across twelve regions in America found that, on aver-age, residents were 2 – 2.5 times more likely to commute on transit com-pared to the average resident of the region (Renne, 2005b).
Studies which investigate non-commute trips in TODs have been less
conclusive on travel behaviour impacts (Boarnet and Crane, 2001), al-though Chatman (2006) found that residents and employees near rail sta-tions have a higher non-auto share of commuting and non-work travel. He attributed the effects based mainly upon the level of convenience (or in-convenience) in using an automobile. His study also found higher shares of non-auto use closer to job centres.
TOD households exhibit lower automobile ownership in comparison to
regional averages. One study found that American households near train stations owned 0.9 cars per household compared to 1.6 cars per household across regions (Center for Transit-Oriented Development, 2004). My study of 103 TODs found that 37 percent of TOD households owned two or more cars compared to 55 percent of regional households (Renne, 2005b).
In looking at property value, a number of hedonic price studies found a
premium on land value closer to rail stations (Cervero et al., 2004, Califor-
Transit-Oriented Development and Sustainability 119
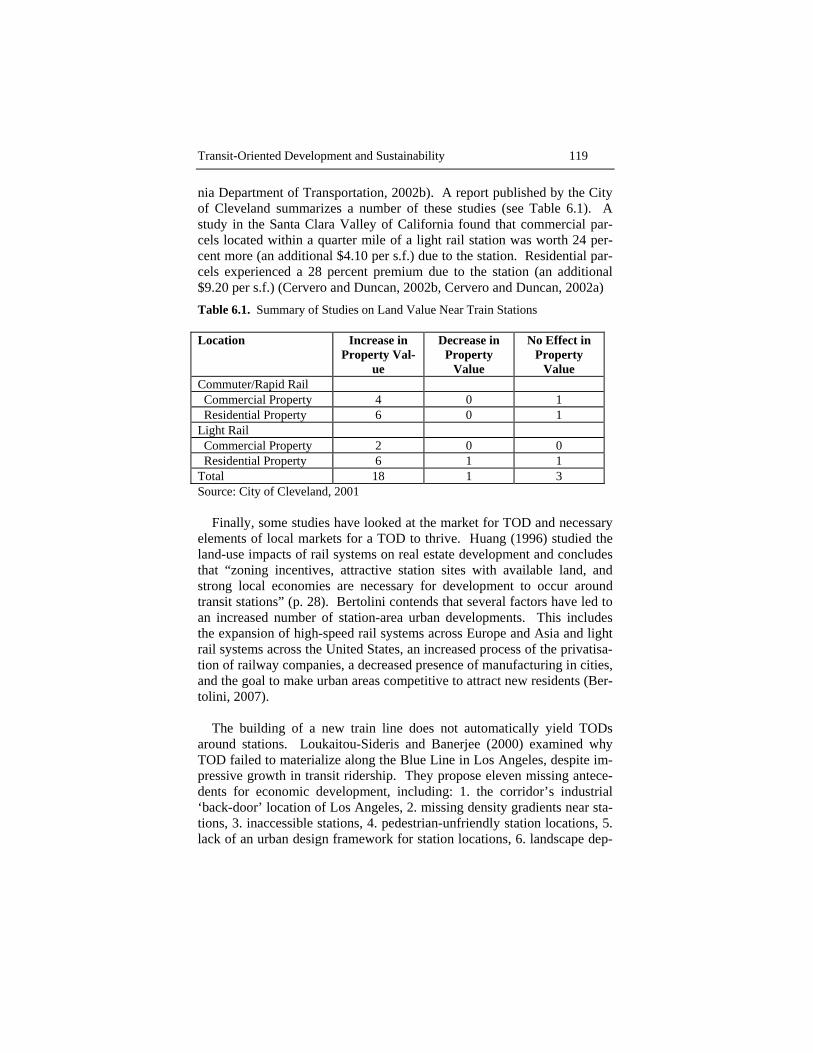
nia Department of Transportation, 2002b). A report published by the City of Cleveland summarizes a number of these studies (see Table 6.1). A study in the Santa Clara Valley of California found that commercial par-cels located within a quarter mile of a light rail station was worth 24 per-cent more (an additional $4.10 per s.f.) due to the station. Residential par-cels experienced a 28 percent premium due to the station (an additional $9.20 per s.f.) (Cervero and Duncan, 2002b, Cervero and Duncan, 2002a) Table 6.1. Summary of Studies on Land Value Near Train Stations
Location Increase in Property Val-
ue
Decrease in Property
Value
No Effect in Property
Value Commuter/Rapid Rail Commercial Property 4 0 1 Residential Property 6 0 1 Light Rail Commercial Property 2 0 0 Residential Property 6 1 1 Total 18 1 3 Source: City of Cleveland, 2001
Finally, some studies have looked at the market for TOD and necessary elements of local markets for a TOD to thrive. Huang (1996) studied the land-use impacts of rail systems on real estate development and concludes that “zoning incentives, attractive station sites with available land, and strong local economies are necessary for development to occur around transit stations” (p. 28). Bertolini contends that several factors have led to an increased number of station-area urban developments. This includes the expansion of high-speed rail systems across Europe and Asia and light rail systems across the United States, an increased process of the privatisa-tion of railway companies, a decreased presence of manufacturing in cities, and the goal to make urban areas competitive to attract new residents (Ber-tolini, 2007).
The building of a new train line does not automatically yield TODs
around stations. Loukaitou-Sideris and Banerjee (2000) examined why TOD failed to materialize along the Blue Line in Los Angeles, despite im-pressive growth in transit ridership. They propose eleven missing antece-dents for economic development, including: 1. the corridor’s industrial ‘back-door’ location of Los Angeles, 2. missing density gradients near sta-tions, 3. inaccessible stations, 4. pedestrian-unfriendly station locations, 5. lack of an urban design framework for station locations, 6. landscape dep-
120 Transit-Oriented Development and Sustainability
ravation and the ‘broken window syndrome,’ 7. relatively high land costs, 8. antiquated zoning and regulatory barriers, 9. lack of institutional com-mitment, 10. absence of critical mass, and 11. lack of community involve-ment and participation (p. 119 – 122).
When a number of factors coexist, including a healthy local real estate
market, community and institutional support, and transit and road network accessibility, changing demographics are supporting TODs. A number of studies indicate that the supply of transit accessible, mixed-use neighbour-hoods is much lower than the demand to live in such locations (Levine and Inam, 2004, Center for Transit-Oriented Development, 2004, Urban Land Institute and PriceWaterhouseCoopers, 2005). Levine (2006) argues that zoning policies are artificially restricting smart growth developments, such as TODs.
Transit Oriented Development in America: Experiences, Challenges,
and Prospects (Cervero et al., 2004) was the seminal report on TOD in the United States, sponsored by the Federal Transit Administration. This study, which reviewed the literature, surveyed and interviewed a number of stakeholder groups, and conducted case studies across ten regions con-cluded that “[t]he literature is replete with platitudes that have been heaped on the TOD concept; however, relatively few serious studies have been carried out that assign benefits to TOD in any quantitative or monetary sense. For the most part, anecdotes and story lines are relied on instead” (p. 119). The study went on to note that transit ridership impacts and land value gains were the areas with the most amount of quantitative research.
Studies in Measuring TOD Success Holistically
Some studies have attempted to study TOD success from a holistic van-tage. The Statewide Transit-Oriented Development Study: Factors for Success in California (California Department of Transportation, 2002a, 2002b) reported on ten areas of major benefits, including: 1. TOD can provide mobility choices, 2. TOD can increase public safety, 3. TOD can increase transit ridership, 4. TOD can reduce rates of vehicle miles trav-elled (VMT), 5. TOD can increase households’ disposable income, 6. TOD reduces air pollution and energy comsumption rates, 7. TOD can preserve resource lands and open space, 8. TOD can play a role in economic devel-opment, 9. TOD can decrease infrastructure costs, and 10. TOD can con-tribute to more affordable housing (pp. executive summary 4 – 6). In addi-tion to providing data within the final reports which addresses each of these areas, the State of California also launched an online TOD Search-
Transit-Oriented Development and Sustainability 121
able Database (http://transitorienteddevelopment.dot.ca.gov/). This data-base provides data about: land uses, mapping, implementation processes, financing, facilities, zoning, design features, pedestrian access, transit ser-vices, photos, travel benefits, local contacts, and other variables for 21 TODs across California. While the database is valuable, most of the data appear to date back to the early 2000s, thus the database is in need of an update.
Wells and Renne (2003) proposed a set of indicators to evaluate the suc-
cess of the New Jersey Transit Village Initiative, a state program that fa-cilitates TODs, otherwise known as Transit Villages. We recommended an evaluation framework based upon economic activity, environmental and transportation activity, institutional changes, and community perceptions using data most readably available for economic activity, travel behaviour, and public perception. Table 6.2 illustrates the indicators suggested for each of the categories. In attempt to collect the data, it was found that much of the data were missing and difficult to obtain. Subsequent efforts in working with local and state government in New Jersey met with some difficulty in collecting data as many of the variables were unavailable or only available in paper format located within municipal libraries. It be-came a time consuming effort to collect the data so designated Transit Vil-lages were encouraged to collect and report data to the State for analysis by researchers at Rutgers University. This led to a series of reports as part of the Transit Village Monitoring Research program (available at: http://www.policy.rutgers.edu/vtc/tod/tod_ projects.html).
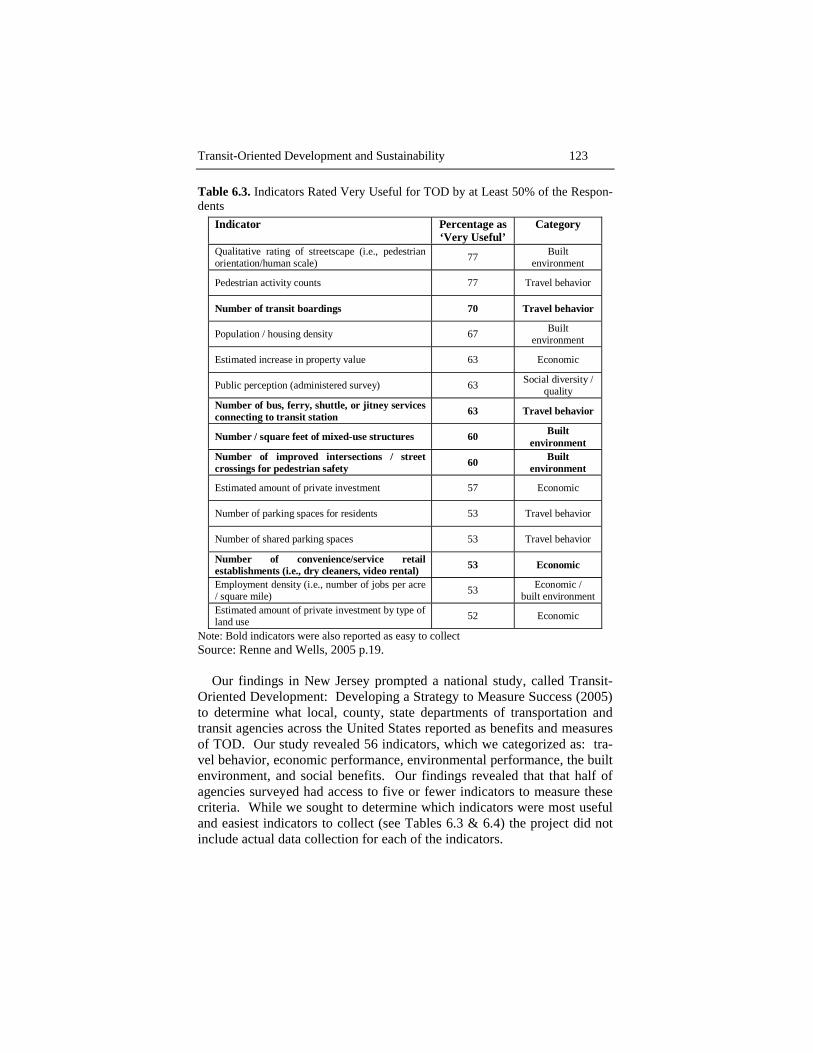
Our findings in New Jersey prompted a national study, called Transit-
Oriented Development: Developing a Strategy to Measure Success (2005) to determine what local, county, state departments of transportation and transit agencies across the United States reported as benefits and measures of TOD. Our study revealed 56 indicators, which we categorized as: tra-vel behavior, economic performance, environmental performance, the built environment, and social benefits. Our findings revealed that that half of agencies surveyed had access to five or fewer indicators to measure these criteria. While we sought to determine which indicators were most useful and easiest indicators to collect (see Tables 6.3 & 6.4), the project did not include actual data collection for each of the indicators.

122 Transit-Oriented Development and Sustainability
Table 6.2. Recommended Indicators to Evaluate TOD as Part of the Evaluation of the New Jersey Transit Village Initiative
Economic Activity Environmental and
Transportation Activity
Institutional Changes
Community Perception
Public Investment Pedestrian Residential Survey
• Municipal funds • State funds
o Grants o Loans
• Federal funds o Grants o Loans
• Tax abatements • Total public
investment (calculated from indicators above)
Private Investment, Commercial • New or substantially
rehabilitated retail/office space1
• Estimated private investment2
• Estimated new property taxes generated3
Private Investment, Residential • New or substantially
rehabilitated housing units1
• Estimated private investment2
• Estimated new property taxes generated3
• Number of new studios / one bedroom
• Number of new two bedrooms
• Number of new three or more bedrooms
• Number of new units for sale
• Number of new units for rent
• Length of improved streetscape
• Number of improved intersections/street crossings for pedestrian safety
• Length of façade improvement
• Pedestrian activity counts
Parking • Number of new spaces
for shoppers only • Number of new spaces
for commuters only • Number of spaces that
are shared • Number of new bicycle
racks or lockers provided
Traffic Flow • Number of new shuttle
or jitney services provided to and from the transit station
• Number of traffic control or flow improvements
Land Use • Amount of brownfield
properties remediated under a [Department of Environmental Protection] approved plan
• Number/size of vacant buildings rehabilitated or replaced
• Number/amount of underutilized/vacant lots reclaimed for
• New TOD ordinances
• New TOD or smart growth designations
• How would you rate your town/neighborhood as a place to live?
• Do you feel the downtown (or transit station area) is more or less attractive now compared to (number) years ago?
• Is it more or less pleasant to walk around the downtown (or transit station area) now compared to (number) years ago?
• Does the downtown (or transit station area) seem more or less safe now compared to (number) years ago?
• Does the downtown (or transit station area) offer better or worse shopping now compared to (number) years ago?
• Does the downtown (or transit station area) offer more or less restaurant options now compared to (number) years ago?
• Does the downtown (or
Source: Wells and Renne, 2003
Transit-Oriented Development and Sustainability 123
Table 6.3. Indicators Rated Very Useful for TOD by at Least 50% of the Respon-dents
Indicator Percentage as ‘Very Useful’
Category
Qualitative rating of streetscape (i.e., pedestrian orientation/human scale) 77 Built
environment
Pedestrian activity counts 77 Travel behavior
Number of transit boardings 70 Travel behavior
Population / housing density 67 Built environment
Estimated increase in property value 63 Economic
Public perception (administered survey) 63 Social diversity / quality
Number of bus, ferry, shuttle, or jitney services connecting to transit station 63 Travel behavior
Number / square feet of mixed-use structures 60 Built environment
Number of improved intersections / street crossings for pedestrian safety 60 Built
environment
Estimated amount of private investment 57 Economic
Number of parking spaces for residents 53 Travel behavior
Number of shared parking spaces 53 Travel behavior
Number of convenience/service retail establishments (i.e., dry cleaners, video rental) 53 Economic
Employment density (i.e., number of jobs per acre / square mile) 53 Economic /
built environment Estimated amount of private investment by type of land use 52 Economic
Note: Bold indicators were also reported as easy to collect Source: Renne and Wells, 2005 p.19.
Our findings in New Jersey prompted a national study, called Transit-
Oriented Development: Developing a Strategy to Measure Success (2005) to determine what local, county, state departments of transportation and transit agencies across the United States reported as benefits and measures of TOD. Our study revealed 56 indicators, which we categorized as: tra-vel behavior, economic performance, environmental performance, the built environment, and social benefits. Our findings revealed that that half of agencies surveyed had access to five or fewer indicators to measure these criteria. While we sought to determine which indicators were most useful and easiest indicators to collect (see Tables 6.3 & 6.4) the project did not include actual data collection for each of the indicators.

124 Transit-Oriented Development and Sustainability
Our findings in New Jersey prompted a national study, called Transit-Oriented Development: Developing a Strategy to Measure Success (2005) to determine what local, county, state departments of transportation and transit agencies across the United States reported as benefits and measures of TOD. Our study revealed 56 indicators, which we categorized as: tra-vel behavior, economic performance, environmental performance, the built environment, and social benefits. Our findings revealed that that half of agencies surveyed had access to five or fewer indicators to measure these criteria. While we sought to determine which indicators were most useful and easiest indicators to collect (see Tables 3 & 4) the project did not in-clude actual data collection for each of the indicators.
We recommended the following indicators as the most essential for a
TOD evaluation framework: 1. transit ridership, 2. population and housing density, 3. quality of streetscape design, 4. quantity of mixed-use struc-tures, 5. pedestrian activity and pedestrian safety 6. increase in property value/tax revenue, 7. public perception—resident and merchant surveys, 8. mode connections at the transit station, 9. parking configuration—for commuters, for residents, and shared parking.
Methodology
This study was commissioned jointly by the State of Western Australia’s Department for Planning and Infrastructure (DPI) and the Public Transport Authority (PTA). DPI and PTA are both members of a state TOD Com-mittee. Other members of the TOD Committee include the Main Roads department, the East Perth Redevelopment Authority, the Midland Rede-velopment Authority, the Department of Housing and Works, and the Western Australia Local Government Association. The TOD Committee coordinates and prioritizes capital infrastructure planning to encourage TOD. The Committee recently developed a TOD Assessment Tool, which helps in prioritizing when stations should receive capital investments. They work closely with local government and have ranked all stations with respect to partnership potential, strategic significance of location, potential for maximising transit ridership, development opportunities, and socio-economic benefits.
As the TOD Committee funnels state resources into creating TODs, they
would like a way to track progress. This tool was commissioned to be flexible so progress could be measured across a variety of benefit types.
Transit-Oriented Development and Sustainability 125
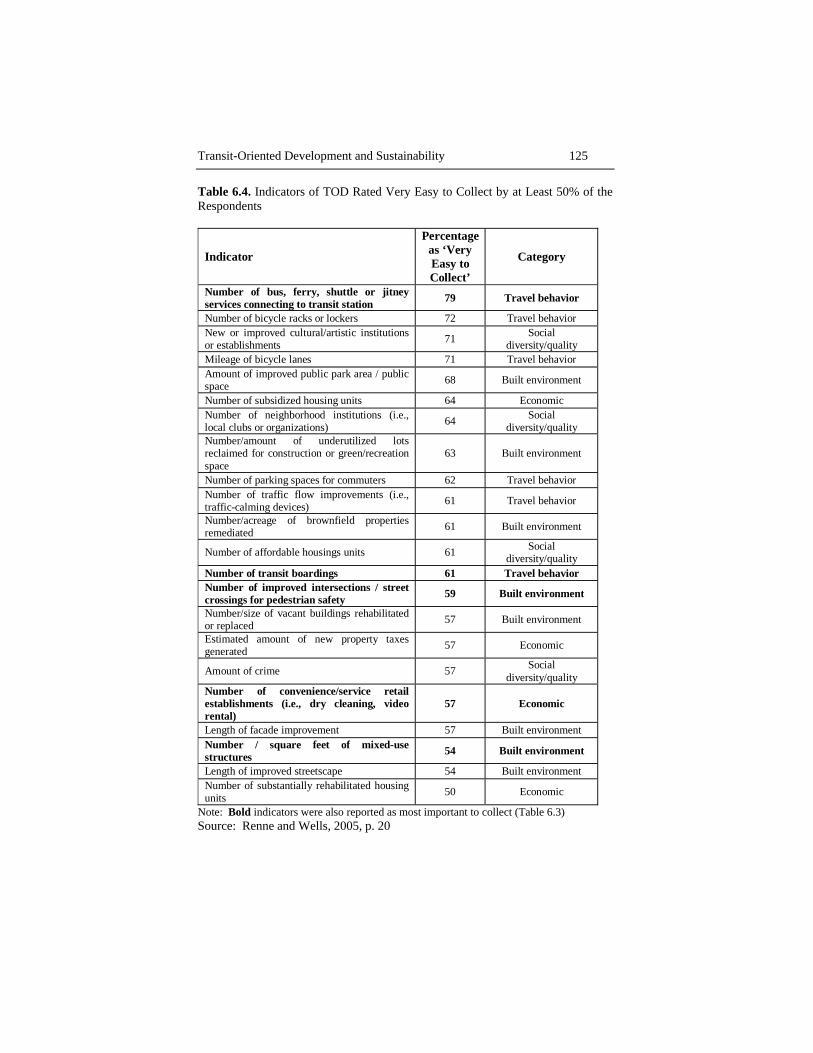
Table 6.4. Indicators of TOD Rated Very Easy to Collect by at Least 50% of the Respondents
Indicator
Percentage as ‘Very Easy to Collect’
Category
Number of bus, ferry, shuttle or jitney services connecting to transit station 79 Travel behavior
Number of bicycle racks or lockers 72 Travel behavior New or improved cultural/artistic institutions or establishments 71 Social
diversity/quality Mileage of bicycle lanes 71 Travel behavior Amount of improved public park area / public space 68 Built environment
Number of subsidized housing units 64 Economic Number of neighborhood institutions (i.e., local clubs or organizations) 64 Social
diversity/quality Number/amount of underutilized lots reclaimed for construction or green/recreation space
63 Built environment
Number of parking spaces for commuters 62 Travel behavior Number of traffic flow improvements (i.e., traffic-calming devices) 61 Travel behavior
Number/acreage of brownfield properties remediated 61 Built environment
Number of affordable housings units 61 Social diversity/quality
Number of transit boardings 61 Travel behavior Number of improved intersections / street crossings for pedestrian safety 59 Built environment
Number/size of vacant buildings rehabilitated or replaced 57 Built environment
Estimated amount of new property taxes generated 57 Economic
Amount of crime 57 Social diversity/quality
Number of convenience/service retail establishments (i.e., dry cleaning, video rental)
57 Economic
Length of facade improvement 57 Built environment Number / square feet of mixed-use structures 54 Built environment
Length of improved streetscape 54 Built environment Number of substantially rehabilitated housing units 50 Economic
Note: Bold indicators were also reported as most important to collect (Table 6.3) Source: Renne and Wells, 2005, p. 20

126 Transit-Oriented Development and Sustainability
The goal of the study was to develop a method for measuring the per-formance of TODs in Perth against selected economic, environmental, so-cial, and other performance criteria, and to establish the structure for a da-tabase required to undertake on-going periodic performance measurement. Therefore, while collecting data was an important part of the study, the most important part of the project was to test which data were available for collection. Therefore, this study has established a baseline that future ana-lyses can be measured against.
The scope of the project began by identifying five transit precincts for
analysis. The selection team, which included researchers and planners from DPI and PTA sought to select five stations which were representative of the different types of stations across Perth. The five stations selected were: 1. Mosman Park – a relatively compact, mixed-use and mixed-income established suburb; 2. Subiaco – an awarding winning textbook TOD build in the early 2000s, which has been so successful that property values have priced out most working class residents; 3. Maylands – a working class suburb close to Downtown Perth with an underutilized mainstreet and commercial centre; 4. Joondalup – an awarding wining New Urbanist town built in the early 1990s, which some argue has not tak-en full advantage of the train station within the urban fabric; 5. Glen-dalough – a station surrounded by automobile-oriented land uses that is hostile towards pedestrians.
The next step was to identify appropriate data categories, indicators, and
data sources. The project team then embarked on collecting the data, working with local and state government to collect as much secondary data as possible before a primary data collection effort. Since our data collec-tion effort sought to identify performance within the approximate 800-meter station precinct, some of the secondary data sources did not allow for an analysis at such a small geographic scale.
Our primary data collection effort took the form of site visits and a TOD
Household Survey. The site visits sought to collect indicators from field observation whereas the Household Survey aimed to collect data from households living within the study areas. 2,503 households were randomly selected across the study area. Because Joondalup only had 364 house-holds within the station precinct, we selected all of these households. In the remaining precincts 535 households (534 households in Glendalough) were randomly selected and sent surveys. For each selected household a letter was mailed from the government stating that they were chosen to participate in a study and that they would soon be receiving a question-
Transit-Oriented Development and Sustainability 127
naire that was important for the future of planning in Perth. The first round of questionnaires was mailed within a week after this initial letter. To generate the highest response rate possible, each packet contained an introductory letter, an eight page questionnaire, and a postcard to return separately to ensure complete anonymity for the responses. After two weeks, the households that did not return postcards were sent a second round of questionnaires.
In total, 332 surveys were returned as bad addresses resulting in 2,171
surveys sent to valid households. The Household Survey resulted in 848 completed questionnaires or a response rate of 39.1 percent of households with valid addresses. This response rate falls in line with another house-hold TOD mail survey using a similar methodology. A household mail questionnaire of three TODs in New Jersey recently resulted in a response rate of 40 percent (Renne and Wells, 2003).
It is important to note the limitations of this study’s methodology.
Many of the indicators draw from secondary data sources; therefore the da-ta may be biased based on the methodologies used within the original col-lection of data depending upon the source. As for the primary data collec-tion, the TOD Household Survey may be biased similar to any mail survey. Those that have the strongest opinions are perhaps more likely to complete the questionnaire. Moreover, since we surveyed only households that live within 800 meters of a train station, the habits of the population might be skewed compared to the general population due to a self-selection process of living near a rail station. Despite these limitations, the collection of these data represent one of the first attempts to amass such a broad set of indicators to measure the success of TOD based on a sustain-ability framework. There is no doubt that problems within the data exist but this study’s goal was more to test a method for measuring TOD suc-cess than to collect the data. The best way to test a methodology for measuring TOD success is to actually collect data, which serves as a base-line to track future growth.
Results
The team identified indicators for six categories, including: 1. Travel Be-haviour, 2. The Local Economy, 3. The Natural Environment, 4. The Built Environment, 5. The Social Environment, and 6. The Policy Context. This section presents the results of identifying and collecting indicators within
128 Transit-Oriented Development and Sustainability
each category. While a number of indicators are reported as possible measures to track TOD success, for the sake of brevity, this section only presents the results of selected measures from a larger set of data collected.
Travel Behaviour
Table 6.5 lists the potential measures, indicators, and possible data sources for measuring travel behaviour of residents living in TODs, while Table 6.6 reports information collected from secondary data sources. Three cells pertaining to vehicle kilometres travelled (see reverse coloured cells) are identified because the data seems questionable. This data comes from the Perth and Regional Travel Survey (PARTS) which surveyed 14,651 households across the region. The percent of the sample living within the station area precincts ranged from a high of 0.54 percent (79 households) in Mosman Park to a low of 0.055 percent (8 households) in Joondalup. The questionable data could be due to the small sample size in these loca-tions.
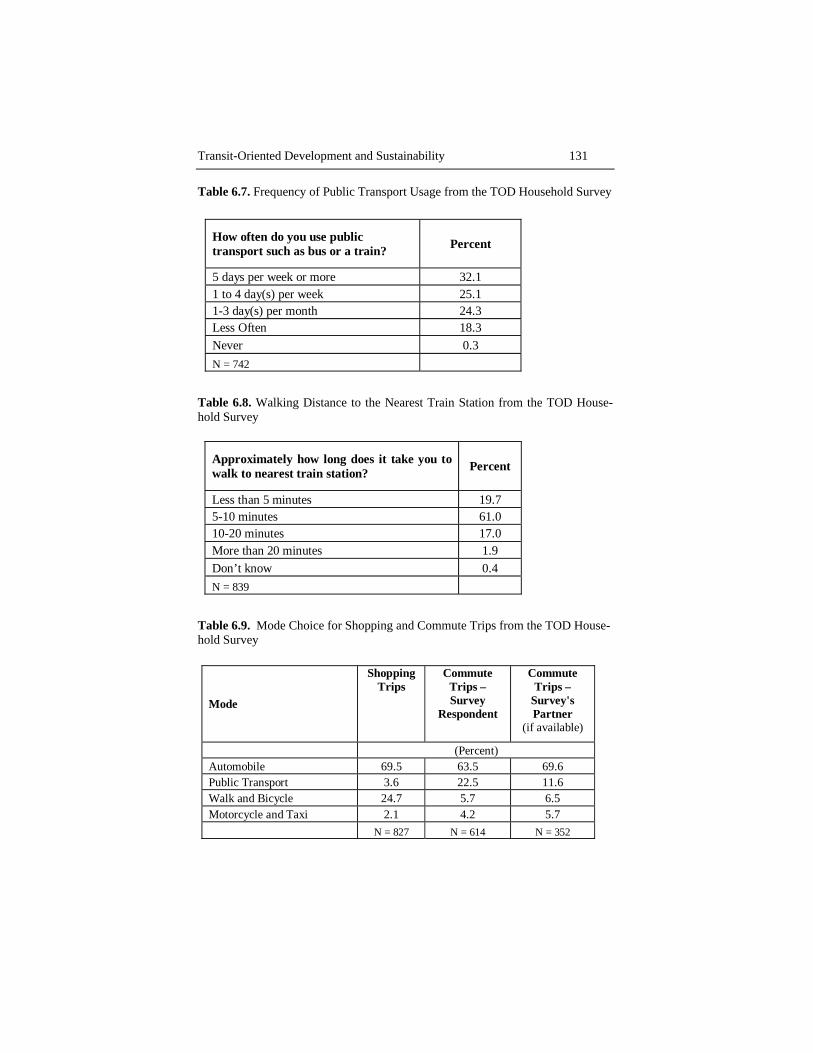
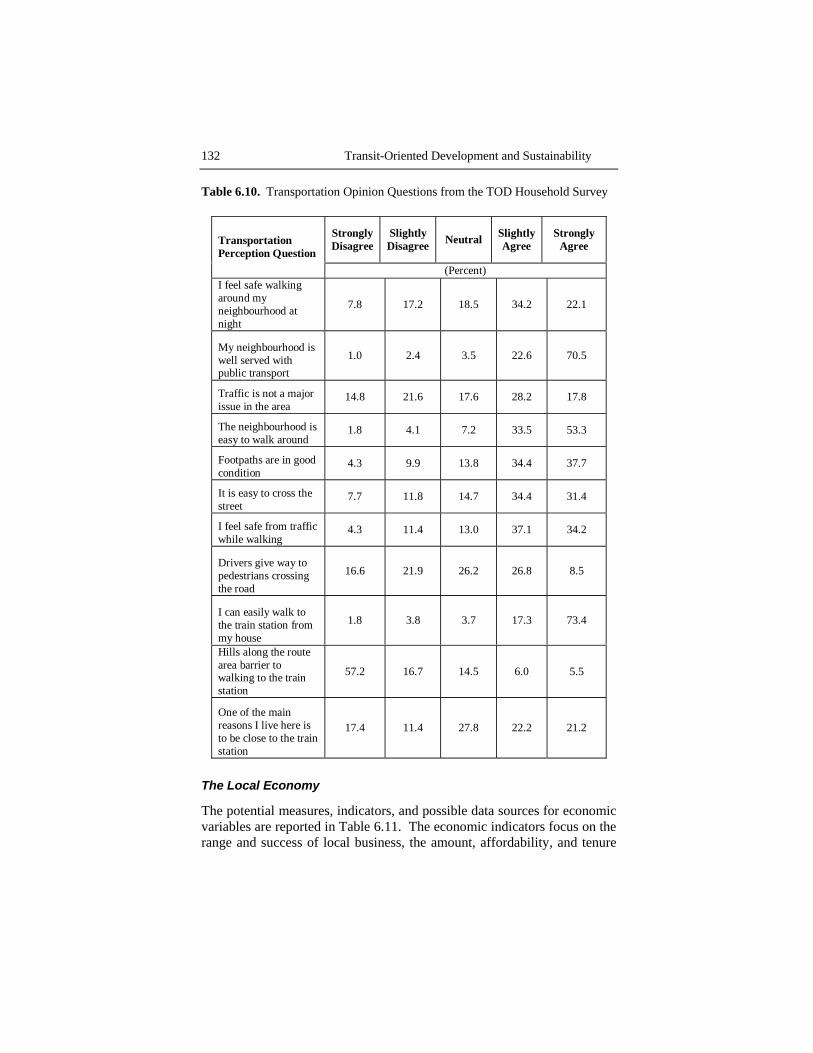
As discussed above, The TOD Household Survey provided a much lar-ger sample across the station area precincts. The questionnaire asked resi-dents how they use public transport (see Table 6.7), how long it takes them to walk to the nearest train station (see Table 6.8), how they travel for shopping and commute trips (Table 6.9). This data reveals that automo-biles are used for roughly 70 percent of all shopping and commute trips. Of the remaining 30 percent, residents in these five station areas are more likely to use public transport for commuting and more likely to walk or ride a bike for shopping. The survey also collected the number of vehicles, bicycles, and licensed drivers within the household (results not reported here). We also asked a number of opinion questions related to transporta-tion, as reported in Table 6.10.
Transit-Oriented Development and Sustainability 129
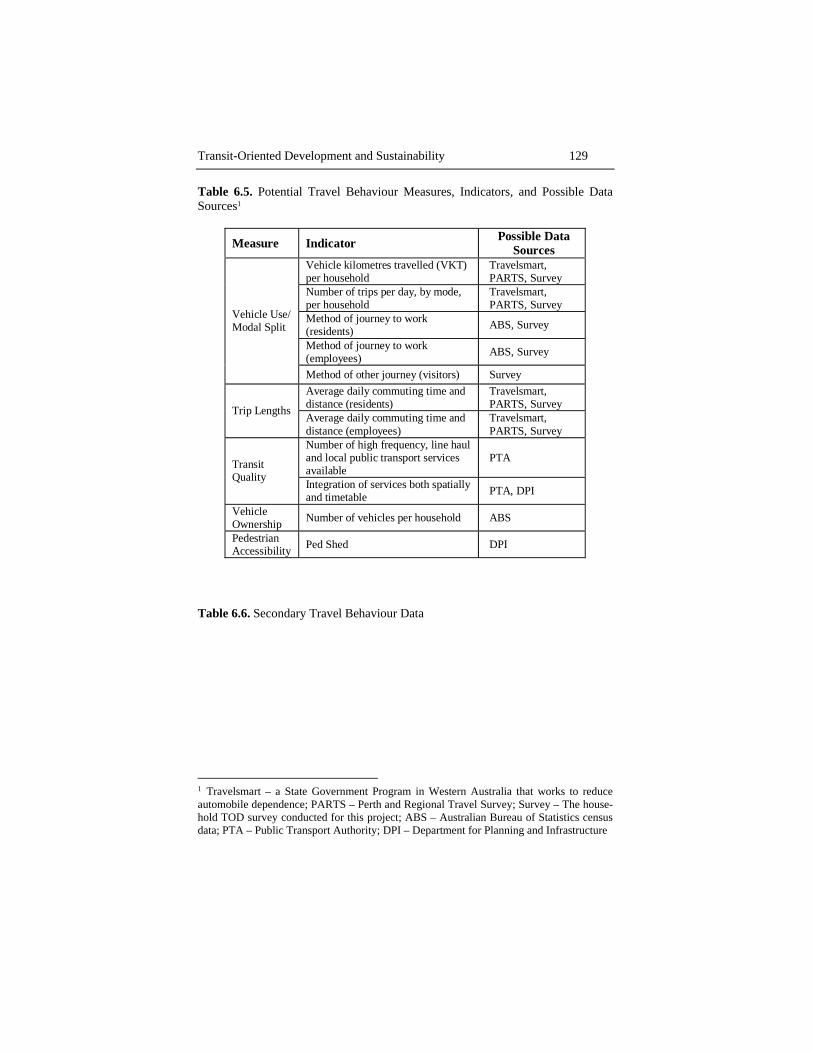
Table 6.5. Potential Travel Behaviour Measures, Indicators, and Possible Data Sources1
Measure Indicator Possible Data Sources
Vehicle kilometres travelled (VKT) per household
Travelsmart, PARTS, Survey
Number of trips per day, by mode, per household
Travelsmart, PARTS, Survey
Method of journey to work (residents) ABS, Survey
Method of journey to work (employees) ABS, Survey
Vehicle Use/ Modal Split
Method of other journey (visitors) Survey Average daily commuting time and distance (residents)
Travelsmart, PARTS, Survey Trip Lengths Average daily commuting time and
distance (employees) Travelsmart, PARTS, Survey
Number of high frequency, line haul and local public transport services available
PTA Transit Quality Integration of services both spatially
and timetable PTA, DPI
Vehicle Ownership Number of vehicles per household ABS
Pedestrian Accessibility Ped Shed DPI
Table 6.6. Secondary Travel Behaviour Data
1 Travelsmart – a State Government Program in Western Australia that works to reduce automobile dependence; PARTS – Perth and Regional Travel Survey; Survey – The house-hold TOD survey conducted for this project; ABS – Australian Bureau of Statistics census data; PTA – Public Transport Authority; DPI – Department for Planning and Infrastructure

130 Transit-Oriented Development and Sustainability
TOD Performance
Indicators
Mosm
an Park Station
Tow
n of Mosm
an Park
Subiaco Station
City of Subiaco
Maylands Station
City of B
ayswater
Glendalough Station
City of Stirling
Joondalup Station
City of Joondalup
Perth Metro A
rea
Average VKT per household (per day) 11.87 17.57 66.62 31.10 13.47 18.41 48.48 21.40 164.32 23.45 26.38
Mode Share of Daily Household Trips (all trips)
% trips by private vehicle (driver or pass) inc truck, mbike, taxi
68.91 80.52 79.39 75.34 74.49 86.21 91.02 86.18 92.68 85.80 83.88
% trips by public transport (all modes) 5.88 4.68 5.64 5.18 7.65 0.95 3.91 2.90 3.05 2.39 3.87
% trips walking, cycling, other 25.21 14.81 16.16 19.49 17.86 10.12 4.69 10.85 3.96 11.75 12.17
Method of Journey to Work (residents)
% trips by private vehicle (driver or pass) inc truck, mbike, taxi 63.16 32.00 78.87 74.30 78.26 87.50 95.24 88.95 90.00 89.30 86.51 % trips by public transport (all modes) 10.53 40.00 18.31 15.08 17.39 7.29 3.17 8.51 6.67 7.79 9.26 % trips walking, cycling, other 10.53 28.00 2.82 10.61 4.35 5.21 1.59 2.54 3.33 2.91 4.23
Method of Journey to Work (employees)
% trips by private vehicle (driver or pass) inc truck, mbike, taxi 64.29 80.00 82.93 78.11 66.67 87.50 91.89 89.19 91.18 89.86 86.51 % trips by public transport (all modes) 21.43 4.00 12.20 12.94 27.78 7.55 5.41 7.88 5.88 6.69 9.26 % trips walking, cycling, other 14.29 16.00 4.88 8.96 5.56 4.69 2.70 2.75 2.94 3.23 4.21
Method of other Journey (visitors)
% trips by private vehicle (driver or pass) inc truck, mbike, taxi 70.09 81.52 78.32 74.65 77.53 86.04 89.73 85.74 93.52 85.17 83.53 % trips by public transport (all modes) 4.02 4.08 4.07 4.54 3.93 3.08 3.78 2.29 2.73 1.87 3.10 % trips walking, cycling, other 25.89 14.40 17.62 20.81 18.54 10.89 5.95 11.93 3.55 12.88 13.33
Trip lengths (residents) 9.723 2.810 11.341 10.257 9.601 11.240 13.254 11.952 8.273 15.443 14.404
Trip lengths (employees) 9.274 6.680 12.318 11.276 8.654 11.381 13.297 11.842 9.487 15.210 14.404 Number of services available (train and bus) total services 256 632 286 502 700
#trips, bus services not co-ordinated with trains 76 132 0 0 0 #trips, bus services not serving station 36 332 122 78 0 Number of vehicles per household 1.139 1.275 1.286 1.223 1.353 1.562 1.429 1.573 0.875 1.880 1.694
Ped Shed (walkable catchment/total catchment) 77% 67% 67% 67% 67% Passengers boarding (Average Weekday Boardings (AWB) 677 2504 1418 1791 2444 68416
Note: Data from multi secondary sources. Shaded cells represent questionable data.
Transit-Oriented Development and Sustainability 131
Table 6.7. Frequency of Public Transport Usage from the TOD Household Survey
How often do you use public transport such as bus or a train? Percent
5 days per week or more 32.1 1 to 4 day(s) per week 25.1 1-3 day(s) per month 24.3 Less Often 18.3 Never 0.3 N = 742
Table 6.8. Walking Distance to the Nearest Train Station from the TOD House-hold Survey
Approximately how long does it take you to walk to nearest train station? Percent
Less than 5 minutes 19.7 5-10 minutes 61.0 10-20 minutes 17.0 More than 20 minutes 1.9 Don’t know 0.4 N = 839
Table 6.9. Mode Choice for Shopping and Commute Trips from the TOD House-hold Survey
Mode
Shopping Trips
Commute Trips – Survey
Respondent
Commute Trips –
Survey's Partner
(if available)
(Percent) Automobile 69.5 63.5 69.6 Public Transport 3.6 22.5 11.6 Walk and Bicycle 24.7 5.7 6.5 Motorcycle and Taxi 2.1 4.2 5.7 N = 827 N = 614 N = 352
132 Transit-Oriented Development and Sustainability
Table 6.10. Transportation Opinion Questions from the TOD Household Survey
Strongly Disagree
Slightly Disagree Neutral Slightly
Agree Strongly
Agree Transportation Perception Question
(Percent) I feel safe walking around my neighbourhood at night
7.8 17.2 18.5 34.2 22.1
My neighbourhood is well served with public transport
1.0 2.4 3.5 22.6 70.5
Traffic is not a major issue in the area
14.8 21.6 17.6 28.2 17.8
The neighbourhood is easy to walk around
1.8 4.1 7.2 33.5 53.3
Footpaths are in good condition
4.3 9.9 13.8 34.4 37.7
It is easy to cross the street
7.7 11.8 14.7 34.4 31.4
I feel safe from traffic while walking
4.3 11.4 13.0 37.1 34.2
Drivers give way to pedestrians crossing the road
16.6 21.9 26.2 26.8 8.5
I can easily walk to the train station from my house
1.8 3.8 3.7 17.3 73.4
Hills along the route area barrier to walking to the train station
57.2 16.7 14.5 6.0 5.5
One of the main reasons I live here is to be close to the train station
17.4 11.4 27.8 22.2 21.2
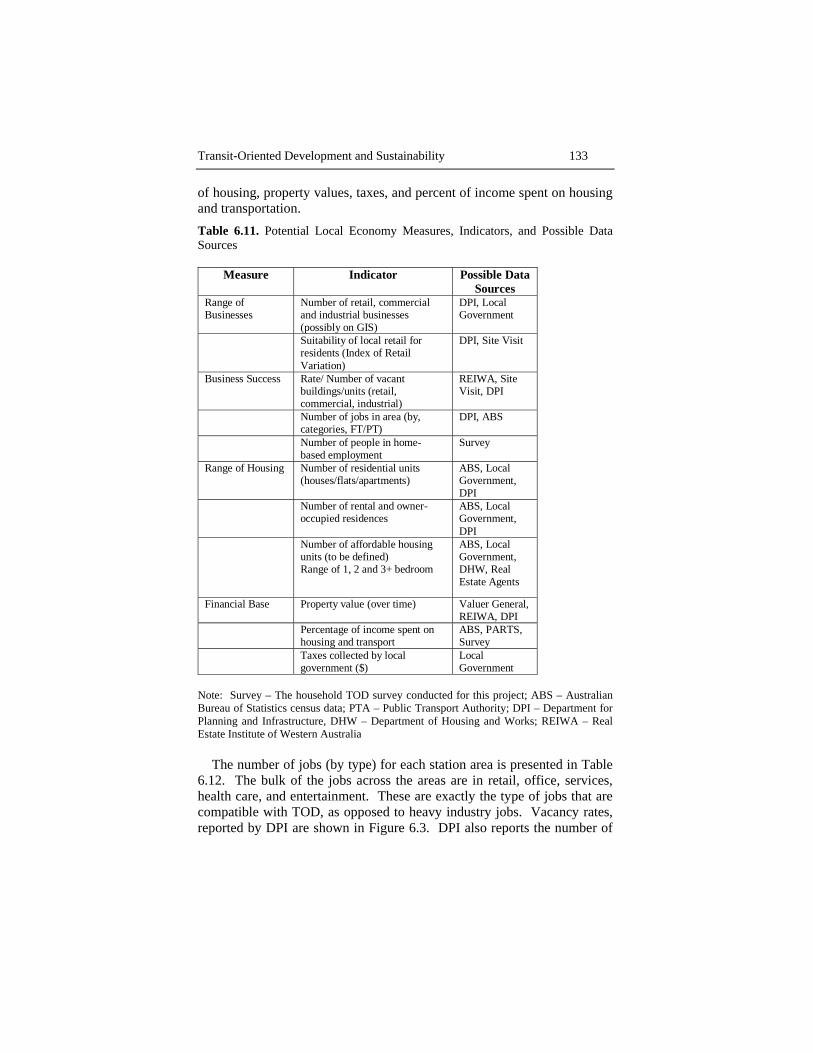
The Local Economy
The potential measures, indicators, and possible data sources for economic variables are reported in Table 6.11. The economic indicators focus on the range and success of local business, the amount, affordability, and tenure
Transit-Oriented Development and Sustainability 133
of housing, property values, taxes, and percent of income spent on housing and transportation. Table 6.11. Potential Local Economy Measures, Indicators, and Possible Data Sources
Measure Indicator Possible Data Sources
Range of Businesses
Number of retail, commercial and industrial businesses (possibly on GIS)
DPI, Local Government
Suitability of local retail for residents (Index of Retail Variation)
DPI, Site Visit
Business Success Rate/ Number of vacant buildings/units (retail, commercial, industrial)
REIWA, Site Visit, DPI
Number of jobs in area (by, categories, FT/PT)
DPI, ABS
Number of people in home-based employment
Survey
Range of Housing Number of residential units (houses/flats/apartments)
ABS, Local Government, DPI
Number of rental and owner-occupied residences
ABS, Local Government, DPI
Number of affordable housing units (to be defined) Range of 1, 2 and 3+ bedroom
ABS, Local Government, DHW, Real Estate Agents
Financial Base Property value (over time) Valuer General, REIWA, DPI
Percentage of income spent on housing and transport
ABS, PARTS, Survey
Taxes collected by local government ($)
Local Government
Note: Survey – The household TOD survey conducted for this project; ABS – Australian Bureau of Statistics census data; PTA – Public Transport Authority; DPI – Department for Planning and Infrastructure, DHW – Department of Housing and Works; REIWA – Real Estate Institute of Western Australia
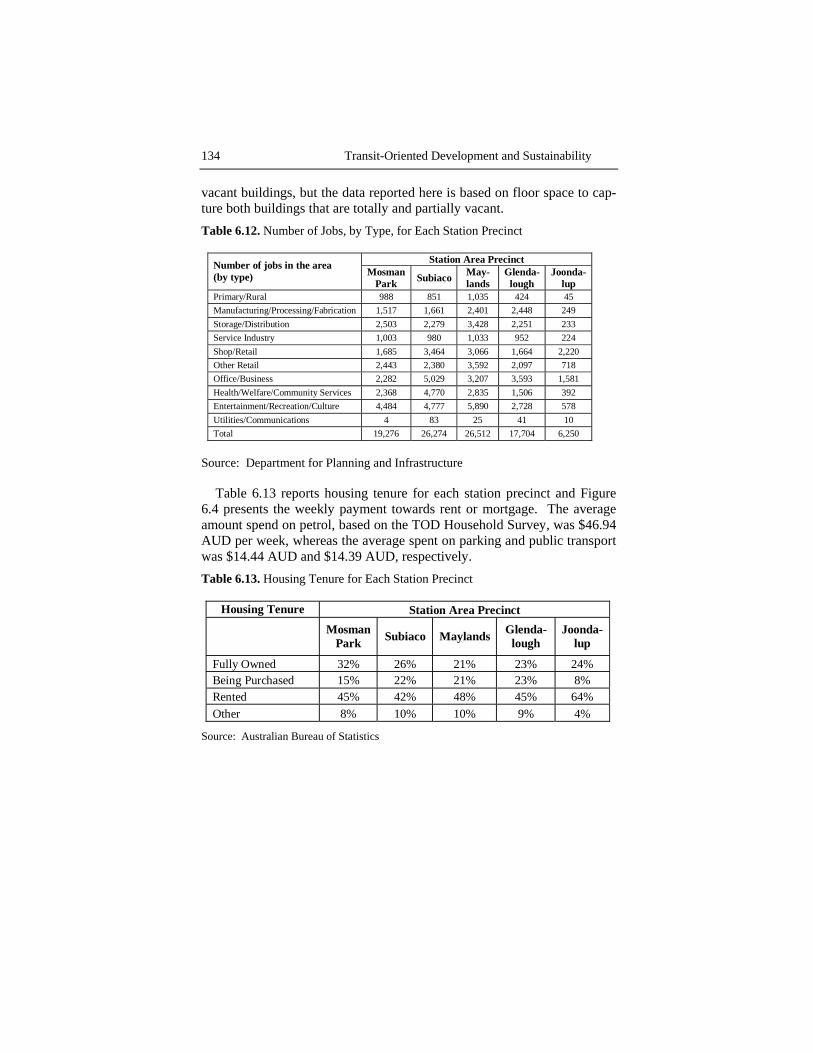
The number of jobs (by type) for each station area is presented in Table
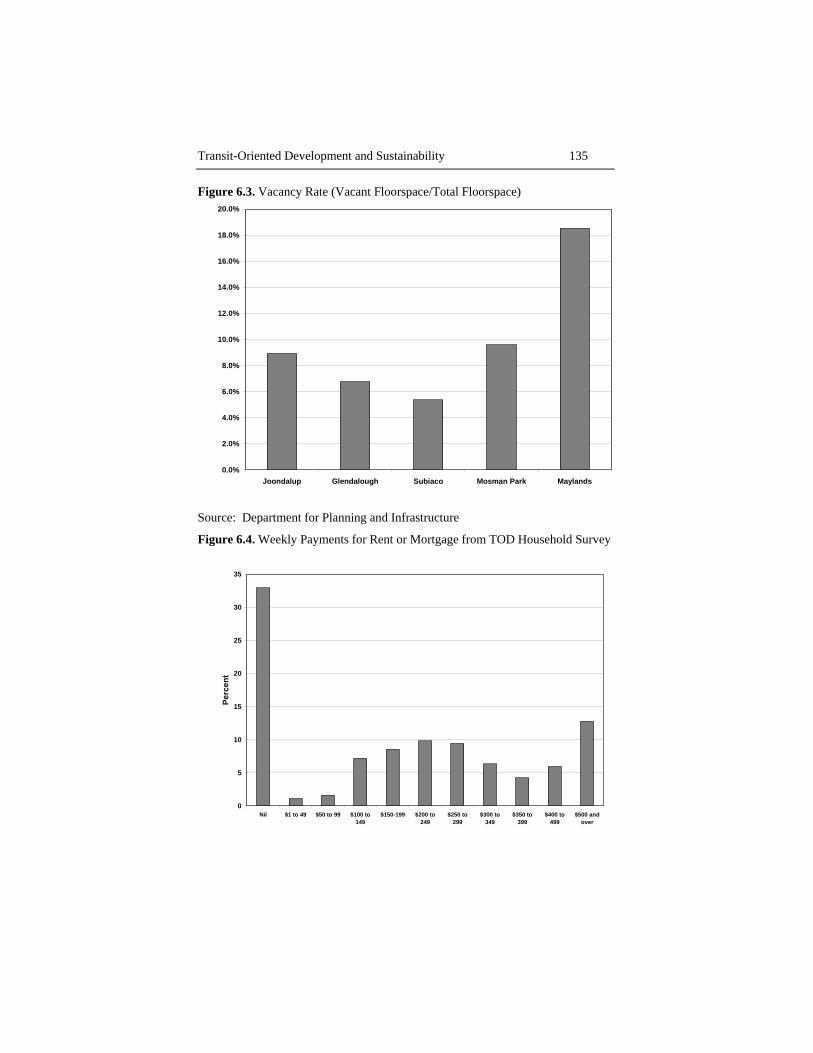
6.12. The bulk of the jobs across the areas are in retail, office, services, health care, and entertainment. These are exactly the type of jobs that are compatible with TOD, as opposed to heavy industry jobs. Vacancy rates, reported by DPI are shown in Figure 6.3. DPI also reports the number of
134 Transit-Oriented Development and Sustainability
vacant buildings, but the data reported here is based on floor space to cap-ture both buildings that are totally and partially vacant. Table 6.12. Number of Jobs, by Type, for Each Station Precinct
Station Area Precinct Number of jobs in the area (by type) Mosman
Park Subiaco May-lands
Glenda-lough
Joonda-lup
Primary/Rural 988 851 1,035 424 45 Manufacturing/Processing/Fabrication 1,517 1,661 2,401 2,448 249 Storage/Distribution 2,503 2,279 3,428 2,251 233 Service Industry 1,003 980 1,033 952 224 Shop/Retail 1,685 3,464 3,066 1,664 2,220 Other Retail 2,443 2,380 3,592 2,097 718 Office/Business 2,282 5,029 3,207 3,593 1,581 Health/Welfare/Community Services 2,368 4,770 2,835 1,506 392 Entertainment/Recreation/Culture 4,484 4,777 5,890 2,728 578 Utilities/Communications 4 83 25 41 10 Total 19,276 26,274 26,512 17,704 6,250
Source: Department for Planning and Infrastructure
Table 6.13 reports housing tenure for each station precinct and Figure 6.4 presents the weekly payment towards rent or mortgage. The average amount spend on petrol, based on the TOD Household Survey, was $46.94 AUD per week, whereas the average spent on parking and public transport was $14.44 AUD and $14.39 AUD, respectively. Table 6.13. Housing Tenure for Each Station Precinct
Housing Tenure Station Area Precinct
Mosman Park Subiaco Maylands Glenda-
lough Joonda-
lup
Fully Owned 32% 26% 21% 23% 24% Being Purchased 15% 22% 21% 23% 8% Rented 45% 42% 48% 45% 64% Other 8% 10% 10% 9% 4%
Source: Australian Bureau of Statistics
Transit-Oriented Development and Sustainability 135
Figure 6.3. Vacancy Rate (Vacant Floorspace/Total Floorspace)
0.0%
2.0%
4.0%
6.0%
8.0%
10.0%
12.0%
14.0%
16.0%
18.0%
20.0%
Joondalup Glendalough Subiaco Mosman Park Maylands
Source: Department for Planning and Infrastructure
Figure 6.4. Weekly Payments for Rent or Mortgage from TOD Household Survey
0
5
10
15
20
25
30
35
Nil $1 to 49 $50 to 99 $100 to149
$150-199 $200 to249
$250 to299
$300 to349
$350 to399
$400 to499
$500 andover
Perc
ent

136 Transit-Oriented Development and Sustainability
The Natural and Built Environment
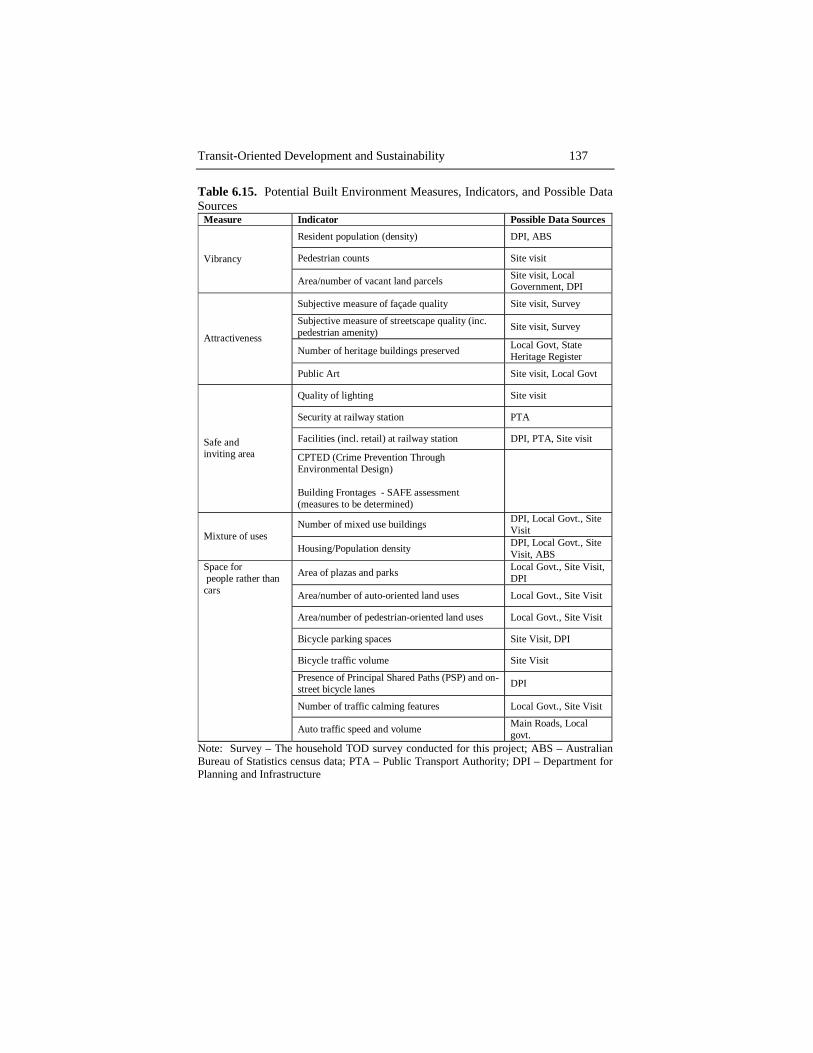
An ideal TOD includes compact development and mixed land uses while still provided green and natural space. The potential measures, indicators and possible data source are listed in Table 6.14 and 6.15. Table 6.14. Potential Natural Environment Measures, Indicators, and Possible Data Sources
Measure Indicator Possible Data Sources
Air Quality and Pollution
Estimate emissions based on VKT
Survey, PARTS, Travelsmart
Energy use (people ) Estimate car fuel use based on VKT
Survey, PARTS, Travelsmart
Noise Average and Peak noise levels Local Government
Stormwater Retention Volume of water Local Government
Note: Travelsmart – a State Government Program in Western Australia that works to re-duce automobile dependence; PARTS – Perth and Regional Travel Survey; Survey – The household TOD survey conducted for this project
Transit-Oriented Development and Sustainability 137
Table 6.15. Potential Built Environment Measures, Indicators, and Possible Data Sources
Measure Indicator Possible Data Sources
Resident population (density) DPI, ABS
Pedestrian counts Site visit Vibrancy
Area/number of vacant land parcels Site visit, Local Government, DPI
Subjective measure of façade quality Site visit, Survey
Subjective measure of streetscape quality (inc. pedestrian amenity) Site visit, Survey
Number of heritage buildings preserved Local Govt, State Heritage Register
Attractiveness
Public Art Site visit, Local Govt
Quality of lighting Site visit
Security at railway station PTA
Facilities (incl. retail) at railway station DPI, PTA, Site visit Safe and inviting area CPTED (Crime Prevention Through
Environmental Design) Building Frontages - SAFE assessment (measures to be determined)
Number of mixed use buildings DPI, Local Govt., Site Visit Mixture of uses
Housing/Population density DPI, Local Govt., Site Visit, ABS
Area of plazas and parks Local Govt., Site Visit, DPI
Area/number of auto-oriented land uses Local Govt., Site Visit
Area/number of pedestrian-oriented land uses Local Govt., Site Visit
Bicycle parking spaces Site Visit, DPI
Bicycle traffic volume Site Visit
Presence of Principal Shared Paths (PSP) and on-street bicycle lanes DPI
Number of traffic calming features Local Govt., Site Visit
Space for people rather than cars
Auto traffic speed and volume Main Roads, Local govt.
Note: Survey – The household TOD survey conducted for this project; ABS – Australian Bureau of Statistics census data; PTA – Public Transport Authority; DPI – Department for Planning and Infrastructure
138 Transit-Oriented Development and Sustainability
Figure 6.5 reports housing density and the amount of public space, which is a vital component for creating a successful built environment. Figure 6.5. Housing Density and Area of Plazas and Parks
0.00
2.00
4.00
6.00
8.00
10.00
12.00
14.00
16.00
18.00
20.00
Mosman Park Subiaco Maylands Glendalough Joondalup
Hou
sing
Den
sity
(Dw
ellin
gs p
er G
ross
Ha)
0.00
5.00
10.00
15.00
20.00
25.00
30.00
Are
a of
Pla
zas
and
Park
s in
Ha
Housing density(dwellings per grosshectare)
Area of plazas andparks (ha)
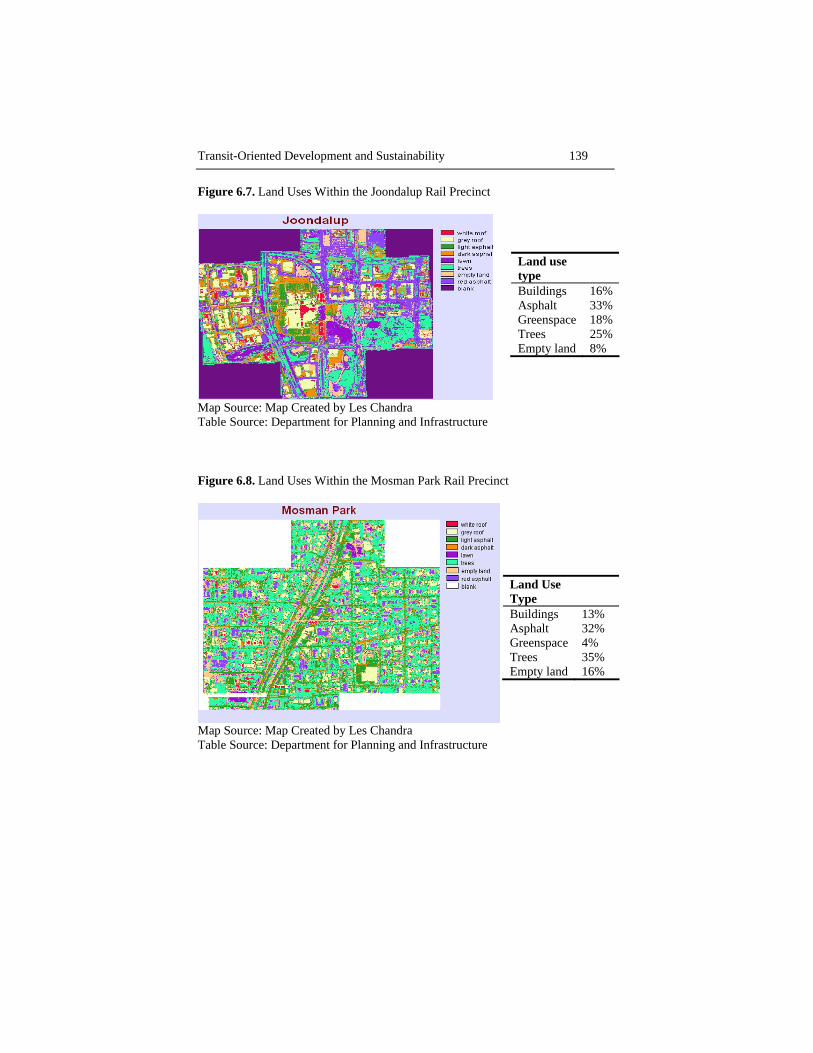
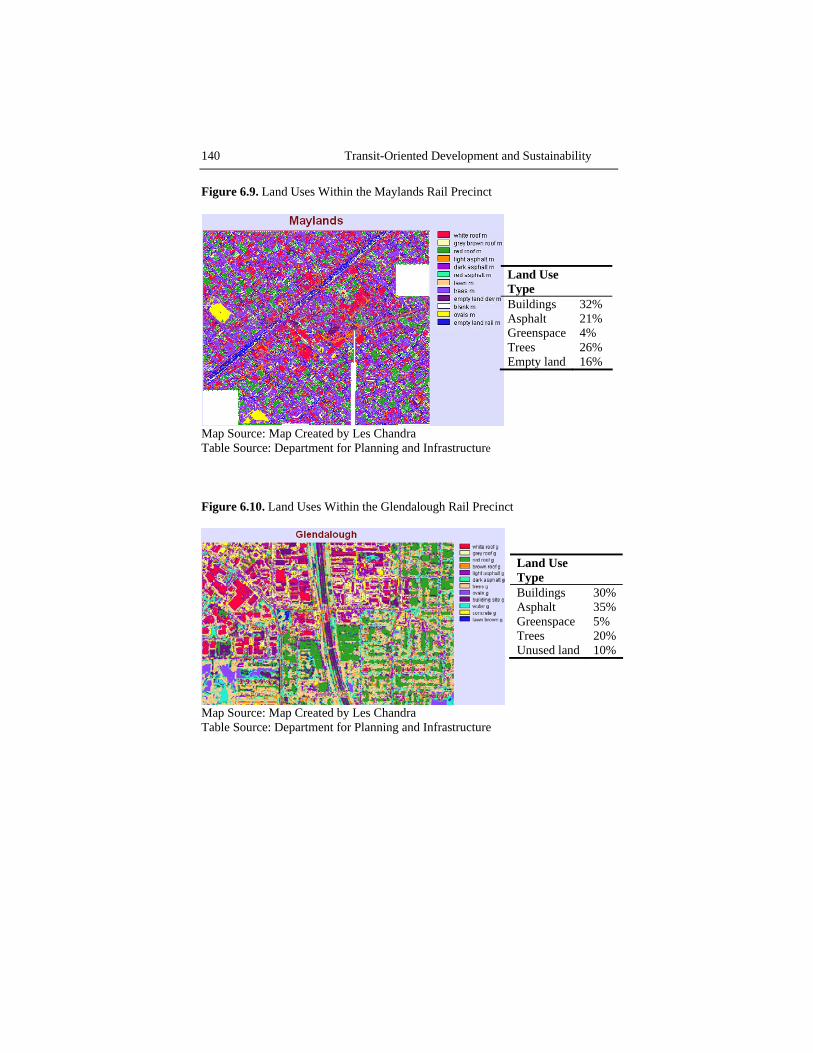
An analysis of land use by remote sensing depicts the amount and vari-
ety for different types of land uses (see Figures 6.6 – 6.10). Table 6.16 shows the comparison of land uses across the five station precincts. Figure 6.6. Land Uses Within the Subiaco Rail Precinct
Map Source: Map Created by Les Chandra Table Source: Department for Planning and Infrastructure
Land Use Type
Buildings 28% Asphalt 41% Greenspace 3% Trees 21% Empty land 7%
Transit-Oriented Development and Sustainability 139
Figure 6.7. Land Uses Within the Joondalup Rail Precinct
Map Source: Map Created by Les Chandra Table Source: Department for Planning and Infrastructure
Figure 6.8. Land Uses Within the Mosman Park Rail Precinct
Map Source: Map Created by Les Chandra Table Source: Department for Planning and Infrastructure
Land use type
Buildings 16% Asphalt 33% Greenspace 18% Trees 25% Empty land 8%
Land Use Type
Buildings 13% Asphalt 32% Greenspace 4% Trees 35% Empty land 16%
140 Transit-Oriented Development and Sustainability
Figure 6.9. Land Uses Within the Maylands Rail Precinct
Map Source: Map Created by Les Chandra Table Source: Department for Planning and Infrastructure
Figure 6.10. Land Uses Within the Glendalough Rail Precinct
Map Source: Map Created by Les Chandra Table Source: Department for Planning and Infrastructure
Land Use Type
Buildings 32% Asphalt 21% Greenspace 4% Trees 26% Empty land 16%
Land Use Type
Buildings 30% Asphalt 35% Greenspace 5% Trees 20% Unused land 10%

Transit-Oriented Development and Sustainability 141
Table 6.16. Land Use Comparison Across Rail Station Precincts
Glenda-
lough Joonda-
lup Maylands Mosman
Park Subiaco (Percent) Buildings 30 16 32 13 28 Asphalt 35 33 21 32 41 Greenspace 5 18 4 4 3 Trees 20 25 26 35 21 Unused land 10 8 16 16 7
Source: Department for Planning and Infrastructure
The TOD Household Survey also asked a number of detailed questions
about the quality of the natural and built environment. Some of the data, including the quality of the footpaths, perceptions of safety, and other indi-cators related to transportation as it relates to the environments were re-ported in Table 6.10. Other data, which asked detailed questions about the respondent’s ideal neighbourhood and the types of land uses that were im-portant to them were asked on the questionnaire but not reported here for the sake of brevity.
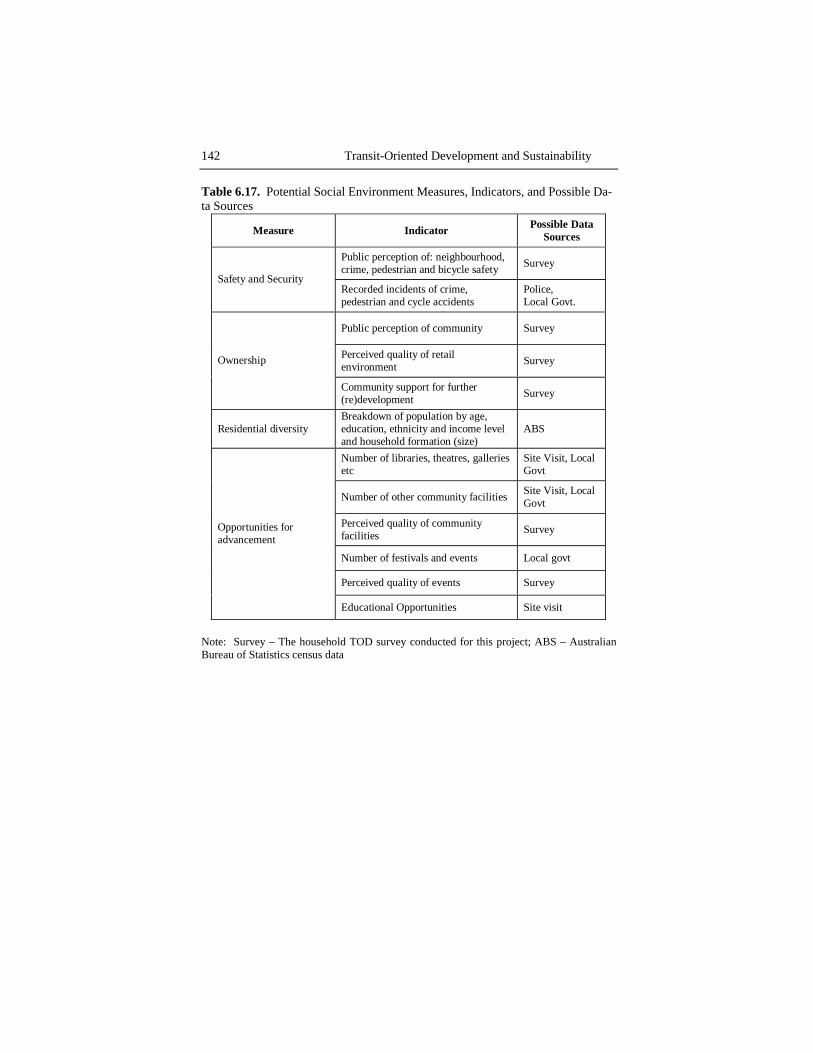
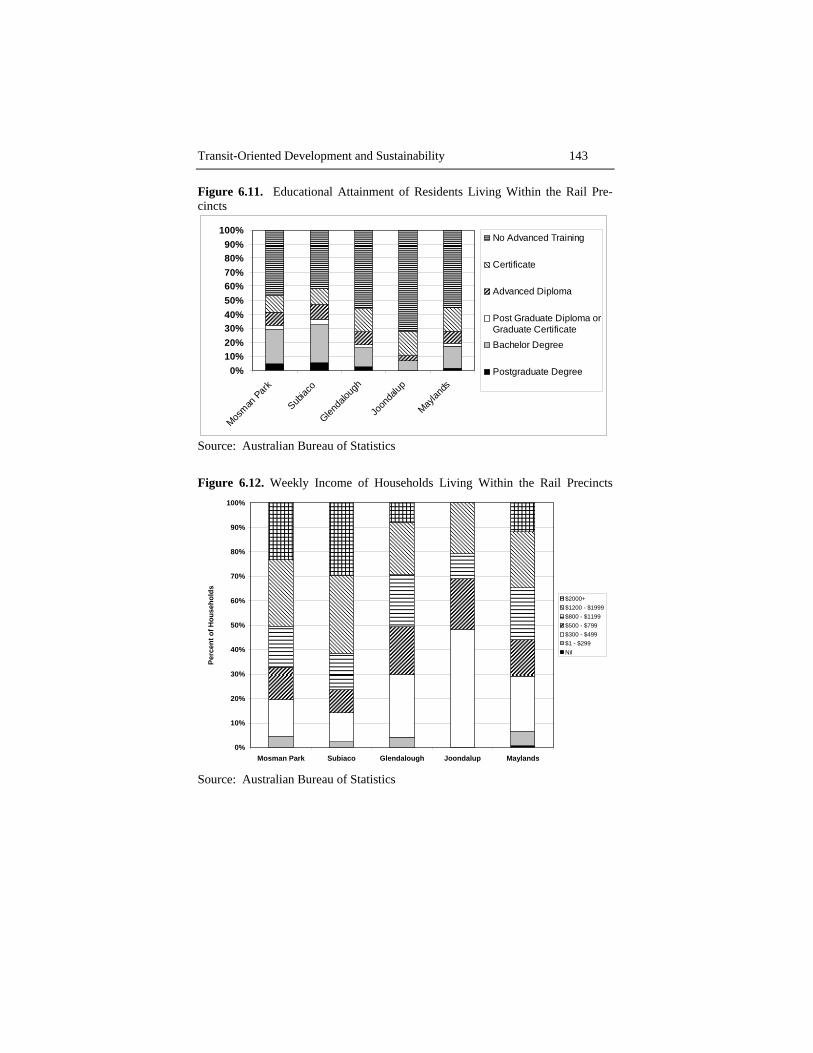
The Social Environment
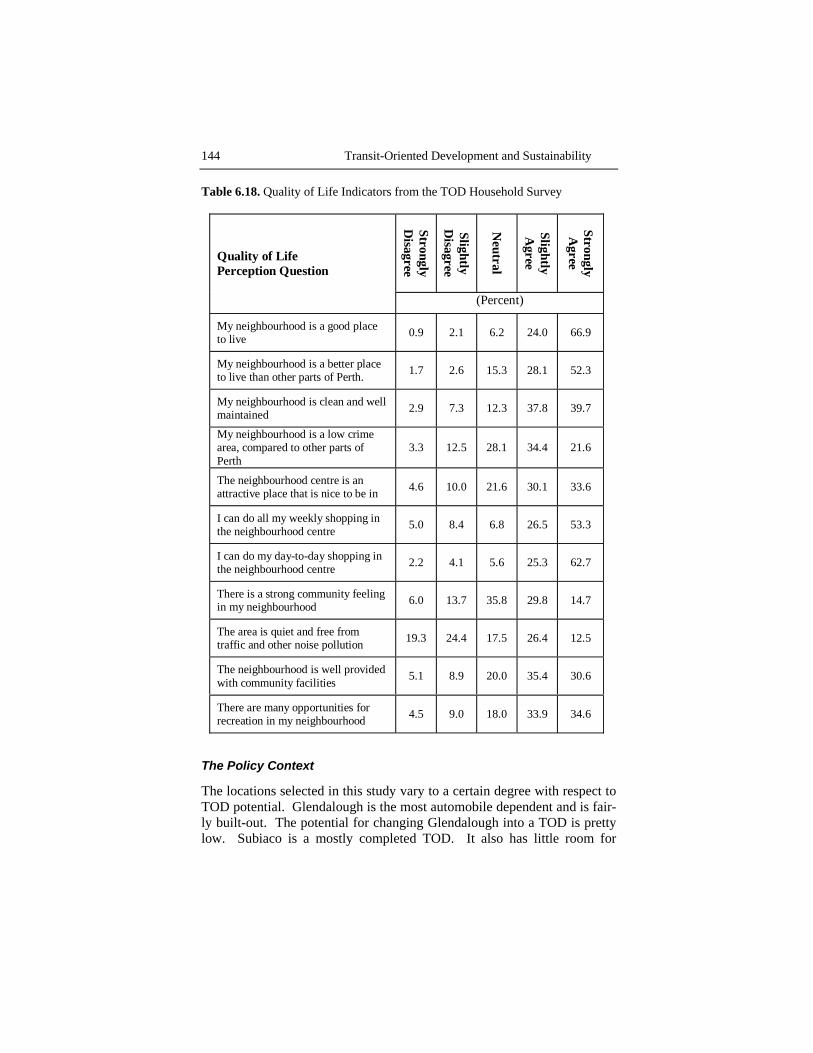
Potential measures, indicators and possible data sources of the social envi-ronment are reported in Table 6.17. Figures 6.11 and 6.12 present data on educational attainment and income distribution of the population. Some of the data on safety and security were reported in Table 6.10. We also col-lected data on age and gender, as well as the perception of neighbourhood quality. Table 6.18 reports quality of life indicators collected thorough the TOD Household Survey.
142 Transit-Oriented Development and Sustainability
Table 6.17. Potential Social Environment Measures, Indicators, and Possible Da-ta Sources
Measure Indicator Possible Data Sources
Public perception of: neighbourhood, crime, pedestrian and bicycle safety Survey
Safety and Security Recorded incidents of crime, pedestrian and cycle accidents
Police, Local Govt.
Public perception of community Survey
Perceived quality of retail environment Survey Ownership
Community support for further (re)development Survey
Residential diversity Breakdown of population by age, education, ethnicity and income level and household formation (size)
ABS
Number of libraries, theatres, galleries etc
Site Visit, Local Govt
Number of other community facilities Site Visit, Local Govt
Perceived quality of community facilities Survey
Number of festivals and events Local govt
Perceived quality of events Survey
Opportunities for advancement
Educational Opportunities Site visit
Note: Survey – The household TOD survey conducted for this project; ABS – Australian Bureau of Statistics census data
Transit-Oriented Development and Sustainability 143
Figure 6.11. Educational Attainment of Residents Living Within the Rail Pre-cincts
0%10%20%30%40%50%60%70%80%90%
100%
Mosman
Park
Subiac
o
Glenda
lough
Joon
dalup
Maylan
ds
No Advanced Training
Certificate
Advanced Diploma
Post Graduate Diploma orGraduate CertificateBachelor Degree
Postgraduate Degree
Source: Australian Bureau of Statistics
Figure 6.12. Weekly Income of Households Living Within the Rail Precincts
0%
10%
20%
30%
40%
50%
60%
70%
80%
90%
100%
Mosman Park Subiaco Glendalough Joondalup Maylands
Perc
ent o
f Hou
seho
lds
$2000+$1200 - $1999$800 - $1199$500 - $799$300 - $499$1 - $299Nil
Source: Australian Bureau of Statistics
144 Transit-Oriented Development and Sustainability
Table 6.18. Quality of Life Indicators from the TOD Household Survey
Strongly D
isagree
Slightly D
isagree
Neutral
Slightly A
gree
Strongly A
gree Quality of Life Perception Question
(Percent)
My neighbourhood is a good place to live 0.9 2.1 6.2 24.0 66.9
My neighbourhood is a better place to live than other parts of Perth. 1.7 2.6 15.3 28.1 52.3
My neighbourhood is clean and well maintained 2.9 7.3 12.3 37.8 39.7
My neighbourhood is a low crime area, compared to other parts of Perth
3.3 12.5 28.1 34.4 21.6
The neighbourhood centre is an attractive place that is nice to be in 4.6 10.0 21.6 30.1 33.6
I can do all my weekly shopping in the neighbourhood centre 5.0 8.4 6.8 26.5 53.3
I can do my day-to-day shopping in the neighbourhood centre 2.2 4.1 5.6 25.3 62.7
There is a strong community feeling in my neighbourhood 6.0 13.7 35.8 29.8 14.7
The area is quiet and free from traffic and other noise pollution 19.3 24.4 17.5 26.4 12.5
The neighbourhood is well provided with community facilities 5.1 8.9 20.0 35.4 30.6
There are many opportunities for recreation in my neighbourhood 4.5 9.0 18.0 33.9 34.6
The Policy Context
The locations selected in this study vary to a certain degree with respect to TOD potential. Glendalough is the most automobile dependent and is fair-ly built-out. The potential for changing Glendalough into a TOD is pretty low. Subiaco is a mostly completed TOD. It also has little room for
Transit-Oriented Development and Sustainability 145
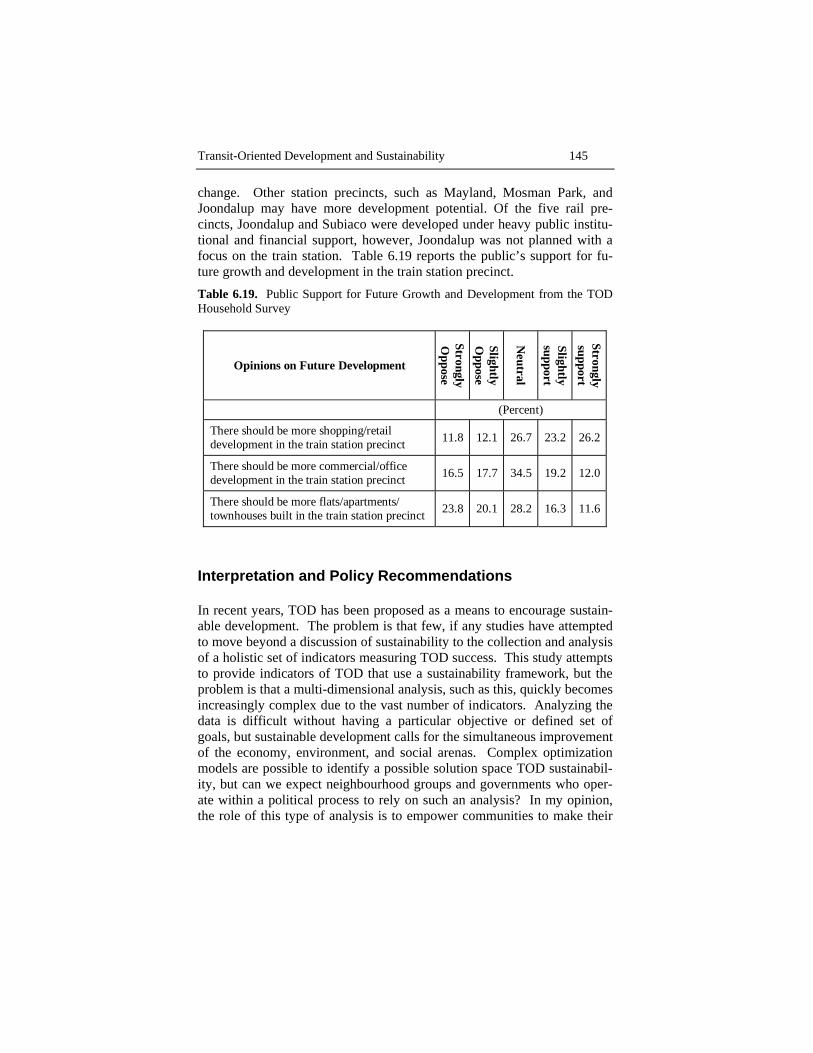
change. Other station precincts, such as Mayland, Mosman Park, and Joondalup may have more development potential. Of the five rail pre-cincts, Joondalup and Subiaco were developed under heavy public institu-tional and financial support, however, Joondalup was not planned with a focus on the train station. Table 6.19 reports the public’s support for fu-ture growth and development in the train station precinct. Table 6.19. Public Support for Future Growth and Development from the TOD Household Survey
Opinions on Future Development Strongly O
ppose
Slightly O
ppose
Neutral
Slightly support
Strongly support
(Percent)
There should be more shopping/retail development in the train station precinct 11.8 12.1 26.7 23.2 26.2
There should be more commercial/office development in the train station precinct 16.5 17.7 34.5 19.2 12.0
There should be more flats/apartments/ townhouses built in the train station precinct 23.8 20.1 28.2 16.3 11.6
Interpretation and Policy Recommendations
In recent years, TOD has been proposed as a means to encourage sustain-able development. The problem is that few, if any studies have attempted to move beyond a discussion of sustainability to the collection and analysis of a holistic set of indicators measuring TOD success. This study attempts to provide indicators of TOD that use a sustainability framework, but the problem is that a multi-dimensional analysis, such as this, quickly becomes increasingly complex due to the vast number of indicators. Analyzing the data is difficult without having a particular objective or defined set of goals, but sustainable development calls for the simultaneous improvement of the economy, environment, and social arenas. Complex optimization models are possible to identify a possible solution space TOD sustainabil-ity, but can we expect neighbourhood groups and governments who oper-ate within a political process to rely on such an analysis? In my opinion, the role of this type of analysis is to empower communities to make their

146 Transit-Oriented Development and Sustainability
own decisions. This section suggests policy recommendations for using this sort of TOD outcome analysis and how it can inform policy.
1. Understand that most decisions are ultimately political – Planners need
to understand that no matter how much data experts analyze, decisions are mostly made based on political factors. The importance of data is to confirm or reject assumptions that local communities make based on gut feelings. Data can assist to refine goals and objectives and ultimately create better policies to produce more sustainable outcomes (see Figure 6.2).
2. Define the goals of TOD – Each community needs to define their own goals for TOD. If multiple goals exist, they should be ranked. Some communities might encourage TOD primarily from a mobility perspec-tive while others see it as a driver of economic development. Other communities might use TOD as a way to encourage location efficient af-fordable housing. Without specific prioritized goals for TOD, it be-comes very difficult to define success.
3. Establish baseline data across sustainability dimensions – This paper at-tempts to create multiple dimensions to evaluate TOD success. Baseline data is needed to track future changes to ensure that goals are not achieved at the expense of some other unintended negative externality. Collecting data from both primary (ie. the TOD Household Survey) and secondary sources (ie. census) is often necessary. Secondary sources do not provide the coverage and scope of data needed to fully evaluate TOD from a sustainability perspective. It is also important to ensure that at least some of the data collected can be compared to regional or sub-regional averages.
4. Collect data at regular intervals to track success – Once the baseline data has been established, the only way to determine success is to collect the same data, using the same methodologies, at regular intervals. Change within the TOD could be compared to change within the region (or sub-region) to determine if the TOD is becoming more or less sus-tainable in comparison to the average.
5. Analysis of data should include local and regional stakeholders – A me-chanism needs to be established for local and regional stakeholders to discuss and debate the outcomes of the analysis. Local planners need to seek the input of the community and regional planners need to work col-laboratively across agencies and layers of government to ensure political coordination. The TOD Committee in Western Australia provides such a forum for Perth.

Transit-Oriented Development and Sustainability 147
Again, the goal for this study was not to create the definitive methodol-ogy to measure TOD success using a sustainability framework. The goal was to start a dialogue. Future studies should analyze which indicators are best, how many are needed, and how to best analyze the data once it has been collected. The terms sustainable development and transit oriented development have become quite popular with planners across most urban-ized areas, especially in Australia and North America. The problem is most studies focus too heavily on only one aspect of TOD success. This attempt admittedly has flaws as well, namely, what do you do when you have all of the data? How do you make decisions? Perhaps this tension is not so bad because it ensures that we are moving towards building cities based on a blend of political and data-driven analyses.
References
Banister, D., Pucher, J. and Lee-Gosselin, M. (2006) In Institutions and Sustain-able Transport: Regulatory Reform in Advanced Economies(Ed, Rietveld, P.) London, Edward Elgar.
Boarnet, M. G. and Crane, R. (2001) Travel by Design: The Influence of Urban Form on Travel, Oxford ; New York, Oxford University Press.
California Department of Transportation (2002a) Statewide Transit-Oriented De-velopment Study: Factors for Success in California, California Department of Transportation, Sacramento, California.
California Department of Transportation (2002b) Statewide Transit-Oriented De-velopment Study: Factors for Success in California, Technical Appendix, Cali-fornia Department of Transportation, Sacramento, California.
Center for Transit-Oriented Development (2004) Hidden in Plain Sight: Captur-ing the Demand for Housing Near Transit, Reconnecting America, Las Vegas, NM.
Cervero, R. (1994) Transport Policy, 1, 174-183. Cervero, R., Arrington, G. B., Smith-Heimer, J., Dunphy, R., Murphy, S., Ferrell,
C., Goguts, N., Tsai, Y.-H., Boroski, J., Golem, R., Peninger, P., Nakajima, E., Chui, E., Meyers, M., McKay, S. and Witenstein, N. (2004) Transit Ori-ented Development in America: Experiences, Challenges, and Prospects, TCRP Report 102, Washington, D.C., National Academy Press.
Cervero, R. and Duncan, M. (2002a) Journal of Public Transportation, 5, 1-18. Cervero, R. and Duncan, M. (2002b) Transportation Research Record, 1805, 8-
15. Chatman, D. G. (2006) Transit-Oriented Development and Household Travel: A
Study of California Cities (DRAFT), Institute of the Environment, Institute of Transportation Studies, Department of Urban Planning, School of Public Af-fairs, Los Angeles.
148 Transit-Oriented Development and Sustainability
City of Cleveland (2001) The Effect of Rail Transit on Property Values: A Sum-mary of Studies (Draft), Prepared by Parsons Brinkerhoff, Cleveland, Ohio.
Government of Western Australia (2003) Hope for the Future: The Western Aus-tralian State Sustainability Strategy, Department of the Premier and Cabinet, Perth.
Huang, H. (1996) Journal of Planning Literature, 11, 17-30. Levine, J. (2006) Zoned out: regulation, markets, and choices in transportation
and metropolitan land-use, Resources for the Future, Washington, DC. Levine, J. and Inam, A. (2004) Transportation, 31, 409-427. Loukaitou-Sideris, A. and Banerjee, T. (2000) Journal of Urban Design, 5, 101-
125. Lund, H., Cervero, R. and Willson, R. (2004) Travel Characteristics of Transit-
Oriented Development in California, Cal Poly Pomona, Pomona. Newman, P. and Kenworthy, J. R. (1999) Sustainability and cities : overcoming
automobile dependence, Washington, D.C., Island Press. Renne, J. (2005a) Transit-Oriented Development in Western Australia: Attitudes,
Obstacles, and Opportunities, Planning and Transport Research Centre, Perth, Western Australia.
Renne, J. (2005b) In Edward J. Bloustein School of Planning and Public Policy, New Brunswick, New Jersey, Rutgers University.
Renne, J. and Wells, J. S. (2003) Transit Villages in New Jersey: Public Opinion and Attitudes, Voorhees Transportation Center, New Brunswick, New Jersey, Rutgers University.
Renne, J. and Wells, J. S. (2005) Transit-Oriented Development: Developing a Strategy to Measure Success, Transportation Research Board of the National Academies, Washington, D.C., National Cooperative Highway Research Pro-gram.
Urban Land Institute and PriceWaterhouseCoopers (2005) Emerging Trends in Real Estate, Washington, D.C., Urban Land Institute.
Wells, J. S. and Renne, J. (2003) Transit Villages in New Jersey: Recommenda-tions for Assessment and Accountability, Alan M. Voorhees Transportation Center, New Brunswick, New Jersey, Rutgers University.