
Window Media Encoder Scorpio I Nyoman Nicharee Srirochanakul.

43
6. DAFTAR PUSTAKA
Adapa, S.,H.Dingeldein,K,A.Schmidt & T.J. Herald.(2000). Rheological Properties of
Ice Cream Mixes and Frozen Ice creams Containing Fat and Fat Replacers. Journals
of Dairy science 83: 2223-2229.
Apriyanto, A;D. Fardiaz; N.L. Puspitasari; Sedarnawati; dan S.Budiyanto. (1998).
Analisis Pangan. IPB Press,Bogor.
Arlyza I. S. (2005). Phycocyanin dari mikroalga bernilai ekonomis tinggi sebagai
produk industri, Oseana, vol. XXX, no. 3, hal. 27-36
Astawan, M.W. & M. Astawan.(1998). Teknologi Pengolahan Pangan Hewani Tepat
Guna. Akademi Pressindo Jakarta.
Atrika, B. (2011). Karakteristik Pigmen Fikosianin dari Spirulina fusiformis yang
Dikeringkan dan Diamobilisasi. Institut Pertanian Bogor.
Bennion, M, & O. Hughes. (1975). Introductory Foods. Macmillan Publishing
Co.Inc.New York
Ciferri O. 1983. Spirulina, the edible microorganism. Microbiol Rev 47:551-578
El-Baky HHA. 2003. Over production of phycocyanin pigment in blue green alga
Spirulina sp. And it’s Inhibitory effect on growth of Ehrlich Aschites Carcinoma
Cells. Journal Medical Science 3(4):314-324.
Farrow, J. & S.Lewis. (2000). Ice Cream and Iced Dessert. Lorenz Books. Annes
Publishing.Columbia.
Firdaus, Muhammad; Ahmad Fauzan, Cahya Lestari. (2011). Pengembangan Komoditas
Akuakultur Spirulina sebagai Super Food dalam Penanggulan Ancaman Gizi Buruk
dan Kerawanan Pangan di Indonesia.
Gaman, P. M. & K. B. Sherrington. (1994). Ilmu Pangan: Pengantar Ilmu Pangan,
Nutrisi dan Mikrobiologi Edisi kedua. Gadjah Mada University Press. Yogyakarta
Habib M. A & M. Parvin. (2008). A Review on Culture, Production and Use of
Spirulina As Food For Humans And Feeds For Domestic Animal and Fish. Food
And Agriculture Organization of Spirulina As Food For Humans and Feeds For
Domestic Animals and Fish

44
Kabinawa, I Nyoman K. (2006). Spirulina : Ganggang Penggempur Aneka Penyakit.
Ebook. PT Agromedia Pustaka. Jakarta
Kuncahyono I, Sunardi. (2007). Uji aktivitas antioksidan ekstrak belimbing wuluh
(Averhoa bilimbi. L) terhadap 1,1-diphenyl-2- picrilhidrazyl (DPPH). Seminar
Nasional Teknologi:1-9\
Marshall, R.,H.D. Goff, and R.W.Hartel. (2003). Ice Cream. Kluwer Academic Press,
NewYork,NY.
Meilgaard,M.,G.V.Civille & B.T.Carr.(1999).Sensory Evaluation Techniques 3rd
Edition.CRC Press.ASA.
Muse,M.R, & R.W. Hartel.(2004).Ice Cream Stuctural Element that Affect Melting
Rate and Hardness.J.Dairy Sci. 87:1-10.
Potter, N.N. & J.H.Hotchkiss.(1996). Food Science 5th
Edition. CBS Publisher and
Distribution.New Delhi.
Prindiville, E.A.,R.T. Marshall & H. Heymann. (2000). Effect of Milk Fat, Cocoa
Butter, and Whey Protein Fat Replacers On the Sensory Properties of Lowfat and
Nonfat Chocolate Ice Cream.J Dairy Science 83:2216-2223
Priyanka Malik; C. Kempanna; A. Paul (2013). Quality Characteristics of ice cream
enriched with Spirulina powder. International Journal of Food and Nutritional
Sciences. 2013, Vol.2,Iss.1. 44-50.
Rebecca Christiana; Hari Kristopo; Leenawaty Limantara (2008). Photodegradation And
Antioxidant Activity Of Chlorophyll A From Spirulina (Spirulina Sp.) Powder. Indo.
J. Chem., 2008, 8 (2), 236 - 241
Richmond,A., (1988) .Spirulina. In:Borowitzka,M.A.,Borowitzka,L.J.(Eds.), Micro
Alga l Biotechnology.CambridgeUniversityPress,Cambridge,pp.85/121.
Romay, Ch; R. Gonzalez; N. Ledon; D. Remirez and V. Rimbau. (2003). C-Phycocyanin:
A Biliprotein with Antioxidant, Anti-Inflammatory and Neuroprotective Effects.
Current Protein and Peptide Science, 2003, Vol. 4, No. 3. 209 – 216
Sri Sedjati; Ervia Yudianti; Suryono. (2012). Profil Pigmen Polar dan Non Polar
Mikroalga Laut Spirulina sp.dan Potensinya sebagai Pewarna Alami. Jurnal Ilmu
Kelautan September 2012. Vol. 17 (3) 176-181.

45
Spolaore, P., Joanis-Casson, C., Duran, E., Isant, A.(2006)., “Comercial Aplication of
Micro Alga”. Volume 101,journal of bioscience and bioenggenering.
Sunarni T. 2005. Aktivitas antioksidan penangkap radikal bebas beberapa kecambah
dari biji tanaman familia papilanoceae. Jurnal Farmasi Indonesia 2: 53-61.
Tietze, Harald W. (2004). Spirulina : Micro Food Macro Blessing 4th
edition. Harald
W. Tietze Publishing. Australia.

46
7. LAMPIRAN
Lampiran 1. Hasil analisa Spss
Hasil Analisa Sensori
Test of Homogeneity of Variances
Levene Statistic df1 df2 Sig.
Warna 1.596 7 272 .137
Rasa 1.423 7 272 .196
Tekstur 1.197 7 272 .305
Overall 3.507 7 272 .001
Friedman Test
Wilcoxon Signed Ranks Test
Ranks
N Mean Rank Sum of Ranks
Spirulina_1 - Spirulina_0.5 Negative Ranks 28a 19.25 539.00
Positive Ranks 7b 13.00 91.00
Ties 0c
Total 35
a. Spirulina_1 < Spirulina_0.5
b. Spirulina_1 > Spirulina_0.5
c. Spirulina_1 = Spirulina_0.5
Ranks
Mean Rank
Spirulina_0.5 4.97
Spirulina_1 2.99
Spirulina_1.25 3.66
Spirulina_1.5 3.89
fikosianin_0.5 4.00
Fikosianin_1 5.14
Fikosianin_1.25 6.21
Fikosianin_1.5 5.14
Test Statisticsa
N 35
Chi-Square 44.456
Df 7
Asymp. Sig. .000
a. Friedman Test

47

48

49

50

51
Tests of Normality
Perlakuan
Kolmogorov-Smirnova Shapiro-Wilk
Statistic df Sig. Statistic df Sig.
Hardness Kontrol .240 5 .200* .904 5 .430
spirulina 0,5% .329 5 .082 .785 5 .061
spirulina 1,5% .227 5 .200* .876 5 .290
Overrun Kontrol .223 5 .200* .888 5 .346
spirulina 0,5% .339 5 .061 .755 5 .033
spirulina 1,5% .181 5 .200* .988 5 .972
Visko_sebelum Kontrol .231 5 .200* .881 5 .314
spirulina 0,5% .279 5 .200* .766 5 .041
spirulina 1,5% .254 5 .200* .803 5 .086
Visko_sesudah Kontrol .231 5 .200* .881 5 .314
spirulina 0,5% .254 5 .200* .803 5 .086
spirulina 1,5% .300 5 .161 .833 5 .146
Time_to_melt kontrol .250 5 .200* .814 5 .105
spirulina 0,5% .241 5 .200* .821 5 .119
spirulina 1,5% .339 5 .062 .754 5 .033
a. Lilliefors Significance Correction
*. This is a lower bound of the true significance.
Test of Homogeneity of Variances
Levene Statistic df1 df2 Sig.
Hardness .084 2 12 .920
Overrun .168 2 12 .848
Visko_sebelum 11.207 2 12 .002
Visko_sesudah 1.460 2 12 .271
Time_to_melt 2.721 2 12 .106
ANOVA
Sum of Squares df Mean Square F Sig.
Hardness Between Groups 15149.589 2 7574.794 .153 .859
Within Groups 592209.907 12 49350.826
Total 607359.496 14
Overrun Between Groups 3343.545 2 1671.773 94.601 .000
Within Groups 212.062 12 17.672
Total 3555.608 14
Visko_sebelum Between Groups 1568.933 2 784.467 242.619 .000
Within Groups 38.800 12 3.233
Total 1607.733 14
Visko_sesudah Between Groups 270.933 2 135.467 90.311 .000
Within Groups 18.000 12 1.500
Total 288.933 14
Time_to_melt Between Groups 118.533 2 59.267 14.694 .001
Within Groups 48.400 12 4.033
Total 166.933 14

52
Post Hoc Tests
Homogeneous Subsets
Hardness
Duncan
Perlakuan N
Subset for alpha
= 0.05
1
spirulina 1,5% 5 1315.0480
kontrol 5 1343.0980
spirulina 0,5% 5 1391.9600
Sig. .612
Means for groups in homogeneous subsets are
displayed.
Overrun
Duncan
Perlakuan N
Subset for alpha = 0.05
1 2 3
kontrol 5 25.8340
spirulina 0,5% 5 35.8020
spirulina 1,5% 5 61.2900
Sig. 1.000 1.000 1.000
Means for groups in homogeneous subsets are displayed.
Visko_sebelum
Duncan
Perlakuan N
Subset for alpha = 0.05
1 2 3
kontrol 5 68.2000
spirulina 1,5% 5 76.4000
spirulina 0,5% 5 92.8000
Sig. 1.000 1.000 1.000
Means for groups in homogeneous subsets are displayed.
Visko_sesudah
Duncan
Perlakuan N
Subset for alpha = 0.05
1 2 3
spirulina 1,5% 5 26.0000
kontrol 5 30.8000
spirulina 0,5% 5 36.4000
Sig. 1.000 1.000 1.000
Means for groups in homogeneous subsets are displayed.
Time_to_melt
Duncan
Perlakuan N
Subset for alpha = 0.05
1 2
kontrol 5 52.6000
spirulina 1,5% 5 53.6000
spirulina 0,5% 5 59.0000
Sig. .446 1.000
Means for groups in homogeneous subsets are
displayed.
Pengujian Sifat Fisik Es Krim Fikosianin
Tests of Normality
Perlakuan
Kolmogorov-Smirnova Shapiro-Wilk
Statistic df Sig. Statistic df Sig.
Hardness kontrol .240 5 .200* .904 5 .430
fikosianin 1% .155 5 .200* .994 5 .991
fikosianin 1,25% .336 5 .067 .807 5 .093
Overrun kontrol .223 5 .200* .888 5 .346
fikosianin 1% .163 5 .200* .993 5 .990
fikosianin 1,25% .241 5 .200* .821 5 .119
Visko_sebelum kontrol .231 5 .200* .881 5 .314
fikosianin 1% .245 5 .200* .871 5 .272
fikosianin 1,25% .255 5 .200* .865 5 .247
Visko_sesudah kontrol .231 5 .200* .881 5 .314
fikosianin 1% .273 5 .200* .852 5 .201
fikosianin 1,25% .300 5 .161 .833 5 .146
Time_to_melt kontrol .250 5 .200* .814 5 .105
fikosianin 1% .254 5 .200* .803 5 .086
fikosianin 1,25% .250 5 .200* .814 5 .105
a. Lilliefors Significance Correction
*. This is a lower bound of the true significance.
Test of Homogeneity of Variances
Levene Statistic df1 df2 Sig.
Hardness 12.828 2 12 .001
Overrun .513 2 12 .611
Visko_sebelum 6.383 2 12 .013
Visko_sesudah .800 2 12 .472
Time_to_melt 1.572 2 12 .248
ANOVA
Sum of Squares df Mean Square F Sig.
Hardness Between Groups 417057.346 2 208528.673 9.953 .003
Within Groups 251412.545 12 20951.045
Total 668469.891 14
Overrun Between Groups 3886.305 2 1943.153 130.295 .000
Within Groups 178.962 12 14.913
Total 4065.267 14
Visko_sebelum Between Groups 1004.933 2 502.467 85.164 .000
Within Groups 70.800 12 5.900
Total 1075.733 14
Visko_sesudah Between Groups 582.400 2 291.200 218.400 .000
Within Groups 16.000 12 1.333
Total 598.400 14
Time_to_melt Between Groups 388.800 2 194.400 39.141 .000
Within Groups 59.600 12 4.967
Total 448.400 14
Post Hoc Tests
Homogeneous Subsets
Hardness
Duncan
Perlakuan N
Subset for alpha = 0.05
1 2
fikosianin 1,25% 5 955.2600
fikosianin 1% 5 1.0383E3
kontrol 5 1.3431E3
Sig. .382 1.000
Means for groups in homogeneous subsets are displayed.
Overrun
Duncan
Perlakuan N Subset for alpha = 0.05

53
Visko_sebelum
Duncan
Perlakuan N
Subset for alpha = 0.05
1 2 3
fikosianin 1,25% 5 53.6000
kontrol 5 68.2000
fikosianin 1% 5 72.8000
Sig. 1.000 1.000 1.000
Means for groups in homogeneous subsets are displayed.
Visko_sesudah
Duncan
Perlakuan N
Subset for alpha = 0.05
1 2
fikosianin 1,25% 5 30.0000
kontrol 5 30.8000
fikosianin 1% 5 43.6000
Sig. .295 1.000
Means for groups in homogeneous subsets are displayed.
Time_to_melt
Duncan
Perlakuan N
Subset for alpha = 0.05
1 2
kontrol 5 52.6000
fikosianin 1,25% 5 52.6000
fikosianin 1% 5 63.4000
Sig. 1.000 1.000
Means for groups in homogeneous subsets are displayed.
Pengujian Melting Rate
ANOVA
melting_rate
Pengujian Melting Rate
ANOVA
melting_rate
Sum of Squares df Mean Square F Sig.
Between Groups 1.146 2 .573 6.311 .002
Within Groups 17.433 192 .091
Total 18.579 194
Post Hoc Tests
Homogeneous Subsets
melting_rate
Duncan
Perlakuan N
Subset for alpha = 0.05
1 2
spirulina 0,5% 65 .3338
spirulina 1,5% 65 .4930
kontrol 65 .4997
Sig. 1.000 .900
Means for groups in homogeneous subsets are
displayed.
Oneway
ANOVA
Sum of Squares df Mean Square F Sig.
mr_20 Between Groups 99.233 2 49.617 38.413 .000
Within Groups 15.500 12 1.292
Total 114.733 14
MR_25 Between Groups 419.733 2 209.867 59.962 .000
Within Groups 42.000 12 3.500
Total 461.733 14
MR_30 Between Groups 388.233 2 194.117 23.411 .000
Within Groups 99.500 12 8.292
Total 487.733 14
Post Hoc Tests
Homogeneous Subsets
mr_20
Duncan
konsentrasi N
Subset for alpha = 0.05
1 2
soirulina 0,5% 5 .0000
kontrol 5 5.3000
spirulina 1,5% 5 5.6000
Sig. 1.000 .684
Means for groups in homogeneous subsets are
displayed.
MR_25
Duncan
konsentrasi N
Subset for alpha = 0.05
1 2
soirulina 0,5% 5 .0000
kontrol 5 10.8000
MR_25
Duncan
konsentrasi N
Subset for alpha = 0.05
1 2
soirulina 0,5% 5 .0000
kontrol 5 10.8000
spirulina 1,5% 5 11.6000
Sig. 1.000 .512
Means for groups in homogeneous subsets are
displayed.
MR_30
Duncan
konsentrasi N
Subset for alpha = 0.05
1 2
soirulina 0,5% 5 5.3000
spirulina 1,5% 5 15.5000
kontrol 5 16.6000
Sig. 1.000 .557
Means for groups in homogeneous subsets are
displayed.
ANOVA
Sum of Squares df Mean Square F Sig.
kontrol Between Groups 1210.375 5 242.075 41.263 .000
Within Groups 140.800 24 5.867
Total 1351.175 29
Spiru_0.5 Between Groups 117.042 5 23.408 312.111 .000
Within Groups 1.800 24 .075
Total 118.842 29
Spiru_1.5 Between Groups 1032.975 5 206.595 259.596 .000
Within Groups 19.100 24 .796
Total 1052.075 29
Fiko_1 Between Groups 88.167 5 17.633 156.741 .000
Within Groups 2.700 24 .112
Total 90.867 29
Fiko_1.25 Between Groups 1255.367 5 251.073 415.570 .000
Within Groups 14.500 24 .604
Total 1269.867 29

54
Post Hoc Tests
Homogeneous Subsets
kontrol
Duncan
waktu N
Subset for alpha = 0.05
1 2 3 4
5 menit 5 .0000
10 menit 5 .0000
15 menit 5 .0000
20 menit 5 5.3000
25 menit 5 10.8000
30 menit 5 16.6000
Sig. 1.000 1.000 1.000 1.000
Means for groups in homogeneous subsets are displayed.
Spiru_0.5
Duncan
waktu N
Subset for alpha = 0.05
1 2
5 menit 5 .0000
10 menit 5 .0000
15 menit 5 .0000
20 menit 5 .0000
25 menit 5 .0000
30 menit 5 5.3000
Sig. 1.000 1.000
Means for groups in homogeneous subsets are
displayed.
Means for groups in homogeneous subsets are
displayed.
Spiru_1.5
Duncan
waktu N
Subset for alpha = 0.05
1 2 3 4 5
5 menit 5 .0000
10 menit 5 .0000
15 menit 5 2.4000
20 menit 5 5.6000
25 menit 5 11.6000
30 menit 5 15.5000
Sig. 1.000 1.000 1.000 1.000 1.000
Means for groups in homogeneous subsets are displayed.
Fiko_1
Duncan
waktu N
Subset for alpha = 0.05
1 2
5 menit 5 .0000
10 menit 5 .0000
15 menit 5 .0000
20 menit 5 .0000
25 menit 5 .0000
30 menit 5 4.6000
Sig. 1.000 1.000
Means for groups in homogeneous subsets are
displayed.
Fiko_1.25
Duncan
waktu N
Subset for alpha = 0.05
1 2 3 4 5
5 menit 5 .0000
10 menit 5 .0000
15 menit 5 3.5000
20 menit 5 8.2000
25 menit 5 12.4000
30 menit 5 17.5000
Sig. 1.000 1.000 1.000 1.000 1.000
Means for groups in homogeneous subsets are displayed.
Oneway
ANOVA
Sum of Squares df Mean Square F Sig.
MRF_20 Between Groups 172.900 2 86.450 58.943 .000
Within Groups 17.600 12 1.467
Total 190.500 14
MRF_25 Between Groups 454.933 2 227.467 69.990 .000
Within Groups 39.000 12 3.250
Total 493.933 14
MRF_30 Between Groups 518.700 2 259.350 30.998 .000
Within Groups 100.400 12 8.367
Total 619.100 14
MRF_15 Between Groups 40.833 2 20.417 245.000 .000
Within Groups 1.000 12 .083
Total 41.833 14
Post Hoc Tests
Homogeneous Subsets
MRF_20
Duncan
Konsentrasi N
Subset for alpha = 0.05
1 2 3
soirulina 0,5% 5 .0000
Kontrol 5 5.3000
spirulina 1,5% 5 8.2000
Sig. 1.000 1.000 1.000
Means for groups in homogeneous subsets are displayed.
MRF_25
Duncan
Konsentrasi N
Subset for alpha = 0.05
1 2
soirulina 0,5% 5 .0000
kontrol 5 10.8000
spirulina 1,5% 5 12.4000
Sig. 1.000 .186
Means for groups in homogeneous subsets are displayed.
MRF_30
Duncan
konsentrasi N
Subset for alpha = 0.05
1 2
soirulina 0,5% 5 4.6000
kontrol 5 16.6000
spirulina 1,5% 5 17.5000
Sig. 1.000 .632
Means for groups in homogeneous subsets are displayed.

55
MRF_15
Duncan
konsentrasi N
Subset for alpha = 0.05
1 2
kontrol 5 .0000
soirulina 0,5% 5 .0000
spirulina 1,5% 5 3.5000
Sig. 1.000 1.000
Means for groups in homogeneous subsets are displayed.
Oneway
ANOVA
Sum of Squares df Mean Square F Sig.
mr_20 Between Groups 99.233 2 49.617 38.413 .000
Within Groups 15.500 12 1.292
Total 114.733 14
MR_25 Between Groups 419.733 2 209.867 59.962 .000
Within Groups 42.000 12 3.500
Total 461.733 14
MR_30 Between Groups 388.233 2 194.117 23.411 .000
Within Groups 99.500 12 8.292
Total 487.733 14
Post Hoc Tests
Homogeneous Subsets
mr_20
Duncan
konsentrasi N
Subset for alpha = 0.05
1 2
soirulina 0,5% 5 .0000
kontrol 5 5.3000
spirulina 1,5% 5 5.6000
Sig. 1.000 .684
Means for groups in homogeneous subsets are displayed.
MR_25
Duncan
konsentrasi N
Subset for alpha = 0.05
1 2
soirulina 0,5% 5 .0000
kontrol 5 10.8000
spirulina 1,5% 5 11.6000
Sig. 1.000 .512
Means for groups in homogeneous subsets are displayed.
MR_30
Duncan
konsentrasi N
Subset for alpha = 0.05
1 2
soirulina 0,5% 5 5.3000
spirulina 1,5% 5 15.5000
kontrol 5 16.6000
Sig. 1.000 .557
Means for groups in homogeneous subsets are displayed.
Pengujian Kandungan Fikosianin
ANOVA
Sum of Squares df Mean Square F Sig.
kontrol Between Groups 2.601 5 .520 11.685 .000
Within Groups 1.069 24 .045
Total 3.670 29
spirulina_0.5 Between Groups 30.013 5 6.003 71.255 .000
Within Groups 2.022 24 .084
Total 32.035 29
spirulina_1.5 Between Groups 66.610 5 13.322 234.406 .000
Within Groups 1.364 24 .057
Total 67.974 29
Fiko_1 Between Groups 49.953 5 9.991 369.316 .000
Within Groups .649 24 .027
Total 50.602 29
Fiko_1.25 Between Groups 28.986 5 5.797 144.195 .000
Within Groups .965 24 .040
Total 29.951 29
Post Hoc Tests
Homogeneous Subsets
Kontrol
Duncan
Hari N
Subset for alpha = 0.05
1 2 3
15 hari 5 2.2296
12 hari 5 2.4759 2.4759
0 hari 5 2.6678
3 hari 5 2.9439
9 hari 5 2.9662
6 hari 5 3.0468
Sig. .077 .163 .475
56
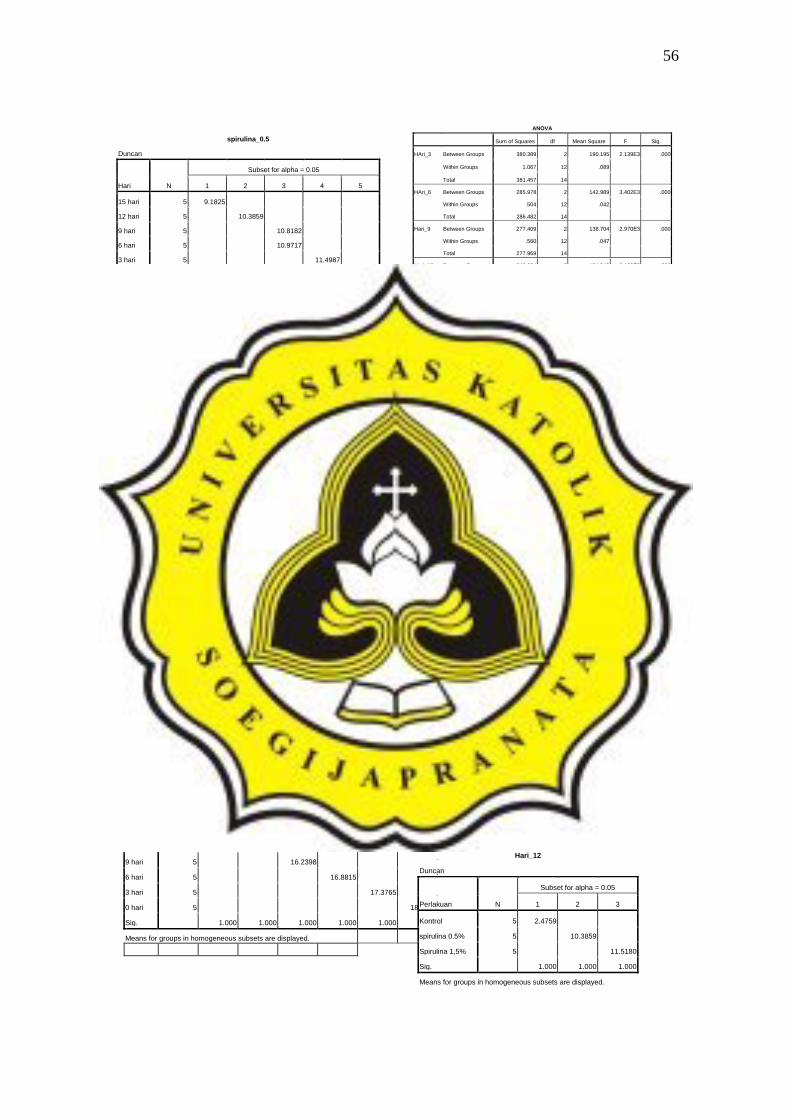
spirulina_0.5
Duncan
Hari N
Subset for alpha = 0.05
1 2 3 4 5
15 hari 5 9.1825
12 hari 5 10.3859
9 hari 5 10.8182
6 hari 5 10.9717
3 hari 5 11.4987
0 hari 5 12.4555
Sig. 1.000 1.000 .411 1.000 1.000
Means for groups in homogeneous subsets are displayed.
spirulina_1.5
Duncan
Hari N
Subset for alpha = 0.05
1 2 3
15 hari 5 11.2753
12 hari 5 11.5180
9 hari 5 12.9735
6 hari 5 13.2294
3 hari 5 14.9173
0 hari 5 15.1469
Sig. .121 .103 .141
Means for groups in homogeneous subsets are displayed.
Fiko_1
Duncan
Hari N
Subset for alpha = 0.05
1 2 3 4 5
15 hari 5 13.6948
12 hari 5 13.9018 13.9018
Fiko_1
Duncan
Hari N
Subset for alpha = 0.05
1 2 3 4 5
15 hari 5 13.6948
12 hari 5 13.9018 13.9018
9 hari 5 14.0185 14.0185
6 hari 5 14.1749
3 hari 5 15.8912
0 hari 5 17.2023
Sig. .058 .273 .146 1.000 1.000
Means for groups in homogeneous subsets are displayed.
Fiko_1.25
Duncan
Hari N
Subset for alpha = 0.05
1 2 3 4 5 6
15 hari 5 15.2665
12 hari 5 15.6314
9 hari 5 16.2398
6 hari 5 16.8815
3 hari 5 17.3765
0 hari 5 18.1068
Sig. 1.000 1.000 1.000 1.000 1.000 1.000
Means for groups in homogeneous subsets are displayed.
ANOVA
Sum of Squares df Mean Square F Sig.
HAri_3 Between Groups 380.389 2 190.195 2.139E3 .000
Within Groups 1.067 12 .089
Total 381.457 14
HAri_6 Between Groups 285.978 2 142.989 3.402E3 .000
Within Groups .504 12 .042
Total 286.482 14
Hari_9 Between Groups 277.409 2 138.704 2.970E3 .000
Within Groups .560 12 .047
Total 277.969 14
Hari_12 Between Groups 242.684 2 121.342 2.103E3 .000
Within Groups .692 12 .058
Total 243.376 14
HAri_0 Between Groups 431.283 2 215.641 4.545E3 .000
Within Groups .569 12 .047
Total 431.852 14
Hari_15 Between Groups 224.246 2 112.123 1.268E3 .000
Within Groups 1.061 12 .088
Total 225.307 14
Post Hoc Tests
Homogeneous Subsets
HAri_3
Duncan
Perlakuan N
Subset for alpha = 0.05
1 2 3
Kontrol 5 2.9439
spirulina 0.5% 5 11.4987
Spirulina 1,5% 5 14.9173
Sig. 1.000 1.000 1.000
Means for groups in homogeneous subsets are displayed.
HAri_6
Duncan
Perlakuan N
Subset for alpha = 0.05
1 2 3
Kontrol 5 3.0468
spirulina 0.5% 5 10.9717
Spirulina 1,5% 5 13.2294
Sig. 1.000 1.000 1.000
Means for groups in homogeneous subsets are displayed.
Hari_9
Duncan
Perlakuan N
Subset for alpha = 0.05
1 2 3
Kontrol 5 2.9662
spirulina 0.5% 5 10.8182
Spirulina 1,5% 5 12.9735
Sig. 1.000 1.000 1.000
Means for groups in homogeneous subsets are displayed.
Hari_12
Duncan
Perlakuan N
Subset for alpha = 0.05
1 2 3
Kontrol 5 2.4759
spirulina 0.5% 5 10.3859
Spirulina 1,5% 5 11.5180
Sig. 1.000 1.000 1.000
Means for groups in homogeneous subsets are displayed.

57
HAri_0
Duncan
Perlakuan N
Subset for alpha = 0.05
1 2 3
Kontrol 5 2.6678
spirulina 0.5% 5 12.4555
Spirulina 1,5% 5 15.1469
Hari_15
Duncan
Perlakuan N
Subset for alpha = 0.05
1 2 3
Kontrol 5 2.2296
spirulina 0.5% 5 9.1825
Spirulina 1,5% 5 11.2753
Sig. 1.000 1.000 1.000
Means for groups in homogeneous subsets are displayed.
ANOVA
Sum of Squares df Mean Square F Sig.
hari_0 Between Groups 750.719 2 375.359 8.420E3 .000
Within Groups .535 12 .045
Total 751.254 14
Hari_3 Between Groups 630.231 2 315.115 4.941E3 .000
Within Groups .765 12 .064
Total 630.996 14
HAri_6 Between Groups 537.599 2 268.799 6.179E3 .000
Within Groups .522 12 .044
Total 538.121 14
Hari_9 Between Groups 505.461 2 252.730 8.016E3 .000
Within Groups .378 12 .032
Total 505.839 14
Hari_12 Between Groups 511.015 2 255.508 1.678E4 .000
Within Groups .183 12 .015
Total 511.198 14
Hari_15 Between Groups 506.468 2 253.234 1.014E4 .000
Within Groups .300 12 .025
Total 506.768 14
Post Hoc Tests
Homogeneous Subsets
hari_0
Duncan
Perlakua
n N
Subset for alpha = 0.05
1 2 3
kontrol 5 2.6678
fiko_1 5 17.2023
Fiko_3 5 18.1068
Sig. 1.000 1.000 1.000
Means for groups in homogeneous subsets are displayed.
Hari_3
Duncan
Perlakua
n N
Subset for alpha = 0.05
1 2 3
kontrol 5 2.9439
fiko_1 5 15.8912
Fiko_3 5 17.3765
Sig. 1.000 1.000 1.000
Means for groups in homogeneous subsets are displayed.
HAri_6
Duncan
Perlakua
n N
Subset for alpha = 0.05
1 2 3
kontrol 5 3.0468
fiko_1 5 14.1749
Fiko_3 5 16.8815
Sig. 1.000 1.000 1.000
Means for groups in homogeneous subsets are displayed.
Hari_9
Duncan
Perlakua
n N
Subset for alpha = 0.05
1 2 3
kontrol 5 2.9662
fiko_1 5 14.0185
Fiko_3 5 16.2398
Sig. 1.000 1.000 1.000
Means for groups in homogeneous subsets are displayed.
Hari_12
Duncan
Perlakua
n N
Subset for alpha = 0.05
1 2 3
kontrol 5 2.4759
fiko_1 5 13.9018
Fiko_3 5 15.6314
Sig. 1.000 1.000 1.000
Means for groups in homogeneous subsets are displayed.
Hari_15
Duncan Hari_15
Duncan
Perlakua
n N
Subset for alpha = 0.05
1 2 3
kontrol 5 2.2296
fiko_1 5 13.6948
Fiko_3 5 15.2665
Sig. 1.000 1.000 1.000
Means for groups in homogeneous subsets are displayed.
58
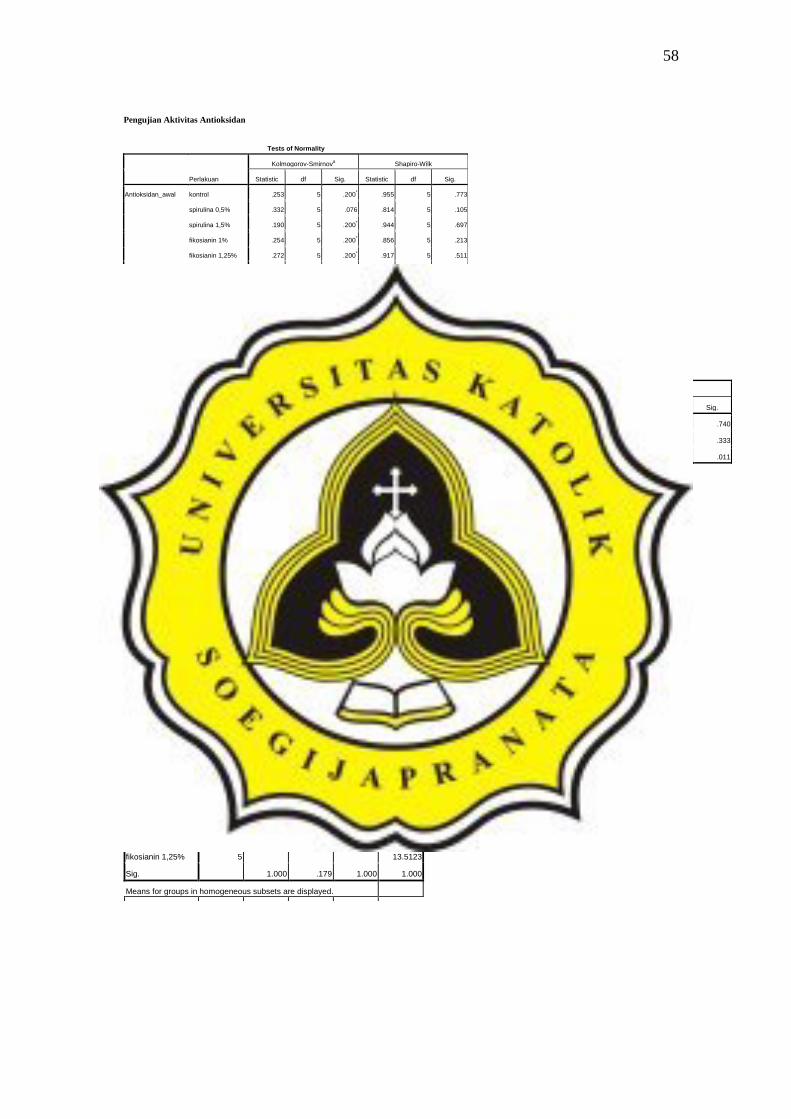
Pengujian Aktivitas Antioksidan
Tests of Normality
Perlakuan
Kolmogorov-Smirnova Shapiro-Wilk
Statistic df Sig. Statistic df Sig.
Antioksidan_awal kontrol .253 5 .200* .955 5 .773
spirulina 0,5% .332 5 .076 .814 5 .105
spirulina 1,5% .190 5 .200* .944 5 .697
fikosianin 1% .254 5 .200* .856 5 .213
fikosianin 1,25% .272 5 .200* .917 5 .511
Antioksidan_akhir kontrol .204 5 .200* .935 5 .631
spirulina 0,5% .243 5 .200* .829 5 .137
spirulina 1,5% .130 5 .200* .992 5 .986
fikosianin 1% .200 5 .200* .916 5 .507
fikosianin 1,25% .224 5 .200* .900 5 .411
a. Lilliefors Significance Correction
*. This is a lower bound of the true significance.
Test of Homogeneity of Variances
Levene Statistic df1 df2 Sig.
Antioksidan_awal .483 4 20 .748
Antioksidan_akhir .272 4 20 .893
Post Hoc Tests
Homogeneous Subsets
Antioksidan_awal
Duncan
Perlakuan N
Subset for alpha = 0.05
1 2 3 4 5
kontrol 5 3.8980
spirulina 0,5% 5 15.7460
spirulina 1,5% 5 20.1520
Post Hoc Tests
Homogeneous Subsets
Antioksidan_awal
Duncan
Perlakuan N
Subset for alpha = 0.05
1 2 3 4 5
kontrol 5 3.8980
spirulina 0,5% 5 15.7460
spirulina 1,5% 5 20.1520
fikosianin 1% 5 34.7000
fikosianin 1,25% 5 44.6260
Sig. 1.000 1.000 1.000 1.000 1.000
Means for groups in homogeneous subsets are displayed.
Antioksidan_akhir
Duncan
Perlakuan N
Subset for alpha = 0.05
1 2 3 4
kontrol 5 2.7966
spirulina 0,5% 5 6.0366
spirulina 1,5% 5 6.6744
fikosianin 1% 5 11.6180
fikosianin 1,25% 5 13.5123
Sig. 1.000 .179 1.000 1.000
Means for groups in homogeneous subsets are displayed.
Pengujian Stabilitas Fikosianin Pada Es Krim Spirulina
Tests of Normality
Perlakuan
Kolmogorov-Smirnova Shapiro-Wilk
Statistic df Sig. Statistic df Sig.
Kadar_fikosianin kontrol .102 30 .200* .977 30 .740
spirulina 0,5% .123 30 .200* .961 30 .333
spirulina 1,5% .172 30 .023 .905 30 .011
a. Lilliefors Significance Correction
*. This is a lower bound of the true significance.

59
Lampiran 2. Scoresheet Uji Sensori Penentuan Konsentrasi Spirulina
UJI RANGKING HEDONIK
Nama : Tanggal:
Produk : Es Krim Spirulina
Atribut : Warna
Instruksi:
Di hadapan Anda terdapat 8 macam sampel produk es krim dengan penggunaan
konsentrasi Spirulina yang berbeda. Amatilah warna dari masing-masing sampel secara
berurutan dari kiri ke kanan. Anda boleh mengulang sesering yang diperlukan. Setelah
mengamati semua sampel, berilah nilai sesuai dengan tingkat kesukaan Anda terhadap
warna sampel yang tersedia. Urutkan nilai sampel dari yang Anda paling sukai (=8)
hingga yang paling Anda tidak sukai (=1).
Kode Sampel Ranking (jangan sampai ada yang dobel)
..... .....
..... .....
.....
.....
….
….
….
….
.....
.....
….
….
….
….
Terima Kasih.

60
UJI RANGKING HEDONIK
Nama : Tanggal:
Produk : Es Krim Spirulina
Atribut : Rasa
Instruksi:
Di hadapan Anda terdapat 8 macam sampel produk Es krim dengan penggunaan
konsentrasi spirulina yang berbeda. Cicipilah rasa dari masing-masing sampel secara
berurutan dari kiri ke kanan. Anda boleh mengulang sesering yang diperlukan. Setelah
merasakan semua sampel, berilah nilai sesuai dengan tingkat kesukaan Anda terhadap
rasa sampel yang tersedia. Urutkan nilai sampel dari yang Anda paling sukai (=8)
hingga yang paling Anda tidak sukai (=1).
Kode Sampel Ranking (jangan sampai ada yang dobel)
..... .....
..... .....
.....
.....
….
….
….
….
.....
.....
….
….
….
….

61
UJI RANGKING HEDONIK
Nama : Tanggal:
Produk : Es Krim Spirulina
Atribut : Tekstur
Instruksi:
Di hadapan Anda terdapat 8 macam sampel produk Es Krim dengan penggunaan
konsentrasi spirulina yang berbeda. Rasakan Tekstur dari masing-masing sampel secara
berurutan dari kiri ke kanan. Anda boleh mengulang sesering yang diperlukan. Setelah
mengamati semua sampel, berilah nilai sesuai dengan tingkat kesukaan Anda terhadap
tekstur sampel yang tersedia. Urutkan nilai sampel dari yang Anda paling sukai (=8)
hingga yang paling Anda tidak sukai (=1).
Kode Sampel Ranking (jangan sampai ada yang dobel)
..... .....
..... .....
.....
.....
….
….
….
….
.....
.....
….
….
….
….

62
UJI RANGKING HEDONIK
Nama : Tanggal:
Produk : Es Krim Spirulina
Atribut : Overall
Instruksi:
Di hadapan Anda terdapat 8 macam sampel produk Es Krim dengan penggunaan
konsentrasi spirulina yang berbeda. Perhatikan keseluruhan parameter mutu seperti
warna, rasa, dan tekstur pada masing-masing sampel secara berurutan dari kiri ke kanan.
Anda boleh mengulang sesering yang diperlukan. Setelah mengamati semua sampel,
berilah nilai sesuai dengan tingkat kesukaan Anda terhadap overall sampel yang
tersedia. Urutkan nilai sampel dari yang Anda paling sukai (=8) hingga yang paling
Anda tidak sukai (=1).
Kode Sampel Ranking (jangan sampai ada yang dobel)
..... .....
..... .....
.....
.....
….
….
….
….
.....
.....
….
….
….
….
Terima Kasih.

63
Lampiran 3. Worksheet Uji Sensori Penentuan Konsentrasi Spirulina dan
fikosianin
Worksheet Uji Ranking Hedonik
Tanggal uji : 28 Juni 2013
Jenis sampel : Es Krim Spirulina
Identifikasi sampel Kode
Es Krim Spirulina 0,5 % A
Es Krim Spirulina 1 % B
Es Krim Spirulina 1,25 % C
Es Krim Spirulina 1,5 % D
Es Krim Fikosianin 0,5 % E
Es Krim Fikosianin 1 % F
Es Krim Fikosianin 1,25 % G
Es Krim Fikosianin 1,5 % H
Kode kombinasi urutan penyajian
ABCDEFGH = 1
BCDEFGHA = 2
CDEFGHAB = 3
DEFGHABC = 4
EFGHABCD = 5
FGHABCDE = 6
GHABCDEF = 7
HABCDEFG = 8

64
Penyajian
Booth Panelis Kode sampel urutan penyajian
I #1;9;17;25 591 636 415 383 975 257 723 4481
II #2;10;18;26 214 167 982 349 973 752 395 5242
III #3;11;19;27 851 789 543 468 235 667 174 9513
IV #4;12;20;28 669 438 743 122 811 227 453 9824
V #5;13;21;29 394 413 835 771 761 813 276 4555
VI #6;14;22;30 921 313 278 889 461 695 249 3746
VII #7;15;23 569 446 874 918 991 222 676 5597
VIII #8;16;24 811 225 373 768 792 633 461 5778
Rekap kode sampel
Sampel A 591 524 174 227 761 889 874 225
Sampel B 636 214 951 453 813 461 918 373
Sampel C 415 167 851 982 276 695 991 768
Sampel D 383 982 789 669 455 249 222 792
Sampel E 975 349 543 438 394 374 676 633
Sampel F 257 973 468 743 413 921 559 461
Sampel G 723 752 235 122 835 313 569 577
Sampel H 448 395 667 811 771 278 446 811