6 Annual Nutrition and Health Conference Diet and
75
6 th Annual Nutrition and Health Conference Diet and Cardiovascular Disease Prevention: An Update 5/12/09 Linda Van Horn, PhD, RD Professor and Interim Chair Department of Preventive Medicine Northwestern University Feinberg School of Medicine
Transcript of 6 Annual Nutrition and Health Conference Diet and
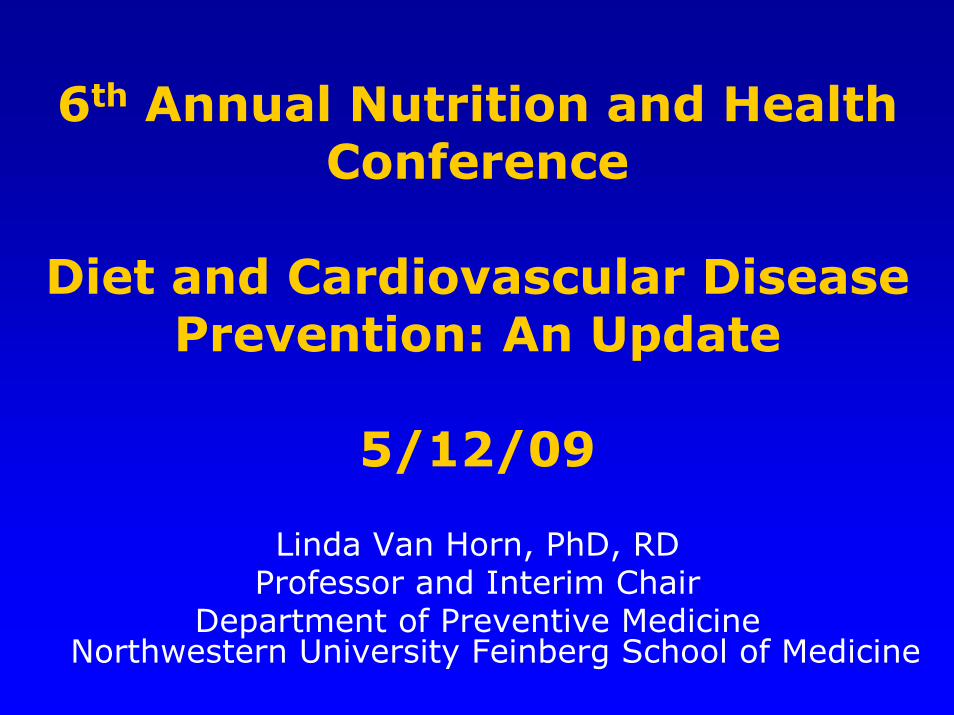
6th Annual Nutrition and Health Conference
Diet and Cardiovascular Disease Prevention: An Update
5/12/09
Linda Van Horn, PhD, RDProfessor and Interim Chair
Department of Preventive MedicineNorthwestern University Feinberg School of Medicine

Sponsored by
The University of ArizonaCollege of Medicine
at the Arizona Health Sciences Center

Disclosure
I have nothing to disclose

Objectives
• Review CVD statistics and current diet/lipid recommendations
• Consider emerging research
• Role of obesity/other risk factors
• Future directions

Cardiovascular Disease Mortality Trends for Males and Females (United States: 1979-2004)
Source: NCHS and NHLBI
380
400
420
440
460
480
500
520
79 80 85 90 95 00 04
Years
Dea
ths
in T
hous
ands
Males Females
0

Mean US Total Cholesterol Levels*: 1980-1982 vs. 2003-2006
NHANES III, 2008
Measure Men Women Men Women
Total cholesterol*
mg/dL 212 208 199.7 201.5
*Age Adjusted
1980-1982 2003-2006

Statistical Fact Sheet – Miscellaneous2007 Update*
Nutrition and Cardiovascular Diseases — Statistics
Source: NHANES (1999-2000), NCHS, 2003. Advance Data, Vital and Health Statistics, No. 334, April 17, 2003
Mean Dietary Intake of Energy and 10 Key Nutrients for Public Health
Total Population Males Females
Energy (kcal) 2,146 2,475 1,833
Protein, percent of calories 14.7% 14.9% 14.6%
Carbohydrate, percent of calories 51.9% 50.9% 52.8%
Total fat, percent of calories 32.7% 32.7% 32.6%
Saturated fat, percent of calories 11.2% 11.2% 11.1%
Cholesterol (mg) 265 307 225
Calcium (mg) 863 966 765
Folate micrograms (mcg) 361 405 319
Iron (mg) 15.2 17.2 13.4
Zinc (mg) 11.4 13.3 9.7
Sodium (mg) 3,375 3,877 2,896
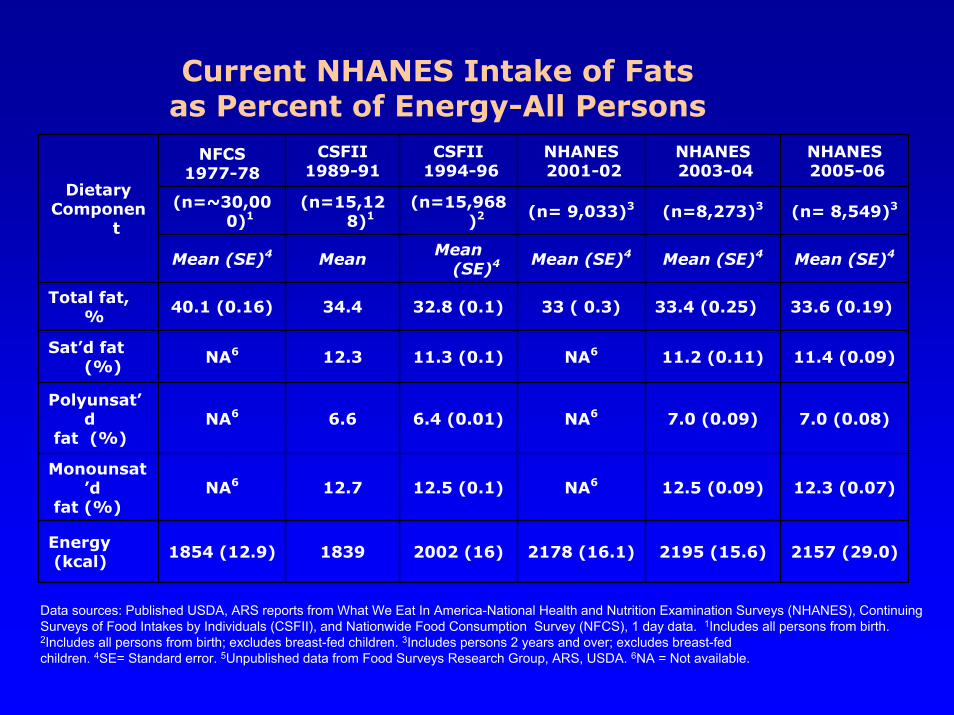
NFCS 1977-78
CSFII 1989-91
CSFII1994-96
NHANES2001-02
NHANES2003-04
NHANES2005-06
(n=~30,000)1
(n=15,128)1
(n=15,968)2 (n= 9,033)3 (n=8,273)3 (n= 8,549)3
Mean (SE)4 Mean Mean (SE)4 Mean (SE)4 Mean (SE)4 Mean (SE)4
Total fat, %
40.1 (0.16) 34.4 32.8 (0.1) 33 ( 0.3) 33.4 (0.25) 33.6 (0.19)
Sat’d fat (%) NA6 12.3 11.3 (0.1) NA6 11.2 (0.11) 11.4 (0.09)
Polyunsat’d
fat (%)NA6 6.6 6.4 (0.01) NA6 7.0 (0.09) 7.0 (0.08)
Monounsat’d
fat (%)NA6 12.7 12.5 (0.1) NA6 12.5 (0.09) 12.3 (0.07)
Energy(kcal) 1854 (12.9) 1839 2002 (16) 2178 (16.1) 2195 (15.6) 2157 (29.0)
DietaryComponen
t
Current NHANES Intake of Fats as Percent of Energy-All Persons
Data sources: Published USDA, ARS reports from What We Eat In America-National Health and Nutrition Examination Surveys (NHANES), Continuing Surveys of Food Intakes by Individuals (CSFII), and Nationwide Food Consumption Survey (NFCS), 1 day data. 1Includes all persons from birth. 2Includes all persons from birth; excludes breast-fed children. 3Includes persons 2 years and over; excludes breast-fed children. 4SE= Standard error. 5Unpublished data from Food Surveys Research Group, ARS, USDA. 6NA = Not available.

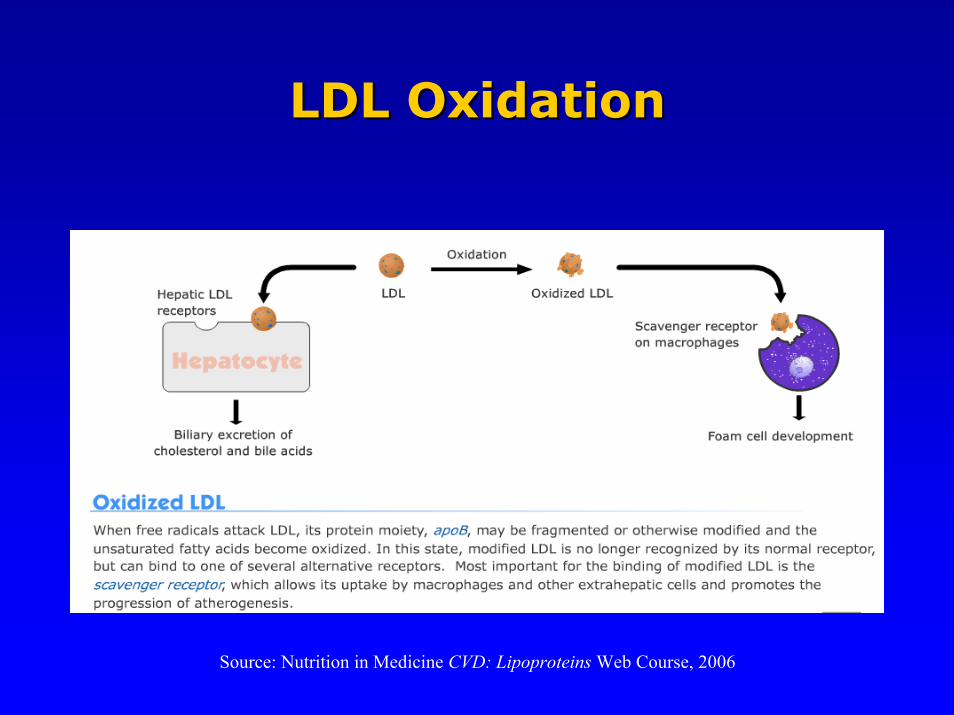
Source: Nutrition in Medicine CVD: Lipoproteins Web Course, 2006
Dietary Factors Influencing LDLDietary Factors Influencing LDL--CC
Source: Nutrition in Medicine CVD: Lipoproteins Web Course, 2006
LDL OxidationLDL Oxidation
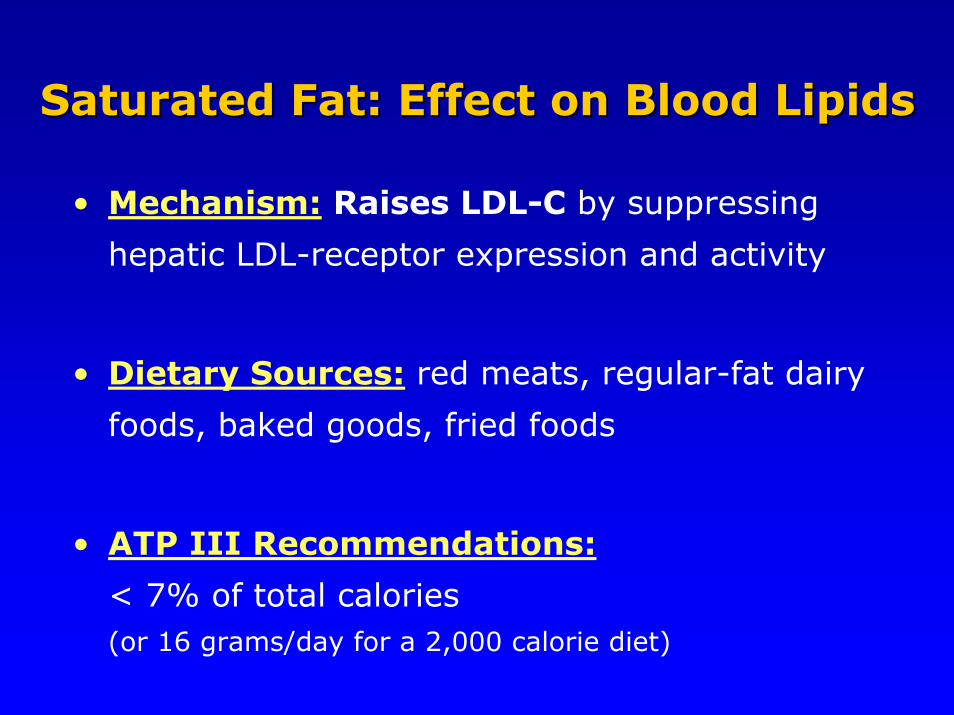
Saturated Fat: Effect on Blood LipidsSaturated Fat: Effect on Blood Lipids
• Mechanism: Raises LDL-C by suppressing
hepatic LDL-receptor expression and activity
• Dietary Sources: red meats, regular-fat dairy
foods, baked goods, fried foods
• ATP III Recommendations:
< 7% of total calories (or 16 grams/day for a 2,000 calorie diet)
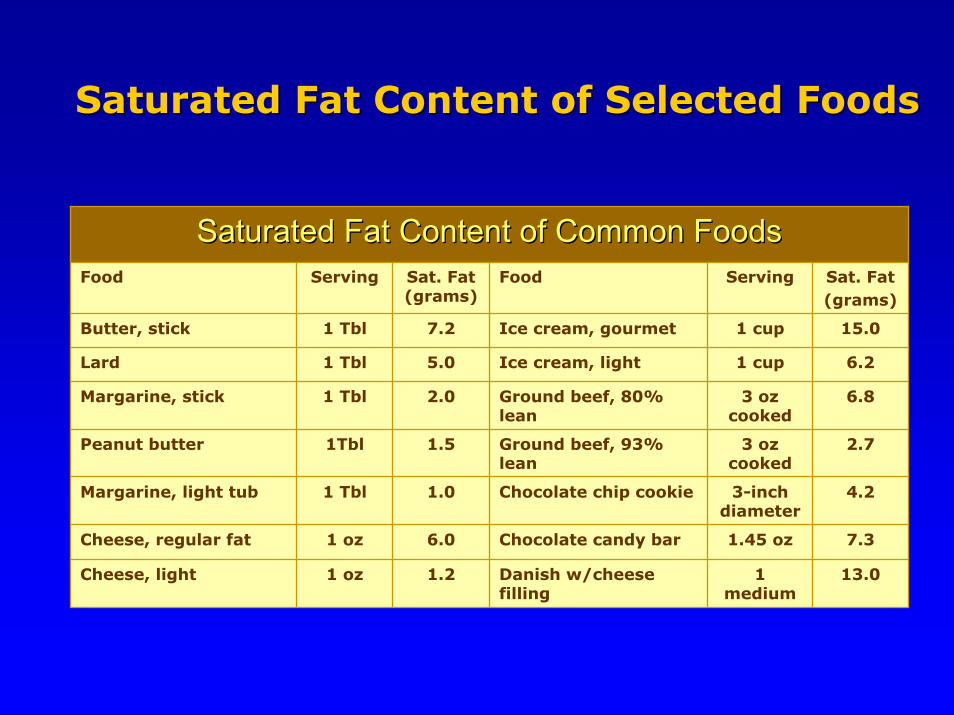
Saturated Fat Content of Common FoodsSaturated Fat Content of Common FoodsFood Serving Sat. Fat
(grams)Food Serving Sat. Fat
(grams)
Butter, stick 1 Tbl 7.2 Ice cream, gourmet 1 cup 15.0
Lard 1 Tbl 5.0 Ice cream, light 1 cup 6.2
Margarine, stick 1 Tbl 2.0 Ground beef, 80% lean
3 oz cooked
6.8
Peanut butter 1Tbl 1.5 Ground beef, 93% lean
3 oz cooked
2.7
Cheese, regular fat 1 oz 6.0 Chocolate candy bar 1.45 oz 7.3
Cheese, light 1 oz 1.2 Danish w/cheese filling
1 medium
13.0
Margarine, light tub 1 Tbl 1.0 Chocolate chip cookie 3-inch diameter
4.2
Saturated Fat Content of Selected FoodsSaturated Fat Content of Selected Foods

Dietary Cholesterol: Dietary Cholesterol: Effect on Blood LipidsEffect on Blood Lipids
• Mechanism: Raises LDL-C by down regulating
hepatic cholesterol receptors.
• Dietary sources: animal protein esp. red meat,
egg yolks, dairy foods, some baked goods & fried
foods.
• ATP III Recommendations:
< 200 mg/day

Keys Formula: Metabolic Ward “Feeding Study”
1.35 (2SFA – PFA) + 1.5 √ C
Different Fats Impact Blood Cholesterol Differently
SFA ↑PUFA ↓Dietary Cholesterol ↑
SFA = % Kcal Sat. Fat
PFA = % Kcal Poly. Fat
C = Diet Chol. in mg/4184 KJ

Blood Cholesterol: Diet–CHD Connection
• Studies in laboratory animals
• Epidemiological studies
– Between populations
– Within populations
• Genetic hypercholesterolemias
• Clinical Trials
Evidence Based on:

Monounsaturated Fat: Monounsaturated Fat: Effect on Blood LipidsEffect on Blood Lipids
• Mechanism: Lowers LDL-C
Neutral effect on HDL-C
• Dietary Sources: Olives, olive oil, peanuts,
peanut oil, avocadoes, canola oil
• ATP III Recommendations:
Up to 20% of total calories

MUFA Content of Common FoodsMUFA Content of Common FoodsFood Serving MUFA
(grams)Food Serving MUFA
(grams)
Olive Oil 1 Tbl 10 Almonds ¼ cup 11
Canola Oil 1 Tbl 8 Peanuts ¼ cup 9
Peanut Oil 1 Tbl 6 Peanut butter 2 Tbl 4
Grapeseed Oil 1 Tbl 2 Hazelnuts ¼ cup 17
Avocado 1 med 17 Olives 5 med 2
Monounsaturated Fat (MUFA) Monounsaturated Fat (MUFA) Content of Selected FoodsContent of Selected Foods

Polyunsaturated Fats: Polyunsaturated Fats: Effect on Blood LipidsEffect on Blood Lipids
• Effects:Omega-6: lowers LDL-C; may lower HDL-C
Omega-3: lowers triglycerides; slightly raises HDL-C
Also decreases platelet adhesion, improves endothelial
dysfunction, decreases vasoconstriction, reduces
inflammation and reduces risk of coronary thrombosis
• Dietary Sources:Omega-6: Soybean oil, safflower oil, corn oil
Omega-3: Salmon, herring, flax seeds, walnuts, canola oil
• ATP III Recommendations:Up to 10% of total calories; emphasis on eating two or more 4 oz
servings of fatty fish per week and walnuts, canola oils and other
plant fats rich in omega 3 fats

COOH
C20:5 ω-3 Eicosapentaenoic(EPA)
H3C
C18:3 ω-3
Omega 3 Fats
α-Linolenic• AntiAnti--arrhythmicarrhythmic•• AntiAnti--inflammatoryinflammatory
Polyunsaturated Fats
C22:6 ω-3 Docosahexaenoic(DHA)
COOHH3C
Fatty Fish and Fish Oil Capsules
H3CCOOH
Omega 6 Fats
C20:4 ω-6
C18:2 ω-6 Linoleic
Arachidonic
H3CCOOH
Corn, Safflower & Sunflower Oils
H3C COOH
Flaxseed, Canola & Soybean Oils
•• TGTG-- loweringlowering•• AntiAnti--arrthymicarrthymic•• AntiAnti--inflammatoryinflammatory
•• Platelet aggregationPlatelet aggregation•• VasoconstrictionVasoconstriction•• ProPro--inflammatoryinflammatory
º

OmegaOmega--3 PUFA Content of Selected Foods3 PUFA Content of Selected Foods
OmegaOmega--3 (N3 (N--3) Fat Content of Common Foods3) Fat Content of Common Foods
Animal Food Serving N-3 (grams)
Plant Food Serving N-3 (grams)
Salmon, Atlantic, wild 3 oz 2.3 Flax seed oil 1 Tbl 7
Salmon, Atlantic, farm raised
3 oz 1.9 Flax seeds, ground 1 Tbl 1.3
Rainbow Trout, fresh 3 oz 1.2 Walnuts 5 halves 0.9
Herring, pickled 3 oz 1.2 Canola oil 1 Tbl 1.3
Sardines 3 oz 1.4 Soybean oil 1 Tbl 0.9

Fish Figure
Risk of Sudden Death According toDietary Fish Intake in 20,551 MalePhysicians Followed for 11 Years
0
0.2
0.4
0.6
0.8
1
1.2
<1/mth 1-3/mth 1-<2/wk 2-<5/wk >5/wk
Age-adjustedMultivariate
* **
** signif icant, 95% CIdoes not contain 1.0
Source: Albert et al., 1998
Rel
ativ
e R
isk
Fishconsumption
*
JAMA 279:23-28
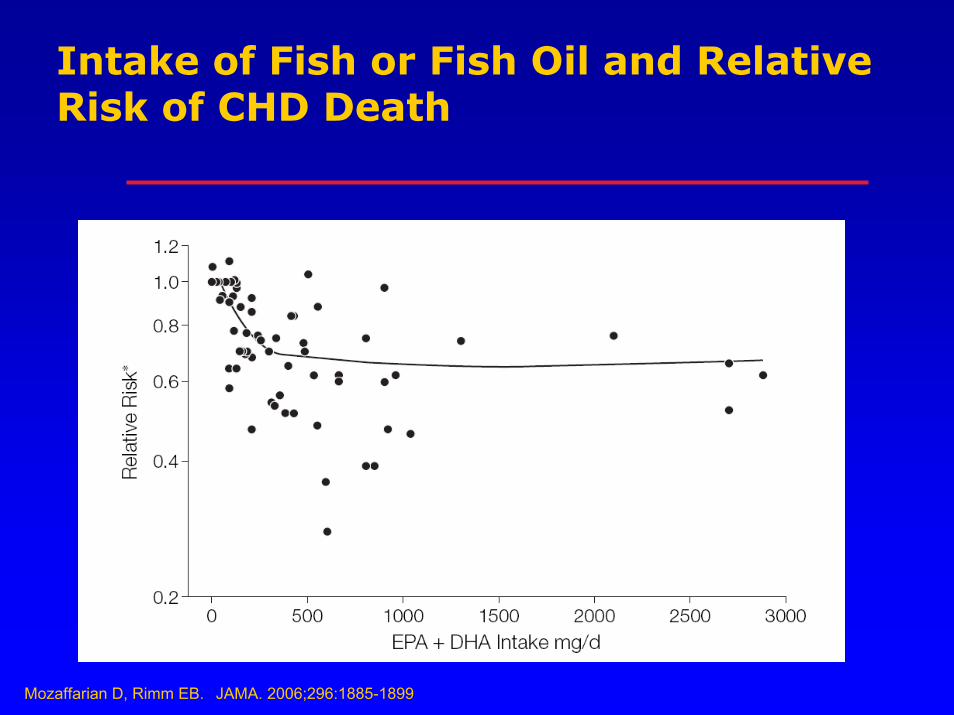
Intake of Fish or Fish Oil and Relative Risk of CHD Death
Mozaffarian D, Rimm EB. JAMA. 2006;296:1885-1899

OmegaOmega--3 PUFA and Mercury Content 3 PUFA and Mercury Content of Selected Fishof Selected Fish

Factors Influencing ALA Metabolism
• Diet rich in n-6 fatty acidsdecrease ALA conversion to EPA/DPA by ~ 40-50%
• Rate of ALA conversion to EPA < 10%
• Rate of ALA conversion to DHA is 0-9%
Br J Nutr. 2002;88(4):411-420; Am J Clin Nutr. 2004;80(5):1167-1174

Mozaffarian, D. et al. N Eng J Med 2006: 354:1601-13.
Trans Fat: Chemical StructureTrans Fat: Chemical Structure

Trans Fat: Effect on Blood LipidsTrans Fat: Effect on Blood Lipids
• Mechanism:
– Raises LDL-C , VLDL-C, triglycerides and Lipoprotein a
– Lowers HDL-C
• Other Physiological Effects:
– Increases inflammatory response
– Triggers endothelial dysfunction
– Increases levels of circulating adhesion molecules
• Dietary Sources: Fried foods, baked goods, snack items
• ATP III Recommendations:< 7% of total calories (saturated AND trans fat)

Mozaffarian, D. et al. N Eng J Med 2006: 354:1601-13
Trans Fat: Trans Fat: Effects on LipidsEffects on Lipids

Mozaffarian, D. et al. N Eng J Med 2006: 354:1601-13
Trans Fat:Trans Fat:Effects on Endothelial CellsEffects on Endothelial Cells

Mozaffarian, D. et al. N Eng J Med 2006: 354:1601-13
Trans Fat:Trans Fat:Effects on Effects on AdipocytesAdipocytes

Mozaffarian, D. et al. N Eng J Med 2006: 354:1601-13
Trans Fat:Trans Fat:Effects on Effects on MonocyteMonocyte & Macrophage Activity& Macrophage Activity
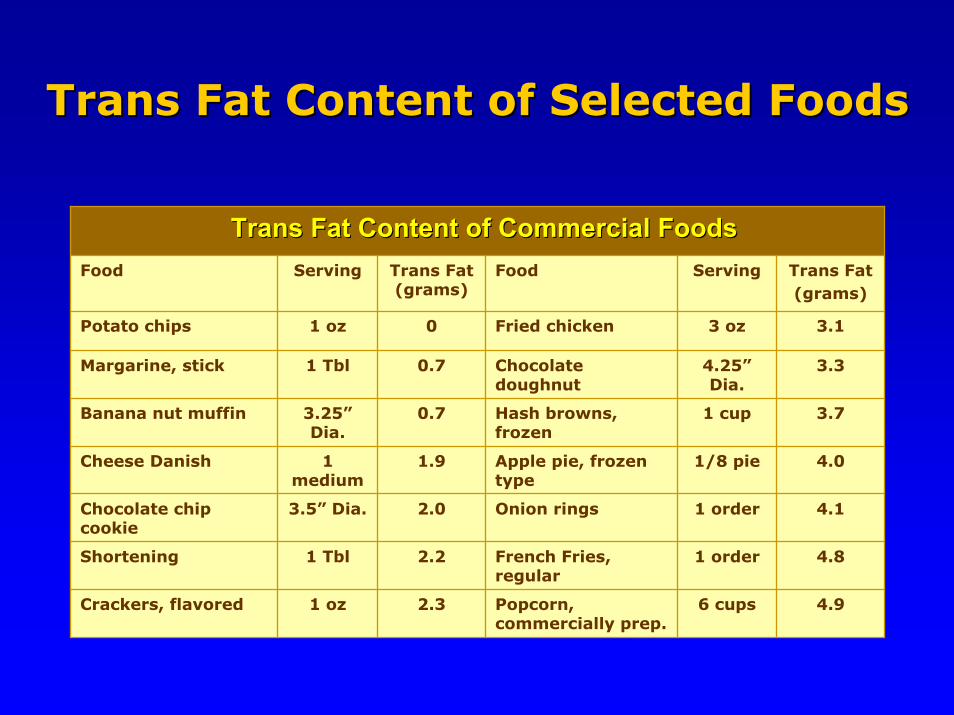
Trans Fat Content of Selected FoodsTrans Fat Content of Selected Foods
Trans Fat Content of Commercial FoodsTrans Fat Content of Commercial FoodsFood Serving Trans Fat
(grams)Food Serving Trans Fat
(grams)
Potato chips 1 oz 0 Fried chicken 3 oz 3.1
Margarine, stick 1 Tbl 0.7 Chocolate doughnut
4.25”Dia.
3.3
Banana nut muffin 3.25”Dia.
0.7 Hash browns, frozen
1 cup 3.7
Cheese Danish 1 medium
1.9 Apple pie, frozen type
1/8 pie 4.0
Shortening 1 Tbl 2.2 French Fries, regular
1 order 4.8
Crackers, flavored 1 oz 2.3 Popcorn, commercially prep.
6 cups 4.9
Chocolate chip cookie
3.5” Dia. 2.0 Onion rings 1 order 4.1

Adult Treatment Panel IV (ATP IV) Guidelines expected in 2010
National Cholesterol Education Program
Source: NHLBI, National Cholesterol Education Program, available at http://hp2010.nhlbihin.net/ncep_slds/menu.htm#2

ATP III Therapeutic Lifestyle ChangesNutrient Composition of TLC Diet
Nutrient Recommended Intake• Saturated fat Less than 7% of total calories• Polyunsaturated fat Up to 10% of total calories• Monounsaturated fat Up to 20% of total calories• Total fat 25–35% of total calories• Carbohydrate 50–60% of total calories• Fiber 20–30 grams per day• Protein Approximately 15% of total
calories• Cholesterol Less than 200 mg/day• Total calories (energy) Balance energy intake and
expenditure to maintain desirable body weight/ prevent weight gain
Source: NHLBI, National Cholesterol Education Program, available at http://hp2010.nhlbihin.net/ncep_slds/menu.htm#2

Soluble fiberbinds with both:
1. Hepatic cholesterol 2. Dietary cholesterol
in the small intestine,both which are event-ually eliminated out ofthe body.
♥ 3-5% LDL-C lowering expected.
Hepatic Cholesterol
Dietary Cholesterol
ATP III Dietary Adjuncts: ATP III Dietary Adjuncts: Soluble (Viscous) FiberSoluble (Viscous) Fiber
• Soluble fiber has greater LDL-lowering potential than insoluble fiber.
• A high fiber diet (both soluble and insoluble fiber) is inversely associated with CHD.

• Plant stanol esters block entry of most cholesterol into micelle– Dietary Cholesterol– Biliary Cholesterol
• Cholesterol absorption is reduced by 50%.
• Blocked cholesterol and plant stanol are eliminated from body.
• Commercial stanols: Take Control and Benecol nonhydrogenated tub margarines.
Stanol esterCholesterol
ATP III Dietary Adjuncts: Plant StanolsATP III Dietary Adjuncts: Plant Stanols

Sterols & Stanols: Clinical Considerations
• 1-3 grams/day of plant sterols & stanols esters are effective in lowering LDL-C by 6-15%.
• No effect on HDL-C and TG.
• Because enriched foods are calorie dense, they must be substituted for other fatty foods as part of a diet low in cholesterol and saturated fat.
• Plant stanol esters are safe and effective in combination with statins and should be considered, along with a low fat diet and/or in combination with lipid-lowering medications, for patients with hypercholesterolemia.
Thompson,GR and Grundy, SM. Am J Cardiol 2005; 96(suppl): 3D-9D).

Dietary Component
Meets Dietary Goal
Approximate LDL Reduction
Major ComponentSaturated & trans fats <7% of calories 8-10%
Dietary cholesterol <200 mg/day 3-5%
Weight reduction Lose 10 lbs 5-8%
Other LDL-lowering options
Viscous fiber 5-10 g/day 3-5%
Plant sterol/stanol esters 2 g/day 11-14%
Cumulative estimate 30- 40%
ATPIII Final Report in Circulation 2002; 106: 3143-421; Guigliano, D et al. J Am College of Cardio 2006; 48: 677-85.
Cumulative Benefit of Dietary Factors Cumulative Benefit of Dietary Factors on LDLon LDL--C ReductionC Reduction

Cardiovascular Nutrition
20th CenturyFat-Cholesterol Focused
Single Nutrient
Reduce/Omit Approach
- Total Fat- Saturated Fat
- Trans fat- Cholesterol
- Salt
21st CenturyBenefit Focused:
Dietary Pattern Approach
-Lyon Diet-Mediterranean Diet-Fish: omega-3 fats-Fiber/whole grains -Nuts-Fruits & Vegetables-Low fat dairy-Olive oil
Adapted from McCulloch, 2004
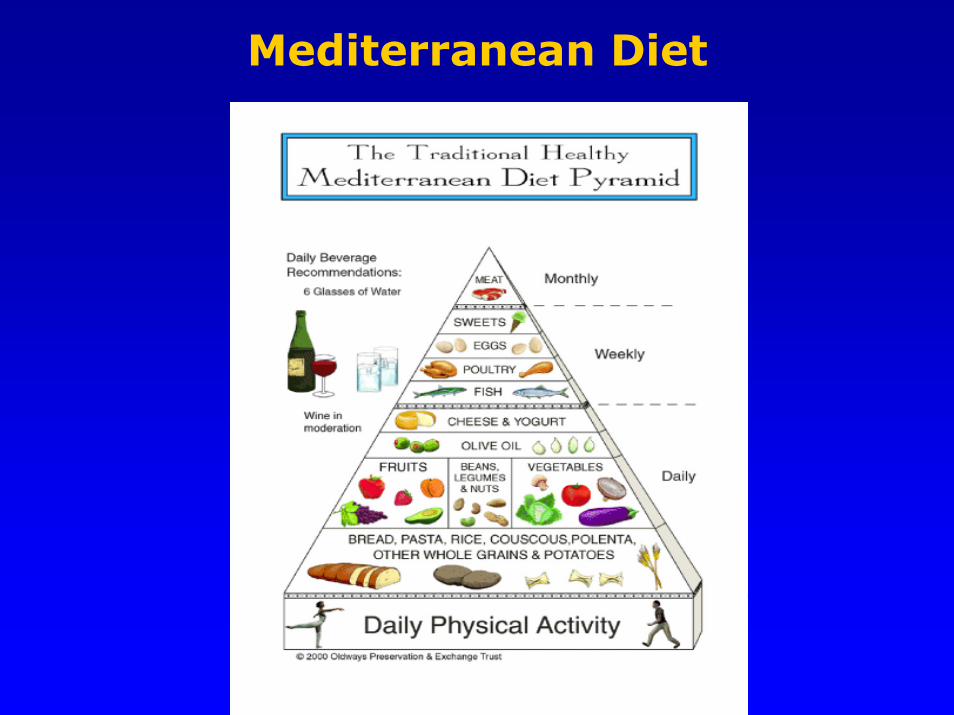
Mediterranean Diet

Selected Nutrition Studies Selected Nutrition Studies Showing Reduced Risk of CVDShowing Reduced Risk of CVD
Hu, F. ADAJ, 2005;105:111.
• OSLO: Lowered Fat and Cholesterol (1960-1970)
• Multiple Risk Factor Intervention Trial (MRFIT):
Lower Fat and Cholesterol (1970-1980)
• Dietary Approaches to Stopping Hypertension
(DASH): Increase Fruits and Vegetables, Low Fat
Dairy, Lower Sodium (1990-2000)
• PREMIER: Free living version of DASH (1990-2000)
• OmniHeart: CHO vs PRO vs MUFA

OmniHeart Randomized Trial
• Objective: To compare effects of 3 healthful diets each with reduced SFA on BP and serum lipids.
• Design: Randomized 3 Period Crossover Feeding Study; Baltimore and Bostonn=164 prehypertensive and hypertensive patients6 week feeding cycle
• Interventions: Three Dietso High CHOo High PRO (1/2 veg pro)o High MUFA
Appel, LJ et al. JAMA. 2005;294:2455-2464.

OmniHeart Randomized Trial(continued)
All three diets associated with reduced BP vs. Baseline
•PRO vs. CHO Diet:-Further reduced SBP 1.4mm Hg (P=.002) and 3.5mm Hg (P=.006) for those with HTN
-LDL-C ↓ 3.3mg/dL (P=.01) and TG ↓ 15.7 mg/dL (p<.001)
•MUFA vs CHO Diet:-Reduced SBP by 1.3 mm Hg (p=.005) and 2.9 mm Hg (p=.02) in HTN
-No effect on LDL and ↑ HDL by 1.1 mg/dL (p=.03) and ↓ TG by 9.6 mg/dL (P=.02)
Results
Appel, LJ et al. JAMA. 2005;294:2455-2464.

OmniHeart Randomized Trial (continued)
Diet can effectively lower BP, LDL-C, TG and increase HDL-C via changes in food patterns and adherence to dietary recommendations.
Appel, LJ et al. JAMA. 2005;294:2455-2464.
Conclusion

Other Dietary Considerations in the Prevention & Treatment of CVD
• Quality and Quantity of Carbohydrate
• Glycemic Index/Glycemic Load
• Antioxidants
• Sugar and High Fructose Corn Syrup
• Vitamin D
Hu, F. ADAJ, 2005;105:111.
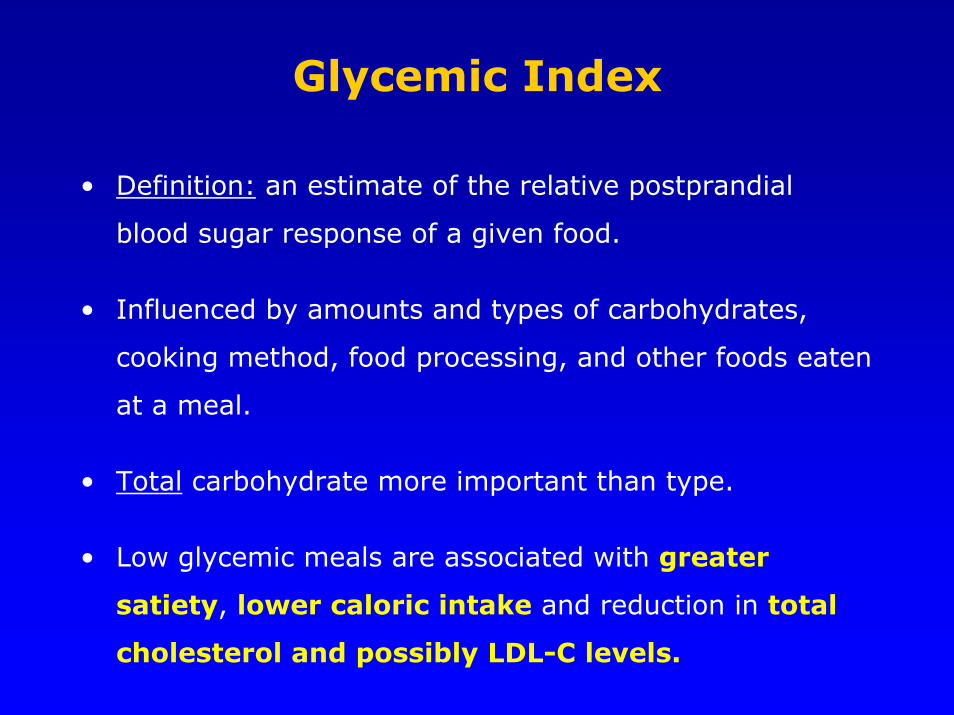
Glycemic Index
• Definition: an estimate of the relative postprandial
blood sugar response of a given food.
• Influenced by amounts and types of carbohydrates,
cooking method, food processing, and other foods eaten
at a meal.
• Total carbohydrate more important than type.
• Low glycemic meals are associated with greater
satiety, lower caloric intake and reduction in total
cholesterol and possibly LDL-C levels.

Glycemic Index v. Glycemic Load
Glycemic Index Glycemic LoadRepresents the blood sugar response to ingestion of a 50g carbohydrate portion of a given food tested expressed as a percent of the response to the same amount of carbohydrate from white bread or pure glucose consumed by the same subject.
Represents the quality and quantity of carbohydrates consumed ORthe glycemic index of a food multiplied by the amount of carbohydrates per serving.
Types of carbohydrate consumed, food preparation/cooking method and meal composition all influence blood sugar response.
Calculatiing Glycemic LOAD:
Glycemic Index x Amt Carbs (grams)100
Glycemic INDEX Ranking:0-55= Low56-70= Medium71+ = High
Glycemic LOAD Ranking:0-10= Low11-19= Medium20+ = High

Antioxidants: Proposed Mechanism
Diaz MN, N Engl J Med 1997; 337:408-416.
Dietary Antioxidants:
• Vitamins C & E
• Phytochemicals

Vitamin Supplements and CVD Risk
Source: American Heart Association Meeting Report 11/13/2006
Women’s Antioxidant and Folic Acid Cardiovascular Study:• Randomized clinical trial studying female health
professionals 40 years or older who had a history of CVD or those with at least 3 CVD risk factors.
• 5422 women took either a placebo or combination of folic acid, vitamin B6 and vitamin B12 for 7.3 years.
• 8171 females took either a placebo or vitamin C, vitamin E or beta-carotene for 9.4 years.
• Results: NO CVD benefit from taking ANY of the vitamin supplements.

US Trends in High Fructose Corn Syrup Consumption

• Fructose metabolism may promote lipogenesisby increasing postprandial TG levels and decreasing satiety hormone leptin.
• Individuals who drink sugary beverages do not compensate for their calories in other ways and may actually increase their desire to consume more sugary foods/beverages.
High Fructose Corn Syrup:Health Implications
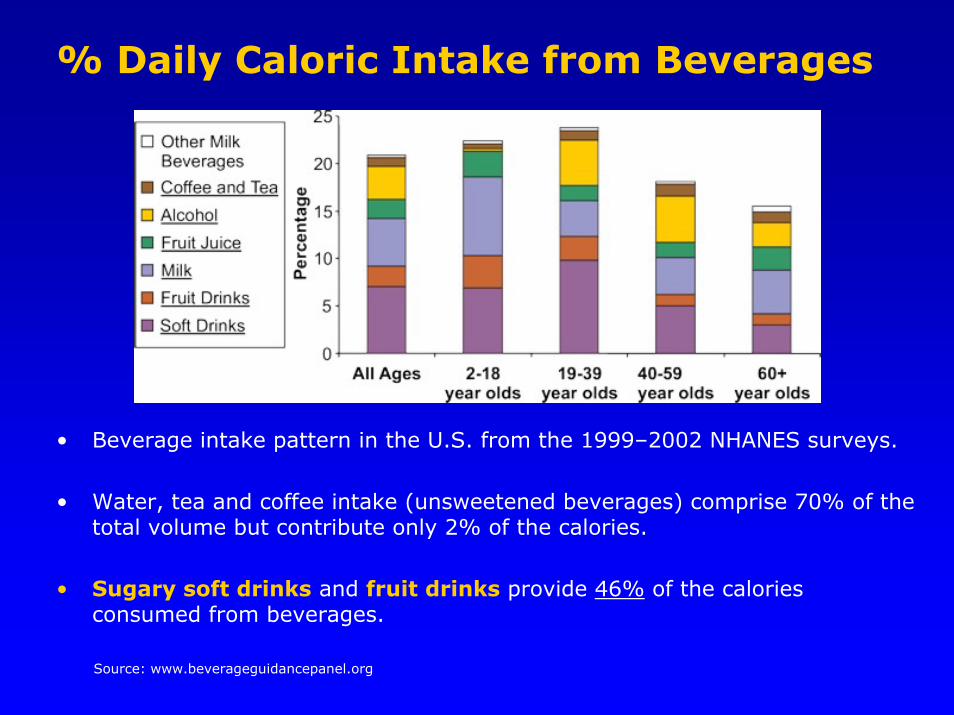
% Daily Caloric Intake from Beverages
• Beverage intake pattern in the U.S. from the 1999–2002 NHANES surveys.
• Water, tea and coffee intake (unsweetened beverages) comprise 70% of the total volume but contribute only 2% of the calories.
• Sugary soft drinks and fruit drinks provide 46% of the calories consumed from beverages.
Source: www.beverageguidancepanel.org
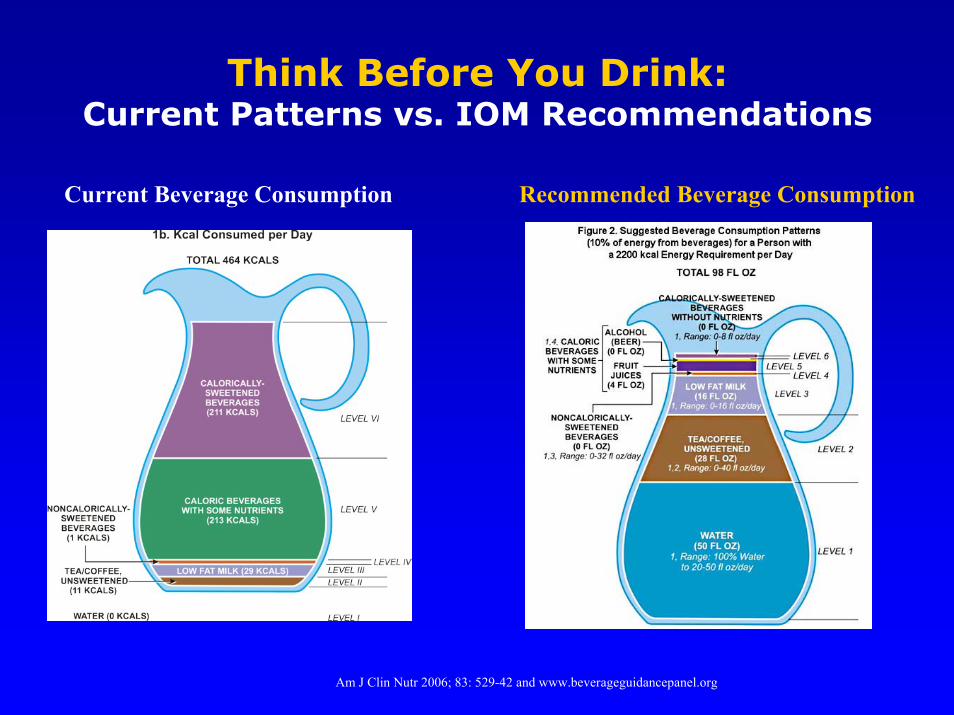
Think Before You Drink:Current Patterns vs. IOM Recommendations
Am J Clin Nutr 2006; 83: 529-42 and www.beverageguidancepanel.org
Current Beverage Consumption Recommended Beverage Consumption
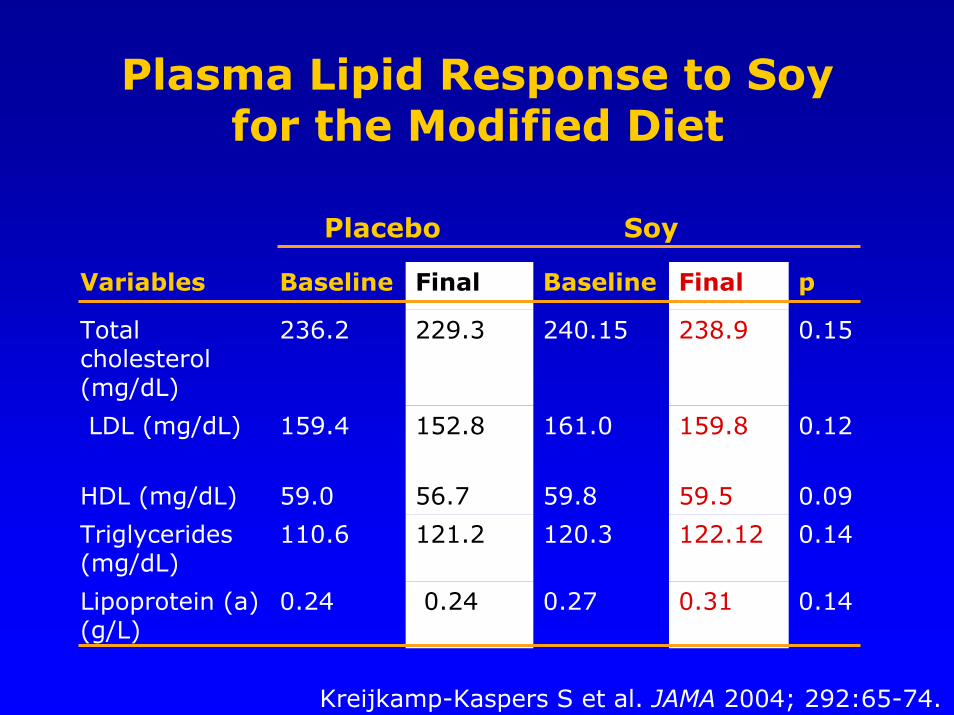
Plasma Lipid Response to Soy for the Modified Diet
Variables Baseline Final Baseline Final p
Total cholesterol (mg/dL)
236.2 229.3 240.15 238.9 0.15
LDL (mg/dL) 159.4 152.8 161.0 159.8 0.12
HDL (mg/dL) 59.0 56.7 59.8 59.5 0.09
Triglycerides (mg/dL)
110.6 121.2 120.3 122.12 0.14
Lipoprotein (a) (g/L)
0.24 0.24 0.27 0.31 0.14
Kreijkamp-Kaspers S et al. JAMA 2004; 292:65-74.
Placebo Soy

Prospective Cohort Studies of CVD and Consumption of Nuts, Fruits and Vegetables,
or Whole Grains
• Nuts– Albert et al, 2002– Ellsworth et al, 2001– Brown et al, 1999*– Hu et al, 1998– Fraser and Shavlik, 1997– Fraser et al, 1992
• Fruits & Vegetables– Bazzano et al, 2002– Liu et al, 2000– Joshipura et al, 1999– Gaziano et al, 1995– Gillman et al, 1995– Knekt et al, 1994*
• Whole Grains– Lutsey et al, 2007– Jensen, AK et al, 2006– Liu et al, 2000– Liu et al, 1999
Relative Risks (RR) and 95% Confidence Intervals (CI) between the incidence rates of the highest versus lowest consumption group. Data adjusted for nondietary and/or dietary covariates. Asterick means no CI was published in the article. Hu et al., JAMA, 2002, 288:2569-2578

Classification and Management of Adult Blood Pressure
BPClassification SBP, mm Hg DBP, mm Hg
LifestyleModification
Normal <120 <80 Encourage
Prehypertension 120-139 80-89 Yes
Stage 1hypertension 149-159 90-99 Yes
Stage 2hypertension
≥160 ≥100 Yes
Chobanian A V, et al. JAMA. 2003;289:2560-2572. (Copyright © 2003 American Medical Association. (All rights reserved)

Effect on systolic BP for lower vsintermediate vs higher sodium intakes in
the DASH diet vs control diet arms
Bray GA et al. Am J Cardiol 2004; 94:222-227.
Group 23-41 years
42-47 years
48-54 years
55-76 years
Control diet
•Lower vs higher -4.8 -5.9 -7.5 -8.1
•Lower vs intermed -3.6 -3.7 -5.3 -5.2
•Intermed vs higher -1.2 -2.2 -2.1 -2.8
DASH diet
•Lower vs higher -1.0 -1.8 -4.3 -6.0
•Lower vs intermed +0.8 -1.3 -2.6 -4.3
•Intermed vs higher -1.8 -0.5 -1.7 -1.7

Physiological Effects of Dietary Sodium
Increased SNS Activity
Sodium/Fluid Retention
Salt Sensitivity
Potassium, Calcium Intakes
Glycemic Load
Renal Disease, Left Ventricular Hypertrophy,Cerebrovascular Disease
Target OrganDamage
High Sodium Intake

Definition: Salt-Sensitivity
•• Response defined as:Response defined as:– 10 mm Hg increase with sodium loading following
a period of sodium restrictionOR – 5% increase in BP with sodium repletion following restriction
•• Estimated prevalence Estimated prevalence – 30-50% of hypertensives
– 15-20% of normotensives
•• Highest prevalence associated with:Highest prevalence associated with:– obesity– African-American– diabetes (type II)– age > 65 years– family history of hypertension

Dietary Sodium
Source: Nutrition in Medicine CVD: Hypertension & Other Risk Factors Web Course, 2006

Sodium Guidelines
2262
2819
3427 3375
1500
2300
1000
1500
2000
2500
3000
3500
1970 1980 1990 2000 AI UL
Sodi
um In
take
(mg/
day)
AI = Adequate intakeUL = Tolerable upper intake
Sources: Am J Clin Nutr. 2005;81:941-2. Institute of Medicine Recommended Intakes

Vascular Effects of Potassium
•• Determines resting membrane potentialDetermines resting membrane potential(plasma potassium:intracellular potassium)
– influences force and timing of cardiac/vascular muscle contractions
– altered by changes in extracellular [Na+] and [Ca+2]
•• Impacts capacitance of blood vesselsImpacts capacitance of blood vessels– How responsive peripheral vasculature will be to
changes in plasma volume.– Enables blood pressure to be maintained within a narrow
range over wide variations in plasma volume.
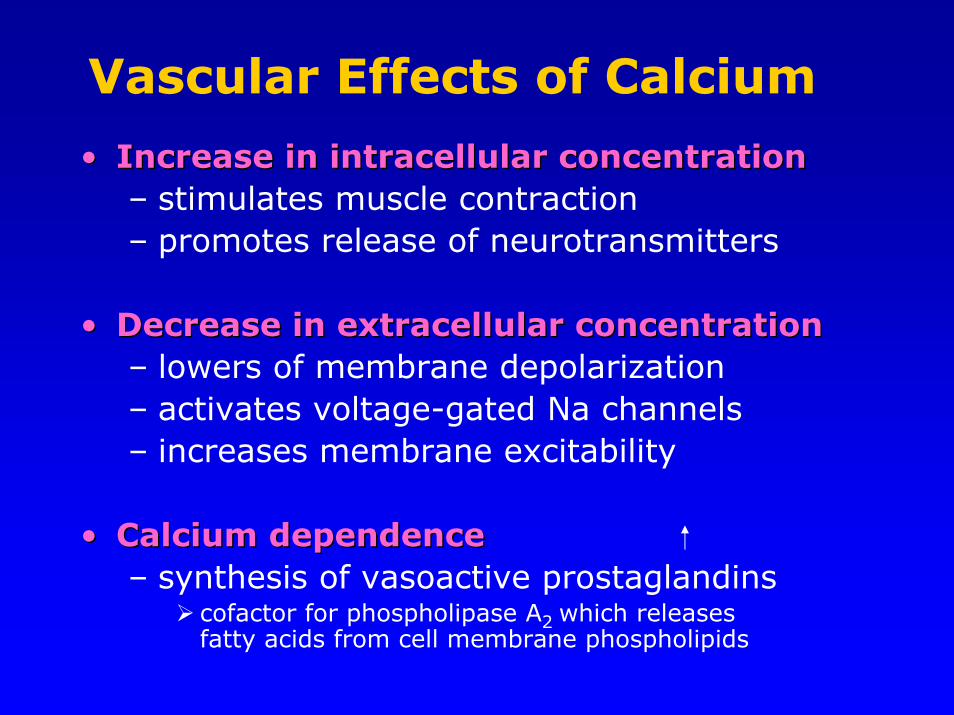
•• Increase in intracellular concentrationIncrease in intracellular concentration– stimulates muscle contraction – promotes release of neurotransmitters
•• Decrease in extracellular concentrationDecrease in extracellular concentration– lowers of membrane depolarization– activates voltage-gated Na channels – increases membrane excitability
•• Calcium dependenceCalcium dependence– synthesis of vasoactive prostaglandins
cofactor for phospholipase A2 which releasesfatty acids from cell membrane phospholipids
Vascular Effects of Calcium
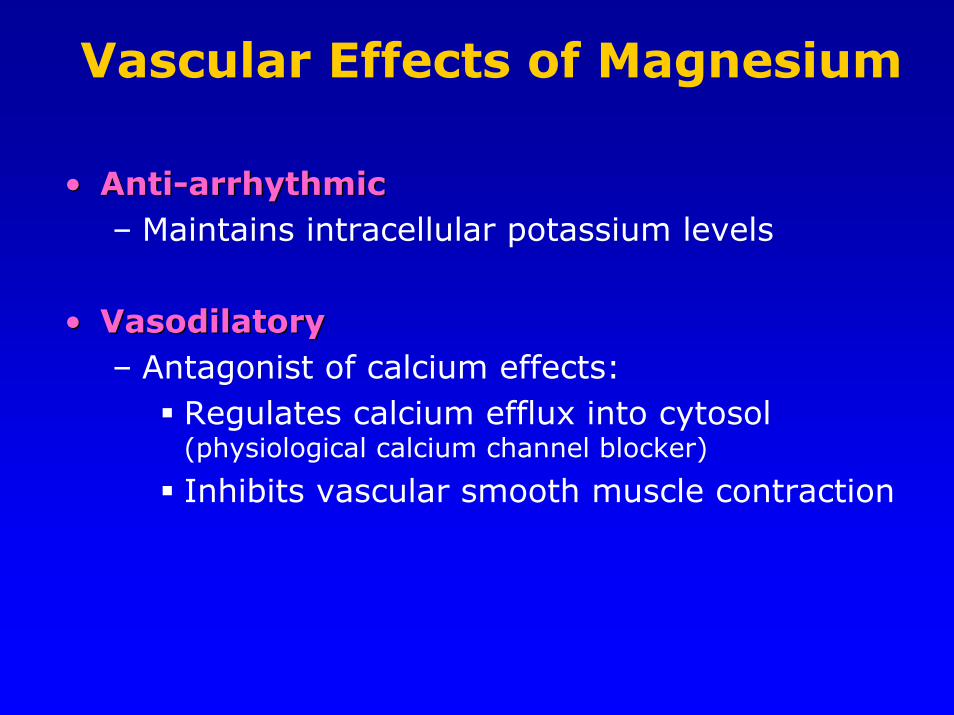
•• AntiAnti--arrhythmicarrhythmic– Maintains intracellular potassium levels
•• VasodilatoryVasodilatory– Antagonist of calcium effects:
Regulates calcium efflux into cytosol(physiological calcium channel blocker)
Inhibits vascular smooth muscle contraction
Vascular Effects of Magnesium
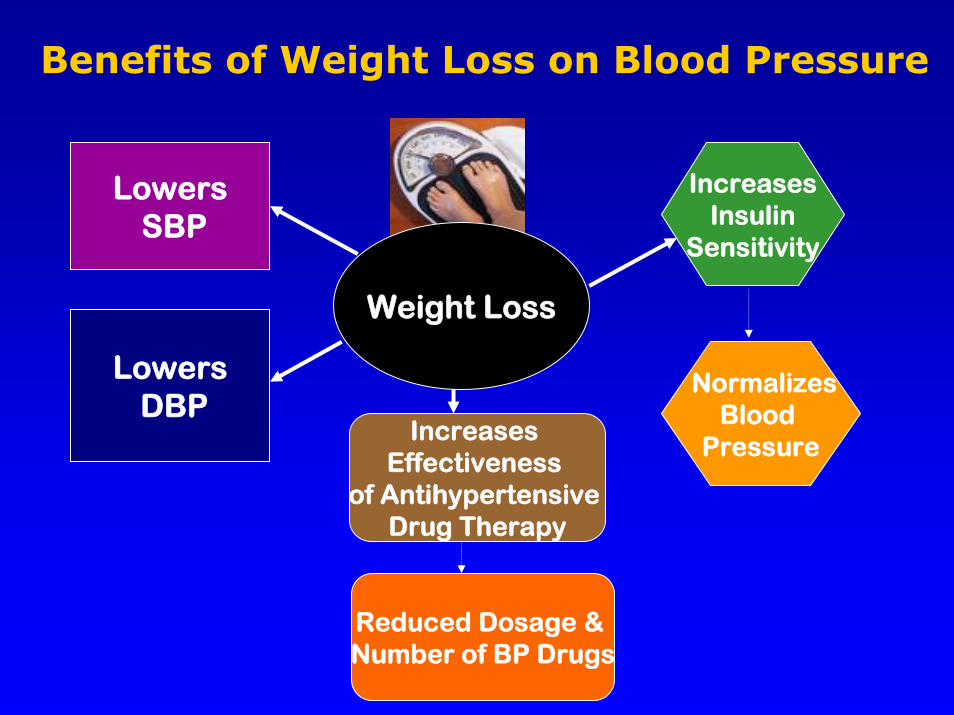
Weight Loss
Benefits of Weight Loss on Blood Pressure
LowersSBP
LowersDBP
Increases Insulin
Sensitivity
NormalizesBlood
PressureIncreases
Effectiveness of Antihypertensive
Drug Therapy
Reduced Dosage & Number of BP Drugs

Metabolic Syndrome: Definition
Expert Panel. JAMA 2001;285:2486-2497.
3 or more3 or moreRisk FactorsRisk Factors Defining LevelDefining Level
Abdominal Abdominal obesityobesity
Waist circumferenceWaist circumferenceMen: >40 in (102 cm); Men: >40 in (102 cm); Women >35 in (88 cm)Women >35 in (88 cm)
TriglyceridesTriglycerides ≥≥150 mg/dl150 mg/dl
HDLHDL--CC <40 mg/dl in men; <40 mg/dl in men; <50 mg/dl in women<50 mg/dl in women
Blood pressureBlood pressure ≥≥130/130/≥≥85 mm Hg85 mm Hg
Fasting Fasting glucoseglucose ≥≥110 mg/dl110 mg/dl

Markers of CHD Risk: Metabolic Syndrome
Atherogenic DyslipidemiaTriglycerides
HDL cholesterolCholesterol/HDL cholesterol ratio
"Normal" LDL cholesterol but apo BSmall, dense LDL and HDL
Postprandial hyperlipidemia
Atherogenic DyslipidemiaTriglycerides
HDL cholesterolCholesterol/HDL cholesterol ratio
"Normal" LDL cholesterol but apo BSmall, dense LDL and HDL
Postprandial hyperlipidemia
Insulin ResistanceInsulin resistanceHyperinsulinemiaHyperglycemiaType 2 diabetes
Insulin ResistanceInsulin resistanceHyperinsulinemiaHyperglycemiaType 2 diabetes
Thrombotic StatePAI-1
Fibrinogen
Thrombotic StatePAI-1
Fibrinogen
Inflammatory StateCRP
Cytokines
Inflammatory StateCRP
CytokinesAbdominalAbdominal
ObesityObesity Metabolic Risk FactorsMetabolic Risk FactorsRisk of Acute Risk of Acute
Coronary SyndromeCoronary Syndrome
InflammationInflammation
Thin Thin fibrous capfibrous cap
Lipid Lipid CoreCore
Coronary Coronary AtherosclerosisAtherosclerosisUnstable PlaqueUnstable Plaque
Adapted from Després JP, et al. Progress in Obesity Research: 9; 2003:29-35

POUNDS LOST STUDY:Preventing Overweight Using Novel Dietary Strategies
• Funded by the NHLBI, 2004 - 2007
• Participating institutions: – Harvard School of Public Health– Women’s Hospital in Boston
• Objective: – Evaluate the effect of diet composition on:
Weight lost at 6 months Maintenance of weight loss after 2 years
Sacks FM et al. N Engl J Med 2009; 360: 859-873

POUNDS LOST STUDY (continued)
• Sample: – 811 overweight/obese men & women– Ages 30 to 70 years.
• Mean weight loss:– 13 pounds at six months – Maintenance of a 9 pound loss at 24 months.
• The varied protein/fat/carbohydrate compositions of reduced-calorie diets (1400-2000 calories/day) had comparable effects on weight loss.
• Dietary compliance was not high.
Sacks FM et al. N Engl J Med 2009; 360: 859-873

POUNDS LOST STUDY: Preventing Overweight Using Novel Dietary Strategies

% Adult Americans Meeting Daily Physical Activity Recommendations*
Source: www.cdc.gov
*Recommended physical activity is defined as > 5 days a week for 30 minutes a day of moderate
intensity activity or at least 3 days a week for 20 minutes a day of vigorous intensity activity.

Trends in Prevalence of Overweight Among U.S. Children and Adolescents by Age and Survey
(NHANES, 1971-74, 1976-80, 1988-94 and 2001-2004)
Source: Health, United States, 2006, unpublished data. NCHS.Source: Health, United States, 2006, unpublished data. NCHS.
4.3 3.6
6.6 6.4
11.6 11
18.7
16.3
02468
101214161820
6-11 12-19
Perc
ent o
f Pop
ulat
ion
1971-74 1976-80 1988-94 2001-2004
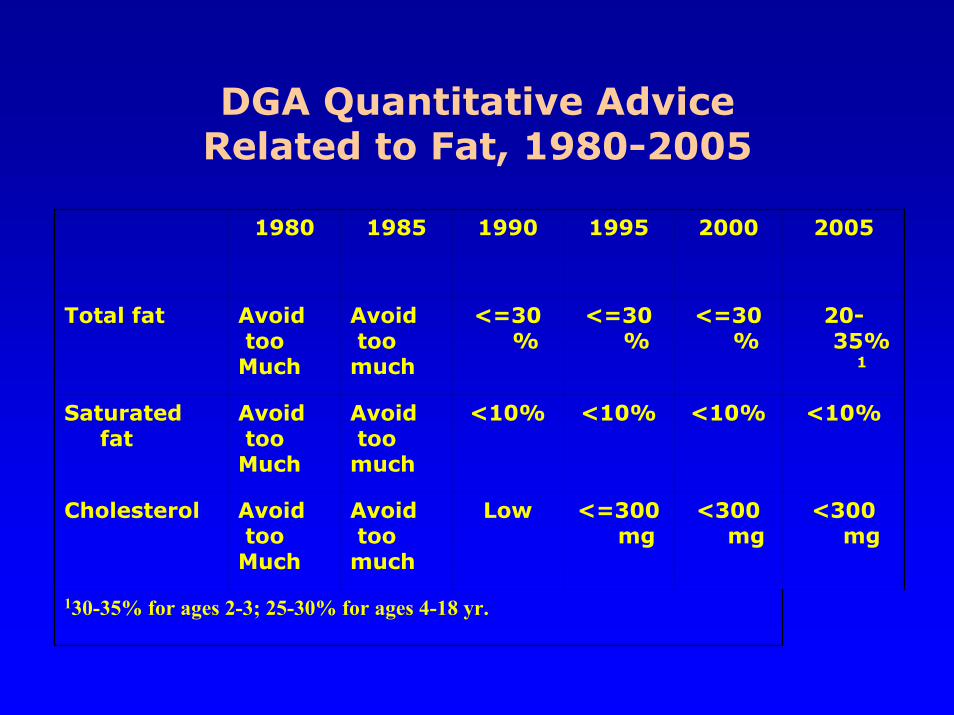
DGA Quantitative Advice Related to Fat, 1980-2005
1980 1985 1990 1995 2000 2005
Total fat Avoidtoo Much
Avoidtoo much
<=30%
<=30%
<=30%
20-35%
1
Saturated fat
Avoidtoo Much
Avoidtoo much
<10% <10% <10% <10%
Cholesterol Avoidtoo Much
Avoidtoo much
Low <=300 mg
<300 mg
<300 mg
130-35% for ages 2-3; 25-30% for ages 4-18 yr.

DASH Diet: Dietary Approaches to Stopping Hypertension
• Multi-center research project
• First trial:– Controlled feeding study– Emphasis-whole grains, nuts, legumes, fruits/veg, low-fat dairy– No sodium restriction
• Second trial:– Controlled feeding study– Emphasis-whole grains, nuts, legumes, fruits/veg, low-fat dairy– 3 levels of sodium restriction-1500, 2400 & 3300 mg/day
• Third trial (PREMIER):– DASH diet + exercise + weight loss among 810 free-living
participants receiving intensive, some or little behavior counseling.
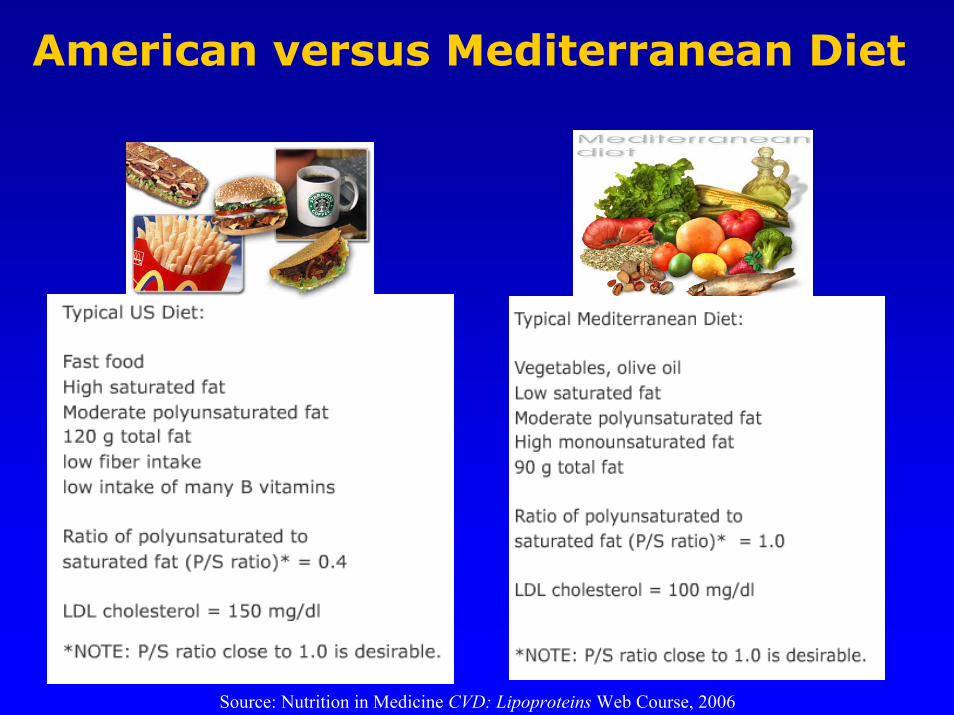
American versus Mediterranean Diet
Source: Nutrition in Medicine CVD: Lipoproteins Web Course, 2006
Diet & CVD Risk: Translating Key Nutrition Concepts
into a Heart-Healthy Diet