6 1 July 2018 · The Northeast Asian Economic Review Vol. 6 July 2018 No. 1 Contents Page Common...
58
6 1 July 2018
Transcript of 6 1 July 2018 · The Northeast Asian Economic Review Vol. 6 July 2018 No. 1 Contents Page Common...

6 1 July 2018
The Northeast Asian Economic Review
Editorial Committee
*Head of the Committee
The Northeast Asian Economic Review is an ERINA English-language academic journal to be
published twice annually, and we will accept a wide-range of contributions.
While it includes studies on all aspects of economy and society in Northeast Asia, research in
areas related to ERINA’s research activities is particularly welcome.
Economic Research Institute for Northeast Asia (ERINA)
13th Floor, Bandaijima Building, Bandaijima 5-1, Chuo-ku, Niigata City,
950-0078, Japan
Tel: +81-25-290-5545Fax: +81-25-249-7550
E-mail: [email protected]
ARAI Hirofumi Economic Research Institute for Northeast AsiaBATNASAN Namsrai National University of MongoliaBOSWORTH Barry Brookings InstitutionFUKAGAWA Yukiko School of Political Science and EconomicsFAN Gang National Economic Research InstituteKAWAI Masahiro Economic Research Institute for Northeast AsiaKIM Byung-Yeon Seoul National UniversityKUMO Kazuhiro Hitotsubashi UniversityLEE Jong-Wha Korea UniversityLIN Yifu Peking UniversityMARUKAWA Tomoo The University of TokyoMINAKIR Pavel Russian Academy of SciencesNAKAJIMA Tomoyoshi* Economic Research Institute for Northeast AsiaSEO Yong-Won Chung-Ang UniversitySHEN Minghui Chinese Academy of Social SciencesTABATA Shinichiro Hokkaido universityZHANG Yunling Chinese Academy of Social SciencesZHANG Yuyan Chinese Academy of Social Sciences

The Northeast Asian Economic Review
Vol. 6 July 2018 No. 1
Contents
Page
Common Obstacles in Conducting Foreign Trade in Mongolia: Suggestions and Solutions ・・・・・・・・・・・・・・・・・・・・・・・・・・・・・・・・・・・・・・・・・・・・・・・・・・・・・・・・・・・・・・・・・・ OTGONSAIKHAN Nyamdaa 1 DAVAASUREN Batsukh DOLJIN Mandshir
The Transportation and Logistics Environment of the Eastern Region of Russia: A Comparative Evaluation with the Western Region Based on Microdata ・・・・・・・・・・・・・・・・・・・・・・・・・・・・・・・・・・・・・・・・・・・・・・・・・・・・・・・・・・・・・・・・・・・・・・・・・・・・・・・・・・・・・ ARAI Hirofumi 15
Economic Effects of Free Trade Agreements in Northeast Asia: CGE Analysis with the GTAP 9.0a Data Base ・・・・・・・・・・・・・・・・・・・・・・・・・・・・・・・・・・・・・・・・・・・・・・・・・・・・・・・・・・・・・・・・・・・・・・・・・・ ENKHBAYAR Shagdar 37 NAKAJIMA Tomoyoshi

Common Obstacles in Conducting Foreign Trade in Mongolia: Suggestions and Solutions
OTGONSAIKHAN Nyamdaa*DAVAASUREN Batsukh**
DOLJIN Mandshir***
Abstract
In order to form an attractive business environment, it is crucial to take courses of action immediately after carefully observing the business environment and conducting a solid analysis. The main purpose of this research study is to indicate the key obstacles and their causes in conducting foreign trade in Mongolia, as well as to determine the courses of action in order to develop the sector. Within the framework of the goal of this research, the survey results have been grouped and analyzed in three groups: 1) within the territory of Mongolia; 2) within the territory of trade partner countries; and 3) difficulties that occur in the operation of international trading companies.
Key words: foreign trade, customs duties, export/import documents, border wait-time, transportationJEL classification code: F10, F13, F14
1. Background
Research backgroundAlthough foreign trade has taken up an important position in the social and economic
development of Mongolia, on the other hand the dependency solely on exports of mining products is greatly increasing the level of risk. Therefore, the Government of Mongolia has paid special attention to supporting the export of non-mining products, such as varying the economic structure by promoting non-mining sectors, establishing partnerships in foreign markets, as well as creating a flow of exports.
However, there is still an urgency for supporting business owners through developing and implementing a proper set of policies which are based on solid research by the government in order to form an attractive environment for conducting business. This research study is aimed at determining the common obstacles for international trade for companies in the non-mining sector, evaluating the implementation of the legal and policy documents of the government, and identifying the courses of action to be taken in the future.
Research methodology and data processing A questionnaire method was applied in conducting a survey throughout the nation,
including the 21 provinces (aimags) of Mongolia and the 9 districts (duuregs) of the city of Ulaanbaatar. Survey sampling consisted of 2,100 entities in total, of which there were 75 entities each from the 5 provinces in the Western region, 70 entities each from the 9 provinces in the Eastern and Khangai regions, and 65 entities each from the 9 districts in the city of Ulaanbaatar. Data collected from 1,573 entities which met the requirements were processed through Stata.
1The Northeast Asian Economic Review Vol. 6, No. 1, July 2018

1,349 entities responded on investment type, of which 96.4% were domestically invested entities.70% of entities were established prior to the year 2010, with the other 30% after that year;
80% of entities were small and medium-sized enterprises (SMEs). As for annual sales revenue, 43% of the participants had lower than 100 million togrogs, 34% had 101–400 million togrogs, 16% had 401 million to 1 billion togrogs, and the remaining 7% of the participants had more than 1 billion togrogs.
2. Common Obstacles in Conducting Foreign Trade within Mongolia
When participants were asked about the common obstacles for conducting foreign trade within Mongolia, they named domestic transportation, customs duties, time and fees spent collecting export/import documents, and additional costs originating from waiting at the border and customs (border wait-time). Therefore, we have looked into these difficulties by comparing the city of Ulaanbaatar and the four regions of Mongolia with the median for the country.
2.1 Domestic transportation
Around 2% of the survey participants responded that they face no problems related to domestic transportation, whereas the remaining 98% had difficulties related to transportation costs and time in domestic transportation.
Figure 1: Obstacles in Domestic Transportation (%)
As having the most negative influence on conducting foreign trade, 55.8% of the survey participants gave a response of transportation expenses, 53.8% transportation time, and 43.5% the inclusiveness of transportation means. Hence, cultivating logistics for domestic transportation can be seen as an essential matter.
The following results were generated when comparing the difficulties in carrying out domestic transportation for the country’s median, the four regions of Mongolia, and the city of Ulaanbaatar.
Source: Author’s calculations using the results of the study
2 The Northeast Asian Economic Review

Table 1: Obstacles to Domestic Transportation (by region, %)
Difficulty Country Median
Western Region
Khangai Region
Central Region
Eastern Region Ulaanbaatar
Cost 55.8 64.2 62.7 49.3 47.1 51.8Time 53.8 60.8 58.1 45.2 38.8 54.8
Accessibility 43.5 50.6 46.3 35.2 19.7 47.1Source: Author’s calculations using the results of the study
Looking at the content of Table 1, transportation costs cause the highest level of difficulty to international trade companies, and for isolated areas, the Western Region has the worst situation, followed by the Khangai [mountain] Region. Therefore, transportation infrastructure in these isolated areas needs to be cultivated with urgency. As for foreign and domestically invested entities, these obstacles may be displayed in the following way.
Figure 2: Obstacles in Domestic Transportation (by investment type of entity, %)
2.2 Customs duties
One of the biggest challenges for foreign traders are customs duties, for which it was found in the survey that 7.2% of the participants had responded that import duties don’t affect them in any way, whereas 37% of the participants responded medium effects, and 55.7% of the participants responded that import duties greatly affect their business.
Source: Author’s calculations using the results of the study
3Common Obstacles in Conducting Foreign Trade in Mongolia: Suggestions and Solutions

Figure 3: Difficulty Level Caused by Customs Duties (%)
Although Mongolia has some of the lowest import duties in Asia, that they still trouble business owners may suggest that the role of regulations in customs tariffs requires improvement. Therefore, we have investigated deeply the Government of Mongolia’s policy toward the role of regulations on customs tariffs.
Mongolia developed the Comprehensive National Development Strategy document (CNDS: 2008–2021) in 2008, based on the Millennium Development Goals, which indicated: “Supporting small and medium manufacturing enterprises with an export orientation through policy on customs tariffs”; “Supporting some import substitution manufactures through policy on customs tariffs”; and “Supporting import of advanced-technology precision tools and equipment through policy on customs tariffs”. Hence the document played an essential role in the regulation of customs tariffs.
Based on this comprehensive strategy, the Government of Mongolia adopted a program called “Mongolian Industrialization 2009–2016” in 2009. The program indicated issues including: developing a legal basis to levy customs duties after a certain amount of time (once the operation of manufacturing becomes consistent) for final products and goods that are manufactured by using raw materials that can’t be substituted, or a substitute raw material itself; and exempting the customs tariffs on the equipment required for core technology. However, dozens of business owners believed that the implementation of this program was insufficient.
The National Security Concept of Mongolia was ratified by the State Great Khural in July 2010, and states that: “Losses on foreign trade will be reduced, and tariff and non-tariff barriers will be utilized in a proper way in order to promote domestic industry”.
Within the implementation of the concept mentioned above, the Law on Customs Tariffs and Duties was revised and passed in 2008, and amendments were also made on more than ten occasions between 2012 and 2017. It is safe to say that these amendments were aimed toward improving the role for regulating customs tariffs to support domestic industry and investment.
The Law on Supporting Manufacturing was adopted in 2015, with certain amendments to related laws. For instance, an amendment of the Law on Customs Tariffs and Duties was made in December 2015, which included the tax exemption of equipment for research and the renewable energy industry, including spare parts, and accessories.
Source: Author’s calculations using the results of the study
4 The Northeast Asian Economic Review

Even though some hefty policy documents were developed, with a purpose of improving the role of regulating customs tariffs, several amendments have been applied to the Law on Customs Tariffs and Duties in recent years, as this research shows, and those policy alterations and improvements do not have any positive impact on business owners.
In order to determine which region is most troubled by customs duties, survey responses of the most numerous difficulties were collected and analyzed by comparing the country median to the four regions of Mongolia and the city of Ulaanbaatar, which is shown in Figure 4.
Figure 4: Difficulties Derived from Customs Duties (by region, %)
Figure 4 shows that more than 50% in every region, excluding the Eastern Region, identify import duties as the more troublesome.
Several amendments, as follows, have been made since 2015 to the Annex to the State Great Khural’s Resolution No. 27 of 1999,1 which stipulated increased customs tariffs for products capable of being manufactured domestically. Therefore, the standard rate of 5% import duty for some products was pushed up to the WTO bound-tariff level,2 in accordance with the World Trade Organization rules, which may have impacted importers.
◦ Customs tariff rates on meat products, a variety of meats, honey, canned products, cement, and trolleybuses were increased in August 2015.3
◦ Beginning on 1 March 2016, customs tariff rates on imported vodka and wine were raised to 40% and 20%, respectively.4 On top of this, in order to fulfill the obligations Mongolia proposed to the WTO, and to implement the Economic Partnership Agreement between Mongolia and Japan, an amendment to the Excise Tax Law was made which equalized the duty for imported and domestic alcoholic beverages.5
◦ Beginning on 1 May 2016, the customs tariff rates were increased for over 100 products which have the potential for domestic manufacture.6
Changes to customs tariffs have both positive and negative impacts on society and the economy. The results of this study show that when carrying out alterations to customs tariffs, it
Source: Author’s calculations using the results of the study
5Common Obstacles in Conducting Foreign Trade in Mongolia: Suggestions and Solutions

is crucial to implement them after accounting for the impact on domestic industry, consumption, and state revenue.
As for export duties, those that are imposed on lumber, timber and logs according to the law concerning customs duties on some export commodities cause business owners the same difficulties as import duties. In particular, more than 50% of foreign traders in the Western Region and Ulaanbaatar have responded that export duties are one of their biggest obstacles.
2.3 Difficulties in obtaining export/import documents
Prior to 2013, conducting international trade used to require more than ten documents, and take around a month. In order to reduce this problem, as well as to soften international trading procedures, an amendment to the customs law was applied in 2012, which changed the required documents to four, including foreign trade contracts or invoices, transport documents, permissions, licenses required for the goods subject to non-tariff restrictions, and evaluation for certain goods specified by the law issued by the agency for specialized inspections (Inspection Certificate, Health Certificate, Phytosanitary Certificate, and Product Testing Certificate). Foreign trade contracts or invoices, and transport documents are the mandatory documents. In addition, in accordance with the Economic Partnership Agreement with Japan, an amendment to the customs law was made in 2015, which states that “According to Mongolian law, it is necessary to apply for a certificate of origin if it is required by a legal entity”.
According to survey participants when they were asked whether they face any obstacles related to obtaining documents, 53% of the participants responded with the evaluation of specialized inspections, while 50% of the participants responded with certificates of origin and transport documents, 49% responded with foreign trade contracts, and 48% responded that licenses required for goods subject to non-tariff restriction were considered as highly difficult issues. (Figure 5).
Figure 5: Obstacles in Obtaining Export/Import Documents (%)
Source: Author’s calculations using the results of the study
6 The Northeast Asian Economic Review

Table 2 shows the summary for responses of “extremely high” and “high” in a questionnaire on which region has the most problems with obtaining export/import documents, comparing the country median and regions.
Table 2: Difficulties in Obtaining Export/Import Documents (by region, %)
Region
Evaluation of Agency
for Specialized Inspections
Certificates of origin
Permission required for goods subject to non-tariff
restrictions
Transport documents
Foreign trade
contracts
Western Region 62 56 52 58 53Ulaanbaatar 57 46 46 47 48Country Median 53 50 48 50 49Khangai Region 44 50 46 49 50Central Region 41 47 53 45 52Eastern Region 38 52 33 56 33
Source: Author’s calculations using the results of the study
According to Table 2, international traders in the Western Region believe the excessive amount of time spent obtaining documents is one of their biggest challenges. In particular, it should be noted that 62% of the survey participants responded that the evaluation of specialized inspections causes them difficulty, and this was the worst in the nation as a whole.
When we take the investment type and characteristics into consideration regarding the time spent obtaining export/import documents, the certificates of origin and evaluation of specialized inspections are the most troublesome factors for foreign-invested entities, whereas evaluation of specialized inspections causes the most difficulty for domestically-invested entities.
Figure 6: Difficulties in Obtaining Export/Import Documents (by entity investment type, %)
Source: Author’s calculations using the results of the study
7Common Obstacles in Conducting Foreign Trade in Mongolia: Suggestions and Solutions

Figures 7 and 8 show the differences among foreign traders in obtaining export/import documents regarding their company size and experience.
56.2% of large-sized entities responded that there is moderate difficulty in obtaining documents, whereas 49.8% of small and 51.7% of medium-sized entities responded that obtaining documents is the most problematic.
2.4 Occurrence of additional costs due to extensive time spent at customs and borders
Quality, time and simplification of customs and border services (customs, border control, specialized inspections, restrictions, prohibitions, etc.) are significant indicators of the logistics performance index. Mongolia was ranked 100th at 2.39 points in 2016 according to this index, and had moved up 32 places compared to 2014 (132th place, 2.2 points).
Therefore, we investigated whether there is additional expense due to the waiting time at customs and borders when conducting foreign trade.
Source: Author’s calculations using the results of the study
Figure 7: Difficulties in Obtaining Export/Import Documents (by entity size, %)
Figure 8: Difficulties in Obtaining Export/Import Documents (by year established, %)
8 The Northeast Asian Economic Review

Figure 9: Occurrence of additional costs due to waiting time at customs and borders (%)
Figure 9 shows that 3–5% of international traders responded that they face no problem at customs and borders, whereas over 50% of the participants responded that they encounter difficulties due to losing time at customs and borders, and resultant additional costs. Hence, it is fair to assume that there is a lack of integrated regulation for customs and borders.
When respondents were asked whether they have difficulties related to the time spent obtaining export/import documents, they responded that the evaluation of specialized inspections takes an excessive amount of time in processing documents, and they suggested that evaluation of specialized inspections should be carried out without troubling other business owners. In addition, it should be noted that the government needs to take a set of actions in order to improve the capacity of the borders, control equipment and laboratories.
3. Common Obstacles within the Territory of Trade Partner Countries
We have looked into the common obstacles within the territory of trade partner countries, or in other words, the common difficulties business owners face after crossing of the Mongolian border. Participants named “import duties”, “standards and restrictions”, “transit costs”, and “additional costs due to the extensive amount of time spent at customs and borders” as the most problematic issues, which are shown in Figure 10.
Source: Author’s calculations using the results of the study
9Common Obstacles in Conducting Foreign Trade in Mongolia: Suggestions and Solutions

Figure 10: Common Obstacles within the Territory of Foreign Partner Countries (%)
Around 2% of the survey participants responded that they have no issues within the territory of foreign partner countries, whereas 54–57% of the participants responded that they experience problems to some degree.
According to the policy on customs tariffs of partner countries, there is a distinct tariff depending on the product manufactured. Although the customs tariffs for Mongolia’s main export products, such as raw material and minerals, are generally zero or very low, that the customs duties for non-mining products with added value are relatively high is causing some degree of difficulty in exports. Therefore, it is important to consider the beneficial factors of a product when Mongolia signs a preferential or free trade agreement with its main trading partner countries.
Transit transport is one of the biggest challenges for conducting foreign trade, thus resulting in an increase of costs and a decrease in profit in a country like Mongolia, which is landlocked and located between two major nations. Therefore, it is critical to reach agreement with these neighboring countries on reducing the rates for transit transport, and on reducing the transportation costs via reducing the volume of goods by processing raw materials and minerals.
Wool, cashmere, rawhide, leather, and food products have the highest potential for export among the non-mining export goods of Mongolia. Concerning these products, not only customs tariffs, but also the standards, sanitary and hygiene procedures, and restriction requirements of the importing countries cause a substantial amount of difficulty. Therefore, a systematic course of action needs to be urgently taken, such as establishing an integrated system for raw material preparation, providing a solution to transportation logistics, and introducing quality control and the standards of other countries.
When the survey participants were asked about the obstacles at the customs and borders of the neighboring countries, 57% responded that they encounter a certain level of difficulty at Russian customs and borders, and 55% responded that they run into trouble at Chinese customs and borders.
Evaluation of common obstacles in the territory of trade partner countries has been made by comparison with the country median, as shown in Table 3.
Source: Author’s calculations using the results of the study
10 The Northeast Asian Economic Review

Table 3: Common Obstacles within the Territory of Trade Partner Countries (by region, %)
Region Import Duties
Standards and
Restrictions Transit Costs
Russian Customs and
Borders
Chinese Customs and
Borders
Western Region 63.8 61.1 60.6 58.4 59.3Khangai Region 57.4 48.4 50 48.8 48.3Country Median 57.1 54.5 57.3 56.2 54.5Ulaanbaatar 56.6 57.8 57.3 58.7 54.7Eastern Region 52.1 26.5 66.7 41.2 46.5Central Region 49.5 56.6 57 63.8 57
Source: Author’s calculations using the results of the study
Regarding common obstacles within the territory of trade partner countries, the Western Region has difficulties with import duties, standards and restrictions, and Chinese customs and borders, whereas the Eastern Region has difficulties with the cost of transit transport, and the Central Region had trouble at Russian customs and borders. In order to overcome these obstacles, we suggest signing a memorandum or agreement of cooperation with the corresponding organizations of the neighboring countries, and to co-monitor implementation.
4. Difficulties in the Operational Activities of Foreign-Trading Entities
A company’s capacity building plays a crucial role in conducting foreign trade, and therefore we have evaluated the common difficulties they encounter. The most troublesome factors are: establishing partnerships in foreign markets; signing foreign trade contracts; the lack of availability of skilled employees; accessible information on exports and imports; the lack of financial capital; the lack and sufficiency of raw materials; and the lack of access to equipment and technology.
According to Figure 11, 2 to 3% of the survey participants responded that they face no difficulties in conducting foreign trade, whereas 50% replied otherwise. Moreover, 57% responded that they face a lack of access to information on exports and imports. Therefore, it is essential to introduce the best practices of top-notch export/import management companies from foreign countries, such as Japan, which have expertise in certain sectors, products, and markets. It is also important to provide foreign-trading entities with technical consultancy services and substantial information.
Moreover, issues including lack of experts, and inability to establish trade partners in the foreign market and to negotiate trade contracts are crucial to every entity. Lack of personnel capacity is considered the most troublesome factor for medium-sized enterprises (60.4%) and for small entities (55.6%), whereas processing foreign trade contracts is a major issue for large entities (50%); on the average, however, establishing trade partners in foreign markets is the most difficult obstacle for all entities.
11Common Obstacles in Conducting Foreign Trade in Mongolia: Suggestions and Solutions

Figure 11: Common Obstacles in the Operational Activities of Foreign-Trading Entities (%)
A foreign trade contract is one of the main documents required at customs. The profits or losses of foreign-trading companies depend on how well the contract was negotiated. Some entities, however, attempt to fabricate a contract in order to reduce customs tariffs. Contracts have no legal power to enforce customs declarations; in other words, if the main required documents don’t meet the requirements, importers will be turned down at the border, which causes a certain level of difficulty for foreign trading entities.
When respondents were asked via an open question about the initiatives and activities the government should implement in order to support business owners in accessing international markets, 27.4% of survey participants responded: support of domestic industry, including implementing special policy to support small and medium-sized manufacturers and companies in local areas, and protection from imported goods; 25.2% responded: implementing policy on tax incentives, reducing customs duties and easing inspections at border controls. 21.9% of the respondents suggested implementing strategy supporting exports, including exemption of fees for research and investigation of exported goods, reducing the number of required documents, and specifically supporting the export of agricultural products. 20% of the respondents suggested that it is crucial to develop foreign relationships, concluding trade and business contracts (with the involvement of the government and guaranteed by the state), supporting international cooperation, and reaching agreement with neighboring countries on reducing customs tariffs.
Conclusions
◦ Over 50% of the survey participants responded that the expenses and time for transportation are the main problem factors, in which the Western Region had the worst result among the regions, followed by the Khangai Region. This shows that there is an urgent need for developing the logistics for domestic transportation in Mongolia.
Source: Author’s calculations using the results of the study
12 The Northeast Asian Economic Review

◦ 56% of the survey participants responded that the import duties of Mongolia cause them trouble due to a lack of implementation of policy on customs tariffs and of its effectiveness.
◦ Although the Government of Mongolia has taken a certain amount of action on reducing the number of documents related to international trade, 50% of the survey participants responded that they encounter problems obtaining documents. In addition, they specified that there is a need for action to be taken, such as speeding up the process of obtaining documents, introducing a single-window system, and computerization.
◦ 49% of the respondents replied that foreign trade contracts are a problem. The main cause is that no contract would be carried out for a low product amount and value, and even in some cases contracts signed do not meet requirements.
◦ Over 50% of the survey participants responded that additional costs due to spending an excessive amount of time at customs and borders is one of their greatest obstacles. Therefore, the government needs to take courses of action to improve the capacity of customs and borders, control equipment, and laboratories.
◦ 54–57% of total respondents answered that the import duties of the partner country, restrictions and prohibitions, and the cost of transit transport were the most problematic when exporting goods. Hence, it is essential to agree upon a memorandum or agreement of cooperation with the corresponding organizations of the neighboring countries, and to co-monitor implementation.
◦ A company’s capacity plays a crucial role in conducting foreign trade. 60% of the survey participants (mostly entities in the countryside) responded that they lack experts in certain sectors, products, and markets, and this leads to complications in accessing the foreign market, due to the absence of expert information, analysis, and assessment.
*Professor, National University of Commerce and Business, Mongolia, Email: [email protected]**Professor, National University of Mongolia, Business School, Email: [email protected]***Professor, National University of Commerce and Business, Mongolia, E mail: [email protected]
13Common Obstacles in Conducting Foreign Trade in Mongolia: Suggestions and Solutions

1 “Adopting Customs Duty Rates on Import Commodities” on 3 June 1999.2 Bound tariffs are specific commitments made by individual WTO member governments. The bound tariff is
the maximum MFN tariff level for a given commodity line.3 State Great Khural Resolution No. 332 of 17 August 2015.4 State Great Khural Resolution No. 17 of 4 February 2016.5 Excise Tax Law of Mongolia, 2006.6 State Great Khural Resolution No. 185 of 28 March 2016.
References
DAVAASUREN B., N. OTGONSAIKHAN, M. DOLJIN, and D. ENKH-OTGON. (2017). A Study of the Business Environment in Mongolia. Available online: http://www.mongolchamber.mn/bundles/uploads/MNCCI_2017_Business_Orchinii_Sudalgaa_final_website.pdf [in Mongolian]
ENKHBAYAR Sh., and N. OTGONSAIKHAN (2017). Impacts of Import Tariff Reforms on the Mongolian Economy: A CGE Analysis with the GTAP 8.1 data base, The Northeast Asian Economic Review, Vol. 5, No. 1, pp. 1–25, ERINA
Government of Mongolia (2009). Mongolian Industrialization Program 2009–2016. Available online: http://www.legalinfo.mn/annex/details/2568?lawid=5429 [in Mongolian]
OTGONSAIKHAN N. (2013). Budget Replenishment of Mongolia on the Basis of Customs Tariff Regulation of Foreign Trade, doctoral dissertation, Baikal State University of Economics and Law, Russia [in Russian]
State Great Khural of Mongolia (2008). Millennium Development Goals-Based Comprehensive National Development Strategy of Mongolia (CNDS: 2008–2021). Available online: http://www.legalinfo.mn/annex/details/3282?lawid=7045 [in Mongolian]
State Great Khural of Mongolia (2010). National Security Concept of Mongolia. Available online: http://www.legalinfo.mn/law/details/6163 [in Mongolian]
World Bank (2016). Doing Business 2016. Available online: http://www.doingbusiness.org/~/media/WBG/DoingBusiness/Documents/Annual-Reports/English/DB16-Full-Report.pdf
World Bank (2016). Logistics Performance Index 2014, 2016. Available online: https://lpi.worldbank.org/international/global
World Economic Forum (2017). Global Competitiveness Report 2016–2017. Available online: http://www.nmi.is/media/338436/the_global_competitiveness_report_2016-2017.pdf
14 The Northeast Asian Economic Review

The Transportation and Logistics Environment of the Eastern Region of Russia: A Comparative Evaluation with the Western Region Based on
Microdata
ARAI Hirofumi*
Abstract
In this paper, the author aims to comprehensively evaluate the transportation and logistics environment of the eastern region of Russia via making comparison with western Russia, based on microdata obtained via a large-scale interview survey of firms. From the simple aggregation of the response results, it can be understood that the firms of eastern Russia strongly demand an improvement in the environment in various aspects, not only for hard infrastructure, but also soft infrastructure. Most of the difference between east and west in the strength of this demand is explained by the external conditions surrounding individual firms and the special characteristics of the firms themselves. As a conclusion it can be said that the transport and logistics environment of eastern Russia is inferior in comparison with western Russia.
Key words: Logistics environment, Transport service, Infrastructure development, Railway, Russian Far EastJEL classification codes: L91, O18, R40
1. IntroductionFar from the economic center of the country and with a sparse spatial distribution of
population and corporate activity, the overcoming of “distance” is a serious economic problem for the Russian Far East. In that light, the securing of a transport and logistics environment centered on transportation infrastructure is considered a major life-or-death economic issue by many firms located in the Far Eastern region.
Despite being so important, the Russian Far East is still a region lagging behind in the development of transportation infrastructure. In the “Strategy for the Socio-Economic Development of the Far East and Zabaykalye for the Period up to 2025” (henceforward “The Far East and Zabaykalye Development Strategy”) which the Government of Russia adopted in 2009, it was pointed out that the Russian Far East is a disadvantaged region, and in particular the development level of transportation and electricity infrastructure is low (Government of Russia, 2009).
Meanwhile, in the Far East there are also infrastructure construction projects whose feasibility is considered doubtful. For example, within the government formulated “Strategy for Developing Rail Transport in the Russian Federation up to 2030”, a project was raised of constructing a new 1,866-km line over a practically uninhabited plain with only a sprinkling of settlements from the city of Yakutsk (Sakha Republic) to the city of Magadan (Magadan Oblast) (Government of Russia, 2008). If they proceed with infrastructure development via political considerations alone, then it will lead to wasteful spending increasing.
Zooming out a little, it is not the case that the transport and logistics environment for firms has been stipulated by hard transportation infrastructure alone. It has also been stipulated from the soft perspectives of the content of legal systems including transportation fee regimes, transport safety regulations, and border-crossing procedures, as well as the efficiency of their
15The Northeast Asian Economic Review Vol. 6, No. 1, July 2018

implementation by the respective institutions, and the private-sector firms offering transport services. Even if a large amount of infrastructure investment is not undertaken, it is possible to improve the transport and logistics environment.
Taking such societal demands into consideration, this paper takes as its aim the comprehensive evaluation of the problem of the transport and logistics environment of the Russian Far East, based on the demands and activities of firms. Specifically, it aims to elucidate what kind of improvement in the environment the managements of firms want, and how they are attempting the resolution of the problems.
To that end, this paper will use the results of a large-scale interview survey (henceforward referred to as the “ERINA Survey”) which the Economic Research Institute for Northeast Asia (ERINA) undertook in Russia in September–December 2015 aimed at the managements and senior managers of firms.1 The basic objective of this survey, in order to elucidate the potential for the economic development of the Russian Far East, is to evaluate the organization of firms and various aspects of company activities in the region via a comparison with European Russia. The target regions in the ERINA Survey were eight federal subjects of the Russian Federation from eastern Russia and nine from western Russia (Table 1). The target regions of the survey in the east and west are regions adjoining the borders with the Asia-Pacific and Europe, respectively. The target regions for the survey in the east are among the target regions of the Far East and Zabaykalye Development Strategy, and are along the Trans-Siberian Railway and the Baikal-Amur Mainline (BAM) with their branch lines. These railways connect to the ports on the Sea of Japan. With the exception of the Sakha Republic, seven of the federal subjects border on one or both of China and Mongolia. The target regions for the survey in the west were set in order to undertake a comparison with the east, and nine federal subjects were selected so as to be almost the same scale as the east in terms of population, gross regional production, and number of firms. While the focus is on the Northwestern Federal District which adjoins the Barents and Baltic Seas, as a result of taking geographical connectedness into consideration, it includes part of the Central Federal District. On the other hand, taking into consideration the risk of the city of Saint Petersburg—an international hub of higher level—causing a bias in the survey results, it was excluded from the survey region. As a result, the area of the eastern region grows to more than four times that of the western region.
In line with the basic objective of the survey, it included wide-ranging questions on firms’ organization and operations. In order to exclude small firms with weak corporate governance, the target firms were limited to joint-stock companies and limited liability companies with 50 or more employees. The criteria for selection of target firms in terms of industrial classification was whether firms in a certain industry would undertake economic activity beyond their urban areas so to be able to ascertain the impact from differences in the spatial characteristics of the two regions (the density of population and economic activity). In the next step, the number of firms by sector was assigned so as to reflect the regional industrial structure. As a result, valid responses from 358 firms in the east and 384 firms in the west, for a total of 742, were obtained with a composition of business sectors as shown in Table 2.
Below, first Section 2 introduces several indicators and prior analyses showing the inadequacies in the transport and logistics environment of the Russian Far East. Then Section 3 shows the picture ascertained from the aggregate results of the ERINA Survey. In Section 4, using a multiple regression analysis method, the author undertakes an analysis of the factors impacting the evaluation at a time when the managements of firms are demanding improvement
16 The Northeast Asian Economic Review

Tabl
e 1:
Bas
ic E
cono
mic
Indi
cato
rs fo
r th
e Ta
rget
Reg
ions
of t
he E
RIN
A S
urve
y
Are
a1Po
pula
tion1
Popu
latio
n D
ensi
ty1
Gro
ss R
egio
nal
Prod
uct (
GR
P)2
GR
P pe
r ca
pita
2N
umbe
r of F
irms
Thou
s. sq
. km
Shar
e(%
)Th
ous.
Shar
e(%
)po
p. /
sq.
kmM
ln.
Rub
leSh
are
(%)
Thou
s. R
uble
Num
ber
Shar
e(%
)
Tota
l7,
380
100.
018
,731
100.
02.
57,
339
100.
039
152
3,53
610
0.0
East
ern
Reg
ion
5,99
281
.29,
673
51.6
1.6
3,82
652
.139
526
9,93
251
.6R
epub
lic o
f Bur
yatia
351
4.8
982
5.2
2.8
204
2.8
208
20,9
334.
0Sa
kha
Rep
ublic
3,08
441
.896
05.
10.
375
010
.278
327
,178
5.2
Kha
baro
vsk
Kra
i78
810
.71,
335
7.1
1.7
572
7.8
428
46,1
368.
8Pr
imor
sky
Kra
i16
52.
21,
929
10.3
11.7
717
9.8
371
70,8
7313
.5Za
bayk
alsk
y K
rai
432
5.9
1,08
35.
82.
524
93.
422
916
,585
3.2
Am
ur O
blas
t36
24.
980
64.
32.
227
73.
834
316
,676
3.2
Irku
tsk
Obl
ast
775
10.5
2,41
312
.93.
11,
014
13.8
420
68,1
0613
.0Je
wis
h A
uton
omou
s Obl
ast
360.
516
60.
94.
645
0.6
268
3,44
50.
7W
este
rn R
egio
n1,
388
18.8
9,05
848
.46.
53,
513
47.9
387
253,
604
48.4
Rep
ublic
of K
arel
ia18
12.
463
03.
43.
521
12.
933
424
,341
4.6
Ark
hang
elsk
Obl
ast
590
8.0
1,17
46.
32.
061
78.
452
426
,196
5.0
Leni
ngra
d O
blas
t384
1.1
1,77
99.
521
.285
411
.648
038
,320
7.3
Mur
man
sk O
blas
t14
52.
076
24.
15.
339
05.
351
122
,579
4.3
Nov
goro
d O
blas
t55
0.7
616
3.3
11.3
240
3.3
389
16,3
793.
1Ps
kov
Obl
ast
550.
864
63.
511
.713
31.
820
516
,451
3.1
Smol
ensk
Obl
ast
500.
795
95.
119
.225
73.
526
727
,754
5.3
Tver
Obl
ast
841.
11,
305
7.0
15.5
341
4.6
260
36,1
496.
9Vo
logd
a O
blas
t14
52.
01,
188
6.3
8.2
469
6.4
394
45,4
358.
7N
otes
: 1.
As o
f 1 Ja
nuar
y 20
16.
2.
As o
f 201
5.So
urce
: C
ompi
led
by a
utho
r bas
ed o
n R
osst
at d
ata
17The Transportation and Logistics Environment of the Eastern Region of Russia: A Comparative Evaluation with the Western Region Based on Microdata

Table 2: Composition of Surveyed Firms by Industrial SectorTotal Eastern Region1 Western Region
Number Share(%) Number Share
(%) Number Share(%)
All firms surveyed 742 100.0 358 100.0 384 100.0
Agriculture, Forestry and Fishing 113 15.2 51 14.2 62 16.1
Agriculture 71 9.6 32 8.9 39 10.2
Forestry 20 2.7 13 3.6 7 1.8
Fishing 22 3.0 6 1.7 16 4.2
Mining and Manufacturing 267 36.0 107 29.9 160 41.7
Production and distribution of electricity, gas and water 43 5.8 24 6.7 19 4.9
Production of fuel and energy minerals 4 0.5 3 0.8 1 0.3
Production of other minerals 21 2.8 14 3.9 7 1.8
Food industry 58 7.8 21 5.9 37 9.6
Light industry 11 1.5 4 1.1 7 1.8
Forest, paper-pulp and woodworking industry 38 5.1 11 3.1 27 7.0
Chemical and petrochemical industry 12 1.6 3 0.8 9 2.3
Metallurgy and metalwork 15 2.0 5 1.4 10 2.6
Machine-building industry 37 5.0 11 3.1 26 6.8
Building materials industry 28 3.8 11 3.1 17 4.4
Building 105 14.2 62 17.3 43 11.2
Wholesale trade 184 24.8 103 28.8 81 21.1
Transport 55 7.4 27 7.5 28 7.3
Communications 18 2.4 8 2.2 10 2.6
Note: Test of equality of proportion for 17 sectors of industrial classification with the western region: Chi2(16)=40.4000, p=0.0006; Cramer V=0.2333
Source: Compiled by author based on the ERINA Survey
in the transport and logistics environment and adopting improvement measures. Lastly, conclusions are drawn in Section 5.
18 The Northeast Asian Economic Review

2. The East–West Difference in the Transport and Logistics EnvironmentAs stated above, the transportation infrastructure of the Russian Far East is meager. What
demonstrates the situation most straightforwardly is the state of development of the railways and roads. Among the target regions of the ERINA Survey, half of the federal subjects in the eastern region fall below the average railway density of 50 km/10,000 km2 (2015) for the Russian Federation, in contrast to Arkhangelsk Oblast alone in the western region (Table 3). The average for the Far Eastern Federal District is under 14 km/10,000 km2, and ranks lowest among all Federal Districts. The same also goes for paved road density (2015). Only two federal subjects in the eastern region exceed the Federation average of 61 km/1,000 km2, whereas conversely in the western region only three federal subjects fall below it (Table 3). The average paved road density for the Far Eastern Federal District (9.5 km/1,000 km2) is one-sixth of the Federation average, and as expected ranks bottom.
Table 3: Road and Railway Density by Federal Subject of the Russian Federation
Federal SubjectPaved Road1 Rail2
km/1,000km2 km/10,000km2
Russian Federation Average 61 50
Eastern Region
Republic of Buryatia 26 35
Sakha Republic 3.8 2
Khabarovsk Krai 12 27
Primorsky Krai 93 95
Zabaykalsky Krai 34 56
Amur Oblast 34 81
Irkutsk Oblast 30 32
Jewish Autonomous Oblast 68 141
Western Region
Republic of Karelia 47 123
Arkhangelsk Oblast 21 30
Leningrad Oblast3 207 341
Novgorod Oblast 198 210
Murmansk Oblast 23 60
Pskov Oblast 299 197
Smolensk Oblast 283 232
Tver Oblast 248 214
Vologda Oblast 118 53Note: As of 2015.Source: Rosstat data
19The Transportation and Logistics Environment of the Eastern Region of Russia: A Comparative Evaluation with the Western Region Based on Microdata

Elsewhere, concerning seaports, the eastern region is not so disadvantaged. Vostochny Port, with the largest volume of cargo handled in the Russian Far East (69.29 million tonnes in 2017), is even third nationwide in volume handled.2 Moreover, the number of containers handled at the Port of Vladivostok (840,000 TEU in 2017) is second in Russia behind the Port of Saint Petersburg on the Baltic Sea. However, despite the presence of such pivotal ports, the ports of the Russian Far East have great problems. On this point, the following problems were pointed out in Minakir and Sergienko (eds., 2011, p. 145): “technological constraints bring delays in transshipment operations”;3 “there are ports where development is constrained due to being located within an urban area”;4 and “a long period of time is required for the transit of overseas trade cargo due to the lack of infrastructure in the inspection and supervisory organs”.
As stated above, the transport and logistics environment is also stipulated by elements on the software side. There are data which show that firms in the Russian Far East are also actually placing emphasis on the elements in soft infrastructure. In fact, in a questionnaire survey targeting 64 shipper firms in Khabarovsk Krai in 2008 it was ascertained that “shipping rates” were a more significant problem than “(insufficient) quality of roads.” What is more, as the results of analysis combining an evaluation of the degree of satisfaction, the survey concluded that emphasis should be placed on three points, adding “timely dispatch of transport vehicles” to the other two (Balalaev et al., 2008, pp. 69–71).
From a different angle again comes circumstantial evidence indicating the inadequacies in the transport and logistics environment of the Russian Far East. There is one example to mention. In the Russian Far East, as part of regional development policy, the two kinds of special zone systems of “Advanced Special Economic Development Zones (ASEZ)” and the “Free Port of Vladivostok (FPV)” were established in 2016. Looking at the breakdown by industry classification of “resident” firms’ business5 as of the end of June 2017, 35 firms within the 136 in the ASEZ and 78 firms within the 220 in the FPV were planning to perform “warehousing and services incidental to transport”. In both cases, the category gives the largest number among the industry sectors, which suggests that many and most firms intend to enter into the market, discovering business opportunities there. There is no need to stress that the inadequacies of the provision of transportation and logistics services are in the background. Furthermore, even though there is still the possibility that some of the firms may designate it as an incidental business for their own company’s distribution and not for profit, it suggests that these firms will come not to rely on the services of established businesses, but attempt to tackle matters within their own firm. In any case, the tendencies of the resident firms in these special zones suggest that “there are unsatisfied needs of firms in the market for warehousing, etc.”
Up to this point this section has introduced the data and several analyses indicating that the transport and logistics environment in the Russian Far East is at a disadvantage in comparison with other regions within Russia. However, these remain fragmentary pieces of information. Certainly, it can generally be said that the small amount of infrastructure is a problem. However, the profundity of that problem should probably be judged on the magnitude of the divergence from the needs. In addition, even when some of the firms located in the Russian Far East have sensed an inadequacy in the provision of certain transportation and logistics services, it is not pertinent to take that for evaluation of the entire transport and logistics environment in the Russian Far East. After all, these problems may not be peculiar to the Russian Far East, but may be universal problems for Russia.
In this regard the data from the ERINA Survey make possible an overall evaluation,
20 The Northeast Asian Economic Review

via comparative analysis between the east and west target regions of the survey, as well as a crosswise analysis of hard and soft infrastructure. A case example cannot be found where micro-level data on logistics has been gathered in such a way within Russia. From Section 3 on, the author analyzes this valuable data, and aims to elucidate whether the transport and logistics environment in the Russian Far East really is inferior.
3. The Results of the SurveyIn this section, in order to tackle the concerns mentioned in the previous section, based on
the ERINA Survey data, the author carries out analysis as to whether differences exist between eastern and western Russia with regard to the evaluations and judgements of the managers of firms and the actions of firms in the area of transportation and logistics. Here on in, sub-sections 3.1 and 3.2 show the reality revealed for the evaluation of the external environment, followed by sub-section 3.3 for the actions of firms. In sub-section 3.4, after summarizing these, the author presents interpretations and further questions for in-depth consideration in Section 4.
3.1 The Impact of the External Environment on the Management of Firms First, in order to evaluate the relative acuteness for the upgrading of transportation and
logistics infrastructure, an analysis was done as to the responses to the crosswise question on impacts of various factors of the external environment on management of firms.
For this question the interviewers requested a five-grade evaluation—“a definitely negative impact”, “a rather negative impact”, “no impact”, “a rather positive impact”, and “a definitely positive impact”—regarding a total of 12 categories of factors and structures of the external environment, including “federal government economic policy” and “local government and municipal bodies’ economic policy”, and 10 others as in Table 4.
Comparing the responses from eastern and western firms, a chi-squared test for equality of proportion revealed that out of the total 12 target categories there were 8 categories where a null hypothesis of no difference between the two regions was rejected at a 10% level or below. “Transportation and logistics infrastructure”, the main subject of this paper, was included among those 8 categories, and for that category the null hypothesis was rejected particularly strongly (x2 = 21.8039, p = 0.0002). By comparing the responses from both regions in this category, negative responses (the total of “a definitely negative impact” and “a rather negative impact”) were 41.0% (139 out of 339 firms) in the eastern region, as against 27.2% (98 out of 360 firms) in the western region (Table 4). On the other hand, the percentages for the positive responses (the total of “a definitely positive impact” and “a rather positive impact”) were 22.7% in the eastern region (77 out of 339 firms) and 26.4% in the western region (95 out of 360 firms), with the western region higher. In other words, it is graphically illustrated in these results that firms in the eastern region have a strong awareness that the infrastructure for transportation and logistics is insufficient.
Due to space constraints, the author will omit detailed examination of the other categories, but there were categories which can confirm a similar trend for transportation infrastructure where there were significant differences in the proportion of responses between east and west, and in addition there were many responses of negative impacts in the eastern region: “federal government economic policy”, “local government and municipal bodies’ economic policy”, “local legislation”, “the electricity grid” and “the shadow economy”. On the other hand, for the response results regarding “communications”, which also belongs within infrastructure, there was a significantly positive evaluation in the eastern region. Furthermore, for “federal legislation”,
21The Transportation and Logistics Environment of the Eastern Region of Russia: A Comparative Evaluation with the Western Region Based on Microdata

Table 4: The Impact of External Economic Environment on Management of FirmsAll Firms Surveyed1 Eastern Region Western Region
No. Firms % of Total No. Firms % ofTotal No. Firms % of
Total
(a) Federal Government Economic PolicyA definitely negative impactA rather negative impactNo impactA rather positive impactA definitely positive impactTotal
382433029515
693
5.535.143.613.72.2
100.0
211331284513
340
6.239.137.613.23.8
100.0
17110174502
353
4.831.249.314.20.6
100.0Test of equality: x2 (4)= 17.6968, p = 0.0014; Cramér V = 0.1598
(b) Local Government and Municipal Bodies’ Economic PolicyA definitely negative impactA rather negative impactNo impactA rather positive impactA definitely positive impactTotal
4121132610715
700
5.930.146.615.32.1
100.0
261071544510
342
7.631.345.013.22.9
100.0
15104172625
358
4.229.148.017.31.4
100.0Test of equality: x2(4) = 7.9938, p = 0.0918; Cramér V = 0.1068
(c) Federal LegislationA definitely negative impactA rather negative impactNo impactA rather positive impactA definitely positive impactTotal
3723731110014
699
5.333.944.514.32.0
100.0
21117144489
339
6.234.542.514.22.7
100.0
16120167525
360
4.433.346.414.41.4
100.0Test of equality: x2 (4)= 3.0893, p = 0.5429; Cramér V = 0.0664
(d) Local LegislationA definitely negative impactA rather negative impactNo impactA rather positive impactA definitely positive impactTotal
311933619510
690
4.528.052.313.81.4
100.0
2095
171429
337
5.928.250.712.52.7
100.0
1198
190531
353
3.127.853.815.00.3
100.0Test of equality: x2(4) = 10.9681, p = 0.0269; Cramér V = 0.1260
(e) Judicial SystemA definitely negative impactA rather negative impactNo impactA rather positive impactA definitely positive impactTotal
1897
452648
639
2.815.270.710.01.3
100.0
1146
221295
312
3.514.770.89.31.6
100.0
751
231353
327
2.115.670.610.70.9
100.0Test of equality: x2(4) = 2.0793, p = 0.7211; Cramér V = 0.0570
(f) Power Enforcement Organs (police activity and enforcement of laws)A definitely negative impactA rather negative impactNo impactA rather positive impactA definitely positive impactTotal
16110455716
658
2.416.769.110.80.9
100.0
844
233335
323
2.513.672.110.21.5
100.0
866
222381
335
2.419.766.311.30.3
100.0
Test of equality: x2 (4)= 7.4683, p = 0.1131; Cramér V = 0.1065
Note: Targets were firms with valid responses.Source: Compiled by author based on the ERINA Survey
22 The Northeast Asian Economic Review
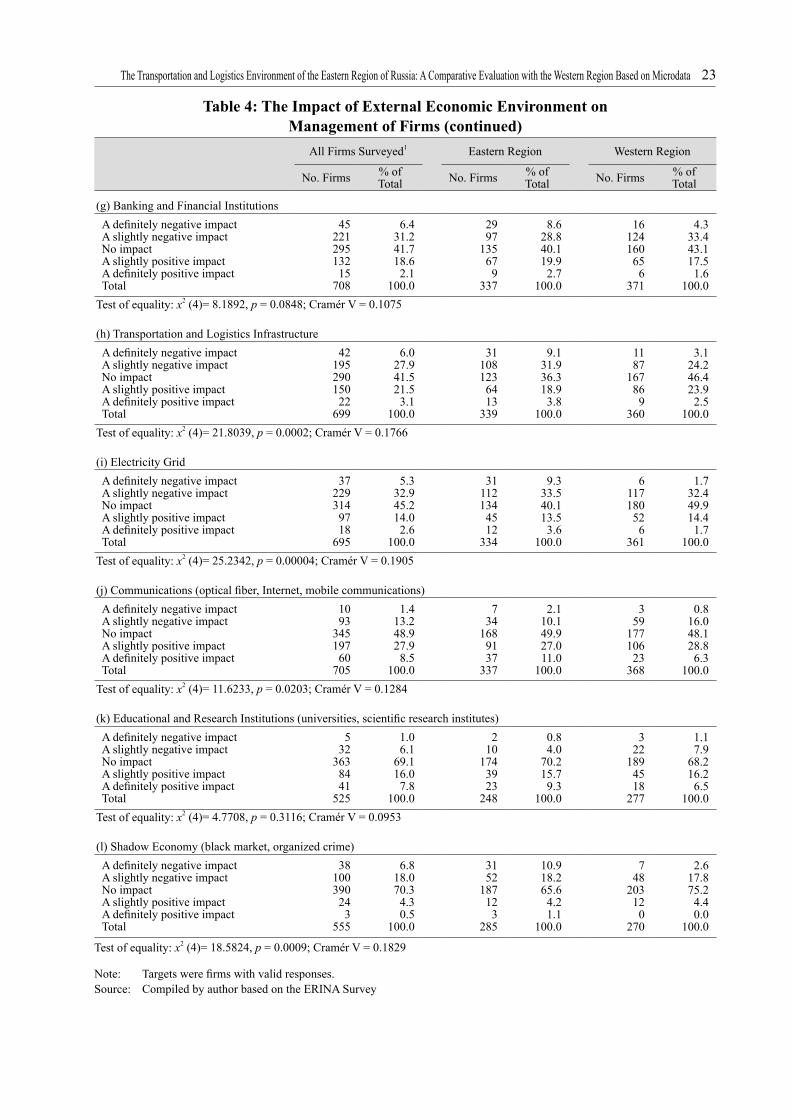
Table 4: The Impact of External Economic Environment on Management of Firms (continued)
All Firms Surveyed1 Eastern Region Western Region
No. Firms % ofTotal No. Firms % of
Total No. Firms % ofTotal
(g) Banking and Financial InstitutionsA definitely negative impactA slightly negative impactNo impactA slightly positive impactA definitely positive impactTotal
4522129513215
708
6.431.241.718.62.1
100.0
2997
135679
337
8.628.840.119.92.7
100.0
16124160656
371
4.333.443.117.51.6
100.0Test of equality: x2 (4)= 8.1892, p = 0.0848; Cramér V = 0.1075
(h) Transportation and Logistics InfrastructureA definitely negative impactA slightly negative impactNo impactA slightly positive impactA definitely positive impactTotal
4219529015022
699
6.027.941.521.53.1
100.0
311081236413
339
9.131.936.318.93.8
100.0
1187
167869
360
3.124.246.423.92.5
100.0Test of equality: x2 (4)= 21.8039, p = 0.0002; Cramér V = 0.1766
(i) Electricity GridA definitely negative impactA slightly negative impactNo impactA slightly positive impactA definitely positive impactTotal
372293149718
695
5.332.945.214.02.6
100.0
311121344512
334
9.333.540.113.53.6
100.0
6117180526
361
1.732.449.914.41.7
100.0Test of equality: x2 (4)= 25.2342, p = 0.00004; Cramér V = 0.1905
(j) Communications (optical fiber, Internet, mobile communications)A definitely negative impactA slightly negative impactNo impactA slightly positive impactA definitely positive impactTotal
1093
34519760
705
1.413.248.927.98.5
100.0
734
1689137
337
2.110.149.927.011.0
100.0
359
17710623
368
0.816.048.128.86.3
100.0Test of equality: x2 (4)= 11.6233, p = 0.0203; Cramér V = 0.1284
(k) Educational and Research Institutions (universities, scientific research institutes)A definitely negative impactA slightly negative impactNo impactA slightly positive impactA definitely positive impactTotal
532
3638441
525
1.06.1
69.116.07.8
100.0
210
1743923
248
0.84.0
70.215.79.3
100.0
322
1894518
277
1.17.9
68.216.26.5
100.0Test of equality: x2 (4)= 4.7708, p = 0.3116; Cramér V = 0.0953
(l) Shadow Economy (black market, organized crime)A definitely negative impactA slightly negative impactNo impactA slightly positive impactA definitely positive impactTotal
38100390243
555
6.818.070.34.30.5
100.0
3152
187123
285
10.918.265.64.21.1
100.0
748
203120
270
2.617.875.24.40.0
100.0
Test of equality: x2 (4)= 18.5824, p = 0.0009; Cramér V = 0.1829
Note: Targets were firms with valid responses.Source: Compiled by author based on the ERINA Survey
23The Transportation and Logistics Environment of the Eastern Region of Russia: A Comparative Evaluation with the Western Region Based on Microdata

“judicial system”, “power enforcement organs”, and “educational and research institutions” a significant east–west difference was not observed.
As above, for 6 categories, half of the total 12, a tendency of responses was discernable of the eastern firms being even more negatively impacted than the western ones. Included among the 6 categories were “transportation and logistics infrastructure” and the “electricity grid”, and the Government of Russia’s recognition that “the development of transportation and electricity infrastructure in the Russian Far East is lagging behind” can be discerned in the fact that it is a shared view at the level of the management of firms.
3.2 The Improvement of the External Environment Required by FirmsOn the point of being able to discern that firms in the eastern region are firmly regarding
the lack of development of transportation and logistics infrastructure as a problem, the next analysis was of the problem focused on the transport and logistics environment. Here, based on the hypothesis that at the same time as many firms desiring development of hard infrastructure—infrastructure in a narrower sense—also desire the improvement of the transport and logistics environment by other means, such as deregulation, the author examined whether there is a difference in those demands between east and west. On the question of the target for the analysis, relating to the improvement of the transport and logistics environment there were the following 8 categories as those considered desired by firms: “new construction and expansion of infrastructure”; “improvement and modernization of infrastructure”; “transportation fee reduction or subsidies for transportation fees”; “relaxation of freight transportation-related regulations”; “strengthening of competition policy in the transportation market”; “raising of the quality of the services of forwarding businesses”; “streamlining and expedition of cross-border procedures for freight”; and “enhancement of transportation services for special freight (including frozen and refrigerated freight, and oversize freight)”. Regarding the necessity of each, the interviewers asked for responses in three divisions: “necessary”; “desirable”; and “don’t recognize a necessity”. All these issues are clearly given external environments for individual firms, and it is a difficult matter for the companies alone to improve them by their own efforts.
The aggregate results of the responses are as in Table 5. In whichever category the proportion of companies considering it “necessary” was greater in the eastern than the western region, whereas the proportion of companies considering “don’t recognize a necessity” were fewer in the eastern region. A chi-squared test of equality detected a statistically significant east–west difference at a 1% level for responding firms in all categories. Comparing reciprocally the responses to the questions for the eight categories within eastern firms, only the response to “transportation fee reduction or subsidies for transportation fees” of “necessary” exceeded 50%, and the total together with “desirable” exceeded 90%.
From the above it can be understood that, in the comparison with western region firms, eastern firms more strongly require improvement in the overall broader transport and logistics environment, including institutions and policy, as well as the development of soft infrastructure, such as the service content of logistics firms, as their requirements are not limited to the development of hard infrastructure. Among these transportation fee reduction is strongly demanded.
24 The Northeast Asian Economic Review

Table 5: The External Environment Requiring ImprovementAll Firms Surveyed1 Eastern Region Western Region
No. Firms % ofTotal No. Firms % of
Total No. Firms % ofTotal
(a) New Construction and Expansion of InfrastructureDon’t recognize a necessityDesirableNecessaryTotal
137315172624
22.050.527.6
100.0
53145110308
17.247.135.7
100.0
8417062
316
26.653.819.6
100.0Test of equality: x2 (2)= 22.2951, p = 0.00001; Cramér V = 0.1890
(b) Improvement and Modernization of InfrastructureDon’t recognize a necessityDesirableNecessaryTotal
139306177622
22.349.228.5
100.0
55128120303
18.242.239.6
100.0
8417857
319
26.355.817.9
100.0Test of equality: x2 (2)= 36.2564, p = 0.0000; Cramér V = 0.2414
(c) Transportation Fee Reduction or Transportation Fee Supplementary PaymentsDon’t recognize a necessityDesirableNecessaryTotal
77298285660
11.745.243.2
100.0
20120179319
6.337.656.1
100.0
57178106341
16.752.231.1
100.0Test of equality: x2 (2)= 47.0850, p = 0.0000; Cramér V = 0.2670
(d) Relaxation of Freight Transportation-related RegulationsDon’t recognize a necessityDesirableNecessaryTotal
140287207634
22.145.332.6
100.0
56121116293
19.141.339.6
100.0
8416691
341
24.648.726.7
100.0Test of equality: x2 (2)= 12.1104, p = 0.0023; Cramér V = 0.1382
(e) Strengthening of Competition Policy in the Transportation MarketDon’t recognize a necessityDesirableNecessaryTotal
172248175595
28.941.729.4
100.0
53122115290
18.342.139.7
100.0
11912660
305
39.041.319.7
100.0Test of equality: x2 (2)= 42.3245, p = 0.0000; Cramér V = 0.2667
(f) Raising of the Quality of the Services of Forwarding BusinessesDon’t recognize a necessityDesirableNecessaryTotal
184261139584
31.544.723.8
100.0
8211687
285
28.840.730.5
100.0
10214552
299
34.148.517.4
100.0Test of equality: x2 (2)= 13.8814, p = 0.0009; Cramér V = 0.1541
(g) Streamlining and Expedition of Cross-Border Customs Procedures for FreightDon’t recognize a necessityDesirableNecessaryTotal
127194151472
26.941.132.0
100.0
408884
212
18.941.539.6
100.0
8710667
260
33.540.825.8
100.0Test of equality: x2 (2)= 16.2645, p = 0.0002; Cramér V = 0.1856
(h) Enhancement of Transportation Services for Special FreightDon’t recognize a necessityDesirableNecessaryTotal
139219138496
28.044.227.8
100.0
539186
230
23.039.637.4
100.0
8612852
266
32.348.119.5
100.0Test of equality: x2 (2)= 19.9547, p = 0.0000; Cramér V = 0.2005
Note: Targets were firms with valid responses.Source: Compiled by author based on the ERINA Survey
25The Transportation and Logistics Environment of the Eastern Region of Russia: A Comparative Evaluation with the Western Region Based on Microdata

3.3 Firms’ Independent Efforts at Logistics ImprovementThe next examination is whether there is an east–west difference in the efforts which firms
are making themselves to resolve logistical problems. On the questions concerning this, the survey presented the following 7 categories as improvement measures which are conceivable for execution at each firm: “change the procurement source to a supplier in a convenient location”; “change the shipping market to a convenient location”; “utilization of comprehensive distribution service providers, including third-party logistics”; “possession of firm’s own transportation means, such as trucks and freight wagons”; “establishment of warehouses and logistics centers other than at company HQ”; “utilization of computer systems for logistics management”; and “utilization and nurturing of specialist logistics personnel”, requiring responses in the form of two choices, affirmative and negative, based on whether a firm has adopted the respective measures.
The aggregate results are as in Table 6. Via a Z-test on the difference in proportion, a null hypothesis of no difference between east and west was rejected for three categories: “utilization of comprehensive distribution service providers, including third-party logistics” (z = 2.4531, p = 0.0142); “establishment of warehouses and logistics centers other than at company HQ” (z = 3.8897, p = 0.0001); and “utilization and nurturing of specialist logistics personnel” (z = 2.1024, p = 0.0355).
Confirming the content of these responses, the former two were adopted more in the eastern region, and the latter more in the western region. For firms utilizing comprehensive distribution service providers, there were 48 in the eastern region (16.7% of firms with valid responses), as against 31 (9.9%) in the western region. Regarding firms which have installed distribution hubs, there were 59 (20.6%) in the eastern region and 29 (9.3%) in the western region, practically double in difference. On the other hand, for firms undertaking utilization and nurturing of specialist personnel, there were 24 (8.4%) in the eastern region and 43 (13.8%) in the western region.
In the other four categories, the null hypothesis of no east–west difference was not rejected. “Possession of firm’s own transportation means, such as trucks and freight wagons” was included within that, the sole category among all seven which more than half the firms were carrying out. That is, in the adoption or rejection of the majority of improvement measures, including the strategies most broadly in use, there were less differences in the actions of firms between the eastern and western regions.
Collecting these together, compared with the improvement demands for the external environment where it is discerned that the eastern firms have strong demands in all categories, it can be concluded that the east–west difference is small in terms of the actions in efforts to improve independently by investing their own resources.
3.4 Short SummaryAs discussed above, the analyses in this section have confirmed differences in the trends for
responses in the eastern and western regions from the simple aggregation of the questionnaire survey. Their summation is as follows.
In the area of the evaluation and awareness of the external environment, it was shown that for eastern firms the development of transportation and logistics infrastructure is insufficient. Furthermore, regarding the necessity of development of transportation and logistics infrastructure (construction and renovation) as well as the improvement of the wider overall transport and
26 The Northeast Asian Economic Review

Table 6: Independent Efforts toward Logistics ImprovementAll Firms Surveyed1 Eastern Region Western Region
No. Firms % ofTotal No. Firms % of
Total No. Firms % ofTotal
(a) Change the Procurement Source to a Supplier in a Convenient Location
AdoptedNot adoptedTotal
149450599
24.975.1100
78209287
27.272.8100
71241312
22.877.2100
Test of proportion: z = 1.2505, p = 0.2111
(b) Change the Shipping Market to a Convenient Location
AdoptedNot adoptedTotal
63536599
10.589.580.7
34253287
11.888.238.7
29283312
9.390.7
42
Test of proportion: z = 1.0170, p = 0.3091
(c) Utilization of Comprehensive Distribution Service Providers, incl. Third-Party Logistics
AdoptedNot adoptedTotal
79520599
13.286.880.7
48239287
16.783.338.7
31281312
9.990.1
42
Test of proportion: z = 2.4531, p = 0.0142
(d) Possession of Firm’s Own Transportation Means, such as Trucks and Freight Wagons
AdoptedNot adoptedTotal
378221599
63.136.980.7
184103287
64.135.938.7
194118312
62.237.8
42
Test of proportion: z = 0.4896, p = 0.6245
(e) Establishment of Warehouses and Logistics Centers other than at Company HQ
AdoptedNot adoptedTotal
68511579
11.788.3
78
59228287
20.679.438.7
29283312
9.390.7
42
Test of proportion: z = 3.8897, p = 0.0001
(f) Utilization of Computer Systems for Logistics Management
AdoptedNot adoptedTotal
35564599
5.894.280.7
18269287
6.393.738.7
17295312
5.494.6
42
Test of proportion: z = 0.4290, p = 0.6679
(g) Utilization and Nurturing of Specialist Logistics Personnel
AdoptedNot adoptedTotal
67532599
11.288.880.7
24263287
8.491.638.7
43269312
13.886.2
42
Test of proportion: z = −2.1024, p = 0.0355
Note: Targets were firms with valid responses.Source: Compiled by author based on the ERINA Survey
logistics environment, including the legal system governing the distribution and logistics and freight transport services, the eastern firms discern a necessity more than the western ones.
27The Transportation and Logistics Environment of the Eastern Region of Russia: A Comparative Evaluation with the Western Region Based on Microdata

On the other hand, regarding efforts being implemented to improve logistics by firms investing their own resources, although in part it is possible to discern a difference between eastern and western firms, the statistical analysis does not show such a clear difference, as on the stance of requiring improvement in the external environment.
Considering these analytical results altogether, while the east–west difference is small in terms of each firm tackling the problems by acting autonomously for the resolution of transportation and logistics problems, in terms of demands to the external environment (other players) it is possible to obtain a tentative conclusion with the trend of eastern firms’ strongly requiring improvement.
Taking into consideration this paper’s main issue of the evaluation of east–west differences in the transport and logistics environment, then how should we interpret the tentative conclusion obtained here? One interpretation is that out of two groups of the firm managements taking similar actions, one group strongly requires improvement of the environment and the other not as much, which suggests that the group of firms which strongly requires improvement of the environment is one which is in a relatively unfortunate environment. According to this interpretation, the transport and logistics environment in the eastern region should be inferior in comparison to the western region.
On the other hand, investigating the analytical results up to this point in a little more detail, there are also factors calling for hesitation in such an interpretation. Some of the survey categories, like transportation-related regulations and cross-border procedures are uniform systems nationwide, and that fact has also naturally been acknowledged by business people both east and west. Consequently, regarding the necessity of these improvements, the fact that the response trends differ greatly between eastern and western firms can be called an extremely unnatural result. Considered this way, the result in all categories of eastern firms more strongly demanding improvement than western firms, gives rise to the suspicion that it comes from the bias held by the responders of: “while the managements of firms in the Russian Far East are neglecting self-help efforts, the level of their demands tends to be high”. Therefore in the next section the author will attempt to investigate this suspicion.
4. Factor Analysis on the East–West Differences via Regression AnalysisIn order to examine the questions arising from the results of the analysis in the previous
section, this section conducts a multiple regression analysis as to whether the regional difference between east and west, which was observed as the aggregate results of the ERINA Survey, is detectable at the same time as controlling other factors which would have an influence on the responses of firms.
Below, sub-section 4.1 explains the analytical method, and sub-sections 4.2 and 4.3 undertake factor analysis of the east–west differences observed in the previous section regarding demand for external environment improvement and independent improvement efforts, respectively.
4.1 Analytical MethodWithin the two fields of “demand for improvement in the external environment” and
“independent improvement efforts”, taking as examination targets the categories where a significant difference between east and west was discernible, an analysis of which factors strengthen demand (demand promotion factors) and which factors encourage independent efforts
28 The Northeast Asian Economic Review

(independent effort promotion factors) was undertaken. The semantic content and definition of the variables used in the regression analysis and the descriptive statistics are shown in Table 7.
First, in the analysis of the demand promotion factors, as significant east–west differences were ascertained in all eight categories, eight models were estimated with all as targets for analysis. The dependent variables for each model were: new construction and expansion of infrastructure (logiinfradev); improvement and modernization of infrastructure (logiinfrares); transportation fee reduction or subsidies for transportation (transfee); relaxation of freight transportation-related regulations (transreg); strengthening of anti-monopoly policy in the transportation sector (transanti); raising of the quality of the services of forwarding businesses (transqua); streamlining and expedition of cross-border procedures for freight (custom); and enhancement of transportation services for special freight (including frozen and refrigerated freight, and oversize freight) (spectrans). Each dependent variable was an ordinal variable with incremental figures in three levels depending on the degree of necessity given in the responses.
As independent variables, other than the dummy variable (east) which designates eastern firms as 1, the author introduced control variables representing several factors which might influence what kind of improvement in the transport and logistics environment firms demand. More specifically, as a proxy variable for the local regional environment, and in particular the level of infrastructure development, the models employed the railway density (raildens) by area for the federal subjects of the Russian Federation as shown above in Table 3. Furthermore, as it is conceivable that the closeness of relations with the government has an impact on the manner of requesting changes in rules and policy, the models employed another proxy variable for this, a dummy variable (staown) which designates state-owned enterprises as 1. Further still, as it is conceivable that the nature of relations with clients also has an impact on the logistics needs of firms, the models introduced: a dummy variable (b2c) which designates as 1 firms which engage in consumer-oriented business (business-to-consumer firms); a dummy concerning the existence of dealings with overseas firms (forpart); an ordinal variable (inputrange) which represents the distance to the location of the main procurement source for raw materials, components, etc.; and an ordinal variable (outputrange) which represents the distance to the main shipping destination or markets for merchandise and finished goods. Lastly, adding a group of industrial sector dummies6 to control the fixed effect for the industries to which the surveyed firms belong, the regression analysis estimated all these variables simultaneously with east. In dealing with the dependent variables being ordinal variables, an ordered probit model was used in the estimation of the regression model.
In the analysis of independent effort promotion factors, there were three target categories—the utilization of comprehensive distribution (3PL) firms (logicom), establishment of own-company distribution facilities (warehouses, etc.) (ownlogicen), and utilization and nurturing of specialist logistics personnel (logistaff)—where there were significant east–west differences, and three models respectively were estimated for each with the dependent variables. All the dependent variables (x) were estimated simultaneously, employing the same set of control variables as the factor analysis of the demand for improvement in the external environment, in addition to the eastern firm dummy (east). As the dependent variables were dummy variables containing the two options of adoption or non-adoption of improvement measures, a probit model was used for the estimations.
29The Transportation and Logistics Environment of the Eastern Region of Russia: A Comparative Evaluation with the Western Region Based on Microdata

Table 7: The Semantic Content and Definition of the Variables Used in the Regression Analysis and the Descriptive Statistics
Variable Name Semantic Content and Definition of Variables
Descriptive Statistics
No. of Obs. Avg. S.D. Median Min. Max.
logiinfradev Freight transportaion infrastructure: new construction and expansion1 624 1.056 0.702 1 0 2
logiinfrares Freight transport infrastructure: inprovement and modernization1 622 1.061 0.711 1 0 2
transfee Transportation fee reduction or subsidies to transportation fee1 660 1.315 0.671 1 0 2
transreg Relaxation of freight transportation-related regulation1 634 1.106 0.733 1 0 2
transanti Strengthening of anti-monopoly policy in the transportation sector1 595 1.005 0.764 1 0 2
transqua Raising of the quality of the services of forwarding businesses1 584 0.923 0.740 1 0 2
custom Streamlining and expedition of cross-border procedure for freight1 472 1.051 0.767 1 0 2
spectrans Enhancement of transportation services for special freight1 496 0.998 0.748 1 0 2
logicom Utilization of comprehensive distribution firms (3PL, etc.)2 599 0.132 0.339 0 0 1
ownlogicen Securing of firm’s own distribution facilities2 599 0.147 0.354 0 0 1
logistaff Utilization and nurturing of specialist logistics personnel2 599 0.112 0.315 0 0 1
east Dummy for firms in eastern Russia3 742 0.482 0.500 0 0 1
raildens Rail density of host federal subject4 742 148.657 100.810 95 2 295
staown Dummy for state-owned enterprises5 690 0.101 0.302 0 0 1
b2c Dummy for transactions and services aimed at consumers5 724 0.608 0.489 1 0 1
forpart Dummy for existing of foreign partners6 733 0.317 0.465 0 0 1
inputrange Location of main suppliers of raw and intermediate inputs7 680 1.429 1.126 1 0 4
outputrange Location of main destination of products and merchandize goods7 732 1.092 1.075 1 0 4
Notes: 1. Category variable: 0 = not necessary; 1 = desirable; 2 = necessary 2. Dummy variable: 0 = not adopted; 1 = adopted 3. Dummy variable: 0 = western region; 1 = eastern region 4. Continuous variable: km/10,000 km2
5. Dummy variable: 1 = applicable firm (state-owned enterprise, business-to-consumer firms); 0 = other 6. Dummy variable: 0 = no; 1 = yes 7. Category variable: 0 = same city; 1 = outside city, same federal subject; 2 = up to 3,000 km away in other federal
subject; in federal subject further than 3,000 km away; 4 = abroadSource: Compiled by author based on the ERINA Survey
30 The Northeast Asian Economic Review

4.2 Factors Promoting Demand for Improvement of the External EnvironmentThe estimation results of the ordered probit model taking the eight variables from
logiinfradev to spectrans as dependent variables, are as shown in Table 8. While the analysis in the previous section made it clear that for eastern firms the tendency to demand improvement in the external environment is significantly strong, the model estimation results revealed that out of eight demand categories the only category where the strong demand could be attributed to the eastern firm dummy (east) was the “enhancement of transportation services for special freight”. For the other categories, the results were ones that several factors introduced as control variables—specifically factors related to the external conditions surrounding the relevant firms or the firms’ own peculiarities—can explain for the recognition of the necessity of improvement. The paragraphs below describe what kind of external conditions and peculiarities of the firms tend to enhance their necessity of improvement of the external environment.
First, looking at railway density (raildens), a proxy variable for the level of infrastructure development, a significant negative regression coefficient was estimated in five estimation models from the total eight. That is, the estimation results showed that the lower a region’s railway density, the stronger the tendency becomes for firms located there to demand improvements in the environment in a wide range of sectors. The railway density was introduced as a proxy variable for the level of infrastructure development. It can easily be understood that in regions where this is low the demand for improvement relating to infrastructure strengthens. At the same time, it is also conceivable that railway density is a variable which shows the spatial density of economic activity. In case of firms located in regions with sparse economic activity, it is highly likely that part or all of the transportation distance among the various procured raw materials and components and shipped products will be long, and consequently it is conceivable that this will become a factor for demanding a reduction in transportation fees. Furthermore, it is imaginable that in these regions transportation firms are monopolistic or oligopolistic and that the forwarders able to provide the desired services are not in place, and there is the possibility of this being linked with the respective demands for improvement.
Furthermore, in model [7] which analyzed cross-border procedures, the coefficient of the dealings with overseas firms dummy (forpart) having the extremely large value of 0.554 clearly shows where the problem is, which is considered a suggestive analytical result.
Otherwise characteristic was that the estimated coefficient for the business-to-consumer (b2c), one of the control variables, was significantly positive in all the estimation models. That is, B-to-C firms demand improvement of the external environment in all categories; in other words, they have a higher demand level relating to the transport and logistics environment.
As said before, the eastern firm dummy had a significant positive effect only on the demand for improvement regarding the “enhancement of transportation services for special freight”. It may be said that the need for transportation services for special freight in the eastern region is particularly high, or that the service providers are particularly lacking. In any case, on this issue, elements other than the factors introduced as control variables are having a strong effect in the eastern region.
As a whole, in the great majority of models the coefficient for east was not significant, which means that among the managements of firms in the eastern region, the managements in a position where they should naturally demand improvement, considering their external conditions (lack of infrastructure, etc.) and their company’s own characteristics (B2C firms, etc.), respond that it is necessary, and those not in such a position do not recognize a necessity. In other words,
31The Transportation and Logistics Environment of the Eastern Region of Russia: A Comparative Evaluation with the Western Region Based on Microdata

Tabl
e 8:
The
Est
imat
ion
Res
ults
for
the
Dem
and
Prom
otio
n Fa
ctor
sM
odel
[1]
[2]
[3]
[4]
[5]
[6]
[7]
[8]
Estim
ator
Ord
ered
Pro
bit
Ord
ered
Pro
bit
Ord
ered
Pro
bit
Ord
ered
Pro
bit
Ord
ered
Pro
bit
Ord
ered
Pro
bit
Ord
ered
Pro
bit
Ord
ered
Pro
bit
Dep
ende
nt V
aria
ble
logi
infr
adev
logi
infr
ares
tran
sfee
tran
sreg
tran
sant
itr
ansq
uacu
stom
spec
tran
s
east
0.09
60.
120
0.15
10.
156
0.27
7-0
.128
0.10
00.
356
*
(0.1
6)(0
.16)
(0.1
6)(0
.16)
(0.1
8)(0
.17)
(0.2
2)(0
.20)
raild
ens
-0.0
02**
-0.0
02**
*-0
.002
***
0.00
0-0
.002
*-0
.002
**-0
.001
-0.0
01
(0.0
0)(0
.00)
(0.0
0)(0
.00)
(0.0
0)(0
.00)
(0.0
0)(0
.00)
stao
wn
0.28
0*
0.18
70.
046
0.27
7*
0.26
70.
258
0.25
90.
268
(0.1
6)(0
.13)
(0.1
7)(0
.15)
(0.1
6)(0
.16)
(0.1
9)(0
.16)
b2c
0.28
5**
0.27
6**
0.18
8*
0.22
3**
0.50
7**
*0.
355
***
0.45
9**
*0.
425
***
(0.1
2)(0
.11)
(0.1
1)(0
.11)
(0.1
2)(0
.11)
(0.1
3)(0
.12)
forp
art
0.17
70.
236
*0.
212
*0.
203
*-0
.003
0.18
30.
564
***
0.27
4*
(0.1
3)(0
.12)
(0.1
2)(0
.12)
(0.1
3)(0
.13)
(0.1
4)(0
.14)
inpu
tran
ge-0
.007
0.04
50.
101
*0.
027
0.05
0-0
.009
-0.0
050.
003
(0.0
5)(0
.05)
(0.0
5)(0
.05)
(0.0
5)(0
.05)
(0.0
6)(0
.06)
outp
utra
nge
0.03
2-0
.001
0.08
9-0
.025
0.08
40.
064
0.06
30.
107
*
(0.0
6)(0
.06)
(0.0
6)(0
.06)
(0.0
6)(0
.06)
(0.0
6)(0
.06)
Indu
stry
Dum
mie
sye
sye
sye
sye
sye
sye
sye
sye
s
N52
853
156
354
650
850
640
543
0
Wal
d Te
st (x
2 )165
.23
***
77.2
9**
*89
.15
***
36.7
3**
87.2
9**
*59
.28
***
598.
25**
*72
.39
Pseu
do R
20.
010.
060.
080.
030.
070.
050.
090.
06
Log
likel
ihoo
d-5
14.8
2-5
12.4
2-5
07.4
6-5
63.4
0-5
11.4
3-5
13.6
3-5
13.6
3-4
30.4
3
Not
es:
1. N
ull h
ypot
hesi
s: a
ll co
effic
ient
s are
zer
o.
2. T
he fi
gure
s in
pare
nthe
sis a
re ro
bust
stan
dard
err
ors.
***
= si
gnifi
canc
e le
vel o
f 1%
; **
= si
gnifi
canc
e le
vel o
f 5%
; and
* =
sign
ifica
nce
leve
l of 1
0%;
Sour
ce:
Aut
hor’s
est
imat
es. F
or th
e se
man
tic c
onte
nt a
nd d
efini
tion
and
the
desc
riptiv
e st
atis
tics f
or e
ach
varia
ble,
see
Tabl
e 7
32 The Northeast Asian Economic Review
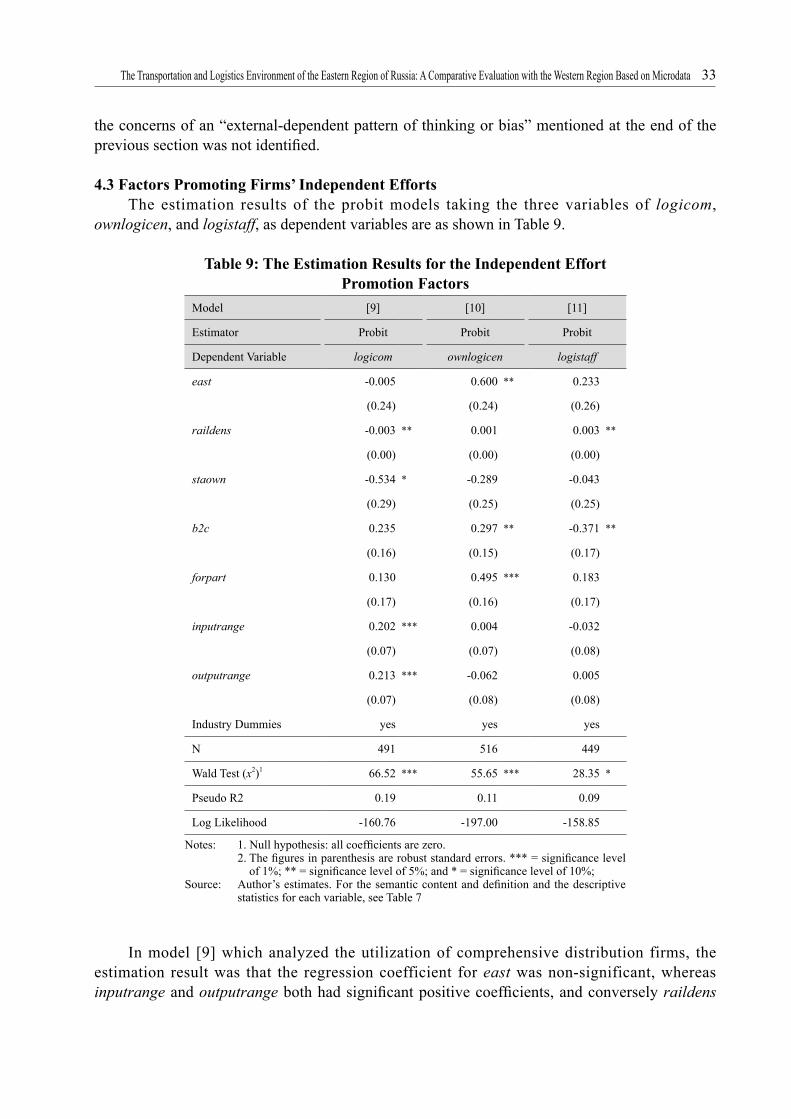
the concerns of an “external-dependent pattern of thinking or bias” mentioned at the end of the previous section was not identified.
4.3 Factors Promoting Firms’ Independent EffortsThe estimation results of the probit models taking the three variables of logicom,
ownlogicen, and logistaff, as dependent variables are as shown in Table 9.
Table 9: The Estimation Results for the Independent Effort Promotion Factors
Model [9] [10] [11]
Estimator Probit Probit Probit
Dependent Variable logicom ownlogicen logistaff
east -0.005 0.600 ** 0.233
(0.24) (0.24) (0.26)
raildens -0.003 ** 0.001 0.003 **
(0.00) (0.00) (0.00)
staown -0.534 * -0.289 -0.043
(0.29) (0.25) (0.25)
b2c 0.235 0.297 ** -0.371 **
(0.16) (0.15) (0.17)
forpart 0.130 0.495 *** 0.183
(0.17) (0.16) (0.17)
inputrange 0.202 *** 0.004 -0.032
(0.07) (0.07) (0.08)
outputrange 0.213 *** -0.062 0.005
(0.07) (0.08) (0.08)
Industry Dummies yes yes yes
N 491 516 449
Wald Test (x2)1 66.52 *** 55.65 *** 28.35 *
Pseudo R2 0.19 0.11 0.09
Log Likelihood -160.76 -197.00 -158.85
Notes: 1. Null hypothesis: all coefficients are zero. 2. The figures in parenthesis are robust standard errors. *** = significance level
of 1%; ** = significance level of 5%; and * = significance level of 10%;Source: Author’s estimates. For the semantic content and definition and the descriptive
statistics for each variable, see Table 7
In model [9] which analyzed the utilization of comprehensive distribution firms, the estimation result was that the regression coefficient for east was non-significant, whereas inputrange and outputrange both had significant positive coefficients, and conversely raildens
33The Transportation and Logistics Environment of the Eastern Region of Russia: A Comparative Evaluation with the Western Region Based on Microdata

had a significant negative coefficient. Considered in conjunction with the analysis results in the previous section of there being many firms utilizing comprehensive distribution firms in the eastern region, the possible interpretation is that external services are being used proactively in the eastern region, as there are many firms undertaking long-distance procurement and shipment, and there are limits for them to tackle the issues by themselves.
In model [10] which analyzed the establishment of own-company distribution facilities, the effect of east was estimated to be significant and positive. The coefficients for forpart and b2c were also significant positive ones, but in terms of the magnitude of coefficients, east was the largest. This result shows that the special circumstances of the eastern region have a strong impact which cannot be explained by the independent variables introduced into this model. As discussed in Section 2, the current situation in the special zones of the Russian Far East witnesses the unsatisfied needs of firms for warehousing and services incidental to transportation. Given such circumstances, the estimation results of this model suggest that the provision of transportation-related services including commercial warehousing and logistics centers is lacking in the eastern region.
Regarding the utilization and nurturing of specialist logistics personnel, the analysis of the previous section gave the result of the eastern region being lower for this. In the regression analysis results here (model [11] ), the regression coefficient for east was non-significant. On the other hand, a significant positive coefficient was estimated for raildens, and a significant negative coefficient for b2c. Taken together with the model estimation results on the utilization of comprehensive distribution firms mentioned above, in regions where railway density is low, firms don’t undertake the utilization and nurturing of specialist logistics personnel in house, but have a tendency to pursue outsourcing.
5. ConclusionIn this paper, based on the results of the 2015 ERINA Survey, the author attempted to grasp,
via comparison with the western region, the actual situation for eastern Russia’s transport and logistics environment.
From the simple east–west comparison of the aggregated results, it was shown that although the east–west difference was small in terms of company activities to tackle logistics problems by investing a certain amount of their own resources, in terms of making demands externally (other players), there was a tendency for eastern firms to strongly demand improvement.
In so doing, the demand for improvement of eastern firms doesn’t stop only at the development of infrastructure, but extends into wide-ranging areas, including the reduction of the burden of transportation costs in particular, and other institutions and policy as well as the quality and breadth of transportation services.
Regarding such demands for improvement, according to the testing via multivariate analysis, the author reached the conclusion that it is proper to interpret the result in such a way that there are many firms hoping for improvement in the eastern region, as there are many firms which necessitate the improvement of the transport and logistics environment from such matters as the external conditions and the firm’s characteristics. That is, it is not the case that the managements of eastern firms are groundlessly taking up “demand for demand’s sake”. When talking with Russians, one often hears “the residents of the Far East are too used to support from the center, and there is a tendency to demand things originally unnecessary”, but such a tendency cannot be seen from the managements of firms targeted in the ERINA Survey.
34 The Northeast Asian Economic Review

To summarize this conclusion, the transportation and logistics environment of eastern Russia is inferior in comparison with the western region, and improvement in both hard and soft aspects is necessary. On this point, because it is considered that the managements of firms have reasonable demands, it will be necessary for Russia’s federal and regional policymakers to seriously confront such demand from eastern firms.
AcknowledgementThe paper is one of the outcomes of the research project “Market Quality in the Far East:
from Viewpoint of Company Management” sponsored by the Economic Research Institute for Northeast Asia (ERINA). The preliminary research findings were presented at several workshops and seminars, including the Russia-Japan Seminar “Quality of Market according to Company Management” in Vladivostok, March 6, 2017 and a session at the second World Congress of Comparative Economics in Saint Petersburg, June 15-17, 2017. The author expresses sincere gratitude to Yoshiaki Nishimura, former Representative Director of ERINA, for his initiative for the project, as well as the project members and participants of the seminars for their valuable comments.
* Director and Senior Research Fellow, Research Division, Economic Research Institute for Northeast Asia (ERINA)
1 For the details of the ERINA Survey, see Arai and Iwasaki (2016).2 Cargo handling volumes and container figures from Mortsentr (2018).3 In Russia’s Far Eastern ports, there are the cases of cargo-handling machinery such as cranes being decrepit,
and the railway sidings to wharves being few.4 The Port of Vladivostok and the Port of Nakhodka are in urban areas, and enlarging the area for wharves is
extremely difficult.5 In these special zones, only those firms which have obtained the status of “resident” are able to enjoy the
preferential treatment stipulated in the special zone systems. When applying to become resident firms, it is required that they make clear the business they plan to engage in. At that time, there are many cases of applications which also include other incidental business in the original business.
6 Industries in a total of 13 sectors: mining; food; light industry; paper manufacturing and wood processing; the chemical and petrochemical industry; construction materials; metal processing; machine manufacturing; essential utilities; construction; distribution; transportation; and communications. The default category is agriculture, forestry, and fisheries.
References
ARAI, Hirofumi and Ichiro IWASAKI (2016). Market Quality in the Russian Far East from the Viewpoint of Company Management: Preliminary Report on Microeconomic Comparative Analysis with European Regions. (ERINA Discussion Paper No. 1602-e)
BALALAEV, Aleksandr et al. (2008). Formirovanie logisticheskoi transportno-raspreditel’noi sistemy Khabarovskogo kraia [Formation of Logistics Transport-Distribution System of Khabarovsk Krai]. Khabarovsk: FESTU Publishing Bureau [in Russian]
Government of Russia (2008). Strategiia razvitiia zheleznodorozhnogo transporta v Rossiiskoi Federatsii do 2030 goda [Strategy for Developing Rail Transport in the Russian Federation up to 2030]. (Government order of Russian Federation No. 877-r of June 17, 2008) [in Russian]
35The Transportation and Logistics Environment of the Eastern Region of Russia: A Comparative Evaluation with the Western Region Based on Microdata

Government of Russia (2009). Strategiia sotsial’no-economicheskogo Razvitiia Dal’nego Vostoka i Baikal’skogo Regiona na period do 2030 goda [Strategy for the Socio-Economic Development of the Far East and Zabaykalye for the Period up to 2025]. (Government order of Russian Federation No. 2094-r of December 28, 2009] [in Russian]
MINAKIR, Pavel and Valentin SERGIENKO eds. (2011). Sintez nauchno-tekhnicheskikh i ekonomicheskikh prognozov: Tikhookeanskaia Rossiia – 2050 [The Synthesis of Scientific-Technological and Economic Forecasts: Pacific Russia – 2050]. Vladivostok: Dal’nauka [in Russian]
Mortsentr TEK (2018). Obzor perevozok gruzov cherez morskie porty za 2017 god [Overview of Freight Transportation through Sea Ports in 2017]. Moscow [in Russian]
36 The Northeast Asian Economic Review
Economic Effects of Free Trade Agreements in Northeast Asia: CGE Analysis with the GTAP 9.0a Data Base
ENKHBAYAR Shagdar*NAKAJIMA Tomoyoshi**
Abstract
Despite growing trade and economic relations among the countries in the Northeast Asian (NEA) region, there are only two bilateral free trade agreements in effect currently. The China–ROK Free Trade Agreement entered into force on 20 December 2015 and the Japan–Mongolia Economic Partnership Agreement (EPA) became effective on 7 June 2016. However, several EPAs and free trade agreements (FTAs) are under negotiation or have prospects to emerge among not only the countries in the region, but also surrounding regions and countries.
An analysis of the economic effects of the ongoing FTA (China–Japan–Korea Trilateral Free Trade Agreement (CJK FTA)), and several other prospective FTAs—Northeast Asia Preferential Free Trade Agreement (NEA FTA); Northeast Asia plus the Eurasian Economic Union (EAEU) Preferential Free Trade Area (NEA+EAEU FTA); and Northeast Asia plus the Regional Comprehensive Economic Partnership (RCEP) plus the EAEU Preferential Free Trade Area (NEA+RCEP+EAEU FTA)—using the standard CGE Model and GTAP Data Base 9.0a revealed that all parties of the agreements will benefit from the formation of these free trade agreements, having welfare gains and real GDP expansions regardless of international capital mobility status—i.e. whether the capital is internationally mobile or not. Moreover, the results indicated that for the NEA region as a whole, the NEA FTA is preferable to the CJK FTA alone, and it would be even better off with the formation of wider free trade areas, such as with the other RCEP and EAEU members.
Keywords: Free trade, CGE analysisJEL classification codes: F150, C680
1. The ModelIn analyzing the expected economic effects of FTAs in Northeast Asia, we employed
the Global Trade Analysis Project (GTAP) Data Base (Version 9.0a) and the standard GTAP Model (The Model). The GTAP Model is a multi-region and multi-sector Computable General Equilibrium (CGE) model1 with perfect competition and constant returns to scale. Bilateral trade is handled via the Armington assumption. It combines detailed bilateral trade, transport and protection data characterizing the economic linkages among regions, together with individual country input–output databases, which account for inter-sectoral linkages.
The GTAP Data Base 9.0a has triple reference years (2004, 2007 and 2011) and this analysis used 2011 as the reference year. Thus the values indicated in this analysis are expressed in constant 2011 US$ terms. The data are for 140 regions and 57 commodities, and in the consideration of the target countries the regions were aggregated into 12 from the original 140 regions in the model, while the original 57 sectors in the model were not aggregated. The aggregated regions are: China, Japan, the ROK, Mongolia, Russia, the EAEU4, ASEAN9, ANZI, the Rest of Asia, the United States, the EU_28, and Rest of World. Due to lack of data, the DPRK was not included in the Northeast Asia region, but the country is included implicitly in the Rest of Asia region as a part of the Rest of East Asia. Thus, the NEA region in this analysis refers to
37The Northeast Asian Economic Review Vol. 6, No. 1, July 2018

five countries in the region, excluding the DPRK (Appendix Tables I and II).The original eight factors in the Model were aggregated into four factors: land, labor, capital
and natural resources, where land and natural resources are immobile and labor and capital are mobile factors (Appendix Table III).
The composition of GDP of the countries in question is provided in Table 1. GDP shares of foreign trade activities were the highest for Mongolia among the selected countries with exports and imports each exceeding 70% of the country’s GDP.
Table 1: Composition of GDP, %
Regions/Countries
Private Consumption Investment Government
Consumption Exports Imports Total
China 36.3 46.1 13.5 26.7 -22.6 100
Japan 59.7 20.4 20.2 16.0 -16.2 100
ROK 52.7 31.0 14.4 51.3 -49.4 100
Mongolia 47.3 47.7 12.6 71.0 -78.6 100
Russia 49.5 21.8 18.5 29.2 -19.0 100
EAEU4 54.5 26.5 12.8 43.7 -37.4 100
ASEAN9 57.9 28.2 10.8 56.7 -53.6 100
ANZI 58.7 30.2 14.8 20.5 -24.2 100
Rest of Asia 65.9 20.9 10.6 53.8 -51.2 100
USA 70.1 18.5 16.5 12.1 -17.2 100
EU_28 59.9 19.0 22.0 39.3 -40.3 100
Rest of World 58.3 21.8 16.7 30.8 -27.6 100
World 58.9 23.5 17.6 28.2 -28.2 100Source: GTAP 9.0a Data Base
2. The ExperimentsFour FTA scenarios in the NEA region were considered in the simulations where the ad
valorem import tariffs and tariff equivalents of bilateral nontariff barriers (NTBs) between the countries in question were removed on a preferential basis. The scenarios were:i) China–Japan–Korea Trilateral Free Trade Agreement (CJK FTA). The members are: China,
Japan and the ROK (CJK);ii) Northeast Asia Preferential Free Trade Agreement (NEA FTA). The members are the CJK
members plus Mongolia and Russia (NEA);iii) Northeast Asia plus the Eurasian Economic Union (EAEU) Free Trade Area (NEA+EAEU
FTA). The members are CJK, Mongolia, Russia and the other four members of the EAEU (EAEU4). The EAEU4 members are described in the Appendix Table I;
iv) Northeast Asia plus RCEP plus the EAEU Preferential Free Trade Area (NEA+RCEP+EAEU FTA). The members are NEA plus the EAEU4, ASEAN9 and ANZI members. The ASEAN9 and ANZI members are described in the Appendix Table I.
38 The Northeast Asian Economic Review

Source-specific change in tax on imports of commodity “i” from country “r” into country “s” is expressed by a variable “tms (i,r,s)” in the Model and shocks were applied for a target rate of zero for this variable. Both values of the parameter “RORDELTA”, which is the investment allocation binary coefficient in the Model, were applied in each scenario to observe the impacts of investment allocation decisions in the assumed FTAs. The default value of the parameter RORDELTA in the Model equals 1, where investment is allocated across regions to equate the change in the expected rates of return, rore (r) which implies international capital mobility. When RORDELTA equals 0, investments are allocated across regions to maintain the existing composition of capital stock (no international capital mobility) and it effectively fixes the trade balance for each country/region. Description of the experiments is provided in Box 1. The solution method was Gragg, or a multiple step extrapolation method.
In order to simplify the application of shocks to the Model, three additional subsets of the regions were created by modifying the CMFSTART file of the GTAP Model. These are: CJK, NEA4 (China, Japan, the ROK, and Mongolia) and RCEP (China, Japan, the ROK, ASEAN9 and ANZI) and the modified CMFSTART file is illustrated in Box 2, where rows numbered from 7 to 15 were added into the default version of the CMFSTART file. The CMFSTART file contains some additional instructions, which are sent to GEMPACK prior to solving the model.
Box 1: Description of the Experiments
Experiments:Complete removal of ad valorem import tariffs
and tariff equivalents of bilateral nontariff barriers (NTBs)
(tms = 0%)Export interventions
were not altered.
a. China–Japan–Korea Trilateral Free Trade
Agreement (CJK FTA)Shock
tms(TRAD_COMM,CJK,CJK) = target % 0 from file tms.shk;
Experiment 1: Default
(RORDELTA = 1)
Experiment 2: (RORDELTA = 0)
b. Northeast Asia Preferential Free Trade
Area (NEA FTA)(Shocks list is in Box 3)
Experiment 3: Default
(RORDELTA = 1)
Experiment 4: (RORDELTA = 0)
c. Northeast Asia plus Eurasian Economic Union
Free Trade Area (NEA+EAEU FTA)
(Shocks list is in Box 4)
Experiment 5: Default
(RORDELTA = 1)
Experiment 6: (RORDELTA = 0)
d. Northeast Asia plus RCEP plus Euroasian
Economic Union Preferential Free Trade
Area (NEA+RCEP+EAEU FTA)
(Shocks list is in Box 5)
Experiment 7: Default
(RORDELTA = 1)
Experiment 8: (RORDELTA = 0)
39Economic Effects of Free Trade Agreements in Northeast Asia: CGE Analysis with the GTAP 9.0a Data Base

Box 2: The Modified CMFSTART file
1. ! If a version has no CMFSTART file of its own2. ! RunGTAP creates one by copying the supplied file CMFSTART.DEF3. CPU = yes; ! log show simulation times4. NDS = yes; ! no displays5. Extrapolation accuracy file = NO ; ! No XAC file6. !servants = 1; ! use 2 processors at once, if possible7. XSET NEA4 #NEA4 regions#8. (China, Japan, ROK, Mongolia);9. XSUBSET NEA4 is subset of REG;10. XSET CJK #ChinaJapanKorea#11. (China, Japan, ROK);12. XSUBSET CJK is subset of NEA4;13. XSET RCEP #RCEP regions#14. (China, Japan, ROK, ASEAN9, ANZI);15. XSUBSET RCEP is subset of REG;
Source: GTAP Model
Box 3: Shock Statements in NEA FTA Scenario
Shock tms(TRAD_COMM,NEA4,NEA4) = target % 0 from file tms.shk;Shock tms(TRAD_COMM,NEA4,”Russia”) = target % 0 from file tms.shk;Shock tms(TRAD_COMM,”Russia”,NEA4) = target % 0 from file tms.shk;
Source: GTAP Model
Box 4: Shock Statements in NEA+EAEU FTA Scenario
Shock tms(TRAD_COMM,NEA4,NEA4) = target % 0 from file tms.shk;Shock tms(TRAD_COMM,NEA4,”Russia”) = target % 0 from file tms.shk;Shock tms(TRAD_COMM,”Russia”,NEA4) = target % 0 from file tms.shk;Shock tms(TRAD_COMM,”Russia”,”EAEU”) = target % 0 from file tms.shk;Shock tms(TRAD_COMM,”EAEU”,”Russia”) = target % 0 from file tms.shk;Shock tms(TRAD_COMM,”EAEU”,NEA4) = target % 0 from file tms.shk;Shock tms(TRAD_COMM,NEA4,”EAEU”) = target % 0 from file tms.shk;
Source: GTAP Model
40 The Northeast Asian Economic Review

Box 5: Shock Statements in NEA+RCEP+EAEU FTA Scenario
Shock tms(TRAD_COMM,RCEP,RCEP) = target % 0 from file tms.shk;Shock tms(TRAD_COMM,RCEP,”EAEU”) = target % 0 from file tms.shk;Shock tms(TRAD_COMM,”EAEU”,RCEP) = target % 0 from file tms.shk;Shock tms(TRAD_COMM,”EAEU”,”EAEU”) = target % 0 from file tms.shk;Shock tms(TRAD_COMM,RCEP,”Mongolia”) = target % 0 from file tms.shk;Shock tms(TRAD_COMM,RCEP,”Russia”) = target % 0 from file tms.shk;Shock tms(TRAD_COMM,”Mongolia”,RCEP) = target % 0 from file tms.shk;Shock tms(TRAD_COMM,”Russia”,RCEP) = target % 0 from file tms.shk;Shock tms(TRAD_COMM,”Russia”,”EAEU”) = target % 0 from file tms.shk;Shock tms(TRAD_COMM,”Mongolia”,”EAEU”) = target % 0 from file tms.shk;Shock tms(TRAD_COMM,”Mongolia”,”Russia”) = target % 0 from file tms.shk;Shock tms(TRAD_COMM,”Russia”,”Mongolia”) = target % 0 from file tms.shk;Shock tms(TRAD_COMM,”EAEU”,”Russia”) = target % 0 from file tms.shk;Shock tms(TRAD_COMM,”EAEU”,”Mongolia”) = target % 0 from file tms.shk;
Source: GTAP Model
3. The Resultsa) China–Japan–Korea Trilateral Free Trade Agreement (CJK FTA)
In terms of the equivalent variation (EV), which is an indicator for measuring the effect on public welfare, the simulation results demonstrated that all three countries, China, Japan and the ROK, would benefit from the CJK FTA regardless of the investment allocation decisions, while other countries and regions, including those in the NEA region, would experience welfare losses and real GDP contractions.
In Experiment 1, with international capital mobility, Japan would have the largest welfare gain of US$21.4 billion, while those for the ROK and China equaled US$11.2 billion and US$1.9 billion, respectively. Most of Japan’s welfare gain was associated with gains in terms of trade in goods and services equaling US$15.2 billion, while the ROK had relatively equal gains in terms of allocative efficiency (US$5.6 billion) and terms of trade in goods and services (US$5.8 billion). However, the ROK may experience a slight loss in its terms of trade in investment and savings equaling US$237 million. At the same time, China’s allocative efficiency and terms of trade in investment and savings were improved by US$4.46 billion and US$475 million, respectively, while the country’s terms of trade in goods and services would worsen by US$3.05 billion. However, the net effect was positive, equaling US$1.88 billion, as the allocative efficiency and terms of trade in investment and savings gains were larger than the terms of trade losses in goods and services. Although Russia was not a part of the CJK FTA, the country may benefit by having a welfare gain of US$43 million, when the capital is not mobile across regions (Table 2).
In addition, the simulation results indicated that the CJK FTA would result in positive changes in all the three countries’ real GDP (expressed in the GDP quantity index) regardless of the investment allocation decisions. The ROK’s real GDP change was the highest, equaling 0.467% and 0.356% depending on the investment allocation decisions, while those for Japan were 0.1% and 0.096%, and for China 0.061% and 0.054%. Higher values were observed when
41Economic Effects of Free Trade Agreements in Northeast Asia: CGE Analysis with the GTAP 9.0a Data Base

capital is internationally mobile (Table 3).
b) Northeast Asia Preferential Free Trade Area (NEA FTA)As expected, all members of the NEA region had welfare gains in the case of the NEA FTA,
regardless of investment allocation decisions, while other regions would experience welfare losses and real GDP contractions. Welfare gains for Japan were the highest among the FTA members, equaling US$23.5 billion, followed by the ROK’s US$12.4 billion and China’s US$5.1 billion, when capital is internationally mobile. The other members of this FTA, Russia and Mongolia, had welfare gains of US$1.97 billion and US$58 million, respectively. These values were lower when capital is internationally immobile (Table 2).
When capital is internationally mobile (Experiment 3), most of the welfare gains were associated with allocative efficiency gains as well as improvements in terms of trade in goods and services for all NEA countries, except Russia. Russia would have a loss of US$785 million in its terms of trade in goods and services, but due to its gains of US$1.5 billion in its terms of trade in investment and savings and US$1.2 billion gains in allocative efficiency, the country’s total welfare gain from this FTA was positive, equaling US$1.92 billion (Appendix Table V).
Moreover, all members of the NEA FTA would expect positive changes in their real GDP regardless of investment allocation decisions. The gains were higher when capital is internationally mobile. The ROK would benefit most from the formation of the NEA FTA, with its real GDP increasing by 0.482% when capital is internationally mobile and 0.363% when capital is internationally immobile. In addition, the foreign trade activities of all NEA countries would increase as a result of this agreement and the increase for merchandize exports ranged between 1.12% (the lowest) for Japan and 4.374% (the highest) for the ROK, depending on international capital mobility, while the increase for merchandize imports would range between 1.049% (the lowest) for Mongolia and 5.274% (the highest) for the ROK. However, Mongolia’s merchandise exports would decline by 0.401% when international capital is mobile (Tables 3, 5 and 6).
In terms of nominal GDP (expressed in the value of GDP), Russia may be affected negatively in both the cases of international capital mobility due to drops in its aggregate prices. Russia’s GDP price index dropped respectively by 0.883% and 1.145%, when capital is internationally mobile and immobile. In addition, the prices of Russia’s merchandise exports declined in both cases and the price index of its merchandise exports were 0.264% and 0.347% lower, respectively, when capital is internationally mobile and immobile. Mongolia would also experience a drop in its nominal GDP of 0.313% without international capital mobility, due to the 0.334% reduction in its aggregate prices (Table 4 and Appendix Tables VII and VIII).
c) Northeast Asia plus the Eurasian Economic Union (EAEU) Preferential Free Trade Area (NEA+EAEU FTA)
All countries in the NEA region would benefit from the formation of this FTA regardless of investment allocation decisions, while other countries and regions would experience welfare losses and real GDP contractions. The magnitude of these benefits were larger for all the NEA countries, except Russia, in the NEA+EAEU FTA scenario compared to the previous two FTA scenarios. The welfare gains ranged between US$61 million for Mongolia and US$23.5 billion for Japan, while Russia’s welfare gain became slightly lower than the NEA FTA scenario, equaling US$1.958 billion when capital is internationally mobile. At the same time, real GDP
42 The Northeast Asian Economic Review

expansion ranged between 0.062% (the lowest) for Russia and 0.484% (the highest) for the ROK when capital is internationally mobile. The gains were lower without international capital mobility and welfare gains ranged between US$21 million (the lowest) for Mongolia and US$20.4 billion (the highest) for Japan, while real GDP changes were 0.029% (the lowest) for Mongolia and 0.364% (the highest) for the ROK. Changes in nominal GDP had a similar pattern with the NEA FTA (Tables 3 and 4).
However, despite being a part of this FTA, the other four members of the EAEU (EAEU4) may experience welfare losses as a result of the formation of this FTA, along with contractions of their real and nominal GDP due to losses in their allocation efficiency and worsening of the terms of trade in goods and services. EAEU4‘s terms of trade in goods and services worsened by US$194 when capital is internationally mobile. Russia’s nominal GDP may also contract by 0.85% and 1.12% depending on international investment allocation decisions. This was associated with price drops of their merchandize exports. Price decline of merchandize exports in the EAEU area would range between 0.282% and 0.421% depending on international capital mobility (Table 3 and Appendix Table VIII).
d) Northeast Asia plus RCEP plus the EAEU Preferential Free Trade Area (NEA+RCEP+EAEU FTA)
All countries in the NEA, RCEP and EAEU areas, except the EAEU4, would benefit from formation of this FTA by having welfare gains and real GDP expansions regardless of investment allocation decisions, while other countries and regions would experience welfare losses and real GDP contractions. The magnitude of these gains were larger for all the NEA countries in this scenario than in the previous three FTA scenarios. Welfare gains ranged between US$70 million for Mongolia and US$31.8 billion for Japan and real GDP expansions were between 0.012% (the lowest) for the EAEU4 and 0.534% (the highest) for the ROK, when capital is internationally mobile. Without international capital mobility, the gains were lower and the welfare gains ranged between US$19 million for Mongolia and US$28 billion for Japan, while the ROK’s real GDP expansion was also the highest, equaling 0.394%. Similar to the previous FTA scenario, although being a part of this FTA, the EAEU4 members would experience welfare losses regardless of investment allocation decisions and may see no impacts on their real GDP when capital is not internationally mobile (Tables 2 and 3).
Impacts on nominal GDP had a similar pattern as in the NEA+EAEU FTA scenario. Mongolia’s aggregate level of prices became 1.083% lower when capital is not internationally mobile. Also, Russia, the EAEU4 and the ANZI members may experience reductions in their nominal GDP in both the cases of international capital mobility decisions due to drops of their aggregate price indices. At the same time, prices of merchandise exports of these countries would decline in a range of 0.098% to 0.439% (Table 4 and Appendix Tables VII, VIII).
43Economic Effects of Free Trade Agreements in Northeast Asia: CGE Analysis with the GTAP 9.0a Data Base

Table 2: Equivalent Variations (EVs) via the FTAs(2011 US$ million)
Regions
No international capital mobility International capital mobility
CJKFTA
NEAFTA
NEA+EAEU
FTA
NEA+RCEP+EAEU
FTA
CJKFTA
NEAFTA
NEA+EAEU
FTA
NEA+RCEP+EAEU
FTAChina 93 2,831 3,456 7,845 1,883 5,130 5,841 10,623 Japan 18,421 20,309 20,376 27,977 21,446 23,485 23,544 31,801 ROK 7,758 8,701 8,821 11,150 11,194 12,384 12,521 14,040 Mongolia -13 19 21 19 -26 58 61 70 Russia 43 1,824 1,817 2,492 -314 1,969 1,958 2,518 EAEU4 -15 -141 -185 -68 -78 -205 -111 -18 ASEAN9 -3,051 -3,458 -3,482 3,781 -3,800 -4,255 -4,290 6,207 ANZI -1,014 -1,178 -1,210 5,142 -1,765 -2,053 -2,109 7,904 Rest of Asia -2,753 -2,788 -2,796 -4,321 -3,048 -3,131 -3,145 -4,995 USA -2,753 -3,178 -3,266 -7,445 -5,139 -6,307 -6,495 -13,924 EU_28 -3,098 -6,066 -6,339 -10,724 -3,670 -7,364 -7,724 -13,753 Rest of World -1,687 -4,838 -5,142 -6,554 -4,272 -7,090 -7,385 -10,840
Source: GTAP Model, simulation results
Table 3: Real GDP Changes via the FTAs (qgdp = GDP quantity index)(% change)
Regions
No international capital mobility International capital mobility
CJKFTA
NEAFTA
NEA+EAEU
FTA
NEA+RCEP+EAEU
FTA
CJKFTA
NEAFTA
NEA+EAEU
FTA
NEA+RCEP+EAEU
FTAChina 0.054 0.062 0.064 0.101 0.061 0.070 0.072 0.112 Japan 0.096 0.100 0.100 0.161 0.100 0.104 0.104 0.166 ROK 0.356 0.363 0.364 0.394 0.467 0.482 0.484 0.534 Mongolia -0.006 0.021 0.029 0.062 -0.034 0.177 0.187 0.243 Russia 0.005 0.055 0.057 0.076 -0.001 0.062 0.062 0.081 EAEU4 -0.004 -0.031 -0.015 0.000 -0.008 -0.035 -0.001 0.012 ASEAN9 -0.018 -0.021 -0.021 0.110 -0.027 -0.031 -0.031 0.137 ANZI -0.006 -0.007 -0.007 0.213 -0.013 -0.016 -0.016 0.239 Rest of Asia -0.013 -0.013 -0.013 -0.022 -0.015 -0.016 -0.016 -0.029 USA -0.001 -0.002 -0.002 -0.003 -0.003 -0.004 -0.004 -0.007 EU_28 -0.003 -0.008 -0.008 -0.013 -0.002 -0.008 -0.008 -0.013 Rest of World -0.003 -0.007 -0.008 -0.012 -0.009 -0.014 -0.014 -0.024
Source: GTAP Model, simulation results
44 The Northeast Asian Economic Review

Table 4: Changes in Nominal GDP (vgdp = change in value of GDP)(% change)
Regions
No international capital mobility International capital mobility
CJKFTA
NEAFTA
NEA+EAEU
FTA
NEA+RCEP+EAEU
FTA
CJKFTA
NEAFTA
NEA+EAEU
FTA
NEA+RCEP+EAEU
FTAChina -0.214 0.002 0.041 0.234 -0.086 0.147 0.191 0.429 Japan 1.502 1.726 1.735 2.179 1.875 2.122 2.131 2.682 ROK 1.047 1.372 1.407 1.346 1.818 2.199 2.239 2.316 Mongolia -0.416 -0.313 -0.301 -1.021 -0.685 0.914 0.957 0.541 Russia -0.157 -1.091 -1.118 -1.261 -0.273 -0.820 -0.850 -1.052 EAEU4 -0.184 -0.401 -1.161 -1.192 -0.282 -0.512 -0.932 -1.007 ASEAN9 -0.441 -0.458 -0.459 0.076 -0.504 -0.532 -0.534 0.485 ANZI -0.263 -0.281 -0.287 -0.558 -0.366 -0.406 -0.415 -0.179 Rest of Asia -0.654 -0.639 -0.639 -0.976 -0.695 -0.690 -0.691 -1.054 USA -0.222 -0.243 -0.248 -0.510 -0.321 -0.372 -0.380 -0.772 EU_28 -0.227 -0.323 -0.334 -0.560 -0.268 -0.384 -0.397 -0.681 Rest of World -0.201 -0.278 -0.289 -0.498 -0.276 -0.362 -0.374 -0.655
Source: GTAP Model, simulation results
Table 5: Changes in Real Exports (qxwreg = change in volume of merchandise exports)(% change)
Regions
No international capital mobility International capital mobility
CJKFTA
NEAFTA
NEA+EAEU
FTA
NEA+RCEP+EAEU
FTA
CJKFTA
NEAFTA
NEA+EAEU
FTA
NEA+RCEP+EAEU
FTAChina 3.223 3.452 3.520 4.446 2.679 2.830 2.878 3.674Japan 2.614 2.676 2.671 3.833 1.151 1.120 1.118 2.019ROK 4.192 4.374 4.374 5.712 2.167 2.205 2.196 3.221Mongolia 0.036 1.273 1.283 1.400 0.282 -0.401 -0.430 -0.524Russia -0.043 1.882 1.854 2.179 0.089 1.277 1.264 1.664EAEU4 -0.101 -0.300 1.583 1.646 0.005 -0.137 1.096 1.227ASEAN9 -0.199 -0.196 -0.196 4.022 0.040 0.069 0.072 2.939ANZI -0.103 -0.148 -0.157 6.079 0.125 0.131 0.130 4.920Rest of Asia -0.498 -0.506 -0.510 -0.730 -0.237 -0.224 -0.225 -0.294USA -0.192 -0.240 -0.249 -0.556 0.248 0.313 0.319 0.584EU_28 -0.046 -0.091 -0.096 -0.175 0.070 0.078 0.079 0.144Rest of World -0.066 -0.089 -0.093 -0.261 0.055 0.065 0.065 0.046
Source: GTAP Model, simulation results
45Economic Effects of Free Trade Agreements in Northeast Asia: CGE Analysis with the GTAP 9.0a Data Base

Table 6: Changes in Real Imports (qiwreg = change in volume of merchandise imports)(% change)
Regions
No international capital mobility International capital mobility
CJKFTA
NEAFTA
NEA+EAEU
FTA
NEA+RCEP+EAEU
FTA
CJKFTA
NEAFTA
NEA+EAEU
FTA
NEA+RCEP+EAEU
FTAChina 3.366 3.702 3.793 5.040 3.414 3.767 3.862 5.105Japan 3.825 4.051 4.053 5.639 4.235 4.492 4.494 6.162ROK 4.635 4.940 4.955 6.551 4.943 5.274 5.290 6.925Mongolia -0.033 1.049 1.063 1.167 -0.346 3.163 3.230 3.572Russia -0.044 2.948 2.901 3.499 -0.288 3.742 3.676 4.172EAEU4 -0.093 -0.340 1.839 2.002 -0.184 -0.484 2.145 2.268ASEAN9 -0.324 -0.332 -0.331 4.128 -0.393 -0.413 -0.415 4.543ANZI -0.088 -0.121 -0.128 4.738 -0.226 -0.282 -0.293 5.187Rest of Asia -0.817 -0.821 -0.824 -1.209 -0.920 -0.935 -0.940 -1.421USA -0.208 -0.250 -0.258 -0.579 -0.423 -0.520 -0.536 -1.133EU_28 -0.066 -0.133 -0.140 -0.245 -0.091 -0.174 -0.183 -0.339Rest of World -0.062 -0.125 -0.133 -0.290 -0.148 -0.232 -0.243 -0.503
Source: GTAP Model, simulation results
4. ConclusionsCGE analysis of the economic impacts of the four prospective free trade agreements
covering the NEA region using GTAP Model and Data Base 9.0a have demonstrated that removing tariff barriers will benefit all parties of a free trade agreement, due to increased trade and economic activities. Specifically, in the cases of:a) CJK Trilateral Free Trade Agreement: All three countries, China, Japan and the ROK,
will benefit as a result of this agreement having positive EV values and real GDP expansions regardless of whether capital is internationally mobile or not. The ROK would benefit most in terms of real GDP change. All other regions would experience welfare losses, including those in the NEA region, except Russia when capital is not internationally mobile.
b) NEA Preferential Free Trade Area: All five countries in the NEA region would benefit from formation of an NEA FTA, having welfare gains and increases of real GDP regardless of the investment allocation decisions. The ROK was the largest winner in terms of its real GDP expansion. The other countries and regions in the model experienced welfare losses and contractions of their real GDP as well.
c) NEA+EAEU Preferential Free Trade Area: All countries in the NEA region would benefit from formation of this FTA regardless of investment allocation decisions, while other countries and regions would experience welfare losses and real GDP contractions. The magnitude of these benefits were larger for all the NEA countries, except Russia, in this scenario compared to the previous two FTA cases. Japan was the largest winner in terms of welfare gains, while the ROK would be the top beneficiary in terms of real GDP expansion.
46 The Northeast Asian Economic Review

However, despite being a part of this FTA, the EAEU4 members may experience welfare losses along with drops in their real and nominal GDP due to their allocative efficiency losses and worsening of terms of trade in goods and services.
d) NEA+RCEP+EAEU Preferential Free Trade Area: Similar to the previous scenario, all countries in the NEA region would benefit from this agreement by having welfare gains and expansions of real GDP regardless of international capital mobility decisions. All countries in the NEA region were better off under this scenario than the previous three FTA cases, whereas Japan was the largest winner in terms of welfare gains and nominal GDP expansion, while the ROK would benefit most in terms of its real GDP expansion. The other members of the RCEP region would also benefit from this FTA by experiencing welfare gains and real GDP expansions. However, in both cases of international capital mobility, Russia, the EAEU4 and ANZI would experience reductions in terms of nominal GDP due to drops in their aggregate price indices.Accordingly, for the NEA region as a whole, the NEA+ FTA is preferable to CJK FTA only, and would be even better off in formation of a wider coverage of free trade agreement partners, such as RCEP and the EAEU, where all the countries in the region would benefit from larger welfare gains and real GDP expansions regardless of the investment allocation decisions.
*Senior Research Fellow, Research Division, ERINA**Senior Research Fellow, Research Division, ERINA
1 For more details on the GTAP model and database, refer to Hertel, T. (ed.), 1997.
References
ADAMS Philip D. (2003). Interpretation of Macroeconomic Results from a CGE Model such as GTAP, Centre of Policy Studies, Monash University. Available online.
BEGG M., Ch. BURMAA, et al (2012). “GTAP 8 Data Base Documentation - Chapter 7.C: Mongolia” by BEGG Michael, BURMAA Chadraaval, RAGCHAARSUREN Galindev, ESMEDEKH Lkhanaajav, and ERDENESAN Eldev-Ochir. Retrieved from: https://www.gtap.agecon.purdue.edu
ENKHBAYAR Shagdar and Tomoyoshi NAKAJIMA (2013). Impacts of Mongolian FTAs with the Countries in Northeast Asia: CGE Analysis with the GTAP 8 Data Base. The Northeast Asian Economic Review, Vol. 1, No. 2, December 2013, pp. 43–67.
ENKHBAYAR Shagdar and Nyamdaa OTGONSAIKHAN (2017). Impacts of Import Tariff Reforms on Mongolia’s Economy: CGE Analysis with the GTAP 8.1 Data Base, The Northeast Asian Economic Review, Vol. 5, No. 1, March 2017, pp. 1–25
HERTEL T. (ed.) (1997). Global Trade Analysis: Modeling and Applications. Cambridge University Press
NAKAJIMA Tomoyoshi (2012). “The ROK’s FTA Policy: Developments under the Lee Myung-bak Administration”, The Journal of Econometric Study of Northeast Asia, Vol. 8, No. 2, 2012
NARAYANAN G. Badri, Angel AGUIAR, and Robert McDOUGALL (eds.) (2012). Global Trade, Assistance, and Production: The GTAP 8 Data Base, Center for Global Trade Analysis, Purdue University
47Economic Effects of Free Trade Agreements in Northeast Asia: CGE Analysis with the GTAP 9.0a Data Base

Appendix Table I: Classification of Regions in the Model
The Model(12 regions) GTAP 9.0a (140 regions)
China China
Japan Japan
ROK Republic of Korea
Mongolia Mongolia
Russia Russian Federation
EAEU4 Kazakhstan, Kyrgyzstan, Armenia, Belarus
ASEAN9ASEAN9 members, except Myanmar: Brunei Darussalam, Cambodia, Indonesia, Lao People's Democratic Republic, Malaysia, Philippines, Singapore, Thailand, Vietnam
ANZI Australia, New Zealand, India
Rest of Asia Hong Kong, Taiwan, Rest of East Asia, Rest of Southeast Asia, Bangladesh, Nepal, Pakistan, Sri Lanka, Rest of South Asia
USA United States of America
EU_28
Austria, Belgium, Cyprus, Czech Republic, Denmark, Estonia, Finland, France, Germany, Greece, Hungary, Ireland, Italy, Latvia, Lithuania, Luxembourg, Malta, Netherlands, Poland, Portugal, Slovakia, Slovenia, Spain, Sweden, United Kingdom, Bulgaria, Romania, Croatia
Rest of World
Rest of Oceania, Canada, Mexico, Rest of North America, Argentina, Bolivia, Brazil, Chile, Colombia, Ecuador, Paraguay, Peru, Uruguay, Venezuela, Rest of South America, Costa Rica, Guatemala, Honduras, Nicaragua, Panama, El Salvador, Rest of Central America, Dominican Republic, Jamaica, Puerto Rico, Trinidad and Tobago, Caribbean, Switzerland, Norway, Rest of EFTA, Albania, Ukraine, Rest of Eastern Europe, Rest of Europe, Rest of Former Soviet Union, Azerbaijan, Georgia, Bahrain, Islamic Republic of Iran, Israel, Jordan, Kuwait, Oman, Qatar, Saudi Arabia, Turkey, United Arab Emirates, Rest of Western Asia, Egypt, Morocco, Tunisia, Rest of North Africa, Benin, Burkina Faso, Cameroon, Côte d’Ivoire, Ghana, Guinea, Nigeria, Senegal, Togo, Rest of Western Africa, Central Africa, South Central Africa, Ethiopia, Kenya, Madagascar, Malawi, Mauritius, Mozambique, Rwanda, Tanzania, Uganda, Zambia, Zimbabwe, Rest of Eastern Africa, Botswana, Namibia, South Africa, Rest of South African Customs, Rest of the World
Source: GTAP 9.0a Data Base
48 The Northeast Asian Economic Review

Appendix Table II: Classification of Sectors in the ModelNo. Code Description
1 pdr Paddy rice2 wht Wheat3 gro Cereal grains nec.4 v_f Vegetables, fruit, nuts5 osd Oil seeds6 c_b Sugar cane, sugar beet7 pfb Plant-based fibers8 ocr Crops nec.9 ctl Cattle, sheep, goats, horses
10 oap Animal products nec.11 rmk Raw milk12 wol Wool, silk-worm cocoons13 frs Forestry14 fsh Fishing15 coa Coal16 oil Oil17 gas Gas18 omn Minerals nec.19 cmt Meat: cattle, sheep, goats, horse20 omt Meat products nec.21 vol Vegetable oils and fats22 mil Dairy products23 pcr Processed rice24 sgr Sugar25 ofd Food products nec.26 b_t Beverages and tobacco products27 tex Textiles28 wap Wearing apparel29 lea Leather products30 lum Wood products31 ppp Paper products, publishing32 p_c Petroleum, coal products33 crp Chemical, rubber, plastic products34 nmm Mineral products nec.35 i_s Ferrous metals36 nfm Metals nec.37 fmp Metal products38 mvh Motor vehicles and parts39 otn Transport equipment nec.
49Economic Effects of Free Trade Agreements in Northeast Asia: CGE Analysis with the GTAP 9.0a Data Base

Appendix Table II: Classification of Sectors in the Model (continued)No. Code Description
40 ele Electronic equipment
41 ome Machinery and equipment nec.
42 omf Manufactures nec.
43 ely Electricity
44 gdt Gas manufacture, distribution
45 wtr Water
46 cns Construction
47 trd Trade
48 otp Transport nec.
49 wtp Sea transport
50 atp Air transport
51 cmn Communication
52 ofi Financial services nec.
53 isr Insurance
54 obs Business services nec.
55 ros Recreation and other services
56 osg Public administration, Defense, Health, Education
57 dwe DwellingsSource: GTAP 9.0a Data Base
Appendix Table III: Classification of Production Factors in the ModelOld factor New factor
No. Code Description No. Code Description
1 Land Land 1 Land -1
2 tech_aspros Technicians/Associates, Professional 2 Labor mobile
3 clerks Clerks 2 Labor mobile
4 service_shop Service/Shop workers 2 Labor mobile
5 off_mgr_pros Officials and Managers 2 Labor mobile
6 ag_othlowsk Agricultural and Unskilled 2 Labor mobile
7 Capital Capital 3 Capital mobile
8 NatlRes Natural Resources 4 NatRes -0.001Source: GTAP 9.0a Data Base
50 The Northeast Asian Economic Review

Appendix Table IV: CJK FTA Welfare Effects: EV Decomposition Summary(Experiment 1: International Capital Mobility)
(2011 US$ million)
Regions AllocativeEfficiency
Terms of Tradein Goods and
Services
Terms of Tradein Investmentand Savings
Total Welfare
China 4,459 -3,051 475 1,883Japan 5,894 15,160 337 21,391ROK 5,611 5,819 -237 11,194Mongolia -3 -22 -1 -26Russia -14 -495 195 -314EAEU4 -21 -77 19 -78ASEAN9 -583 -3,262 46 -3,799ANZI -451 -1,150 -165 -1,765Rest of Asia -187 -2,915 54 -3,048USA -413 -3,769 -957 -5,139EU_28 -413 -3,128 -166 -3,707Rest of World -1,312 -3,357 396 -4,272
Total 12,568 -246 -4 12,319Source: GTAP Model, simulation results
Appendix Table V: NEA FTA Welfare Effects: EV Decomposition Summary(Experiment 3: International capital mobility)
(2011 US$ million)
Regions AllocativeEfficiency
Terms of Tradein Goods and
Services
Terms of Tradein Investmentand Savings
Total Welfare
China 5,121 364 -374 5,111Japan 6,161 16,914 356 23,431ROK 5,800 6,888 -304 12,384Mongolia 16 46 -3 58Russia 1,174 -785 1,529 1,918EAEU4 -93 -154 42 -205ASEAN9 -660 -3,578 -16 -4,254ANZI -547 -1,290 -216 -2,053Rest of Asia -199 -2,954 22 -3,131USA -588 -4,674 -1,045 -6,307EU_28 -1,391 -5,651 -356 -7,398Rest of World -2,029 -5,429 367 -7,090
Total 12,765 -303 2 12,464Source: GTAP Model, simulation results
51Economic Effects of Free Trade Agreements in Northeast Asia: CGE Analysis with the GTAP 9.0a Data Base

Appendix Table VI: NEA+EAEU FTA Welfare Effects: EV Decomposition Summary
(Experiment 5: International capital mobility)(2011 US$ million)
Regions AllocativeEfficiency
Terms of Tradein Goods and
Services
Terms of Tradein Investmentand Savings
Total Welfare
China 5,291 999 -467 5,823Japan 6,164 16,966 359 23,490ROK 5,821 7,007 -308 12,521Mongolia 16 47 -3 61Russia 1,190 -859 1,577 1,908EAEU4 -2 -194 85 -111ASEAN9 -667 -3,605 -18 -4,289ANZI -565 -1,326 -217 -2,109Rest of Asia -202 -2,963 21 -3,145USA -617 -4,817 -1,060 -6,495EU_28 -1,484 -5,912 -363 -7,758Rest of World -2,129 -5,652 396 -7,385
Total 12,816 -309 2 12,509Source: GTAP Model, simulation results
Appendix Table VII: Aggregate Price Changes by Region: GDP Price Index (pgdp (REG))(% change)
RegionsNo international capital mobility International capital mobility
NEA FTA NEA+EAEU+RCEP FTA NEA FTA NEA+EAEU+R
CEP FTAChina -0.06 0.133 0.077 0.319 Japan 1.624 2.015 2.016 2.512 ROK 1.005 0.949 1.709 1.781 Mongolia -0.334 -1.083 0.736 0.297 Russia -1.145 -1.336 -0.883 -1.133 EAEU4 -0.37 -1.193 -0.477 -1.020 ASEAN9 -0.437 -0.034 -0.501 0.348 ANZI -0.274 -0.770 -0.391 -0.417 Rest of Asia -0.624 -0.954 -0.674 -1.025 USA -0.242 -0.507 -0.368 -0.765 EU_28 -0.315 -0.547 -0.375 -0.668 Rest of World -0.271 -0.487 -0.349 -0.631
Source: GTAP Model, simulation results
52 The Northeast Asian Economic Review

Appendix Table VIII: Price Index of Merchandise Exports by Region (pxwreg (REG))(% change)
Regions
No international capital mobility International capital mobility
CJKFTA
NEAFTA
NEA+EAEU
FTA
NEA+RCEP+EAEU
FTA
CJKFTA
NEAFTA
NEA+EAEU
FTA
NEA+RCEP+EAEU
FTAChina -0.237 -0.081 -0.055 0.023 -0.141 0.03 0.06 0.185Japan 1.153 1.313 1.32 1.674 1.434 1.615 1.622 2.062ROK 0.56 0.709 0.726 0.821 0.916 1.096 1.115 1.282Mongolia -0.347 0.241 0.253 0.173 -0.457 0.683 0.709 0.784Russia -0.141 -0.347 -0.366 -0.439 -0.218 -0.264 -0.282 -0.391EAEU4 -0.146 -0.27 -0.421 -0.47 -0.218 -0.327 -0.349 -0.43ASEAN9 -0.274 -0.291 -0.292 0.061 -0.302 -0.32 -0.321 0.311ANZI -0.226 -0.257 -0.263 -0.308 -0.308 -0.348 -0.354 -0.098Rest of Asia -0.409 -0.396 -0.396 -0.601 -0.42 -0.409 -0.409 -0.614USA -0.205 -0.233 -0.238 -0.462 -0.286 -0.333 -0.34 -0.664EU_28 -0.203 -0.284 -0.294 -0.485 -0.245 -0.335 -0.346 -0.585Rest of World -0.164 -0.248 -0.258 -0.408 -0.228 -0.305 -0.314 -0.514
Source: GTAP Model, simulation results
53Economic Effects of Free Trade Agreements in Northeast Asia: CGE Analysis with the GTAP 9.0a Data Base

GUIDELINES FOR CONTRIBUTIONS (abstract) Please send peer-reviewed articles as email attachments or on a CD, in Microsoft Word or other text-file form. Papers should be double-spaced and not more than 5,000 words in length. All peer-reviewed articles must have a summary of not more than 150 words, with keywords (three to six terms), and JEL classification codes (up to three). The title page should contain the title of the paper, the full names and addresses of the authors, their contact information (telephone number, facsimile number and email address) and their professional affiliation. As the name of the author is to be withheld from the referees the title of the paper only should be repeated on the first page of the main text. Please refer to the “Guidelines for Authors” on ERINA website (https://www.erina.or.jp/en/publications/naer/) regarding the other matters for the authors of articles we would like to be observed. Once manuscripts have been anonymously peer-reviewed, their acceptance or rejection rests with the Editorial Board. The anonymity of both authors and referees will be maintained throughout the reviewing process. The copyright of accepted peer-reviewed articles will belong to the author. Please refer to the “Guidelines on Copyright” regarding the copyright for accepted peer-reviewed articles.