5G NR Sub-6 GHz Measurement Methods Application Note · 5G, LTE, LTE-Advanced, W-CDMA, TD-SCDMA,...
45
Application Note Contents 1 Introduction ......................................................................................... 3 2 Standards ............................................................................................. 4 2.1 3GPP ............................................................................................................. 4 2.2 5G REQUIREMENTS IN JAPAN ..................................................................................... 8 3 Measuring Instruments ......................................................................... 10 4 Measurements..................................................................................... 12 4.1 CONDUCTED TX TESTS ............................................................................................... 12 4.1.1 BS OUTPUT POWER ................................................................................................ 12 4.1.2 RE POWER CONTROL DYNAMIC RANGE ........................................................................ 13 4.1.3 TOTAL POWER DYNAMIC RANGE ............................................................................... 14 4.1.4 TRANSMIT ON/OFF POWER ................................................................................... 15 4.1.5 TRANSMITTED SIGNAL QUALITY ................................................................................ 18 4.1.6 TIME ALIGNMENT ERROR ....................................................................................... 20 4.1.7 OCCUPIED BANDWIDTH ......................................................................................... 21 4.1.8 ADJACENT CHANNEL LEAKAGE POWER RATIO .................................................................. 23 5G NR Sub-6 GHz Measurement Methods Signal Analyzer MS2850A Vector Signal Generator MG3710A/MG3710E
Transcript of 5G NR Sub-6 GHz Measurement Methods Application Note · 5G, LTE, LTE-Advanced, W-CDMA, TD-SCDMA,...
Application Note
Contents
1 Introduction ......................................................................................... 3
2 Standards ............................................................................................. 4
2.1 3GPP ............................................................................................................. 4
2.2 5G REQUIREMENTS IN JAPAN ..................................................................................... 8
3 Measuring Instruments ......................................................................... 10
4 Measurements ..................................................................................... 12
4.1 CONDUCTED TX TESTS ............................................................................................... 12
4.1.1 BS OUTPUT POWER ................................................................................................ 12
4.1.2 RE POWER CONTROL DYNAMIC RANGE ........................................................................ 13
4.1.3 TOTAL POWER DYNAMIC RANGE ............................................................................... 14
4.1.4 TRANSMIT ON/OFF POWER ................................................................................... 15
4.1.5 TRANSMITTED SIGNAL QUALITY ................................................................................ 18
4.1.6 TIME ALIGNMENT ERROR ....................................................................................... 20
4.1.7 OCCUPIED BANDWIDTH ......................................................................................... 21
4.1.8 ADJACENT CHANNEL LEAKAGE POWER RATIO .................................................................. 23
5G NR Sub-6 GHz Measurement Methods Signal Analyzer MS2850A
Vector Signal Generator MG3710A/MG3710E
2
4.1.9 OPERATING BAND UNWANTED EMISSIONS ..................................................................... 25
4.1.10 TRANSMITTER SPURIOUS EMISSIONS ........................................................................... 27
4.1.11 TRANSMITTER INTERMODULATION .............................................................................. 29
4.2 CONDUCTED RX TEST ........................................................................................... 30
4.2.1 REFERENCE SENSITIVITY LEVEL ................................................................................... 30
4.2.2 DYNAMIC RANGE ................................................................................................ 31
4.2.3 ADJACENT CHANNEL SELECTIVITY (ACS) ....................................................................... 33
4.2.4 IN-BAND BLOCKING ............................................................................................. 35
4.2.5 OUT-OF-BAND BLOCKING ....................................................................................... 37
4.2.6 RECEIVER SPURIOUS EMISSIONS ................................................................................. 38
4.2.7 RECEIVER INTERMODULATION ................................................................................... 39
4.2.8 IN-CHANNEL SELECTIVITY ....................................................................................... 42
5 Summary ........................................................................................... 44
6 Ordering Information ........................................................................... 44
3
1 Introduction
Fifth generation (5G) mobile communications systems use multiple connections to meet the need for increases in mobile
data traffic volumes as well as new functions such as ultra-low-latency. In comparison to 4G, they aim to achieve 100 times
higher data capacity as well as 90% lower latency and are expected to play a key role in other fields. such as automobile
applications, in addition to mobile phone communications. 5G offers end-to-end high-quality communications meeting
the needs of every usage scenario. Such networks do not require adjustments meeting every usage and provide optimum
functions and quality for each use case and scenario. Implementing 5G requires use of new radio technology (NR) and
higher frequency bands, such as mmWave, in addition to existing frequency bands.
The Third Generation Partnership Project (3GPP) determining the standards released the 5G NR non-standalone (NSA)
specifications for making connections via multiple radio technologies, such as LTE, in Release 15 in June 2018.
Release 15 presumes the use of frequency bands up to 52.6 GHz and specifies the band from 450 MHz to 6 GHz as FR1
(Frequency Range 1), and from 24.25 GHz to 52.6 GHz as FR2 (Frequency Range 2). FR1 assumes use of the same wired
tests as conventional wireless technologies whereas FR2 assumes OTA (Over the Air) testing.
This application note references the 3GPP TS38.104 and TS38.141 Conformance Test specifications, and introduces TRx test
measurement examples for wired connections with sub-6 GHz base stations covering FR1 using the Signal Analyzer
MS2850A and Vector Signal Generator MG3710A/MG3710E.
4
2 Standards
2.1 3GPP
The 3GPP standardization body for wireless systems has defined the following standards for tests of 5G base station
wireless characteristics.
Standard Contents
TS 38.211 V15.3.0 (2018-09) PHY Layer Specifications
TS 38.104 V15.4.0 (2019-01) Base Station (BS) Measurement Conditions
TS 38.141-1 V2.0.0 (2019-01) Base Station (BS) Conducted Measurement Method
TS 38.141-2 V2.0.0 (2019-01) Base Station (BS) Radiated Measurement Method
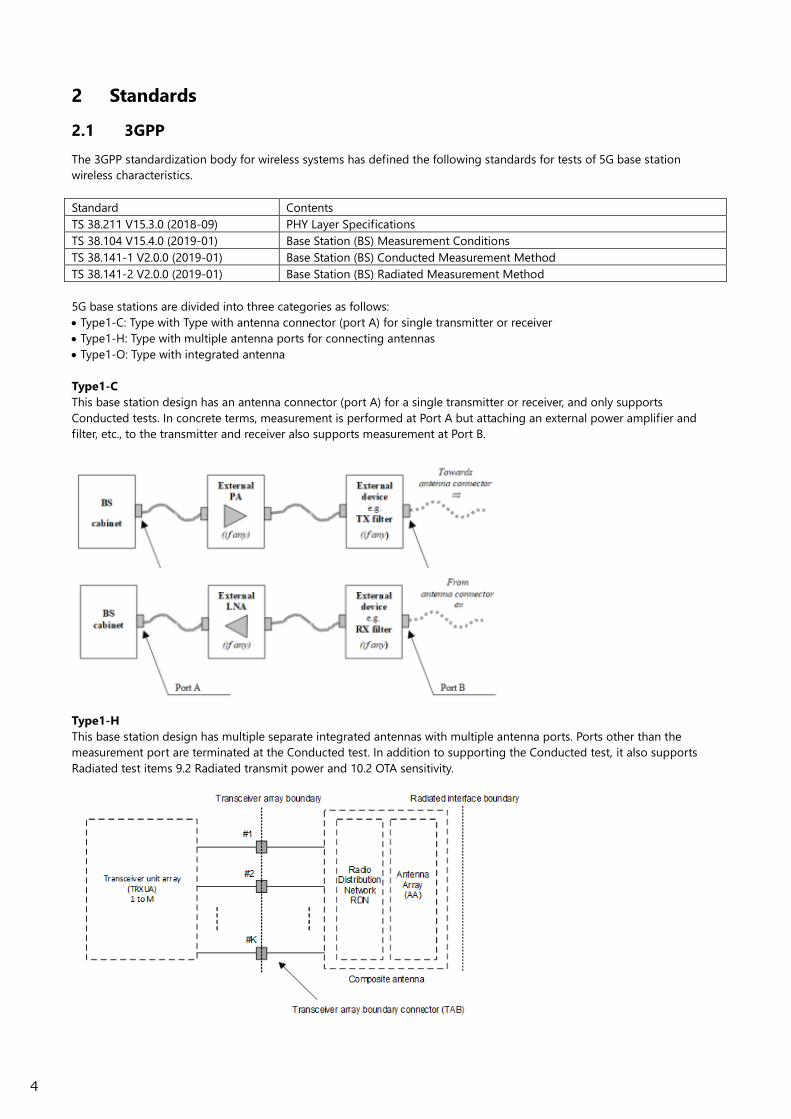
5G base stations are divided into three categories as follows:
Type1-C: Type with Type with antenna connector (port A) for single transmitter or receiver
Type1-H: Type with multiple antenna ports for connecting antennas
Type1-O: Type with integrated antenna
Type1-C
This base station design has an antenna connector (port A) for a single transmitter or receiver, and only supports
Conducted tests. In concrete terms, measurement is performed at Port A but attaching an external power amplifier and
filter, etc., to the transmitter and receiver also supports measurement at Port B.
Type1-H
This base station design has multiple separate integrated antennas with multiple antenna ports. Ports other than the
measurement port are terminated at the Conducted test. In addition to supporting the Conducted test, it also supports
Radiated test items 9.2 Radiated transmit power and 10.2 OTA sensitivity.

5
Type1-O
This base station design has a transmitter and receiver as well as integrated antennas. Since the antennas cannot be
separated, it supports Radiated tests.

6
Additionally, the standards describe two types of measurement methods—the Conducted method, and the Radiated
method assuming OTA measurements.
Comparison of Base Station Types and Measurement Items
Conducted Tx Test
38.104 Item BS type
1-C
BS type
1-H
BS type
1-O
6.2 BS Output power ✔ ✔ -
6.3 Output power dynamics ✔ ✔
6.3.2 RE power control dynamic range ✔ ✔
6.3.3 Total power dynamic range ✔ ✔
6.4 Transmit ON/OFF power ✔ ✔
6.4.1 Transmitter OFF power ✔ ✔
6.4.2 Transmitter transient period ✔ ✔
6.5 Transmitted signal quality ✔ ✔
6.5.1 Frequency error ✔ ✔
6.5.2 Modulation quality ✔ ✔
6.5.3 Time alignment error ✔ ✔
6.6.2 Occupied bandwidth ✔ ✔
6.6.3 ACLR ✔ ✔
6.6.4 Operating band unwanted emissions ✔ ✔
6.6.5 Transmitter spurious emissions ✔ ✔
6.7 Transmitter intermodulation ✔ ✔
Conducted Rx Test
38.104 Item BS type
1-C
BS type
1-H
BS type
1-O
7.2 Reference sensitivity level ✔ ✔ -
7.3 Dynamic range ✔ ✔
7.4 In-band selectivity and blocking ✔ ✔
7.5 Out-of-band blocking ✔ ✔
7.6 Receiver spurious emissions ✔ ✔
7.7 Receiver intermodulation ✔ ✔
7.8 In-channel selectivity ✔ ✔

7
Radiated Tx Test
38.104 Item BS type
1-C
BS type
1-H
BS type
1-O
9.2 Radiated transmit power - ✔ ✔
9.3 OTA base station output power - ✔
9.4 OTA output power dynamics ✔
9.5 OTA transmit ON/OFF power ✔
9.6 OTA transmitted signal quality ✔
9.7.2 OTA occupied bandwidth ✔
9.7.3 OTA ACLR ✔
9.7.4 OTA out-of-band emission ✔
9.7.5 OTA transmitter spurious emission ✔
9.8 OTA transmitter intermodulation ✔
Radiated Rx Test
38.104 Item BS type
1-C
BS type
1-H
BS type
1-O
10.2 OTA sensitivity - ✔ ✔
10.3 OTA reference sensitivity level - ✔
10.4 OTA dynamic range ✔
10.5 OTA in-band selectivity and blocking ✔
10.6 OTA out-of-band blocking ✔
10.7 OTA receiver spurious emission ✔
10.8 OTA receiver intermodulation ✔
10.9 OTA in-channel selectivity ✔

8
2.2 5G Requirements in Japan
In FY2018, the Next-Generation Mobile Communications Systems Committee Report of the Communication Technology
Subcommittee of the Council for Information and Communications recommended the following conditions for introducing
5G to Japan.
Measurements are to be made using a measuring instrument such as a spectrum analyzer.
Technology (5G NR TDD) using 3.7 GHz and 4.5 GHz bands
Permissible
Frequency Error
Within ±(0.05 ppm + 12 Hz)
With antenna connector and max. antenna power >38 dBm
Without antenna connector and max. antenna power >47 dBm
Within ±(0.1 ppm + 12 Hz)
With antenna connector and max. antenna power <38 dBm
Without antenna connector and max. antenna power <47 dBm
Within ±(0.05 ppm + 12 Hz)
With antenna connector in combination with active antenna and max. antenna power >38 dBm
+ 10log(N)
Within ±(0.1 ppm + 12 Hz)
Max. antenna power <38 dBm + 10log(N)
Unwanted Emissions
in Spurious Domain
Frequency Range
Permissible Value
Reference
BW
With
Antenna
Connector
Without
Antenna
Connector
> 9 kHz ≤ 150 kHz -13 dBm - 1 kHz
> 150 kHz ≤ 30 MHz –13 dBm - 10 kHz
> 30 MHz ≤ 1000 MHz –13 dBm –4 dBm 100 kHz
> 1000 MHz ≤ 12.75 GHz –13 dBm –4 dBm 1 MHz
> 12.75 GHz ≤ 5 times upper frequency –13 dBm –4 dBm 1 MHz
Frequency Range
Permissible Value
Reference
BW
With
Antenna
Connector
Without
Antenna
Connector
> 1884.5 MHz ≤ 1915.7 MHz –41 dBm –32 dBm 300 kHz
Adjacent Leakage
Power
100 MHz BW
System Regulation
Type
Detuning
Frequency
Permissible Value
Reference
BW
With Antenna
Connector
Without
Antenna
Connector
100 MHz
System
Absolute 100 MHz –13 dBm/MHz –4 dBm/MHz 98.28 MHz
Relative 100 MHz –44.2 dBc –44.2 dBc 98.28 MHz
Absolute 200 MHz –13 dBm/MHz –4 dBm/MHz 98.28 MHz
Relative 200 MHz –44.2 dBc –44.2 dBc 98.28 MHz
9
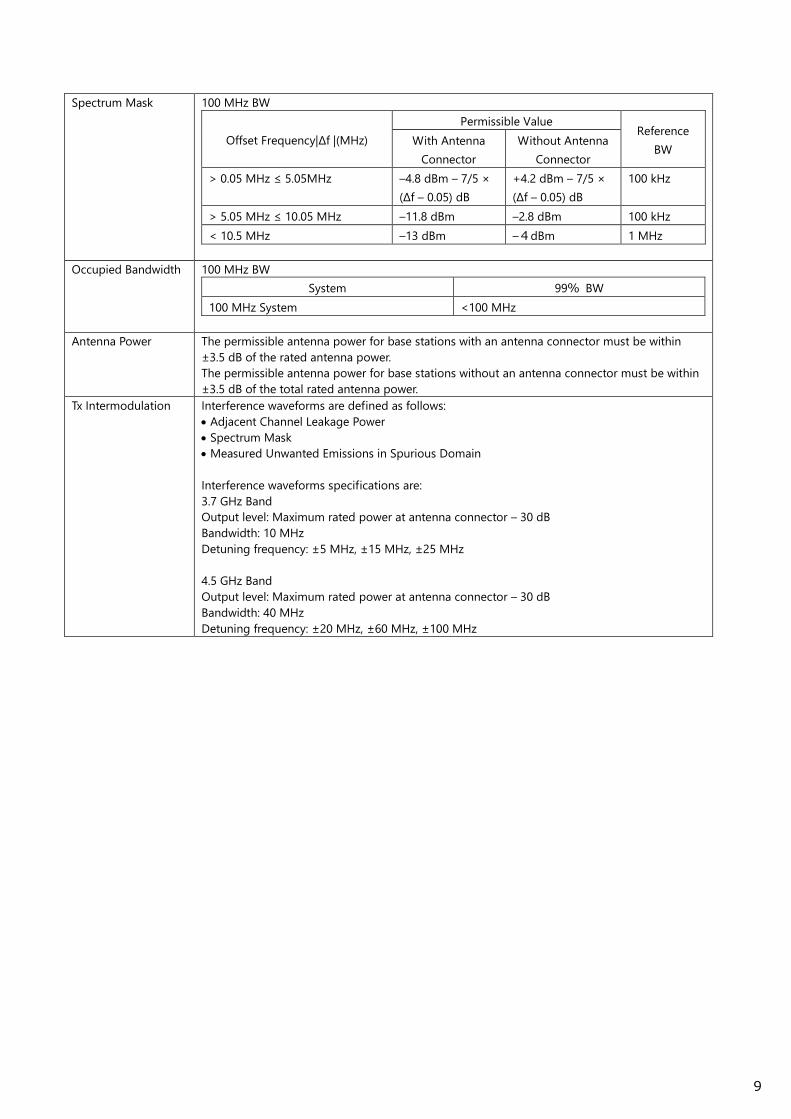
Spectrum Mask 100 MHz BW
Offset Frequency|Δf |(MHz)
Permissible Value Reference
BW With Antenna
Connector
Without Antenna
Connector
> 0.05 MHz ≤ 5.05MHz –4.8 dBm – 7/5 ×
(Δf – 0.05) dB
+4.2 dBm – 7/5 ×
(Δf – 0.05) dB
100 kHz
> 5.05 MHz ≤ 10.05 MHz –11.8 dBm –2.8 dBm 100 kHz
< 10.5 MHz –13 dBm –4dBm 1 MHz
Occupied Bandwidth 100 MHz BW
System 99% BW
100 MHz System <100 MHz
Antenna Power The permissible antenna power for base stations with an antenna connector must be within
±3.5 dB of the rated antenna power.
The permissible antenna power for base stations without an antenna connector must be within
±3.5 dB of the total rated antenna power.
Tx Intermodulation Interference waveforms are defined as follows:
Adjacent Channel Leakage Power
Spectrum Mask
Measured Unwanted Emissions in Spurious Domain
Interference waveforms specifications are:
3.7 GHz Band
Output level: Maximum rated power at antenna connector – 30 dB
Bandwidth: 10 MHz
Detuning frequency: ±5 MHz, ±15 MHz, ±25 MHz
4.5 GHz Band
Output level: Maximum rated power at antenna connector – 30 dB
Bandwidth: 40 MHz
Detuning frequency: ±20 MHz, ±60 MHz, ±100 MHz
10
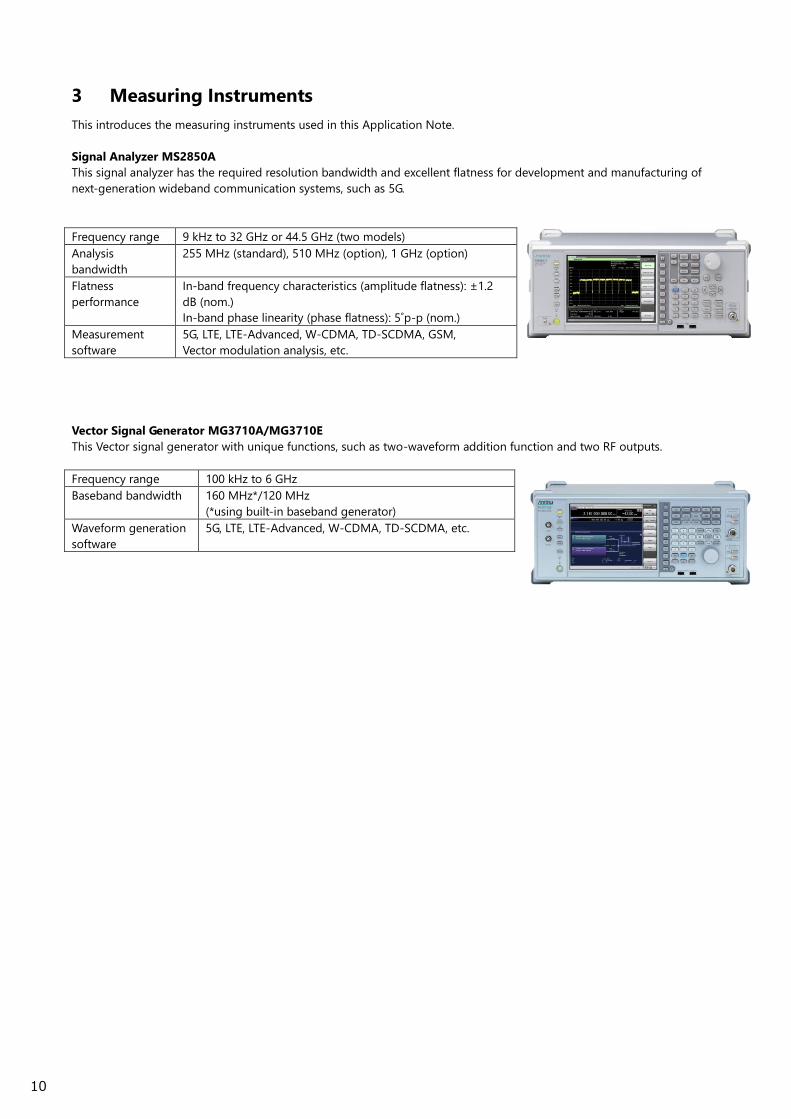
3 Measuring Instruments
This introduces the measuring instruments used in this Application Note.
Signal Analyzer MS2850A
This signal analyzer has the required resolution bandwidth and excellent flatness for development and manufacturing of
next-generation wideband communication systems, such as 5G.
Frequency range 9 kHz to 32 GHz or 44.5 GHz (two models)
Analysis
bandwidth
255 MHz (standard), 510 MHz (option), 1 GHz (option)
Flatness
performance
In-band frequency characteristics (amplitude flatness): ±1.2
dB (nom.)
In-band phase linearity (phase flatness): 5˚p-p (nom.)
Measurement
software
5G, LTE, LTE-Advanced, W-CDMA, TD-SCDMA, GSM,
Vector modulation analysis, etc.
Vector Signal Generator MG3710A/MG3710E
This Vector signal generator with unique functions, such as two-waveform addition function and two RF outputs.
Frequency range 100 kHz to 6 GHz
Baseband bandwidth 160 MHz*/120 MHz
(*using built-in baseband generator)
Waveform generation
software
5G, LTE, LTE-Advanced, W-CDMA, TD-SCDMA, etc.
11
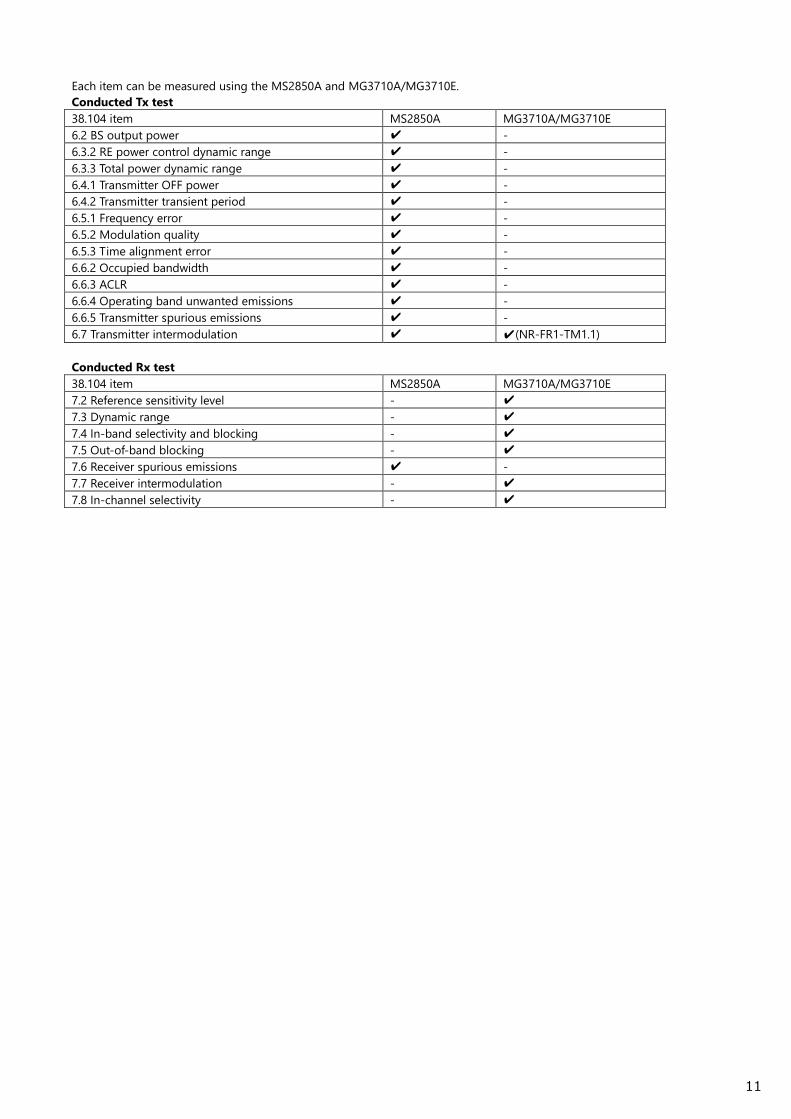
Each item can be measured using the MS2850A and MG3710A/MG3710E.
Conducted Tx test
38.104 item MS2850A MG3710A/MG3710E
6.2 BS output power ✔ -
6.3.2 RE power control dynamic range ✔ -
6.3.3 Total power dynamic range ✔ -
6.4.1 Transmitter OFF power ✔ -
6.4.2 Transmitter transient period ✔ -
6.5.1 Frequency error ✔ -
6.5.2 Modulation quality ✔ -
6.5.3 Time alignment error ✔ -
6.6.2 Occupied bandwidth ✔ -
6.6.3 ACLR ✔ -
6.6.4 Operating band unwanted emissions ✔ -
6.6.5 Transmitter spurious emissions ✔ -
6.7 Transmitter intermodulation ✔ ✔(NR-FR1-TM1.1)
Conducted Rx test
38.104 item MS2850A MG3710A/MG3710E
7.2 Reference sensitivity level - ✔
7.3 Dynamic range - ✔
7.4 In-band selectivity and blocking - ✔
7.5 Out-of-band blocking - ✔
7.6 Receiver spurious emissions ✔ -
7.7 Receiver intermodulation - ✔
7.8 In-channel selectivity - ✔
12
4 Measurements
This section explains the measurement contents in concrete terms for the Conducted Tx Tests in the 3GPP standards.
4.1 Conducted Tx Tests
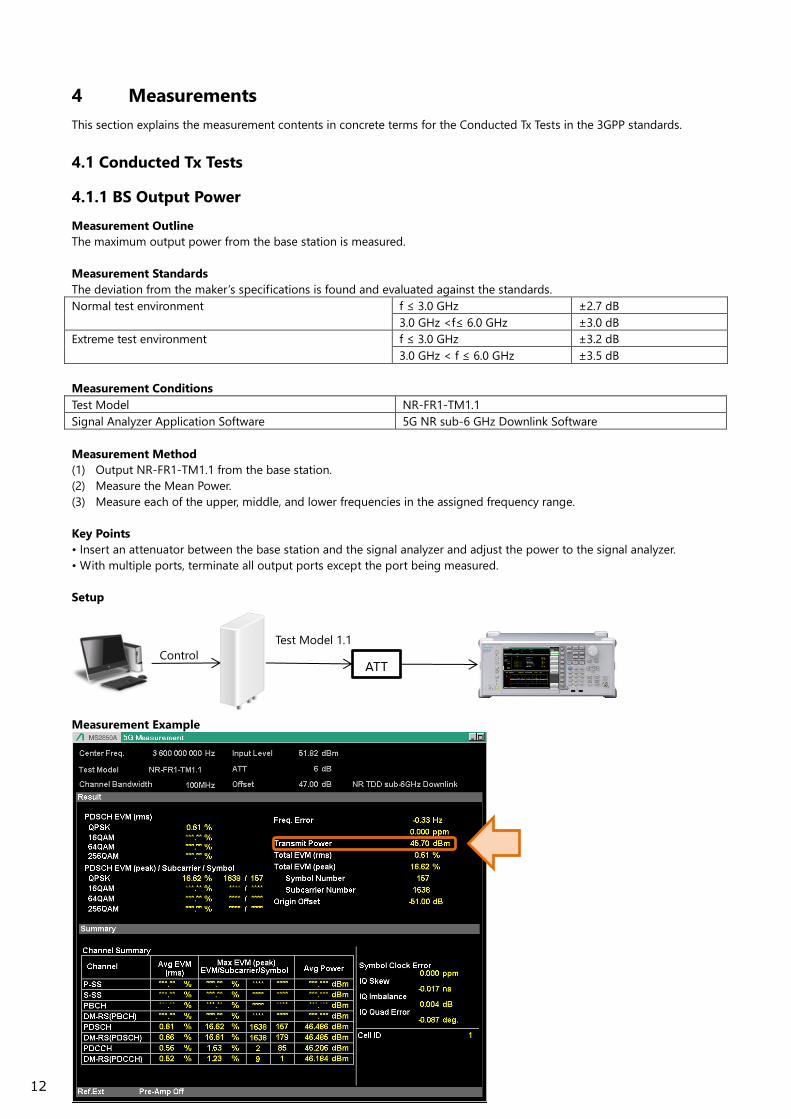
4.1.1 BS Output Power
Measurement Outline
The maximum output power from the base station is measured.
Measurement Standards
The deviation from the maker’s specifications is found and evaluated against the standards.
Normal test environment f ≤ 3.0 GHz ±2.7 dB
3.0 GHz <f≤ 6.0 GHz ±3.0 dB
Extreme test environment f ≤ 3.0 GHz ±3.2 dB
3.0 GHz < f ≤ 6.0 GHz ±3.5 dB
Measurement Conditions
Test Model NR-FR1-TM1.1
Signal Analyzer Application Software 5G NR sub-6 GHz Downlink Software
Measurement Method
(1) Output NR-FR1-TM1.1 from the base station.
(2) Measure the Mean Power.
(3) Measure each of the upper, middle, and lower frequencies in the assigned frequency range.
Key Points
• Insert an attenuator between the base station and the signal analyzer and adjust the power to the signal analyzer.
• With multiple ports, terminate all output ports except the port being measured.
Setup
Measurement Example
Control ATT
Test Model 1.1
13
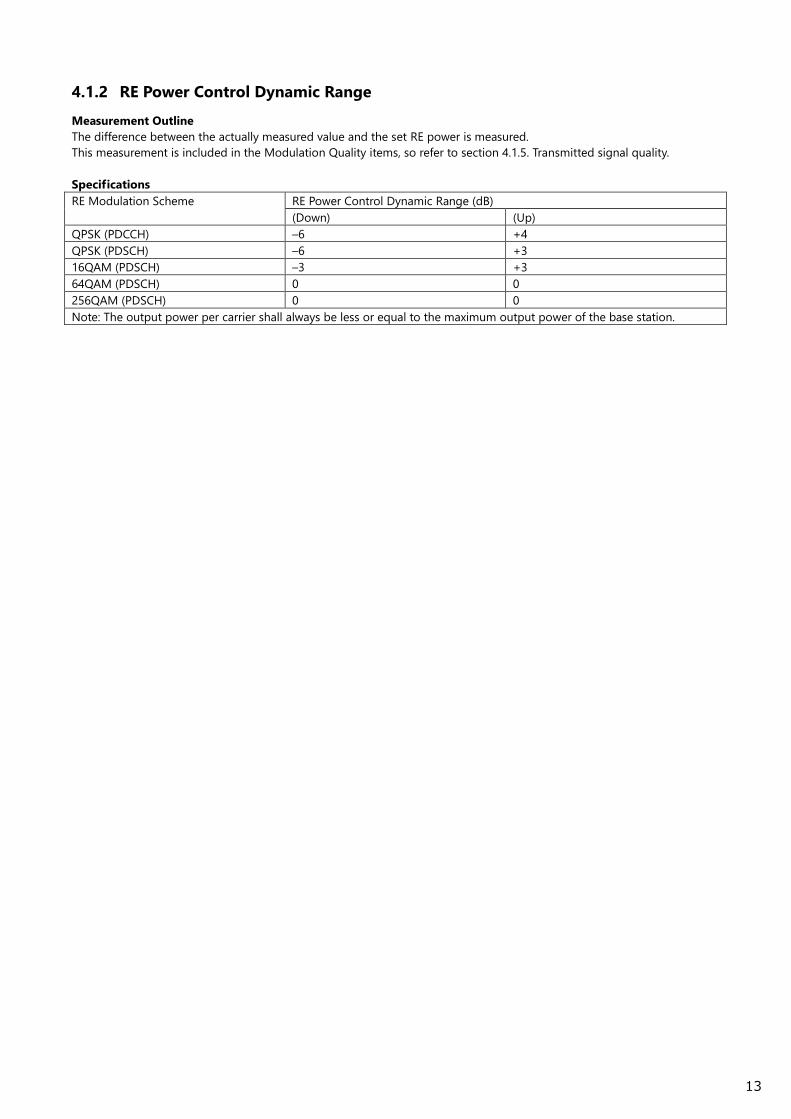
4.1.2 RE Power Control Dynamic Range
Measurement Outline
The difference between the actually measured value and the set RE power is measured.
This measurement is included in the Modulation Quality items, so refer to section 4.1.5. Transmitted signal quality.
Specifications
RE Modulation Scheme RE Power Control Dynamic Range (dB)
(Down) (Up)
QPSK (PDCCH) –6 +4
QPSK (PDSCH) –6 +3
16QAM (PDSCH) –3 +3
64QAM (PDSCH) 0 0
256QAM (PDSCH) 0 0
Note: The output power per carrier shall always be less or equal to the maximum output power of the base station.
14
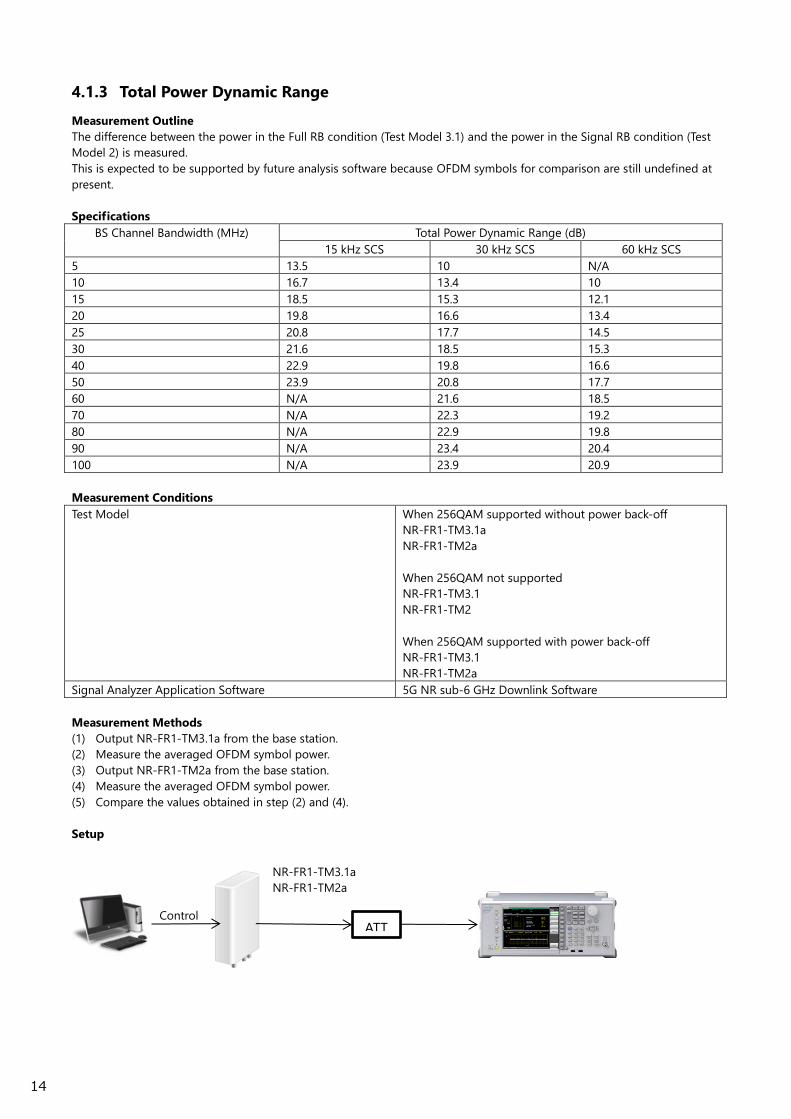
4.1.3 Total Power Dynamic Range
Measurement Outline
The difference between the power in the Full RB condition (Test Model 3.1) and the power in the Signal RB condition (Test
Model 2) is measured.
This is expected to be supported by future analysis software because OFDM symbols for comparison are still undefined at
present.
Specifications
BS Channel Bandwidth (MHz) Total Power Dynamic Range (dB)
15 kHz SCS 30 kHz SCS 60 kHz SCS
5 13.5 10 N/A
10 16.7 13.4 10
15 18.5 15.3 12.1
20 19.8 16.6 13.4
25 20.8 17.7 14.5
30 21.6 18.5 15.3
40 22.9 19.8 16.6
50 23.9 20.8 17.7
60 N/A 21.6 18.5
70 N/A 22.3 19.2
80 N/A 22.9 19.8
90 N/A 23.4 20.4
100 N/A 23.9 20.9
Measurement Conditions
Test Model When 256QAM supported without power back-off
NR-FR1-TM3.1a
NR-FR1-TM2a
When 256QAM not supported
NR-FR1-TM3.1
NR-FR1-TM2
When 256QAM supported with power back-off
NR-FR1-TM3.1
NR-FR1-TM2a
Signal Analyzer Application Software 5G NR sub-6 GHz Downlink Software
Measurement Methods
(1) Output NR-FR1-TM3.1a from the base station.
(2) Measure the averaged OFDM symbol power.
(3) Output NR-FR1-TM2a from the base station.
(4) Measure the averaged OFDM symbol power.
(5) Compare the values obtained in step (2) and (4).
Setup
Control ATT
NR-FR1-TM3.1a
NR-FR1-TM2a
15
4.1.4 Transmit ON/OFF Power
Measurement Outline
There are two measurement types as follows:
Transmit OFF power
Average power at base station OFF period
Transmitter transient period
Transition time from OFF to ON, or ON to OFF period
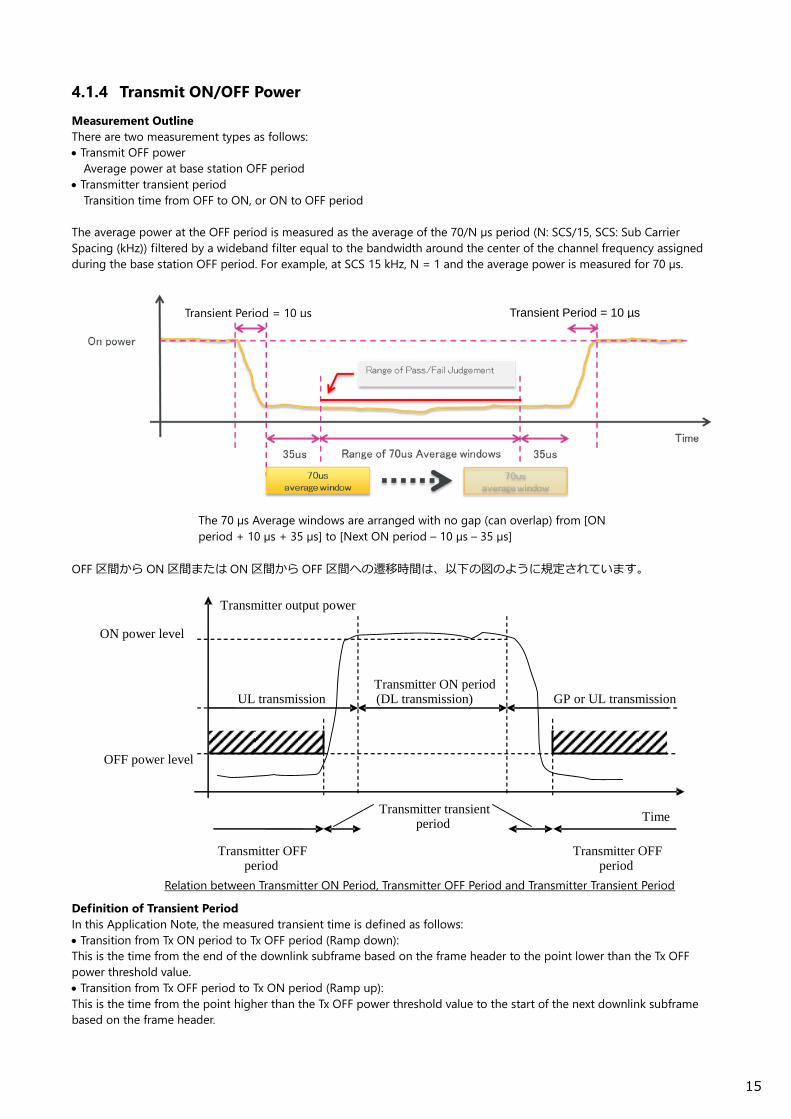
The average power at the OFF period is measured as the average of the 70/N µs period (N: SCS/15, SCS: Sub Carrier
Spacing (kHz)) filtered by a wideband filter equal to the bandwidth around the center of the channel frequency assigned
during the base station OFF period. For example, at SCS 15 kHz, N = 1 and the average power is measured for 70 µs.
OFF 区間から ON 区間または ON 区間から OFF 区間への遷移時間は、以下の図のように規定されています。
Definition of Transient Period
In this Application Note, the measured transient time is defined as follows:
Transition from Tx ON period to Tx OFF period (Ramp down):
This is the time from the end of the downlink subframe based on the frame header to the point lower than the Tx OFF
power threshold value.
Transition from Tx OFF period to Tx ON period (Ramp up):
This is the time from the point higher than the Tx OFF power threshold value to the start of the next downlink subframe
based on the frame header.
Transmitter output power
Time
Transmitter ON period (DL transmission)
Transmitter OFF period
Transmitter OFF period
Transmitter transient period
OFF power level
ON power level
UL transmission
GP or UL transmission
Relation between Transmitter ON Period, Transmitter OFF Period and Transmitter Transient Period
Transient Period = 10 µs Transient Period = 10 µs
The 70 µs Average windows are arranged with no gap (can overlap) from [ON
period + 10 µs + 35 µs] to [Next ON period – 10 µs – 35 µs]
16
Specifications
Transmit OFF Power
BS Type BS Output Power
1-C ≤–85 dBm/MHz per antenna connector
1-H ≤–85 dBm/MHz per TAB connector
Transient Period
Transition Transient Period Length (µs)
OFF to ON 10
ON to OFF 10
OFF Power Level at Transient Period Measurement
BS Type BS Output Power
1-C –83 dBm/MHz for carrier frequency f ≤ 3.0 GHz
–82.5 dBm/MHz for carrier frequency 3.0 GHz < f ≤ 6.0 GHz
1-H –83 dBm/MHz for carrier frequency f ≤ 3.0 GHz.
–82.5 dBm/MHz for carrier frequency 3.0 GHz < f ≤ 6.0 GHz
Measurement Conditions
Signal Analyzer Application Software Signal Analyzer Mode
Signal Analyzer Settings Mode: Power vs Time
Trigger Source: External 1
Span: 125 MHz
Detector: RMS
RBW Filter Type: Rect
Trace Points: 10001
Boost Average Power Function
Pre-amplifier: On
Storage: Lin Average
Average Count: 100
Measurement Method
(1) Output a signal from the base station.
(2) Set Marker 1 and Marker 2 to the 70/N µs period and measure the Tx OFF power. Since the Filter BW is 100 MHz,
calculate the value by conversion to 1 MHz. For example, –67 dBm at Filter BW of 100 MHz converts to –87 dBm at
Filter BW of 1 MHz.
(3) Set Marker 1 to the downlink subframe end time and Marker 2 to the point lower than the Tx OFF power threshold
value to measure the transition time from the Tx ON period to the OFF period.
Calculate the threshold value by conversion to Filter BW of 100 MHz. For example, –83 dBm at Filter BW of 1 MHz
converts to –63 dBm at Filter BW of 100 MHz.
(4) Set Marker 1 to the point lower than the Tx OFF power threshold and Marker 2 to the start of the next downlink
subframe to measure the transition time from the Tx OFF period to the ON period.
Calculate the threshold value by conversion to Filter BW of 100 MHz. For example, –83 dBm at Filter BW of 1 MHz
converts to –63 dBm at Filter BW of 100 MHz.
Key Points
Input the trigger signal from the base station to the measuring instrument to control the measurement timing.
At single-band use, measure at the center frequency in the assigned frequency range. At multi-band use, measure at the
upper, middle, and lower frequencies in the assigned frequency range.

17
Setup
Measurement Examples
Tx OFF Power Transient Time
Control ATT
Trigger
18
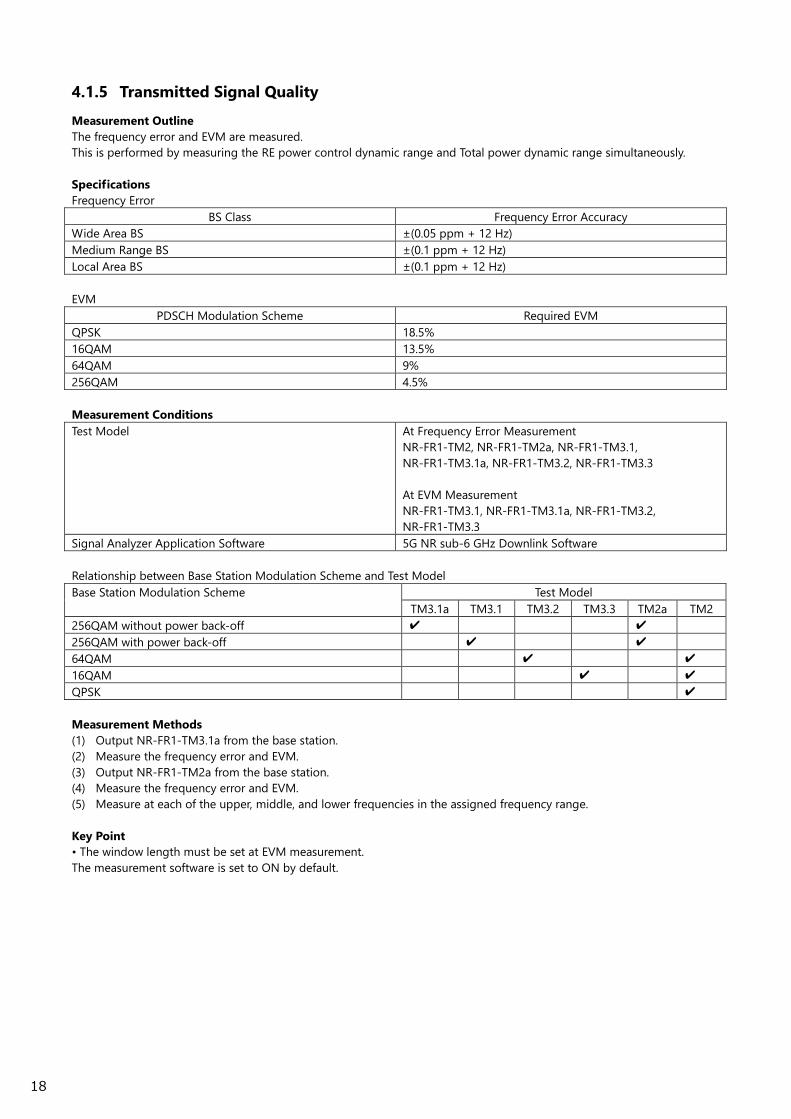
4.1.5 Transmitted Signal Quality
Measurement Outline
The frequency error and EVM are measured.
This is performed by measuring the RE power control dynamic range and Total power dynamic range simultaneously.
Specifications
Frequency Error
BS Class Frequency Error Accuracy
Wide Area BS ±(0.05 ppm + 12 Hz)
Medium Range BS ±(0.1 ppm + 12 Hz)
Local Area BS ±(0.1 ppm + 12 Hz)
EVM
PDSCH Modulation Scheme Required EVM
QPSK 18.5%
16QAM 13.5%
64QAM 9%
256QAM 4.5%
Measurement Conditions
Test Model At Frequency Error Measurement
NR-FR1-TM2, NR-FR1-TM2a, NR-FR1-TM3.1,
NR-FR1-TM3.1a, NR-FR1-TM3.2, NR-FR1-TM3.3
At EVM Measurement
NR-FR1-TM3.1, NR-FR1-TM3.1a, NR-FR1-TM3.2,
NR-FR1-TM3.3
Signal Analyzer Application Software 5G NR sub-6 GHz Downlink Software
Relationship between Base Station Modulation Scheme and Test Model
Base Station Modulation Scheme Test Model
TM3.1a TM3.1 TM3.2 TM3.3 TM2a TM2
256QAM without power back-off ✔ ✔
256QAM with power back-off ✔ ✔
64QAM ✔ ✔
16QAM ✔ ✔
QPSK ✔
Measurement Methods
(1) Output NR-FR1-TM3.1a from the base station.
(2) Measure the frequency error and EVM.
(3) Output NR-FR1-TM2a from the base station.
(4) Measure the frequency error and EVM.
(5) Measure at each of the upper, middle, and lower frequencies in the assigned frequency range.
Key Point
• The window length must be set at EVM measurement.
The measurement software is set to ON by default.

19
Setup
Measurement Example
Control ATT
Test Model
20
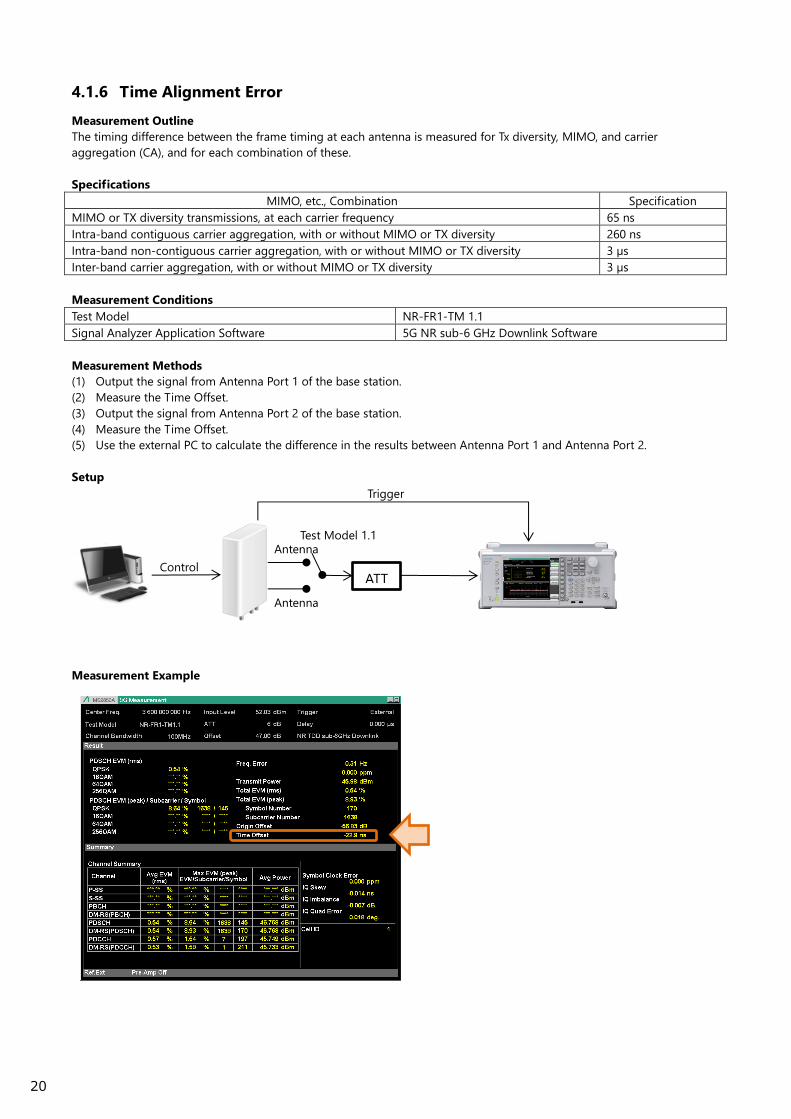
4.1.6 Time Alignment Error
Measurement Outline
The timing difference between the frame timing at each antenna is measured for Tx diversity, MIMO, and carrier
aggregation (CA), and for each combination of these.
Specifications
MIMO, etc., Combination Specification
MIMO or TX diversity transmissions, at each carrier frequency 65 ns
Intra-band contiguous carrier aggregation, with or without MIMO or TX diversity 260 ns
Intra-band non-contiguous carrier aggregation, with or without MIMO or TX diversity 3 µs
Inter-band carrier aggregation, with or without MIMO or TX diversity 3 µs
Measurement Conditions
Test Model NR-FR1-TM 1.1
Signal Analyzer Application Software 5G NR sub-6 GHz Downlink Software
Measurement Methods
(1) Output the signal from Antenna Port 1 of the base station.
(2) Measure the Time Offset.
(3) Output the signal from Antenna Port 2 of the base station.
(4) Measure the Time Offset.
(5) Use the external PC to calculate the difference in the results between Antenna Port 1 and Antenna Port 2.
Setup
測定例
Measurement Example
Control ATT
Test Model 1.1
Trigger
Antenna
1
Antenna
2
21
4.1.7 Occupied Bandwidth
Measurement Outline
The frequency bandwidth occupying 0.5% of the total Tx power for each of the upper and lower frequency bands is
measured.
Specifications
The occupied bandwidth for each NR Carrier wave must be smaller than the BS channel bandwidth. For in-band contiguous
CA, the occupied bandwidth must be less than the aggregate BS channel bandwidth.
Measurement Conditions
Test Model NR-FR1-TM1.1
Signal Analyzer Application Software Spectrum Analyzer
Signal Analyzer Settings Measurement Mode: OBW measurement function, 99% rule
(using template)
Span: Twice spectrum bandwidth
RBW: 100 kHz
VBW: 300 kHz
Detector: Positive
Trace Points: 10001
Storage: Max Hold
Average Count: 100
Span and Measurement Points Settings
Bandwidth BS Channel Bandwidth
BWChannel (MHz)
Aggregated BS Channel
Bandwidth BWChannel_CA(MHz)
5 10 15 >20 >20
Span (MHz) 10 20 30 2 × 𝐵𝑊𝐶ℎ𝑎𝑛𝑛𝑒𝑙 Minimum number of
measurement points
400 400 400
kHz
BW CAChannel
100
2
_
Measurement Methods
(1) Output NR-FR1-TM1.1 from the base station
(2) Measure the OBW using the OBW measurement function.
Key Point
• When using a single carrier, measure at the center frequency in the assigned frequency range. When using contiguous
multi-carriers, measure at the center frequency in the assigned frequency range.
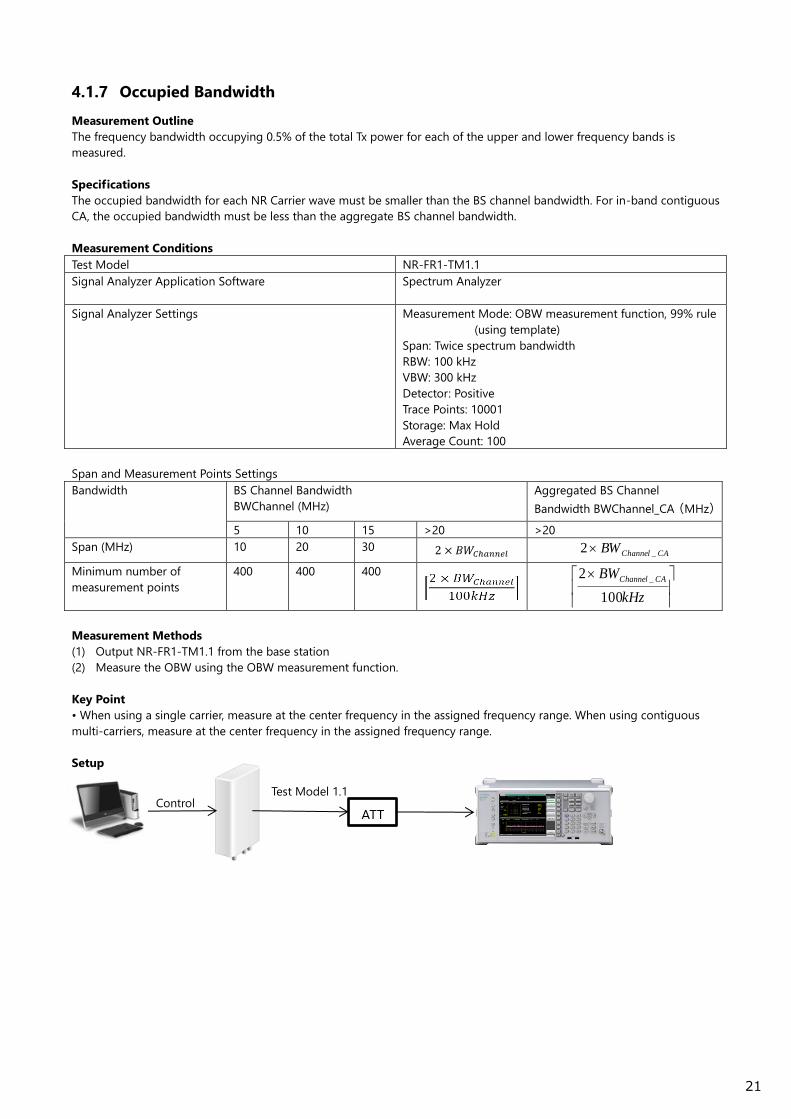
Setup
CAChannelBW _2
Control ATT
Test Model 1.1
22
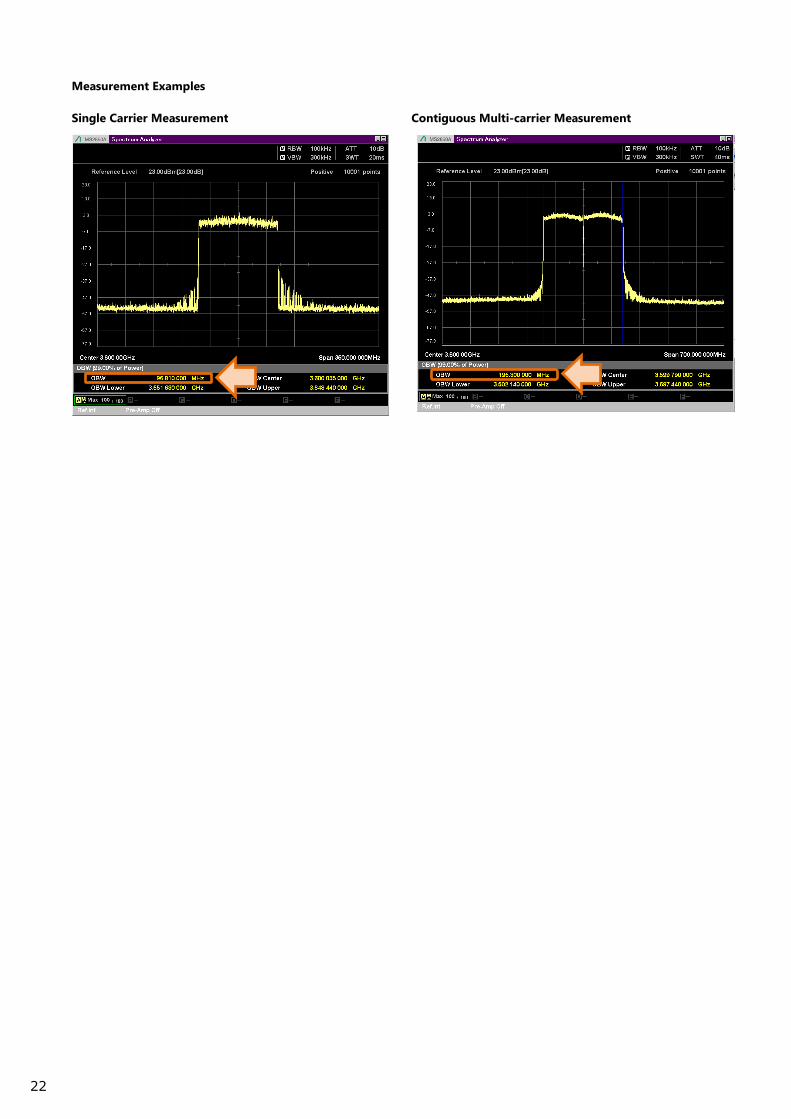
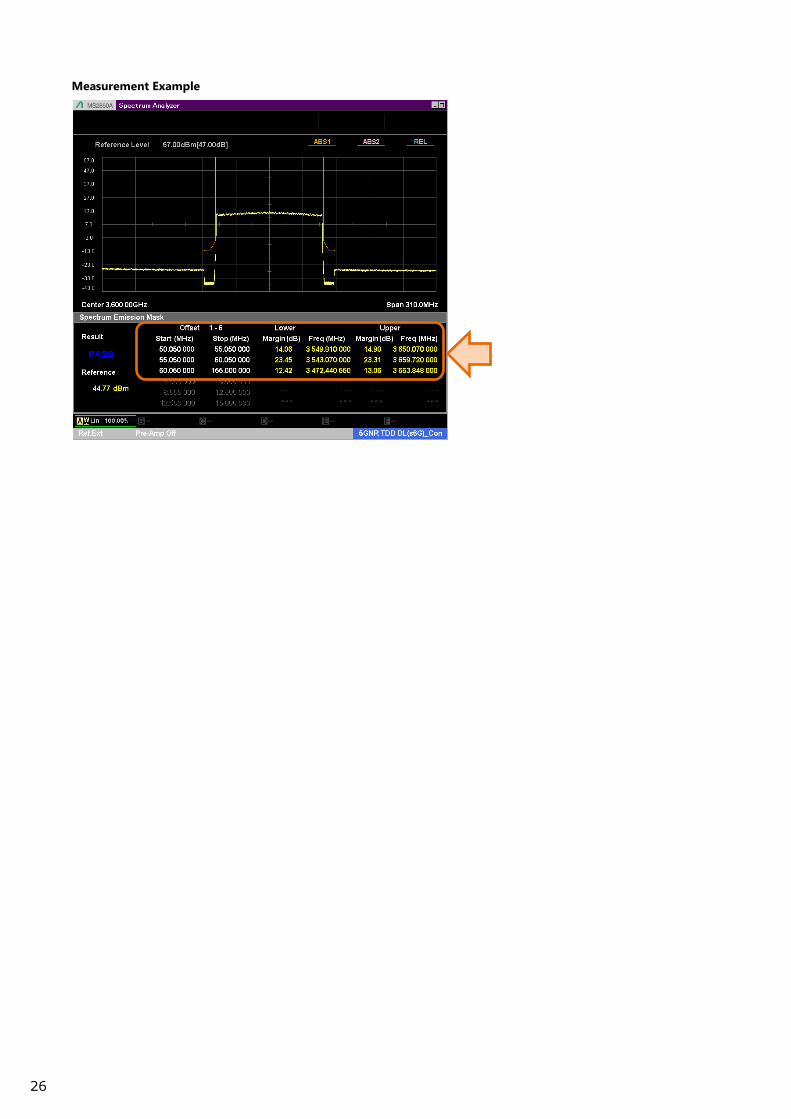
Measurement Examples
Single Carrier Measurement Contiguous Multi-carrier Measurement
23
4.1.8 Adjacent Channel Leakage Power Ratio
Measurement Outline
The ratio between the adjacent channel average power and the average power of the assigned frequency band is
measured.
Specifications
BS channel bandwidth
of lowest/highest NR
carrier transmitted
BWChannel (MHz)
BS adjacent channel center
frequency offset below lowest
or above highest carrier center
frequency transmitted
Assumed adjacent
channel carrier
(informative)
Filter on adjacent
channel frequency and
corresponding filter
bandwidth
ACLR limit
5, 10, 15, 20 BWChannel NR of same BW
(Note 2)
Square (BWConfig) 44.2 dB
2 x BWChannel NR of same BW
(Note 2)
Square (BWConfig) 44.2 dB
BWChannel /2 + 2.5 MHz 5 MHz E-UTRA Square (4.5 MHz) 44.2 dB
(Note 3)
BWChannel /2 + 7.5 MHz 5 MHz E-UTRA Square (4.5 MHz) 44.2 dB
(Note 3)
25, 30, 40, 50, 60, 70,
80, 90, 100
BWChannel NR of same BW
(Note 2)
Square (BWConfig) 43.8 dB
2 x BWChannel NR of same BW
(Note 2)
Square (BWConfig) 43.8 dB
BWChannel /2 + 2.5 MHz 5 MHz E-UTRA Square (4.5 MHz) 43.8 dB
(Note 3)
BWChannel /2 + 7.5 MHz 5 MHz E-UTRA Square (4.5 MHz) 43.8 dB
(Note 3)
Note 1: BWChannel and BWConfig are the BS channel bandwidth and transmission bandwidth configuration of the
lowest/highest NR carrier transmitted on the assigned channel frequency.
Note 2: With SCS providing largest transmission bandwidth configuration (BWConfig).
Note 3: The requirements are applicable when the band is also defined for E-UTRA or UTRA.
The following specifications are the absolute values and are applied when the above specifications are severe.
BS Category/BS Class ACLR Absolute Basic Limit
Category A Wide Area BS –13 dBm/MHz
Category B Wide Area BS –15 dBm/MHz
Medium Range BS –25 dBm/MHz
Local Area BS –32 dBm/MHz
Measurement Conditions
Test Model NR-FR1-TM1.1
Signal Analyzer Application Software Spectrum Analyzer
Signal Analyzer Settings Measurement Mode: ACP measurement function (using
template)
RBW: 100 kHz
RBW Filter Type: Rect (RBW filter type setting is
unnecessary because Rect is standard.)
Detector: RMS
Trace Point: 10001
Storage: Lin Average
Average Count: 100
24
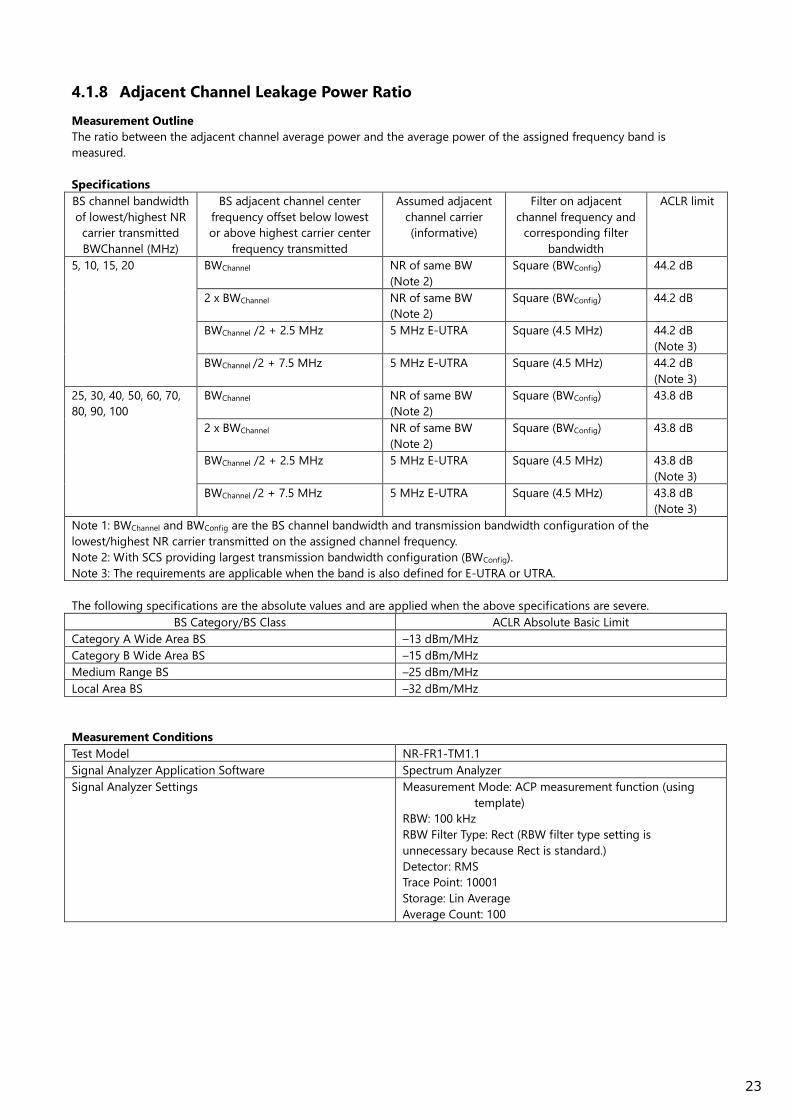
Measurement Methods
(1) Output NR-FR1-TM1.1 from the base station.
(2) Measure ACLR using the ACP measurement function.
(3) Measure at each of the upper, middle, and lower frequencies in the assigned frequency range.
Setup
Measurement Example
Control ATT
Test Model 1.1
25
4.1.9 Operating Band Unwanted Emissions
Measurement Outline
The spurious near the assigned frequency range is measured.
Specifications
Wide Area BS Operating Band Unwanted Emission Limits (NR bands >3 GHz) for Category A
Frequency Offset of
Measurement Filter 3 dB
Point, Δf
Frequency Offset of Measurement
Filter Center Frequency, f_offset
Basic Limit (Note 1, 2) Measurement
Bandwidth
0 MHz ≤ Δf < 5 MHz 0.05 MHz ≤ f_offset < 5.05 MHz dB
MHz
offsetfdBm
05.0
_
5
75.2
–5.2 dBm@f_offset 0.05 MHz
–12.2 dBm@ f_offset 5.05 MHz
100 kHz
5 MHz ≤ Δf <
Min (10 MHz, Δfmax)
5.05 MHz ≤ f_offset <
Min (10.05 MHz, f_offsetmax)
–12.2 dBm 100 kHz
10 MHz ≤ Δf ≤ Δfmax 10.5 MHz ≤ f_offset < f_offsetmax –13 dBm (Note 3) 1MHz
Note 1: For a BS supporting non-contiguous spectrum operation within any operating band, the emission limits within
sub-block gaps are calculated as a cumulative sum of contributions from adjacent sub-blocks on each side of the
sub-block gap, where the contribution from the far-end sub-block shall be scaled according to the measurement
bandwidth of the near-end sub-block. The exception is Δf ≥ 10 MHz from both adjacent sub-blocks on each side of the
sub-block gap, where the emission limits within sub-block gaps shall be –13 dBm/1 MHz.
Note 2: For a multi-band connector with Inter RF Bandwidth gap < 2*ΔfOBUE, the emission limits within the Inter RF
Bandwidth gaps are calculated as a cumulative sum of contributions from adjacent sub-blocks or RF Bandwidth on each
side of the Inter RF Bandwidth gap, where the contribution from the far-end sub-block or RF Bandwidth shall be scaled
according to the measurement bandwidth of the near-end sub-block or RF Bandwidth.
Note 3: The requirement is not applicable when Δfmax < 10 MHz.
Maximum Offset of Operating Band Unwanted Emissions Outside Downlink Operating Band
BS Type Operating Band Characteristics Δfmax (MHz)
BS type 1-C Assigned frequency range ≤ 200 MHz 10
200 MHz < Assigned frequency range ≤ 900 MHz 40
BS type 1-H Assigned frequency range ≤ 200 MHz 10
200 MHz < Assigned frequency range ≤ 900 MHz 40
Measurement Conditions
Test Model NR-FR1-TM1.1, NR-FR1-TM1.2
Signal Analyzer Application Software Spectrum Analyzer
Signal Analyzer Settings Measurement Mode: SEM measurement function (using
template)
Detector: RMS
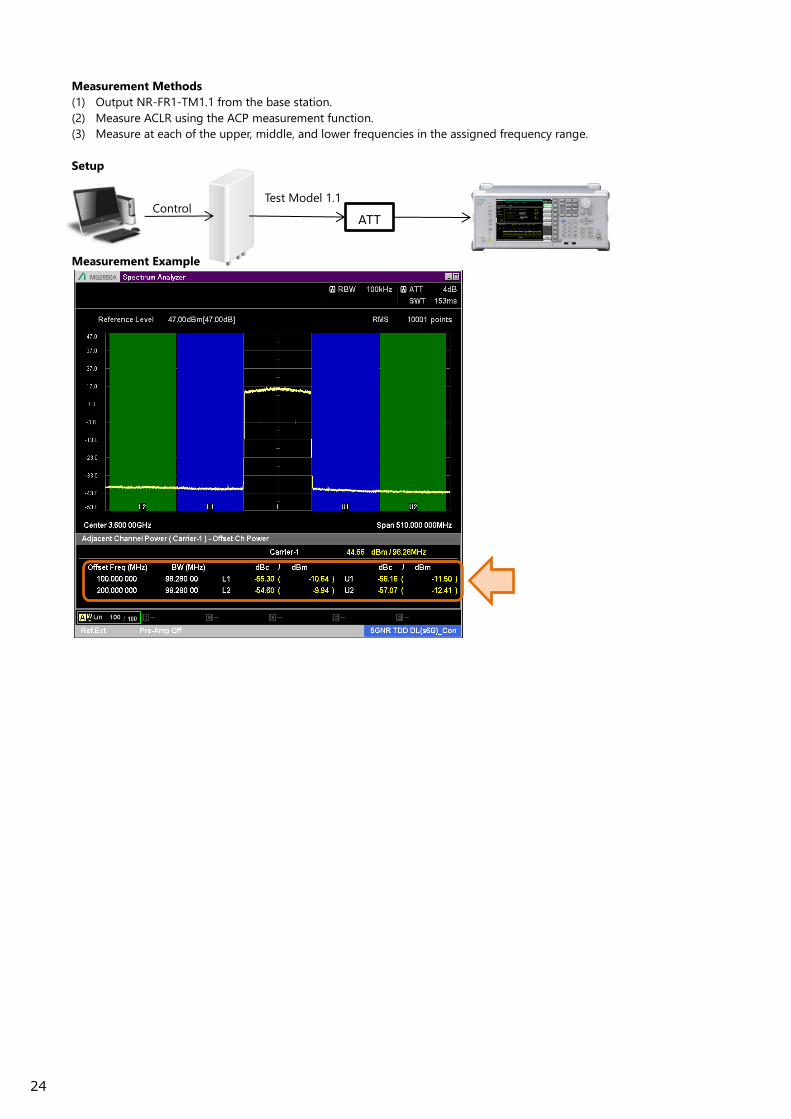
Measurement Methods
(1) Output NR-FR1-TM1.1 from the base station.
(2) Measure the spurious using the SEM measurement function.
(3) Measure at each of the upper, middle, and lower frequencies in the assigned frequency range.
Setup
Control ATT
Test Model 1.1
Test Model 1.2
26
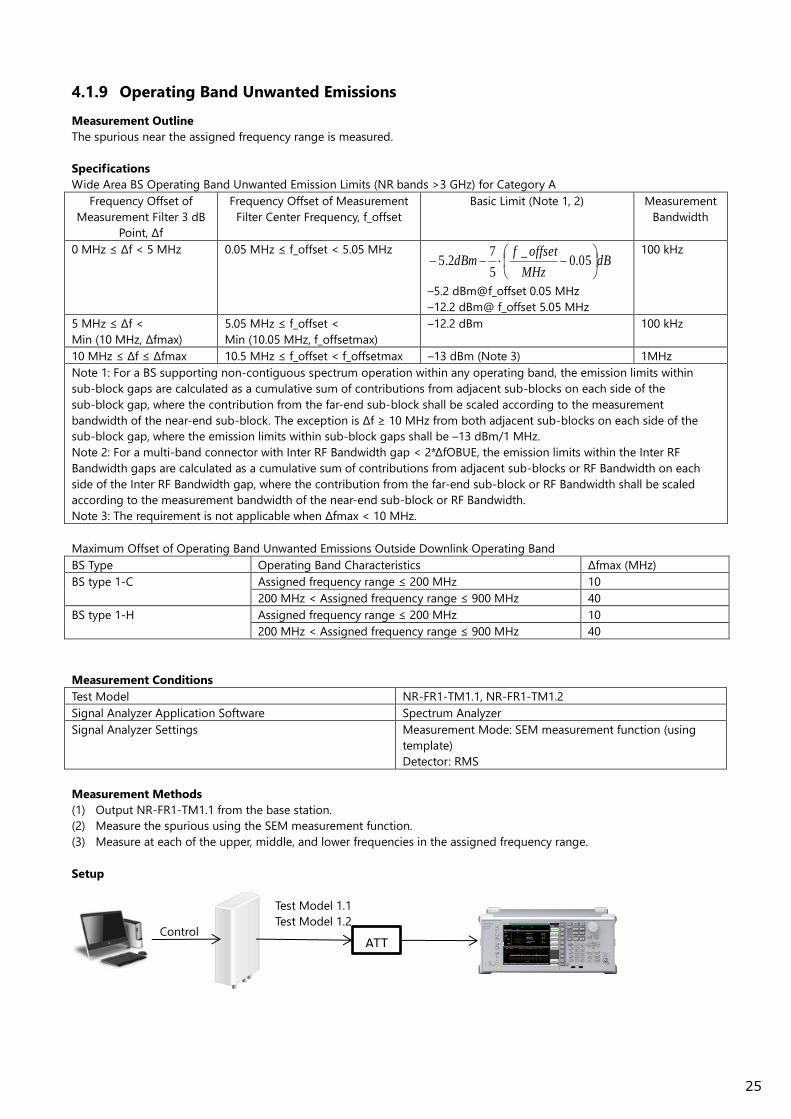
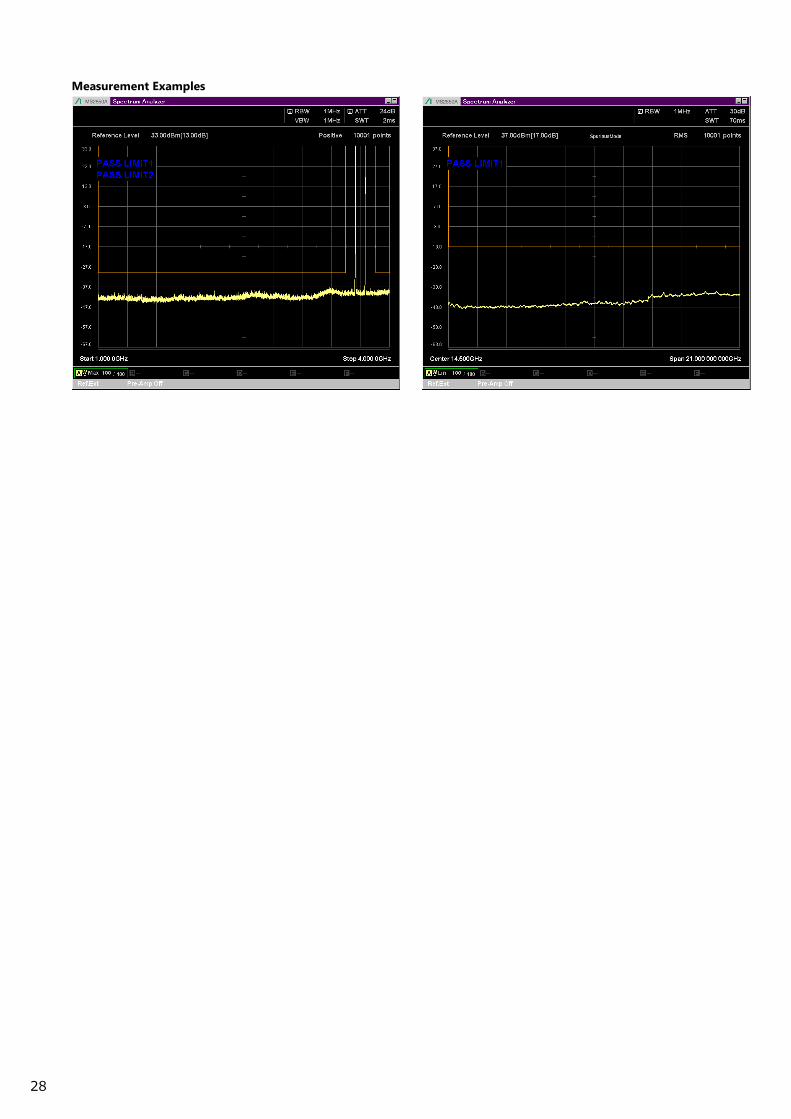
Measurement Example
27
4.1.10 Transmitter Spurious Emissions
Measurement Outline
Spurious measurement is performed from 9 kHz to the fifth harmonic excluding the operating bandwidth unwanted
emission measurement range.
Specifications
Tx General BS Transmitter Spurious Emission Limits in FR1, Category A
Spurious Frequency Range Basic Limit Measurement
Bandwidth
Notes
9 kHz to 150 kHz –13 dBm 1 kHz Note 1, Note 4
150 kHz to 30 MHz 10 kHz Note 1, Note 4
30 MHz to 1 GHz 100 kHz Note 1
1 GHz to 12.75 GHz 1 MHz Note 1, Note 2
12.75 GHz to 5th harmonic of upper frequency edge of DL
operating band in GHz
1 MHz Note 1, Note 2, Note 3
Note 1: Measurement bandwidths as in ITU-R SM.329 [2], s4.1.
Note 2: Upper frequency as in ITU-R SM.329 [2], s2.5 Table 1.
Note 3: This spurious frequency range applies only for operating bands for which the 5th harmonic of the upper frequency
edge of the DL operating band exceeds 12.75 GHz.
Note 4: This spurious frequency range applies only to BS type 1-C and BS type 1-H.
Rx
BS Class Frequency Range Basic Limit Measurement Bandwidth
Wide Area BS Assigned uplink frequency
range
–96 dBm 100 kHz
Medium Range BS –91 dBm
Local Area BS –88 dBm
Measurement Conditions
Test Model NR-FR1-TM1.1
Signal Analyzer Application Software Spectrum Analyzer
Signal Analyzer Settings Detector: RMS
Trace Points: 10001
Storage: Lin Average
Average Count: 100
Measurement Methods
(1) Output NR-FR1-TM1.1 from the base station.
(2) Set the spectrum analyzer measurement range.
(3) Measured the spurious in the measurement range.
Key Point
• Insert a band rejection filter (BRF) into the measurement system to cut the carrier.
Setup
Control ATT
Test Model BRF
28
Measurement Examples
29
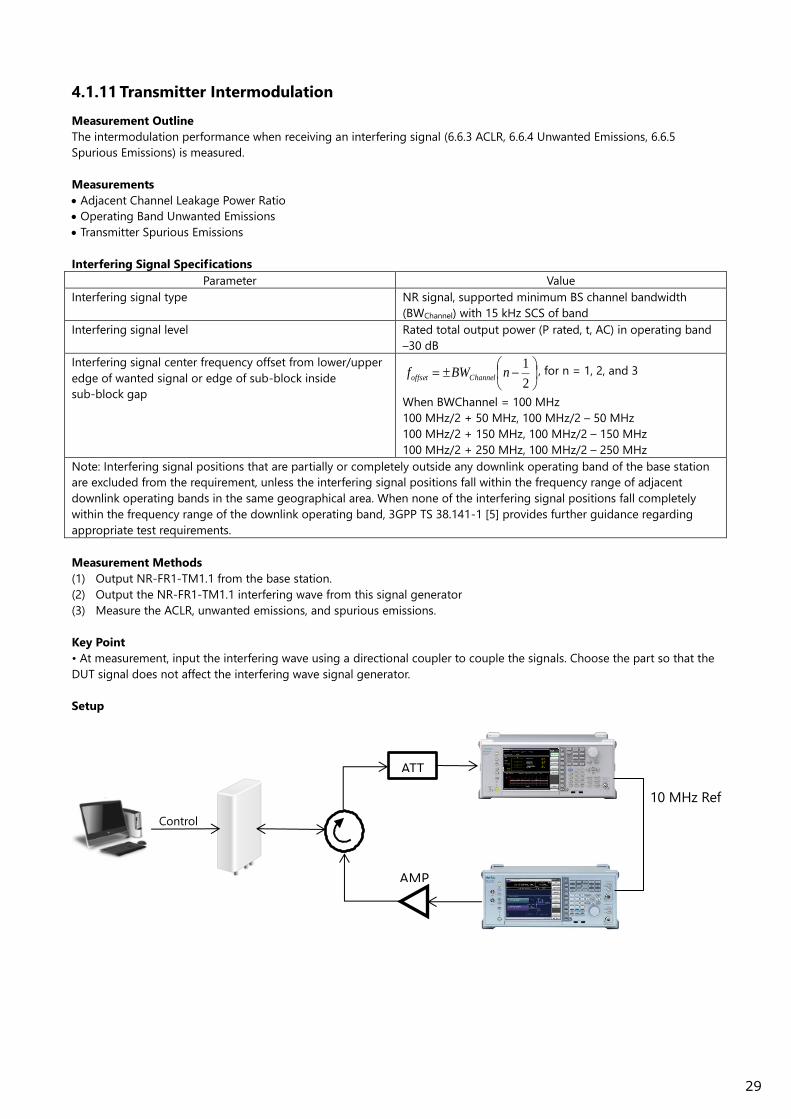
4.1.11 Transmitter Intermodulation
Measurement Outline
The intermodulation performance when receiving an interfering signal (6.6.3 ACLR, 6.6.4 Unwanted Emissions, 6.6.5
Spurious Emissions) is measured.
Measurements
Adjacent Channel Leakage Power Ratio
Operating Band Unwanted Emissions
Transmitter Spurious Emissions
Interfering Signal Specifications
Parameter Value
Interfering signal type NR signal, supported minimum BS channel bandwidth
(BWChannel) with 15 kHz SCS of band
Interfering signal level Rated total output power (P rated, t, AC) in operating band
–30 dB
Interfering signal center frequency offset from lower/upper
edge of wanted signal or edge of sub-block inside
sub-block gap
2
1nBWf Channeloffset
, for n = 1, 2, and 3
When BWChannel = 100 MHz
100 MHz/2 + 50 MHz, 100 MHz/2 – 50 MHz
100 MHz/2 + 150 MHz, 100 MHz/2 – 150 MHz
100 MHz/2 + 250 MHz, 100 MHz/2 – 250 MHz
Note: Interfering signal positions that are partially or completely outside any downlink operating band of the base station
are excluded from the requirement, unless the interfering signal positions fall within the frequency range of adjacent
downlink operating bands in the same geographical area. When none of the interfering signal positions fall completely
within the frequency range of the downlink operating band, 3GPP TS 38.141-1 [5] provides further guidance regarding
appropriate test requirements.
Measurement Methods
(1) Output NR-FR1-TM1.1 from the base station.
(2) Output the NR-FR1-TM1.1 interfering wave from this signal generator
(3) Measure the ACLR, unwanted emissions, and spurious emissions.
Key Point
• At measurement, input the interfering wave using a directional coupler to couple the signals. Choose the part so that the
DUT signal does not affect the interfering wave signal generator.
Setup
Control
ATT
AMP
10 MHz Ref

30
4.2 Conducted Rx Test
4.2.1 Reference sensitivity level
Measurement outline
This measures throughput even when the wanted signal level is low.
Specifications
NR Wide Area BS reference sensitivity levels
BS channel bandwidth (MHz) Sub-carrier
spacing
(kHz)
Reference
measurement
channel
Reference sensitivity power level, PREFSENS
(dBm)
≤ 3.0 GHz 3.0 GHz < f
≤ 4.2 GHz
4.2 GHz < f
≤ 6.0 GHz
5, 10, 15 15 G-FR1-A1-1 –101 –100.7 –100.5
10, 15 30 G-FR1-A1-2 –101.1 –100.8 –100.6
10, 15 60 G-FR1-A1-3 –98.2 –97.9 –97.7
20, 25, 30, 40, 50 15 G-FR1-A1-4 –94.6 –94.3 –94.1
20, 25, 30, 40, 50, 60, 70, 80, 90, 100 30 G-FR1-A1-5 –94.9 –94.6 –94.4
20, 25, 30, 40, 50, 60, 70, 80, 90, 100 60 G-FR1-A1-6 –95 –94.7 –94.5
Measurement conditions
FRC (Fixed Reference Channel) Select from the above table according to the base-station
bandwidth and SCS.
The FRC waveform pattern can be created easily using the 5G NR sub-6 GHz TDD IQproducer Easy Setup mode.
Measurement method
(1) Set the waveform pattern signal output from the signal generator.
(2) Set the output level.
(3) Measure the Throughput at the base station and confirm that it is ≥95%.
(4) Measure the Throughput at each of the upper, middle, and lower frequencies of the allocated frequency range.
Setup
Wanted Signal
Throughput
5G NR IQproducer
31
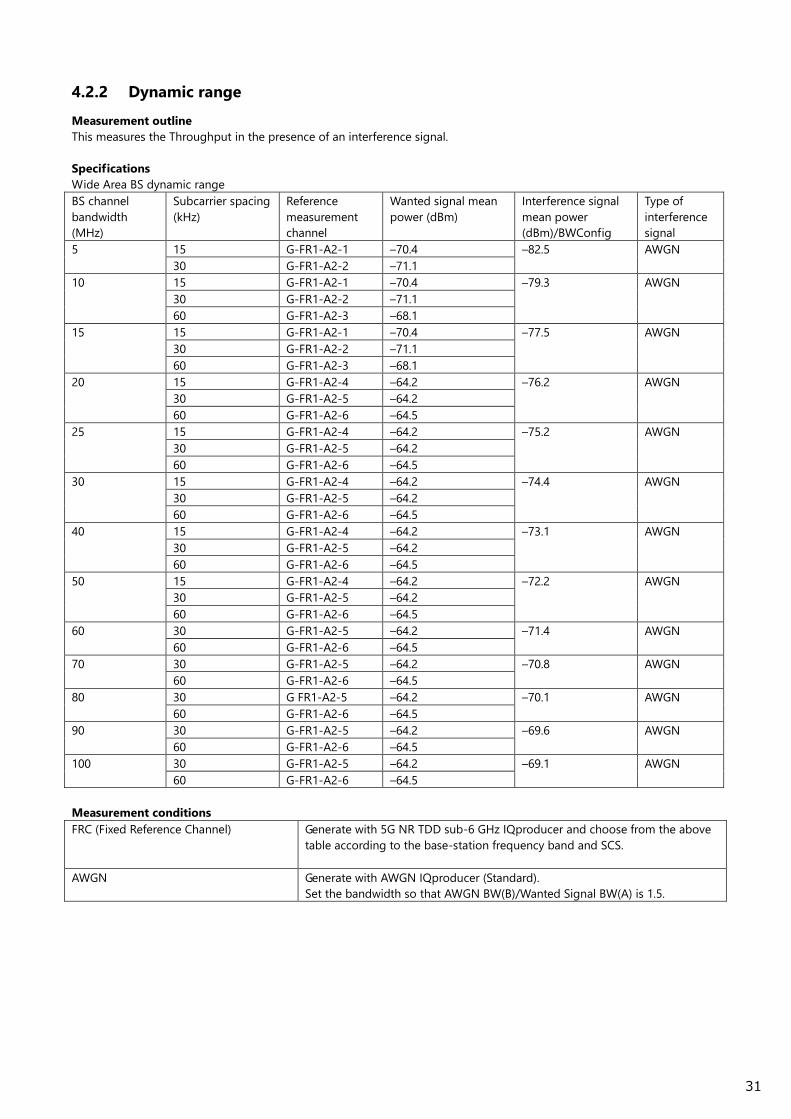
4.2.2 Dynamic range
Measurement outline
This measures the Throughput in the presence of an interference signal.
Specifications
Wide Area BS dynamic range
BS channel
bandwidth
(MHz)
Subcarrier spacing
(kHz)
Reference
measurement
channel
Wanted signal mean
power (dBm)
Interference signal
mean power
(dBm)/BWConfig
Type of
interference
signal
5 15 G-FR1-A2-1 –70.4 –82.5 AWGN
30 G-FR1-A2-2 –71.1
10 15 G-FR1-A2-1 –70.4 –79.3 AWGN
30 G-FR1-A2-2 –71.1
60 G-FR1-A2-3 –68.1
15 15 G-FR1-A2-1 –70.4 –77.5 AWGN
30 G-FR1-A2-2 –71.1
60 G-FR1-A2-3 –68.1
20 15 G-FR1-A2-4 –64.2 –76.2 AWGN
30 G-FR1-A2-5 –64.2
60 G-FR1-A2-6 –64.5
25 15 G-FR1-A2-4 –64.2 –75.2 AWGN
30 G-FR1-A2-5 –64.2
60 G-FR1-A2-6 –64.5
30 15 G-FR1-A2-4 –64.2 –74.4 AWGN
30 G-FR1-A2-5 –64.2
60 G-FR1-A2-6 –64.5
40 15 G-FR1-A2-4 –64.2 –73.1 AWGN
30 G-FR1-A2-5 –64.2
60 G-FR1-A2-6 –64.5
50 15 G-FR1-A2-4 –64.2 –72.2 AWGN
30 G-FR1-A2-5 –64.2
60 G-FR1-A2-6 –64.5
60 30 G-FR1-A2-5 –64.2 –71.4 AWGN
60 G-FR1-A2-6 –64.5
70 30 G-FR1-A2-5 –64.2 –70.8 AWGN
60 G-FR1-A2-6 –64.5
80 30 G FR1-A2-5 –64.2 –70.1 AWGN
60 G-FR1-A2-6 –64.5
90 30 G-FR1-A2-5 –64.2 –69.6 AWGN
60 G-FR1-A2-6 –64.5
100 30 G-FR1-A2-5 –64.2 –69.1 AWGN
60 G-FR1-A2-6 –64.5
Measurement conditions
FRC (Fixed Reference Channel) Generate with 5G NR TDD sub-6 GHz IQproducer and choose from the above
table according to the base-station frequency band and SCS.
AWGN Generate with AWGN IQproducer (Standard).
Set the bandwidth so that AWGN BW(B)/Wanted Signal BW(A) is 1.5.

32
Measurement method
(1) Use the two-waveform addition function to save the wanted-signal (G-FR1-A2-1) waveform file to memory 1 and the
AWGN-waveform file to memory 2.
(2) Set the output level for each of the wanted and interference signals.
(3) Output the signal from the signal generator.
(4) Measure the Throughput at the base station and confirm that it is ≥95%.
(5) Measure the Throughput at the center frequency of the allocated frequency range.
Setup
Wanted Signal
+
Interference Signal (AWGN)
Throughput
5G NR IQproducer AWGN IQproducer
33
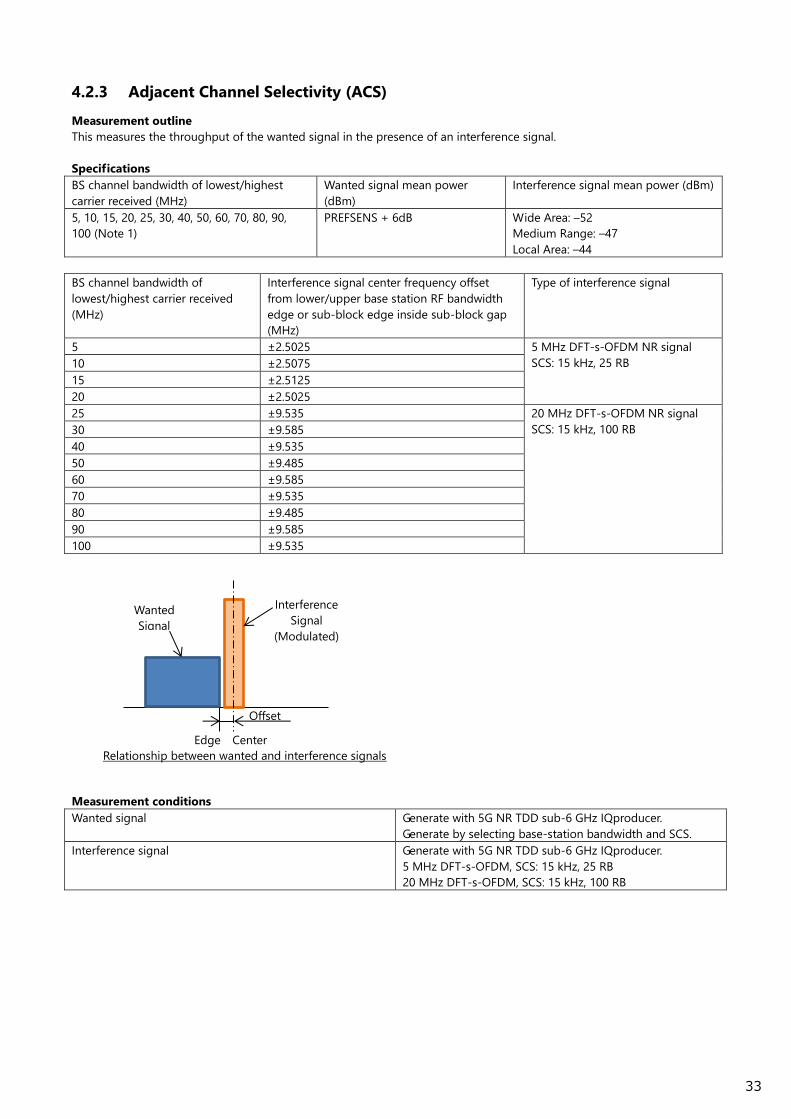
4.2.3 Adjacent Channel Selectivity (ACS)
Measurement outline
This measures the throughput of the wanted signal in the presence of an interference signal.
Specifications
BS channel bandwidth of lowest/highest
carrier received (MHz)
Wanted signal mean power
(dBm)
Interference signal mean power (dBm)
5, 10, 15, 20, 25, 30, 40, 50, 60, 70, 80, 90,
100 (Note 1)
PREFSENS + 6dB Wide Area: –52
Medium Range: –47
Local Area: –44
BS channel bandwidth of
lowest/highest carrier received
(MHz)
Interference signal center frequency offset
from lower/upper base station RF bandwidth
edge or sub-block edge inside sub-block gap
(MHz)
Type of interference signal
5 ±2.5025 5 MHz DFT-s-OFDM NR signal
SCS: 15 kHz, 25 RB 10 ±2.5075
15 ±2.5125
20 ±2.5025
25 ±9.535 20 MHz DFT-s-OFDM NR signal
SCS: 15 kHz, 100 RB 30 ±9.585
40 ±9.535
50 ±9.485
60 ±9.585
70 ±9.535
80 ±9.485
90 ±9.585
100 ±9.535
Measurement conditions
Wanted signal Generate with 5G NR TDD sub-6 GHz IQproducer.
Generate by selecting base-station bandwidth and SCS.
Interference signal Generate with 5G NR TDD sub-6 GHz IQproducer.
5 MHz DFT-s-OFDM, SCS: 15 kHz, 25 RB
20 MHz DFT-s-OFDM, SCS: 15 kHz, 100 RB
Offset
Edge Center
Wanted
Signal
Interference
Signal
(Modulated)
Relationship between wanted and interference signals

34
Measurement method
(1) Use the two-waveform addition function to save the wanted-signal waveform file to memory 1.
(2) Save the interference signal in memory 2, and set the offset frequency.
(3) Output the signal from the signal generator.
(4) Measure the Throughput at the base station and confirm that it is ≥95%.
Measure the Throughput at the center frequency of the allocated frequency range.
Setup
Wanted Signal
+
Interference Signal
Throughput
5G NR IQproducer
35
4.2.4 In-band blocking
Measurement outline
This measures the Throughput of the wanted signal in the presence of an interference signal.
Specifications
Applicable range
BS type Operating band characteristics ΔfOOB
(MHz)
Range (MHz)
BS type 1-C FUL, high – FUL, low ≤ 200 MHz 20 FUL, low –20 ≤ ≤UL, high + 20
200 MHz < FUL, high – FUL, low ≤ 900 MHz 60 FUL, low –60 ≤ ≤UL, high + 60
BS type 1-H FUL, high – FUL, low < 100 MHz 20 FUL, low –20 ≤ ≤UL, high + 20
100 MHz ≤ FUL, high – FUL, low ≤ 900 MHz 60 FUL, low –60 ≤ ≤UL, high + 60
General blocking
BS channel
bandwidth of
lowest/highest carrier
received (MHz)
Wanted signal mean
power (dBm)
Interference signal
mean power (dBm)
Interference signal center
frequency minimum
offset from lower/upper
base station RF
bandwidth edge or
sub-block edge inside
sub-block gap (MHz)
Type of interference
signal
5, 10, 15, 20 PREFSENS + 6 dB Wide Area: –43
Medium Range: –38
Local Area: –35
±7.5 5 MHz DFT-s-OFDM NR
signal
SCS: 15 kHz, 25 RB
25, 30, 40, 50, 60, 70,
80, 90, 100
PREFSENS + 6 dB Wide Area: –43
Medium Range: –38
Local Area: –35
±30 20 MHz DFT-s-OFDM
NR signal
SCS: 15 kHz, 100 RB
Narrowband blocking
BS channel
bandwidth of the
lowest/highest
carrier received
(MHz)
Wanted signal
mean power
(dBm)
Interference signal
mean power (dBm)
Interference RB center frequency offset
to lower/upper base station RF
bandwidth edge or sub-block edge
inside sub-block gap (kHz)
Type of
interference
signal
5 PREFSENS + 6 dB Wide Area: –49
Medium Range: –44
Local Area: –41
±([342.5]+m*180),
m = 0, 1, 2, 3, 4, 9, 14, 19, 24
5 MHz
DFT-s-OFDM
NR signal, 1 RB
SCS: 15 kHz
10 ±([347.5]+m*180),
m = 0, 1, 2, 3, 4, 9, 14, 19, 24
15 ±([352.5]+m*180),
m = 0, 1, 2, 3, 4, 9, 14, 19, 24
20 ±([342.5]+m*180),
m = 0, 1, 2, 3, 4, 9, 14, 19, 24
25 ±([557.5]+m*180),
m = 0, 1, 2, 3, 4, 29, 54, 79, 100
20 MHz
DFT-s-OFDM
NR signal, 1 RB
SCS: 15 kHz
30 ±([562.5]+m*180),
m = 0, 1, 2, 3, 4, 29, 54, 79, 100
40 ±([557.5]+m*180),
m = 0, 1, 2, 3, 4, 29, 54, 79, 100
50 ±([552.5]+m*180),
m = 0, 1, 2, 3, 4, 29, 54, 79, 100
60 ±([562.5]+m*180),
m = 0, 1, 2, 3, 4, 29, 54, 79, 100
70 ±([557.5]+m*180),
m = 0, 1, 2, 3, 4, 29, 54, 79, 100
80 ±([552.5]+m*180),
m = 0, 1, 2, 3, 4, 29, 54, 79, 100
90 ±([562.5]+m*180),
m = 0, 1, 2, 3, 4, 29, 54, 79, 100
36
100 ±([557.5]+m*180),
m = 0, 1, 2, 3, 4, 29, 54, 79, 100
Measurement Conditions
Wanted signal Generate with 5G NR TDD sub-6 GHz IQproducer.
Generate by selecting the base-station bandwidth and SCS.
Interference signal Generate with 5G NR TDD sub-6 GHz IQproducer.
5 MHz DFT-s-OFDM SCS: 15 kHz, 1 RB
20 MHz DFT-s-OFDM SCS: 15 kHz, 1 RB
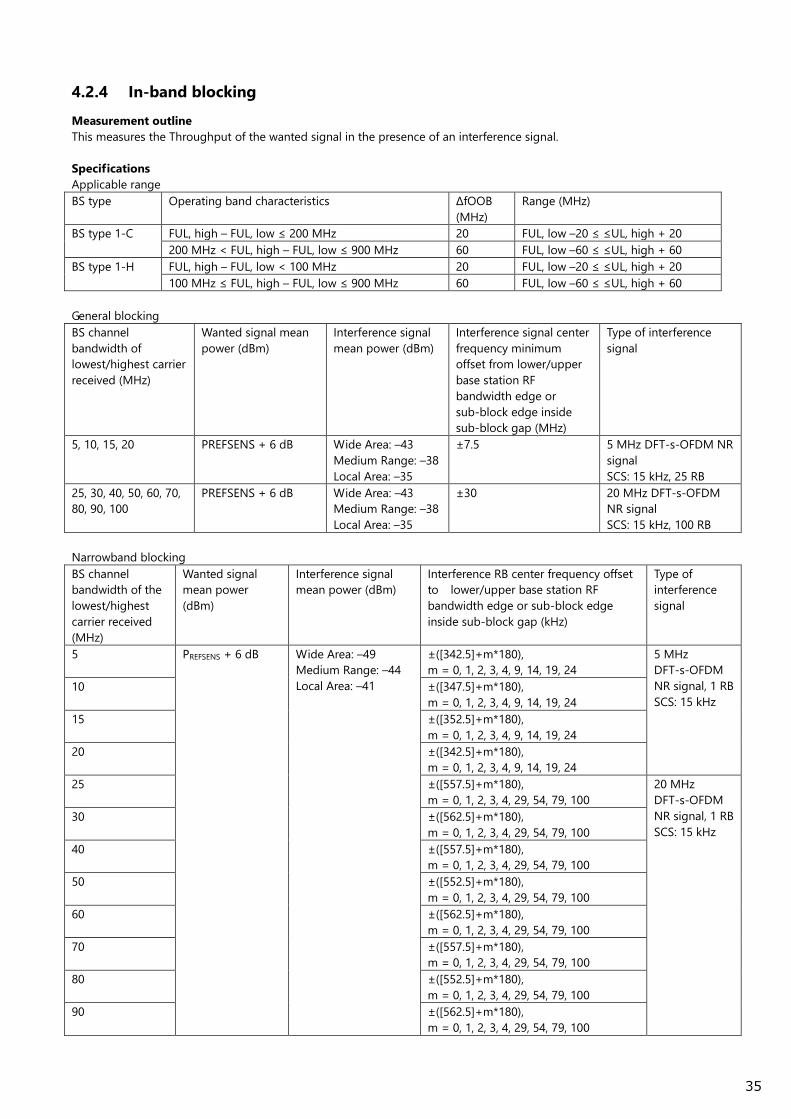
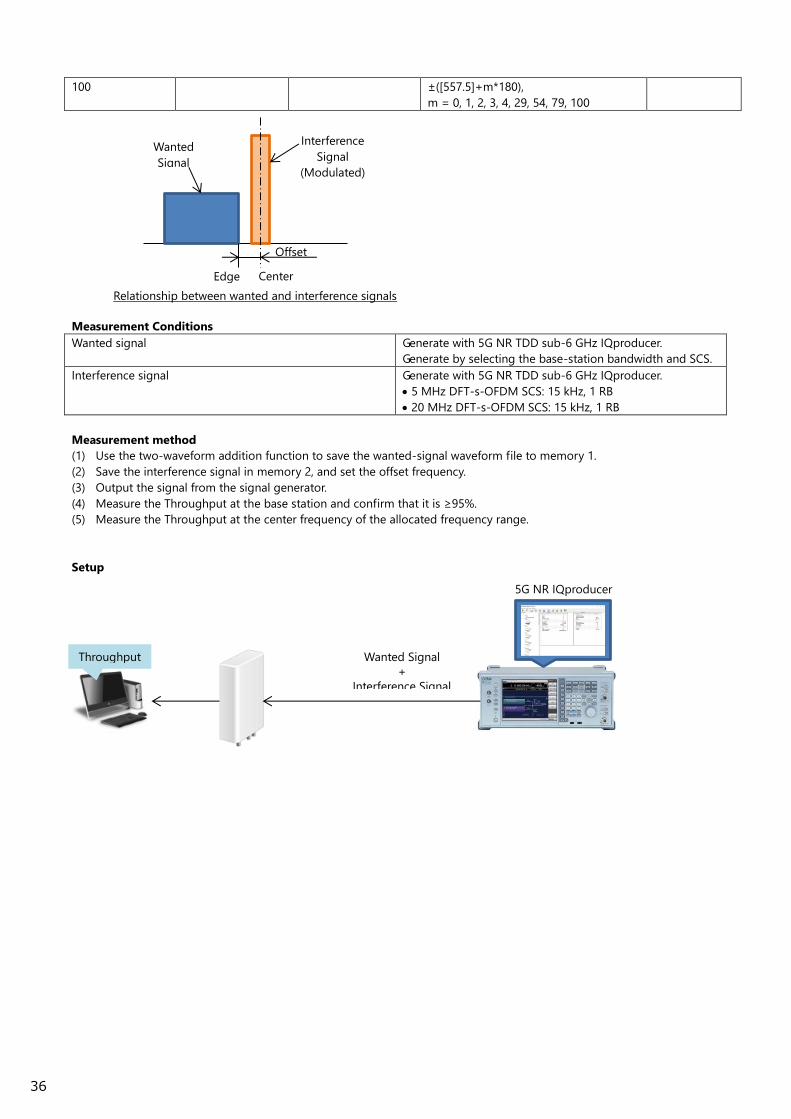
Measurement method
(1) Use the two-waveform addition function to save the wanted-signal waveform file to memory 1.
(2) Save the interference signal in memory 2, and set the offset frequency.
(3) Output the signal from the signal generator.
(4) Measure the Throughput at the base station and confirm that it is ≥95%.
(5) Measure the Throughput at the center frequency of the allocated frequency range.
Setup
Wanted Signal
+
Interference Signal
Throughput
5G NR IQproducer
Offset
Edge Center
Wanted
Signal
Interference
Signal
(Modulated)
Relationship between wanted and interference signals

37
4.2.5 Out-of-band blocking
Measurement outline
This measures the Throughput of the wanted signal in the presence of an interference signal.
Specifications
General
NOTE: PREFSENS depends on the BS channel bandwidth as specified in TS 38.104 [2], Table 7.2.2-1, 7.2.2-2 and 7.2.2-3.
Measurement conditions
Wanted signal Generate with 5G NR TDD sub-6 GHz IQproducer.
Generate by selecting base-station bandwidth and SCS.
Interference signal CW Signal
Measurement Method
(1) Set the wanted signal waveform file at SG1.
(2) Set the CW interference signal setting at SG2.
(3) Output the signal from the signal generator.
(4) Measure the Throughput at the base station and confirm that it is ≥95%.
Measure the Throughput at the center of frequency of the allocated frequency range.
Setup
Wanted signal mean power
(dBm)
Interference
signal mean
power (dBm)
Type of interference
signal
Interference signal frequency range
PREFSENS +6 dB
(Note)
–15 CW carrier 1 MHz to FUL, low - ΔfOOB and from FUL,
high + ΔfOOB up to 12750 MHz
Wanted
Signal
Interference
Signal
(CW)
1 MHz 12.75 GHz
Wanted Signal
Throughput
5G NR IQproducer
Filter
Hybrid Coupler
10 MHz Ref
Interference Signal
(CW)
Relationship between interference and wanted signals

38
4.2.6 Receiver spurious emissions
Measurement outline
This measures the Rx spurious.
Specifications
Spurious frequency range Basic limits Measurement
bandwidth
Note
30 MHz to 1 GHz –57 dBm 100 kHz Note 1
1 GHz to 12.75 GHz –47 dBm 1 MHz Note 1, Note 2
12.75 GHz – 5th harmonic of upper frequency edge of
UL operating band in GHz
–47 dBm 1 MHz Note 1, Note 2,
Note 3
Note 1: Measurement bandwidths as in ITU-R SM.329 [2], s4.1.
Note 2: Upper frequency as in ITU-R SM.329 [2], s2.5 Table 1.
Note 3: This spurious frequency range applies only for operating bands for which the 5th harmonic of the upper frequency
edge of the UL operating band reaches beyond 12.75 GHz.
Measurement conditions
Signal analyzer application software Spectrum analyzer
Signal analyzer settings Detector: RMS
Trace Point: 10001
Storage: Lin Average
Average Count: 100
Measurement method
(1) Set the NR-FR1-TM1.1 signal at the base station.
(2) Set the signal-analyzer measurement range.
(3) Measure the spurious in the measurement range.
Setup
Control
Trigger
Terminate unused
connectors
39
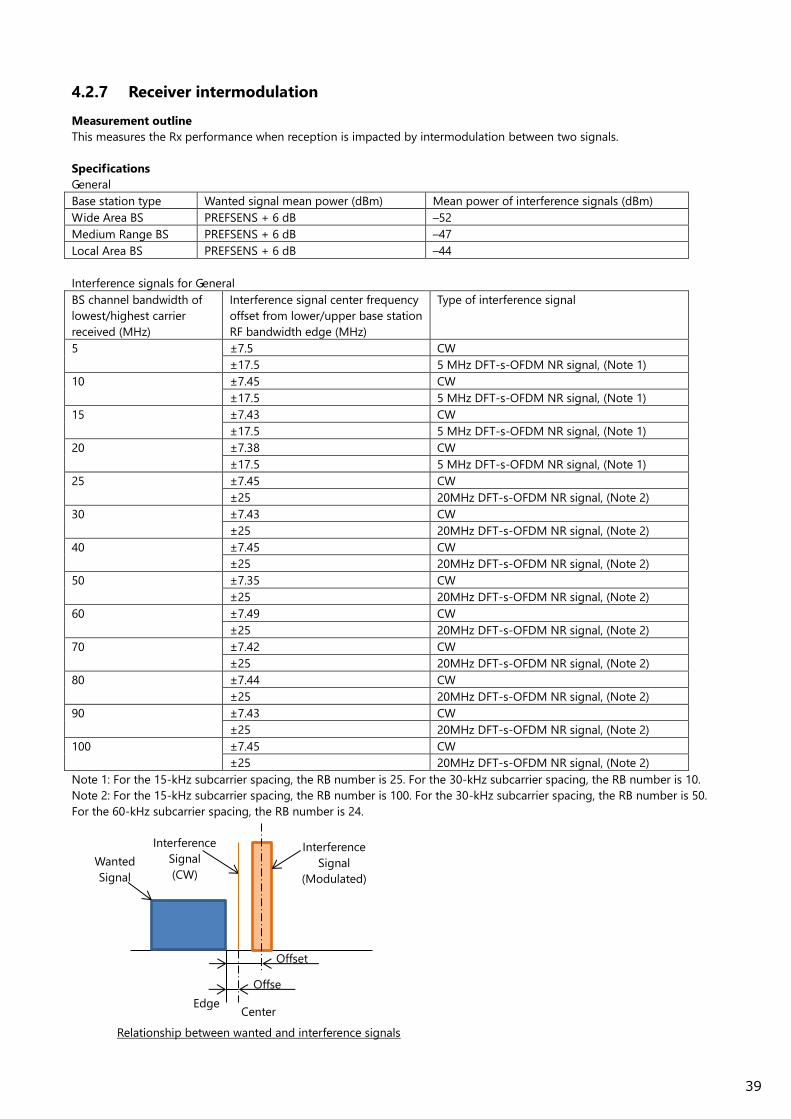
4.2.7 Receiver intermodulation
Measurement outline
This measures the Rx performance when reception is impacted by intermodulation between two signals.
Specifications
General
Base station type Wanted signal mean power (dBm) Mean power of interference signals (dBm)
Wide Area BS PREFSENS + 6 dB –52
Medium Range BS PREFSENS + 6 dB –47
Local Area BS PREFSENS + 6 dB –44
Interference signals for General
BS channel bandwidth of
lowest/highest carrier
received (MHz)
Interference signal center frequency
offset from lower/upper base station
RF bandwidth edge (MHz)
Type of interference signal
5 ±7.5 CW
±17.5 5 MHz DFT-s-OFDM NR signal, (Note 1)
10 ±7.45 CW
±17.5 5 MHz DFT-s-OFDM NR signal, (Note 1)
15 ±7.43 CW
±17.5 5 MHz DFT-s-OFDM NR signal, (Note 1)
20 ±7.38 CW
±17.5 5 MHz DFT-s-OFDM NR signal, (Note 1)
25 ±7.45 CW
±25 20MHz DFT-s-OFDM NR signal, (Note 2)
30 ±7.43 CW
±25 20MHz DFT-s-OFDM NR signal, (Note 2)
40 ±7.45 CW
±25 20MHz DFT-s-OFDM NR signal, (Note 2)
50 ±7.35 CW
±25 20MHz DFT-s-OFDM NR signal, (Note 2)
60 ±7.49 CW
±25 20MHz DFT-s-OFDM NR signal, (Note 2)
70 ±7.42 CW
±25 20MHz DFT-s-OFDM NR signal, (Note 2)
80 ±7.44 CW
±25 20MHz DFT-s-OFDM NR signal, (Note 2)
90 ±7.43 CW
±25 20MHz DFT-s-OFDM NR signal, (Note 2)
100 ±7.45 CW
±25 20MHz DFT-s-OFDM NR signal, (Note 2)
Note 1: For the 15-kHz subcarrier spacing, the RB number is 25. For the 30-kHz subcarrier spacing, the RB number is 10.
Note 2: For the 15-kHz subcarrier spacing, the RB number is 100. For the 30-kHz subcarrier spacing, the RB number is 50.
For the 60-kHz subcarrier spacing, the RB number is 24.
Offset
Edge Center
Wanted
Signal
Interference
Signal
(Modulated)
Interference
Signal
(CW)
Offse
t
Relationship between wanted and interference signals
40
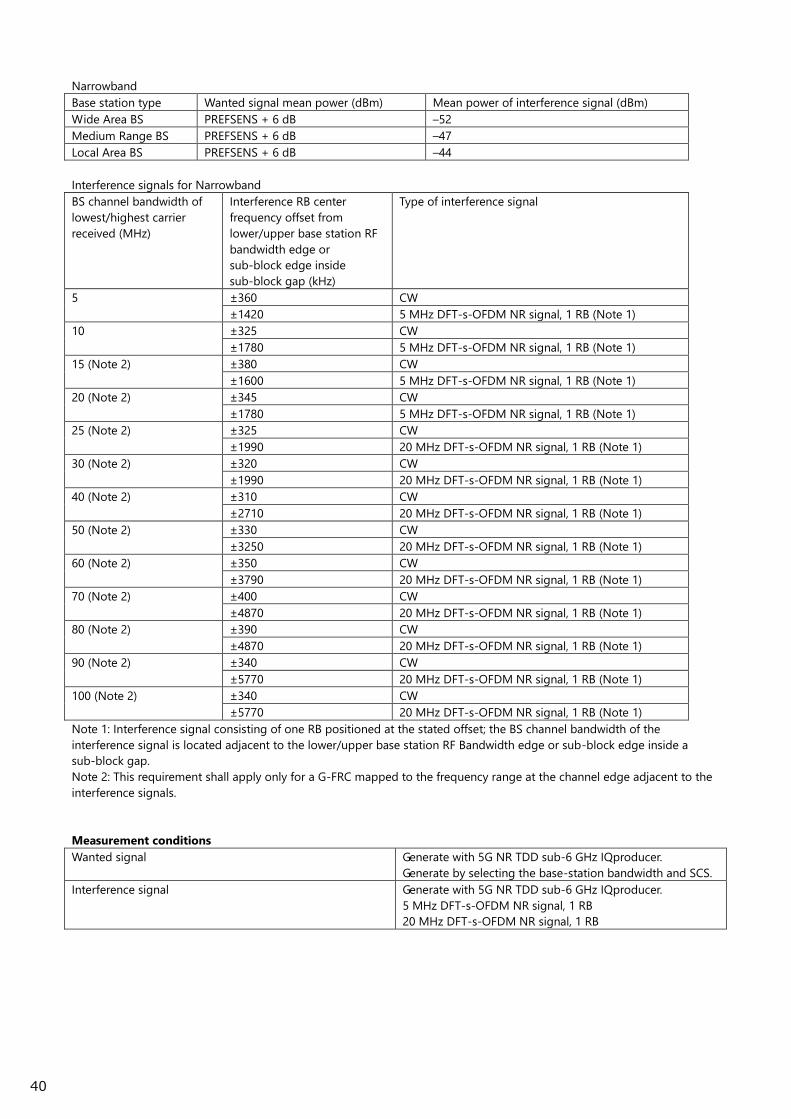
Narrowband
Base station type Wanted signal mean power (dBm) Mean power of interference signal (dBm)
Wide Area BS PREFSENS + 6 dB –52
Medium Range BS PREFSENS + 6 dB –47
Local Area BS PREFSENS + 6 dB –44
Interference signals for Narrowband
BS channel bandwidth of
lowest/highest carrier
received (MHz)
Interference RB center
frequency offset from
lower/upper base station RF
bandwidth edge or
sub-block edge inside
sub-block gap (kHz)
Type of interference signal
5 ±360 CW
±1420 5 MHz DFT-s-OFDM NR signal, 1 RB (Note 1)
10 ±325 CW
±1780 5 MHz DFT-s-OFDM NR signal, 1 RB (Note 1)
15 (Note 2) ±380 CW
±1600 5 MHz DFT-s-OFDM NR signal, 1 RB (Note 1)
20 (Note 2) ±345 CW
±1780 5 MHz DFT-s-OFDM NR signal, 1 RB (Note 1)
25 (Note 2) ±325 CW
±1990 20 MHz DFT-s-OFDM NR signal, 1 RB (Note 1)
30 (Note 2) ±320 CW
±1990 20 MHz DFT-s-OFDM NR signal, 1 RB (Note 1)
40 (Note 2) ±310 CW
±2710 20 MHz DFT-s-OFDM NR signal, 1 RB (Note 1)
50 (Note 2) ±330 CW
±3250 20 MHz DFT-s-OFDM NR signal, 1 RB (Note 1)
60 (Note 2) ±350 CW
±3790 20 MHz DFT-s-OFDM NR signal, 1 RB (Note 1)
70 (Note 2) ±400 CW
±4870 20 MHz DFT-s-OFDM NR signal, 1 RB (Note 1)
80 (Note 2) ±390 CW
±4870 20 MHz DFT-s-OFDM NR signal, 1 RB (Note 1)
90 (Note 2) ±340 CW
±5770 20 MHz DFT-s-OFDM NR signal, 1 RB (Note 1)
100 (Note 2) ±340 CW
±5770 20 MHz DFT-s-OFDM NR signal, 1 RB (Note 1)
Note 1: Interference signal consisting of one RB positioned at the stated offset; the BS channel bandwidth of the
interference signal is located adjacent to the lower/upper base station RF Bandwidth edge or sub-block edge inside a
sub-block gap.
Note 2: This requirement shall apply only for a G-FRC mapped to the frequency range at the channel edge adjacent to the
interference signals.
Measurement conditions
Wanted signal Generate with 5G NR TDD sub-6 GHz IQproducer.
Generate by selecting the base-station bandwidth and SCS.
Interference signal Generate with 5G NR TDD sub-6 GHz IQproducer.
5 MHz DFT-s-OFDM NR signal, 1 RB
20 MHz DFT-s-OFDM NR signal, 1 RB
41
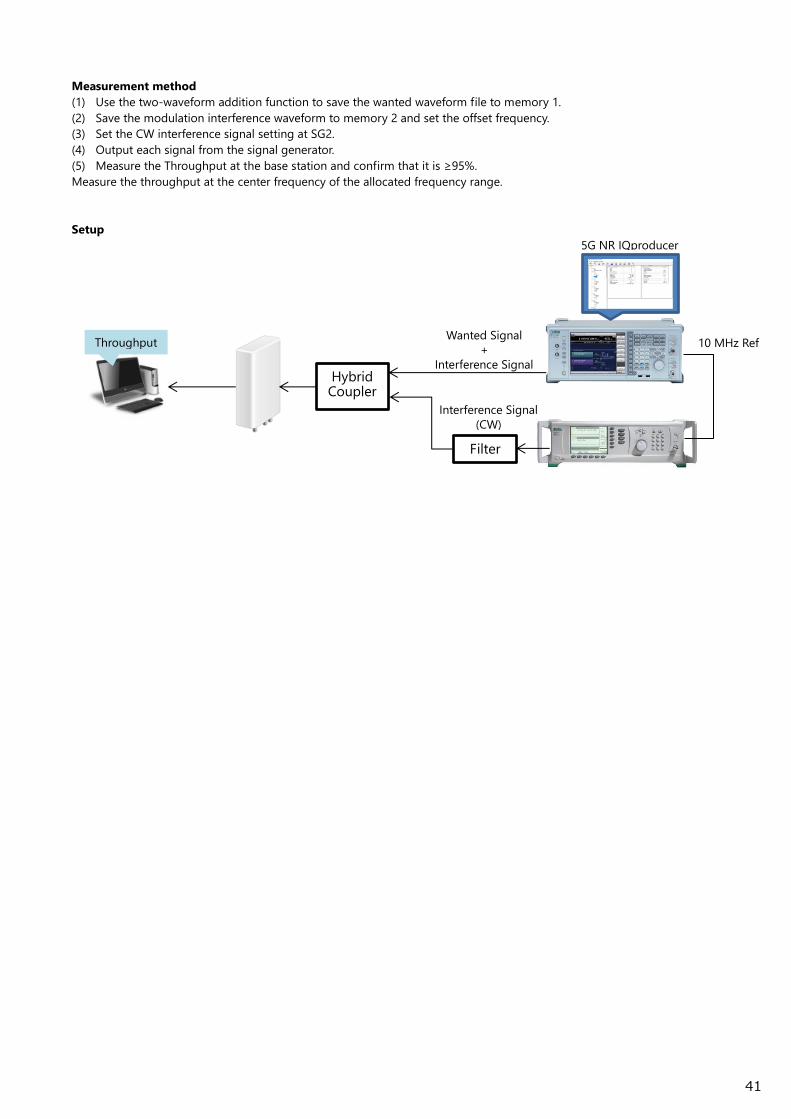
Measurement method
(1) Use the two-waveform addition function to save the wanted waveform file to memory 1.
(2) Save the modulation interference waveform to memory 2 and set the offset frequency.
(3) Set the CW interference signal setting at SG2.
(4) Output each signal from the signal generator.
(5) Measure the Throughput at the base station and confirm that it is ≥95%.
Measure the throughput at the center frequency of the allocated frequency range.
Setup
Wanted Signal
+
Interference Signal
Throughput
5G NR IQproducer
Filter
Hybrid Coupler
10 MHz Ref
Interference Signal
(CW)
42
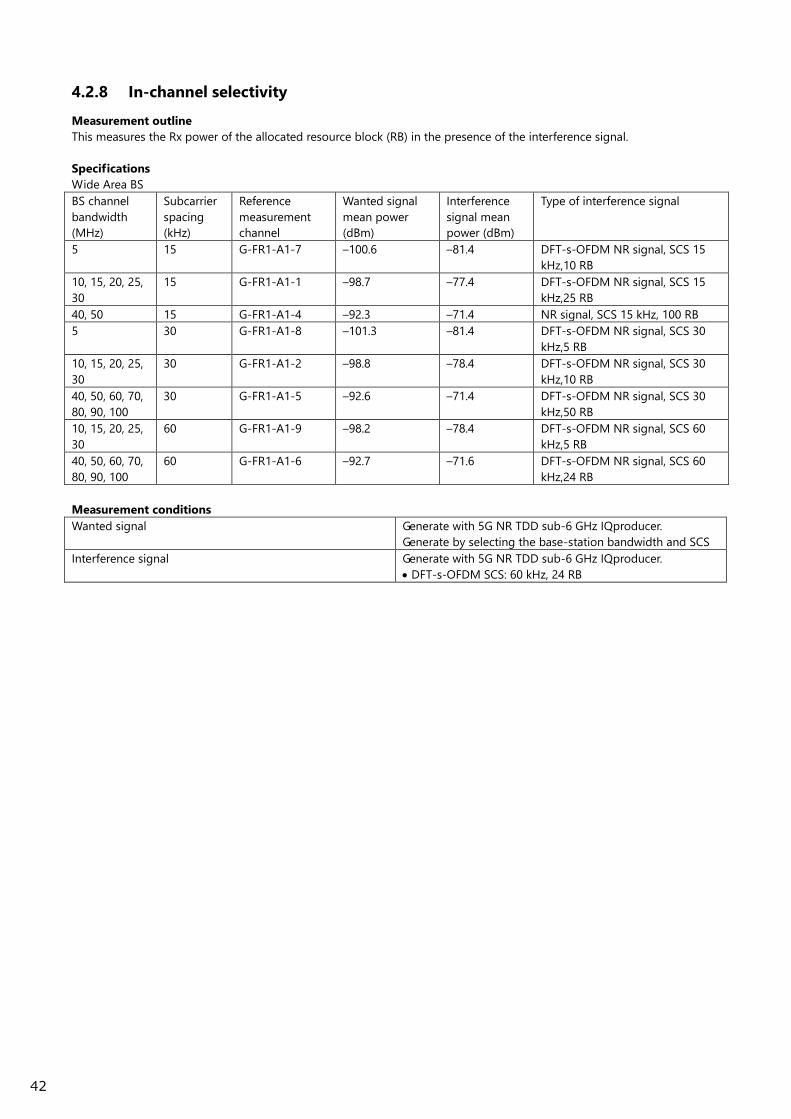
4.2.8 In-channel selectivity
Measurement outline
This measures the Rx power of the allocated resource block (RB) in the presence of the interference signal.
Specifications
Wide Area BS
BS channel
bandwidth
(MHz)
Subcarrier
spacing
(kHz)
Reference
measurement
channel
Wanted signal
mean power
(dBm)
Interference
signal mean
power (dBm)
Type of interference signal
5 15 G-FR1-A1-7 –100.6 –81.4 DFT-s-OFDM NR signal, SCS 15
kHz,10 RB
10, 15, 20, 25,
30
15 G-FR1-A1-1 –98.7 –77.4 DFT-s-OFDM NR signal, SCS 15
kHz,25 RB
40, 50 15 G-FR1-A1-4 –92.3 –71.4 NR signal, SCS 15 kHz, 100 RB
5 30 G-FR1-A1-8 –101.3 –81.4 DFT-s-OFDM NR signal, SCS 30
kHz,5 RB
10, 15, 20, 25,
30
30 G-FR1-A1-2 –98.8 –78.4 DFT-s-OFDM NR signal, SCS 30
kHz,10 RB
40, 50, 60, 70,
80, 90, 100
30 G-FR1-A1-5 –92.6 –71.4 DFT-s-OFDM NR signal, SCS 30
kHz,50 RB
10, 15, 20, 25,
30
60 G-FR1-A1-9 –98.2 –78.4 DFT-s-OFDM NR signal, SCS 60
kHz,5 RB
40, 50, 60, 70,
80, 90, 100
60 G-FR1-A1-6 –92.7 –71.6 DFT-s-OFDM NR signal, SCS 60
kHz,24 RB
Measurement conditions
Wanted signal Generate with 5G NR TDD sub-6 GHz IQproducer.
Generate by selecting the base-station bandwidth and SCS
Interference signal Generate with 5G NR TDD sub-6 GHz IQproducer.
DFT-s-OFDM SCS: 60 kHz, 24 RB
43
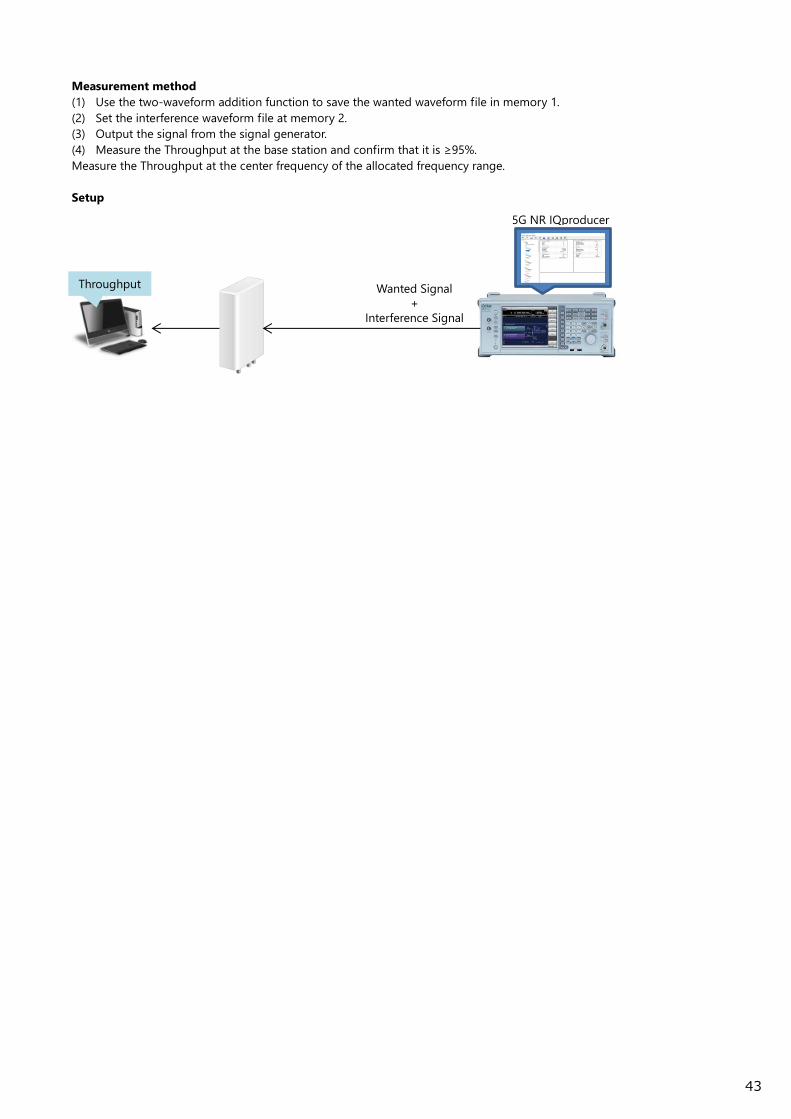
Measurement method
(1) Use the two-waveform addition function to save the wanted waveform file in memory 1.
(2) Set the interference waveform file at memory 2.
(3) Output the signal from the signal generator.
(4) Measure the Throughput at the base station and confirm that it is ≥95%.
Measure the Throughput at the center frequency of the allocated frequency range.
Setup
Wanted Signal
+
Interference Signal
Throughput
5G NR IQproducer
44
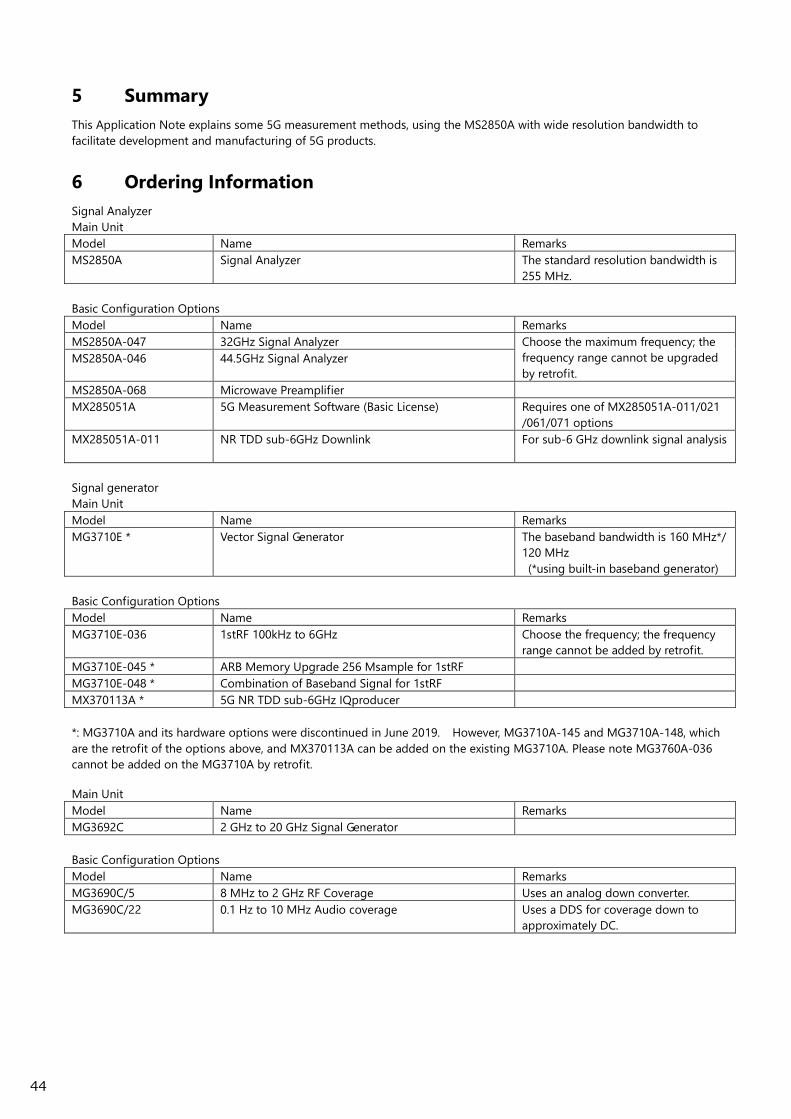
5 Summary
This Application Note explains some 5G measurement methods, using the MS2850A with wide resolution bandwidth to
facilitate development and manufacturing of 5G products.
6 Ordering Information
Signal Analyzer
Main Unit
Model Name Remarks
MS2850A Signal Analyzer The standard resolution bandwidth is
255 MHz.
Basic Configuration Options
Model Name Remarks
MS2850A-047 32GHz Signal Analyzer Choose the maximum frequency; the
frequency range cannot be upgraded
by retrofit.
MS2850A-046 44.5GHz Signal Analyzer
MS2850A-068 Microwave Preamplifier
MX285051A 5G Measurement Software (Basic License) Requires one of MX285051A-011/021
/061/071 options
MX285051A-011 NR TDD sub-6GHz Downlink For sub-6 GHz downlink signal analysis
Signal generator
Main Unit
Model Name Remarks
MG3710E * Vector Signal Generator The baseband bandwidth is 160 MHz*/
120 MHz
(*using built-in baseband generator)
Basic Configuration Options
Model Name Remarks
MG3710E-036 1stRF 100kHz to 6GHz Choose the frequency; the frequency
range cannot be added by retrofit.
MG3710E-045 * ARB Memory Upgrade 256 Msample for 1stRF
MG3710E-048 * Combination of Baseband Signal for 1stRF
MX370113A * 5G NR TDD sub-6GHz IQproducer
*: MG3710A and its hardware options were discontinued in June 2019. However, MG3710A-145 and MG3710A-148, which
are the retrofit of the options above, and MX370113A can be added on the existing MG3710A. Please note MG3760A-036
cannot be added on the MG3710A by retrofit.
Main Unit
Model Name Remarks
MG3692C 2 GHz to 20 GHz Signal Generator
Basic Configuration Options
Model Name Remarks
MG3690C/5 8 MHz to 2 GHz RF Coverage Uses an analog down converter.
MG3690C/22 0.1 Hz to 10 MHz Audio coverage Uses a DDS for coverage down to
approximately DC.

Anritsu Americas Sales Company450 Century Parkway, Suite 190, Allen,TX 75013 U.S.A.Phone: +1-800-Anritsu (1-800-267-4878)
• CanadaAnritsu Electronics Ltd.700 Silver Seven Road, Suite 120, Kanata, Ontario K2V 1C3, CanadaPhone: +1-613-591-2003 Fax: +1-613-591-1006
• BrazilAnritsu Eletronica Ltda.
Phone: +55-11-3283-2511Fax: +55-11-3288-6940
• MexicoAnritsu Company, S.A. de C.V.Blvd Miguel de Cervantes Saavedra #169 Piso 1, Col. GranadaMexico, Ciudad de Mexico, 11520, MEXICOPhone: +52-55-4169-7104
• United KingdomAnritsu EMEA Ltd. 200 Capability Green, Luton, Bedfordshire, LU1 3LU, U.K.Phone: +44-1582-433200 Fax: +44-1582-731303
• FranceAnritsu S.A.12 avenue du Québec, Bâtiment Iris 1- Silic 612,91140 VILLEBON SUR YVETTE, FrancePhone: +33-1-60-92-15-50Fax: +33-1-64-46-10-65
• GermanyAnritsu GmbHNemetschek Haus, Konrad-Zuse-Platz 1 81829 München, Germany Phone: +49-89-442308-0Fax: +49-89-442308-55
• ItalyAnritsu S.r.l.Via Elio Vittorini 129, 00144 Roma, ItalyPhone: +39-6-509-9711 Fax: +39-6-502-2425
• SwedenAnritsu ABIsafjordsgatan 32C, 164 40 KISTA, SwedenPhone: +46-8-534-707-00
• FinlandAnritsu ABTeknobulevardi 3-5, FI-01530 VANTAA, FinlandPhone: +358-20-741-8100Fax: +358-20-741-8111
• DenmarkAnritsu A/STorveporten 2, 2500 Valby, DenmarkPhone: +45-7211-2200Fax: +45-7211-2210
• RussiaAnritsu EMEA Ltd.Representation Office in RussiaTverskaya str. 16/2, bld. 1, 7th floor.Moscow, 125009, RussiaPhone: +7-495-363-1694Fax: +7-495-935-8962
• SpainAnritsu EMEA Ltd.Representation Office in SpainEdificio Cuzco IV, Po. de la Castellana, 141, Pta. 528046, Madrid, SpainPhone: +34-915-726-761Fax: +34-915-726-621
• United Arab EmiratesAnritsu EMEA Ltd.Dubai Liaison Office
• P.R. China (Shanghai)Anritsu (China) Co., Ltd.Room 2701-2705, Tower A, New Caohejing International Business CenterNo. 391 Gui Ping Road Shanghai, 200233, P.R. ChinaPhone: +86-21-6237-0898Fax: +86-21-6237-0899
• P.R. China (Hong Kong)Anritsu Company Ltd.Unit 1006-7, 10/F., Greenfield Tower, Concordia Plaza,No. 1 Science Museum Road, Tsim Sha Tsui East, Kowloon, Hong Kong, P.R. ChinaPhone: +852-2301-4980Fax: +852-2301-3545
• JapanAnritsu Corporation
Phone: +81-46-296-6509Fax: +81-46-225-8352
8-5, Tamura-cho, Atsugi-shi, Kanagawa, 243-0016 Japan
• KoreaAnritsu Corporation, Ltd.5FL, 235 Pangyoyeok-ro, Bundang-gu, Seongnam-si, Gyeonggi-do, 13494 KoreaPhone: +82-31-696-7750Fax: +82-31-696-7751
• AustraliaAnritsu Pty. Ltd.
Phone: +61-3-9558-8177Fax: +61-3-9558-8255
• TaiwanAnritsu Company Inc.7F, No. 316, Sec. 1, NeiHu Rd., Taipei 114, TaiwanPhone: +886-2-8751-1816Fax: +886-2-8751-1817
1811
Printed on Recycled Paper
• SingaporeAnritsu Pte. Ltd.11 Chang Charn Road, #04-01, Shriro HouseSingapore 159640Phone: +65-6282-2400Fax: +65-6282-2533
• IndiaAnritsu India Private Limited6th Floor, Indiqube ETA, No.38/4, Adjacent to EMC2,Doddanekundi, Outer Ring Road, Bengaluru – 560048, IndiaPhone: +91-80-6728-1300Fax: +91-80-6728-1301
Specifications are subject to change without notice.
• United States
Unit 20, 21-35 Ricketts Road, Mount Waverley, Victoria 3149, Australia
902, Aurora Tower,P O Box: 500311- Dubai Internet CityDubai, United Arab EmiratesPhone: +971-4-3758479Fax: +971-4-4249036
Praça Amadeu Amaral, 27 - 1 Andar01327-010 - Bela Vista - Sao Paulo - SPBrazil
Printed in Japan 2019-8 MJM No. MS2850A_5GNR-E-F-1-(2.00)