
OWP112010 WCDMA Radio Network Coverage Dimensioning ISSUE1.21

H2020-ICT-2016-2
5G-MoNArch
Project No. 761445
5G Mobile Network Architecture for diverse services, use cases, and applications in 5G and beyond
Deliverable D6.3
Final report on architectural verification and validation
Contractual Date of Delivery 2019-06-30
Actual Date of Delivery 2019-07-15
Work Package WP6 – Verification and Validation
Editor(s) Julie BRADFORD (Real Wireless)
Reviewers Mark KEENAN (Real Wireless), David GUTIERREZ ESTEVEZ
(Samsung UK)
Dissemination Level Public
Type Report
Version 1.0
Total number of pages 193
Abstract: This report forms the final deliverable of Work Package (WP) 6 of 5G-MoNArch, focusing
on the verification and validation of the technical and economic benefits claimed by the 5G-MoNArch
architecture and its supporting functional innovations of a) security and resilience and b) resource
elasticity. Technical verification results are presented based on (i) enabler specific simulation results
provided by the technical WPs, (ii) measurements from the two testbed platforms and (iii) a system
simulation of the Hamburg study area providing the technical key performance indicators (KPIs)
achieved across a series of evaluation cases. It is worth highlighting that the latter corresponds to a
system simulator that integrates a selection of 5G-MoNArch enablers and thus allows joint evaluation
of these key enablers, their interaction and performance. The techno-economic verification is based
on the Hamburg study area and evaluation case set. This analysis focuses on (i) network costs, which
involves understanding the impact of 5G-MoNArch innovations on network dimensioning, and (ii)
opportunities for new revenue streams. Wider socio-economic benefits are also analysed and
presented.
Keywords: 5G Network Architecture, verification, validation, KPIs, techno-economic, socio-
economic.

5G-MoNArch (761445) D6.3 Final report on architectural verification
Version 1.0 Page 2 of 193
Executive Summary
This report is the final deliverable of the verification and validation work performed under the European
Horizon 2020 framework programme research project 5G-MoNArch. It aims to quantify the technical
and economic benefits envisaged by the 5G-MoNArch architecture and its supporting functional
innovations of (i) secure and resilient network functions, and (ii) resource elastic network functions. We
present results from the two main threads of verification work:
• Improvements to technical Key Performance Indicators (KPIs)
• Improvements to commercial and economic KPIs
These KPI improvements are then compared against the objectives set for the project’s target KPIs of
area traffic capacity, cost efficiency, E2E latency, E2E reliability, (virtual network function) relocation
delay, service creation time and slice isolation. In assessing KPI improvements, three evaluation cases,
all set in Hamburg city centre and port area, have been defined and analysed:
• Evaluation case 1 (EC1) – considering the extension of an existing wide area enhanced Mobile
Broadband (eMBB) network to deliver industrial services, requiring high reliability, in the
Hamburg port area.
• Evaluation case 2 (EC2) – considering the temporary demand hotspots created by large cruise
ships arriving in Hamburg port and how these can be served more cost efficiently with resource
elasticity.
• Evaluation case 3 (EC3) –considering the extension of the eMBB network of EC1 not only to
accommodate industrial port services but also to deliver smart city and vehicular services to the
wider city area.
Conclusions on KPI improvements targeted by 5G-MoNArch
Verification results have been gathered from across (i) enabler specific simulation results provided by
the technical WPs, (ii) measurements from the two testbed platforms and (iii) system simulations of the
Hamburg study area. These demonstrate that all KPI targets set for the project can be met with the 5G-
MoNArch approach. However, we note that not all KPI targets can be met simultaneously for all services
and at every location in the coverage area of a wide area radio network. For example, improvements in
area traffic capacity to serve eMBB demand hotspots will not be required or practical in all locations in
the network. Additionally, the provision of highly reliable services in areas overlapping with demand
hotspots will reduce the availability of network resources and hence impact area traffic capacity.
Therefore, fulfilment of these KPIs depends on the underlying services targeted, network deployment
and usage scenario. There is also very often a trade-off between the infrastructure investment required
and achievable KPI levels (as investigated in our techno-economic evaluations). With this in mind, we
present findings from each of the three evaluation cases set in the Hamburg study area to understand
fulfilment of KPIs in realistic example use cases.
Findings on the delivery of industrial port services via 5G-MoNArch
Within EC1 we have considered the requirements in the Hamburg study area for wireless services to
both the port authority and other industrial users of the port area. Services considered include intelligent
transport systems (ITS), automation of port machinery, environmental monitoring and augmented reality
(AR) to support maintenance and construction. We have found that the 5G-MoNArch enablers can meet
the requirements of the most challenging of these industrial services with focus for EC1 on:
• E2E latency – This is impacted by the location of application specific virtual network functions
(VNFs). Under a 5G-MoNArch network, orchestration of such functions near the radio
processing in an edge cloud site (together with a CN User Plane Function (UPF) for local
breakout) can meet the latency requirements of the most demanding EC1 port services. In the
case of the Hamburg study area, if existing fixed telecoms exchanges in the area are used for
edge cloud sites this would meet the required latency requirements of the EC1 services. E2E
latency has also been measured on the two testbeds, showing levels of under 5 msec in the case
of the Turin testbed applying elastic VNF orchestration.

5G-MoNArch (761445) D6.3 Final report on architectural verification
Version 1.0 Page 3 of 193
• E2E reliability – E2E reliability is impacted by the reliability of the chain of components across
the network. Starting with RAN reliability, data duplication in combination with multi-
connectivity has been shown to increase RAN reliability to 99.999%. The improvement
achieved depends on the overlap between cells and as such depends on the network deployment
and in turn cost limitations. We note a potential impact on other slices not applying these
enablers as the required overlap between cells may create increased interference zones for these.
Next the dimensioning of edge cloud processing power must factor in appropriate levels of
redundancy, based on the telco-cloud resilience schemes incorporated under 5G-MoNArch, to
achieve the target 99.999% reliability. Regarding connectivity between sites, the central cloud
and Wide Area Network (WAN) connections of a typical MNO network already offer reliability
in line with the targeted levels. The xhaul connection between antenna sites and edge cloud
sites therefore becomes the driver for inter site connectivity reliability. Here appropriate rules
need to be applied by the MNO during network planning to ensure xhaul reliability requirements
are met.
• Security – 5G-MoNArch supports security trust zones (STZs) and other techniques for threat
detection, prevention and reaction within its Management and Orchestration (M&O) layer.
These have been shown to deliver the target security level of being comparable to proprietary
solutions. Via simulation of the sea port testbed threat environment, STZs have been shown to
efficiently isolate and handle various types of threats with an average response time of 280
milliseconds achieved against batches of threats occurring at different paces.
• Slice isolation – A key feature of 5G-MoNArch is support for network slicing and the ability to
ensure that activity on one slice does not impact the ability of other slices to maintain their target
KPIs and service level. This is called slice isolation and is particularly important when
delivering ultra-reliable services from the same network and infrastructure set as less stringent
eMBB services. This has been demonstrated on both testbeds with the high-performance slices
of virtual reality (in the case of the Turin testbed) and connected traffic lights (in the case of
Hamburg) not being impacted when high levels of eMBB traffic were added to the network.
• Service creation time – To understand how dynamically slices and new services for different
end users might be added and removed from a 5G-MoNArch network, measurements on the
time to set up and deploy new slices (so called service creation time) were taken on the two
testbeds. These showed a fully functional service being available on the live Hamburg testbed
within 6 minutes of the initial request to generate the new service.
Alongside the technical performance assessment just summarised, a commercial and economic
assessment of each evaluation case was also performed. This analysis focused on quantifying the (i)
benefits of the services considered and hence opportunities for new revenue streams or wider socio-
economic benefits and (ii) implications for network costs, which involved modelling the existing
network in the Hamburg study area and dimensioning of this to allow for new services using the 5G-
MoNArch innovations. For EC1 we found the following against the assessed commercial and economic
KPIs:
• Incremental revenue - From our revenue assessment we anticipate that a combination of all port
services could add up to 54% to existing eMBB revenues (for an MNO with 33% eMBB market
share) in the example Hamburg study area by 2030. Of the three services analysed, port
automation with high and tangible operational benefits was the biggest contributor to this. Other
services like port ITS had significant but less tangible socio-economic benefits (such as the
value of drivers’ time lost in congestion, reductions in CO2 emissions and reduced freight times
and stock levels). This limited the revenue potential from these services compared with those
with a more direct operational benefit.
• Incremental costs – The cost of adding each of the EC1 services to an existing eMBB network
ranged from an extra 2.7% to 10%. This is assessed over a 2020-2030 time period to include
both capital and operational expenditure. Port automation with its service area limited to the
container terminals had the lowest incremental cost compared with port ITS and AR for
construction and maintenance which would be required to be more widespread across the port.
Applying multi-connectivity gave cost improvements by a factor of up to 2.7 but this is highly

5G-MoNArch (761445) D6.3 Final report on architectural verification
Version 1.0 Page 4 of 193
dependent on the location of existing macro cells and the overlap of coverage areas in the
locations of the target services. Further multi-service cost efficiencies of 44% were observed
from offering combinations of EC1 services from the same infrastructure set. This shows an
economy of scope effect, whereby once a network is repurposed for higher reliability, this can
be reused for other services and end users with overlapping requirements.
• Business case – Combining revenues with costs gives a positive business case for all EC1
services if multi-connectivity is applied. Our results show significant Return on Investment
(ROI) gains from industrial services, with our case study of providing port automation services
to container terminal operators showing an ROI improvement of up to 16%. This is an
improvement that continues to grow the more services that are added. This is demonstrated by
this ROI gain increasing to 20% when combinations of industrial services are offered.
Findings on the benefits of resource elasticity in 5G-MoNArch in serving demand hotspots
EC2 aims to quantify the benefits of flexible resource allocation using elasticity techniques in virtualised
5G networks like 5G-MoNArch. Elasticity aims to make more efficient use of network resources amid
changing network demand conditions. With this in mind, EC2 has focused on using elasticity to reduce
network over dimensioning and deliver cost efficiencies when serving the temporary demand hotspot of
a large cruise ship arriving at one of the terminal buildings in Hamburg. Our findings against the target
KPIs for this scenario are as follows:
• Area traffic capacity – Our assessment of slice-aware elasticity has shown that, in some
scenarios, the number of physical resource blocks required across slices can be reduced by a
factor of 18.75 using this technique. A similar result from the work package focusing on
elasticity (WP4) also showed capacity gains by dynamic reallocation of network resources
across slices of a factor of 10 for the RAN and of factor of 2 for the CN.
• Cost efficiency – Elasticity has been shown to give cost savings of between 38% and 68% for
the EC2 case study of providing a dedicated small cell network at one of Hamburg’s cruise ship
terminals. The achieved cost saving depended on the demand scenario and antenna site
ownership (and related cost sharing) in the hotspot location. The benefits analysis for EC2
showed limited potential for incremental revenues and an overall negative business case. This
further emphasises the importance of cost efficiencies in these hotspot deployments which may
be essential to maintain market position. We note that for macrocell dominated networks with
high site acquisition and rental costs, the antenna site costs will dominate the total cost of
ownership (TCO) more than in these small cell deployments. As shown in [5GM-D42], in these
cases we expect the cost saving of elasticity to be limited to under 15%.
• Relocation delay – Elasticity relies on the ability to flexibly relocate VNFs depending on where
and when resources are available in the network. However, relocating VNFs may impact quality
of service and hence the delay in relocating VNFs and whether this interrupted service delivery
was measured on the Turin testbed. Experiments showed that there was no service interruption
with only a few milliseconds required for VNF relocation under 5G-MoNArch compared with
over 70 minutes for legacy solutions.
Although for this example we selected a temporary demand hotspot in the form of a cruise ship terminal
near a port city, the principals of elasticity investigated here are equally applicable to other demand
hotspot cases where large but temporary uplifts in localised traffic are experienced such as sports
stadiums and other similar locations.
Findings on the delivery of smart city services and wider socio-economic benefits of 5G-
MoNArch
EC3 examines extending the network, already developed for the port area in EC1, into the wider city of
Hamburg. We examine how benefits, costs and revenues are impacted as smart city and vehicular
services are added to the network with findings as follows:
• Benefits and revenues – Our EC3 revenue forecast for smart city services shows an increase of
nearly 9% over existing eMBB revenues (for an MNO with a 33% eMBB market share) by
2030. This is much lower than for the EC1 industrial services. However, the socio-economic
5G-MoNArch (761445) D6.3 Final report on architectural verification
Version 1.0 Page 5 of 193
benefits of the smart city services are approximately 4 times higher than revenues with
significant benefits such as improvements in public health via environmental monitoring and
reductions in congestion and greenhouse gas emissions via intelligent traffic control. For
vehicular services in the city the opposite trend is true with the incremental revenue potential
being much higher than the socio-economic value.
• Incremental costs – Our cost analysis shows an economy of scale effect when extending the
existing port ITS network from EC1 to also provide city ITS. Adding support either for a port
ITS or city ITS individually to an existing eMBB network has an incremental cost of 5% and
5.6% respectively. However, adding support for both ITSs simultaneously to the same network
has a cost increment of 7.8%. Vehicular services can be extremely demanding on the existing
eMBB network with an incremental cost of 46% found for supporting high capacity
infotainment services. High reliability but lower demand vehicular services like semi-
automated driving support were in a similar order to the ITS services with a cost increment of
4.4%. An economy of scope effect was also seen when combining port ITS and semi-automated
driving on the same eMBB network with an incremental cost of 7.4% as opposed to 5% and
4.4% when added individually.
• Business case – Our analysis of smart city services has shown that the business case for such
services is challenging. For example, the business case analysis in EC3 for adding support for
a city ITS to an existing eMBB network shows a negative impact on both ROI and discounted
cashflow (DCF). Given the high socio-economic value of such services, this implies that public
private partnerships and/or new deployment models may be needed to ensure that the wider
value of these services is not lost due to commercial pressures. Under vehicular services,
infotainment was found to worsen the business case compared with returns from existing eMBB
services. Semi-automated driving improved the existing business case to a limited extent, but
we note such services require short term investment in repurposing the network which takes
time to be repaid as uptake of the new service grows over time.
Conclusions from stakeholder validation
In addition to the verification work, feedback from stakeholders has been obtained during the project to
validate the verification results. Stakeholder feedback has been obtained from the project testbeds,
which involved real verticals and real end-users, as well as from our discussions with user groups. The
feedback received, both from the sea port and tourism sectors, has confirmed that the services and
applications proposed under 5G-MoNArch’s testbeds and verified in the evaluation cases in this report
are use cases that are of interest to them. Furthermore, these use cases have potential to generate both
operational and wider socio-economic benefits. However, there is clearly some way to go to convince
stakeholders that 5G is the right solution to deliver these applications with the technology still seen as
relatively immature and the business cases yet to be clearly articulated. From this perspective the
verification activities undertaken in 5G-MoNArch have been welcomed to help demonstrate the
technical ability of 5G and capture benefits against the levels of investment required.
It was also highlighted that consideration of the benefits of 5G needs to extend beyond the narrow
commercial objectives of businesses to target wider societal benefits. This means that stakeholders
(ranging from existing MNOs to industrial users, city councils, government bodies and regulators) can
no longer afford to think and act unilaterally. Instead the formation of partnerships amongst these
stakeholders seems essential to unlocking the full value, in both a commercial and socio-economic sense,
from 5G.

5G-MoNArch (761445) D6.3 Final report on architectural verification
Version 1.0 Page 6 of 193
List of Authors
Partner Name E-mail
NOK-DE Diomidis Michalopoulos [email protected]
DT Juan Rendon Schneir
Gerd Zimmermann
TIM Sergio Barberis
Giorgio Calochira
HPA Hendrik Roreger
Torsten Hinz
CERTH Anastasis Drosou
Athanasios Tsakiris
Asterios Mpatziakas
Eleni Ketzaki
RW Ade Ajibulu
Julie Bradford
Caroline Gabriel
Kostas Konstantinou
Stuart Mitchell
Hassan Osman
Ken Pearson
Abhaya Sumanasena
NOMOR Kunjan Shah
Sina Khatibi
Fernando Ruiz Vera
Alba Jano
UNIKL Marcos Rates Crippa
Anjie Qiu
Acknowledgements
We would like to acknowledge and thank the contribution made to this work by Heinz Droste. On behalf
of Deutsche Telekom, Heinz led the 5G-MoNArch verification and validation activities until his
retirement from the company in December 2018.

5G-MoNArch (761445) D6.3 Final report on architectural verification
Version 1.0 Page 7 of 193
List of Acronyms and Abbreviations
2D Two Dimensional
2G 2nd Generation mobile wireless communication system (GSM, GPRS, EDGE)
3D Three Dimensional
3G 3rd Generation mobile wireless communication system (UMTS, HSPA)
4G 4th Generation mobile wireless communication system (LTE, LTE-A)
5G 5th Generation mobile wireless communication system
3GPP 3rd Generation Partnership Project
5G-PPP 5G Public Private Partnership
5GS 5G system
5QI 5G QoS Identifier
AGV Automated Guided Vehicles
AI Artificial Intelligence
AR Augmented Reality
ARPU Average Revenue per User
ARQ Automatic Repeat Request
B2B Business to Business
BER Bit Error Rate
BIM Building Information Modelling
BS Base Station
BSS Business Support Systems
CAPEX CAPital EXpenditure
CBR Constant Bit Rate
CCTV Closed Circuit TeleVision
CDF Cumulative Distribution Function
CN Core Network
CoMP Coordinated Multipoint Transmission
CO2 Carbon dioxide
COTS Commercial Off The Shelf
CP Control Plane
CPU Central Processing Unit
CPM Cost per thousand impressions
CPRI Common Public Radio Interface
CU Central Unit
DC Dual Connectivity
DCF Discounted Cash Flow
DSC Dynamic Small Cells
D-TDD Dynamic Time Division Duplex
DU Distribution Unit
DL DownLink
E2E End to End
eCPRI Evolved Common Public Radio Interface
EEA European Economic Area
EIRP Equivalent Isotropically Radiated Power
ETSI European Telecommunications Standards Institute
eMBB Enhanced Mobile Broadband
EU ETS EU Emissions Trade System
FDD Frequency Division Duplex
FTP File Transport Protocol
GSMA GSM (Groupe Spéciale Mobile) Association

5G-MoNArch (761445) D6.3 Final report on architectural verification
Version 1.0 Page 8 of 193
GUI Graphical User Interface
GVA Gross Added Value
GW GateWay
HARQ Hybrid Automatic Repeat ReQuest
HHLA Hamburger Hafen und Logistik AG
HLS Higher Layer Split
HPA Hamburg Port Authority
HW HardWare
IEEE Institute of Electrical and Electronics Engineers
IETF Internet Engineering Task Force
IMT International Mobile Telecommunications
INF Intra slice Network Function
IoT Internet of Things
IP Internet Protocol
ISC Inter Slice Controller
ISD Inter Site Distance
ISM Industrial Scientific and Medical
ITS Intelligent Transport Systems
KPI Key Performance Indicator
LLS Lower Layer Split
LOS Line of Sight
LTE Long Term Evolution
M2M Machine to Machine
MAC Media Access Control
MBB Mobile Broadband
MC Multi Connectivity
MCS Modulation Coding Scheme
MIMO Multiple Input Multiple Output
ML Machine Learning
mMTC Massive Machine Type Communication
MNO Mobile Network Operator
M&O Management and Orchestration
MSP Mobile Service Provider
MTBF Mean Time Between Failure
MTTR Mean Time To Repair
NAS Network Access Server
NC Network Coding
NE Network Element
NF Network Function
NFV Network Function Virtualisation
NGMN Next Generation Mobile Networks
NLOS Non-Line of Sight
NOx Oxides of Nitrogen
NPV Net Present Value
NR New Radio
NSI Network Slice Instance
NSSI Network Slice Subnet Instance
NWDAF Network Data Analytics Function
OAI Open Air Interface
OECD Organisation for Economic Cooperation and Development
OFDM Orthogonal Frequency Division Multiplexing

5G-MoNArch (761445) D6.3 Final report on architectural verification
Version 1.0 Page 9 of 193
OPEX OPerational EXpenditure
PDCP Packet Data Convergence Protocol
PDR Packet Drop Rate
PER Packet Error Rate
PHY Physical Layer
PLTE Private LTE
PM Particulate Matter
PNF Physical Network Function
PoC Proof of Concept
PRB Physical Resource Block
QCI QoS Class Indicator
QoE Quality of Experience
QoS Quality of Service
RACH Random Access Channel
RAM Random Access Memory
RAN Radio Access Network
RAT Radio Access Technology
RF Radio Frequency
RLC Radio Link Control
ROI Return on Investment
RRC Radio Resource Control
RRH Remote Radio Head
RRM Radio Resource Management
RSRP Reference Signal Received Power
Rx Receive
SBA Service Based Architecture
SC Small Cell
SDN Software Defined Networking
SDO Standards Developing Organisations
SDR Software Defined Radio
SINR Signal to Interference plus Noise Ratio
SISO Single Input Single Output
SLA Service Level Agreement
SoBI Southbound interface
SOx Oxides of Sulphur
srsLTE Software Radio Systems LTE
SSP Smart Sea Port
STZ Security Trust Zone
SVOD Streaming Video-On-Demand
SW SoftWare
TC Touristic City
TCO Total Cost of Ownership
TDD Time Division Duplex
TEU Twenty-foot Equivalent Units
TN Transport Network
TTI Transmission Time Interval
TOS Terminal Operating System
UE User Equipment
UL UpLink
ULCV Ultra Large Container Vessels
UMTS Universal Mobile Telecommunications System

5G-MoNArch (761445) D6.3 Final report on architectural verification
Version 1.0 Page 10 of 193
UP User Plane
UPF User Plane Function
UR Ultra-Reliable
URLLC Ultra-Reliable Low Latency Communication
UT User Terminal
V2I Vehicle to Infrastructure
V2X Vehicle to everything
VNF Virtual Network Function
VoIP Voice over Internet Protocol
VR Virtual Reality
vMAC Virtualised Media Access Control
vPHY Virtualised Physical Layer
vRAN Virtualised Radio Access Network
vRLC Virtualised Radio Link Control
Wi-Fi Wireless-Fidelity
WP Work Package
WAN Wide Area Network
XNF Cross slice Network Function
XSC Cross Slice Controller

5G-MoNArch (761445) D6.3 Final report on architectural verification
Version 1.0 Page 11 of 193
Table of Contents
1 Introduction ................................................................................................ 19
1.1 Scope of this document ............................................................................................. 19 1.2 5G-MoNArch motivation – pressure in mobile industry and the promise of 5G ... 20 1.3 Technical and commercial benefits of 5G-MoNArch to be verified and validated 21 1.4 Structure of this document ....................................................................................... 22
2 Target KPIs and our verification approach ............................................ 23
2.1 Target KPIs ............................................................................................................... 23 2.2 Verification and validation methodology ................................................................. 25
2.2.1 Verification methodology .............................................................................................. 25 2.2.2 Verification tools ........................................................................................................... 26
2.2.2.1 Network level simulator used for technical KPIs – Mx-ART ................................. 26 2.2.2.2 Business case analysis toolset for techno-economic KPIs .................................... 27
2.2.3 Validation methodology ................................................................................................ 28 2.3 5G-MoNArch architecture reference model ............................................................ 29 2.4 Verification scenario and assumed infrastructure – Hamburg city & port area ... 31 2.5 Evaluation cases and their implementation in the network .................................... 33
2.5.1 Evaluation cases considered .......................................................................................... 33 2.5.2 Services and slices required per evaluation case ........................................................... 35 2.5.3 Assumptions in mapping slices to infrastructure ........................................................... 36
2.5.3.1 Slice templates for considered services ................................................................. 36 2.5.3.2 Functional setups and topological view for the considered services .................... 36
3 Evaluation case 1: Resilient network slices for industrial applications 38
3.1 Objectives of EC1 and stakeholders targeted .......................................................... 38
3.2 Technical performance verification ......................................................................... 38 3.2.1 E2E reliability ................................................................................................................ 39
3.2.1.1 Improved RAN reliability via MC and data duplication ....................................... 39 3.2.1.2 Telco-cloud reliability via network fault management .......................................... 43 3.2.1.3 Conclusions on E2E reliability .............................................................................. 46
3.2.2 E2E latency .................................................................................................................... 48 3.2.3 Security .......................................................................................................................... 50 3.2.4 Comparison of WP3 verification results with WP6 wider area simulation results ....... 51
3.2.4.1 Comparison against WP3 conclusions for RAN reliability ................................... 51 3.2.4.2 Comparison against WP3 conclusions for telco cloud reliability ......................... 52
3.3 Commercial verification ........................................................................................... 53 3.3.1 Services targeted in EC1 and their anticipated demand ................................................ 53
3.3.1.1 Baseline demand assumed for consumer-focused MBB services .......................... 53 3.3.1.2 Industrial sea port services considered and their demand profiles ....................... 54
3.3.2 Revenues assessment ..................................................................................................... 55 3.3.2.1 Baseline eMBB network revenues ......................................................................... 55 3.3.2.2 Port services - economic and operational benefits ............................................... 55 3.3.2.3 Port services - MSP revenues ................................................................................ 60
3.3.3 Cost assessment ............................................................................................................. 61 3.3.3.1 Approach ............................................................................................................... 61 3.3.3.2 Cost of automating the container terminals .......................................................... 63 3.3.3.3 Cost of providing port ITS ..................................................................................... 64 3.3.3.4 Cost of providing port AR ...................................................................................... 65 3.3.3.5 Summary of cost results ......................................................................................... 65
3.3.4 Business case impact ..................................................................................................... 66 3.3.5 Commercial verification sensitivity analysis ................................................................. 68
3.3.5.1 Sensitivity of findings to existing MBB network specification and evolution ........ 68

5G-MoNArch (761445) D6.3 Final report on architectural verification
Version 1.0 Page 12 of 193
3.3.5.2 Sensitivity of findings to combinations of services ................................................ 69
4 Evaluation case 2: Elastic network slices enabling local peak
performance ....................................................................................................... 71
4.1 Objectives of EC2 and stakeholders targeted .......................................................... 71 4.2 Technical performance verification ......................................................................... 72
4.2.1 Computational elasticity ................................................................................................ 73 4.2.2 Orchestration driven elasticity ....................................................................................... 74 4.2.3 Slice-aware elasticity ..................................................................................................... 76 4.2.4 Comparison of WP4 verification results against WP6 wider area results ..................... 77
4.2.4.1 Computational elasticity ........................................................................................ 77 4.2.4.2 Orchestration driven elasticity .............................................................................. 78 4.2.4.3 Slice aware elasticity ............................................................................................. 78
4.3 Commercial verification ........................................................................................... 79 4.3.1 Services targeted in EC2 and their anticipated demand ................................................ 80 4.3.2 Revenues assessment ..................................................................................................... 81
4.3.2.1 Premium eMBB hotspot service ............................................................................ 82 4.3.2.2 AR tourism app ...................................................................................................... 82
4.3.3 Cost assessment ............................................................................................................. 84 4.3.4 Business case impact ..................................................................................................... 87 4.3.5 Sensitivity analysis ........................................................................................................ 87
4.3.5.1 Sensitivity to demand scenario .............................................................................. 88 4.3.5.2 Sensitivity to hotspot deployment model ................................................................ 89
5 Evaluation case 3: Economies of scale and scope in wider smart city
environments ...................................................................................................... 92
5.1 Objectives of EC3 ...................................................................................................... 92 5.2 Services targeted in EC3 and their anticipated demand ......................................... 92 5.3 Economies of scale effects – providing similar services to more tenants over a
wider area ............................................................................................................................ 94 5.3.1 Benefits assessment for providing smart city services .................................................. 94
5.3.1.1 Synergies between the city centre and the port in ITS and environmental
monitoring 95 5.3.1.2 Spin-off effects of smart city services on tourism .................................................. 97
5.3.2 Cost assessment for extending ITS beyond the port to the city ..................................... 97 5.3.3 Business case impact of deploying ITS in both the Port and the City ........................... 97
5.4 Economies of scope effects – extending the network to deliver a wider range of
services and tenants ............................................................................................................. 98 5.4.1 Benefits assessment for extending to V2I services ....................................................... 98 5.4.2 Cost assessment for extending to V2I services ........................................................... 100
5.4.2.1 Cost of infotainment ............................................................................................ 100 5.4.2.2 Cost of semi-automated driving ........................................................................... 101 5.4.2.3 Cost of port ITS and semi-automated driving ..................................................... 102
5.4.3 Business case impact of extending to V2I services ..................................................... 103
6 Testbed measurements, related KPIs and conclusions on quantitative
verification ....................................................................................................... 104
6.1 KPIs verified by testbed measurements .................................................................. 104 6.1.1 KPIs specific to VR applications ................................................................................. 106
6.2 Assessment of quantitative verification results from both simulations and testbed
measurements against project targets per KPI ................................................................. 106
7 Qualitative verification ............................................................................ 110
7.1 Architectural enhancements from 5G-MoNArch.................................................. 110 7.1.1 Review of results and KPIs for architectural enablers ................................................ 110

5G-MoNArch (761445) D6.3 Final report on architectural verification
Version 1.0 Page 13 of 193
7.1.2 Architectural contributions based on gap analysis and enhancements ........................ 113 7.2 Qualitative verification of architectural and functional requirements ................ 113
8 Validation of verification findings with stakeholders ........................... 115
8.1 Map of stakeholders impacted by 5G-MoNArch and our approach to stakeholder
validation ........................................................................................................................... 115 8.2 User requirements for and value of 5G services .................................................... 115
8.2.1 Sea port related users ................................................................................................... 116 8.2.1.1 Validation with sea port related organisations ................................................... 116 8.2.1.2 Hamburg testbed workshops ............................................................................... 117
8.2.2 Tourism related users .................................................................................................. 118 8.2.2.1 Telephone interviews with venues and tourism related organisations ................ 118 8.2.2.2 Feedback from Turin testbed event ..................................................................... 120
8.2.3 Smart city service users ............................................................................................... 120 8.3 Impact of 5G-MoNArch on the mobile industry ................................................... 121
8.3.1 The value of 5G-MoNArch to mobile network operators ........................................... 121 8.3.2 The value of 5G-MoNArch to mobile equipment vendors .......................................... 122
8.4 Impact of 5G-MoNArch on infrastructure provision and barriers to deployment
123
8.5 Implications for and validation by regulators and government groups ............... 125
9 Conclusions ............................................................................................... 127
9.1 Summary of verification results for target KPIs and conclusions against project
KPI targets ......................................................................................................................... 127 9.2 EC1 conclusions: 5G-MoNArch ability to realise high reliability industrial
services ............................................................................................................................... 128 9.3 EC2 conclusions: Benefits of resource elasticity in 5G-MoNArch ...................... 129
9.4 EC3 conclusions: Ability of 5G-MoNArch to support smart city and wider social
and economic value generation ........................................................................................ 129
9.5 Conclusions from stakeholder validation of 5G-MoNArch .................................. 130
10 References .............................................................................................. 131
Appendix A Mapping services to slice blueprints and infrastructure .... 137
A.1 List of Slices Properties for the Slice Template ..................................................... 137
A.2 List of Slice Templates ............................................................................................ 139 A.2.1 eMBB slices ................................................................................................................ 139 A.2.2 URLLC slices .............................................................................................................. 141 A.2.3 mMTC slices ............................................................................................................... 142
A.3 List of Functional Setups ....................................................................................... 144 A.3.1 eMBB slices ................................................................................................................ 145 A.3.2 URLLC slices .............................................................................................................. 146 A.3.3 mMTC slices ............................................................................................................... 147
Appendix B Further details on services modelled and scenario setup for
Mx-ART simulations ....................................................................................... 150
B.1 Description of network configuration and slice configuration for Hamburg
verification scenario .......................................................................................................... 150 B.2 Description of synthetic scenario ........................................................................... 152
Appendix C Attacks and probes used in security verification process .. 155
Appendix D Further details on benefits analysis and network
dimensioning for commercial verifications ................................................... 156
D.1 Revenue and benefits modelling for eMBB ........................................................... 156

5G-MoNArch (761445) D6.3 Final report on architectural verification
Version 1.0 Page 14 of 193
D.1.1 eMBB market segmentation ........................................................................................ 156 D.1.2 eMBB revenues ........................................................................................................... 157
D.2 Approach to revenue and benefits modelling in EC1............................................ 158 D.2.1 Traffic control .............................................................................................................. 158 D.2.2 Automated container handling .................................................................................... 162 D.2.3 Augmented Reality (AR) for construction and maintenance ...................................... 166 D.2.4 Asset tracking .............................................................................................................. 167 D.2.5 Translating benefits to revenues .................................................................................. 171
D.3 Benefits and revenues assessment for EC3 ........................................................... 172 D.3.1 Approach for ITS revenues and social benefits ........................................................... 172 D.3.2 Approach for smart energy grids – revenues and social benefits ................................ 173 D.3.3 Approach for smart water ............................................................................................ 174 D.3.4 Approach for environmental monitoring ..................................................................... 174
D.4 Network dimensioning assumptions ...................................................................... 175 D.4.1 Spectrum availability and supported site configuration assumptions over the study
period 175 D.4.2 Spectrum efficiency assumptions ................................................................................ 175 D.4.3 Minimum inter-site distance (ISD) and maximum cell range assumptions ................ 176 D.4.4 Site and equipment cost assumptions .......................................................................... 176
D.5 Network dimensioning assumptions for small cell network at cruise ship terminal
under EC2 .......................................................................................................................... 177 D.5.1 eMBB demand at cruise ship terminal ........................................................................ 177 D.5.2 Small cell capacity and supporting network equipment assumed ............................... 177 D.5.3 Spectrum assumptions for small cell hotspot deployment models .............................. 179
Appendix E Sensitivity analysis results for Mx-ART .............................. 180
Appendix F Stakeholder questionnaires ................................................... 184
Appendix G Details on qualitative verification of architectural and
functional requirements .................................................................................. 186

5G-MoNArch (761445) D6.3 Final report on architectural verification
Version 1.0 Page 15 of 193
List of Figures
Figure 1-1: Mobile revenue and mobile data consumption trends in the UK ....................................... 20 Figure 2-1: Verification framework applied .......................................................................................... 26 Figure 2-2: Mx-ART setup overview (left) and GUI screenshot .......................................................... 27 Figure 2-3: Overview of CAPisce tool used for network dimensioning and cost analysis ................... 28 Figure 2-4: 5G-MoNArch high-level structure of the overall functional .............................................. 30 Figure 2-5: WP6 verification scenario – Hamburg city centre and sea port study area ........................ 31 Figure 2-6: Assumed site types and functionality and equipment per site in WP6 analysis ................. 32 Figure 2-7: Assumed starting infrastructure in the study area ............................................................... 32 Figure 2-8: Setting for EC1 and its target services ................................................................................ 33 Figure 2-9: Setting for EC2 and its target services ................................................................................ 34 Figure 2-10: Settings for EC3 and the extension of 5G-MoNArch services ......................................... 34 Figure 2-11: Example of a functional setup diagram ............................................................................ 37 Figure 3-1: Data duplication as network layer ...................................................................................... 40 Figure 3-2: Impact on packet drop rate due to data duplication ............................................................ 41 Figure 3-3: Probability of successful packet transmission .................................................................... 42 Figure 3-4: Modelling of VNF chain failure event ............................................................................... 43 Figure 3-5: Mapping of PRBs to VNF chain......................................................................................... 44 Figure 3-6: Pseudo-code for joint resource management algorithm ..................................................... 45 Figure 3-7: Comparison of redundancy schemes .................................................................................. 46 Figure 3-8: Simplified 5GS block diagram ........................................................................................... 47 Figure 3-9: CDF of fibre length between antenna and edge cloud sites ................................................ 48 Figure 3-10: eMBB low, medium and high demand forecasts .............................................................. 53 Figure 3-11: Daily downlink (DL) outdoor demand generated for port services .................................. 54 Figure 3-12: eMBB low, medium and high revenues forecast .............................................................. 55 Figure 3-13: Estimation of annual MSP revenues from business applications ..................................... 61 Figure 3-14: Example of MC impact on network dimensioning ........................................................... 62 Figure 3-15: Additional servers dimensioned depending on service reliability requirements .............. 62 Figure 3-16: Cost of providing a port automation service with and without MC ................................. 63 Figure 3-17: Costs for providing port ITS ............................................................................................. 64 Figure 3-18: Costs for providing HPA AR............................................................................................ 65 Figure 3-19: TCO comparison between additional services, with and without MC ............................. 66 Figure 3-20: 2020-2030 cumulative DCF for eMBB and Port Automation .......................................... 67 Figure 3-21: Network cost with variations in eMBB demand, sum over 11 years in €m ..................... 68 Figure 3-22: Cost of providing combinations of port services .............................................................. 69 Figure 4-1: Queen Mary 2 leaving Hamburg’s Steinwerder cruise ship terminal ................................. 71 Figure 4-2: Illustration of where the three dimensions of elasticity impact .......................................... 72 Figure 4-3: Normalised Computational Load - MAC approach (left) and PHY ................................... 73 Figure 4-4: Average Throughput – MAC approach (left) and PHY approach (right) ........................... 74 Figure 4-5: Orchestration driven elasticity model ................................................................................. 74 Figure 4-6: Analysis of Elastic Computational Resource Allocation .................................................... 75 Figure 4-7: Radio and computational resource allocation to eMBB slice ............................................. 76 Figure 4-8: Radio and computational resource allocation to IoT and URLLC slices ........................... 77 Figure 4-9: Temporary demand hotspot scenario evaluated under EC2 ............................................... 80 Figure 4-10: Average capacity required per MSP at the cruise ship terminal ....................................... 81 Figure 4-11: Forecast revenues for cruise ship terminal premium eMBB ............................................ 82 Figure 4-12: Speicherstadt historic area in Hamburg and area for AR tourism .................................... 83 Figure 4-13: Forecast revenues for AR guided tour service against study area .................................... 84 Figure 4-14: Network deployment scenario assumed for cruise ship terminal hotspot ........................ 84 Figure 4-15: Number of small cells required to serve the cruise ship terminal hotspot ........................ 85 Figure 4-16: Difference in the eMBB medium demand heatmaps between the evening ...................... 85 Figure 4-17: Number of cores used by wide area eMBB network (blue) and Steinwerder .................. 86 Figure 4-18: 2020-2030 TCO for cruise ship terminal small cell network with and without ............... 86 Figure 4-19: 2020-2030 cumulative DCF for the small cell network at the Steinwerder ..................... 87

5G-MoNArch (761445) D6.3 Final report on architectural verification
Version 1.0 Page 16 of 193
Figure 4-20: 2020-2030 TCO for the small cell network at the cruise ship terminal ............................ 88 Figure 4-21: 2020-2030 cumulative DCF for the small cell network at the Steinwerder ..................... 89 Figure 4-22: Overview of deployment models explored in EC2 sensitivity analysis ........................... 90 Figure 4-23: Comparison of the 2020-2030 TCO of the small cell network to serve ........................... 91 Figure 5-1: Setting for EC3 – extending 5G services to Hamburg city centre ...................................... 92 Figure 5-2: Daily demand in the study area for the additional EC3 services of city ITS ...................... 93 Figure 5-3: Results for smart city revenue and social benefits in the Baseline scenario ....................... 95 Figure 5-4: Economy of scale impact on cost of delivering city and port ITS ...................................... 98 Figure 5-5: Estimates for V2I revenues and associated social benefits for Baseline ............................ 99 Figure 5-6: Network evolution to support eMBB and infotainment ................................................... 100 Figure 5-7: Infotainment demand in comparison to eMBB ................................................................ 101 Figure 5-8: Cost of providing infotainment service ............................................................................ 101 Figure 5-9: Semi-automated driving demand in comparison to eMBB .............................................. 102 Figure 5-10: Cost of providing semi-automated driving service ......................................................... 102 Figure 5-11: Cost of providing port ITS and semi-automated driving services .................................. 103 Figure 8-1: Stakeholder map applied in WP6 stakeholder validation ................................................. 115 Figure 8-2: Hamburg workshop questionnaire responses: benefits of 5G .......................................... 118 Figure 8-3: Views from user survey at Palazzo Madama, Turin testbed event ................................... 120 Figure A-1: Functional setup for the eMBB for consumer devices slice ............................................ 145 Figure A-2: Functional setup for the wireless CCTV slice ................................................................. 145 Figure A-3: Functional setup for the AR / VR service for port management ..................................... 146 Figure A-4: Functional setup for the automated vehicles and port machinery slice ........................... 146 Figure A-5: Functional Setup for the Traffic Signal Control slice ...................................................... 146 Figure A-6: Functional Setup for the Semi-automated Driving slice .................................................. 147 Figure A-7: Functional Setup for the Assisted Driving slice .............................................................. 147 Figure A-8: Functional Setup for the Port Environmental Data Analytics slice ................................. 148 Figure A-9: Functional Setup for the Cargo Tracking slice ................................................................ 148 Figure A-10: Functional Setup for the Smart Grid Data Collection and Control slice ....................... 148 Figure A-11: Functional Setup for the City Services slices ................................................................ 149 Figure B-1: Traffic demand for pedestrians ........................................................................................ 151 Figure B-2: Average traffic demand per cell ....................................................................................... 153 Figure B-3: Traffic demand histogram ................................................................................................ 154 Figure D-1: Daily distribution of traffic (journeys) in the port area ................................................... 160 Figure D-2: Role of 5G-MoNArch in a port automation system ........................................................ 165 Figure D-3: The IoT connectivity solutions fall into four categories .................................................. 170 Figure D-4:Calculated capacity per small cell over time .................................................................... 178 Figure D-5: Assumed spectrum availability between the deployment scenarios ................................ 179
5G-MoNArch (761445) D6.3 Final report on architectural verification
Version 1.0 Page 17 of 193
List of Tables
Table 1-1: Summary of evaluation cases under assessment .................................................................. 19 Table 1-2: Key benefits claimed by 5G-MoNArch and related KPIs under assessment ....................... 21 Table 2-1: 5G-MoNArch main target KPI ............................................................................................ 24 Table 2-2: Summary of services and markets targeted under each evaluation case .............................. 34 Table 2-3: Summary of slices deployed for EC1 .................................................................................. 35 Table 2-4: Summary of slices deployed for EC2 .................................................................................. 36 Table 2-5: Summary of slices deployed for EC3 .................................................................................. 36 Table 3-1: 5GS related gaps concerning resilience and security along with ......................................... 39 Table 3-2: Computational resource allocation per cell .......................................................................... 46 Table 3-3: Extract of NR and LTE air interface UP latencies [3GPP-37910]....................................... 49 Table 3-4: Security results and KPIs concerning relevant enablers presented by WP3 ........................ 50 Table 3-5: RAN reliability results and KPIs concerning MC enablers presented by WP3 ................... 51 Table 3-6: Reliability results and KPIs concerning telco cloud resilience enablers.............................. 52 Table 3-7: Potential economic benefits arising from traffic control: M€ .............................................. 56 Table 3-8: Potential operational benefits arising from Port Automation: M€ ....................................... 58 Table 3-9: Potential economic benefits arising from AR in construction projects: M€ ........................ 60 Table 3-10: Business cases for eMBB plus port applications ............................................................... 67 Table 3-11: Incremental Business cases for port applications .............................................................. 67 Table 3-12: Business case for Port Automation and Port ITS with variations in eMBB ...................... 69 Table 3-13: Percentage increase in 2020 to 2030 TCO compared with ................................................ 70 Table 3-14: Business case for combining Port of Hamburg applications ............................................. 70 Table 4-1: KPIs concerning computational elasticity enablers presented by WP4 ............................... 77 Table 4-2: KPIs concerning orchestration driven elasticity enablers presented by WP4 ...................... 78 Table 4-3: KPIs concerning slice aware elasticity enablers presented by WP4 .................................... 79 Table 4-4: Forecast penetration for hotspot services, Hamburg Study Area ......................................... 82 Table 4-5: Forecast MSP revenues for hotspot services, Baseline, Hamburg Study Area .................... 82 Table 4-6: Forecast penetration for hotspot services, Hamburg Study Area ......................................... 84 Table 4-7: Forecast MSP revenues for hotspot services, Baseline, Hamburg Study Area .................... 84 Table 4-8: Business case for the for the small cell network at the Steinwerder .................................... 87 Table 4-9: Business case for the for the small cell network at the Steinwerder .................................... 89 Table 5-1: Smart city revenues, Baseline, Hamburg Study Area: k€ .................................................... 94 Table 5-2: Social benefits for smart city services, Baseline, Hamburg Study Area: k€........................ 94 Table 5-3: ITS synergies: social benefits, Baseline, Hamburg Study Area: k€ .................................... 96 Table 5-4: Environmental monitoring synergies: social benefits, Baseline, from HPA ....................... 96 Table 5-5: Environmental monitoring synergies: revenues, Baseline, from HPA ................................ 96 Table 5-6: Business cases for extending ITS to the City ....................................................................... 97 Table 5-7: V2I penetration, Baseline, Hamburg Study Area ................................................................ 99 Table 5-8: V2I revenues, Baseline, Hamburg Study Area: k€ .............................................................. 99 Table 5-9: Social benefits for V2I, Baseline, Hamburg Study Area: k€ ............................................... 99 Table 5-10: Business cases for extending to V2I services .................................................................. 103 Table 6-1: 5G-MoNArch performance KPIs in the SSP and the TC testbeds .................................... 104 Table 6-2: Overall use - VR application specific KPIs and comparison ............................................. 106 Table 6-3: VR application specific KPIs and comparison results – results throughout ...................... 106 Table 6-4: VR application specific KPIs and comparison results – results for task............................ 106 Table 6-5: Comparison of simulation and testbed results – all quantitative verification .................... 107 Table 7-1: Cloud enabled protocol stack enabler results ..................................................................... 110 Table 7-2: Experiment driven optimisation enabler results ................................................................. 111 Table 7-3: Inter-slice control & management enabler results ............................................................. 111 Table 7-4: Inter-slice management & orchestration enabler results .................................................... 112 Table 7-5: Architectural gaps identified and corresponding enhancements ........................................ 113 Table 7-6: Overview of outcome of qualitative verification of architectural and ............................... 114 Table 8-1: Summary of discussions with tourism related organisations and their .............................. 118 Table 9-1: 5G-MoNArch performance against KPI objectives ........................................................... 127

5G-MoNArch (761445) D6.3 Final report on architectural verification
Version 1.0 Page 18 of 193
Table A-1: List of slice properties relevant to the baseline deployment specification ........................ 137 Table A-2: Slice templates for eMBB slices ....................................................................................... 139 Table A-3: Slice templates for URLLC slices ..................................................................................... 141 Table A-4: Slice templates for mMTC slices ...................................................................................... 142 Table A-5: Functional setup graphs guideline ..................................................................................... 145 Table B-1: Configuration of antenna sites assumed in Mx-ART ........................................................ 150 Table B-2: Network configuration ...................................................................................................... 152 Table C-1: List of probes and attacks which were used for security evaluation ................................. 155 Table D-1: eMBB market segmentation by scenario .......................................................................... 157 Table D-2: Forecast penetration for eMBB services, Hamburg Study Area ....................................... 157 Table D-3: eMBB monthly ARPU assumptions (Euros) .................................................................... 158 Table D-4: Summary of traffic levels in the port area by road segment ............................................. 159 Table D-5: Summary of value of time estimates in economic literature ............................................. 161 Table D-6: Estimate of the annual value of containerised goods transported by ................................ 162 Table D-7: Estimate of the annual economic benefits of reducing CO2 emissions ............................. 162 Table D-8: Scale of operation at Hamburg’s container terminals ....................................................... 164 Table D-9: Importance of 5G-MoNArch to each application and weighted score.............................. 171 Table D-10: Estimation of MSP revenues ........................................................................................... 172 Table D-11: Minimum ISD assumptions ............................................................................................ 176 Table D-12: Assumed upper limit on permitted cell range ................................................................. 176 Table D-13: Cost elements per site type included in cost analysis ..................................................... 176 Table D-14: Example costs for different site configurations .............................................................. 177 Table E-1: Parameter modified: Site Density ...................................................................................... 180 Table E-2: Parameter modified: Bandwidth ........................................................................................ 180 Table E-3: Parameter modified: Traffic Demand ................................................................................ 181 Table E-4: Parameter modified: Link Imbalance Threshold (BW=20 MHz)...................................... 181 Table E-5: Parameter modified: Link Imbalance Threshold (BW=100 MHz).................................... 181 Table E-6: Sensitivity analysis results for RAN reliability ................................................................. 181 Table E-7: Parameter modified: Redundancy Scheme ........................................................................ 182 Table E-8: Sensitivity analysis results for Telco-cloud Reliability ..................................................... 182 Table E-9: Parameter modified: Resource Share ................................................................................ 182 Table E-10: Parameter modified: Allocated VNFs Per Cell ............................................................... 182 Table E-11: Parameter modified: Max MCS Index ............................................................................ 182 Table E-12: Correlation results between slice resource share and user experienced .......................... 183 Table E-13: Correlation results between number of VNFs assigned and user experienced ................ 183 Table E-14: Correlation results between max MCS index and user experienced ............................... 183 Table G-1: Generic requirements on the overall 5G system ............................................................... 186 Table G-2: Requirements on network slicing ...................................................................................... 188 Table G-3: RAN-related requirements ................................................................................................ 189 Table G-4: Capability exposure requirements ..................................................................................... 191 Table G-5: Security requirements ....................................................................................................... 192

5G-MoNArch (761445) D6.3 Final report on architectural verification
Version 1.0 Page 19 of 193
1 Introduction
1.1 Scope of this document
This report forms the final deliverable of work package (WP) 6 of 5G-MoNArch focusing on the
verification and validation of the technical and economic benefits envisaged by the 5G-MoNArch
architecture and its supporting functional innovations of:
• Secure and resilient Network Functions (NFs)
• Resource elastic NFs
This document presents results from the two main threads of verification work within the project to
collect, analyse, quantify and conclude:
• Improvements to technical Key Performance Indicators (KPIs)
• Improvements to commercial and economic KPIs
Achieved improvements in KPIs for wireless networks are notoriously variable and dependent on the
network deployment, environment, wireless services, user behaviour etc. assumed. Rather than reporting
KPI improvements under idealised conditions, within WP6 a series of evaluation cases have been
defined to assess the claimed benefits of 5G-MoNArch in a realistic deployment scenario relevant to the
use cases under assessment. Each evaluation case is grounded in a commercial or economic motivation.
Improvements in technical KPIs underpin these commercial or economic motivations - they are essential
to achieving the required Quality of Service (QoS) and efficiencies in network dimensioning that are
needed to deliver the benefit and cost improvements under assessment in the original motivation for
each evaluation case.
The three evaluation cases are set in Hamburg city centre and port area and summarised on Table 1-1.
Table 1-1: Summary of evaluation cases under assessment
Evaluation case
title
Services and users
considered Commercial motivation
Technical performance
underpinning commercial
motivation
Evaluation case 1
(EC1): Resilient
network slices for
industrial
applications
Enhanced Mobile
Broadband (eMBB) for
consumers across the
study area.
Intelligent transport
systems (ITS),
Augmented Reality
(AR) for port
maintenance and
construction and
environmental
monitoring for the port
authority.
Automation of port
machinery for container
terminal operators.
Improve business case for
Mobile Service Providers
(MSPs) by delivering
higher value industrial
grade wireless services to
vertical users (who have a
higher willingness to pay
than consumers).
To deliver industrial grade
wireless solutions and enable
these new revenue streams
requires improvements in:
End to End (E2E) reliability
E2E latency
Security
These improvements need to
be achieved without too high
an impact network
dimensioning and hence on
cost.
Evaluation case 2
(EC2): Elastic
network slices
enabling local
peak performance
eMBB for consumers
across the study area.
Additional eMBB
capacity at Steinwerder
cruise ship terminal for
cruise ship passengers
and staff.
Improve business case for
serving demand hotspots
better by using elasticity
to reduce hotspot related
costs.
To deliver cost savings,
reductions in the volume of
processing equipment required
to serve demand hotspots, via
elasticity, are needed. These
reductions must be done whilst
maintaining Quality of
Experience (QoE) on existing
and hotspot services.

5G-MoNArch (761445) D6.3 Final report on architectural verification
Version 1.0 Page 20 of 193
Evaluation case 3
(EC3): Economies
of scale and scope
in wider smart city
environments
eMBB for consumers
across the study area.
EC1 industrial services
for port authority.
Smart city services for
city council.
Vehicular services for
car manufacturers.
Improve business case by
delivering multiple
services for a range of end
users from a single
infrastructure set which
delivers new revenue
streams whilst limiting the
incremental cost of new
services.
To deliver a mix of services
with varying QoS from the
same network infrastructure set
requires E2E network slicing
with demonstrable slice
isolation.
Within WP6, wide area simulators have been developed; one focusing on technical KPIs and the other
on techno-economic analysis. These tools have been used to generate the WP6 KPI improvements
reported against the evaluation cases above. The design of these tools has been informed by the more
detailed work of the technical WPs in 5G-MoNArch so that they represent at a high level the innovations
and enablers of these. These technical WPs include:
• Work package 2 (WP2) examining architecture [5GM-D23]
• Work package 3 (WP3) examining resilience and security [5GM-D32]
• Work package 4 (WP4) examining resource elasticity [5GM-D42]
Not all KPIs can be simulated and in some cases require demonstration on real testbeds (service creation
time for example). In these cases, simulation results have been supplemented with measurements from
the two 5G-MoNArch testbeds; one located in Hamburg and the other in Turin. Additionally, a
qualitative assessment is also presented to verify functional requirements.
Finally, these KPI improvements and the underlying assumptions behind them have been validated with
industry stakeholders with the results of these discussions also reported here.
1.2 5G-MoNArch motivation – pressure in mobile industry and the promise
of 5G
Each of the verification evaluation cases focused on by WP6 have commercial or economic motivations
which can only be realised if technical KPI improvement targets are reached. Here, we briefly
summarise the commercial pressures facing today’s mobile industry and how 5th Generation mobile
wireless communication system (5G) promises to go some way towards addressing these. This forms
the motivation for many of 5G-MoNArch’s innovations.
Figure 1-1 presents an analysis of historical mobile data volumes and revenues for the United Kingdom
based on [Ofc18]. This shows a slight downward trend in prices paid by mobile subscribers, driven by
competition in the UK mobile market and limits on consumers’ willingness to pay. This is despite
subscribers receiving much higher data volumes through their subscriptions over time and has created a
steep downward trend in the mobile revenue received per unit of data delivered. Alongside this
subscriber volumes have grown only marginally with headline retail mobile revenues in the UK falling
by 8% from £17 billion to £15.6 billion between 2012 and 2017.
Figure 1-1: Mobile revenue and mobile data consumption trends in the UK

5G-MoNArch (761445) D6.3 Final report on architectural verification
Version 1.0 Page 21 of 193
This difficulty in growing or even maintaining revenues from consumer-focused mobile broadband
(MBB) services puts pressure on mobile network costs to be reduced to maintain margins. However,
with increasing volumes of data being consumed on mobile networks the opportunity to reduce costs
has been limited, with CAPital EXpenditure (CAPEX) investment from European Mobile Network
Operators (MNOs) continuing to be required at a rate of between 12% and 18% of revenues for the
period 2010 to 2017, according to GSM (Groupe Spéciale Mobile) Association (GSMA) [Gsma18].
The implications of these trends are:
• A risk to the long-term sustainability of the mobile industry if the focus remains on pursuing a
consumer focused MBB strategy.
• A risk that MNOs might be forced to limit MBB data growth to manage network costs. This
could stifle innovation, new services and applications.
• A risk that MNOs will not be in a position to finance and deliver all future categories of mobile
services leading to social gaps, such as the rural urban divide already seen, and loss of wider
social and economic benefits. Examples include less efficient monitoring and control of
pollution and traffic congestion in cities due to a lack of smart city service rollout.
Virtualised networks supporting network slicing, as proposed by 5G-MoNArch, have the potential to
improve margins and de-risk the long-term business case for MSPs in two ways:
• Increasing the revenue per unit of data by developing relationships with end users and tenants
who place a higher value than consumers on tailored mobile services with a guaranteed QoS
level. For this, the functional innovation of “Secure and resilient NFs” within 5G-MoNArch is
key.
• Reducing the cost per unit of data compared with many disparate, dedicated private networks
due to economies of scale and scope of combining multiple services on the same network. Here,
the functional innovation of “Resource elastic NFs” can help reduce overprovisioning of
processing equipment, and hence reduce costs, by taking advantage of diversity in demand for
different services and their requirements.
1.3 Technical and commercial benefits of 5G-MoNArch to be verified and
validated
Unlike many other 5G projects, 5G-MoNArch focuses on the network architecture required for 5G and
related services rather than the air interface. Its main objective is the delivery of a guaranteed QoS across
a diverse range of services via network slicing and supported enablers.
The key benefits claimed by 5G-MoNArch to be verified and validated by WP6 are as shown on Table
1-2. This table also introduces the “target KPIs” focused on by WP6 to validate each of these claims.
These target KPIs and the levels of improvement set by other 5G projects and fora are described in
further detail in Section 2.1.
Alongside the technical and commercial metrics being analysed above, we also assess the wider social
and economic benefits of potential 5G services in a city environment and ask, “Does 5G-MoNArch
improve the mobile business case enough for the full value and range of mobile services to be realised
by today’s mobile ecosystem?”.
Table 1-2: Key benefits claimed by 5G-MoNArch and related KPIs under assessment in this report
Key benefit claimed by 5G-MoNArch KPIs for assessment to verify this claim
Delivery of new industrial services and
meeting their challenging service
requirements leading to new business to
business (B2B) higher value revenue
opportunities.
The ability to meet the requirements of challenging new
services is measured by:
E2E reliability
E2E latency
Security
Introduction of resource elasticity in
virtualised networks to serve temporary
demand hotspots more cost effectively in
Reductions in overprovisioning of equipment due to elasticity
and related cost savings are assessed under the “Cost
efficiency” metric.

5G-MoNArch (761445) D6.3 Final report on architectural verification
Version 1.0 Page 22 of 193
new ways and via new partnerships and
commercial models.
Delivery of a fully-fledged virtualised
network architecture with E2E network
slicing delivering flexibility, multi-tenancy
and multi-service support and their
subsequent economies of scale and scope.
Multi-service support is demonstrated by “Slice isolation” or
the ability of the network to deliver multiple services with a
diverse range of requirements without the load of any one
service impacting the QoS of another.
Flexibility is measured by “Service creation time” or the time
to set up new slices or services in the proposed architecture.
Economies of scale and scope from multi-service support is
measured by changes to the “Cost efficiency” metric.
1.4 Structure of this document
This report is structured as follows:
• Chapter 1 – This introduction setting out the objectives of this report, current pressures on the
mobile industry and the envisaged benefits of 5G-MoNArch in addressing these and under
assessment in this report.
• Chapter 2 – Introduces the KPIs targeted for assessment in this report and our approach to the
verification process. It also introduces the Hamburg study area and three related evaluation cases
used by the two WP6 wider area simulation tools.
• Chapters 3, 4 and 5 are dedicated to the technical and commercial verification of 5G-MoNArch
in each of the three evaluation cases considered in turn of:
o Evaluation case 1 (EC1) - Resilient network slices for industrial applications
o Evaluation case 2 (EC2) - Elastic network slices enabling local peak performance
o Evaluation case 3 (EC3) - Economies of scale and scope in wider smart city
environments
• Chapter 6 – Completes the target KPIs assessment with additional information from testbed
measurements and draws conclusions on the level of improvement seen across the target KPIs
from all quantitative verification activities.
• Chapter 7 – Presents the qualitative verification of 5G-MoNArch in terms of architectural
innovations and assessment against 5G functional requirements.
• Chapter 8 – Summarises implications for stakeholders of the KPI improvements found in our
verification work and validation of these results and their underlying assumptions with
stakeholders.
• Chapter 9 – Presents conclusions from across this report.

5G-MoNArch (761445) D6.3 Final report on architectural verification
Version 1.0 Page 23 of 193
2 Target KPIs and our verification approach
This chapter introduces the KPIs targeted in our verification work along with the framework and
methodology that we have applied in assessing 5G-MoNArch against these. It also reports the details
and assumptions related to the evaluation cases of WP6. This includes details of the services and slices
used, a description of the scenarios analysed and related infrastructure assumptions.
2.1 Target KPIs
Across the technical WP deliverables [5GM-D23, 5GM-D32, 5GM-D42,5GM-D52] various KPIs that
describe the networks’ performance are used (initially defined in [5GM-D61]). However, to examine
each of these KPIs in detail is not practical, so a subset of these has been selected [5GM-D62].
Summarised results for the remaining KPIs as outputted from the simulations and testbed runs of the
project are available in Chapters 3, 4, 6 and 7.
This section provides an overview of the main KPIs that were chosen for the verification and validation
process that combines the three evaluation cases examined in this deliverable (Table 1-1) with the
testbed results. In Table 2-1, we show the improvement targeted for each of these KPIs under 5G-
MoNArch (based on the objectives given in the project’s DoA) and compare them against the 5G Public
Private Partnership (5G-PPP) targets currently discussed in the Technical Board - Performance KPIs
[B+18]. Each KPI is briefly presented along with the innovations and techniques that impact their values:
• Area traffic capacity: The sharing strategies devised by the project contribute to increase the
wireless area traffic capacity. The innovation on “inter-slice control” enables efficient capacity
sharing among different tenants and operators. This can provide capacity improvements
compared to legacy networks where each network has its own infrastructure and radio spectrum
resources. The “resource elasticity” innovation provides further multiplexing gains at an intra-
slice level, which increases area traffic capacity by an additional factor due to diversity in when
and where services or slices are used. The gains resulting from resource elasticity are evaluated
in the Touristic City (TC) testbed, while the gains resulting from inter-slice control are evaluated
via EC2. It should be noted that that features for capacity improvements on lower layers of 5G
air interfaces are not in scope of 5G-MoNArch; their impact is considered in simulative
evaluations, e.g. by corresponding look-up tables, e.g. for Massive Multiple Input Multiple
Output (MIMO) antenna usage.
• Cost efficiency: Cost efficiency in 5G-MoNArch mainly comes from: (i) the increased
flexibility of the architecture due to “network slicing”, which allows for satisfying a diverse set
of requirements with a single infrastructure, and (ii) the “resource elasticity” innovation, which
maintains the performance levels under limited network resources. To assess the first feature,
5G-MoNArch builds on the techno-economic analysis undertaken in 5G-PPP Phase 1 projects
(in particular 5G NORMA), taking as target KPIs the figures derived by this Phase 1 analysis
and confirming through testbed results and further techno-economic assessment that this target
is met. The gains due to “resource elasticity” are verified by both measurements from the Turin
TC testbed and the techno-economic assessment of elasticity under EC2.
• E2E latency: By enabling the flexible “orchestration” of NFs, 5G-MoNArch can instantiate
slices that achieve very low latencies by placing those NFs that have an impact on latency very
close to the user. This is demonstrated in the TC testbed, which runs applications that require
latencies as low as 5 msec. Some of EC1 sea port services also have ≤10 msec latency
requirements.
• E2E reliability: The “reliability” innovation developed by 5G-MoNArch provides the ability
to cope with eventual infrastructure and radio-link failures while keeping the network and
service up and running. Following enterprise deployment requirements, our goal is to provide a
service reliability between four and five nines. This objective will be assessed in EC1 and in
our sea port testbed, which will incorporate the necessary mechanisms to this end.
• Relocation delay: The architecture of 5G-MoNArch uses Virtual Network Function (VNF) to
substitute specialised equipment used in legacy networks. Better VNF optimal placement can
boost network performance and help save resources and, via orchestration driven elasticity

5G-MoNArch (761445) D6.3 Final report on architectural verification
Version 1.0 Page 24 of 193
algorithms, the best placement of VNFs across the network is found. This KPI measures the
delay required for the migration of VNFs and is verified in the TC testbed.
Table 2-1: 5G-MoNArch main target KPI
KPI Architecture Enablers KPI objective
5G-PPP
corresponding
KPI & Target
Demonstrated by1
Area
traffic
capacity
Inter-slice control &
resource management
Resource elasticity
Improvement by
factor ~10
(compared to non-
5G systems)
Data Volume,
10 Tb/s/km1
EC2 slice-aware elasticity
simulations (Section 4.2.3),
EC2 cost analysis (Section
3.3) and WP4 simulations
(Section 4.2.4)
Cost
efficiency
(1) Network slicing
(2) Resource elasticity
(1) According to
5G-PPP Phase 1
economic analysis,
Total Cost of
Ownership (TCO)
reduction of 14%
(2) At least a factor
of 2
KPI not
defined in
5G-PPP yet
(1) Economic analysis of
EC1 and EC3 (Sections 3.3
and 5.3) plus both of the
testbeds (Section 6.1)
(2) Economic analysis of
EC2 (Section 4.3) and
Touristic City testbed
(Section 6.1)
E2E
latency
Orchestration
Network elasticity
5 msec (for
scenarios/slices/
services where such
latency is required)2
E2E latency,
≤ 5 msec
Touristic City and Smart
Sea Port testbeds (Section
6.1), EC1 analysis (Section
3.2.2)
E2E
reliability
Data duplication & MC
in Radio Access
Network (RAN) telco
cloud resilience
techniques
Four or five 9’s
(dependent on
scenarios/slices/servi
ces considered)
Reliability,
99.999%
WP3 simulations (Section
3.2.4) and Smart Sea Port
testbed (Section 6.1), EC1
simulations and economic
analysis (Sections 3.2.1 and
3.3)
Relocation
delay
Orchestration
Network elasticity
No service
disruption -
Touristic City testbed
(Section 6.1)
Security
Security trust zones
Security techniques
regarding threat
detection, prevention,
and reaction within
Management and
Orchestration (M&O)
layer
Comparable to
proprietary solutions -
Smart Sea Port testbed
environment simulations
(Section 0)
Service
creation
time
Orchestration
Network slicing Minutes
Service
deployment
time, <90 min
Smart Sea Port and
Touristic City testbed
(Section 6.1)
Slice
Isolation
Inter-slice control
Resource elasticity
Changes in one slice
without negative
impact on other
slices running on the
same infrastructure
-
Smart Sea Port and
Touristic City testbed
(Section 6.1)
1 Note this 5G-PPP target for area traffic capacity is for an indoor office or stadium scenario, i.e. for an area
with limited size, where high capacity may be needed. 2 Note for the services considered under the wide area evaluation cases of WP6 the strictest latency
requirement assessed was ≤10 msec. 5 msec is only required in extreme use cases but consideration is given
to how this might be achieved in Section 3.2.2.
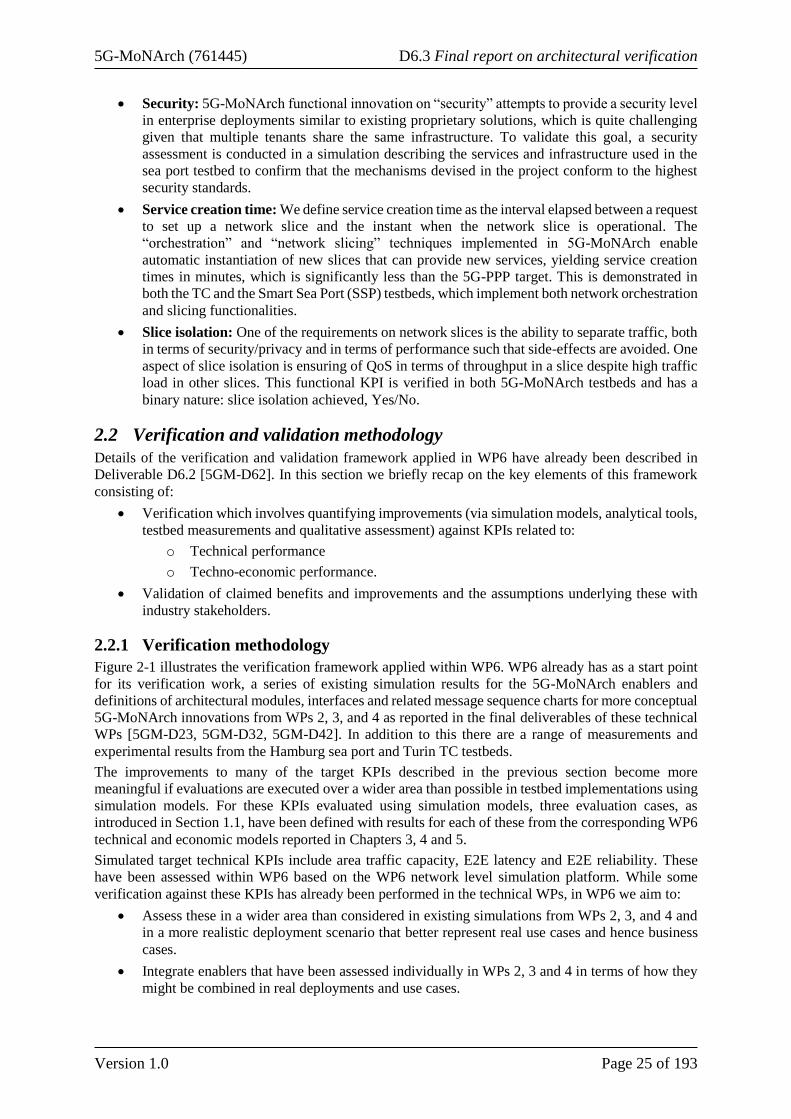
5G-MoNArch (761445) D6.3 Final report on architectural verification
Version 1.0 Page 25 of 193
• Security: 5G-MoNArch functional innovation on “security” attempts to provide a security level
in enterprise deployments similar to existing proprietary solutions, which is quite challenging
given that multiple tenants share the same infrastructure. To validate this goal, a security
assessment is conducted in a simulation describing the services and infrastructure used in the
sea port testbed to confirm that the mechanisms devised in the project conform to the highest
security standards.
• Service creation time: We define service creation time as the interval elapsed between a request
to set up a network slice and the instant when the network slice is operational. The
“orchestration” and “network slicing” techniques implemented in 5G-MoNArch enable
automatic instantiation of new slices that can provide new services, yielding service creation
times in minutes, which is significantly less than the 5G-PPP target. This is demonstrated in
both the TC and the Smart Sea Port (SSP) testbeds, which implement both network orchestration
and slicing functionalities.
• Slice isolation: One of the requirements on network slices is the ability to separate traffic, both
in terms of security/privacy and in terms of performance such that side-effects are avoided. One
aspect of slice isolation is ensuring of QoS in terms of throughput in a slice despite high traffic
load in other slices. This functional KPI is verified in both 5G-MoNArch testbeds and has a
binary nature: slice isolation achieved, Yes/No.
2.2 Verification and validation methodology
Details of the verification and validation framework applied in WP6 have already been described in
Deliverable D6.2 [5GM-D62]. In this section we briefly recap on the key elements of this framework
consisting of:
• Verification which involves quantifying improvements (via simulation models, analytical tools,
testbed measurements and qualitative assessment) against KPIs related to:
o Technical performance
o Techno-economic performance.
• Validation of claimed benefits and improvements and the assumptions underlying these with
industry stakeholders.
2.2.1 Verification methodology
Figure 2-1 illustrates the verification framework applied within WP6. WP6 already has as a start point
for its verification work, a series of existing simulation results for the 5G-MoNArch enablers and
definitions of architectural modules, interfaces and related message sequence charts for more conceptual
5G-MoNArch innovations from WPs 2, 3, and 4 as reported in the final deliverables of these technical
WPs [5GM-D23, 5GM-D32, 5GM-D42]. In addition to this there are a range of measurements and
experimental results from the Hamburg sea port and Turin TC testbeds.
The improvements to many of the target KPIs described in the previous section become more
meaningful if evaluations are executed over a wider area than possible in testbed implementations using
simulation models. For these KPIs evaluated using simulation models, three evaluation cases, as
introduced in Section 1.1, have been defined with results for each of these from the corresponding WP6
technical and economic models reported in Chapters 3, 4 and 5.
Simulated target technical KPIs include area traffic capacity, E2E latency and E2E reliability. These
have been assessed within WP6 based on the WP6 network level simulation platform. While some
verification against these KPIs has already been performed in the technical WPs, in WP6 we aim to:
• Assess these in a wider area than considered in existing simulations from WPs 2, 3, and 4 and
in a more realistic deployment scenario that better represent real use cases and hence business
cases.
• Integrate enablers that have been assessed individually in WPs 2, 3 and 4 in terms of how they
might be combined in real deployments and use cases.

5G-MoNArch (761445) D6.3 Final report on architectural verification
Version 1.0 Page 26 of 193
The existing verification results from WPs 2, 3, and 4 are combined with measurements from WP5
(related to the testbeds) to form the basis for the “rules of thumb” and look-up tables applied in the WP6
network level simulation tool as it would not be practical to replicate the detail of all enablers in a single
network level simulator.
The existing WPs 2, 3, and 4 verification results have been considered by the second thread of
simulation-based verification work in WP6 which focuses on the techno-economic KPIs and is centred
around a set of business case analysis tools which assess revenues, costs, commercial business case and
wider social and economic value. The impact of the WP 2, 3, and 4 enablers on the dimensioning of
network equipment has been studied and incorporated into the cost model elements of the business case
toolset.
However, not all KPIs can be assessed in simulation models. Some, like service creation time and
application specific KPIs, require implementation on real hardware or feedback from real users to be
assessed in a credible way. Therefore, in Chapter 6, a range of measurements and experimental results
from the two project testbeds (the Hamburg Sea Port testbed and Turin TC testbed) are reported to
complete any remaining gaps in the target KPIs which have not been possible to assess in the verification
simulation results. Additionally, a qualitative assessment is performed in Chapter 7 for network and
service requirements that cannot be readily quantified but still require verification against target 5G
requirements. This qualitative assessment draws heavily on the conceptual verification work already
performed by the technical WPs and observations of functionality proven in the testbeds.
Figure 2-1: Verification framework applied
2.2.2 Verification tools
2.2.2.1 Network level simulator used for technical KPIs – Mx-ART
Nomor’s network level simulator called Mx-ART is one of the primary tools for technical verification
in WP6. Using coarser modelling of the real system, it can run vast scenarios (i.e. the whole city) with
speed many times faster than real-time. It is important to highlight that having such a system simulator
that integrates the key project enablers within the same simulator allows to understand the interactions
between the various enablers and their joint effect on the KPIs of interest. This provides much deeper
insights on the system performance than the simulations focusing on individual enablers performed by
WPs 2, 3 and 4. As a matter of fact, developing such an integrated simulator is very challenging and
involves a very considerable effort. Because of this, in many cases it is not possible to provide
simulations such as the ones we provide here, integrating a large set of enablers.
The main features and capabilities of Mx-ART are:

5G-MoNArch (761445) D6.3 Final report on architectural verification
Version 1.0 Page 27 of 193
• Service Traffic Profiles: The traffic manager enables various traffic profiles including but not
limited to Full Buffer, File Transfer Protocol (FTP), Video Streaming, Web Browsing, Voice
over Internet Protocol (VoIP), Constant Bit Rate (CBR), and custom traffic.
• Media Access Control (MAC) Scheduler: Different scheduling techniques are available in
Mx-ART including:
o Throughput fair: all active UEs receive the same throughput,
o Resource fair: all the active UEs receive the same number of Physical Resource Blocks
(PRBs),
o QoS-aware: the scheduler serves the active UEs based on the QoS Class Indicator (QCI)
or 5G QoS Identifier (5QI), respectively.
• Mobility: Mx-ART has a mobility manager module that can support various mobility models
for the UEs or groups of UEs. These models are:
o Street Graph Model: It provides semi-realistic traffic simulations, where the simulation
objects move on a directed graph and take random turns at intersections. The objects
behaviour such as turning and speed changes are instantaneous.
o Circle Model: The circle mobility model uses a random walk model based on the initial
speed of each UE. A circular area of given diameter and position confines the mobility
of terminals.
o Pre-defined Pathway Model: It provides a pathway model for specific terminals like a
ship moving along the river. This type of mobility model is pre-defined for each of the
paths and UE follows the steps and positions defined in the model.
• Radio Propagation Models: Mx-ART can consider different radio propagation models
including Winner+ Radio Propagation [HMK+10] and Universal Mobile Telecommunications
System (UMTS) 30.03 [3GPP-101112].
• Network Slicing: 5G-MoNArch considers three slicing approaches for RAN, which are
Common Physical Layer (PHY), Common MAC, and Common Packet Data Convergence
Protocol (PDCP) [5GM-D21]. Mx-ART can support all three approaches. Each network slice
contains multiple UEs and one service. Each UE can belong to multiple slices, and it inherits
the service of the slice (each slice can only have one service). Thus, the UEs may have multiple
services depending on the number of slices they belong to.
Figure 2-2 shows an Mx-ART setup block diagram and a graphical user interface (GUI) screenshot.
Figure 2-2: Mx-ART setup overview (left) and GUI screenshot of a several cells scenario (right)
2.2.2.2 Business case analysis toolset for techno-economic KPIs
The techno-economic verification within 5G-MoNArch has been performed by Real Wireless using
their 5G business case analysis toolset which assesses:
• The benefits of new 5G services in terms of:

5G-MoNArch (761445) D6.3 Final report on architectural verification
Version 1.0 Page 28 of 193
o Increased revenue opportunities due to the delivery of new 5G services. This includes
assessment of the operational impact of improved wireless services to industrial users
and translating this into willingness to pay and potential revenues for a service provider.
o Wider social and economic benefits of delivering new 5G services. The commercial
business case for delivering some 5G enabled services, such as smart city services, may
not be very compelling due to the limited budgets available to end users, such as city
councils. However, the wider social and economic benefits of these services may be
high indicating that some use cases may benefit from public and private partnerships to
ensure these less tangible, but important, socioeconomic benefits are not lost.
• The required network roll-out and costs associated with different deployment strategies and
service offerings.
• The Return on Investment (ROI) or commercial business case from combining revenues and
costs from the above two points (typically taken over a study period of several years, here 2020
to 2030).
A Real Wireless developed tool called CAPisce has been used for evaluating network roll out and costs.
An overview of the tool is given in Figure 2-3.
The tool was originally developed under a study for the UK regulator Ofcom [RW12a] and was further
evolved under the 5G NORMA project [5GN-D23] to dimension 5G cloudified networks with antenna
sites, intermediate edge cloud sites (with number of processors, servers and cabinets) and requirements
for the site transport links between these. This platform has been further expanded under 5G-MoNArch
to consider the Hamburg city study area targeted under this project and the cost implications of
delivering resilient industrial services.
Figure 2-3: Overview of CAPisce tool used for network dimensioning and cost analysis
2.2.3 Validation methodology
Verification results and the assumptions used as the basis for these have been validated with stakeholders
via:
• Workshop events held around the two project testbeds; the SSP in Hamburg and TC
demonstration in Turin.
• Telephone interviews with stakeholders.
• Review and discussions with project partners.
• Feedback from the project’s advisory board.
• Attendance at and presenting 5G-MoNArch benefits at industry events.
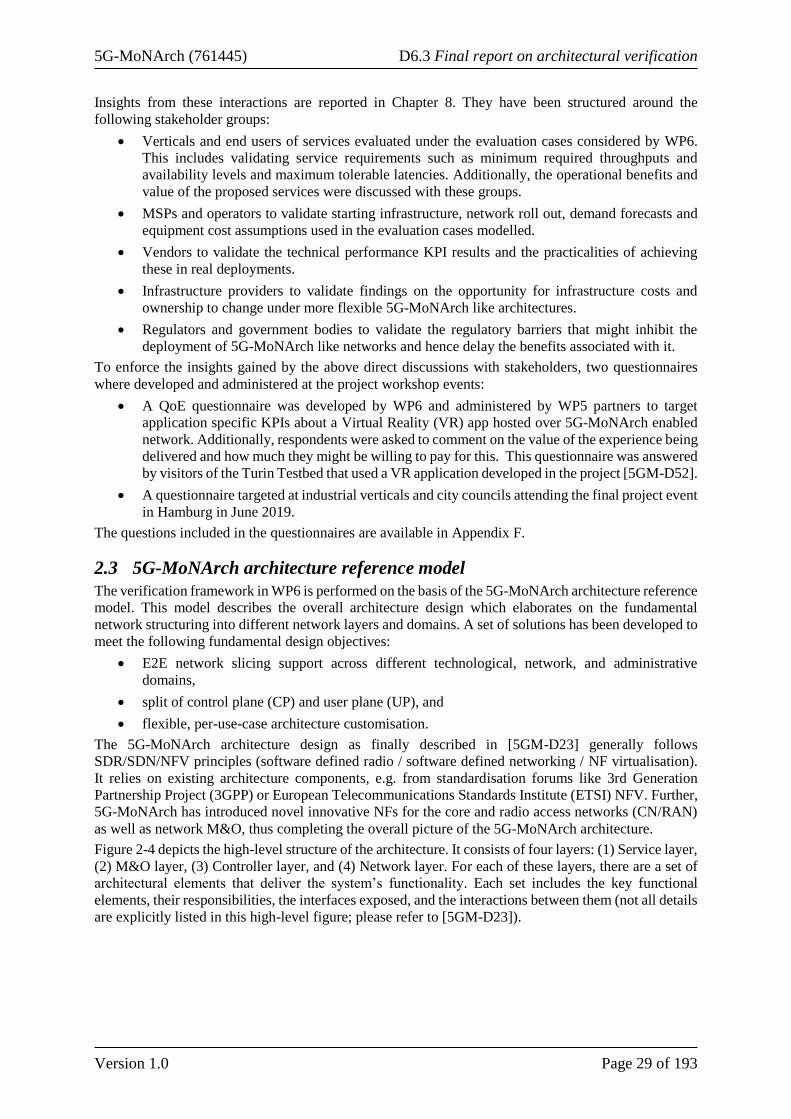
5G-MoNArch (761445) D6.3 Final report on architectural verification
Version 1.0 Page 29 of 193
Insights from these interactions are reported in Chapter 8. They have been structured around the
following stakeholder groups:
• Verticals and end users of services evaluated under the evaluation cases considered by WP6.
This includes validating service requirements such as minimum required throughputs and
availability levels and maximum tolerable latencies. Additionally, the operational benefits and
value of the proposed services were discussed with these groups.
• MSPs and operators to validate starting infrastructure, network roll out, demand forecasts and
equipment cost assumptions used in the evaluation cases modelled.
• Vendors to validate the technical performance KPI results and the practicalities of achieving
these in real deployments.
• Infrastructure providers to validate findings on the opportunity for infrastructure costs and
ownership to change under more flexible 5G-MoNArch like architectures.
• Regulators and government bodies to validate the regulatory barriers that might inhibit the
deployment of 5G-MoNArch like networks and hence delay the benefits associated with it.
To enforce the insights gained by the above direct discussions with stakeholders, two questionnaires
where developed and administered at the project workshop events:
• A QoE questionnaire was developed by WP6 and administered by WP5 partners to target
application specific KPIs about a Virtual Reality (VR) app hosted over 5G-MoNArch enabled
network. Additionally, respondents were asked to comment on the value of the experience being
delivered and how much they might be willing to pay for this. This questionnaire was answered
by visitors of the Turin Testbed that used a VR application developed in the project [5GM-D52].
• A questionnaire targeted at industrial verticals and city councils attending the final project event
in Hamburg in June 2019.
The questions included in the questionnaires are available in Appendix F.
2.3 5G-MoNArch architecture reference model
The verification framework in WP6 is performed on the basis of the 5G-MoNArch architecture reference
model. This model describes the overall architecture design which elaborates on the fundamental
network structuring into different network layers and domains. A set of solutions has been developed to
meet the following fundamental design objectives:
• E2E network slicing support across different technological, network, and administrative
domains,
• split of control plane (CP) and user plane (UP), and
• flexible, per-use-case architecture customisation.
The 5G-MoNArch architecture design as finally described in [5GM-D23] generally follows
SDR/SDN/NFV principles (software defined radio / software defined networking / NF virtualisation).
It relies on existing architecture components, e.g. from standardisation forums like 3rd Generation
Partnership Project (3GPP) or European Telecommunications Standards Institute (ETSI) NFV. Further,
5G-MoNArch has introduced novel innovative NFs for the core and radio access networks (CN/RAN)
as well as network M&O, thus completing the overall picture of the 5G-MoNArch architecture.
Figure 2-4 depicts the high-level structure of the architecture. It consists of four layers: (1) Service layer,
(2) M&O layer, (3) Controller layer, and (4) Network layer. For each of these layers, there are a set of
architectural elements that deliver the system’s functionality. Each set includes the key functional
elements, their responsibilities, the interfaces exposed, and the interactions between them (not all details
are explicitly listed in this high-level figure; please refer to [5GM-D23]).

5G-MoNArch (761445) D6.3 Final report on architectural verification
Version 1.0 Page 30 of 193
Figure 2-4: 5G-MoNArch high-level structure of the overall functional architecture [5GM-D23]
The Service layer comprises Business Support Systems (BSS), business-level Policy and Decision
functions, and further applications and services operated by a tenant or other external entities.
The M&O layer is divided into an E2E service M&O sublayer and an additional sublayer containing
domain-specific management functions. This is especially relevant for E2E network slices which are
composed of Network Slice Subnet Instances (NSSIs), typically each from a different network domain,
including subnets from RAN, transport network (TN), and CN domains, or private (e.g. enterprise)
networks. Please note that in principle each domain may be hosted by a different owner.
The Controller layer includes both cross-slice and intra-slice controllers (XSC and ISC, respectively).
Typically, each network domain has a dedicated controller that is aware of technology and
implementation characteristics utilised in that domain. Cross-domain coordination would be executed
in the M&O layer. Controllers expose southbound interfaces (SoBI) towards virtualised and physical
NFs (VNFs/PNFs) in the Network layer. The Controller layer facilitates the concept of SDN-based
programmability by splitting NFs into the decision logic hosted in a control application and the actual
NF in the Network layer UP (denoted as uVNF or uPNF) that executes the decision. In that case, the
corresponding CP functions (cVNF or cPNF) disappear since the functionality is provided by the
Controller layer functions. If no such split between control logic and agent is applied, i.e. conventional
CP functions are utilised, the Controller layer would disappear. In this sense, it is an optional layer of
the 5G-MoNArch architecture.
The Network layer finally hosts the NSSIs typically comprising the NFs of a specific network domain,
e.g. RAN or CN. A NSSI can be either shared by multiple E2E Network Slice Instances (NSIs) or
dedicated to a single NSI. Accordingly, an NSSI consists of cross-slice NFs (XNFs) or intra-slice NFs
(INFs), respectively.
It should be noted that Figure 2-4 only addresses the functional view of the 5G-MoNArch architecture.
How to map the functions in the different layers, especially in the Network layer, onto the underlying
physical infrastructure, is not explicitly shown. For the verification framework in WP6 it is generally
assumed that a highly softwarised and cloudified network environment will offer the processing
functionalities for NFs across different locations in the various domains, e.g. at antenna sites, edge cloud
sites (e.g. at central offices of MNOs) as well as central cloud sites, which are interconnected by the TN
[5GM-D21]. Finally, the M&O layer is responsible for NF orchestration across the infrastructure
dependent on the service requirements (e.g. latency, reliability, data rate) within the different E2E NSIs.
The dedicated mapping applied in the verification framework by WP6 is described in Section 2.5.

5G-MoNArch (761445) D6.3 Final report on architectural verification
Version 1.0 Page 31 of 193
2.4 Verification scenario and assumed infrastructure – Hamburg city & port
area
As discussed in Sections 1.1 and 2.2, central to the verification work performed in WP6 has been
quantifying 5G-MoNArch improvements over a wide area realistic scenario, termed “verification
scenario”. A series of use cases have been analysed in this scenario, so called “evaluation cases”, using
the wider area WP6 simulation tools; one focused on technical and the other on techno-economic KPIs.
As already introduced in [5GM-D62], the WP6 verification scenario consists of Hamburg city centre
with the addition of the industrial area making up Hamburg port south of the river Elbe. This has been
chosen to have synergies with the use cases being shown in the two testbeds of:
• Delivering resilient and secure industrial services to a port within a large city location as shown
in the Hamburg smart sea-port testbed.
• Using elasticity to provide improved wireless services to challenging hotspot locations in a cost-
effective way, as shown in the Turin TC testbed. The Steinwerder cruise ship terminal in
Hamburg provides this hotspot location for assessment of elasticity enablers.
Additionally, incorporation of the city centre as well as the port area into the verification scenario allows
benefits to the wider city beyond solely the port area to be assessed. It also allows assessment of
economies of scale and scope as further services relevant to the wider city area can be included on the
network in addition to those local to the port and cruise ship terminal areas.
Figure 2-5 shows the area outline considered in techno-economic evaluations with the technical
performance modelling considering a rectangular outline in the same area of 13km x 12km.
Figure 2-5: WP6 verification scenario – Hamburg city centre and sea port study area (focus area
shown in pink with a further “buffer” area in purple)
The mobile network deployed across the verification scenario to deliver the services considered under
each evaluation case is assumed to be a fully virtualised 5G network. As shown in Figure 2-6, the
network is assumed to be made up of:
• Antenna sites which are remote radio heads (RRHs) made up of the antennas, Radio Frequency
(RF) front end and other dedicated hardware for supporting the PNFs required to support
conversion of the RF signal to the Common Public Radio Interface (CPRI) [Cpr15] or evolved
Common Public Interface (eCPRI) [Cpr17]. These sites have with a CPRI or eCPRI connection
to edge cloud sites.
• Edge cloud sites which perform the radio protocol stack processing on commercial off the shelf
(COTS) server hardware for the macrocell and small cell (SC) RRH antenna sites connecting

5G-MoNArch (761445) D6.3 Final report on architectural verification
Version 1.0 Page 32 of 193
into them. Under the 5G-MoNArch architecture part of the M&O layer might be devolved to
these more localised edge cloud sites. However, this is not explicitly modelled in cost
calculations in WP6.
• Core network (CN) which performs the centralised CN functions and main M&O of the network
slices. Again, this is not explicitly modelled in the cost calculations in WP6 under the
assumption that the main cost and processing requirements of the network are driven by the UP
NFs.
Figure 2-6: Assumed site types and functionality and equipment per site in WP6 analysis
The assumed existing infrastructure in terms of antenna and edge cloud sites is shown in Figure 2-7.
The edge cloud sites have been selected to be representative of a subset of the existing fixed telecoms
exchanges in the area which could be used as edge cloud data centres. These have also been selected to
ensure they are close enough to the most local antenna sites so that the fronthaul latency via fibre to
connect to these would be well within the 250 µs required for a CPRI or eCPRI connection.
Figure 2-7: Assumed starting infrastructure in the study area – antenna sites on left (pink markers)
and edge cloud sites on right (red dots)
Further assumptions on spectrum availability, Equivalent Isotropically Radiated Power (EIRP),
supported site configurations (in terms of MIMO, frequency band and bandwidth) and spectral

5G-MoNArch (761445) D6.3 Final report on architectural verification
Version 1.0 Page 33 of 193
efficiency are given in Appendix B and Appendix D. Site and equipment costs have been based on those
used in 5G NORMA with some revisions in line with stakeholder feedback to allow for reductions in
items such as site rental between London (in 5G NORMA) and Hamburg (in 5G-MoNArch). The
evaluation cases, representing different use cases within this verification scenario, and their mapping to
this infrastructure set is described in the next section.
2.5 Evaluation cases and their implementation in the network
Within the verification scenario described in Section 2.3, three evaluation cases (EC) have been defined
which target different groups of services and 5G-MoNArch innovations. A high-level description of
each evaluation case is provided in this section along with a description of how the services within these
would be mapped to slices and infrastructure within the deployed network to ensure that requirements
particular to each service are delivered. More detailed descriptions of the evaluation cases and the
rationale for choosing them have are been given in [5GM-D62]. The resulting technical and techno-
economic verification against each of the three evaluation cases is described in Chapters 3, 4 and 5.
2.5.1 Evaluation cases considered
As described in Section 1.1, each evaluation case assessed by WP6 has a commercial or economic
motivation which is underpinned by 5G-MoNArch’s ability to deliver technical KPI improvements
which can be translated into:
• Improved and guaranteed QoS. This enables new revenue streams from more challenging
industrial services or consumer applications.
• Efficiencies in network and equipment dimensioning. This enables cost savings.
Evaluation case 1 - Resilient network slices for industrial applications
EC1 concerns secure and resilient industrial services in an SSP environment. Besides an eMBB slice,
an MSP provides slices to isolated industrial networks inside an SSP scenario. These slices are aimed at
fulfilling security and reliability requirements, as well as improving the operational efficiency of the
port management and tenants using the port area. Figure 2-8 exemplary shows two examples for target
services of EC1.
Figure 2-8: Setting for EC1 and its target services – container terminals in the Port of Hamburg
(left) and the Elbtunnel exemplary for an HPA managed crossing of the Elbe for vehicles (right)
Evaluation case 2 - Elastic network slices enabling local peak performance
EC2 focuses on adding capacity to the existing consumer focused eMBB network deployed across the
verification scenario to better deal with eMBB demand hotspots generated by passengers on large cruise
ships arriving at the cruise ships terminals. The goal is to verify the concept of network elasticity that is
demonstrated in the Turin TC testbed, but on a bigger scale. Figure 2-9 shows examples for the target
services of EC2.

5G-MoNArch (761445) D6.3 Final report on architectural verification
Version 1.0 Page 34 of 193
Figure 2-9: Setting for EC2 and its target services – large cruise ships in the Port of Hamburg
Evaluation case 3 - Economies of scale and scope in wider smart city environments
Under EC1 and EC2 the new services added to the existing eMBB network are very much focused on
the port area. In EC3 we examine delivering new services to the city centre area of the verification
scenario in combination with these new services in the port area. The aim is to understand how revenues
and costs scale as more services and tenants are added to the existing eMBB network. Figure 2-10 shows
examples for the target services of EC3.
Figure 2-10: Settings for EC3 and the extension of 5G-MoNArch services to the city centre
Table 2-2 presents an overview of the three evaluation cases, the services included in these and the types
of market targeted.
Table 2-2: Summary of services and markets targeted under each evaluation case
Evaluation case Services modelled Target market and business
model
“Business as
usual” eMBB
baseline network
across the entire
verification
scenario
eMBB for outdoor consumer portable devices
Residential and business users
of existing handheld portable
mobile devices. Service and
infrastructure provided by an
MSP who is an existing MNO
in the area.
EC1 – resilient
network slices for
industrial
applications
In addition to “Business as usual” eMBB services:
1. ITS for port construction sites consisting of:
• Connected temporary construction traffic
lights
• Connected mobile Closed-Circuit TeleVision
(CCTV) cameras for monitoring traffic levels
2. AR for port maintenance and construction
3. Environmental monitoring for the port authority
4. Automation of port machinery including:
Port authority for 1. to 3. and
container terminal operators for
4. and 5. Service and
infrastructure provided by an
MSP who is an existing MNO
in the area expanding their
eMBB network to deliver these
industrial services. The aim is to
increase revenues with minimal
impact on network cost.

5G-MoNArch (761445) D6.3 Final report on architectural verification
Version 1.0 Page 35 of 193
• Connected Automated Guided Vehicles
(AGVs) – taking container from cranes to
stackers in the container yards
• Connected stackers – managing the stacking
of containers in the container yards
5. Cargo and asset tracking in the port
EC2 – elastic
network slices
enabling local
peak performance
In addition to “Business as usual” eMBB services:
• Improved capacity eMBB services to cruise ship
passengers at the Steinwerder cruise ship terminal
Cruise ship passengers willing
to pay premium for an improved
eMBB service whilst at the
cruise ship terminal. However,
incremental revenue potential is
limited hence focus is on cost
efficiencies when serving this
demand hotspot. Service and
infrastructure provided by an
MSP who is an existing MNO
in the area. Other infrastructure
partnerships also explored.
EC3 – economies
of scale and scope
in wider smart
city environments
In addition to “Business as usual” eMBB services:
1. All EC1 smart port services
2. Smart city services of ITS, waste management
and environmental monitoring for Hamburg city
3. Smart energy services
4. Vehicle to Infrastructure (V2I) services
As for EC1 for 1, city council
for 2, utility companies for 3
and car manufacturers for 4.
Service and infrastructure
provided by an MSP who is an
existing MNO in the area.
2.5.2 Services and slices required per evaluation case
As mentioned in [5GM-D62], each evaluation case will provide multiple services, each service defined
by a slice. For clarity and better understanding of the defined baseline deployment, this subsection will
give a list with all slices with a brief summary of their requirements. More details can be found in [5GM-
D62]. Defined slices can be generally grouped in three categories, for the sake of clarity:
• eMBB slices – eMBB for services requiring high bandwidth
• mMTC slices – massive Machine Type Communications, involving large numbers of sensing,
metering and monitoring devices
• URLLC slices – Ultra-Reliable Low Latency Communication slices, involving critical services
that require high levels of resilience and/or fast response times (low latency)
Summaries for EC1 are provided in Table 2-3 and for EC2 in Table 2-4. EC3 has the same slices as EC1
and EC2, plus the ones listed in Table 2-5.
Table 2-3: Summary of slices deployed for EC1
eMBB slices mMTC slices URLLC slices
eMBB for consumer portable
devices
requires high bandwidth and
tolerates high latency
Environmental Data Analytics
minimum connectivity, tolerates
high latency, no high E2E
reliability required
Intelligent Traffic Signal Control
and Connected Traffic Lights
minimum connectivity, tolerates
high latency, requires high E2E
reliability
Wireless CCTV
requires high bandwidth and
tolerates high latency
Cargo Tracking
minimum connectivity, tolerates
high latency, no high E2E
reliability required
Automated Vehicles and Port
Machinery
low latency and high E2E
reliability required
AR and VR service for Port
Management and Maintenance
requires high bandwidth and low
latency (below 10ms)

5G-MoNArch (761445) D6.3 Final report on architectural verification
Version 1.0 Page 36 of 193
Table 2-4: Summary of slices deployed for EC2
eMBB slices
eMBB for consumer portable devices: requires high bandwidth and tolerates high latency
eMBB for cruise ship passengers arriving a port terminal: requires high bandwidth and tolerates high latency
Table 2-5: Summary of slices deployed for EC3
mMTC slices URLLC slices
Smart grid data collection and control
minimum connectivity, tolerates high latency, no high E2E reliability
required, high data processing and storage requirements
Semi-automated driving
high E2E reliability, and high data
processing and storage requirements
Assisted driving
minimum connectivity, tolerates high latency, no high E2E reliability
required, high data processing and storage requirements
Waste management and ITS control
minimum connectivity, tolerates high latency, no high E2E reliability
required, high data processing and storage requirements
2.5.3 Assumptions in mapping slices to infrastructure
To establish a benchmark for the verification of 5G-MoNArch, a baseline architecture deployment
without any of the 5G-MoNArch enablers needs to be defined. The architecture will be deployed in the
Hamburg verification scenario and based on the assumed existing infrastructure mentioned in the
previous sections. As input for the definition process, two elements are necessary: the service definitions
within each of the evaluation cases listed above (with their related performance profiles) and the
architecture described in [5GM-D21, 5GM-D22, 5GM-D23].
The definition of the baseline architecture deployment includes multiple elements. The list of
deployment elements and their function will be summarised below, while the full description of each
element can be found in Appendix A.
2.5.3.1 Slice templates for considered services
A full baseline architecture deployment needs to specify the kind, number and functionality of all its
services. This translates to defining all the properties that the slices listed above should possess. A slice
property is a relevant modelling aspect from the point of view of the tenant and deployment. This work
is related to the slice blueprints defined by the WP2 (please refer to Deliverable D2.2 [5GM-D22]). The
template defined for WP6 focuses on the properties that are relevant for verification and the baseline
deployment. Slice properties and the list of slice templates for each slice considered in the three
evaluation cases can be found in Appendix A.
2.5.3.2 Functional setups and topological view for the considered services
The next step in the baseline specification is to indicate for each slice where the different functions will
be hosted, as well as where the services will be deployed. This mapping of slices to infrastructure can
then be considered in each of the WP6 simulation tools. As a basis, we used the Hamburg verification
scenario and the assumed infrastructure described in the previous Section 2.3. This part of the baseline
specification is accomplished with diagrams referred to as functional setups. Full details of the
assumptions and process behind these functional setups is given in Appendix A. This appendix also
presents the functional setup for each of the services across the three evaluation cases. For simplicity,
we present one example functional setup in Figure 2-11 which looks at the deployment of an eMBB
service for consumer portable devices. In Figure 2-11:
• Orange boxes indicate PNFs or VNFs, respectively
• Black lines indicate user data, grey lines indicate control data
• Yellow boxes indicate areas of the overall MNO or tenant network where the slice will be
deployed

5G-MoNArch (761445) D6.3 Final report on architectural verification
Version 1.0 Page 37 of 193
o On the left, the RRHs with the antennas and low PHY are indicated
o In the middle, all relevant edge clouds are placed one on top of the other, each with a
caption of their owner and location, as well as how the radio stack of radio NFs is
organised
o On the right, the central cloud is shown with the CN functions and their organisation
• The central cloud connects to the data network, which hosts the service application running in
this slice
• To indicate the component elements of the slice, a semi-translucent light blue rectangle is used
Figure 2-11: Example of a functional setup diagram (eMBB for Consumer Portable Devices)
Having established the basis for the evaluation cases and the verification activities required against
these, we next examine the technical and commercial verification results for each evaluation case in turn
across the next three chapters.

5G-MoNArch (761445) D6.3 Final report on architectural verification
Version 1.0 Page 38 of 193
3 Evaluation case 1: Resilient network slices for industrial applications
This chapter presents simulation-based verification results for evaluation case 1 (EC1). EC1 focuses on
using 5G-MoNArch and its enablers to provide resilient network slices for industrial applications around
Hamburg port. This chapter first introduces the objectives for EC1 and the services considered within
it. The technical performance verification results are then presented followed by the techno-economic
verification. A summary of conclusions from this chapter for EC1 is given in the “Conclusions” chapter
and specifically Section 9.2.
3.1 Objectives of EC1 and stakeholders targeted
EC1 focuses on delivering secure and resilient industrial network services to an SSP tenant. It is assumed
that an MSP, in addition to maintaining an eMBB slice for existing eMBB services to its end customers,
is providing additional slices to realise an isolated industrial network as needed to serve SSP related
services and business requirements. The final aim of EC1 is to assess the incremental cost related to the
implementation of relevant enablers derived in 5G-MoNArch to achieve the required KPIs for the
additional new industrial services versus the incremental B2B revenues from the introduction of those
services.
We consider the EC1 industrial services as given on Table 2-2. As these industrial services require
especially high reliability and availability the relevant 5G-MoNArch enablers considered in EC1 were
derived by WP3 covering features like data duplication on the radio transmission links (via Multi
Connectivity (MC)), improved telco cloud resilience, and network fault management (incl. fault
detection, recovery and healing) [5GM-D32]. Note that in addition to the MSP’s infrastructure the
tenant’s infrastructure layer may also be used for the set-up of a resilient E2E NSI.
For verification of the benefits achieved by the enablers against the baseline system, EC1 addresses the
following performance KPIs: E2E reliability, E2E latency, security; as well as techno-economic KPIs:
incremental cost, incremental revenue.
The expected improvement to be achieved by the enablers for the targeted performance KPIs requires
additional investment in the network infrastructure and will lead to higher resource usage both on the
radio and on transport links. These aspects must be justified from a business perspective by the
corresponding techno-economic KPIs.
The underlying ecosystem model for EC1 targets different stakeholder groups. Its primary focus is the
SSP tenant, which corresponds in the case of the selected study area in Hamburg to 5G-MoNArch’s
project partner HPA. HPA is using the intended services e.g. to improve and optimize the logistic traffic
inside the port area as well as the operation and maintenance of their facilities. The implementation may
be achieved via own or leased network infrastructure and/or using cloud services/networks offered by
MSPs like DT. In addition, container terminal operators may rely on services delivered to them directly
by the MSP or via HPA as intermediary tenant. The set-up of such industrial E2E slices requires novel
Software (SW) / Hardware (HW) implementations, especially triggered by NFV/SDN aspects, which
must be provided by corresponding vendors both on network infrastructure and on device side.
3.2 Technical performance verification
In the following sections, results showcasing the technical performance of selected enablers related to
EC1 are presented. Under EC1 the following technical KPIs are targeted:
• E2E reliability made up of:
o RAN reliability
o Telco-cloud reliability (covering both the edge cloud(s) and the central cloud(s))
• E2E latency
• Security
In [5GM-D6.2] a set of enablers was chosen from all the enablers that were developed in the technical
packages of the project, based on an estimation of the KPI impact and an assessment of the level of
novelty they present. These enablers were incorporated into the WP6 simulators ensuring that the results
obtained, represent a larger scale deployment scenario. This ensures that the outcomes presented from
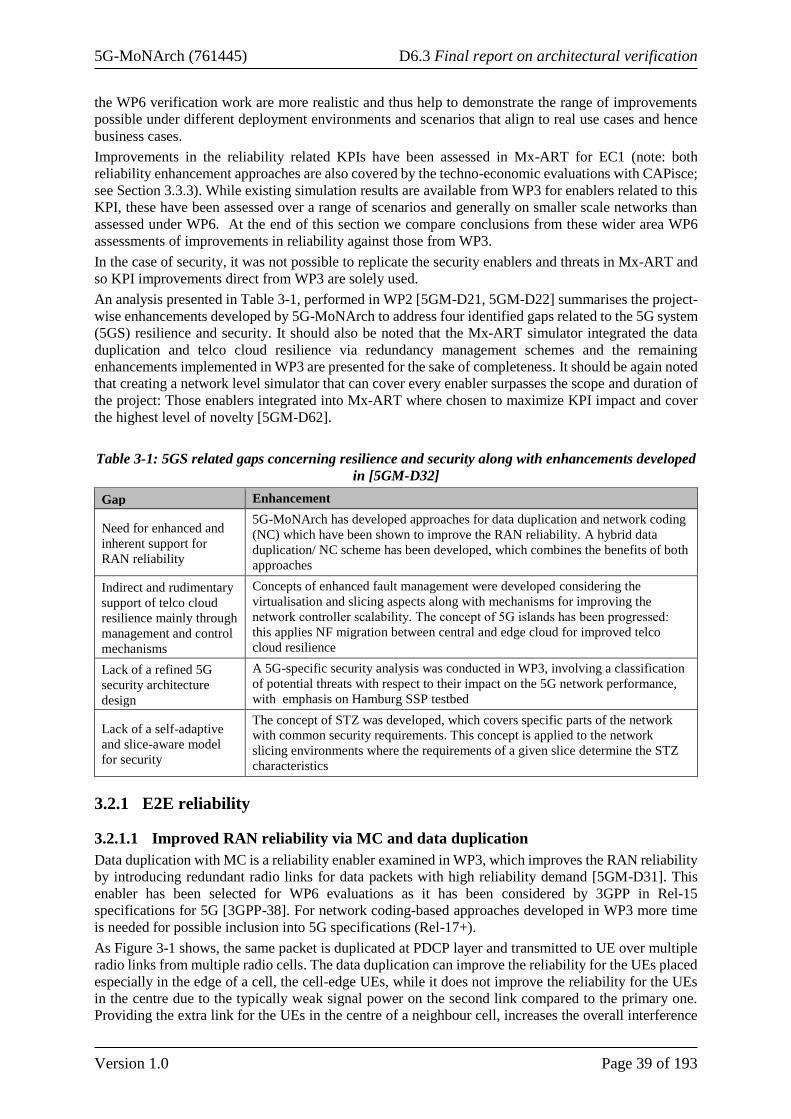
5G-MoNArch (761445) D6.3 Final report on architectural verification
Version 1.0 Page 39 of 193
the WP6 verification work are more realistic and thus help to demonstrate the range of improvements
possible under different deployment environments and scenarios that align to real use cases and hence
business cases.
Improvements in the reliability related KPIs have been assessed in Mx-ART for EC1 (note: both
reliability enhancement approaches are also covered by the techno-economic evaluations with CAPisce;
see Section 3.3.3). While existing simulation results are available from WP3 for enablers related to this
KPI, these have been assessed over a range of scenarios and generally on smaller scale networks than
assessed under WP6. At the end of this section we compare conclusions from these wider area WP6
assessments of improvements in reliability against those from WP3.
In the case of security, it was not possible to replicate the security enablers and threats in Mx-ART and
so KPI improvements direct from WP3 are solely used.
An analysis presented in Table 3-1, performed in WP2 [5GM-D21, 5GM-D22] summarises the project-
wise enhancements developed by 5G-MoNArch to address four identified gaps related to the 5G system
(5GS) resilience and security. It should also be noted that the Mx-ART simulator integrated the data
duplication and telco cloud resilience via redundancy management schemes and the remaining
enhancements implemented in WP3 are presented for the sake of completeness. It should be again noted
that creating a network level simulator that can cover every enabler surpasses the scope and duration of
the project: Those enablers integrated into Mx-ART where chosen to maximize KPI impact and cover
the highest level of novelty [5GM-D62].
Table 3-1: 5GS related gaps concerning resilience and security along with enhancements developed
in [5GM-D32]
Gap Enhancement
Need for enhanced and
inherent support for
RAN reliability
5G-MoNArch has developed approaches for data duplication and network coding
(NC) which have been shown to improve the RAN reliability. A hybrid data
duplication/ NC scheme has been developed, which combines the benefits of both
approaches
Indirect and rudimentary
support of telco cloud
resilience mainly through
management and control
mechanisms
Concepts of enhanced fault management were developed considering the
virtualisation and slicing aspects along with mechanisms for improving the
network controller scalability. Τhe concept of 5G islands has been progressed:
this applies NF migration between central and edge cloud for improved telco
cloud resilience
Lack of a refined 5G
security architecture
design
A 5G-specific security analysis was conducted in WP3, involving a classification
of potential threats with respect to their impact on the 5G network performance,
with emphasis on Hamburg SSP testbed
Lack of a self-adaptive
and slice-aware model
for security
The concept of STZ was developed, which covers specific parts of the network
with common security requirements. This concept is applied to the network
slicing environments where the requirements of a given slice determine the STZ
characteristics
3.2.1 E2E reliability
3.2.1.1 Improved RAN reliability via MC and data duplication
Data duplication with MC is a reliability enabler examined in WP3, which improves the RAN reliability
by introducing redundant radio links for data packets with high reliability demand [5GM-D31]. This
enabler has been selected for WP6 evaluations as it has been considered by 3GPP in Rel-15
specifications for 5G [3GPP-38]. For network coding-based approaches developed in WP3 more time
is needed for possible inclusion into 5G specifications (Rel-17+).
As Figure 3-1 shows, the same packet is duplicated at PDCP layer and transmitted to UE over multiple
radio links from multiple radio cells. The data duplication can improve the reliability for the UEs placed
especially in the edge of a cell, the cell-edge UEs, while it does not improve the reliability for the UEs
in the centre due to the typically weak signal power on the second link compared to the primary one.
Providing the extra link for the UEs in the centre of a neighbour cell, increases the overall interference

5G-MoNArch (761445) D6.3 Final report on architectural verification
Version 1.0 Page 40 of 193
level. In addition, the channel quality between the UE and the additional cell (i.e. the secondary cell) is
comparatively worse, which leads to relatively higher amount of radio resources consumption to offer
the same throughput. The trade-off between the imposed cost to the network and the gained reliability
is proposed to apply data duplication only to the UE placed in the edge of the cell. A UE is assumed to
be a cell-edge UE if it has more than one available radio link with sufficient signal quality and threshold
imbalance between the primary and secondary links is smaller than the threshold, given by:
|𝑅𝑆𝑅𝑃𝑝 − 𝑅𝑆𝑅𝑃𝑠| > 𝜏𝑝
where:
• 𝑅𝑆𝑅𝑃𝑝: the Reference Signal Received Power (RSRP) of the primary link,
• 𝑅𝑆𝑅𝑃𝑠: the RSRP of the secondary link,
• 𝜏𝑝: the link imbalance threshold.
Increasing the link imbalance threshold enables data duplication for more UEs. However, setting a too
high threshold value results in enabling data duplication for UEs having bad channel condition and
reducing the resource utilisation efficiency. Hence, selecting the threshold is a trade-off between the
reliability and radio resource utilisation.
Figure 3-1: Data duplication as network layer
The implemented data duplication algorithm in Mx-ART has the following steps:
1. First Round of Scheduling: In the first step the UEs are served through their primary cells.
Considering the link adaptation techniques and Hybrid Automatic Repeat Request (HARQ), a
constant target Bit Error Rate (BER) is assumed per service.
2. Mark Cell-Edge UEs: After completion of first round of scheduling, the cell-edge UEs are
marked for being served by the secondary cell(s).
3. Secondary Scheduling: upon availability of radio resources, the duplicated data for the cell-
edge UEs is served. It worth noting that the duplicated data is not considered in calculating the
UE’s throughput.
The data-duplication model implemented by Mx-ART facilitates the study of the impact of this enabler
on larger scale than undertaken in WP3. Given the BER for each link and the packet size, the BER is
translated to “Packet Drop Rate (PDR)”, i.e. number of packets dropped as the result of error(s) in the
received packet. Without loss of generality, the assumption is any packet received with an error is going
to be dropped. Hence, packet drop rate is a function of the target BER, packet size and number of radio
links assigned to serve the same data and it is calculated as per the following Equation [STI14].
𝑃𝐷𝑅 = [1 − (1 − 𝐵𝐸𝑅)𝑝]𝑛
Where:
• 𝑃𝐷𝑅: achieved packet drop rate (per UE),
• 𝐵𝐸𝑅: target BER,
• 𝑝: packet size in bits,
• 𝑛: Number of radio links established to serve the same data.
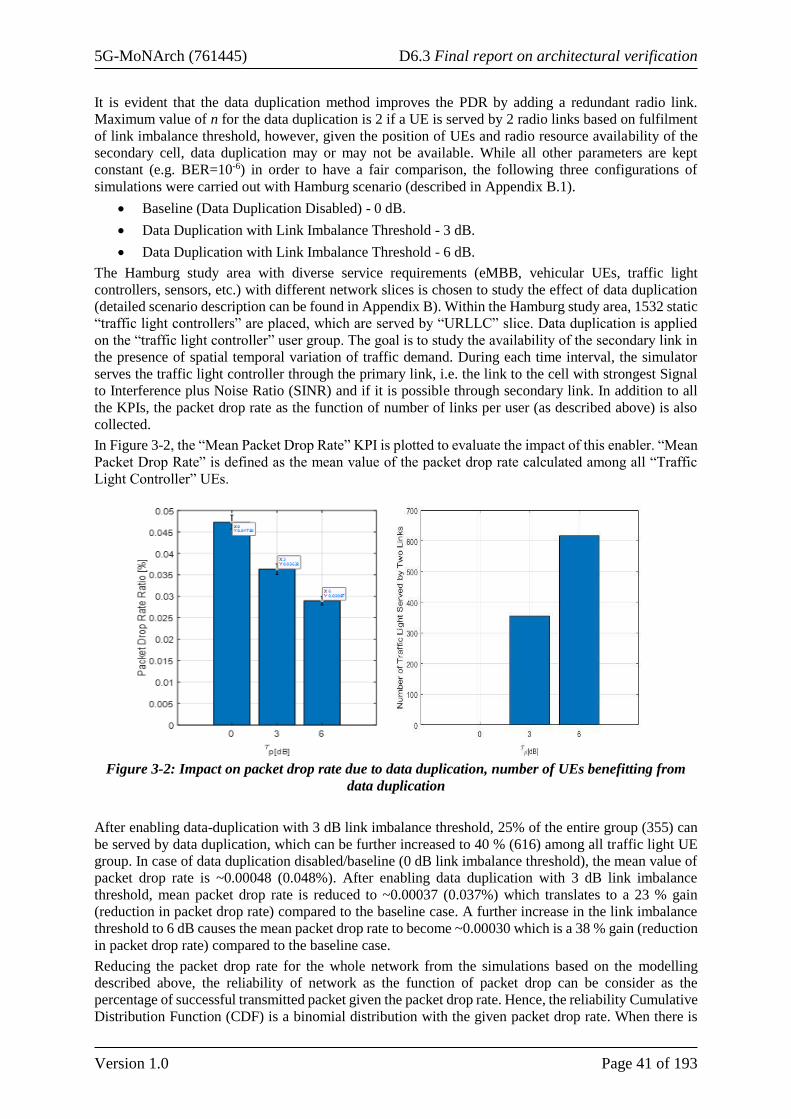
5G-MoNArch (761445) D6.3 Final report on architectural verification
Version 1.0 Page 41 of 193
It is evident that the data duplication method improves the PDR by adding a redundant radio link.
Maximum value of n for the data duplication is 2 if a UE is served by 2 radio links based on fulfilment
of link imbalance threshold, however, given the position of UEs and radio resource availability of the
secondary cell, data duplication may or may not be available. While all other parameters are kept
constant (e.g. BER=10-6) in order to have a fair comparison, the following three configurations of
simulations were carried out with Hamburg scenario (described in Appendix B.1).
• Baseline (Data Duplication Disabled) - 0 dB.
• Data Duplication with Link Imbalance Threshold - 3 dB.
• Data Duplication with Link Imbalance Threshold - 6 dB.
The Hamburg study area with diverse service requirements (eMBB, vehicular UEs, traffic light
controllers, sensors, etc.) with different network slices is chosen to study the effect of data duplication
(detailed scenario description can be found in Appendix B). Within the Hamburg study area, 1532 static
“traffic light controllers” are placed, which are served by “URLLC” slice. Data duplication is applied
on the “traffic light controller” user group. The goal is to study the availability of the secondary link in
the presence of spatial temporal variation of traffic demand. During each time interval, the simulator
serves the traffic light controller through the primary link, i.e. the link to the cell with strongest Signal
to Interference plus Noise Ratio (SINR) and if it is possible through secondary link. In addition to all
the KPIs, the packet drop rate as the function of number of links per user (as described above) is also
collected.
In Figure 3-2, the “Mean Packet Drop Rate” KPI is plotted to evaluate the impact of this enabler. “Mean
Packet Drop Rate” is defined as the mean value of the packet drop rate calculated among all “Traffic
Light Controller” UEs.
Figure 3-2: Impact on packet drop rate due to data duplication, number of UEs benefitting from
data duplication
After enabling data-duplication with 3 dB link imbalance threshold, 25% of the entire group (355) can
be served by data duplication, which can be further increased to 40 % (616) among all traffic light UE
group. In case of data duplication disabled/baseline (0 dB link imbalance threshold), the mean value of
packet drop rate is ~0.00048 (0.048%). After enabling data duplication with 3 dB link imbalance
threshold, mean packet drop rate is reduced to ~0.00037 (0.037%) which translates to a 23 % gain
(reduction in packet drop rate) compared to the baseline case. A further increase in the link imbalance
threshold to 6 dB causes the mean packet drop rate to become ~0.00030 which is a 38 % gain (reduction
in packet drop rate) compared to the baseline case.
Reducing the packet drop rate for the whole network from the simulations based on the modelling
described above, the reliability of network as the function of packet drop can be consider as the
percentage of successful transmitted packet given the packet drop rate. Hence, the reliability Cumulative
Distribution Function (CDF) is a binomial distribution with the given packet drop rate. When there is

5G-MoNArch (761445) D6.3 Final report on architectural verification
Version 1.0 Page 42 of 193
no packet duplication applied (i.e. the baseline case), the packet drop rate is equal to the value used in
the modelling. Enabling this innovation for all the users leads to very high reliability, however, as the
results from the simulations of a practical scenario shows, not all the UEs at all time can have a viable
second link. Thus, the network reliability becomes dependent on the number of UEs and the time
intervals, for which the UEs had data duplication enabled. The higher number of UE with data
duplication enabled, the higher network reliability is going to be achieved.
In Figure 3-3, the average RAN reliability (i.e. reliability of successful packet transmission) across the
entire study area is presented for the baseline case and the cases with 3 dB and 6 dB imbalance threshold.
By application of data duplication and MC, we can achieve theoretically a reliability of five nines,
however due to the limitations of the deployment scenario and the load conditions in the RAN, we can
achieve reliability improvement on average across all traffic light controller UEs from 99.952% to
99.97%.
Figure 3-3: Probability of successful packet transmission
With the example shown in this section, certain reliability gains are achievable by usage of data
duplication via multiple radio links. Gains within the total RAN coverage area are strongly diverging
dependent on the location of the UEs (cell centre, cell edge, overlapping area between 2 or more cells,
…) and the link quality of each involved link (line of sight (LOS), non-LOS, variability of received
signal strength, …). Regarding the absolute value achieved for RAN reliability in that example, it has
to be noted that the link adaptation for a single radio link was already selected in a way to provide a
highly reliable output, i.e. low Packet Error Rate (PER), as a suitable secondary radio leg could not be
guaranteed at each fixed location for the traffic light UEs. This has also some direct implications on
achievable additional gains via further radio legs.
To see the impact of different configuration parameters used for the Mx-ART evaluations a sensitivity
analysis has been additionally performed. An interested reader is referred to Appendix E.
From an MNO perspective, data duplication via MC is one interesting technical feature to increase the
reliability, but it must be seen together with other components. E.g. Ultra-Reliable (UR) or URLLC
services with extreme requirements will not be offered across a wide area RAN, but usually within
dedicated areas which may be an enterprise campus, a factory hall, some main streets, etc. To cover
such areas with high RAN reliability, further frequency layers and/or the deployment of new sites (macro
or small cells) or antenna sectors improving also the MC gains are feasible. This is also in line with
evaluations performed in WP3 on restricted area sizes (see Section 2.1.3.2 of [5GM-D32]). But finally,
the usage of those features is up to the service level agreements (SLAs) and business contracts an MNO
has with its B2B customers, i.e. it is related to dedicated scenarios and cannot simply be generalised.

5G-MoNArch (761445) D6.3 Final report on architectural verification
Version 1.0 Page 43 of 193
3.2.1.2 Telco-cloud reliability via network fault management
The trend of emerging softwarisation and cloudification in telecommunication networks is also visible
in the mobile radio part where RAN and CN processing functions may be orchestrated and operated in
different telco cloud sites. Whereas the virtualisation of CN NFs is already incorporated for 4th
Generation mobile wireless communication system (LTE, LTE-A) (4G) systems since several years –
now pushed to new dimensions with the 5G service based architecture (SBA) approach – , virtualisation
of RAN NFs is not yet the common practice, especially because of possible resource restrictions in edge
cloud sites and higher demands on fault management due to real time or near-real time processing needs
[5GM-D23] [5GM-D32] [5GM-D42].
Reliability of RAN in a virtualised environment Virtualised Radio Access Network (vRAN) has been
modelled in Mx-ART. We assume that all NFs are virtualised, e.g. Virtualised Physical Layer (vPHY),
Virtualised Media Access Control (vMAC), Virtualised Radio Link Control (vRLC), and grouped as a
VNF chain in such a way that one instance of VNF chain forms a virtual eNB/gNB. In order to study
the impact of computational resource, it is assumed that one VNF chain is deployed on one single core
Central Processing Unit (CPU).
In case of a failure, e.g. non-responsive storage unit, Random Access Memory (RAM) failure or power
outage, of a single instance, the following chain of events is assumed. In the upper part of Figure 3-4,
throughput has been plotted over time. It is evident that as soon as a fault happens, QoS/throughput
reduces to zero during the recovery interval. For future reference, time at which failure event happens
will be referred as tf. Total time taken by VNF to recover from failure will be referred as tr. Time at
which VNF chain again becomes healthy will be referred as th.
Figure 3-4: Modelling of VNF chain failure event
Recovery interval can be further subdivided into 5 sub-interval durations.
• Fault Detection Time (Δt1): Time taken by network management entities to detect fault with this
particular VNF chain.
• Load Balancing Time (Δt2): Time taken by network management entities to perform load
balancing among active instances.
• Instance Destroy Time (Δt3): Time taken by network management entities to destroy faulty
instance.
• Instance Orchestration Time (Δt4): Time taken by network management entities to orchestrate
a new VNF instance.

5G-MoNArch (761445) D6.3 Final report on architectural verification
Version 1.0 Page 44 of 193
• Instance Booting Time (Δt5): Time taken by network management entities to boot up a new
VNF instance.
Four reliability schemes have been modelled in Mx-ART and their impact and cost are studied. The
length of each of the intervals described above is heuristically assumed to be 0.2 s. However, the
practical values depend on many variables including the implementation, and the cloud providers’
configuration, in addition to the latency of the specific implemented monitoring and orchestration
software.
‘Active Only’ Scheme: ‘is dimensioned with no redundant VNF chain instances. If a cell estimated to
require N- parallel VNF chains (with an assumption that one VNF chain is capable to process all layers
of RAN protocol stack), this scheme provides only the required N parallel VNF chains. When the
computational load of the cell increases, a horizontal scaling approach is applied, which means
additional VNF chains are introduced and placed in parallel to perform the processing. Throughout this
work, it is assumed that each VNF chain can process the peak computational load (i.e. processing all the
PRBs with the highest Modulation Coding Scheme (MCS) Index) of 10 MHz bandwidth. For the larger
bandwidth, more VNF chains in parallel (i.e. horizontal scaling) are required. Figure 3-5 presents a case
of ‘Active Only’ system with N=2.
Figure 3-5: Mapping of PRBs to VNF chain
In case of normal operation, both VNF chains process equal amount of PRBs. When failure happens
with one of the VNF chains, the supported PRBs by this chain become unavailable. Consequently, the
cell capacity reduces to half during critical time (tc) characterised by tf<tc<tf+Δt1+ Δt2. After performing
load balancing, and before recovery of the failed VNF chain, the other chain can take over entire PRB
bandwidth. It worth noting that the extra imposed computational load should not violate real-time
constraints, hence, processing all the PRBs with maximum MCS index may not be practical during the
load balancing phase. This phase is referred to as moderate time /less critical time interval. tf+Δt1+
Δt2<tm< th, tries to minimise the effect of failure during the following recovery phases.
Considering a cell with bandwidth of 20 MHz (100 PRBs per Transmission Time Interval (TTI), 15 kHz
Orthogonal Frequency Division Multiplexing (OFDM) subcarrier spacing), first 50 PRBs are processed
by VNF A and the rest by VNF B. Due to strict real time requirements, mapping between PRBs to VNF
is performed hardcoded. If we assume that a failure event happens with VNF A; during critical time tc
all the terminals served by first 50 PRB experience loss in throughput regardless of load condition in
VNF B. During moderate time tm, after load balancing all 100 PRBs are processed by VNF B based on
amount of computational load available QoS reduction is calculated.
While achieving same availability and cost as “vertical scaling”, the “horizontal” scheme is expected to
offer graceful performance degradation during tm, unlike complete outage throughout recovery interval
in “vertical”.
‘Active Standby’ Scheme: In this scheme, a cell with peak computational load of estimated N units, N
parallel VNF chains are deployed in virtualised environment with M standby instances dedicated for
this cell. In this scheme, computational resources for N+M units have been consumed while only N VNF
instances are operating in parallel to process all loads. In this mode too, PRB processing is equally
divided among N instances.
As M instances are already available in standby mode, during an event of a failure, overall recovery
interval is reduced compared to ‘Active Only’ mode as Instance Destroy Time (Δt3) and Instance

5G-MoNArch (761445) D6.3 Final report on architectural verification
Version 1.0 Page 45 of 193
Orchestration Time (Δt4) becomes zero. Reduction in recovery time results in higher availability of a
cell compared to ‘Active Only’ mode.
‘Load Sharing’ Scheme: ‘Load sharing with N+M redundancy’ scheme works on the idea of over
provisioning VNFs and corresponding computational resources deployed simultaneously to process all
PRBs across cell bandwidth. Converging to the terminology of the previous scheme, a cell with
estimated peak computational load of N units, N+M VNFs are serving to the cell across all PRBs
simultaneously. In this mode during healthy state and even in peak load condition each VNF chain has
over provisioned computational resources, hence reducing the probability of outage during faulty state.
In event of a failure at tf, cell capacity reduces due to one VNF chain becoming unavailable to serve
during next tc time (tf<tc<tf+Δt1+Δt2). However, reduction in QoS during tc is relatively lesser compared
to previous cases due to the over provisioning. During moderate time tm, all PRBs are served by N+M-
Number_of_faulty VNF chains which can lead to QoS reduction close to zero and user experience
becomes as good as healthy state in previous two approaches. After recovery time, faulty VNF chains
are brought back to the processing and reducing the computational load per VNF chains even further
down at the cost of over provisioning of resources.
‘Active Active’ scheme: In this scheme for a cell with peak computational load of estimated N units,
2N VNFs are allocated to handle the processing load such that two VNFs process identical load. In the
case of failure of one VNF its load is processed by a dedicated redundant replica which is in active state
and runs in parallel. This is the most cost intensive scheme among all the schemes presented so far.
In the case of failure, critical time is reduced even further down as load balancing is not required in this
scheme, yields tc= Δt1. During moderate time, all VNF chains are working fully functional without any
reduction in QoS. Hence total recovery interval for this scheme is equal to fault detection time Δt1. It
should be highlighted that ‘Active Active’ is expected to be the most reliable scheme among all the
reliability schemes presented in this deliverable at the cost of higher operating expenditure, which may
limit their deployment to safety critical applications only.
Regardless of the redundancy scheme, the following joint radio and computational resource
management algorithm, see Figure 3-6, is implemented in Mx-ART.
1 FOR loop over all UEs
2 Identify the traffic demand.
3 Estimate the required radio resources based on channel quality
4 IF radio resources are available in the pool
5 Allocate the corresponding radio resources to UE.
6 Estimate computational resources
7 IF computational resources are available in the pool
8 Serve the UE and calculate throughput.
9 Jump to the next UE.
10 ELSE
11 Estimate the lost throughput
12 ELSE
13 Jump to next UE.
Figure 3-6: Pseudo-code for joint resource management algorithm
Due to the statistical properties of time failures, it would be required to extend the simulation time over
a month in order to achieve a fair comparison among the four schemes. As the baseline Hamburg
scenario requires a significantly high amount of resources, it is not suitable for this use case. Hence a
downscaled simplified synthetic scenario is created for analysis of redundancy schemes. Theoretically
all the four schemes presented here are scalable, and we foresee to achieve the same gain in Hamburg
scenario as well. Details of the scenario can be found in Appendix E.
Allocated computational resources per scheme are listed in Table 3-2.

5G-MoNArch (761445) D6.3 Final report on architectural verification
Version 1.0 Page 46 of 193
Table 3-2: Computational resource allocation per cell
Redundancy Scheme Active Instances Standby Instances
Active Only 2 0
Active Standby 2 1
Load Sharing 3 0
Active Active 4 0
Regardless of the redundancy scheme, “Availability” KPI is introduced defined as the ratio of time that
a given system is providing the expected output to the total observation period. Average availability for
all four schemes is presented in Figure 3-7.
Figure 3-7: Comparison of redundancy schemes
In conclusion, the ‘Active Only’ scheme, which can be considered as a baseline reference scheme as
there are no redundant resources dimensioned, achieves the availability of three nines (~equivalent
downtime=526 minutes per year) for the aforementioned scenario. By gradual placement of additional
redundant resources as per schemes ‘Active Standby’ and ‘Load Sharing’, availability value increases
proportionally. Finally, with ‘Active Active’ scheme which dimensions the highest level of the
availability, we can achieve the availability of four nines (~equivalent downtime=52.60 minutes per
year) which is a significant gain by a factor of 10 compared to the baseline scheme.
To see the impact of different configuration parameters used for the Mx-ART evaluations on telco cloud
reliability a sensitivity analysis has been additionally performed. An interested reader is referred to
Appendix E.
3.2.1.3 Conclusions on E2E reliability
In Sections 3.2.1.1 and 3.2.1.2 results on achievable reliability for the RAN under consideration of data
duplication via MC (related to the URLLC slice in EC1) and usage of a vRAN approach with different
redundancy schemes for a telco edge cloud implementation were presented.
This does not fully address the total E2E reliability listed as one of the target KPIs of 5G-MoNArch.
Figure 3-8 shows a simplified 5GS block diagram [3GPP-23501] which includes the main parts to be
considered for the computation of the E2E reliability (see also Figure 2-6). In addition to the RAN
reliability covered in the figure by the blocks RAN (inclusive of the radio link(s) to the UEs on the left-
hand side) and edge cloud, the reliability of the central cloud(s) as well as of the TNs in between the
RAN and cloud sites has to be incorporated.

5G-MoNArch (761445) D6.3 Final report on architectural verification
Version 1.0 Page 47 of 193
Figure 3-8: Simplified 5GS block diagram
Those TNs may be differentiated according to the sites they interconnect:
• The xhaul part addresses the interconnection between edge cloud sites and antenna sites. The
term ‘xhaul’ stands for fronthaul, midhaul, or backhaul, dependent on the RAN protocol layer
split applied for deployment. In 5G-MoNArch evaluations in WP6 only fronthaul is considered
due to underlying vRAN approach which all radio function processing except of RF in the edge
cloud servers. In that case the xhaul interface is usually based on CPRI [Cpr15] or eCPRI
[Cpr17] or derivatives of it like the xRAN/O-RAN Lower Layer Split (LLS) [xRAN18]
[ORAN]. ‘midhaul’ is a synonym for the F1 interface according to 3GPP’s CU-DU split
(Central Unit/Distributed Unit), also called Higher Layer Split (HLS) with PDCP processing in
the CU at the edge cloud and lower layer processing in the DU at the antenna sites [3GPP-
38470]. With ‘backhaul’, usually the interconnection from “classical” distributed Base Stations
(BSs) (D-RAN) to aggregation points of the Wide Area Network (WAN) or directly to CN sites
is indicated.
• Typically, a WAN is used in MNO’s networks to interconnect the edge cloud and the central
cloud sites as well as the central cloud sites with each other. Dependent on MNO, the WAN is
implemented as mesh or ring network based on highly performant fibre infrastructure. Mesh or
ring structures are often also used for interconnecting neighbouring edge clouds with each other.
The total E2E reliability is the product of the reliability of the different parts of the network elements
(NEs) involved in the E2E chain [MLA12], i.e.
RE2E = RRAN * Rxhaul * REdgeCloud * RWAN * RCentralCloud
To keep an E2E reliability of 4 or 5 nines all elements in the chain must provide at least the same or
higher reliability than the target value. Usually, central clouds elements intended for 5G usage as well
as the corresponding WAN are set up with corresponding resilience schemes, so achieving very high
reliability values near 100% and therefore can be ignored. This has a similar impact on the E2E
reliability as for locally performed applications where the related application functions are shifted to the
edge cloud. In that case both E2E reliability and E2E latency KPIs are impacted at the same time.
Therefore, the main factors for E2E reliability are the RAN link reliability, the RAN processing
reliability in the edge clouds, and the xhaul reliability which must be adjusted during network set-up
and slice orchestration to keep the target value. Taken the results from Section 3.2.1.1 and 3.2.1.2 into
account (best case, i.e. RRAN = 99.97% and REdgeCloud= 99.993%) and assuming Rxhaul = 99.5% for single
fibre links between edge cloud and antenna sites the resulting E2E reliability would be 99.46%, i.e. still
below the target KPI value.
To enhance the reliability, the following tools and features are primarily available (non-exhaustive list;
e.g. general HW/SW technology improvements are not mentioned):
• RAN (link) reliability:
o Usage of UR(LLC) MCS schemes (specified even for single radio links by 3GPP for
New Radio (NR) in Rel-15) [3GPP-38];
o Application of Beamforming/Massive-MIMO – Distributed MIMO (Coordinated
Multipoint Transmission (CoMP)) (especially interesting UR service provisioning in
smaller areas, e.g. in a factory hall or enterprise campus in combination with higher
frequencies) [QC18];
o Antenna site densification;

5G-MoNArch (761445) D6.3 Final report on architectural verification
Version 1.0 Page 48 of 193
o Data duplication via MC (using the same or additional frequency layers; eventually in
combination with extension of cell overlap areas by antenna tilt adaptation or advanced
antenna systems; see Section 3.2.1.1 and [5GM-D32]);
o QoS-based intra-/inter-slice prioritisation of data packets of UR(LLC) services (see
Chapter 4 and [5GM-42]).
• Edge cloud reliability (also valid for central clouds; see Section 3.2.1.2 and [5GM-D32]):
o Increased amount of processing power within and across edge cloud sites;
o Resilience schemes for cloud processing functions in combination with fast fault
detection and function regeneration (re-orchestration of VNFs within the same, but also
across edge cloud sites).
• Xhaul reliability [NGMN-5GX]:
o Provisioning of resilience via increased number of parallel or meshed links connecting
edge cloud and antenna sites.
Based on the given tools and features an MNO can adjust the network in a way that the E2E reliability
target value is fulfilled. But the gain achievable with most of those features is strongly correlated with
increased cost factors (CAPEX and/or OPerational EXpenditure (OPEX)). Therefore, there is always a
trade-off between wanted/achievable reliability and economic viability for UR(LLC) services.
Delivering such services to local areas like an enterprise or industrial campus is much more effective
than providing such a service over a wide area (see the example for the traffic lights in Section 3.2.1.1).
For EC1 the results of related techno-economic evaluations are provided in Section 3.3.
3.2.2 E2E latency
The resulting E2E latency in the network is an important parameter to assess the final QoE for offered
services. The SSP services addressed in EC1 do not demand extreme values below 1 msec, as may occur
in industrial automation, but rather they focus on reliability. The lowest values required are 10 msec for
the AR service for port management and maintenance and the same for control of AGVs in the container
terminals [5GM-D62]; see also Appendix A.2 for more details.
As latency verification is not supported by the tools applied in WP6, the achievable latency was analysed
based on the deployed infrastructure in the Hamburg study area. A more generalised evaluation taken
as a basis for that has been performed e.g. by NGMN in [NGMN-5GX]. In Figure 2-7 the locations of
the antenna sites and the edge cloud sites of the study area are already depicted. According to the
assumption that an antenna site is connected to the edge cloud in the marked area to which the antenna
sites belong, the maximum distance that is covered by fibre cable connections is for 90% of all cases
below 3 km; just for 2 antenna sites a longer distance of up to about 6.3 km is given (see Figure 3-9
regarding the cumulative distribution of fibre length).
Figure 3-9: CDF of fibre length between antenna and edge cloud sites in the Hamburg study area

5G-MoNArch (761445) D6.3 Final report on architectural verification
Version 1.0 Page 49 of 193
With the optical signal speed of 200,000 km/s on the fibre links, the one-way propagation delay is 5
µs/km. This means for the Hamburg set-up that even in the worst case the latency between antenna and
edge cloud sites is less than about 40 µs (includes 10 µs margin as in real installation the fibre length
may be somewhat higher).
In a typical MNO deployment scenario several CN sites are placed across a country, resulting roughly
in an average maximum distance of about 100 km between a central cloud site hosting CN VNFs and
an edge cloud site. Based on previous assumptions this corresponds to a worst-case propagation delay
of about 500 µs. A processing delay of network nodes like switches or routers can be considered by
maximum 100 µs per node.
The E2E latency will be strongly affected by the placement of application VNFs for the related services.
In the study area evaluations, the application VNFs may be hosted at the central clouds or alternatively
for services with special reliability or latency requirements at an edge cloud, e.g. for SSP services the
edge cloud near the harbour area may be used (see also the slice set-up described in Section 2.5.3). To
realise such a local breakout, some CN functionalities, at least the User Plane Functions (UPFs), have
to be shifted to the edge cloud.
3GPP has performed a self-evaluation study for Long Term Evolution (LTE) and NR as members of the
5G air interface family in Rel-15 [3GPP-37910], see Table 3-3. An initial version with results was
submitted to ITU-R in the framework of the International Mobile Telecommunications (IMT)-2020
recommendation process. The results also cover the air interface delay which was considered for the
analysis. As the UP latency results (including also processing time) strongly vary with different
configurations of air interface signal parameters (OFDM subcarrier spacing, frame structure, etc.) and,
in case of NR, of UE capabilities, ranges only are given in Table 3-3 (note: it is assumed that the UE
was in RRC_Connected mode).
Table 3-3: Extract of NR and LTE air interface UP latencies [3GPP-37910]
Air interface UE capability Subcarrier spacing UP latency
NR Frequency Division Duplex
(FDD)
UE capability 1
15 kHz 0.96 - 2.44 msec
30 kHz 0.55 - 1.30 msec
60 kHz 0.44 - 0.84 msec
120 kHz 0.28 - 0.51 msec
UE capability 2
15 kHz 0.52 - 2.01 msec
30 kHz 0.30 - 1.06 msec
60 kHz 0.24 - 0.63 msec
NR Time Division Duplex (TDD)
(DDDSU frame)
UE capability 1
15 kHz 1.28 - 2.78 msec
30 kHz 0.65 - 1.46 msec
60 kHz 0.48 - 0.93 msec
UE capability 2
15 kHz 0.66 - 2.37 msec
30 kHz 0.39 - 1.06 msec
60 kHz 0.27 - 0.70 msec
LTE FDD 15 kHz 0.63 - 2.58 msec
LTE TDD 15 kHz 2.00 - 3.01 msec
Compared to former releases of 3GPP the UP latency has been strongly reduced, also for LTE, taking
care of features like short TTIs, mini slots and grant-free access [3GPP-38].
Taking the different latency values for the network parts/elements together the following conclusions
could be drawn:
• In case of hosting application functions locally at an edge cloud and selecting the 5G air
interface parameters in a proper way E2E network latencies (one way) below the target KPI
value of 5 msec are achievable.

5G-MoNArch (761445) D6.3 Final report on architectural verification
Version 1.0 Page 50 of 193
• Going below 1 msec is only feasible when application and radio processing are near the antenna
sites, which could make sense e.g. for a factory hall, an enterprise campus or a stadium where
dedicated infrastructure may be deployed.
• For services without strong latency restrictions hosting applications in the central cloud should
be viable without remarkable degradation of the QoE.
Apart from the analysis presented here, E2E latency has been measured in both testbeds. A summary of
corresponding results is given in Section 6.1; more details can be found in [5GM-D52].
3.2.3 Security
5G-MoNArch proposes and implements various reliable and resilient mechanisms. However, these
mechanisms become less effective without proper management of security. The unobstructed operation
of the 5G infrastructure is threatened by numerous different security incidents and malicious attackers.
Countering these threats in an effective manner becomes even more important in the case of critical
services with strict reliability and resilience requirements.
In WP3 [5GM-D32], the use of STZ was proposed and implemented, i.e. logical areas of infrastructure
and services where a certain level of security and trust is required. These are deployed using STZ
templates, which describe the list of security services and infrastructure elements that need to be
provisioned, as well as the default configurations to ensure that a particular level of security and trust is
achieved. Additionally, mechanisms based on machine learning (ML) and artificial intelligence (AI)
where developed, to identify security threats in an effective manner along with a list of mitigation actions
and their estimated cost for the different types of threats.
In order to verify the approach concerning security, a simulation campaign was performed by WP3.
Covering security is out of scope for the network level simulator used to verify 5G-MoNArch enablers.
However, the WP3 simulations were based on characteristics of the Hamburg SSP testbed, in terms of
both infrastructure and service requirements and thus are closely linked to EC1. It follows that the results
presented aim to identify risks and threats that may affect day-to-day operations and compromise the
data flow or information security in the industrial context of the SSP.
Three network slices were simulated: a) a slice that handled traffic light control with one STZ, b) a slice
that hosted an application used for personnel training with AR with one STZ and c) a slice used for the
deployment of Internet of Things (IoT) sensors mounted on three moving barges, with on STZ assigned
to each barge. More details are available in [5GM-D31, 5GM-D32]. The main KPIs results concerning
security are presented in Table 3-4.
Table 3-4: Security results and KPIs concerning relevant enablers presented by WP3
Enabler name KPI Name Verification
Type Results
STZs manager
Security failure
isolation – Number of
STZs protected &
STZ isolation
Qualitative
Multiple STZs can be deployed in a
slice. Attacks triggered against assets
of different STZs produce different
alerts without mixing events.
Security threat
monitoring, Security
threat detection
Security threat
identification Qualitative
7 security probes where used; 11
types of attack where simulated and
detected*
Security threat detection:
network behaviour
analysis module)
Security threat
identification Quantitative
97.47% of events where correctly
detected**
Security threat reaction Threat response time Quantitative
An average response time of 280
msec was achieved for a batch of
events occurring at different paces
*a list of the different attacks and the probes uses is available in Appendix C
**The network behaviour analysis module results reported, use a larger network traffic dataset for model
training and verification

5G-MoNArch (761445) D6.3 Final report on architectural verification
Version 1.0 Page 51 of 193
3.2.4 Comparison of WP3 verification results with WP6 wider area simulation
results
WP3 of 5G-MoNArch focused in the development and evaluation of enablers that covered three topics:
RAN reliability, telco cloud resilience, and security. In WP6 network level simulations, the first two
topics where investigated and in the following sections the results of the two WPs are compared and
discussed.
3.2.4.1 Comparison against WP3 conclusions for RAN reliability
WP3 has considered three approaches to increase the reliability of a RAN. The first one is data
duplication, which involves the redundant transmission of duplicate packets over the radio, by means of
transmitting the same message via two transmitting nodes, resulting in a reduced packet error
probability. The second approach is NC with multicasting. NC can be an alternative to the Automatic
Repeat Request (ARQ) approach: In legacy communication systems, the sender of a packet waits for a
negative acknowledgement by the receiver to initiate potentially required retransmissions that
compensate errors. Instead, the NC encoder continuously generates linear combinations of subsets of
the source data packet [5GM-D31]. The third approach is a process combining the two techniques noted
before.
In [5GM-D32] macro diversity via data duplication and NC are evaluated, through both analysis and
numerical simulations, demonstrating their ability to provide sufficient levels of RAN reliability. These
two techniques reflect the set of functionalities applied at the RAN for increasing the reliability levels,
i.e. for ensuring a larger percentage of transmitted packets which is flawlessly delivered at the target
device within a given amount of time.
In contrast to data duplication, NC is a broad concept, which can be utilised in different ways. In 5G-
MoNArch it is shown how it can be applied a) to send re-transmissions with an increased efficiency,
which can then be converted into increased reliability and b) be used in a similar manner as data
duplication (i.e. to reduce the packet error probability by adding redundancy).
Furthermore, capitalising on the fact that NC has the overall potential to achieve improved reliability
levels by proper combination of data packets, while data duplication can outperform NC under certain
assumptions on latency, a hybrid approach between data duplication and NC was presented in [5GM-
D32]. The achieved reliability level outperforms the performance of data duplication and NC, when
these techniques are used individually. The main KPI outputs of these enablers taken from [5GM-D32]
are presented in Table 3-5.
Table 3-5: RAN reliability results and KPIs concerning MC enablers presented by WP3
Enabler name KPI results presented in WP3 RAN Reliability
Data duplication as
RAN reliability
approach -Section 2.1
of [5GM-D32]
Packet loss, throughput overhead,
application layer latency
99.999%, for a specific scenario examining a
limited area with a low network load
NC based multicasting
approach - Section 2.2
of [5GM-D32]
Latency vs Signal to Noise Ratio
(SNR) of chase combining and
incremental redundancy
retransmission schemes
Up to 18% less resource consumption in terms
of packets achieved by less re-transmissions to
obtain the same level of RAN reliability as
when using a conventional multicast approach
Hybrid data duplication
/ NC approach - Section
2.3 of [5GM-D32]
Latency vs PER for different
lower layer link performances
and traffic types
99.999% with 1 msec latency using a URLLC
air interface [PPM18] and a bursty traffic
model
As already explained in Section 3.2.1.1 WP6 has focused on data duplication with MC as this enabler is
most relevant based on standardisation impact (specified as part of 3GPP Rel-15 [3GPP-38]). WP6’s
wide area evaluation based on existing sites in the Hamburg study area has demonstrated that RAN
reliability levels in the range of 5 nines are difficult to fulfil across the whole coverage area without

5G-MoNArch (761445) D6.3 Final report on architectural verification
Version 1.0 Page 52 of 193
further network extensions. This is in line with WP3 evaluations which achieved extremely high
reliability levels only in restricted, i.e. size limited, areas as such as an enterprise campus.
For the other 2 NC-based approaches WP3 results just addressed the resulting link level reliability, i.e.
they are not directly comparable to results achieved for data duplication with MC in WP3 and WP6. The
feasibility of the NC-based approaches in the 3GPP NR radio interface requires further specification
effort. If both implementation overheads and performance enhancements are finally in a good shape, an
inclusion in Rel-17+ specifications related to Industrial IoT might be possible.
3.2.4.2 Comparison against WP3 conclusions for telco cloud reliability
For telco cloud resilience, WP3 considered the following approaches for increasing the robustness of
the telco cloud:
• Root cause identification of faults in a sliced network environment and applying redundant
resources to ensure the telco cloud availability and increase the cloud robustness,
• Enhanced CP resiliency by means of controller scalability and context-aware VNF migration,
• 5G Islands, a concept for selective VNF migration by means to balance the resilience and OPEX
in terms of the trade-off between the costs of VNF migration and outage.
WP3 investigated the concepts of availability and resilience of telco clouds which may cover both the
central and edge cloud domains in a more generalised way, treating the concept of resilience not only
for RAN-specific processing in the edge cloud as it was in focus of WP6 evaluations. Main KPI outputs
of these enablers are presented in Table 3-6.
Table 3-6: Reliability results and KPIs concerning telco cloud resilience enablers presented by WP3
Enabler name KPI results presented
in WP3 Telco Cloud Availability
Root cause identification of
faults and application of
redundancy for higher
availability at telco cloud -
Section 3.1 of [5GM-D32]
Telco cloud availability
vs single network
components for
different redundancy
schemes
Up to 99,999% depending to redundant resources
allocated
Augmented resilience via
increased controller
scalability - Section 3.2 of
[5GM-D32]
Resiliency and
Scalability
Experiments with different SDN controllers
achieved enhanced controller availability via
performance improvement of various controller
frameworks by auto-scaling and better support of
load balancing
5G Islands: Migration cost
and outage loss for context-
aware NF migration -
Section 3.3 of [5GM-D32]
Migration cost, outage
loss
Depending on the precision of outage probability
estimation and VNF migration cost, 5G Islands can
achieve up to 99.999% reliability with a migration
cost reduction by over 50%. In another non-
URLLC sample scenario, outage loss is reduced to
a level of 0.1% with a minimised migration cost of
below 10%
The approach applied by WP6 is primarily based on the first enabler of WP3 taking care of the different
redundancy schemes for cloud resources and fault management for VNFs as described in [5GM-D32].
Results provided by WP3 for the 3 enablers are not directly comparable to those of WP6 due to
underlying scenarios and use cases. Nevertheless, there is a general trend that high reliability levels are
achievable with corresponding cloud implementations. In contrast to classical HW-based NEs the use
of VNFs in combination with suitable redundancy schemes in a cloud environment reduces drastically
the mean time to repair (MTTR) and therefore increases availability and reliability. Finally, there is also
a trade-off between achievable reliability level and cost for implemented redundancy which must be
considered in the business consultations between the involved parties (MNO, tenant, cloud provider,
etc.). The techno-economic evaluations performed in WP6 with CAPisce incorporated corresponding
cloud redundancy dimensioning rules in view of reliability levels.

5G-MoNArch (761445) D6.3 Final report on architectural verification
Version 1.0 Page 53 of 193
3.3 Commercial verification
This section describes the techno-economic analysis of EC1. As with all evaluation cases, this is set in
the Hamburg verification scenario described in Section 2.3. We consider the business case of an existing
provider of MBB services in this area engaging with industrial users in the port area and providing
higher reliability wireless connectivity to them to support their operations. This assessment is performed
over a 2020 to 2030 time period. This allows the network investment and pay back profile over time to
be observed rather than taking a short-term snapshot which is unlikely to reveal the full business case
implications.
The following analysis steps are presented in this section:
• Definition of the services targeted and their anticipated demand over time.
• An assessment of mobile revenues for the baseline consumer focused MBB network and the
opportunity for incremental revenues beyond these from expanding the network to deliver
industrial sea port services.
• An assessment of:
o Costs for the baseline consumer focused MBB network
o Incremental costs to expand the network to deliver industrial sea port services both with
and without the 5G-MoNArch reliability and security innovations.
• Combining of revenues and costs from the above two stages to assess business case.
• A sensitivity analysis of the impact of assumptions on the specification of the baseline MBB
network and infrastructure ownership on the business case.
3.3.1 Services targeted in EC1 and their anticipated demand
3.3.1.1 Baseline demand assumed for consumer-focused MBB services
To derive the configuration and hence cost of an existing typical mobile network in the Hamburg area
and how this will likely evolve over time we have reviewed both historical and future forecasts of eMBB
demand. Given that the growth of MBB data is inherently challenging to forecast we have considered
three different scenarios as shown in Figure 3-10. These are:
• A low growth scenario with modest initial year on year growth rates of 20% which slowly
reduce over time.
• A high growth scenario which follows Cisco VNI [Cis18] forecasts where available to 2022 and
then applies an initial 30% year on year growth rate which reduces over time.
• A medium scenario which takes the average growth rate of the low and high scenarios
All three scenarios are aligned in 2017 with the demand levels reported for Germany in the June 2018
Cisco VNI [Cis18].
Figure 3-10: eMBB low, medium and high demand forecasts assumed (left) and 2020 to 2030
growth rate for each of these three scenarios (right)
Using the same methodology as used for London in 5G NORMA [5GN-D23], these eMBB demand
forecasts are used to derive busy hour outdoor traffic for MBB networks in the Hamburg study area by:

5G-MoNArch (761445) D6.3 Final report on architectural verification
Version 1.0 Page 54 of 193
• Adjusting national demand to study area demand based on the daytime population (i.e.
residential population with an uplift for commuters and visitors)
• Distributing demand between indoors and outdoors and over different days of the week and the
24 hours of the day
• Distributing the demand spatially to allow for denser demand around points of interest
3.3.1.2 Industrial sea port services considered and their demand profiles
As described in Section 3.1, under EC1 we consider the case of an existing provider of eMBB services
in the Hamburg study area enhancing their network to be able to offer the following services to the port
authority and other industrial users in the port area.
• ITS (temporary connected construction traffic lights and wireless CCTV for traffic monitoring)
• Automation of container handling in the port’s container terminals
• AR for construction projects and maintenance
Asset tracking was also considered and although there is potentially additional value arising from the
monitoring of shipping containers, the market for these projects is not sufficiently well developed for
use to quantify potential benefits. Further analysis of asset tracking is provided in the appendices in
D.2.4.
There is also a strong requirement outside of peak periods for environmental sensors throughout the port
area, however since this application is most likely to generate public benefits across the city of Hamburg
it has been addressed in the revenue and benefits assessment of EC3.
Figure 3-11: Daily downlink (DL) outdoor demand generated for port services (left) and compared
against eMBB demand (right)
Figure 3-11 gives an overview of the daily demand generated by EC1 services. This is based on:
• Daily demand per device and device volumes as per Deliverable D6.2 [5GM-D62] which have
been reviewed and updated in line with discussions with HPA.
• Service uptake as follows:
o Port ITS is deployed across all construction traffic lights from 2020
o AR is introduced with a low number of user devices initially which grows to 30 active
devices by 2025
o Staggered automation across the container terminals as follows1: Eurogate terminal
starting from 2022, Burchardkai terminal starting from 2023, and Tollerort terminal
starting from 2025
1 These are hypothetical dates for automation to allow benefits and cost assessment for the purposes of this project and do not
reflect actual plans of specific container terminals

5G-MoNArch (761445) D6.3 Final report on architectural verification
Version 1.0 Page 55 of 193
3.3.2 Revenues assessment
3.3.2.1 Baseline eMBB network revenues
In our analysis of revenues for the existing eMBB network we assume that the network has three main
segments or types of users with each corresponding to different data plans or service agreements with
the MSP. We define the following segments:
• Basic Needs – having a service that covers the minimum necessary to be able to participate and
communicate online in society is the key driver for this segment. Customers are either
constrained from purchasing better packages by low income or being less interested than
average in social media and online services. High quality video (and related video-on-demand
services) and AR are seen as non-essential or luxuries;
• Standard – having good quality connectivity and coverage for a variety of everyday online uses
including social media, good quality video and AR experiences, information etc. is important
to this segment;
• High Performance – high quality streaming video-on-demand (SVOD) and AR, and/or high-
quality gaming are important to this segment.
We assume that the mix of users on the network will drive the volume of demand seen on the network.
Hence, we assume that our high demand forecast corresponds to a network with a higher percentage of
High-performance users compared to our low demand forecast. Further details of the eMBB revenue
assessment is given in Appendix D.1. The resulting revenues forecast to 2030 are given in Figure 3-12
and show limited scope for growth in eMBB revenues even in the high scenario due to limits on
willingness to pay and competition in the German mobile market2.
Figure 3-12: eMBB low, medium and high revenues forecastMSP with 33% market share
3.3.2.2 Port services - economic and operational benefits
Appendix D.2 details the approach to the economic and operations benefits modelling applied under
EC1. Here we briefly summarise results from this analysis for each of the EC1 port services. This
benefits assessment helps assess an upper bound on willingness to pay and hence potential revenues that
an MSP might anticipate from delivering such a service. This conversion from economic benefits to
revenues is given later in this section
Intelligent Transport Systems (ITS)
The road network in the Hamburg port area comprises 140 km of roads. In 2017, 4.3 million trucks
entered the port’s main road network, a total of 44 million truck kilometres were travelled in the port
area and 3.1 million of the 8.8 million Twenty-foot Equivalent Units (TEU) containers handled annually
2 Note that in the appendices in section D.1, further details are given on how we have forecast eMBB ARPUs based on existing mobile tariffs in Germany and publicly available surveys of willingness to pay for 5G.

5G-MoNArch (761445) D6.3 Final report on architectural verification
Version 1.0 Page 56 of 193
by the port were freighted by truck to the hinterland [HPA17].3 A further 19.5 million cars entered the
port’s main road network and 117 million car kilometres were travelled. On the busy Köhlbrandbrücke
road between the eastern and western areas of the port, around 12,000 cars and 7,000 trucks travelled in
each direction each day. Delays on the road network totalled 900 congestion (traffic jam) hours in 2017
which were a result of accidents and general congestion as well as restrictions around HPA construction
works. The 900 congestion hours in 2017 is a substantial reduction from the 1700 congestion hours
experienced across the port in 2015 and 2016 [HPA16a]. The reduction was largely due to the
completion of road works on the Köhlbrandbrücke in 2016 showing the impact that construction work
in the port area can have on congestion levels. We note that the HPA is currently considering options
for a new Köhlbrand crossing to replace the Köhlbrandbrücke bridge [HPA19]. A decision on whether
this will be a bridge or tunnel is due in 2019 and the new crossing is to be completed by 2030. In view
of the considerable traffic disruption this is likely to cause, we have considered that the congestion levels
experienced in 2015/2016 are more representative of traffic conditions over the period of analysis.
To support an enhanced traffic control system, HPA would need to install secure CCTV cameras (to
monitor traffic levels) and temporary traffic lights at key locations in the port area so that traffic flow
can be optimised around areas where construction work is being undertaken. Using the 5G-MoNArch
technology, the HPA could locate CCTV cameras, traffic count sensors and traffic lights more flexibly
and enhance traffic flow by scheduling road and rail traffic according to the current traffic conditions.
5G-MoNArch technology is an enabling technology that would provide the flexibility in geographical
placement and configuration for such enhancements.
To understand the maximum willingness to pay for wireless services supporting ITS in the port area, we
assess the operational and economic benefits of reducing the above reported congestion times in the port
area. These are assessed in terms of:
• Reduction in congestion and the value of driver time saved
• Reduced road freight times and stock holdings
• Reduced CO2 emissions due to reduced congestion
Table 3-7 presents the resulting economic benefits in each of these three areas (the methodology behind
is given in Appendix D.2.1). This shows that the economic benefits of stock reduction and reducing
carbon dioxide (CO2) emissions are very small compared to those arising from reducing driver delays
and journey times for freight. We also include in Table 3-7 the costs for 5G end user devices as would
need to be installed in the CCTV cameras and traffic lights and would be borne by the port authority.
Table 3-7: Potential economic benefits arising from traffic control: M€
2020 2021 202 2023 2024 2025 2026 2027 2028 2029 2030
Value of savings
in driver time 2.432 2.580 2.737 2.903 3.080 3.268 3.467 3.678 3.903 4.141 4.394
Value of reduced
freight times and
stock reduction
0.102 0.107 0.112 0.118 0.124 0.131 0.137 0.144 0.152 0.160 0.168
Value of reduced
CO2 emissions 0.125 0.132 0.140 0.148 0.157 0.166 0.176 0.187 0.198 0.210 0.223
Cost of 5G end
user devices 0.443 0.040 0.040 0.040 0.040 0.040 0.040 0.040 0.040 0.040 0.040
Net economic
benefits 2.22 2.78 2.95 3.13 3.32 3.52 3.74 3.97 4.21 4.47 4.74
Net Present
Value (NPV) 21.7
3 The remaining 5.7 million TEU were transported by rail (2.4 million TEU), transhipped (3.2 million TEU) or transported by
inland waterway (0.1 million TEU).

5G-MoNArch (761445) D6.3 Final report on architectural verification
Version 1.0 Page 57 of 193
We have assumed that the volume of trucks using the port’s roads will increase in proportion to the
average volume of containerised freight using the port (5.1% per year). Therefore, the number of truck
hours of delay will increase by the same proportion. We anticipate that the volume of cars using the port
will also increase and we have assumed the growth between 2016 and 2017 to be representative of this
growth between 2020 and 2030. Similarly, we assume that the value of delayed goods will increase by
the same proportion.
The NPV in 2020 arising from 5G-MoNArch supported traffic control is estimated to be €21.7m taking
account of the three sources of value4.
Automated container handling
Port automation is increasing in international ports; a 2018 McKinsey report estimates that expenditure
on port automation systems over the last 10 years has been $10bn and is expected to be $10-15bn over
the next 5 years [MK18a]. This growth in automation is primarily driven by increased use of standard
TEU containers, the handling of which may be readily automated. Worldwide containerised cargo has
increased by 5.1% AGR over the last 7 years [UNCTD18]. More than half of cargo (66% by tonnage)
handled by the Port of Hamburg is containerised at 8.7 million TEU/year, of which approximately 13%
are empty containers. If the Port of Hamburg follows the worldwide growth trend, then total container
volume handled by the port is likely to grow to 16 million TEU/year by the end of 2030. To
accommodate this larger volume the throughput of existing container terminals must increase, and this
is a major driver for increased port automation.
A second driver for port automation relates to the increased size of container vessels. To remain
competitive and service these Ultra Large Container Vessels (ULCV), ports need to increase their
capacity and throughput. Automating container terminals enables greater storage capacity in block
storage yards (vital to smooth the flow of containers through the terminal) and increases the speed of
unloading/loading a vessel in port. It should be noted that road and rail capacity are also important to
maintaining throughput and the ability of a port to accommodate ULCVs also depends on the quay
lengths and the turning capability in the waterway.
The Port of Hamburg competes commercially with other North Range ports around the Baltic and North
Sea coasts5 and in 2018, Hamburg had a market share of containerised trade of 19.7%[HHLA2].
Hamburg’s ability to maintain its market share of North Range port trade is largely dependent on its
ability to accommodate ever increasing sizes of container vessels and maintain container throughput in
its port facilities. In recent times, the sizes of vessels visiting the Port of Hamburg have increased. The
number of visits by ships of size 14-18 Kilo Tonnes doubled between 2015 and 2017, and the number
of visits by ships of size 18-20 Kilo Tonnes tripled over the same period [HHM19]. This trend of ever
larger container ships is expected to continue.
Improvements in its ability to handle larger vessels and enhancing throughput potentially enables a port
to maintain its market share of North Range trade. Market share between the North Range ports can vary
significantly in a single year; for example, Rotterdam increased its market share by 1.5% in and
Hamburg decreased its market share by 1.3% in 2017 [HHLA17] [HHLA18]. These variations are
substantial; a 1.3% percentage point decrease in Hamburg’s market share represents a 6.6% decrease in
volume and hence revenues.
The third major driver of automation is its ability to improve productivity and efficiency of operations.
As well as enabling faster and more reliable movement of containers, automation allows terminal
operators to reduce operating costs including staffing and energy consumption. The McKinsey study
into port automation found that operating costs typically reduce by 15% to 25% when automation is
introduced [MK18a]. However, efficiency gains are not immediate; there is typically a delay in reaching
expected productivity improvements due to time for implementation, difficulties of integrating new
technology, shortage of skills and concerns of labour unions [UNCTD18].
4 The NPV is calculated using a typical commercial discount rate of 10%.
5 The port of Hamburg competes with other North Range ports which comprise Rotterdam, Antwerp, Bremerhaven, Le Havre,
Dunkirk and Bremen.

5G-MoNArch (761445) D6.3 Final report on architectural verification
Version 1.0 Page 58 of 193
Although port automation is growing in major ports, only 1% of international ports are fully automated
and 2% are semi-automated [UNCTD18]. Indeed, only two of Hamburg’s container terminals
(Hamburger Hafen und Logistik AG (HHLA) Altenwerder and Burchardkai terminals) have already
implemented to, differing degrees, automated cargo handling machinery. A third HHLA terminal
(Tollerort) and the Eurogate container terminal have yet to install automation.
Automation in non-container segments is also expected however the major focus is expected to be
around processing of data and coordination between shipping and port operations [PT16]. Therefore,
we have focussed on the automation of container terminals in this study since it is the control of container
handling machinery where many benefits of using 5G-MoNArch services will arise.
The full methodology of our assessment of the operational and economic benefits of port automation is
given in Appendix D.2.2 with results given in Table 3-8. We assess the benefits of automated container
handling in terms of:
• Storage block automation benefits. This assesses the revenue losses that are avoided due to
increased capacity via automation ensuring that the terminal keeps pace with container volume
growth and protects its market share. These benefits are offset against the high investment
needed from the container terminal operator in automating the stackers in the storage block
areas.
• Yard automation benefits. This assesses the operational cost savings of automation of vehicles
transferring containers from the cranes to the storage yards. Again, this is offset against the
investment required on the part of the container terminal operator to automate these vehicles.
Note, Table 3-8 includes the cost to the terminal operator of automation which includes the costly
replacement of machinery in the container yards and storage blocks. These need to be offset against any
operational benefits of automation to get a true view of the net value of port automation and hence upper
willingness to pay bound on any enabling wireless services of such a transition.
Table 3-8: Potential operational benefits arising from Port Automation: M€
2020 2021 2022 2023 2024 2025 2026 2027 2028 2029 2030
Storage block automation
Avoided net revenue loss 0 0 3 10 19 31 45 60 76 94 113
Automation costs 0 0 6 19 31 49 56 56 62 56 56
Change in cashflow 0 0 -3 -8 -12 -18 -11 4 14 38 58
NPV of economic benefits of
storage block automation
12
Yard automation
Savings in OPEX 0 0 7 27 48 78 103 115 129 135 142
Automation costs 0 0 20 40 40 60 60 60 60 60 60
Changes in cashflow 0 0 -13 -13 8 18 43 56 69 76 82
NPV of economic benefits of
yard automation
132
We estimate that the total NPV of container terminal automation in the port of Hamburg over the period
2020 to 2030 is €144m when discounted at 10% (i.e. the NPV of storage block automation and yard
automation). However, it is important to note that benefits in 2030 are €140m (undiscounted) alone, and
these benefits can be expected to continue. Therefore, the overall benefits of automation to a terminal
operator are likely to be far higher over a longer period than illustrated here in the years 2020-2030.
AR for construction and maintenance
There are many large-scale construction projects undertaken within the port area each year. For example,
in 2016, HPA invested €217m in improving the road and rail networks, building new road and rail
bridges and refurbishment of the St. Pauli Elbe Tunnel [HPA16b]. This level of investment has been
consistent in recent years and is likely to continue. HPA has commenced consideration of a new river
Elbe crossing to replace the Köhlbrand Bridge, which will require substantially larger funding. The costs

5G-MoNArch (761445) D6.3 Final report on architectural verification
Version 1.0 Page 59 of 193
of a new crossing will depend upon whether a new bridge or tunnel is chosen and examination of recent
estuary crossing construction projects suggests that a conservative estimate of overall costs may be
several hundred million Euros and take 4 or 5 years to complete6,7,8,9. Other current and imminent
projects include the Eurogate Westward Expansion and the potential development of the Steinwerder-
Sud container terminal. Therefore, the scale of port construction activity can be expected to continue at
recent historical levels over the coming decade.
AR enabled by 5G-MoNArch technology would allow inspection engineers to observe construction
progress with an overlaid image of relevant site plans. This more efficient process allows more frequent
inspections and the chance to identify deviations from the plan at an earlier stage with consequent
savings in overall cost.
There is a great deal of innovation currently underway in the construction industry. Foremost of these
is the adoption of Building Information Modelling (BIM) techniques. This involves the representation
of construction drawings in the form of Three Dimensional (3D) spatial records which allows:
• Visualisation of 3D drawings
• Layered data for illustrating stages of construction and highlighting specific building services
• Linking of viewed images with underlying technical details and specifications.
HPA is undertaking research into the use of VR/AR technology in planning projects. To support BIM
adoption, the HPA is in the process of installing a suite of eight VR workstations.
The take-up of BIM is also stimulating innovation in the area of field measurement and inspection.
Systems are now available that allow building inspectors to verify the accuracy of construction work
using laser scanning technology. The principle of this is that a tripod mounted laser scanner makes a
multitude of angle and distance measurements within a field of vision to create a point cloud of
measurements. These can then be correlated with digital plans of the same structure and any positional
deviations from the digital records can be identified, measured and highlighted to the engineer. Such
systems vary in sophistication and accuracy and have application during the construction phase and
maintenance when the deterioration of a structure is to be assessed.
An extension of the laser scanning approach is to consider instead images of the construction site
supplemented by position and orientation information. Correlating this information with BIM data
would allow the viewed image to be compared with 3D images derived from the BIM database. The AR
technique has potential to support inspection of construction progress and identify areas where more
detailed analysis and verification is required. Laser derived point cloud systems typically have an
angular resolution of around 0.3° although, as a technique aimed at initial inspection, an AR solution
need not necessarily achieve this level of accuracy.
Applying this technique to AR glasses would provide a convenient method of routine inspection of
construction projects allowing:
• Overlay of actual construction work with plans and technical specifications
• Identification of changes since last inspection
• Checking of compliance with technical plans
• Visualisation of variations in design.
The benefits of using AR for construction projects is assessed based on the annual spend on construction
from HPA, potential overruns on such projects and the ability of AR to identify issues earlier in such
construction projects and reduce project overruns. These are shown in Table 3-9 with the full
6 The Northern Spire bridge over the river Wear in the UK was opened in 2018 at a construction cost of €131m and took 3
years to construct [Chr18].
7 The Rethe Bascule bridge opened for cars in 2016 and rail in 2018 at a cost of €175m (€80m higher than the original budget)
[HM18].
8 The Constitution 1812 Bridge across Cadiz Bay in Spain, was opened in 2015 at a cost of €500m, which was double its
original budget. The bridge took 8 years to build and was 3 years later than scheduled [TL15].
9 A new tunnel is planned for the river Thames at Silvertown in London. It is expected to cost £1bn (€1.1bn) and take 5 years
to construct [CE18].

5G-MoNArch (761445) D6.3 Final report on architectural verification
Version 1.0 Page 60 of 193
methodology given in Appendix D.2.3. The NPV of these savings over the 2020 to 2030 period would
be €35.9m at a discount rate of 10%.
Table 3-9: Potential economic benefits arising from AR in construction projects: M€
2020 2021 2022 2023 2024 2025 2026 2027 2028 2029 2030
Investments
HPA 242 242 242 242 242 242 242 242 242 242 242
New Köhlbrand crossing 0 0 125 125 125 125 0 0 0 0 0
Total investment 242 242 367 367 367 367 242 242 242 242 242
Cost of overruns 121 121 184 184 184 184 121 121 121 121 121
AR savings in overruns 1.2 2.4 5.5 7.3 9.2 9.2 6.1 6.1 6.1 6.1 6.1
Cost of AR technology 0.11 0.02 0.02 0.02 0.02 0.02 0.02 0.02 0.02 0.02 0.02
Changes in cashflow 1.1 2.4 5.5 7.3 9.2 9.2 6.0 6.0 6.0 6.0 6.0
NPV of economic
benefits 35.9
3.3.2.3 Port services - MSP revenues
The potential benefits represent the absolute maximum that the end user organisation should be willing
to pay for services. However, the actual price paid for services will be the result of negotiation between
the end user and the MSP. With multiple MNOs in Germany capable of acting as the MSP in this
evaluation case and being able to provide these services, we can expect changes to be broadly cost based.
However, there are attributes of supply that are not common with consumer contracts. We would expect
the MSP to participate in system development (and would be entitled to a return on such investment),
would provide slice specific features and would provide guaranteed performance levels. In addition,
MTTR and Mean Time Between Failures (MTBF) and customer response times would be stipulated.
Furthermore, future price variation will be limited within bounds. In addition, the MSP would be
expected to proactively develop the service and features as they are supported by vendors of automation
equipment.
The price agreed between the end user organisation and MSP parties will be influenced by:
• How important the specific features of 5G-MoNArch are to the application.
• How demanding the service is in terms of data throughput and latency.
• What non-technical service performance attributes are required for the application such as
Maximum network outage, MTBF, MTTR.
• The level of participation by the MSP in developing the service concept and network slice.
• The competitive environment between MSPs and the availability of alternative means of
achieving the application.
• How tangible the benefits are to the end user organisation (i.e. what risk is there that the benefits
will not materialise). This is related to how easily the benefits may be monetised.
In Appendix D.2.5, we assign a weighting for each of these influencing factors to each of the EC1
services considered and combine this with the benefits assessment presented earlier to derive revenue
forecasts for an MSP providing such services.
To understand how MSP revenues might vary over the period 2020 to 2030, we have assumed that:
• Revenues from traffic control applications will be even across the period in real terms.
• Revenues from port automation applications will increase as each container terminal is
automated in proportion to the total container volume handled by that terminal.
• Revenues from AR applications in construction will increase in proportion to the number of AR
headsets in use at the port.

5G-MoNArch (761445) D6.3 Final report on architectural verification
Version 1.0 Page 61 of 193
Figure 3-13: Estimation of annual MSP revenues from business applications in the Port of
Hamburg: M€
The estimated potential MSP revenues are shown in real terms (referenced to 2020) in Figure 3-13. This
suggests that MSPs might obtain up to €7.9 million per year in revenues from the port applications by
the end of 2030. Compared against eMBB revenues for our medium scenario this represents a 54%
increase in revenues by 2030. However, there is some short-term risk to pursuing such new services as
it will take time for uptake to build.
3.3.3 Cost assessment
3.3.3.1 Approach
From the cost modelling perspective, we assume a virtualised network deployment as given earlier in
Figure 2-6. We dimension the network based on outdoor demand and assume all the RAN protocol
stack processing is achieved at the edge cloud site. We don’t directly model CN functions but some
localisation of these may be needed for the AR and container terminal automation services to keep
within the 10 msec latency requirements of these services (see Section 3.2.2).
Further details of the cost elements included in our modelling and example site costs are given in
Appendix D.5. Network dimensioning and costs focus on U-plane processing costs for the RAN and
exclude CP signalling, network orchestrators or controllers, CN applications and wider business &
administrative costs.
We consider that all network costs are borne by the MSP and model the RAN elements of these. In the
business case analysis presented later we apply an uplift to these RAN costs to allow for CN costs and
wider administrative and marketing functions of MSPs.
As described in Section 2.2.2.2, the cost analysis tool developed under 5G NORMA has been further
evolved under 5G-MoNArch to consider the enablers from the various WPs. In the case of EC1 the key
elements to improve E2E reliability as required for industrial services added to the model include:
• Support for MC to dimension for high coverage confidence levels required for high RAN
reliability
• Dimensioning of servers to include extra redundant equipment to improve telco cloud
availability
Multi-connectivity (MC) support
As an example of how MC impacts network dimensioning in the model, the map in Figure 3-14 shows
the Eurogate container terminal in red. Locations where single connectivity fails to provide service with
99.9% coverage confidence, but MC from two macro cells succeeds against the above coverage
confidence target are shown in blue. The primary and secondary macro cells are noted on the map as
BS1 and BS2, respectively. The green lines show the paths between the example User Terminal (UT)
location, which is served with MC, and each of these two macro cells. These paths are denoted as UT-
BS1 and UT-BS2.

5G-MoNArch (761445) D6.3 Final report on architectural verification
Version 1.0 Page 62 of 193
Frequency 3.5 GHz
32T4R, Receive (Rx) diversity mode
Interference margin due to loading: 16.8 dB (BS1), 24.2 dB
(BS2)
BS antenna height: 43.5 m (BS1), 21.2 (BS2)
User Terminal (UT) antenna height: 1.4 m
Propagation environment: open
Two-Dimensional (2D) separation distances: 1.5 km (BS1-
UT), 2.1 km (BS2-UT)
SINR1 = 7.2 ± 8.8 dB, SINR2 = -9.7 ± 10 dB, correlation
coefficient between SINR1 and SINR2: -0.5
PER = 10-6
SINR threshold for port automation: -11.1 dB
Required confidence at cell-edge to guarantee 99.9%
service confidence: 99.665%
(a) Map of MC example (b) Assumptions for MC example
Figure 3-14: Example of MC impact on network dimensioning
Based on the assumptions given in the table included in Figure 3-14, with BS1 alone the probability of
radio link failure is 1.82%, or a probability of success of 98.18%. This is less than the coverage
confidence requirement of 99.9% set in [5GM-D62] for automated machinery in container terminals.
Therefore, the UT does not get served with single connectivity. The probability of failure if duplicating
transmissions and sending data from both BS1 and BS2 is 0.11%, or probability of success at 99.89%
and therefore the UT gets served.
Telco-cloud reliability support
Dimensioning of processing at edge cloud sites in the cost modelling considers the target telco-cloud
availability level for each service. We assumed operation as per the active standby scheme described in
Section 3.2.1.2. The spare processing that is added to edge cloud sites in line with this scheme is shown
in Figure 3-15.
Figure 3-15: Additional servers dimensioned depending on service reliability requirements
As an example of how provisioning of spare servers to improve telco-cloud reliability impacts telco-
cloud dimensioning in the model, we consider the case of the Steinwerder edge cloud site serving 35
antenna sites in 2020. We further consider that these antenna sites serve a combination of eMBB, CCTV
and connected traffic light traffic, with a telco cloud availability requirement of 99.9%, 99.9% and
99.999%, respectively. We assume temporal separation between failure of these three services.
Based on the equipment and utilisation of each served antenna site, the cost model CAPisce estimates
that this edge cloud site requires 85.92 cores for eMBB, plus 9.72 cores for CCTV, plus 0.00000006
cores for connected traffic lights, or 95.64 cores in total. Because the number of servers is a whole

5G-MoNArch (761445) D6.3 Final report on architectural verification
Version 1.0 Page 63 of 193
number, the above estimation is rounded to 6 working servers with 96 cores. From Figure 3-15 we
calculate the number of spare hot servers: 2 for eMBB, 1 for CCTV, and 2 for connected traffic lights.
The number of spare servers is the maximum across these numbers, because we assumed temporal
separation between failures of the three services.
Note that even though the required number of cores for connected traffic lights is several orders of
magnitude lower than that of eMBB, the number of spare servers required for each of these two services
is equal. Note that the service requirement of eMBB of 99.9% computational availability results in a
spare server requirement that ensures 99.999% availability for connected traffic light, and hence the
more stringent availability of connected traffic lights comes with no additional network cost.
3.3.3.2 Cost of automating the container terminals
Figure 3-16 shows the cost of providing a reliable wireless service from the existing eMBB network to
the container terminals in Hamburg port to allow automation of machinery. Port automation starts from
2022 when AGVs and port machinery (stacking cranes) in Eurogate are assumed to be served by 5G.
The cost bars on the graph are identical prior to this automation date for this reason.
(a) Cost of providing a port automation service with
and without MC
(b) 2020-2030 TCO for eMBB alone, eMBB with port
automation with MC and eMBB with port automation
without MC
Figure 3-16: Cost of providing a port automation service with and without MC
The results show that a 5G network that supports MC would be capable of industrial automation of the
Eurogate terminal without network densification or additional expenditure. This is because the macro
cells in the area are well suited for provision of coverage with industrial-rate availability (99.9%
coverage confidence). In general, the propagation between macro cells and the Eurogate area is benign:
• The macro cells are taller than obstructions which allows LOS opportunities
• The metallised environment with containers and big ships provides specular (strong) reflection
and rich multipath opportunities, which MIMO is designed to exploit under blocking of LOS
• Eurogate is bordered by two well-suited macro cells (one on Autobahn 7, and one across the
river inlet to the west in Finkenwerder district)
• The proximity to the Elbe in some cases helps with MC from across the water
• AGV and cranes are situated outdoors and are moving with relatively low speed
See Figure 3-14 for an example of MC in Eurogate. In addition, there is surplus macrocell capacity in
the wider Eurogate area, as Waltershof district (where Eurogate resides) features little eMBB demand.

5G-MoNArch (761445) D6.3 Final report on architectural verification
Version 1.0 Page 64 of 193
Burchardkai is assumed to automate from 2023. Burchardkai is located further north from the Autobahn
7 macrocell, and further east from the macro cells of Finkenwerder. As a result, provision of 99.9%
radio availability can only be achieved with additional network infrastructure. However, the MC enabler
still results in a reduced infrastructure requirement compared with single connectivity.
The 2020-30 cumulative network cost attributed to port automation amounts to €0.83m (a 2.7% increase
over eMBB alone) with MC and to €2.2m (a 7.2% increase over eMBB alone) without MC This is a
62% reduction in the incremental cost of supporting port automation due to MC. By dividing into the
effective number of years, port automation results in a mean network cost of €100k pa (with MC) and
of €280k pa (without MC).
3.3.3.3 Cost of providing port ITS
Figure 3-17 shows the cost of providing a reliable wireless service from the existing eMBB network to
connected construction traffic lights in Hamburg port to allow for intelligent traffic control. Also
included is support for wireless CCTV to monitor traffic conditions, however, the reliability
requirements of this service are not as strict as for the traffic lights.
(a) Cost of providing a port ITS service with and
without MC (b) 2020-2030 TCO for eMBB alone, eMBB with port
ITS with MC and eMBB with port ITS without MC
Figure 3-17: Costs for providing port ITS
In 2020, the introduction of port ITS drives network expansion with several new small cells. We
assumed that some locations within the port are associated with port ITS usage, e.g. mobile CCTV at
berth, temporary/mobile ITS on roads between container storage and port exits, or CCTV at construction
sites. The demand hotspots that are created are then typically immobile with time; for example, the
berth locations and the road layout are unlikely to change. A non-roamer demand hotspot is more
economically served by a small cell. This is because the small cell has a smaller coverage footprint,
which would provide adequate coverage along road corridors and specific areas of interest (berth,
container terminals, construction sites). In 2020, the cost model has therefore converged to spend €460k
on small cell CAPEX for port CCTV and ITS.
In 2020, HPA connected traffic lights do not require the MC enabler. However, in 2021 MC starts to
show cost savings in macrocell upgrade CAPEX. This is likely to be because the increasing eMBB
utilisation of macrocell spectrum reduces availability of non-contended resources which are needed to
ensure 99.9% coverage confidence.
The 2020-30 cumulative network cost attributed to port ITS amounts to €1.5m (a 5% increase over
eMBB alone) with MC and to €3.2m (a 10.2% increase over eMBB alone) without MC. The 2020-30

5G-MoNArch (761445) D6.3 Final report on architectural verification
Version 1.0 Page 65 of 193
annual network cost attributed to port ITS is €140k pa (with MC) and of €290k pa (without MC).
Provision of port CCTV and ITS is costlier than container terminal automation.
3.3.3.4 Cost of providing port AR
Figure 3-18 shows the costs for providing an AR service to HPA to support their construction sites in
the port area. The reliability of this service is in line with existing mainstream eMBB services and so
we have evaluated the costs of introducing such a service using single connectivity alone rather than
MC.
In 2020, there are only assumed to be 4 devices in use by the HPA construction team, and the cost model
has converged to spend €270k on CAPEX for HPA AR. From 2021 until 2025 the number of HPA AR
users increases from 4 to 30, and these cover a wider geographical area. Macro cells are more efficient
in covering the increasing number of locations and users, and the cost model has converged to spend
€310k on macrocell CAPEX plus €110k on small cell CAPEX for HPA AR.
The 2020-30 cumulative network cost attributed to port AR amounts to €1.2m (a 3.9% increase on
eMBB alone). The 2020-30 annual network cost attributed to port AR is €110k pa.
(a) Cost of providing a port AR service (b) 2020-2030 TCO for eMBB alone and eMBB with
port AR
Figure 3-18: Costs for providing HPA AR
3.3.3.5 Summary of cost results
A summary of the network TCO of the study period of 2020-30 across all EC1 services considered is
summarised in Figure 3-19. The additional cost over a network which only serves eMBB is provided
as a percentage on the top. Additional services on top of eMBB increase the network cost by €0.83m
and €1.5m, for port automation and ITS respectively. However, in the absence of the MC enabler these
costs would be 2.7 and 2.1 times greater than with the enabler, for port automation and ITS respectively.
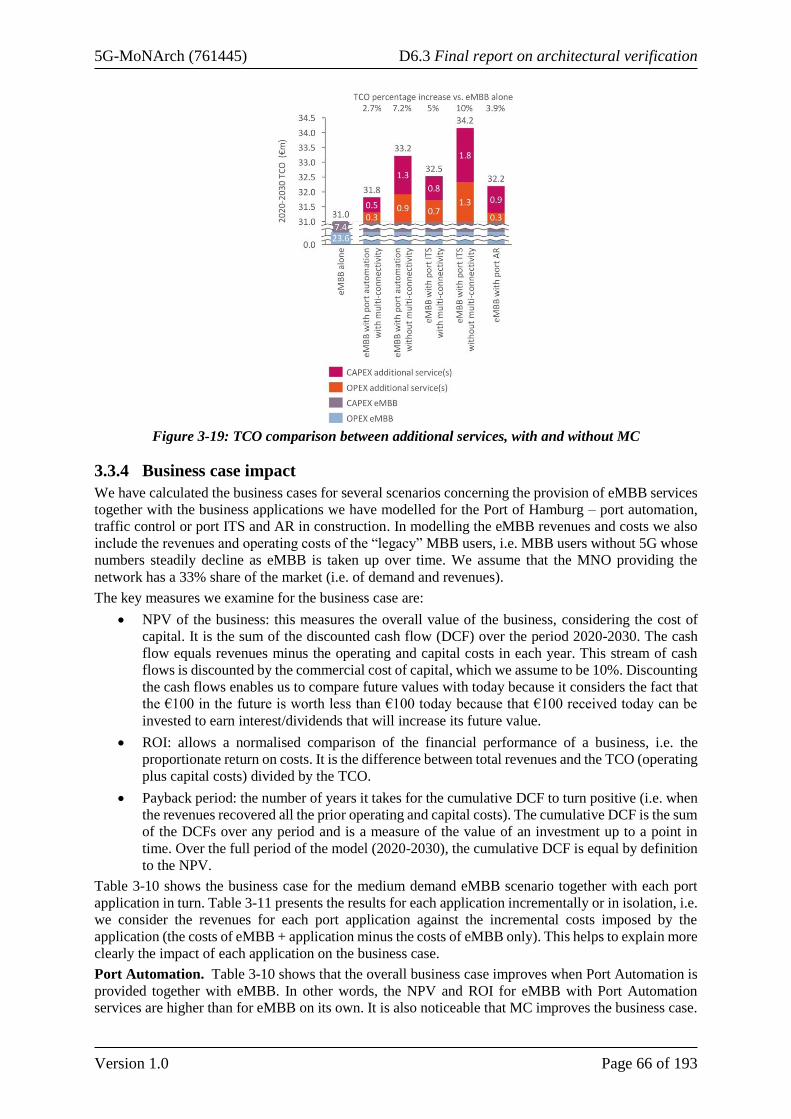
5G-MoNArch (761445) D6.3 Final report on architectural verification
Version 1.0 Page 66 of 193
Figure 3-19: TCO comparison between additional services, with and without MC
3.3.4 Business case impact
We have calculated the business cases for several scenarios concerning the provision of eMBB services
together with the business applications we have modelled for the Port of Hamburg – port automation,
traffic control or port ITS and AR in construction. In modelling the eMBB revenues and costs we also
include the revenues and operating costs of the “legacy” MBB users, i.e. MBB users without 5G whose
numbers steadily decline as eMBB is taken up over time. We assume that the MNO providing the
network has a 33% share of the market (i.e. of demand and revenues).
The key measures we examine for the business case are:
• NPV of the business: this measures the overall value of the business, considering the cost of
capital. It is the sum of the discounted cash flow (DCF) over the period 2020-2030. The cash
flow equals revenues minus the operating and capital costs in each year. This stream of cash
flows is discounted by the commercial cost of capital, which we assume to be 10%. Discounting
the cash flows enables us to compare future values with today because it considers the fact that
the €100 in the future is worth less than €100 today because that €100 received today can be
invested to earn interest/dividends that will increase its future value.
• ROI: allows a normalised comparison of the financial performance of a business, i.e. the
proportionate return on costs. It is the difference between total revenues and the TCO (operating
plus capital costs) divided by the TCO.
• Payback period: the number of years it takes for the cumulative DCF to turn positive (i.e. when
the revenues recovered all the prior operating and capital costs). The cumulative DCF is the sum
of the DCFs over any period and is a measure of the value of an investment up to a point in
time. Over the full period of the model (2020-2030), the cumulative DCF is equal by definition
to the NPV.
Table 3-10 shows the business case for the medium demand eMBB scenario together with each port
application in turn. Table 3-11 presents the results for each application incrementally or in isolation, i.e.
we consider the revenues for each port application against the incremental costs imposed by the
application (the costs of eMBB + application minus the costs of eMBB only). This helps to explain more
clearly the impact of each application on the business case.
Port Automation. Table 3-10 shows that the overall business case improves when Port Automation is
provided together with eMBB. In other words, the NPV and ROI for eMBB with Port Automation
services are higher than for eMBB on its own. It is also noticeable that MC improves the business case.

5G-MoNArch (761445) D6.3 Final report on architectural verification
Version 1.0 Page 67 of 193
Whereas the NPV is only slightly higher with MC – €70 million vs €69 million, the ROI is significantly
improved 220% vs 207%. Figure 3-20 presents another view of the business case for this scenario. This
shows a consistently higher cumulative DCF when Port Automation is added to eMBB. Finally, Table
3-10 shows that Port Automation improves the business case the most out of the three port applications.
Table 3-10: Business cases for eMBB plus port applications
Scenario Business Case NPV (€m) ROI
Medium eMBB 64 204%
eMBB + Port Automation, single-connectivity 69 207%
eMBB + Port Automation, MC 70 220%
eMBB + Port ITS, single-connectivity 63 181%
eMBB + Port ITS, MC 64 195%
eMBB + AR, single-connectivity 65 202%
Table 3-11 show the incremental business case for Port Automation and highlights its positive impact.
The ROI is higher than for eMBB alone, considerably more so in the MC case. The ROI of 830% may
seem unusually large, but the main driver is the fact that the incremental cost of Port Automation is
relatively low. Comparing the NPV – €4.7 million without MC and €6 million with – provides a more
meaningful comparison of the two business cases in this instance.
Table 3-11: Incremental Business cases for port applications
Scenario Business Case NPV (€m) ROI
Port Automation, single-connectivity 4.7 245%
Port Automation, MC 6.0 830%
Port ITS, single-connectivity -1.3 -39%
Port ITS, MC 0.2 25%
AR, single-connectivity 1.4 152%
Figure 3-20: 2020-2030 cumulative DCF for eMBB and Port Automation

5G-MoNArch (761445) D6.3 Final report on architectural verification
Version 1.0 Page 68 of 193
Port ITS. Table 3-10 and Table 3-11 show that adding port ITS service alongside eMBB worsens the
business case compared to eMBB alone, depending on whether MC is applied, and on the metric which
is used. Under single-connectivity the business case (together with eMBB) is unambiguously worse: the
NPV is slightly smaller, but ROI falls significantly from 204% to 181%. Under MC, NPV is fractionally
higher (though this is obscured by rounding), but the ROI (195%) is still lower than eMBB alone.
Looking at the incremental business case for Port ITS we see more clearly that using MC turns the
business case from negative to positive. The NPV with MC is just positive at €0.2 million compared to
€-1.3 million and the ROI goes from -39% to 25%.
AR in construction. The impact of AR in construction is somewhere between Port Automation and
Port ITS. Though the NPV of the incremental business case is positive, ROI (152%) is lower than for
eMBB only (204%). This drags down the combined ROI of eMBB plus AR in construction to 202%.
3.3.5 Commercial verification sensitivity analysis
3.3.5.1 Sensitivity of findings to existing MBB network specification and evolution
eMBB business case variation for low, medium and high eMBB scenarios
With the medium eMBB growth assumption, the cost of serving port automation and ITS was estimated
at €0.83m and at €1.5m over 11 years in Section 3.3.3.2 and Section 3.3.3.3, respectively. This section
discusses the cost and business case variation under different eMBB growth assumptions.
If the eMBB growth is more restrained compared to the baseline, then the cost to serve port automation
and ITS drops to €0.38m and €1.02m over 11 years, respectively. This is because the network in the
area around the container terminals remains lowly utilised. As a result, interference levels from eMBB
PRB remain low (chances of contended PRB are low), so that port automation with MC can be served
with 99.9% confidence without network upgrades that target port services.
If the eMBB growth is faster than the baseline assumption, then the cost to serve port automation and
ITS drops to €0.46m and €0.93m over 11 years, respectively. This is because a faster evolving network
ensures coverage and spare capacity for port services. Figure 3-21 summarises the network cost values
discussed above.
(a) Cost of providing a port automation service (b) Cost of providing a port ITS service
Figure 3-21: Network cost with variations in eMBB demand, sum over 11 years in €m
Table 3-12 shows how the business cases for Port Automation and ITS vary according to our eMBB
demand and revenue scenarios (low, medium and high).

5G-MoNArch (761445) D6.3 Final report on architectural verification
Version 1.0 Page 69 of 193
Overall, the relative impact of providing the port applications alongside eMBB varies neither greatly
nor systematically with eMBB demand. For example, the NPV of the business case increases by a similar
amount when Port Automation is added, regardless of the demand scenario (e.g. from €67 to €73 million
in the high demand case). The ROI also improves by a similar margin across low to high demand. In
contrast, Port ITS (with MC) improves the business case for eMBB in terms of NPV in each demand
sensitivity (e.g. from €67 to €68 million in the high case). However, ROI falls slightly (e.g. from 187%
to 185% in the high case). In fact, the negative impact on ROI, due to adding Port ITS, is smallest in the
high demand case. This suggests the business case is a little more robust at higher demand.
Table 3-12: Business case for Port Automation and Port ITS with variations in eMBB demand
Scenario Business Case NPV (€m) ROI
Low eMBB only 65 254%
Medium eMBB only 64 204%
High eMBB only 67 187%
Low eMBB + Port Automation MC 71 279%
Medium eMBB + Port Automation MC 70 219%
High eMBB + Port Automation MC 73 205%
Low eMBB + Port ITS MC 66 247%
Medium eMBB + Port ITS MC 64 195%
High eMBB + Port ITS MC 68 185%
3.3.5.2 Sensitivity of findings to combinations of services
In Section 3.3.3.5 we summarised the incremental cost of adding one of the considered port services to
the existing eMBB network in the Hamburg study area. In this sensitivity case we examine the
incremental cost of adding combinations of port services to the existing eMBB network. Figure 3-22
shows the cost results for providing combinations of port services with Table 3-13 summarising the
percentage increase in 2020-2030 TCO, relative to the eMBB-only baseline-network. This shows that
by combining all three EC1 port services on the network, the incremental cost is 6.5% rather than the
11.6% expected from adding the cost increment of each service individually. This represents a 44%
reduction in cost due to an economy of scope cost efficiency from combining services on the same multi-
service infrastructure set rather than offering them individually.
Figure 3-22: Cost of providing combinations of port services

5G-MoNArch (761445) D6.3 Final report on architectural verification
Version 1.0 Page 70 of 193
Table 3-13: Percentage increase in 2020 to 2030 TCO compared with that of a network which
serves only eMBB
eMBB + … 11-year TCO increase
port ITS 5%
port automation 2.7%
port AR 3.9%
port automation and ITS 5.6%
port automation, ITS and AR 6.5%
Table 3-14 shows the impact on the business case of eMBB with various combinations of the Port
applications. Both NPV and ROI significantly improve compared to an eMBB only network in the two
scenarios modelled:
• ROI increases from 204% to 217% when Port Automation and Port ITS are combined with
eMBB compared to eMBB only;
• The business case for eMBB plus Port ITS pus Port Automation is also better than that for either
eMBB plus Port ITS (in particular) or eMBB plus Port Automation (NPV improves, ROI is
slightly worse);
• Adding AR in Construction on top of the other two applications increases the NPV slightly from
€71 million to €73 million and increases the ROI to 224%.
Table 3-14: Business case for combining Port of Hamburg applications
Scenario Business Case NPV (€m) ROI
Medium eMBB, Port Automation & Port ITS MC 71 217%
Medium eMBB, Port Automation, Port ITS & AR MC 73 224%
Medium eMBB 64 204%
Medium eMBB + Port Automation MC 70 220%
Medium eMBB + Port ITS MC 64 195%

5G-MoNArch (761445) D6.3 Final report on architectural verification
Version 1.0 Page 71 of 193
4 Evaluation case 2: Elastic network slices enabling local peak
performance
This chapter presents simulation-based verification results for EC2. EC2 focuses on using 5G-MoNArch
and its enablers to provide improved service levels to challenging hotspot locations in a cost-effective
way using elasticity. This chapter first introduces the objectives for EC2 and the services considered
within it. The technical performance verification results are then presented followed by the techno-
economic verification. A summary of conclusions from this chapter for EC2 is given in the
“Conclusions” chapter and specifically Section 9.3.
4.1 Objectives of EC2 and stakeholders targeted
EC2 is related to the verification of 5G features allowing an adaptation of the network in a flexible way
to cope with temporary traffic demands in certain locations of the coverage area. The example
considered here in the Hamburg study area was set up in the context of considering an existing mobile
network delivering eMBB services and having to cope with temporary eMBB demand hotspots such as
those generated by passengers arriving on large cruise ships to Hamburg’s cruise ship terminals (see
Figure 4-1). Such an approach for network elasticity was also verified in the Turin TC testbed of 5G-
MoNArch [5GM-D52] and scaled up here for the evaluation case. The final aim of EC2 is to assess the
incremental cost savings due to network elasticity when serving temporary demand hotspots.
The services considered in EC2 are therefore solely eMBB services but include a temporary but extreme
increase in the traffic volume that may occur in the demand hotspots around cruise ship terminals.
Figure 4-1: Queen Mary 2 leaving Hamburg’s Steinwerder cruise ship terminal (left), Steinwerder
cruise ship terminal (right)
The 5G-MoNArch enablers considered in EC2 originate primarily from WP2 and WP4 covering elastic
VNF design and orchestration as well as elastic inter-/intra-slice resource management (see [5GM-D23]
and [5GM-D42]). With such enablers, future 5G networks based on increased cloudification and
virtualisation will allow for flexible network reconfigurations enabling local peak performance and at
the same time avoiding static oversizing of NEs. Without network elasticity, use cases demanding local
peak performance for certain periods of time would cause bottlenecks with respect to radio, TN and
cloud resources. The 5G-MoNArch network elasticity enablers work at a:
• Computational level by allowing for graceful VNF performance degradations;
• Orchestration level by shifting VNFs to other cloud locations in case of overload;
• Slice level by demand-oriented reassignment of resources to different network slices.
These three dimensions of elasticity and their impact on network equipment and costs is analysed
already in [5GM-D42]. Figure 4-2 provides a high-level overview of how network equipment
dimensioning, and network performance is impacted by these three dimensions of elasticity and the
interplay among them.

5G-MoNArch (761445) D6.3 Final report on architectural verification
Version 1.0 Page 72 of 193
Figure 4-2: Illustration of where the three dimensions of elasticity impact equipment in the network
For verification of the benefits achieved by the enablers against the baseline system EC2 is addressing
following KPIs
• Cost efficiency gain,
• Incremental cost,
• Incremental revenue.
which are focusing on techno-economic aspects that would allow to justify the additional expenditures
required in network implementation.
Like EC1, the underlying ecosystem model for EC2 is targeting different stakeholder groups. In the
main roles there is again the SSP tenant, which corresponds in the case of the selected study area in
Hamburg to 5G-MoNArch’s project partner HPA, temporary offering eMBB services to passengers
from cruise ships within its terminal area. This offer is on top of the existing eMBB services provided
by MSPs in the public port area and can be realised in dedicated network slices combining infrastructures
from the tenant and the MSP. The slice set-up requires novel SW/HW implementations on the network
infrastructure side considering the flexibility required to manage elastic VNFs across different locations.
4.2 Technical performance verification
In the following sections, results showcasing the technical performance of enablers related to EC2 are
presented. More specifically the enablers concerning elasticity are covered, which help in efficiently
handling the scenario examined in EC2, i.e. a temporary large increase in traffic.
Elasticity is a well-studied concept in cloud computing systems related to the resource efficiency of
clouds. In networks, temporal and spatial traffic fluctuations require that the network efficiently scales
resources such that, in case of peak demands, the network adapts its operation and re-distributes
available resources as needed, gracefully scaling the network operation. This feature is particularly
useful when a network slice is instantiated in an environment where overprovisioning of resources is
not an option and the nature of the service allows for a flexible management of the resources without
incurring in critical SLA violations. We refer to this flexibility, which could be applied both to
computational and communications resources, as resource elasticity. 5G-MoNArch considers elasticity
in three different dimensions, namely computational elasticity in the design and the up- or downscaling
of NFs, orchestration-driven elasticity achieved by flexible placement of NFs, and slice-aware
elasticity via cross-slice resource provisioning mechanisms.
As in the previous chapter for EC1, we first present the technical KPI improvements found for elasticity
from the WP6 wide area simulation tool Mx-ART. While results are available from WP4 for each
enabler these are for a diverse range of scenarios and generally over a smaller scale. For completeness,
conclusions from WP4’s modelling of enablers are also summarised here and compared against those
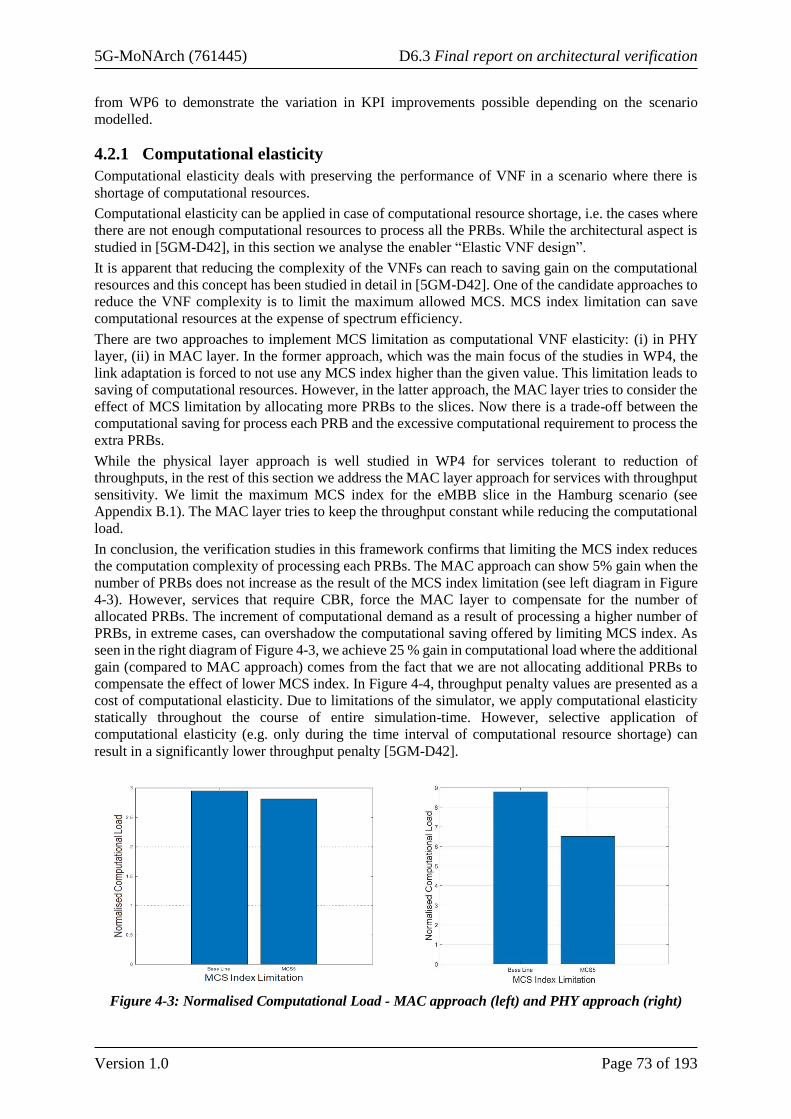
5G-MoNArch (761445) D6.3 Final report on architectural verification
Version 1.0 Page 73 of 193
from WP6 to demonstrate the variation in KPI improvements possible depending on the scenario
modelled.
4.2.1 Computational elasticity
Computational elasticity deals with preserving the performance of VNF in a scenario where there is
shortage of computational resources.
Computational elasticity can be applied in case of computational resource shortage, i.e. the cases where
there are not enough computational resources to process all the PRBs. While the architectural aspect is
studied in [5GM-D42], in this section we analyse the enabler “Elastic VNF design”.
It is apparent that reducing the complexity of the VNFs can reach to saving gain on the computational
resources and this concept has been studied in detail in [5GM-D42]. One of the candidate approaches to
reduce the VNF complexity is to limit the maximum allowed MCS. MCS index limitation can save
computational resources at the expense of spectrum efficiency.
There are two approaches to implement MCS limitation as computational VNF elasticity: (i) in PHY
layer, (ii) in MAC layer. In the former approach, which was the main focus of the studies in WP4, the
link adaptation is forced to not use any MCS index higher than the given value. This limitation leads to
saving of computational resources. However, in the latter approach, the MAC layer tries to consider the
effect of MCS limitation by allocating more PRBs to the slices. Now there is a trade-off between the
computational saving for process each PRB and the excessive computational requirement to process the
extra PRBs.
While the physical layer approach is well studied in WP4 for services tolerant to reduction of
throughputs, in the rest of this section we address the MAC layer approach for services with throughput
sensitivity. We limit the maximum MCS index for the eMBB slice in the Hamburg scenario (see
Appendix B.1). The MAC layer tries to keep the throughput constant while reducing the computational
load.
In conclusion, the verification studies in this framework confirms that limiting the MCS index reduces
the computation complexity of processing each PRBs. The MAC approach can show 5% gain when the
number of PRBs does not increase as the result of the MCS index limitation (see left diagram in Figure
4-3). However, services that require CBR, force the MAC layer to compensate for the number of
allocated PRBs. The increment of computational demand as a result of processing a higher number of
PRBs, in extreme cases, can overshadow the computational saving offered by limiting MCS index. As
seen in the right diagram of Figure 4-3, we achieve 25 % gain in computational load where the additional
gain (compared to MAC approach) comes from the fact that we are not allocating additional PRBs to
compensate the effect of lower MCS index. In Figure 4-4, throughput penalty values are presented as a
cost of computational elasticity. Due to limitations of the simulator, we apply computational elasticity
statically throughout the course of entire simulation-time. However, selective application of
computational elasticity (e.g. only during the time interval of computational resource shortage) can
result in a significantly lower throughput penalty [5GM-D42].
Figure 4-3: Normalised Computational Load - MAC approach (left) and PHY approach (right)

5G-MoNArch (761445) D6.3 Final report on architectural verification
Version 1.0 Page 74 of 193
Figure 4-4: Average Throughput – MAC approach (left) and PHY approach (right)
4.2.2 Orchestration driven elasticity
Orchestration-driven elasticity deals with locating VNFs with strong elasticity characteristics where
the operational cost is higher or avoid the co-location of inelastic VNFs in the same infrastructure.
While the architectural interaction of “orchestration driven elasticity” is well described in WP4 [5GM-
D42], we implement a proof of concept for the “orchestration driven elasticity algorithm” and analyse
its cost saving impact for the entire Hamburg study area. While over provisioning of computational
resources increases the CAPEX & OPEX, under provisioning of the resources may result in QoS
degradation. In this section we propose a dynamic resource allocation algorithm for fully virtualised
vRAN with the aim to achieve optimal resource allocation between cost and QoS. However, the
algorithm can also be modified for other functional split options proposed by 3GPP in [3GPP 38803].
We use the following terminology for the rest of the section.
• Computational Resource Allocated: Number of CPUs allocated per virtualised BS.
• Computational Load: Number of CPUs required in cloud environment to process all PRBs from
a virtualised BS [KSR18].
• Scale Up Threshold (Tup): Threshold value constant, to trigger orchestration of additional
computational resource procedure.
• Scale Down Threshold (Tdown): Threshold value constant, to trigger de-
orchestration/deallocation of computational resource.
Figure 4-5: Orchestration driven elasticity model
Figure 4-5 shows the model considered for the evaluation of orchestration driven elasticity. A controller
continuously monitors computational load consumed by each virtualised BS and allocated
computational resources. When the corresponding conditions are satisfied, scaling up/down procedure
is performed as follows:
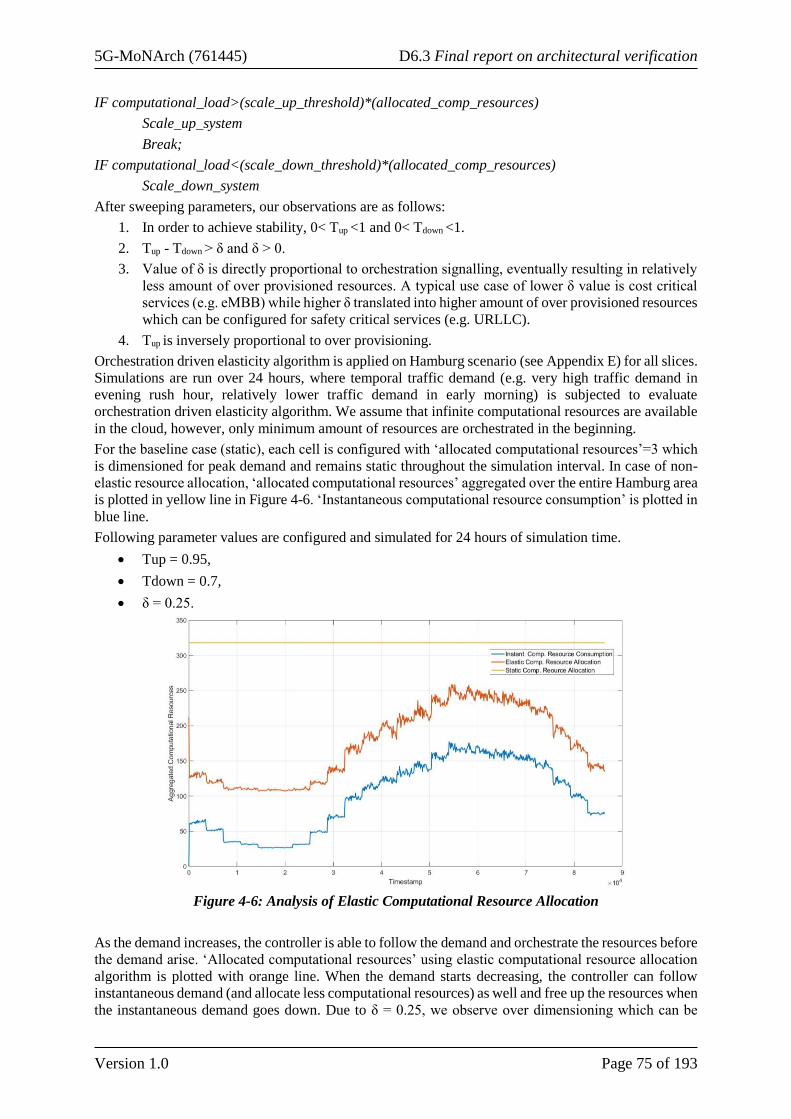
5G-MoNArch (761445) D6.3 Final report on architectural verification
Version 1.0 Page 75 of 193
IF computational_load>(scale_up_threshold)*(allocated_comp_resources)
Scale_up_system
Break;
IF computational_load<(scale_down_threshold)*(allocated_comp_resources)
Scale_down_system
After sweeping parameters, our observations are as follows:
1. In order to achieve stability, 0< Tup <1 and 0< Tdown <1.
2. Tup - Tdown > δ and δ > 0.
3. Value of δ is directly proportional to orchestration signalling, eventually resulting in relatively
less amount of over provisioned resources. A typical use case of lower δ value is cost critical
services (e.g. eMBB) while higher δ translated into higher amount of over provisioned resources
which can be configured for safety critical services (e.g. URLLC).
4. Tup is inversely proportional to over provisioning.
Orchestration driven elasticity algorithm is applied on Hamburg scenario (see Appendix E) for all slices.
Simulations are run over 24 hours, where temporal traffic demand (e.g. very high traffic demand in
evening rush hour, relatively lower traffic demand in early morning) is subjected to evaluate
orchestration driven elasticity algorithm. We assume that infinite computational resources are available
in the cloud, however, only minimum amount of resources are orchestrated in the beginning.
For the baseline case (static), each cell is configured with ‘allocated computational resources’=3 which
is dimensioned for peak demand and remains static throughout the simulation interval. In case of non-
elastic resource allocation, ‘allocated computational resources’ aggregated over the entire Hamburg area
is plotted in yellow line in Figure 4-6. ‘Instantaneous computational resource consumption’ is plotted in
blue line.
Following parameter values are configured and simulated for 24 hours of simulation time.
• Tup = 0.95,
• Tdown = 0.7,
• δ = 0.25.
Figure 4-6: Analysis of Elastic Computational Resource Allocation
As the demand increases, the controller is able to follow the demand and orchestrate the resources before
the demand arise. ‘Allocated computational resources’ using elastic computational resource allocation
algorithm is plotted with orange line. When the demand starts decreasing, the controller can follow
instantaneous demand (and allocate less computational resources) as well and free up the resources when
the instantaneous demand goes down. Due to δ = 0.25, we observe over dimensioning which can be
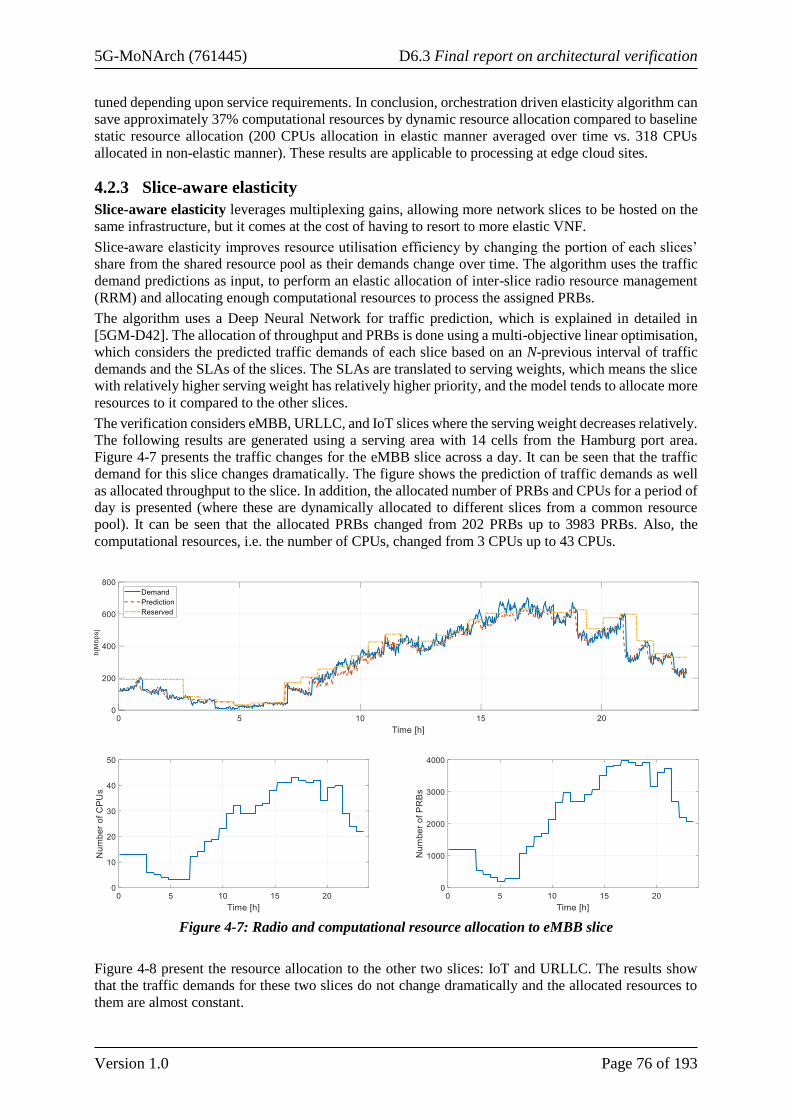
5G-MoNArch (761445) D6.3 Final report on architectural verification
Version 1.0 Page 76 of 193
tuned depending upon service requirements. In conclusion, orchestration driven elasticity algorithm can
save approximately 37% computational resources by dynamic resource allocation compared to baseline
static resource allocation (200 CPUs allocation in elastic manner averaged over time vs. 318 CPUs
allocated in non-elastic manner). These results are applicable to processing at edge cloud sites.
4.2.3 Slice-aware elasticity
Slice-aware elasticity leverages multiplexing gains, allowing more network slices to be hosted on the
same infrastructure, but it comes at the cost of having to resort to more elastic VNF.
Slice-aware elasticity improves resource utilisation efficiency by changing the portion of each slices’
share from the shared resource pool as their demands change over time. The algorithm uses the traffic
demand predictions as input, to perform an elastic allocation of inter-slice radio resource management
(RRM) and allocating enough computational resources to process the assigned PRBs.
The algorithm uses a Deep Neural Network for traffic prediction, which is explained in detailed in
[5GM-D42]. The allocation of throughput and PRBs is done using a multi-objective linear optimisation,
which considers the predicted traffic demands of each slice based on an N-previous interval of traffic
demands and the SLAs of the slices. The SLAs are translated to serving weights, which means the slice
with relatively higher serving weight has relatively higher priority, and the model tends to allocate more
resources to it compared to the other slices.
The verification considers eMBB, URLLC, and IoT slices where the serving weight decreases relatively.
The following results are generated using a serving area with 14 cells from the Hamburg port area.
Figure 4-7 presents the traffic changes for the eMBB slice across a day. It can be seen that the traffic
demand for this slice changes dramatically. The figure shows the prediction of traffic demands as well
as allocated throughput to the slice. In addition, the allocated number of PRBs and CPUs for a period of
day is presented (where these are dynamically allocated to different slices from a common resource
pool). It can be seen that the allocated PRBs changed from 202 PRBs up to 3983 PRBs. Also, the
computational resources, i.e. the number of CPUs, changed from 3 CPUs up to 43 CPUs.
Figure 4-7: Radio and computational resource allocation to eMBB slice
Figure 4-8 present the resource allocation to the other two slices: IoT and URLLC. The results show
that the traffic demands for these two slices do not change dramatically and the allocated resources to
them are almost constant.
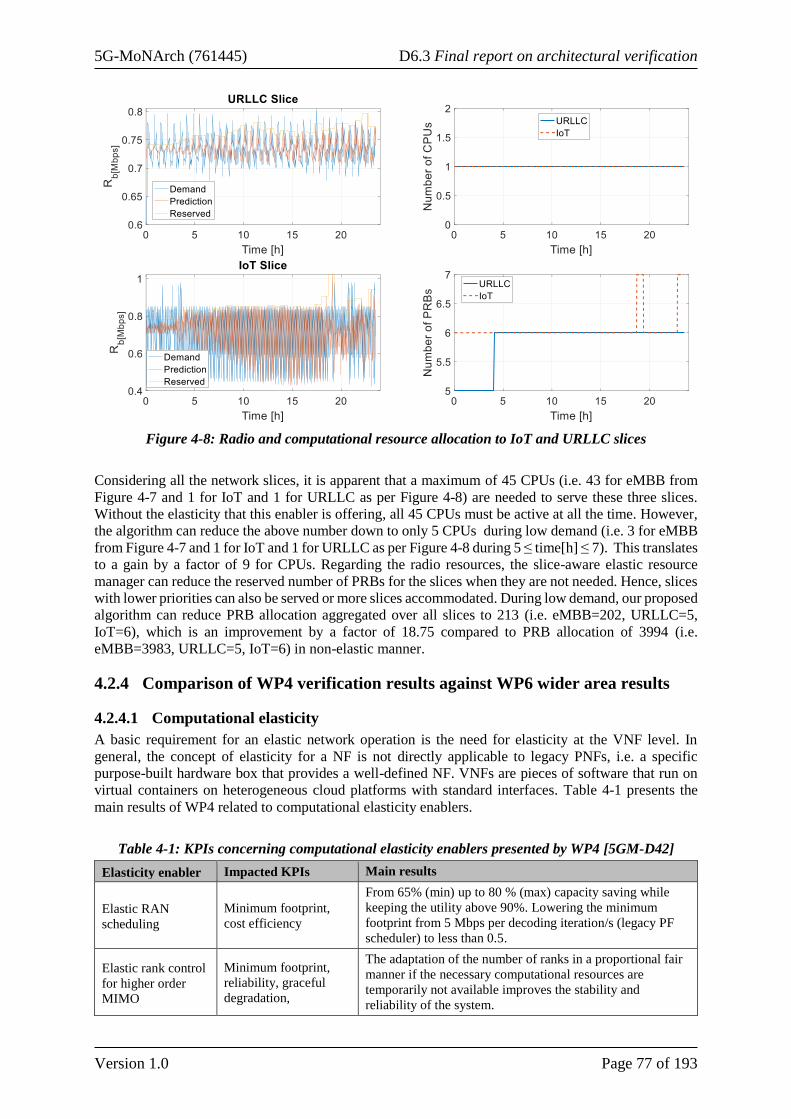
5G-MoNArch (761445) D6.3 Final report on architectural verification
Version 1.0 Page 77 of 193
Figure 4-8: Radio and computational resource allocation to IoT and URLLC slices
Considering all the network slices, it is apparent that a maximum of 45 CPUs (i.e. 43 for eMBB from
Figure 4-7 and 1 for IoT and 1 for URLLC as per Figure 4-8) are needed to serve these three slices.
Without the elasticity that this enabler is offering, all 45 CPUs must be active at all the time. However,
the algorithm can reduce the above number down to only 5 CPUs during low demand (i.e. 3 for eMBB
from Figure 4-7 and 1 for IoT and 1 for URLLC as per Figure 4-8 during 5 ≤ time[h] ≤ 7). This translates
to a gain by a factor of 9 for CPUs. Regarding the radio resources, the slice-aware elastic resource
manager can reduce the reserved number of PRBs for the slices when they are not needed. Hence, slices
with lower priorities can also be served or more slices accommodated. During low demand, our proposed
algorithm can reduce PRB allocation aggregated over all slices to 213 (i.e. eMBB=202, URLLC=5,
IoT=6), which is an improvement by a factor of 18.75 compared to PRB allocation of 3994 (i.e.
eMBB=3983, URLLC=5, IoT=6) in non-elastic manner.
4.2.4 Comparison of WP4 verification results against WP6 wider area results
4.2.4.1 Computational elasticity
A basic requirement for an elastic network operation is the need for elasticity at the VNF level. In
general, the concept of elasticity for a NF is not directly applicable to legacy PNFs, i.e. a specific
purpose-built hardware box that provides a well-defined NF. VNFs are pieces of software that run on
virtual containers on heterogeneous cloud platforms with standard interfaces. Table 4-1 presents the
main results of WP4 related to computational elasticity enablers.
Table 4-1: KPIs concerning computational elasticity enablers presented by WP4 [5GM-D42]
Elasticity enabler Impacted KPIs Main results
Elastic RAN
scheduling
Minimum footprint,
cost efficiency
From 65% (min) up to 80 % (max) capacity saving while
keeping the utility above 90%. Lowering the minimum
footprint from 5 Mbps per decoding iteration/s (legacy PF
scheduler) to less than 0.5.
Elastic rank control
for higher order
MIMO
Minimum footprint,
reliability, graceful
degradation,
The adaptation of the number of ranks in a proportional fair
manner if the necessary computational resources are
temporarily not available improves the stability and
reliability of the system.

5G-MoNArch (761445) D6.3 Final report on architectural verification
Version 1.0 Page 78 of 193
rescuability, cost
efficiency
Computational
elasticity
demonstrator
Graceful degradation,
cost efficiency
Experimental demonstrator shows handling of elastic VNFs
within the physical layer functions of an LTE eNB.
Mx-ART implemented the ‘Elastic VNF Design’ enabler, an adaptation of the 'Computational Elasticity
Demonstrator’. The results show 5% less computational complexity in processing PRBs by limiting
MCS index in the MAC layer, or 25% less computational complexity if this process is implemented in
the PHY layer. These gains are calculated when compared to a case with no computational elasticity.
The ‘Computational Elasticity Demonstrator’ in [5GM-D42] showcased the correlation between used
MCS and processing time and showed how restricting MCS or throughput leads to reduced encoding
processing time, however no results comparable to those by Mx-ART were produced.
4.2.4.2 Orchestration driven elasticity
The elastic design of a VNF has an impact on the elasticity of a network slice, defined as the chain of
VNFs that provides a telecommunication service. Chaining and orchestrating a sequence of VNFs with
different characteristics results in an overall elasticity associated to a tenant running a service using a
single network slice. In turn, this affects the QoE/QoS perceived by users, who may experience different
performance degradations according to the elasticity level allocated by the slice provider. Table 4-2
presents the main results of WP4 related to orchestration driven elasticity enablers.
Table 4-2: KPIs concerning orchestration driven elasticity enablers presented by WP4 [5GM-D42]
Elasticity enabler Impacted KPIs Main results
Intelligent scaling
and orchestration
of VNFs
Resource utilisation
efficiency, cost
efficiency,
reliability
From 4.5% up to 37.8 % CPU reduction, 2.1% to 24.3 %
storage reduction, from 5.7% to 28.8% monetary cost reduction.
12.4% less likely to offload VNFs compared to greedy scaling
and orchestration scheme.
Dynamic VNF
deployment
Rescuability,
reliability, minimum
footprint
Around 41% less CPU resources needed compared to the
benchmark method. From 38% to 266% of more served VNF
chains for a fixed set of computational resources (considering
edge and central cloud jointly) compared to benchmark method.
Mx-ART implemented an “orchestration driven elasticity algorithm” which is an adaptation of
'Intelligent scaling and orchestration of VNFs' enabler. WP6 simulations demonstrate that up to
approximately 37% CPU resources can be saved compared to a case with no orchestration elasticity.
These gains agree with the results of both ‘orchestration driven elasticity’ enablers even though different
scenarios are examined in the evaluation of each enabler.
4.2.4.3 Slice aware elasticity
The topmost level of an elastic operation is elasticity at the infrastructure level, i.e. a requirement that
involves the infrastructure on which elastic VNFs run. The choice of how many network slices are
hosted in the same infrastructure depends on the infrastructure provider (InP) who runs e.g. admission
control algorithms to guarantee that the SLA or security requirements with the various tenants are always
fulfilled. Table 4-3 (see next page) presents the main results of WP4 related to slice aware elasticity
enablers.
Mx-ART implemented an adapted form of the ‘AI-based slice-aware resource management’ enabler
found in Section 4.5.1 of [5GM-D42]. Compared to a system with no slice-aware elasticity, this leads
to up to 145% less CPUs used and ~178% less PRBs used to serve the same slices. This is not directly
comparable to the results for the respective WP4 enabler, as the scenario presented there is very different
compared to the one examined in EC2.

5G-MoNArch (761445) D6.3 Final report on architectural verification
Version 1.0 Page 79 of 193
However, an analysis concerning slicing efficiency in a large-scale scenario, conducted in Section 5.1
of [D4.2], reveals that by dynamically reallocating network resources across slices, substantial capacity
gains can be achieved as a result of using the radio and computing resources more efficiently: Gains in
the order of 10 are achieved in the access network, while the gains in the CN are in the order of 2.
Table 4-3: KPIs concerning slice aware elasticity enablers presented by WP4
Elasticity enabler Impacted KPIs Main results
Resource market-
based admission
control algorithm
Cost efficiency From 100% (min) up to 150 % (max) increased monetisation
compared to benchmark methods
Data driven multi-
slicing efficiency
Resource utilisation
efficiency
From 20% (min) up to 90 % (max) multiplexing efficiency
compared to benchmark method when re-configuration is
possible. If reconfiguration lasts more than 8h, advantages are
negligible at any level
Game theory
approach to
resource
assignment
Cost efficiency From 3% (min) up to 4 % (max) network utilisation compared
to static slicing schemes in terms of network utility
Multi-objective
resource
orchestration
resource utilisation
efficiency, cost
efficiency, area
traffic capacity
From 3.7% to 31.3% improved resource utilisation, from
0.51% to 3.5% less cost and from 6.2% up to 13.4% improved
area traffic capacity, compared to benchmark methods
Profiling of
computational
complexity of RAN
N/A Profiling of computational complexity of various VNFs, based
on processing time of each VNF with different inputs
Slice analytics for
elastic network
slice setup
Minimum footprint,
cost efficiency
At least 18% and at most 23% of fewer resources are needed to
guarantee the same network services, compared to a benchmark
method. Similarly, a fixed set of resources can serve at least 6%
and at most 50% more services with respect to a considered
benchmark system (for an arrival probability of slice requests
higher than 0.5)
Slice-aware
automatic RAN
configuration
Throughout,
Scheduling Delay
From 7% up to 100% throughput gain and 45% up to 56%
beam scheduling delay reduction compared to benchmark
method
Slice-aware
computational
resource allocation
Cost efficiency,
service creation
time, resource
utilisation efficiency
For a fixed number of computational resource requests, from
multiple VNFs of different slices, the execution time needed
was reduced about 5-6 times.
Slice-aware elastic
resource
management
Resource utilisation
efficiency
From 35% (min) up to 100 % (max) more throughput allocated
compared to benchmark method
4.3 Commercial verification
The commercial verification of EC2 examines the challenges, in the existing eMBB business case, of
serving demand hotspots better and how resource elasticity, as introduced under 5G-MoNArch, can help
to reduce costs and improve the business case for such situations. Figure 4-9 gives an overview of the
EC2 scenario considered for commercial verification.
As with all evaluation cases, EC2 is set in the Hamburg study area. The demand hotspot under
consideration is one of the three cruise ship terminals in the Port of Hamburg called Steinwerder cruise
ship terminal (see Figure 4-1). This has been selected as:
• The Steinwerder cruise ship terminal is located on the south side of the river Elbe in the
industrial area of the port where the residential population and hence existing density of antenna
sites is much less than in the city centre (see Figure 4-9).

5G-MoNArch (761445) D6.3 Final report on architectural verification
Version 1.0 Page 80 of 193
• The Steinwerder cruise ship terminal is in one of the deeper parts of the port, near the container
terminals, and hence can accommodate the largest of cruise ships visiting Hamburg. Larger
cruise ships have up to 4,300 passengers on board and 1,500 staff10. As the residential population
in the HPA region of the study area is only approximately 3,000 people, the arrival of such ships
has an impact on the loading of the existing macrocell network in the area.
• The largest cruise ships typically arrive at Steinwerder cruise ship terminal early on Saturday
mornings creating a temporary hotspot of demand in the area around the terminal building until
visitors have dispersed for their planned tours and activities in the city centre and surrounding
areas. In contrast the demand in rest of the city will peak during weekday evening commute
times. This gives an opportunity for processing resources deployed to serve city centre demand
peaks but lying less utilised on Saturday mornings to be reused via elasticity to improve
performance at the cruise ship terminal at its peak times.
Figure 4-9: Temporary demand hotspot scenario evaluated under EC2 with location of existing
macrocell sites shown with pink markers
This analysis builds on the cost benefits of elasticity already presented in [5GM-D42] by:
• Adding consideration of revenue opportunities in demand hotspots to complete the business
case for serving demand hotspots better. This helps to show if the cost savings via elasticity are
enough to make such scenarios more feasible for MSPs to address.
• Aligning with the latest eMBB demand forecasts and cost results being considered for the
Hamburg study area under the verification and validation work of WP6.
4.3.1 Services targeted in EC2 and their anticipated demand
EC2 considers provision of eMBB services to cruise passengers and staff arriving at Steinwerder cruise
ship terminal. Based on the assumptions given in Appendix D.5.1, Figure 4-10 (see next page) shows
the average capacity that would be needed at the cruise ship terminal during its busy hour of 06:30-
07:30 on a Saturday morning when a large cruise ship arrives. This also assumes that three MSPs serve
the cruise ship terminal with each having a 33% market share.
10 Based on discussions with Cruise Gate Hamburg who manage the Steinwerder cruise ship terminal.

5G-MoNArch (761445) D6.3 Final report on architectural verification
Version 1.0 Page 81 of 193
Figure 4-10: Average capacity required per MSP at the cruise ship terminal during its busy hour
(due to the arrival of a large cruise ship)
4.3.2 Revenues assessment
The lack of opportunities to increase existing revenues by serving temporary demand hotspots is a key
reason for these scenarios typically being poorly served in existing mobile networks. Examples include
stadia and transport hubs where demand levels can be extremely concentrated and costly to serve at the
QoS levels more typical of the rest of the network. As well as being costly, subscribers are unlikely to
pay extra beyond their monthly mobile subscription for better service in such locations. For this reason,
the focus of EC2 is on using elasticity to reduce the costs of serving such demand hotspots. However,
to complete the business case for such locations, in this section we briefly examine the benefits and
revenue opportunities from serving demand hotspots better and consider the two cases of:
• Providing an improved eMBB service to the temporary demand hotspots generated at
Hamburg’s cruise ship passenger terminals. We consider this improved eMBB service to be
made up of two components:
o Premium eMBB at cruise terminals, with a guaranteed throughput – this service targets
passengers with an urgent need for higher quality eMBB and its business model is that
the end-user pays a premium for this higher quality connection.
o Best-effort eMBB at cruise terminals which we assume is provided for free. The benefit
to HPA of providing this service, however, is to maintain the port’s competitiveness, or
gain an advantage, as a cruise ship destination.
• Providing an AR tourism application for Hamburg’s Speicherstadt which is part of the Study
Area) which could be funded either through advertising revenues or a per user charge; the
service could be accessed over various terminals such as handsets, Google Glass headsets etc.
and could offer a self-guided tour with information in text, audio, video and mixed reality
overlay formats. This links to 5G-MoNArch’s Turin TC testbed and illustrates the potential
benefits of providing similar applications as were already shown to be growing in popularity in
touristic venues in [5GM-D62] and further validated by our stakeholder discussions with
museums and venues in Section 8.2.2.
The potential benefits from these services would feed into how much a cruise ship terminal operator
such as Cruise Gate Hamburg or a touristic venue might be willing to pay for a network slice to operate
such hotspot services. In our EC2 cost and business case assessment later we focus on the case of the
cruise ship terminal eMBB services. However, the revenue forecasts for the AR tourism application
give an idea of how the business case might change in a different setting and with a different target
application.

5G-MoNArch (761445) D6.3 Final report on architectural verification
Version 1.0 Page 82 of 193
4.3.2.1 Premium eMBB hotspot service
According to HPA, its passenger terminals in Hamburg transport 880,000 passengers per year
[HPA17b]. We assume that take-up of the premium eMBB service rises over time as more passengers
have 5G capable phones and get accustomed to 5G services through their own MSPs.
We project take-up for the premium hotspot service using a saturation curve method. The saturation
level, to which we assume penetration will tend in the long term, was set at 20%. This is largely based
on the baseline estimate of potential “High Performance” subscribers (16% of the population) used in
the wider area eMBB revenues baseline scenario discussed earlier. However, it also makes allowance
for the significantly higher than average income of cruise passengers (higher spending) and their higher
than average age (lower MBB use) which on balance we believe suggests a slightly higher addressable
market. Table 4-4 shows the assumed uptake used for revenue forecasts for this service.
We used the cost of international roaming add-ons (before the 2017 abolition of roaming charges in the
European Economic Area (EEA)) as a proxy for the willingness to pay to use hotspot services, erring
on the side of caution by taking the lower end of charges of around €2 per day. Table 4-5 presents our
forecasts for MSP revenues from the premium eMBB service. In 2030, this premium eMBB revenue
stream would be equal to 2% of the eMBB revenues (for the entire Study Area including the city centre
and for an MSP with 33% market share). Figure 4-11 graphically depicts the forecast. This is partly
driven by the high number of cruise ship passengers coming through the Study Area each year – about
5 times the residential population of the Study Area. However, the duration of the service agreements
with these users are short-lived.
Table 4-4: Forecast penetration for hotspot services, Hamburg Study Area
2020 2021 2022 2023 2024 2025 2026 2027 2028 2029 2030
Premium eMBB 1% 1% 2% 2% 4% 5% 8% 10% 12% 15% 16%
Table 4-5: Forecast MSP revenues for hotspot services, Baseline, Hamburg Study Area: k€
2020 2021 2022 2023 2024 2025 2026 2027 2028 2029 2030
Premium eMBB 10 17 27 42 64 95 133 176 219 257 288
Figure 4-11: Forecast revenues for cruise ship terminal premium eMBB service compared with
study area eMBB medium scenario revenues for a 33% market share
4.3.2.2 AR tourism app
We investigated a ‘user pays revenue model’ for cruise ship customers and an advertising revenue model
for tourists in general. The cruise ship service would offer users a special AR headset, whereas the

5G-MoNArch (761445) D6.3 Final report on architectural verification
Version 1.0 Page 83 of 193
general tourist service could be accessed over a standard handset or tablet. The application content would
be the same for each group. In principle, special AR headsets could be distributed from other sources
such as tourist information offices. Further research into the practicality of AR headset rental through
other channels would be helpful, however it goes beyond the scope of this exercise. We used visitors to
the Elbphilharmonie Plaza (4.5 million a year) located in the Speicherstadt area (see Figure 4-12) as a
proxy for general tourism to the area.
Figure 4-12: Speicherstadt historic area in Hamburg and area for AR tourism application service,
with the Elbphilharmonie in the background (left)
We assumed that museum audio guides and guided tours are the closest equivalents to the cruise ship
passenger AR tourism app. Hence, we set our baseline Average Revenue per User (ARPU) for this
service at €10 per customer, considering museum audio guide prices of €5-7 and Hamburg guided tour
prices in the range €14-25 [Ham19]. This pricing level was also validated by the survey results from the
Turin testbed event (see Section 8.2.2.2).
We based advertising revenues on a cost per thousand impressions (CPM) model, assuming:
• A CPM of €10 given the targeted nature of the advertising. Average CPMs across platforms
such as Instagram, and Google Display Network fall roughly within the range of €2-4. CPMs
for targeted advertising such as Facebook are now reaching CPMs of €10 [Ign19]. This pattern
is also observed in television where targeted CPMs are 3-4x standard CPMs.
• A typical tour duration of 2 hours and 10 advertising spots per hour based on:
o Online advertising such as YouTube or Spotify where assuming one advert for every
two videos – of average length 4 minutes [Min19] – gives just under 7.5 spots per hour;
o Television where advertising breaks vary between roughly 2-4 per hour with 5 or more
individual spots per break.
We again use a saturation curve to model service take-up. The saturation level, to which we assume
penetration will tend in the long term, is set at 40% of all cruise ship passengers (cf. forecast provided
in Table 4-6). We assume that the appeal of the service is wider than the premium eMBB hotspot service,
but not as universal as the eMBB services assessed in EC1. For example, we predict that eMBB
penetration in the “Standard” market segment reaches 77% in 2030.
This revenue would be shared between cruise terminal operators, cruise ship liners, communications
providers and application developers. We believe that the communications service will be essential to
providing the app, since the network slice will deliver the necessary QoE. Hence, we assume that 50%
of the revenue goes to the MSP. Table 4-7 presents our forecasts for MSP revenues from the AR tourist
service. In 2030, the total of the two AR tourism revenue streams would be equal to 13% of the
residential MBB revenues (eMBB + legacy MBB) of an MSP with a 33% market share for the entire
Study Area including the city centre. Figure 4-13 graphically depicts the forecast.

5G-MoNArch (761445) D6.3 Final report on architectural verification
Version 1.0 Page 84 of 193
Table 4-6: Forecast penetration for hotspot services, Hamburg Study Area
2020 2021 2022 2023 2024 2025 2026 2027 2028 2029 2030
AR Tourism 5% 7% 11% 15% 20% 25% 29% 33% 35% 37% 38%
Table 4-7: Forecast MSP revenues for hotspot services, Baseline, Hamburg Study Area: k€
2020 2021 2022 2023 2024 2025 2026 2027 2028 2029 2030
AR tourism: user pays 210 321 473 664 880 1096 1287 1439 1550 1626 1677
AR tourism: advertising 21 33 48 68 90 112 132 147 159 166 171
Figure 4-13: Forecast revenues for AR guided tour service against study area eMBB medium
scenario revenues for a 33% market share
4.3.3 Cost assessment
In the cost assessment for EC2 we consider a scenario where a dedicated small cell network is deployed
to serve the additional demand coming from the passengers arriving on the larger cruise ships visiting
the Steinwerder cruise ship terminal in Hamburg. This is a virtualised small cell network with related
processing provided at the nearest of the four edge cloud sites located in the study area as shown in
Figure 4-14.
Figure 4-14: Network deployment scenario assumed for cruise ship terminal hotspot in EC2

5G-MoNArch (761445) D6.3 Final report on architectural verification
Version 1.0 Page 85 of 193
In the cost analysis presented here, we focus on the ability of elastic intra-slice orchestration driven
elasticity to reduce dimensioning of computational resources by making use of temporal diversity
between peak demand times in the wider Hamburg study area compared with the Steinwerder cruise
ship terminal.
Assuming that the MSP serving the cruise ship terminal is an existing MNO with 33% market share and
small cell spectrum as described in Appendix D, the number of SCs required to serve the low, medium
and high demand scenarios modelled is shown in Figure 4-15. Our assumptions on the capacity per
small cell, how this evolves over time and the cost elements included and excluded in our analysis are
also given in Appendix D.
Figure 4-15: Number of small cells required to serve the cruise ship terminal hotspot over time
While the small cell network around the cruise ship terminal will be heavily utilised when ships arrive
on a Saturday morning, as shown in Figure 4-16, the demand in the rest of the study area is much reduced
compared with the midweek evening rush hour busy hour peak. This means that any computational
resources deployed for the wider area macrocell network will not be heavily utilised at the times when
the small cell cruise ship terminal network is at its highest utilisation and hence there is an opportunity
to share resources between these layers of the network and reduce overprovisioning of computational
resources.
Figure 4-16: Difference in the eMBB medium demand heatmaps between the evening rush hour
and Saturday morning
To determine the number of cores that would be installed at the existing four edge cloud sites in the
study area to handle the existing wide area eMBB traffic over time, we reuse the same eMBB baseline
network as already modelled as the basis for EC1 in Section 3.3.3. The number of cores installed at
each of the four edge cloud sites to serve the study area wide eMBB demand in 2030 is shown in Figure
4-17. The utilisation of these cores is shown for the study area wide eMBB busy hour (on the left) and
for the cruise ship terminal peak time of a Saturday morning (on the right). On a Saturday morning,
when the study area wide eMBB network demand is still building, there are between 171 to 488 cores
not being utilised at each of the four edge cloud sites.

5G-MoNArch (761445) D6.3 Final report on architectural verification
Version 1.0 Page 86 of 193
The total number of cores required to process the traffic from the cruise ship terminal small cell network
during its Saturday morning peak time by 2030 is 113. Clearly, the number of unutilised cores available
from the macrocell network across all 4 edge cloud sites (i.e. 1175 cores) are more than enough to
process the traffic from the cruise ship terminal SCs (i.e. 113 cores). Therefore, if resource elasticity is
used there would be no need to add additional processing, and associated costs, to the network to serve
the small cell demand hotspot network.
Figure 4-17: Number of cores used by wide area eMBB network (blue) and Steinwerder cruise ship
terminal small cell network (orange) during the wide area (left) and hotspot peak times (right)
Figure 4-18 presents the TCO from 2020-2030 inclusive for the small cell network at the cruise ship
terminal. Based on reusing, via orchestration-driven elasticity, the unutilised processing in the wider
area eMBB network as presented in Figure 4-17, the TCO is presented with and without elasticity. This
shows that the edge cloud site costs of the cruise ship terminal network make up 43% of the TCO and
that all of this could be saved by making use of the temporal diversity between the cruise ship terminal
hotspot and wider area eMBB demand via elasticity. Figure 4-17, shows the number of unutilised cores
on a Saturday morning at the Steinwerder edge cloud site for the wider area eMBB network would be
enough to serve the Steinwerder cruise ship terminal. However, in the event of unusually high traffic
levels on the wider area eMBB network in the port area, caused by perhaps an accident and traffic
building up on the Autobahn running through the area, there would be more than enough unutilised
cores available in the other three edge cloud sites around the city which could be used via elasticity.
Figure 4-18: 2020-2030 TCO for cruise ship terminal small cell network with and without elasticity,
medium demand case

5G-MoNArch (761445) D6.3 Final report on architectural verification
Version 1.0 Page 87 of 193
4.3.4 Business case impact
In the business case assessment for EC2 we consider the revenues from a premium eMBB hotspot
service and the costs of deploying and operating the hotspot network to serve this demand at the
Steinwerder terminal only. We focus on the incremental business case for this cruise ship terminal
hotspot service alone and do not include revenues or costs for the wide eMBB network. Further the
business case calculation is based on an MNO with a 33% share of the market.
Table 4-8 presents the NPV and ROI for the Steinwerder cruise terminal premium eMBB service
business case for the medium demand scenario. This is shown with and without elasticity. Figure 4-19
shows the evolution of cumulative DCF for the same two scenarios (which Table 4-8 is based upon11).
Table 4-8: Business case for the for the small cell network at the Steinwerder cruise ship terminal
with and without elasticity, medium demand
Scenario Business Case NPV (M€) ROI
Medium demand, no elasticity -1.7 -89%
Medium demand, elasticity enabled (all edge cloud sites) -0.9 -81%
The results show a strongly negative business case for the cruise terminal hotspot on its own. The NPV
without elasticity enabled is -€1.7 million and the ROI is -89%. As a result, managing costs is key to
limiting the negative impact on the business as a whole. Note that, even with a negative business case,
offering a good mobile service in demand hotspot locations may be considered essential to keep pace
with other competing MSPs and maintain brand image. Enabling elasticity helps to manage costs with
our results indicating a positive impact on the business case, though it remains negative – the NPV is
less negative at -€0.9 million. The change in ROI is less informative in this case as the savings from
elasticity impact costs and ROI is a metric normalised against the investment required or network costs.
Figure 4-19: 2020-2030 cumulative DCF for the small cell network at the Steinwerder cruise ship
terminal with and without elasticity, medium demand
4.3.5 Sensitivity analysis
In this sensitivity analysis we test the impact on the EC2 business case, and related benefits of elasticity,
of changing the following assumptions:
11 Note that the cumulative DCF in 2030 is also equal to the NPV and we use a commercial discount rate of 10%.

5G-MoNArch (761445) D6.3 Final report on architectural verification
Version 1.0 Page 88 of 193
• Assumed eMBB daily demand per person
• Assumed infrastructure ownership and deployment partnerships applied to the small cell
network at the cruise ship terminal.
4.3.5.1 Sensitivity to demand scenario
Figure 4-20 shows the 2020-2030 TCO for the small cell network at the Steinwerder cruise ship terminal
for the cases of the assumed eMBB demand per user varying in line with the low, medium and high
eMBB scenarios presented already for wide area eMBB demand in Section 3.3.1.1.
This shows that the benefit of elasticity reduces the more demand increases. This is due to edge cloud
site costs being a less significant proportion of TCO for higher demand levels. This aligns with the
economies of scale effect seen for edge cloud site costs in [5GN-D23] – the more antenna sites per edge
cloud site the lower the cost per antenna site. However, the antenna site component of TCO tends to
scale more linearly with the number of antenna sites deployed.
We also see that the impact of elasticity depends on the type and scale of deployment that it is applied
to and how significant a proportion of TCO the edge cloud costs are. The small cell demand hotspot
examined here, is a good example of where edge cloud site costs vs. antenna site costs become more
significant compared with macrocell sites. In contrast, when the benefit of elasticity was examined in
the macrocell dominated study area wide eMBB network in [5GM-D42], the cost efficiency benefit was
limited to under 15%. This is because in macrocell networks high site rentals and site civil works costs
make the antenna site costs a more significant component of TCO than the edge cloud site costs. We
note that under 5G networks there is a trend towards smaller cell sizes where the impact of elasticity
becomes more significant.
Figure 4-20: 2020-2030 TCO for the small cell network at the cruise ship terminal with and without
elasticity
Combining costs with revenues to give the DCF and business case analysis under the three demand
scenarios is shown in Table 4-9 and Figure 4-21. These show that the business case worsens as demand
increases due to the higher costs with higher demand but no opportunity for increasing revenues.
Enabling elasticity significantly reduces the extent to which the NPV is negative in both cases. We also
see that the reduction in the benefit of elasticity with higher demand, observed in the cost analysis,
translates to a smaller proportionate improvement in the NPV with elasticity in the higher demand case
compared with the elasticity improvement seen in the low demand case.

5G-MoNArch (761445) D6.3 Final report on architectural verification
Version 1.0 Page 89 of 193
Table 4-9: Business case for the for the small cell network at the Steinwerder cruise ship terminal
with and without elasticity, medium demand
Scenario Business Case NPV (M€) ROI
Low demand, no elasticity -1.3 -88%
Low demand, elasticity enabled (all edge cloud sites) -0.6 -76%
High demand, no elasticity -2.3 -91%
High demand, elasticity enabled (all edge cloud sites) -1.4 -86%
Figure 4-21: 2020-2030 cumulative DCF for the small cell network at the Steinwerder cruise ship
terminal with and without elasticity, low and high demand
4.3.5.2 Sensitivity to hotspot deployment model
As highlighted in the previous sensitivity analysis, the benefits of elasticity are limited to the significance
of the edge cloud site costs in the RAN TCO. This is because elasticity does not impact the antenna site
costs of a network but rather the edge cloud site costs. In many demand hotspot deployment cases these
antenna site costs are the main barrier to MSPs addressing temporary demand hotspots. We therefore
next examine sensitivity of the benefit of elasticity to the type of demand hotspot deployment and
infrastructure ownership model applied.
Neutral host deployment models are gaining interest for demand hotspot locations and are already used
in some locations such as sports stadia. For our cruise ship terminal example, we consider two potential
neutral host deployment models which would help to reduce the risk of investing in antenna site
equipment at hotspots locations for MSPs. When these neutral host models are combined with the ability
of elasticity to reduce the processing costs of MSPs connecting to such systems, these deployment
models, while already available today, become more commercially attractive and less risky for providing
better QoS in hotspot locations.
As in [5GM-D42], Figure 4-22 outlines how ownership of different parts of the mobile network might
vary across the Hamburg study area. It shows, on the left of the diagram, how in the existing wider area
macrocell network all sites, equipment and connectivity between sites is owned by the MSP. However,
as the MSP starts to offer services in the sea port area to the port authority, there may be the opportunity
for partnerships on infrastructure such as the port authority providing sites and access to existing fibre
while the MSP still provides the equipment. The right of the diagram are some possibilities for the
ownership of sites and equipment for a small cell network around the Steinwerder cruise ship terminal.
In our sensitivity analysis, in addition to the MNO owned spectrum and infrastructure scenario already
presented and indicated as option 1 in Figure 4-22, we consider the following two neutral host scenarios:

5G-MoNArch (761445) D6.3 Final report on architectural verification
Version 1.0 Page 90 of 193
• Neutral host antenna sites with MNO spectrum: In this scenario we assume that the neutral
host has made an agreement with all MNOs to support each of their small cell spectrum holdings
on the cruise ship terminal neutral host small cell network. This is option 2 in Figure 4-22.
• Neutral host antenna sites with localised spectrum: In this case we assume that the neutral
host applies for a licence to access localised, low power spectrum in the area of the cruise ship
terminal and makes use of this. This is option 3 in Figure 4-22.
Figure 4-22: Overview of deployment models explored in EC2 sensitivity analysis
The spectrum assumptions for each of these scenarios is given in Appendix D.5.3. We assume that a
neutral host would have a partnership arrangement with the cruise ship terminal landlord and would
receive concessions on access to street furniture and existing fibre under the landlord’s ownership. We
note that the HPA already has fibre connectivity at the Steinwerder cruise ship terminal building and so
it is feasible that this might be offered to a neutral host deployment in some form of partnership
agreement to remove the cost of installing a separate fibre connection for the small cell network at the
terminal building.
Figure 4-23 presents a comparison of the TCO per MNO for these two neutral host scenarios and the
baseline case traditional MNO deployment (as per Section 4.3.3). This shows that when elasticity is not
applied, the TCO reduction varies between 24% and 37% for the two neutral host models considered12.
In both cases, these cost savings are driven by reductions in antenna site costs within the network TCO
(reducing from approximately €1.09 million to approximately €0.38 million in the best case). Much of
this cost reduction is due to the sharing of costs amongst the neutral hosts tenants rather than each MNO
deploying their own separate small cell network.
Figure 4-23 also shows that the edge cloud site costs remain significant and increase their contribution
to the network TCO under the neutral host deployment models proposed. Edge cloud site costs may
therefore become a commercial barrier to the uptake of such models and hence serving demand hotspots.
However, we see that applying elasticity reduces this, now significant, edge cloud site cost component
of the hotspot RAN cost delivering TCO reductions of up to 68%.
12 Note that the amount of localised spectrum is smaller than the total MNO spectrum and that a lower amount of spectrum requires a higher number of small cells to be deployed to meet the demand at the hotspot. This results in a higher deployment cost for the radio sites in the localised spectrum case.

5G-MoNArch (761445) D6.3 Final report on architectural verification
Version 1.0 Page 91 of 193
Figure 4-23: Comparison of the 2020-2030 TCO of the small cell network to serve the cruise ship
hotspot under different deployment models and levels of elasticity
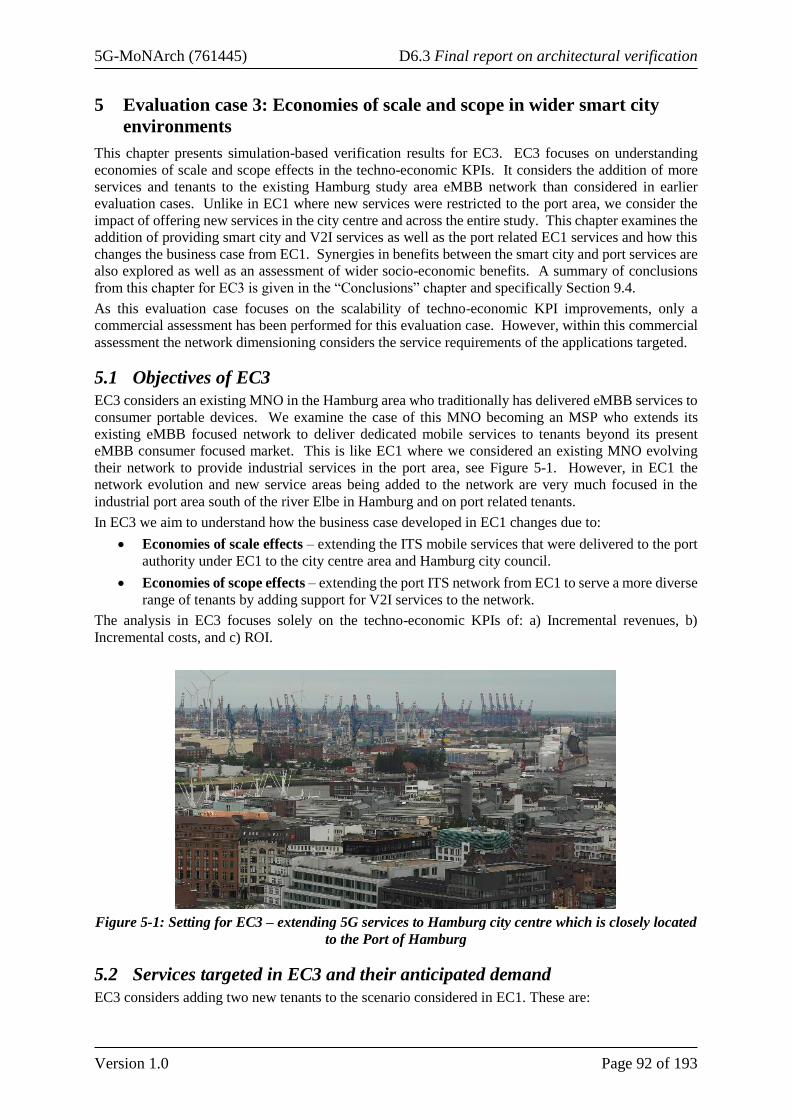
5G-MoNArch (761445) D6.3 Final report on architectural verification
Version 1.0 Page 92 of 193
5 Evaluation case 3: Economies of scale and scope in wider smart city
environments
This chapter presents simulation-based verification results for EC3. EC3 focuses on understanding
economies of scale and scope effects in the techno-economic KPIs. It considers the addition of more
services and tenants to the existing Hamburg study area eMBB network than considered in earlier
evaluation cases. Unlike in EC1 where new services were restricted to the port area, we consider the
impact of offering new services in the city centre and across the entire study. This chapter examines the
addition of providing smart city and V2I services as well as the port related EC1 services and how this
changes the business case from EC1. Synergies in benefits between the smart city and port services are
also explored as well as an assessment of wider socio-economic benefits. A summary of conclusions
from this chapter for EC3 is given in the “Conclusions” chapter and specifically Section 9.4.
As this evaluation case focuses on the scalability of techno-economic KPI improvements, only a
commercial assessment has been performed for this evaluation case. However, within this commercial
assessment the network dimensioning considers the service requirements of the applications targeted.
5.1 Objectives of EC3
EC3 considers an existing MNO in the Hamburg area who traditionally has delivered eMBB services to
consumer portable devices. We examine the case of this MNO becoming an MSP who extends its
existing eMBB focused network to deliver dedicated mobile services to tenants beyond its present
eMBB consumer focused market. This is like EC1 where we considered an existing MNO evolving
their network to provide industrial services in the port area, see Figure 5-1. However, in EC1 the
network evolution and new service areas being added to the network are very much focused in the
industrial port area south of the river Elbe in Hamburg and on port related tenants.
In EC3 we aim to understand how the business case developed in EC1 changes due to:
• Economies of scale effects – extending the ITS mobile services that were delivered to the port
authority under EC1 to the city centre area and Hamburg city council.
• Economies of scope effects – extending the port ITS network from EC1 to serve a more diverse
range of tenants by adding support for V2I services to the network.
The analysis in EC3 focuses solely on the techno-economic KPIs of: a) Incremental revenues, b)
Incremental costs, and c) ROI.
Figure 5-1: Setting for EC3 – extending 5G services to Hamburg city centre which is closely located
to the Port of Hamburg
5.2 Services targeted in EC3 and their anticipated demand
EC3 considers adding two new tenants to the scenario considered in EC1. These are:

5G-MoNArch (761445) D6.3 Final report on architectural verification
Version 1.0 Page 93 of 193
Hamburg city council – we focus on the business case for extending the port ITS to the city centre but
also consider the benefits of other smart city services that might be delivered via a 5G-MoNArch like
network. The smart city services include:
• City ITS – this differs from the port ITS which was targeting temporary construction traffic
lights. In this case providing connectivity to the network of permanent traffic light sets and a
selection of smart signs around the city is considered. Wireless CCTV is not considered as part
of the city ITS as CCTV observation points are already available and do not need to be moved
as was the case for temporary construction site ITS in the port area.
• Environmental monitoring – this includes a series of low cost, low power sensors around the
city for environmental monitoring and improving efficiency of services such as refuge
collection.
• Smart energy and water services – this includes support for smart meter devices and
decentralised energy grid management. Sensor devices can also be extended to the water
network to detect leaks, monitor flow levels and balance supply and demand better.
Car manufacturers – we examine the business case for providing V2I services. This includes:
• Connected vehicle infotainment – essentially eMBB in vehicles, e.g. for non-real-time
information on local amenities and road conditions, and entertainment or content for passengers
such as video and social media.
• Assisted driving – a basic driver assistance service that initially grows more quickly than semi-
automated driving. This includes the provision of real time information to drivers from roadside
infrastructure on upcoming hazards so that the driver can take evasive action.
• Semi-automated driving – a more advanced driver service that offers more autonomy than the
basic service but not full autonomy. This service provides partial automation – e.g. lane
changing and response to alerts from roadside infrastructure or other similarly equipped
vehicles. In contrast to assisted driving services, we expect semi-automated driving to require
high reliability and low latency due to the greater level of autonomy it provides.
While the benefits assessment has been performed against each of these services, for the purposes of
cost modelling and impact on business case we focus on the cases of extending the network to deliver
city ITS and V2I services. The service requirements and demand per device considered for each of
these services are as included in Deliverable D6.2 [5GM-D62]. This gives the demand profile compared
with the existing outdoor eMBB demand for a single MSP with a 33% market share, see Figure 5-2.
Figure 5-2: Daily demand in the study area for the additional EC3 services of city ITS and V2I
services compared with the eMBB outdoor demand for a single MSP with 33% market share

5G-MoNArch (761445) D6.3 Final report on architectural verification
Version 1.0 Page 94 of 193
5.3 Economies of scale effects – providing similar services to more tenants
over a wider area
We examine the effect on revenues & costs of extending the EC1 network to smart city services.
5.3.1 Benefits assessment for providing smart city services
The Hamburg Study Area is relatively small so smart city systems should be deployed faster than for
the whole country. As a result, we assume that ITS, smart energy, smart water & environmental
monitoring are deployed over the course of 3 years, giving an effective uptake of 33% in 2020, 66% in
2021 and 100% thereafter. Our approach to forecasting revenues and social benefits associated with
these smart city services is given in detail in Appendix D.2. In summary the basis of this is as follows:
• ITS revenues are based on historic spending by city councils on ITS systems to date pro-rated
to the population size. ITS social benefits are based on reduced congestion and travel times,
reduce greenhouse gas emissions (from better traffic flow) and reduced accidents from better
signage and road condition information.
• Smart energy revenues are based on existing forecasts for smart energy spend per head of
population taken across several countries. We use Germany’s annually increasing CO2
reduction target as a scaling factor for how smart energy spend might increase over time. The
main social benefit of smart energy is reductions in greenhouse gas emissions.
• Environmental monitoring revenues are based on typical cost benefit ratios applied for city
council services. The benefits here are based on a reduction in the number of premature deaths
due to air quality.
Table 5-1, Table 5-2 and Figure 5-3 present the results for smart city revenue and social benefits in the
Baseline scenario. They cover intelligent transport, smart energy grids, smart water and waste, and
environmental monitoring services. In 2030, total smart city revenues equal 2.9% of total MBB
revenues or nearly 9% of the eMBB revenues of a single MSP with a 33% market share.
Table 5-1: Smart city revenues, Baseline, Hamburg Study Area: k€
2020 2021 2022 2023 2024 2025 2026 2027 2028 2029 2030
Intelligent transport 30 64 101 106 111 116 122 128 135 142 149
Smart grids 125 268 421 443 467 492 518 545 574 605 637
Smart water 47 98 149 153 157 161 165 169 173 178 182
Environmental
monitoring 166 324 463 443 424 404 384 364 345 325 305
Total 368 753 1134 1146 1158 1173 1189 1207 1227 1249 1273
Table 5-2: Social benefits for smart city services, Baseline, Hamburg Study Area: k€
2020 2021 2022 2023 2024 2025 2026 2027 2028 2029 2030
Reduced travel time: ITS 403 825 1244 1257 1273 1291 1311 1333 1356 1381 1407
CO2 emissions: ITS 191 375 540 521 502 484 467 450 433 417 402
Accidents: ITS 93 188 281 281 281 281 281 281 281 281 281
CO2 emissions: Smart
energy 29 132 308 424 543 666 792 921 1054 1191 1331
Reduced air pollution:
environmental
monitoring
829 1618 2316 2217 2118 2019 1920 1821 1723 1624 1525
Total 1545 3137 4688 4699 4717 4741 4770 4806 4847 4893 4945

5G-MoNArch (761445) D6.3 Final report on architectural verification
Version 1.0 Page 95 of 193
(a) Smart city services vs. eMBB revenues for a single
MSP with 33% market share (b) Social benefits for smart city services
Figure 5-3: Results for smart city revenue and social benefits in the Baseline scenario
Our analysis suggests that smart grids and environmental monitoring generate the greatest smart city
revenues. It is worth noting that ITS revenues may be depressed by the fact that assisted driving services
target many of the same benefits. Though they are likely to be complementary to each other, the benefits
of greater road safety, reduced congestion and pollution are likely to be shared between them.
We also note that our predicted social benefits for smart city services are much higher than predicted
revenues – nearly 4 times higher. This suggests that smart city services can generate considerable
benefits for citizens over and above the resources that utility companies and public authorities put into
them. Restrictions on public authority budgets may also affect the ability of these customers to pay for
smart city services. Local authorities may seek to circumvent budgetary restrictions by considering
partnerships with MSPs and offering access to their facilities, such as street furniture or facilitating
neutral host networks, in return for greater service provision.
5.3.1.1 Synergies between the city centre and the port in ITS and environmental
monitoring
Any smart city services used by the City of Hamburg will potentially reap the benefits of similar services
being used in the port area by HPA and having an impact on the wider city. Example services providing
these synergies are:
• ITS – HPA could provide information to the City about freight traffic expected to exit/enter the
port area to/from the wider City. HPA could also smooth out traffic peaks within the port using
data from port operations and ITS roadside infrastructure (e.g. smart traffic routeing). The main
synergies would be further reductions in congestion and greenhouse gas emissions.
• Environmental monitoring – HPA and businesses in the port might use environmental
monitoring services to comply with regulations on pollution. Keeping pollution to within
guidelines would bring additional benefits to that from environmental monitoring by the City
authorities. It would represent an externality (or spin-off) benefit to the citizens of Hamburg.
Synergies with ITS
These synergies are related to the amount of freight traffic from the port in the Study Area. We do not
have precise information on the direction of freight traffic from the port, however, most of the freight
traffic is likely to be port related. Hence, we take the ratio of freight vehicles to total vehicles in the
Study Area (c. 14%) as upper bound on potential synergies for reduced congestion and CO2 emissions.

5G-MoNArch (761445) D6.3 Final report on architectural verification
Version 1.0 Page 96 of 193
We assume that the impact of freight traffic on congestion and CO2 is directly proportional to the number
of freight vehicles as a proportion of all vehicles. The synergy will be a fraction of this amount, however
there is little evidence from which to derive an estimate. Hence, we have assumed that the potential
synergy is equal to an additional 25% reduction in the ITS-related congestion and CO2 savings
attributable to freight traffic. The resulting numbers in terms of savings are provided in Table 5-3.
Table 5-3: ITS synergies: social benefits, Baseline, Hamburg Study Area: k€
2020 2021 2022 2023 2024 2025 2026 2027 2028 2029 2030
Reduced travel time 14.5 29.8 44.9 45.4 46.0 46.6 47.4 48.1 49.0 49.9 50.8
Reduced CO2 emissions 6.9 13.5 19.5 18.8 18.1 17.5 16.9 16.2 15.6 15.1 14.5
Environmental monitoring by HPA and private businesses in the port
The basis of this calculation is pollution emissions reported by HPA in terms of nitrous oxides (NOx),
sulphur oxides (SOx) and particulate matter (PM) [HPA17c]. We include HPA’s data on pollution from
shipping and industrial uses but exclude road and rail transport which would be covered by
environmental monitoring carried out by the City of Hamburg in the wider Study Area. Other IoT
services such as ITS and assisted driving will also have an impact on vehicle pollution. These
environmental monitoring estimates are separate from these effects.
Recorded pollution emissions are multiplied by estimates of the cost to society per tonne of pollutant
from [DEFRA19]. This gives a total potential benefit from eliminating pollution from the port.
We assume that 5G enabled environmental monitoring could reduce emissions by 5% as we did in the
main environmental monitoring calculation for the Study Area. We then apply our figure of 15% for
the impact attributable to communications services, as we did for the calculation for the whole Study
Area. Table 5-4 reports our forecast for the social benefit arising from environmental monitoring social
benefits arising from HPA and private businesses in the port. The social benefits are a major proportion
(61% in 2030) of those for the whole Study Area. This reflects the concentration of industry and
shipping in the port area, and their contributions to pollution. For example, shipping and industry are
responsible for 84% of Oxides of Nitrogen (NOx), 97.5% of PM and nearly all Oxides of Sulphur (SOx)
emissions in the port area itself.
We have also produced a high-level forecast for environmental revenues in the port area from HPA and
industrial businesses operating in the port. Given the lack of publicly available information on private
sector contracts or willingness to pay for environmental monitoring, we have applied the same
methodology as before in the revenue calculation for the whole Study Area. We take the social benefit
forecast set out above and assume the following:
• A benefit cost ratio of 5, which implies that costs (and therefore revenues from environmental
monitoring services) = 20% of benefits. This is more appropriate.
• 15% of these environmental monitoring revenues go to communications, as explained above.
Table 5-5 reports the resulting revenue forecast. The revenues for HPA and port business represent the
same proportion of the whole Study Area revenues – 61% - as for the social benefits as noted above.
Table 5-4: Environmental monitoring synergies: social benefits, Baseline, from HPA and port
businesses: k€
2020 2021 2022 2023 2024 2025 2026 2027 2028 2029 2030
Reduced air pollution 508 991 1419 1358 1298 1237 1176 1116 1055 995 934
Table 5-5: Environmental monitoring synergies: revenues, Baseline, from HPA and port
businesses: k€
2020 2021 2022 2023 2024 2025 2026 2027 2028 2029 2030
Reduced air pollution 102 198 284 272 260 247 235 223 211 199 187
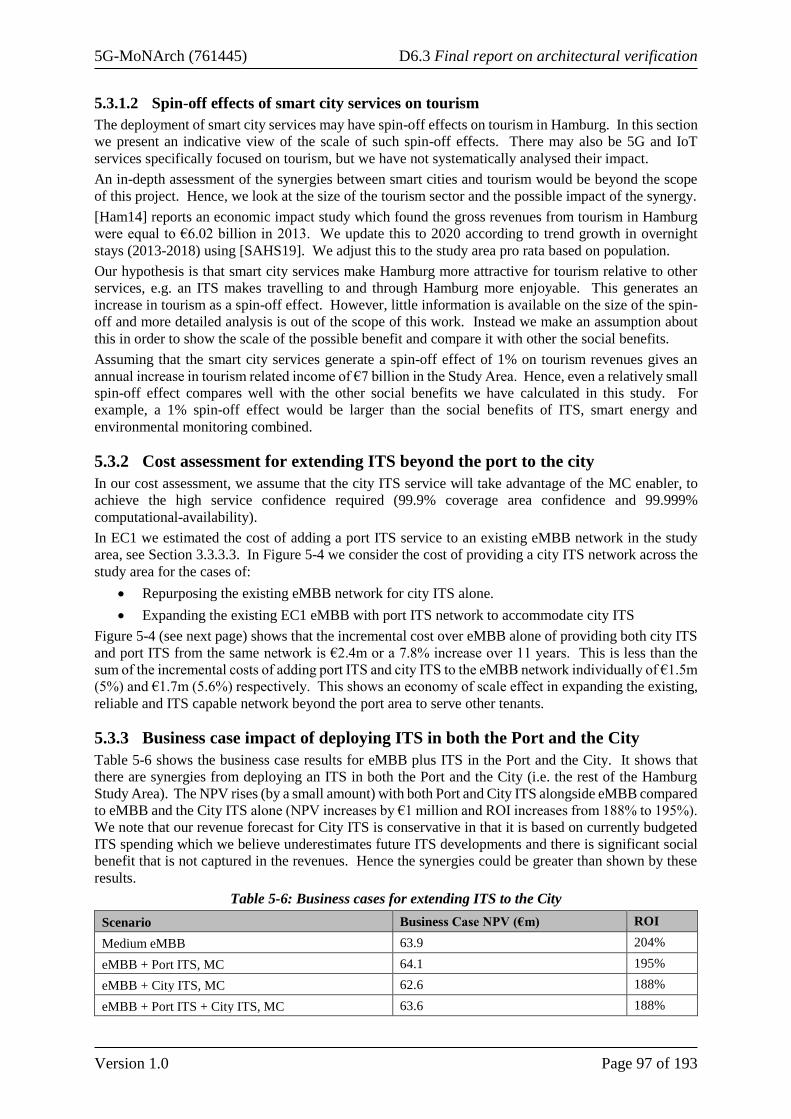
5G-MoNArch (761445) D6.3 Final report on architectural verification
Version 1.0 Page 97 of 193
5.3.1.2 Spin-off effects of smart city services on tourism
The deployment of smart city services may have spin-off effects on tourism in Hamburg. In this section
we present an indicative view of the scale of such spin-off effects. There may also be 5G and IoT
services specifically focused on tourism, but we have not systematically analysed their impact.
An in-depth assessment of the synergies between smart cities and tourism would be beyond the scope
of this project. Hence, we look at the size of the tourism sector and the possible impact of the synergy.
[Ham14] reports an economic impact study which found the gross revenues from tourism in Hamburg
were equal to €6.02 billion in 2013. We update this to 2020 according to trend growth in overnight
stays (2013-2018) using [SAHS19]. We adjust this to the study area pro rata based on population.
Our hypothesis is that smart city services make Hamburg more attractive for tourism relative to other
services, e.g. an ITS makes travelling to and through Hamburg more enjoyable. This generates an
increase in tourism as a spin-off effect. However, little information is available on the size of the spin-
off and more detailed analysis is out of the scope of this work. Instead we make an assumption about
this in order to show the scale of the possible benefit and compare it with other the social benefits.
Assuming that the smart city services generate a spin-off effect of 1% on tourism revenues gives an
annual increase in tourism related income of €7 billion in the Study Area. Hence, even a relatively small
spin-off effect compares well with the other social benefits we have calculated in this study. For
example, a 1% spin-off effect would be larger than the social benefits of ITS, smart energy and
environmental monitoring combined.
5.3.2 Cost assessment for extending ITS beyond the port to the city
In our cost assessment, we assume that the city ITS service will take advantage of the MC enabler, to
achieve the high service confidence required (99.9% coverage area confidence and 99.999%
computational-availability).
In EC1 we estimated the cost of adding a port ITS service to an existing eMBB network in the study
area, see Section 3.3.3.3. In Figure 5-4 we consider the cost of providing a city ITS network across the
study area for the cases of:
• Repurposing the existing eMBB network for city ITS alone.
• Expanding the existing EC1 eMBB with port ITS network to accommodate city ITS
Figure 5-4 (see next page) shows that the incremental cost over eMBB alone of providing both city ITS
and port ITS from the same network is €2.4m or a 7.8% increase over 11 years. This is less than the
sum of the incremental costs of adding port ITS and city ITS to the eMBB network individually of €1.5m
(5%) and €1.7m (5.6%) respectively. This shows an economy of scale effect in expanding the existing,
reliable and ITS capable network beyond the port area to serve other tenants.
5.3.3 Business case impact of deploying ITS in both the Port and the City
Table 5-6 shows the business case results for eMBB plus ITS in the Port and the City. It shows that
there are synergies from deploying an ITS in both the Port and the City (i.e. the rest of the Hamburg
Study Area). The NPV rises (by a small amount) with both Port and City ITS alongside eMBB compared
to eMBB and the City ITS alone (NPV increases by €1 million and ROI increases from 188% to 195%).
We note that our revenue forecast for City ITS is conservative in that it is based on currently budgeted
ITS spending which we believe underestimates future ITS developments and there is significant social
benefit that is not captured in the revenues. Hence the synergies could be greater than shown by these
results.
Table 5-6: Business cases for extending ITS to the City
Scenario Business Case NPV (€m) ROI
Medium eMBB 63.9 204%
eMBB + Port ITS, MC 64.1 195%
eMBB + City ITS, MC 62.6 188%
eMBB + Port ITS + City ITS, MC 63.6 188%

5G-MoNArch (761445) D6.3 Final report on architectural verification
Version 1.0 Page 98 of 193
(a) Cost of extending ITS beyond the port to the city (b) 2020-2030 TCO for eMBB alone, eMBB with city
ITS, eMBB with port ITS and eMBB with city ITS &
port ITS
Figure 5-4: Economy of scale impact on cost of delivering city and port ITS from the same network
5.4 Economies of scope effects – extending the network to deliver a wider
range of services and tenants
In this section we look at expanding the EC1 network to deliver more services to different tenants in the
study area. We consider the extension of the network to accommodate V2I services.
5.4.1 Benefits assessment for extending to V2I services
We model V2I service take-up in the study area using a saturation curve methodology which is informed
by market research forecasts of the take-up of connected cars. [5GN-D23] provides more details of the
methodology. The driver assistance services are substitutes, hence we model a saturation curve for both
segments combined and a transition between them, see Table 5-7.
The 5G NORMA ARPU for driver assistance services assumed that these services effectively led to a
reduction of vehicle insurance premiums. In this analysis, we apply the same assumptions that ARPU
is 18% (basic) and 30% (semi-automated) of the average premium for car insurance in Germany: €325
[Sta19]. These assumptions are based on reported insurance reductions of up to 30% from telematics-
based driver monitoring systems. V2I services might only capture part of the potential reduction in
insurance costs. However, additional value comes from greater convenience, increased fuel efficiency
and reduced travel times.
Connected vehicle infotainment ARPU is modelled as an uplift on 3rd party revenue forecasts for an
equivalent 4G infotainment service: connectivity revenues + 10% of entertainment revenues, [Gsm13].
Social benefits for V2I are similar to those for ITS services, namely: reductions in travel time due to
lower congestion; reductions in greenhouse gas emissions (linked to reduced congestion) and reduced
accidents. There is little direct evidence on the impact of assisted driving on these negative road traffic
impacts since these services have not yet been rolled out on a substantial basis. However [ERTICO15]
reports some impact on studies and trials of in-vehicle systems for promoting better driving and reducing
CO2 emissions. They report a 3-12% reduction in urban CO2 emissions for navigation and “eco-
routeing” studies. For studies on driver behaviour and “eco-driving” systems, they report reductions of
6-12.5%. We assumed a baseline level of 5%.
Clearly there is an issue with how V2I and ITS services jointly work. There may be some overlap
between the benefits they are targeting in which case our estimates will double-count a fraction of the
benefits. However, there may also be synergies between V2I and ITS, particularly over the exchange

5G-MoNArch (761445) D6.3 Final report on architectural verification
Version 1.0 Page 99 of 193
of information between vehicles and ITS systems e.g. at traffic blackspots and where accidents have
taken place. Further research on the ITS/V2I interactions would be useful to explore these issues.
Table 5-8, Table 5-9 and Figure 5-5 present the results of our estimates for V2I revenues and associated
social benefits for our Baseline Scenario. The revenue forecast for V2I is an order of magnitude higher
than for ITS, even after excluding V2I infotainment. However, the predicted social benefits for V2I are
a similar order of magnitude, though higher, to ITS suggesting that smart city ITS systems can deliver
good value for money in terms of societal impact. This may also reflect the fact that individual vehicle
users are not budget constrained in the same way as public authorities.
Table 5-7: V2I penetration, Baseline, Hamburg Study Area
2020 2021 2022 2023 2024 2025 2026 2027 2028 2029 2030
V2I: Assisted driving 1% 1% 2% 3% 5% 8% 12% 17% 24% 29% 33%
V2I: Semi-auto. driv. 0% 1% 1% 2% 3% 4% 6% 10% 14% 21% 29%
V2I: Infotainment 3% 5% 8% 12% 18% 27% 38% 50% 62% 73% 82%
Table 5-8: V2I revenues, Baseline, Hamburg Study Area: k€
2020 2021 2022 2023 2024 2025 2026 2027 2028 2029 2030
V2I: Assisted driving 77 77 128 212 345 547 837 1217 1652 2061 2337
V2I: Semi-auto. driv. 0 82 128 200 311 480 736 1114 1657 2405 3376
V2I: Infotainment 320 518 829 1302 1993 2938 4124 5462 6800 7986 8932
Total 397 677 1085 1715 2649 3965 5697 7793 10109 12453 14645
Table 5-9: Social benefits for V2I, Baseline, Hamburg Study Area: k€
2020 2021 2022 2023 2024 2025 2026 2027 2028 2029 2030
Reduced travel time: V2I 34 55 91 149 241 385 598 896 1280 1726 2189
CO2 emissions: V2I 16 25 40 62 95 144 213 302 409 522 625
Accidents: V2I 8 13 21 33 53 84 128 189 265 351 437
Total 57 93 151 244 390 613 939 1387 1954 2598 3251
(a) V2I forecast revenues for the study area compared
with eMBB revenues for a single MSP with 33% market
share (b) Social benefits from V2I services
Figure 5-5: Estimates for V2I revenues and associated social benefits for Baseline Scenario

5G-MoNArch (761445) D6.3 Final report on architectural verification
Version 1.0 Page 100 of 193
Our results show significant revenues and social benefits for V2I services. V2I infotainment revenues
are equal to 20% of all eMBB revenues in 2030 showing the potential there is for in-vehicle
entertainment and information services. Revenues from assisted and semi-automated driving services
are lower than for infotainment but still equal to 13% of all eMBB revenues in 2030.
5.4.2 Cost assessment for extending to V2I services
5.4.2.1 Cost of infotainment
Infotainment is a service that creates an additional capacity load on the mobile network. From a
geographical location perspective, it coincides with in-vehicle eMBB. The service technical
requirement (cell edge throughput, radio and computational availability) are like eMBB, with the
following two exceptions: a) UT antennas on vehicles have 2 elements, following the feedback of the
automotive industry, and b) the UT is situated on the vehicle and connectivity benefits from voiding
vehicle penetration loss. Therefore, it is expected that network upgrades that are attributed to
infotainment are largely for provision of additional capacity.
Note that delivering equal demand quantity (e.g. 1 GB of video) to a vehicle creates a heavier network
load compared to that in eMBB. This is due to the inherent lower spectral efficiency of a vehicular UT
with antenna elements limited to 2, compared to handheld/wearable UT which features 4 antenna
elements. For example, if in mid band the cell spectral efficiency is 8.5 bit/s/Hz for 32T4R then it could
be 5.9 bit/s/Hz for 32T2R (i.e. a 31% reduction).
Additionally, the share of infotainment demand with mobility (e.g. > 5 km/h) is larger than that of
eMBB. The latter is assumed that consists of a blend of pedestrians and vehicles of various speeds,
whereas the former is purely of vehicles which are occasionally stationary.
For the reasons above infotainment is expected to increase the capacity requirement in the network, in
both radio and computational resource axes.
Based on the site breakdown by configuration given in Figure 5-6, by 2030 the network that serves
infotainment has upgraded 9% of the macrocell layer to make full use of the MNO’s available macrocell
bandwidth, i.e. 170 MHz, 80 MHz of which at mid band. The small cell layer also increases from 0.33
(value for eMBB-only) to 2.2 small cells per macro site, to provide additional capacity on congested
traffic arteries and at major junctions with traffic lights.
Figure 5-6: Network evolution to support eMBB and infotainment. Note that in this table a small
cell denotes a small cell site, consisted of two small cells
sub
-1 G
Hz
1.8
to
2.6
GH
z
3.4
to
3.6
GH
z
sub
-1 G
Hz
1.8
to
2.6
GH
z
3.4
to
3.6
GH
z
Small cell 0 4 4 0 20 20
Small cell 0 2 2 0 20 20
Small cell 0 2 0 0 20 0
Macrocell 4 4 32 30 60 80
Macrocell 4 4 0 30 60 0
Macrocell 0 4 32 0 40 80
Macrocell 4 4 0 30 40 0
Macrocell 2 2 0 20 40 0
Macrocell 2 2 32 10 40 40
Macrocell 0 2 32 0 40 80
Macrocell 0 2 32 0 40 40
Macrocell 2 2 0 10 40 0
Macrocell 2 0 0 10 0 0
Macrocell 0 2 0 0 40 0
Macrocell 0 2 0 0 20 0
antenna
count BW (MHz)

5G-MoNArch (761445) D6.3 Final report on architectural verification
Version 1.0 Page 101 of 193
As shown in Figure 5-7, infotainment uptake and demand on the network increases gradually between
2020-30. In 2020 the increase in network demand, compared with eMBB alone, is 19% with a peak in
in 2028 of 88%. In broad terms, from 2025 onwards infotainment is a large contributor to network’s
demand. However, we note that the network also has access to technical upgrade routes to expand
capacity by this time. For example, if demand warrants then macro cells can have access to 80 MHz at
mid band from 2023.
As shown in Figure 5-8, the 2020-30 cumulative network cost attributed to infotainment sums to €14m,
or €1.3m pa. This is a 46% increase over eMBB alone.
Figure 5-7: Infotainment demand in comparison to eMBB
(a) Cost of providing infotainment service (b) 2020-2030 TCO for eMBB alone and eMBB with
infotainment
Figure 5-8: Cost of providing infotainment service
5.4.2.2 Cost of semi-automated driving
Semi-automated driving is a service that first generates demand in 2021. As semi-automated driving
has more stringent reliability criteria than eMBB (99.9% coverage area confidence and 99.999%
computational-availability), its service requires a denser network compared to that which serves just
eMBB. The main contributor to this additional densification requirement is the fact that UT antennas
on vehicles have 2 elements, following the feedback of the automotive industry. To counterbalance the
stricter reliability criteria semi-automated driving UT benefit from MC opportunities by data

5G-MoNArch (761445) D6.3 Final report on architectural verification
Version 1.0 Page 102 of 193
duplication. Semi-automated driving demand volume is relatively small compared to eMBB, such that
it is expected that semi-automated driving may not require network improvements from capacity
perspective, and that data duplication can be applied.
The network cost attributed to serving semi-automated is expected to sum to €1.4m over 10 years (€140k
pa), or 4.4% TCO increase. With respect to coverage, MC ensures that costs of high reliability remain
low. In terms of capacity, the demand-increase on eMBB that is associated to vehicular services grows
from 1.6% in 2021 to 9.3% in 2030. As a result, the additional capacity requested by the mobile network
is diluted within the upgrades to satisfy eMBB demand growth (TCO increase < demand increase).
The demand load on the network is shown in Figure 5-9 and the cost of providing semi-automated
driving service is depicted in Figure 5-10.
Figure 5-9: Semi-automated driving demand in comparison to eMBB
(a) Cost of providing semi-automated driving service (b) 2020-2030 TCO for eMBB alone and eMBB with
semi-automated driving
Figure 5-10: Cost of providing semi-automated driving service
5.4.2.3 Cost of port ITS and semi-automated driving
The cost of serving port ITS and semi-automated driving is shown in Figure 5-11. Economies of scope
are apparent, because supporting each service individually costs more than repurposing the network to

5G-MoNArch (761445) D6.3 Final report on architectural verification
Version 1.0 Page 103 of 193
support the same services jointly. More specifically, adding port ITS costs €1.5m over 11 years, adding
semi-automated driving costs €1.4m over 11 years, adding semi-automated driving and port ITS costs
€2.3m, which corresponds to savings of €0.6m over 11 years or savings of 21%.
(a) Cost of providing port ITS and semi-automated
driving services (b) 2020-2030 TCO for eMBB alone and eMBB with
port ITS & semi-automated driving
Figure 5-11: Cost of providing port ITS and semi-automated driving services
5.4.3 Business case impact of extending to V2I services
Table 5-10 shows how the eMBB business case is impacted by extending the network to provide V2I
services. We see a sharp difference between adding an infotainment service and adding Vehicle to
everything (V2X) semi-automated driving. Semi-automated driving improves the NPV to a limited
extent by €0.5 million (while the ROI falls slightly). However, for eMBB plus infotainment the business
case worsens significantly with NPV falling by €7 million and ROI falling to 127%.
We explored the business case for semi-automated driving in more detail by considering its incremental
impact. In the incremental business case, the cumulative DCF only turns positive in 2027 and continues
on an upward trend thereafter. This reflects the gradual uptake of semi-automated driving over the model
period and investment risk in supporting such services. Hence, much of the value from a more mature
uptake of semi-automated driving comes after the end of the model period and is not fully reflected in
the NPV or ROI we calculate.
If semi-automated driving is added to a network already set up to provide eMBB plus Port ITS, the
business case in NPV terms improves further – to €64.9 million (as opposed to €64.4 million for eMBB
plus semi-automated driving). Some of this improvement is because it costs less to add semi-automated
driving to an eMBB plus Port ITS network compared to eMBB only because the network specification
has already been made higher for port ITS (i.e. an economy of scope effect).
Table 5-10: Business cases for extending to V2I services
Scenario Business Case NPV (M€) ROI
Medium eMBB 63.9 204%
eMBB + Port ITS, MC 64.1 195%
eMBB + infotainment, single-connectivity 57.3 127%
eMBB + semi-automated driving, MC 64.4 198%
eMBB + Port ITS + semi-automated driving MC 64.9 195%

5G-MoNArch (761445) D6.3 Final report on architectural verification
Version 1.0 Page 104 of 193
6 Testbed measurements, related KPIs and conclusions on quantitative
verification
Chapters 3, 4 and 5 have presented verification results based on simulation models for each of the three
WP6 evaluation cases. However, not all KPIs can be credibly assessed in simulation models. Some
require implementation on real hardware and in real environments for proper assessment. In this chapter
we complete the quantitative verification analysis of WP6 by considering measurements and results
from the two project testbeds. These are then compared to our existing findings against the target KPIs
and conclusions drawn for improvements in target KPI set based on both the simulation and non-
simulation-based verification activities.
6.1 KPIs verified by testbed measurements
The experimental evaluation performed in the SSP and TC testbeds showcase the technical feasibility
of the network architecture proposed, by demonstrating the ability to support the deployment and
operations of diverse applications with heterogeneous demands. In the following sub-section KPI results
measured in the testbeds are presented and we then proceed to discuss the testbed results in comparison
with the results produced in WP6 to achieve a unified view of the projects’ results. While some of the
KPIs can be evaluated in both network level simulations and testbeds, other require implementation on
real hardware to be meaningful e.g. service creations or feedback from real users to be assessed in a
credible way, e.g. application specific KPIs.
Testbed measurements KPIs Table 6-1 provides an extract of main performance KPIs evaluated by the
projects’ testbeds [5GM-D52]. Note that Table 6-1 only includes those KPIs with relevance to the ones
contained in Table 2-1. In Table 6-1, the experimental results obtained are contrasted against the overall
verification objectives of the project. It is important to note that experimental results do not show all the
project objectives (and were never intended to do so). However, in some cases they do show that the
project objective is met, and in other cases they serve to demonstrate the functionality provided by 5G-
MoNArch enablers; further simulations evaluating this functionality serve to evaluate the achievement
of the corresponding project objective. For each KPI, Table 6-1 indicates whether WP6 simulations are
used, in addition to WP5 experimental results, to validate the KPI completion.
The 5G-MoNarch technologies deployed in the testbeds achieve the benchmark targets set by 5G-PPP
for the service creation time and E2E latency. Moreover, other KPIs show that the requirements to fulfil
the objectives of our testbeds are met:
• In the SSP testbed, the application of network slicing concept to industrial environments is
demonstrated along with the instantiation of isolated network slices that can provide reliable
and resilient services, even on failure conditions.
• The TC testbed demonstrates the application of the elasticity concept to media and
entertainment use cases. The use cases shown, require the network to efficiently support high
quality and demand services that can adapt to workload changes by dynamically allocating
necessary network resources through the appropriate orchestration functions.
Table 6-1: 5G-MoNArch performance KPIs in the SSP and the TC testbeds
KPI Test-
bed
Overall
verification
objective through
simulations &
measurements
Experimental results Evaluated
by WP6
simulation-
based
verification?
Area
traffic
capacity
TC Improvement by
factor ~10
The VNFs cloud and radio resources are continuously
orchestrated and scaled on available resources in an
automated optimally manner to adapt to network/traffic
demands. When required, the higher layers and UPF
machines of an eMBB slice can be scaled, adjusting the
allocated capacity on demand. In this way, the cloud
infrastructure can provide baseband processing for more
cells and/or additional sectors/frequency layers, thus
increasing the area traffic capacity.
Yes

5G-MoNArch (761445) D6.3 Final report on architectural verification
Version 1.0 Page 105 of 193
KPI Test-
bed
Overall
verification
objective through
simulations &
measurements
Experimental results Evaluated
by WP6
simulation-
based
verification?
Cost
efficiency
TC TCO reduction
14%
TCO is reduced by a) running two slices that provide the
services in one NF environment and b) scaling of VNF using
by AI enabled elasticity algorithms to adapt them to the
network load. The testbeds show the edge cloud is used just
for 50% of the time. Assuming a pay per use policy, this will
reduce the cost in a proportional factor.
Yes
TC At least a factor 2 Static legacy VNF orchestration cannot adapt to varying
demand by relocating VNFs across the cloud infrastructure,
in contrast with 5G-MoNArch orchestration methods which
achieve better resource allocation to match the demand. In a
scenario examined, the capacity required by eMBB VNFs
can be reduced by a factor of 2 due to elasticity enablers, but
higher savings may be achieved in environments
incorporating a higher number of processed cells.
E2E
latency
TC < 5 msec The elasticity algorithm for re-orchestration of VNFs for
eMBB and URLLC slices triggers the re-location of VNFs
according to latency constraints set by applications. With
this, the E2E latency is restored to 5 msec levels. The use of
short TTI length on the NR PHY layer also contributes to
achieving this latency value.
Yes
SSP AR service with
latency < 10 msec
E2E latency levels of 15 msec (round-trip time) or 7.5 msec
(one-trip time) are achieved for a MC setup in cells of up to
10 Km cell range. This is achieved by placing the user plane
in the edge cloud and using 1 msec TTI numerology on the
radio PHY layer.
E2E
reliability
SSP 99.999% The testbed implements multi-connectivity which is an
essential enabler for reliability With this enabler, 50%-ile of
the latency is significantly reduced from 45 msec to 23
msec, as the dual connectivity with data duplication
approach on the radio layer stabilises the successful data
packet transmission also in handover scenarios. The telco
cloud resilience was improved by decoupling the UPF
operation so that a local UPF in the edge cloud can operate
independently from a UPF in the central cloud. It is shown
that in the case of failure, i.e. an outage of the central UPF,
the local UPF was able to operate without any impact.
Yes
TC 99.999% The testbed shows availability (i.e. all slices receive the
requested resources), which is essential for reliability. After
their instantiation, the two slices have the correct amount of
resources to allow the correct operation of the involved
VNFs (RAN Higher Layers, UPF and application servers).
Resources are scaled up in case of resource shortage. The
system implements an admission control algorithm for
network slices that intelligently selects which slices have to
be onboarded and thus avoids abrupt performance
degradation due to overbooking. This ensures a graceful
performance degradation in the case available resources are
reduced.
Yes
Service
creation
time
TC < 90 min
Two slices are successfully onboarded and configured in
approximately 7 min.
No
SSP Less than 1 min is needed for slice deployment and
approximately 5 min are required for blueprinting through
GUI.
Relocation
delay
TC No disruption The elasticity algorithm developed can relocate VNFs
within very few milliseconds, thus avoiding service
disruption.
No
Slice
isolation
Both Demonstration that
QoS in a slice can
be ensured despite
of high traffic load
in another slice
Cross-correlation measurements are provided, comparing
measurements that show on the one hand the throughput
degradation in a non-sliced network and on the other hand
the isolation effectiveness in a sliced network, resulting in
no performance degradation for prioritised slices.
No
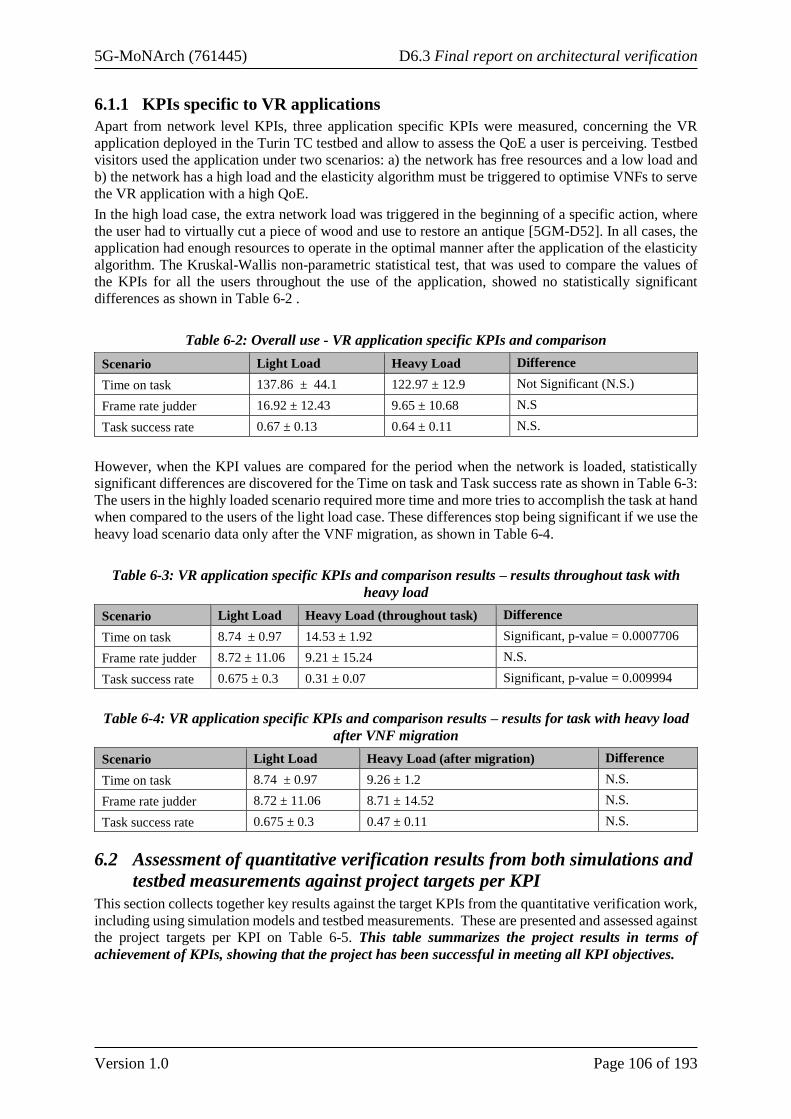
5G-MoNArch (761445) D6.3 Final report on architectural verification
Version 1.0 Page 106 of 193
6.1.1 KPIs specific to VR applications
Apart from network level KPIs, three application specific KPIs were measured, concerning the VR
application deployed in the Turin TC testbed and allow to assess the QoE a user is perceiving. Testbed
visitors used the application under two scenarios: a) the network has free resources and a low load and
b) the network has a high load and the elasticity algorithm must be triggered to optimise VNFs to serve
the VR application with a high QoE.
In the high load case, the extra network load was triggered in the beginning of a specific action, where
the user had to virtually cut a piece of wood and use to restore an antique [5GM-D52]. In all cases, the
application had enough resources to operate in the optimal manner after the application of the elasticity
algorithm. The Kruskal-Wallis non-parametric statistical test, that was used to compare the values of
the KPIs for all the users throughout the use of the application, showed no statistically significant
differences as shown in Table 6-2 .
Table 6-2: Overall use - VR application specific KPIs and comparison
Scenario Light Load Heavy Load Difference
Time on task 137.86 ± 44.1 122.97 ± 12.9 Not Significant (N.S.)
Frame rate judder 16.92 ± 12.43 9.65 ± 10.68 N.S
Task success rate 0.67 ± 0.13 0.64 ± 0.11 N.S.
However, when the KPI values are compared for the period when the network is loaded, statistically
significant differences are discovered for the Time on task and Task success rate as shown in Table 6-3:
The users in the highly loaded scenario required more time and more tries to accomplish the task at hand
when compared to the users of the light load case. These differences stop being significant if we use the
heavy load scenario data only after the VNF migration, as shown in Table 6-4.
Table 6-3: VR application specific KPIs and comparison results – results throughout task with
heavy load
Scenario Light Load Heavy Load (throughout task) Difference
Time on task 8.74 ± 0.97 14.53 ± 1.92 Significant, p-value = 0.0007706
Frame rate judder 8.72 ± 11.06 9.21 ± 15.24 N.S.
Task success rate 0.675 ± 0.3 0.31 ± 0.07 Significant, p-value = 0.009994
Table 6-4: VR application specific KPIs and comparison results – results for task with heavy load
after VNF migration
Scenario Light Load Heavy Load (after migration) Difference
Time on task 8.74 ± 0.97 9.26 ± 1.2 N.S.
Frame rate judder 8.72 ± 11.06 8.71 ± 14.52 N.S.
Task success rate 0.675 ± 0.3 0.47 ± 0.11 N.S.
6.2 Assessment of quantitative verification results from both simulations and
testbed measurements against project targets per KPI
This section collects together key results against the target KPIs from the quantitative verification work,
including using simulation models and testbed measurements. These are presented and assessed against
the project targets per KPI on Table 6-5. This table summarizes the project results in terms of
achievement of KPIs, showing that the project has been successful in meeting all KPI objectives.

5G-MoNArch (761445) D6.3 Final report on architectural verification
Version 1.0 Page 107 of 193
Table 6-5: Comparison of simulation and testbed results – all quantitative verification results
KPI Architectur
e Enablers KPI objective
5G-PPP
correspond-
ding KPI &
target
5G-MoNArch Results Demonstrated
by1
Area
traffic
capacity
Inter-slice
control &
resource
management
Resource
elasticity
Improvement
by factor ~10
(compared to
non-5G
systems)
Data
Volume, 10
Tb/s/km2
The PRBs required were
reduced by a factor of
18.75 during low demand
times across the slices
evaluated in the EC2 slice-
aware elasticity
assessment3.
A similar result from a
WP4 study showed
capacity gains by dynamic
reallocation of network
resources across slices of a
factor of 10 for the RAN
and of factor of 2 for the
CN.
Techno-economic
evaluations of EC2 show
elasticity making hotspot
deployments more cost
effective and feasible (see
“cost efficiency”).
EC2 slice-
aware elasticity
simulations
(Section 4.2.3),
EC2 cost
analysis (Section
3.3) and WP4
simulations
(Section 4.2.4)
Cost
efficiency
via (1)
network
slicing and
(2)
resource
elasticity
(1) Network
slicing
(2) Resource
elasticity
(1) According
to 5G-PPP
Phase 1
economic
analysis TCO
reduction 14%
(2) At least a
factor of 2
KPI not
defined in
5G-PPP yet
(1) A TCO reduction of
44% from offering a
combination of industrial
services from an existing
eMBB network compared
with the incremental cost
of adding each to an
eMBB network
individually and
(2) TCO reduction by
between 38% and 68% for
demand hotspot techno-
economic analysis of EC24
(1) Economic
analysis of EC1
and EC3
(Sections 3.3
and 0) plus both
of the testbeds
(Section 6.1)
(2) Economic
analysis of EC2
(Section 4.3) and
TC testbed
(Section 6.1)
E2E
latency
Orches-
tration
Network
elasticity
5 msec (for
scenarios/slice
s/services
where such
latency is
required)
E2E latency,
≤ 5ms
≤ 5 msec E2E latency
using elastic VNF
orchestration5
TC and SSP
testbeds (Section
6.1), EC1
analysis (Section
3.2.2)
E2E
reliability
Data
duplication
& MC in
RAN Telco
cloud
resilience
techniques
Four or five
9’s (dependent
on scenarios /
slices /
services
considered)
Reliability,
99.999%
99.999% with 1 msec
latency using a URLLC air
interface and a bursty
traffic model6.
EC1 commercial analysis
shows commercial
feasibility of dimensioning
for high reliability
industrial service of port
automation.
WP3
simulations
(Section 3.2.4)
and SSP testbed
(Section 6.1),
EC1 simulations
and economic
analysis
(Sections 3.2.1
and 3.3)
Relocation
delay
Orches-
tration
Network
elasticity
No service
disruption -
No service interruption.
The time required for
reallocation is a few msec
compared to ~74 min
using a legacy solution
TC testbed
(Section 6.1)

5G-MoNArch (761445) D6.3 Final report on architectural verification
Version 1.0 Page 108 of 193
KPI Architectur
e Enablers KPI objective
5G-PPP
correspond-
ding KPI &
target
5G-MoNArch Results Demonstrated
by1
Security
STZs
Security
techniques
regarding
threat
detection,
prevention,
and reaction
within M&O
layer
Comparable to
proprietary
solutions
-
STZs can efficiently
isolate and handle various
types of threats. An
average response time of
280 msec was achieved
against batches of threats
occurring at different
paces.
SSP testbed
environment
simulations
(Section 0)
Service
creation
time
Orches-
tration
Network
slicing
Minutes
Service
deployment
time, <90
min
6 min to deploy a fully
functional service after
request7
SSP and TC
testbed (Section
6.1)
Slice
isolation
Inter-slice
control
Resource
elasticity
Changes in
one slice
without
negative
impact on
other slices
running on
same
infrastructure
-
Isolation achieved: QoS in
terms of throughput in a
slice is ensured despite a
high traffic load in another
slice.
SSP and TC
testbed (Section
6.1)
1. The source which produces the results that achieve covering the KPI objective is marked in bold.
2. Note this 5G-PPP target for area traffic capacity is for an indoor office or stadium scenario, i.e. for an area
with limited size, where high capacity may be needed.
3. Analysis in [5GM-D4.2] Chapter 4, reveals that by dynamically reallocating network resources across
slices, substantial capacity gains can be achieved as a result of using the radio and computing resources
more efficiently. In particular, gains in the order of 10 are achieved in the network access, while the gains
in the network core are in the order of 2.
4. Telco cloud TCO reduced up to half in the TC Testbeds
5. In Hamburg, latency levels are down to 15 msec using MC setup, for cells of up to 10 km.
6. WP6 simulation achieved 99.97% RAN reliability and 99.994 telco cloud reliability. WP3 values result
from specific scenario where an area with good coverage from two cells is assumed while WP6 reports
results for the entire network.
7. This includes the instantiation of the slice blueprint and deployment. In the TC testbed, the slice creation
process was ~7 min.
In summary, we have obtained the following main findings per KPI:
• Area traffic capacity: In EC2 it was shown that the PRBs required were reduced by a factor of
18.75 in the low demand case across slices due to use of slice-aware elasticity related enablers.
The analysis in [D4.2] also reveals that by dynamically reallocating network resources across
slices, substantial capacity gains can be achieved as a result of using the radio and computing
resources more efficiently. In particular, gains of a factor of 10 are achieved in the RAN, while
the gains in the CN are of the factor of 2.
• Cost efficiency: In the TC testbed, telco cloud use was reduced by up to half: if a pay per use
of cloud is assumed, then the TCO cost of the cloud use should have a proportional decrease.
Techno-economic analysis results show the reduction of (i) TCO by 44%, using slicing instead
of hosting a single service in an eMBB network, and (ii) TCO by between 38% and 68% using
resource elasticity for a demand hotspot scenario.
• Ε2Ε latency: Using elasticity related enablers, the E2E latency was kept below 5 msec in the
case of a URLLC slice deployed in the TC testbed. In the SSP testbed, an E2E latency level of
down to 15 msec round-trip time was maintained for cells of up to 10 km using MC with data

5G-MoNArch (761445) D6.3 Final report on architectural verification
Version 1.0 Page 109 of 193
duplication: this level of E2E latency is enough to satisfy the operational demand of a slice
serving an AR application.
• E2E reliability: WP3 reports five nines values in RAN reliability. These result from a specific
scenario where an area with good coverage from two cells is assumed along with a specific air
interface and traffic model. In the WP6 technical verification, the following values for a URLLC
slice across the considered network infrastructure for wide area coverage are reported: 99.97%
RAN reliability and 99.994% telco cloud reliability. Such values do not provide an E2E
reliability of five nines without investment in further radio infrastructure across the study area.
However, the results obtained in techno-economic evaluations for the port automation use case
achieved a higher E2E reliability level in line with the services targeted. This analysis was
limited to a smaller area (in particular, container terminals), as in the WP3 case. Note that very
high reliability demands typically concern specific use cases (mostly verticals) and therefore
such reliability levels are not needed throughout the whole network coverage area. In fact,
providing such reliability throughout the entire network would not be feasible, due to the trade-
off between investment required and achievable reliability level.
• Relocation delay: 5G-MoNArch achieved slice reallocation with no service interruption: the
time required for the reallocation is a few msec, which is significantly smaller compared to ~74
min using a legacy solution.
• Security: The security levels achieved for the 5G-MoNArch architecture are comparable to
existing security systems. Moreover, STZs can efficiently isolate and handle various types of
threats. An average response time of 280 msec was achieved against batches of threats occurring
at different paces.
• Slice creation time: 5G-MoNArch achieves a slice creation time of less than 6 minutes in the
SSP testbed. This can be reduced to less than 1 minute if the slice blueprint has been pre-
provisioned.
• Slice isolation: In both testbeds it was shown that slices are isolated, i.e. a change in one slice
has no negative impact on other slices running on the same infrastructure. Among other results,
it is shown that QoS in terms of throughput in a slice is ensured despite a high traffic load in
another slice.
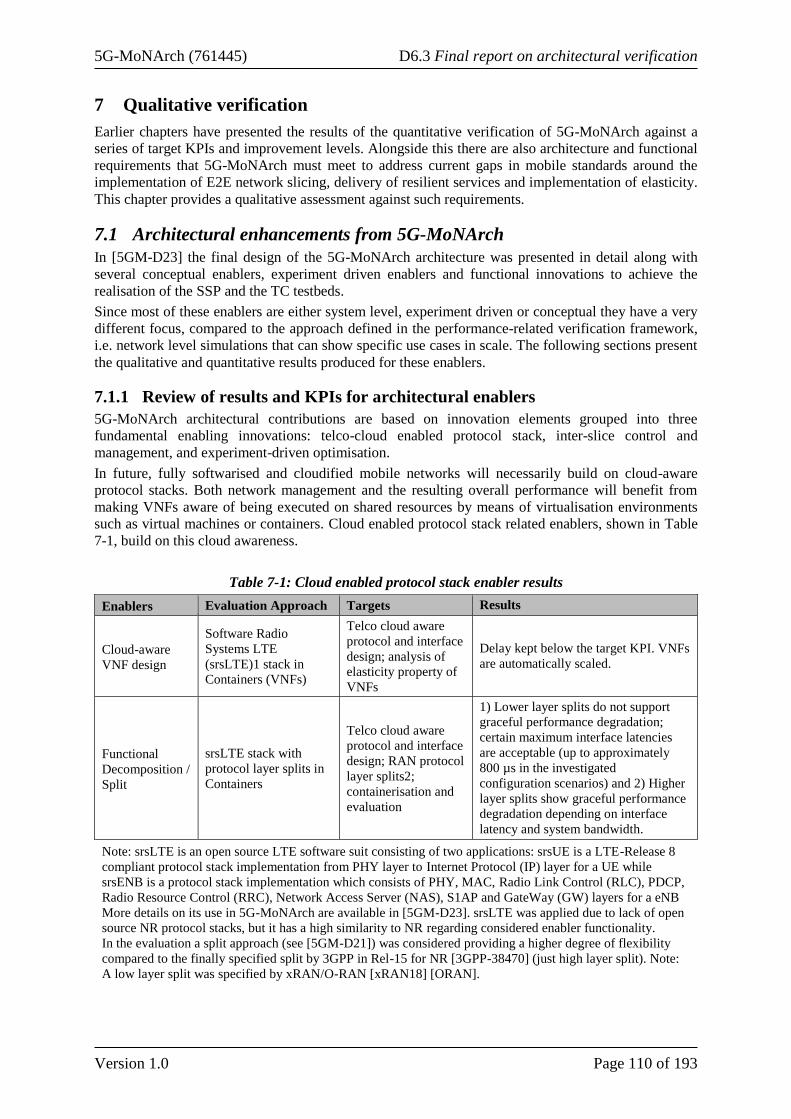
5G-MoNArch (761445) D6.3 Final report on architectural verification
Version 1.0 Page 110 of 193
7 Qualitative verification
Earlier chapters have presented the results of the quantitative verification of 5G-MoNArch against a
series of target KPIs and improvement levels. Alongside this there are also architecture and functional
requirements that 5G-MoNArch must meet to address current gaps in mobile standards around the
implementation of E2E network slicing, delivery of resilient services and implementation of elasticity.
This chapter provides a qualitative assessment against such requirements.
7.1 Architectural enhancements from 5G-MoNArch
In [5GM-D23] the final design of the 5G-MoNArch architecture was presented in detail along with
several conceptual enablers, experiment driven enablers and functional innovations to achieve the
realisation of the SSP and the TC testbeds.
Since most of these enablers are either system level, experiment driven or conceptual they have a very
different focus, compared to the approach defined in the performance-related verification framework,
i.e. network level simulations that can show specific use cases in scale. The following sections present
the qualitative and quantitative results produced for these enablers.
7.1.1 Review of results and KPIs for architectural enablers
5G-MoNArch architectural contributions are based on innovation elements grouped into three
fundamental enabling innovations: telco-cloud enabled protocol stack, inter-slice control and
management, and experiment-driven optimisation.
In future, fully softwarised and cloudified mobile networks will necessarily build on cloud-aware
protocol stacks. Both network management and the resulting overall performance will benefit from
making VNFs aware of being executed on shared resources by means of virtualisation environments
such as virtual machines or containers. Cloud enabled protocol stack related enablers, shown in Table
7-1, build on this cloud awareness.
Table 7-1: Cloud enabled protocol stack enabler results
Enablers Evaluation Approach Targets Results
Cloud-aware
VNF design
Software Radio
Systems LTE
(srsLTE)1 stack in
Containers (VNFs)
Telco cloud aware
protocol and interface
design; analysis of
elasticity property of
VNFs
Delay kept below the target KPI. VNFs
are automatically scaled.
Functional
Decomposition /
Split
srsLTE stack with
protocol layer splits in
Containers
Telco cloud aware
protocol and interface
design; RAN protocol
layer splits2;
containerisation and
evaluation
1) Lower layer splits do not support
graceful performance degradation;
certain maximum interface latencies
are acceptable (up to approximately
800 µs in the investigated
configuration scenarios) and 2) Higher
layer splits show graceful performance
degradation depending on interface
latency and system bandwidth.
Note: srsLTE is an open source LTE software suit consisting of two applications: srsUE is a LTE-Release 8
compliant protocol stack implementation from PHY layer to Internet Protocol (IP) layer for a UE while
srsENB is a protocol stack implementation which consists of PHY, MAC, Radio Link Control (RLC), PDCP,
Radio Resource Control (RRC), Network Access Server (NAS), S1AP and GateWay (GW) layers for a eNB
More details on its use in 5G-MoNArch are available in [5GM-D23]. srsLTE was applied due to lack of open
source NR protocol stacks, but it has a high similarity to NR regarding considered enabler functionality.
In the evaluation a split approach (see [5GM-D21]) was considered providing a higher degree of flexibility
compared to the finally specified split by 3GPP in Rel-15 for NR [3GPP-38470] (just high layer split). Note:
A low layer split was specified by xRAN/O-RAN [xRAN18] [ORAN].

5G-MoNArch (761445) D6.3 Final report on architectural verification
Version 1.0 Page 111 of 193
With different functionalities being virtualised, the cloud infrastructure providers must develop an
experimental procedure to be able to meet the QoS requirements of each VNF optimally. Experiment-
driven optimisation is enabled through a monitoring process of which the measurements feed a
modelling procedure, which models the VNF behaviour regarding their computational, storage and
networking resource demands. Results of the experiment driven optimisation are shown in Table 7-2.
Table 7-2: Experiment driven optimisation enabler results
Enablers Evaluation
Approach Targets Results
Computational
analysis of
Open Source
mobile network
stack
implementations
srsLTE stack
in Containers
(VNFs)
Trade-off study MCS
regarding CPU,
throughput regarding
CPU, elasticity
property of VNFs, are
used to implement
orchestration strategy
1) Different Open Source tools provide
substantially different performance on the CPU
utilisation. 2) When the available CPU is below
70% of the maximum, the highest MCS is not
the one yielding the highest bandwidth
Measurement
campaigns on
the performance
of higher layers
of the protocol
stack
Higher layer
split
(RLC/MAC)
and
virtualisation
(VM)
CPU and RAM
consumption for
higher layer functions
(PDCP and RLC)
Input traffic of 5 Mbps consumes 30% of the
CPU units allocated to the functions, while
input traffic of 30 Mbps requires double CPU
units (60%). For the target functions, more CPU
usage does not correlate with better overall
performance of the service, since a type of
‘forwarding’ is performed, i.e. an on/off
process, and the availability of more CPU does
not provide gains.
ML-based
optimisation of
RAN
srsLTE/Open
Air Interface
(OAI) stack in
Containers
(VNFs)
ML-based
optimisation of RAN
with real time
monitoring of various
parameters including
computational
resources
Enabler considers a generic approach to detect
the computational congestion based on recoded
reports. The algorithm detects the level of
congestion based on variation of processing
time in an online monitoring system.
According to the congestion levels detected,
scaling of computational resources or temporary
reduction of VNF complexity (e.g. by means of
limiting MCS) can be applied.
Inter-slice resource control and management techniques can help to achieve optimised performance by
allocating resources among slices which may share the same spectrum bands in access networks. Results
of the various approaches developed in 5G-MoNArch to enable resource management solutions to
accommodate various use cases and different dynamicity requirements are available in Table 7-3.
Furthermore, inter-slice mechanisms can operate in the M&O layer dealing with the set-up and
commissioning of a new network slice and the congestion control of existing ones: results for these types
of enablers are shown in Table 7-4.
Table 7-3: Inter-slice control & management enabler results
Enablers Evaluation
Approach Targets Results
Inter-slice
RRM for
Dynamic
TDD
Scenarios
Monte Carlo
system level
simulations
Flexibility in
allocation PRBs,
Slice aware TDD
pattern activation to
solve interference
issues
UpLink (UL) and DL throughput and spectral
efficiency were significantly increased (more than
100%) targeting the median and 90th percentile of
the CDF curves, whereas at the 10th percentile (cell-
edge performance) the gains were marginal with
respect to the 2 benchmark cases (a) conventional
Dynamic Time Division Duplex (D-TDD) scheme
and (b) service-oriented TDD slicing.

5G-MoNArch (761445) D6.3 Final report on architectural verification
Version 1.0 Page 112 of 193
Context-
aware
Relaying
Mode
Selection
Conceptual
analysis and
system-level
simulations
Slice-adaptive
functional operation
to improve flexibility:
trade-off between
latency and spectral
efficiency evaluated
by configuring
differently for
different slices
A joint consideration of resultant performance of
dynamic small cells (DSCs), e.g. depending on the
location and link qualities of DSCs, and network
slice requirements are considered in order to fulfil the
slice KPIs.
Inter-slice
RRM using
SDN
framework
srsLTE
stack in
Containers,
scalable
SDN-C
(VNFs),
Kubernetes
Radio resource
sharing strategy, user
experience regarding
sharing strategy,
DL data rate of eMBB slice significantly improved
compared against without inter-slice RRM approach.
E2E network setup time for deployment of RAN and
CN in Docker containers is seconds while VM
deployment takes minutes. This depends on the
underlying infrastructure such as number of CPUs
and RAM size.
Big Data
analytics for
resource
assignment
Data driven
analysis
Predictive resource
assignment using
analytics (radio,
computing)
From 20% (min) up to 90 % (max) multiplexing
efficiency compared with benchmark method when
re-configuration is possible. Combined with the
experimental driven evaluation, we can derive the
advantages in throughput.
Improvement
of existing
SDN frame-
work with
telco grade
performance
srsLTE
stack in
containers,
scalable
SDN-C,
Kubernetes
Telco grade SDN-C –
Scalability, resilience
and load distribution
Controller availability and load balancing is
enhanced by auto scaling feature. Computational load
of controller node is reduced when controller frame-
work scales and UP load is distributed across them.
This significantly reduces the flow-setup time as well
as round trip time for the controller interaction.
Slice aware
radio access
technology
(RAT)
selection
Analytical
Evaluation
Design of slice-aware
RAT select. strategy
to jointly support
URLLC, mMTC, and
eMBB services in
future multi-RAT 5G
networks
The scheme optimises the user performance in terms
of the slice KPIs and enables better performance with
respect to other baseline schemes that take only
signal strength and channel capacity into account.
Table 7-4: Inter-slice management & orchestration enabler results
Enablers Evaluation
Approach Targets Results
Cross-slice
congestion
&
Admission
control
Analytical
evaluation
Maximise long-term resource
utilisation efficiency by using
reinforcement learning by
managing telco cloud
resources across slices
Enables up to 23% increase in terms of slice
acceptance requests compared to a baseline
scheme, which does not implement a
congestion control solution.
Framework
for slice
admission
control
Analytical
modelling,
simulations
Slice admission control based
on optimizing multiple KPIs
using SLAs, number of users
and available resources
0.47% (min) up to 11.08% (max) less resource
consumption, 50.6% (min) up to 77.78% (max)
less SLA violation cost compared with
benchmark methods.
Genetic
optimiser for
inter-slice
control
Simulation,
analytical
modelling
Slice admission control
approach using genetic
optimiser in Inter-Slice M&O
Enabler converges to over 90% utility rate of
the global optimum with fast adaption to new
optimum in dynamic environment of service
demands within 3 generations during the
optimisation cycle while outperforming other
benchmark strategy. Well scalable by
increasing the population size of the genetic
algorithm and fit for parallel computation.

5G-MoNArch (761445) D6.3 Final report on architectural verification
Version 1.0 Page 113 of 193
7.1.2 Architectural contributions based on gap analysis and enhancements
The project has followed a structured approached for the design of the 5G-MoNArch overall
architecture: Baseline requirements and related KPIs for 5G-MoNArch were defined in D6.1 [5GM-
D61]. In turn the project has provided novel components and extensions to the baseline architecture to
address the 5GS gaps identified in previous architectures proposed [5GM-D21, 5GM-D22]. These gaps
and corresponding enhancements are available in Table 7-5.
Table 7-5: Architectural gaps identified and corresponding enhancements
Gap Enhancement Enabling
Innovation Group
Inter-dependencies
between NFs co-located
in the same node
Telco-cloud-aware protocol stack design reduces the inter-
dependencies between NFs and enabling flexible
deployment of RAN NFs at centralised locations, sec. 3.1
of [5GM-D23]
Telco-cloud enabled
protocol stack
Need for support for
computational
offloading
A novel Machine to Machine (M2M) paradigm via floating
mobility anchors was proposed, to facilitate offloading
some signalling at the RAN level (from direct signalling to
the gNB to indirect signalling between anchor and remote
UEs), sec. 3.1.3 of [5GM-D23]
Telco-cloud enabled
protocol stack
Orchestration-driven
elasticity not supported
5G-MoNArch has designed both the architectural elements
(such as the Big Data module and the needed interfaces),
the algorithms and implemented a selection of them in the
TC testbed, sec. 3.3.5 of [5GM-D23], [5GM-D42, 5GM-
D52]
Inter-slice control
and management
Fixed functional
operation of small cells
A paradigm change was introduced from fixed functional
operation of small cells toward slice-adaptive operation via
inter-slice resource management, sec. 3.3 of [5GM-D23]
Inter-slice control
and management
Need for support for
telco grade performance
(e.g. low latency, high
performance,
scalability)
Inter-slice RRM using SDN framework was provided to
support telco grade performance, sec. 3.3.4 of [5GM-D23]
Inter-slice control
and management
Need for (radio)
resource sharing
strategy for network
slices
5G-MoNArch-has developed concepts for Inter-slice
resource management enabling efficient (radio) resource
sharing strategy for network slices considering slicing
principles. Moreover, in WP4 a thorough explanation on
how to achieve elastic RAN operation (both user
scheduling and RAN control), sec. 3.3 of [5GM-D23],
[5GM-D42]
Inter-slice control
and management
E2E cross-slice
optimisation not fully
supported
E2E cross-slice optimisation mechanisms were designed
for a) joint resource allocation, when multiple slices need
to share the same network resources, and b) inter-slice
coordination mechanisms for enabling the 5GS to support
UE applications using multiple QoS flows in multiple
network slices, sec. 3.2 – 3.3 – 3.4 of [5GM-D23]
Inter-slice control
and management,
experiment-driven
optimisation
Lack of experiment-
based E2E resource
management for VNFs
5G-MoNArch has conducted extensive experimentation on
open-source VNF implementations, sec. 3.5 of [5GM-D21]
Experiment-driven
optimisation
7.2 Qualitative verification of architectural and functional requirements
Most of WP6 work in 5G-MoNArch focuses on quantitative verification of key innovations based on
selected KPIs. In addition to those KPIs that [5GM-D61] has compiled a comprehensive list of
requirements for a 5G system taken from 5G-PPP Phase 1 projects and industry forums like NGMN as
well as Standards Developing Organisations (SDOs) like 3GPP and ETSI. The 5G baseline system

5G-MoNArch (761445) D6.3 Final report on architectural verification
Version 1.0 Page 114 of 193
considered within 5G-MoNArch and extended by corresponding enablers to cover the different
evaluation cases must be checked for fulfilment of especially general architectural and functional
requirements. Those requirements are to be structured into
• Generic requirements on the overall 5G system.
• Requirements on network slicing.
• RAN-related requirements.
• Requirements concerning capability exposure.
• Security requirements.
Table 7-6 provides an overview of the outcome of the assessment performed concerning fulfilment of
those requirements based e.g. on the knowledge about 5G-MoNarch architecture or on
results/experiences we got from testbeds. A detailed list of all requirements related to these main
requirement types taken from D6.1 and their assessment can be found in Appendix G. It must be noted
that not all of those requirements were directly addressed by 5G-MoNArch as they are e.g. out of scope
of the project. Such requirements are marked as “Not applicable” and explanations for the assessment
are given in the tables of Appendix G.
Table 7-6: Overview of outcome of qualitative verification of architectural and functional
requirements
Requirement type Fulfilled by 5G-MoNArch approach?
Generic
requirements on the
overall 5G system
16 out of 18 requirements belonging to this type are fulfilled.
One requirement is not applicable as 5G-MoNArch does not consider identity
management issues.
Another requirement is just partially fulfilled as 5G-MoNArch is supporting “stateless”
NFs just in the 5G CN and not in the RAN (note: this is in line with current
standardisation status in 3GPP).
Requirements on
network slicing
All 13 requirements belonging to this type (one of the main focus areas of 5G-
MoNArch) are fulfilled.
RAN-related
requirements
16 out of 19 requirements belonging to this type are fulfilled.
3 requirements are not applicable as 5G-MoNArch does not consider dedicated D2D,
wireless self-backhauling, and broad-/multicast solutions which have a strong PHY
layer impact.
Requirements
concerning
capability exposure
All 7 requirements belonging to this type are fulfilled.
Security
requirements
7 out of 11 requirements belonging to this type are fulfilled.
4 requirements are not applicable as 5G-MoNArch’s focus concerning security aspects
is especially on conceptual level as well as on security threat detection, prevention, and
reaction within M&O layer. Radio protocol related security features as addressed by
the 4 requirements are implementable by corresponding features in the 5G-MoNArch
architecture according to 3GPP specification.
As result of the performed qualitative verification of general 5G architectural and functional
requirements it can be stated that they are fulfilled by the 5G-MoNArch approach. Some requirements
are out of scope of 5G-MoNArch, but no showstoppers are seen regarding an implementation of
solutions which may cover those requirements.

5G-MoNArch (761445) D6.3 Final report on architectural verification
Version 1.0 Page 115 of 193
8 Validation of verification findings with stakeholders
To sense check or validate the assumptions and findings of WP6’s technical and techno-economic
verification work, a series of discussions with relevant stakeholders have been held throughout the
project. These stakeholder groups have ranged from tourist attractions and venues to port authorities and
container terminal operators to city councils and finally to mobile industry stakeholders such as vendors,
regulators and MSPs. This chapter reports on these interactions with stakeholders and the key insights
gained from these. A summary of conclusions from this chapter is given in the “Conclusions” chapter
and specifically Section 9.5.
8.1 Map of stakeholders impacted by 5G-MoNArch and our approach to
stakeholder validation
Within 5G-MoNArch we have adopted the same layered stakeholder model as introduced in 5G
NORMA [5GN-D23]. This is illustrated and expanded to highlight the stakeholder groups most relevant
to the 5G-MoNArch evaluation cases in Figure 8-1. Within this chapter we report on our interactions
with each layer of this stakeholder map.
Figure 8-1: Stakeholder map applied in WP6 stakeholder validation
As reported in Section 2.2.3 stakeholder validation has been performed via a range of methods including:
• Discussions with relevant partner organisations within 5G-MoNArch
• Telephone interviews with stakeholders outside the consortium
• Testbed related workshops
• Presentation of 5G-MoNArch concepts at industry events
• Stakeholder questionnaires
8.2 User requirements for and value of 5G services
Our interactions with verticals and end users were split into the user groups associated with each of the
three evaluation cases. This section reports on our interactions with:
• Sea port related users
• Tourism related users
• Smart city service users

5G-MoNArch (761445) D6.3 Final report on architectural verification
Version 1.0 Page 116 of 193
8.2.1 Sea port related users
The HPA are members of the 5G-MoNArch consortium and throughout the project have contributed to
WP6 by validating the service requirements, device densities and infrastructure assumptions being
proposed under the evaluation cases (with particular emphasis on EC1). Additionally, as the operational
benefits for EC1 have been quantified within WP6, HPA have provided review and feedback on these.
This input from HPA has been supplemented with a series of telephone interviews with other sea port
related stakeholders and the Hamburg testbed workshops which are reported here.
8.2.1.1 Validation with sea port related organisations
During the project we have had discussions with stakeholders involved in existing European ports. These
have included a large, privately-owned, port in the UK and a leading container terminal operator based
in Europe. The areas that we sought to validate were:
• Wireless services and applications of interest in ports
• Existing wireless solutions and areas for improvement
• Willingness to pay for 5G services and views on their operational value
• Barriers to deployment
Wireless applications for ports: Of the applications considered in EC1, stakeholders confirmed that
the application requiring wireless connectivity in ports receiving the most focus recently is port
automation. Port authorities also highlighted asset tracking and traffic management as areas where they
were active in implementing connected technologies. AR for construction was not in the immediate
plans of stakeholders but there was interest in this for future operations once AR devices mature.
For port automation there were two clear motives driving adoption:
• Operational efficiencies - labour is one of the largest operational expenses in port operations
and a high proportion of the cost of sales13.
• Expanding capacity - through greater accuracy, automated systems allow containers to be
stacked higher thereby increasing port capacity.
Automation projects had already been implemented amongst the stakeholders that we spoke to.
Generally, existing systems are short of full automation but even with partial automation a single
operator can control multiple cranes, intervening only at critical points in their operation and delivering
significant cost savings in the process.
Regarding ITS, one respondent claimed to be the first port in Europe to implement a vehicle booking
system that allows the port to manage flows of freight traffic on an hour by hour basis based on available
operational resources and weather. This eases congestion in the local areas and minimises the associated
pollution. ITS for construction traffic lights, as envisaged in EC1, was seen as complimentary to an
existing traffic management like this. It was also highlighted that environmental monitoring already
takes place in many ports but could again be expanded further. It was felt that existing wireless in ports
could be better integrated together under 5G but that this would only be likely once current solutions
had reached the end of their operational life, unless there were compelling economic reasons to swap
them out.
In agreement with the rationale behind EC3, one stakeholder also stated that Hamburg Port, in common
with many other ports, is close to a high-density residential area and therefore air quality, noise pollution
and congestion are major issues for the wider community.
Existing wireless solutions in ports: Many stakeholders had started their existing automation projects
using solutions in licence-exempt spectrum (Wi-Fi and a bespoke 400 MHz ISM system were
highlighted). However, in most cases these had issues with interference and licence exempt spectrum
solutions were replaced with alternatives such as optical fibre or dedicated private LTE (pLTE)
13 An ageing workforce and difficulty in attracting younger people into the industry is forcing up wages. Training costs are also
high given that it takes over 200 hours of exposure to train a crane driver. Even then, there is very limited capacity on the cranes
themselves for training purposes leading to protracted programmes, pushing up costs further.

5G-MoNArch (761445) D6.3 Final report on architectural verification
Version 1.0 Page 117 of 193
networks. These solutions have provided the necessary bandwidth, latency and reliability required for
port automation, but some draw backs were also highlighted:
• Both approaches require bespoke systems and are expensive and difficult to integrate.
• Upgrades are expensive and take time to implement.
• Ongoing availability of spectrum for private LTE is another concern with some bands in Europe
being reclaimed for 5G auctions.
Willingness to pay for 5G services: Stakeholders confirmed that they are closely monitoring the
development of 5G and may be willing to invest in a technology that can provide guaranteed levels of
service against challenging KPIs14. 5G was highlighted as being appealing due to:
• It being a global standard with internationally harmonised spectrum.
• Economies of scale in 5G driving down costs and providing solutions that are more easily
deployed and integrated.
• Having an ecosystem of different users where combined learnings should make for continuous
improvement through the scheduling of regular upgrades.
Some stakeholders speculated that 5G could be the catalyst for the widespread adoption of smart port
applications, especially if network slicing is able to fulfil the promise of providing tailored connectivity
with assurances on quality and reliability. However, all stakeholders emphasised that the benefits of
5G are not yet well articulated and that its performance and impact on operational efficiencies would
need to be proven before confirming willingness to pay for such services.
Barriers to deployment: Barriers to adopting 5G technology in ports raised included:
• MNO willingness to engage with industry. Some of the companies we spoke to are looking to
actively engage with operators and service providers to explore models of working together and
lowering barriers to adoption. However, some also reported attempts to engage with MNOs in
the past and that MNOs were not willing to offer services against their challenging service
requirements.
• Fragmentation in the logistics industry. It was explained that the logistics industry is
traditionally quite fragmented and since there’s money to be made by virtue of that
fragmentation it’s very difficult to get consensus on standard processes and technologies since
players may feel that their market share is threatened. Asset tracking by its nature needs to serve
the purposes of multiple stakeholders in the supply chain, therefore any new technologies will
only garner widespread adoption if they’re implemented by the large shipping companies that
dominate the market and they in turn allow others to interface with their databases and share
information transparently and securely.
• Cyber security. As a key part of the national infrastructure, ports are a key concern and they
work closely with central government to ensure that the standards for security are kept very
high. The perception of 5G is that as a global system it may be subject to increased levels of
attack, however, the counter argument is that by having a large ecosystem of equipment vendors
and service providers there will be more resources directed at fending off such attacks, so whilst
security remains a concern for all connected technologies it is not regarded as a barrier to 5G
adoption.
8.2.1.2 Hamburg testbed workshops
Two workshops were held to demonstrate the Hamburg smart sea port testbed to stakeholders; one in
November 2018 and one in June 2019. During the June workshop, WP6 presented both technical
performance and techno-economic verification results to visitors on one of the exhibition booths and
received one to one feedback on these. In addition, WP6 issued a questionnaire to workshop attendees
(see Appendix F). Both the questionnaire responses and discussions at the workshop confirmed interest
amongst industrial stakeholders in 5G and the applications targeted by 5G-MoNArch. However, they
also highlighted a lack of clarity of understanding around what 5G is and its benefits. There was also a
14 One port set a reliability requirement of no more than 50 minutes of downtime a year.

5G-MoNArch (761445) D6.3 Final report on architectural verification
Version 1.0 Page 118 of 193
consensus that the technology currently lacks the maturity needed for industrial applications. 50% of
questionnaire responses either agreed or strongly agreed that 5G technology as shown at the workshop
could help in their daily operations. The remaining 50% were unsure. No respondents indicated that
the technology would be of no use to their operations. The main operational benefit of 5G highlighted
was as a less costly replacement for fixed telecoms solutions with automation, IOT, employee training
and remote support and gathering and visualising data all being named by 50% of respondents as areas
where 5G might help in daily operations (see Figure 8-2, left). Questionnaire respondents were split
over whether they would pay more than currently being spent on wireless solutions for the benefits of
5G (see Figure 8-2, right). Discussions at the WP6 booth revealed that industrial stakeholders may well
be willing to pay in line with the revenue forecasts outlined by the verification work but that the
technology must be proven, and its benefits quantified first. From this perspective the benefits analysis
of WP6 was welcomed by many visitors to the stand. In terms of how 5G would be funded, 71% of
respondents indicated that they would expect the MSP to pay for the initial network infrastructure build
and to charge for this on an annual subscription basis. The remaining respondents indicated they would
be willing to pay, or part pay, for the initial network infrastructure and set up for their application.
Figure 8-2: Hamburg workshop questionnaire responses: benefits of 5G to daily operations (left)
and willingness to pay more for 5G (right)
8.2.2 Tourism related users
8.2.2.1 Telephone interviews with venues and tourism related organisations
Related to the Turin testbed and the use of immersive technologies to improve visitor experience, we
held a series of stakeholder discussions to capture interest in such use cases in the tourism industry. We
found that many venues are experimenting with immersive technologies already and are interested to
understand how 5G might support deployment of such experiences further. We briefly report in Table
8-1 on some of the feedback and example projects that stakeholders reported.
Table 8-1: Summary of discussions with tourism related organisations and their level of interest in
immersive experiences for visitors
Organisation Interest Deployment options
British
Museum
The British Museum has worked since 2015 on
AR/VR experiences to enhance some of its most
popular galleries, including Ancient Egypt and the
Bronze Age. “VR can be seen as a threat because it
can save people coming to the museum at all, but as
with bookstores, physical objects appeal to many
people. However, it’s impossible to interest
millennials or children in static objects. They need to
be able to ‘touch’ the mummies, not just look at
them.” Over time we will monitor the impact on
The Museum has mainly worked
with VR headset company Oculus.
The apps are live working on 4G or
Wi-Fi connections, but the museum
is interested in the promise that 5G
could enable 3D and even VR
viewing without any special
headgear. The Egyptian gallery tour
was one of the first to trial

5G-MoNArch (761445) D6.3 Final report on architectural verification
Version 1.0 Page 119 of 193
visitor numbers, especially among under-25s, though
we don’t have figures yet.
Facebook’s emerging web-based
VR platform.
Amsterdam
marketing
Amsterdam Marketing has installed a VR experience
at the city’s Central Station, with headsets that can be
borrowed from the tourist information desk. The idea
is to encourage visitors to visit other parts of Holland
by allowing them to experience some highlights
interactively and in 360-degree. The next phase will
be to allow them to download AR-enabled apps to
enrich their experience when they visit the sites.
Amsterdam Marketing says three of the six sites –
Haarlem, Almere and Keukenhof - have reported an
increase in tourists arriving by train, of between 15%
and 20%, since the system went live in summer 2018
(the other three have not provided feedback).
While the installation is enabled by
fixed fibre, the AR apps will work
on 4G, and the aim is to develop a
more consistent experience across
the station system and the apps,
using 5G to improve immersiveness
on the mobile side.
University of
Portsmouth
The University of Portsmouth, on the UK’s south
coast, runs a degree course in AR/VR, and has worked
with the city and its tourism authorities, to develop
fixed and mobile VR experiences in the city’s historic
naval port district, which also includes a visitor
attraction called Spinnaker Tower. One example is a
VR experience which allows the user to ‘walk outside’
the tower above a 90-metre drop.
Tony Sammut, General Manager at Emirates
Spinnaker Tower, said that VR experiences like this
one greatly increase return visits, among under-25s, by
as much as 25%. He believes they also attract young
visitors who would not otherwise have been happy to
visit, as well as adding value to the ticket price. VR
studio Polymerse created the application and is adding
various challenges to the bespoke environment.
Dr. Wendy Powell, reader in VR at
the university, sees an important
AR museum application is to
enable users to see a fragment and
then experience what the original
object would have looked like.
However, she thinks there has not
yet been a really good VR
travel/tourism app. Several
developments will help that to
emerge – 5G for apps which benefit
from mobility; more availability of
skills in making 360-degree
content; better soundscape
technology.
Visit Wales Visit Wales has a program to encourage Welsh tourist
attractions to use AR/VR to boost visitor numbers. In
2018 it awarded £290,000 to six VR projects under its
Tourism Product Innovation Fund. Examples include
the Wildlife Trust of South and West Wales, which
has created VR videos such as a Dolphin dive off the
coast of Pembrokeshire. These are largely for
marketing the attractions, but Gina Gavigan, the
charity's marketing development manager, says there
are plans to support more immersiveness at the sites
themselves, harnessing ‘7D augmented reality’ and, in
future, 5G. She said 85% of people who watched the
videos went on to say they would visit Wildlife Trust
attractions.
Ordnance
Survey
The UK mapping agency is interested in taking its
mapping information to another level of presentation
and usage via AR/VR. It has a mobile AR app to
superimpose points of interest in the surrounding area
on the smartphone camera view, to allow users to
click on these points of interest and get more
information and directions. It believes these can be
more immersive in future to support additional tourist
services. It had expected the main usage to be for
navigation but in fact, two-thirds of the usage is for
accessing information and interacting with points of
interest.
While 5G would enable a new level
of experience, the first deployment
priority would be broad coverage
e.g. for rural walkers, so that may
limit the services to 4G for some
years.
BBC
R&D/Roman
Baths
BBC R&D was a project partner in the 5G Smart
Tourism testbed, working with the University of
Bristol and other partners. One of the test applications
The testbed used a combination of
60 GHz mesh technology, fibre and
Wi-Fi connectivity which was able

5G-MoNArch (761445) D6.3 Final report on architectural verification
Version 1.0 Page 120 of 193
was an AR application at the Roman Baths in Bath.
The first public trials were held in December 2018,
with reconstructions of the Baths at moments in
history on a mobile app, deploying 360-degree video.
80% of the 100+ trial visitors said that they would be
more likely to visit a museum if it offered these kinds
of experiences.
to support the throughput and
latency (600Mbps and <10ms) that
was necessary to enable the handset
experiences at the Baths. The
University of Bristol believes that
even more immersive experiences
would be enabled by gigabit
bandwidth and even lower latency
delivered by 5G.
8.2.2.2 Feedback from Turin testbed event
From 22nd -23rd May 2019 the 5G-MoNArch Turin testbed was installed at Palazzo Madama museum
and open for visitors to the museum to try out the VR experience offered. A questionnaire was circulated
to visitors (see Appendix F) trying out the 5G-MoNArch VR experience. This was followed by an
industry event on 24th May 2019 also at the museum.
The questionnaire responses confirmed that for the majority of visitors, 75%, the VR experience was an
enhancement to their visit and would make them more likely to visit the museum (see Figure 8-3, left).
The questionnaire also confirmed a good willingness to pay beyond existing entrance fees for these type
of VR experiences, with 87% of respondents saying they would pay for such an experience and validated
the €10 fee assumed in our EC2 revenue assessment with 56% of respondents indicating that they would
be willing to pay in this price range (see Figure 8-3, right). This €10 price point is more than we found
for typical audio guide charges (€5) and the same as the current full price admission to the museum
(€10). Finally, the System Usability Scale [BRO96] to measure the perception the users had for the
usability of the application: Most of the participants (87.5%) expressed positive results for the usability
of the VR app with further details of the application specific KPIs collected during the Turin event.
Figure 8-3: Views from user survey at Palazzo Madama, Turin testbed event on the value of
immersive experiences to their visit
8.2.3 Smart city service users
Input was invited from two municipal organisations working on connectivity solutions for smart city
services and applications; one based in Ireland, the other in the UK. This is because many city councils
have the potential dual role of consuming 5G mobile services and also providing sites and infrastructure
to mobile operators We also spoke to a UK based equipment vendor with experience of deploying
common infrastructure on a shared or neutral-host basis.
All interviewees agreed with the principle that wireless connectivity, as defined by 5G-MoNArch has
the ability to deliver real social and environmental benefits for cities. In one case they were already
engaged in the environmental monitoring of water levels and water quality over LTE and another
respondent agreed that traffic management for the reduction of emissions, congestion and noise pollution
is a key part of their strategy.
On the subject of synergies between sea ports and cities, the feedback was slightly more sceptical that
the commercial opportunities would be attractive enough for traditional MNOs to consider granting

5G-MoNArch (761445) D6.3 Final report on architectural verification
Version 1.0 Page 121 of 193
concessions on the provision of services in exchange for access to infrastructure. Their opinion is that
sea ports and their surroundings don’t necessarily have a large footfall to fuel demand and provide
sufficient revenues. However, where there are associated hotspots in the locality, such as the case with
passenger terminals, then it is more likely to resonate with MNOs commercial motives making for a
more attractive proposition. This aligns with the infrastructure partnerships and deployment models
explored in EC2 around the Steinwerder cruise ship terminal hotspot in Hamburg’s industrial port area.
Considering the wider city and regional requirements, both of the civic respondents recognised the
potential for significant economic benefits but felt there were significant barriers to overcome if they
are to be realised, pointing out that commercial returns by themselves are not the appropriate means to
motivate the fulfilment of city-wide digital transformation objectives. This aligns with our findings in
EC3 where revenues from smart city services are shown to be modest while the social benefits are much
more significant.
8.3 Impact of 5G-MoNArch on the mobile industry
To understand the relevance of 5G-MoNArch to the existing mobile industry we have gathered here
views from existing MNOs and mobile equipment vendors.
8.3.1 The value of 5G-MoNArch to mobile network operators
MNO 5G-MoNArch partners have been heavily involved in the review and validation of assumptions
behind the WP6 evaluation cases. These have included:
• Validating service requirements and demand forecasts in the evaluation cases
• Validating spectrum and spectrum efficiency assumptions and the assumed evolution of site
configurations (in terms of order of MIMO antennas and bandwidth supported) over time.
• Reviewing equipment and network dimensioning assumptions in the cost modelling
The results provided by the verification activities, in both technical/KPIs and business/economics
domains, carried out within WP6 represent a valuable input for MNOs that are going to start the
deployment of the first 5G commercial networks in the relatively near future. In particular, results related
to the investigated technical enablers belonging to the main categories of security, resilience and
resource elasticity are quite significant.
Among those, at first instance, resource elasticity appears as the most interesting one in the near future
because its three different components (computational elasticity, orchestration driven elasticity and slice
aware elasticity) are the features which can guarantee the required flexibility to provide simultaneously
different services through a multi-slice approach. Those are quite new concepts that should be included
in the future 5G operational networks. At this regard, the KPIs proposed for each technical enabler
provide a good initial hint for the operator to define the basic requirement to be asked to the manufacturer
for the deployment at first and for the management (with a high degree of automation) later. The
indications provided by the project to assess the resource elasticity appears important also because this
feature is expected to increase its importance in the future when, approaches based on ML and AI will
be able to implement predictive algorithms able to change amount and location of processing resources
in a proactive way, differently with respect to what is shown in the current project demo of the touristic
city where the approach is reactive.
Also of interest is the QoE picture of the proposed services in the Turin testbed collected through the
questionnaire filled by the real users. The direct feedback from the final user of the innovative services
made available in Turin allows to establish correlations between the experienced quality and the
objective KPIs associated with the new innovative functions conceived and implemented by the project.
The correlation between QoE and network KPIs is always a critical aspect and, the knowledge of such
a relation in innovative situations, even if in guided context like the one of the Touristic city testbed,
could provide valuable hints for the design and operation of the 5G network. The investigations on
performance evaluations and KPIs are also able to provide information on what is actually easily
obtainable in an operational network and what is not. All the advanced management algorithms to be
implemented in a highly automated network requires, as a matter of fact, a lot of performance measured
data that should be easily measurable and available in real time.

5G-MoNArch (761445) D6.3 Final report on architectural verification
Version 1.0 Page 122 of 193
Whereas the Touristic City testbed was focussed primarily on eMBB services, the Smart Sea Port testbed
in Hamburg became a realistic testing ground for reviewing innovative technologies and their suitability
for rollout in an industrial environment. The testbed has been highly beneficial to demonstrate
capabilities and potential cost benefits of 5G networks and network slicing for industrial applications.
The design of network slices, their orchestration and lifecycle management during runtime are major
challenges for MNOs. Experiences obtained during the testbed runtime in combination with the
architectural work in 5G-MoNArch have been shared with standardisation bodies like 3GPP and
GSMA's Network Slicing Task Force and will influence the design of future 5G networks both from an
MNO’s as well as from an industrial tenant’s perspective. Requirements of future network services and
use cases as demonstrated in Hamburg are expected to become more heterogeneous in the future,
therefore the experience gained and the accompanying information exchange with interested industrial
parties provided a deeper understanding of vertical’s needs, particularly concerning reliability and
security related aspects. The economic/business related results with regard to cost structure of 5G
networks and market potential of novel services and applications are a good starting point to be tailored
to the various MNOs’ backgrounds to further develop and define the techno-economics tools to be used
in the operational activities and deployments.
8.3.2 The value of 5G-MoNArch to mobile equipment vendors
5G-MoNArch vendor partners have supported the WP6 verification activities by providing details of
expected spectrum efficiency levels under 5G NR and validating equipment cost and dimensioning
assumptions used in the cost analysis.
A major outcome from the validation activities was that by means of the 5G-MoNArch validation
framework it was proven that network slicing setups can be implemented in realistic scenarios. In
addition, it was proven that network slicing can fulfil the requirements set by verticals and stakeholders.
In particular, network slice isolation, which ensures that services with high reliability requirements can
be fully logically separated from services with less strict requirements, was able to be proven by means
of the Hamburg Smart Sea Port testbed.
Another significant outcome from the 5G-MoNArch analysis relates to the validation of data duplication
in multi connectivity setups. It was particularly proven that high RAN reliability values can be achieved
in such scenarios, thereby supporting use cases with critical link reliability requirements, such as mission
critical industrial and/or automotive applications.
An important finding in this regard was that the 5G-MoNArch validation activities identified the
conditions under which the ultra-high reliability levels, pertaining to some critical applications, can be
attained. More precisely, it was derived that such ultra-high levels come at an increased cost of
deployment and/or resources used, thereby reducing the respective spectral efficiency of the radio links
involved. This was confirmed in both small-scale and large-scale simulation activities, conducted within
work packages 3 and 6, respectively.
Particular insight from the work conducted within 5G-MoNArch, in particular with respect to the
implementation and deployment of the Smart Sea Port testbed, is that from the perspective of the
network side, i.e. RAN and telco cloud platforms, core network, etc, network slicing is close to be ready
for commercialisation. A main showstopper at the moment is the lack of compatible terminals with
network slicing supporting capabilities, which can be implemented within industrial environments.
With respect to the definition of the evaluation scenarios the WP6 methodology is based on: An
important aspect for the vendors was that, based on the initial Smart Sea Port scenario, additional
industrial use cases as well as numerous use cases from Smart City scenarios have been integrated. This
clearly contributed to a wider scope for the validation of the technical results and the applicability of
network slicing to complex environments. It also contributed to the techno-economic verification of
network slicing as the most effective and efficient solution for serving such large variety of use cases
and applications.
The usefulness of 5G-MoNArch toolsets for verification and validation purposes to vendors is
summarised as follows:
• The methodology of WP6 with a clearly defined process for the validation and verification of
research and technical concepts and innovations.

5G-MoNArch (761445) D6.3 Final report on architectural verification
Version 1.0 Page 123 of 193
• The Mx-ART simulation environment which provided valuable means to simulate scenarios
and use cases which would not have been possible only with the use of testbed installations.
This applies in particular to the further enhancement of the network deployment setup where a
large number of sites, user terminals and connected assets could be simulated. This offers higher
flexibility of network parameterisation, a large variety of terminal mobility scenarios, and a
plethora of traffic characteristics.
• The availability of a business case toolset that provided a means to accumulate and analyse input
(such as use case, requirements, KPI targets, capabilities, etc) from all relevant stakeholders of
5G mobile networks, including equipment vendors, service providers, verticals.
8.4 Impact of 5G-MoNArch on infrastructure provision and barriers to
deployment
5G-MoNArch partners have supported WP6 activities by providing validation around the provision of
infrastructure to support 5G services. HPA have been particularly helpful in validating the assumptions
around EC3 where we scale and extend the application of our findings to wider smart city environments.
Their input and feedback have been supplemented with a series of telephone interviews with other non-
MNO infrastructure providers, which are reported here. These included two municipal organisations
working on connectivity solutions for smart city services and applications; one based in Ireland, the
other in the UK. This is because many city councils have the potential dual role of consuming 5G mobile
services and also providing sites and infrastructure to mobile operators We also spoke to a UK based
equipment vendor with experience of deploying common infrastructure on a shared or neutral-host basis.
The principal concerns are that current models for connectivity comprise too many boundaries between
networks and between technologies. Incumbents are often viewed as failing to respond to demand, of
disorganised operations and lacking coordinated engagement with stakeholders, leading to disjointed
services across the areas traversed by the public. Traditional methods of granting access to infrastructure
is often to the highest bidder, which does not lend itself to inclusivity or homogeneity. Providers
consequently target more lucrative coverage leading to fragmentation of the market and fragmentation
of services. This often results in the less well-off being underserved creating social divisions and
geographical demarcation as reflected in the well-known urban-rural divide.
Our respondents were united in their optimism that 5G offers the potential for new deployment models,
such as those proposed under 5G-MoNArch, which can meet the need for seamless orchestration of
connectivity across technologies, communities and businesses. The expectation is that 5G will not only
facilitate new public services but will afford the opportunity to optimise existing services and return
better value for public funds. Connecting communities is just as important to cities and regions as
connecting businesses, with the goal of providing more far-reaching social as well as economic benefits.
Each of the stakeholders independently expressed a need for more holistic planning and implementation
as a means to ensure that no communities are left behind. Central to this is having a willing consortium
of stakeholders supported by sympathetic service partners, whether MNOs or neutral hosts or others,
who recognise the benefit of developing and delivering on a joined-up strategy, built around
communities and social and environmental improvement. They need to instil trust too; councils are not
the technology experts, but they need to be confident that everyone’s interests are represented and
aligned.
The interviewees went on to identify several significant barriers standing in the way of delivering on the
promise of inclusive connectivity in cities:
• Access to spectrum
• Technology harmonisation
• Access to finance
• Access to infrastructure
On spectrum, the concern is that such a scarce resource is concentrated in too few players, all of whom
share a business model that is not necessarily aligned with local and regional government objectives.
Licence exempt spectrum has the potential to disrupt this model e.g. through Wi-Fi, however there is

5G-MoNArch (761445) D6.3 Final report on architectural verification
Version 1.0 Page 124 of 193
insufficient spectrum of this type and it is difficult to coordinate in order to deliver optimum
performance. Stakeholders feel that these issues point to the need for a more flexible and affordable
approach, advocating the exploration of options for spectrum brokerage that would facilitate pooling
and leasing of the resource to provide more egalitarian access over a shared common infrastructure.
Our respondents agree that 5G and network slicing in particular can create environments where
connectivity can be tailored and adapted to better suit the multiple disparate needs of different user
groups. Having globally recognised standards and harmonised spectrum bands is key to lowering
equipment costs, however, stakeholders felt that there are still roles for other solutions and
complimentary technologies and these need to be considered as part of finding a more holistic solution.
Open and transparent interfaces are key as is security but at least one representative we spoke to is
working with suppliers of management and orchestration solutions to facilitate this. Another was keen
to emphasise the role of edge computing as a cost-effective means to relieve the pressure on access
networks and this clearly agrees with the findings of 5G-MoNArch.
One of the greatest challenges to municipal stakeholders in being able to drive deployments of their own
solutions is access to finance. The recent period of austerity has resulted in a lack of investment in
critical services pushing infrastructure further down the agenda and respondents are clear that the private
sector has a vital role to play in addressing the shortfall, which has synergies with the motivations for
5G-MoNArch such as delivering economies of scale and scope by using existing networks for new
services. At the same time, the city needs to have a lead role as an active stakeholder, helping to define
where connectivity should be provided, and the services required.
Respondents went on to state that cost management is also key and were quick to point out that historical
models of deploying telecoms infrastructure were slow to align with other development activities that
would see them minimise expense and disruption. They were keen to point out that contrary to the
perception of them being an obstacle to deployment, municipal authorities were dedicated to supporting
build strategies that encourage providers to be more opportunistic and align their activities with other
development and construction projects in order to minimise cost and disruption. Their feeling is that the
right partners will recognise this and be sympathetic in their planning, deployment and operating models.
The final significant barrier concerns access to the infrastructure itself. One concept that is often mooted
is that in return for universal connected services municipalities would be able to facilitate access to
infrastructure at lower than market rates. State aid laws prevent this in most circumstances, but one
stakeholder highlighted that exemptions are possible for the purposes of research development and
innovation. One option, they suggested, may therefore be to use innovation as a catalyst for
infrastructure deployment on the basis that any financial incentive, in the form of cheaper access, is
countered by an obligation on the provider to facilitate access to a local innovation ecosystem e.g.
through the provision of test beds or dedicated network resources. City authorities can be the fulcrum
for such an initiative but universities and strategic infrastructure managers (e.g. ports, airports, roads,
rail, stadiums, public venues and shopping centres etc) are vital players too who need to be willing to
collaborate and commit resources to such a project to extract the most benefit.
Rather than solutions being driven by today’s service and application requirements, which in all
likelihood will be different in future, the idea is about creating the right environment to innovate and
deliver the right services to the right people at the right time. At least the authorities that we spoke to
appeared willing to help create the conditions for others to benefit and prosper and in doing so encourage
wider local and regional benefits.
This is also about aggregating needs and requirements. The ability to dispense 5G slices is not without
limit. Where there are many interested parties and demand is high, network resources can be in short
supply. Providing separate slices for everyone isn’t always feasible hence the need for service providers
to develop innovative solutions that allow shared access by different groups using similar applications
and services.
With margins in telecoms infrastructure being constantly eroded, municipalities understand that in order
to attract the right partners they need to appeal to global investors who are able to leverage economies
of scale and keep costs down. One of the key outcomes of the initiatives suggested by our interviewees,
therefore, is knowledge creation and transfer. Investors will be motivated to enter into such shared risk

5G-MoNArch (761445) D6.3 Final report on architectural verification
Version 1.0 Page 125 of 193
opportunities if the business models are shown to be transferable and can be universally applied
regionally, nationally and globally.
In summary, the consensus amongst stakeholders is that 5G can and should be a key component of the
long-term digital strategy for local authorities, particularly if based on a universal shared infrastructure
model that reflects the holistic needs of society. However, to be a success the technology needs to be
taken as part of a wider program of cooperation and collaboration, involving stakeholders from across
the community, coming together to contribute to the planning and execution of robust solutions and
services. They need to do so in such a way as to promote innovation, to ensure there is no digital
exclusion on the basis of social status and to realise the wider social and environmental benefits that the
technology promises.
8.5 Implications for and validation by regulators and government groups
The migration under 5G towards virtualised, multi-tenant and multi-service networks via network
slicing architectures such as 5G-MoNArch gives rise to a number of regulatory considerations. As with
most regulatory issues, these require a balance between ensuring that the mobile industry is not
unnecessarily hindered in deploying new technologies and services whilst still maintaining a technology
neutral competitive environment. Regulatory considerations related to 5G-MoNArch like networks
include:
• Whether network slicing and the provision of guaranteed QoS to particular user groups is in
keeping with net neutrality regulations.
• The level to which infrastructure sharing as supported under the evolving ecosystem of network
slicing should be permitted.
• Ensuring the availability of and fair access to fibre connectivity to support high speed fronthaul
connections to virtualised antenna sites. Similar considerations might apply to access to fixed
telecoms exchanges which could be attractive edge cloud site data centre locations.
Additionally, of relevance to regulators and government bodies, are the findings under EC3 regarding
the wider socio-economic value of 5G services. Our analysis in EC3 shows that some services such as
ITS may have a high social value but limited potential for mobile revenue generation due to the limited
budgets of city councils. This means that public private partnerships might be needed to ensure that the
full range of 5G services, and their corresponding socio-economic value, are deployed.
During the project discussions took place with a number of European regulators to collect their views
on these key issues and what they feel are the major barriers to the adoption of multi-service 5G networks
like 5G-MoNArch.
The subject of net neutrality is highly topical within regulatory circles and an issue that is often raised
to them by numerous different stakeholders. The position taken within 5G-MoNArch is to make a
distinction between services or applications, and the content. The philosophy being that no content
within the same service wrapper is given priority at the expense of another. The regulators we spoke to
are reasonably aligned with this rationale. Regulators across Europe are working together to understand
if there are any barriers presented by net neutrality legislation that may hinder the deployment of 5G.
They are looking at specific use cases where slicing could be deployed and to-date no party has identified
a clear reason for amending the net neutrality regulation because of a specific challenge presented by
5G and network slicing. Regulators will continue to monitor the roll out of 5G services and act where
necessary to protect the best interests of citizens and consumers.
Regulators have also adopted a similar approach when considering infrastructure sharing i.e. looking at
specific proposals on a case by case basis. Until recently most of the focus was on macrocell network
infrastructure sharing. Due to their distinct characteristics and deployment models small cell networks
are regarded differently.
The approach for macrocell networks has been very much been about striking the right balance between
cost reduction for MNOs and the impact on competition intensity in the market. For consumers, sharing
may mean lower prices initially, but in the long term less competition may be harmful. Across Europe
this approach has established a good trade-off between these competing forces, however, in areas that

5G-MoNArch (761445) D6.3 Final report on architectural verification
Version 1.0 Page 126 of 193
are underserved due to weak commercial prospects15 e.g. rural areas, greater levels of infra sharing
between operators is preferred as a means to lower costs and encourage rollout rather than resorting to
more forceful interventions.
Respondents were of the opinion that extensive small cell deployments are a relatively recent
phenomenon, however regulators do recognise the need for a holistic approach to network sharing in
order to combat fragmentation within urban environments resulting from selectively targeting the most
lucrative locations. Some have suggested this can even lead to social exclusion in some cases, creating
a digital divide between neighbourhoods within cities if left unchecked. Regulators typically want to
avoid intervention therefore it is hoped that such problems can be avoided with the help of neutral host
solutions and 5G network slicing.
One regulator went further to say that network sharing even down to the CN level is a possibility to
lower barriers but at the same time security and privacy will need to be embedded in the design of any
solution in order to pass scrutiny. In fact, security, privacy and reliability were all raised as key areas
that service providers must get right in order to deliver on the expectations for 5G in future markets.
The success of 5G in providing the type of holistic E2E connected services needed to deliver the social
and environmental benefits city-wide as outlined in 5G-MoNArch is also dependent on access to fibre.
This is another key focus for regulators who are agreed on the need to provide universal access to ducting
in order to provide fibre for backhaul and fronthaul applications. One regulator pointed out that for the
use cases explored in 5G-MoNArch what matters for business and consumers is access to services,
regardless of whether they’re 5G or not. It is therefore also the role of the regulator to facilitate
alternative technologies where there are benefits for stakeholders in doing so.
One view is that the mobile industry has a lot of resources to position 5G as the solution for all problems
but in reality, it is only one of the tools in the toolbox. 5G will utilise spectrum bands that that are higher
in frequency and may result in challenges around indoor coverage. Fibre is therefore important not only
for 5G, fibre plus Wi-Fi for example can be an important alternative to providing innovative wireless
services in buildings and some governments and municipalities are targeting fibre connectivity to
premises as well as data centres and kerbside, as a key part of their digital connected strategy.
Regulators are in broad agreement about the need to provide access to next generation wireless
connected services in localised areas such as those studied under 5G-MoNArch. They have been keen
to emphasise that they are highly motivated to lower barriers to the deployment of such services, one
example of this being to release more spectrum. New bands are being made available all the time and
increasingly on a shared basis. Bands are carefully selected to be close to harmonised spectrum to
facilitate cost effective equipment support and ease of deployment. It is felt that such initiatives will
expedite the uptake of industry 4.0 type applications and stimulate innovation by removing constraints
associated with more bespoke solutions or a dependence on MNOs. At the same time regulators have
also expressed a willingness to take on the role of facilitator and help different players within particular
ecosystems talk to each other and improve access to connected services.
The final point made by regulators concerns market barriers. A repeated view is that a lot of use cases
appear to be supply driven when in fact the actual demand for specific services is far from clear, casting
doubt on the viability of traditional business models. This point echoes discussions we had with
municipal representatives who understand that business cases don’t always make sense for traditional
service providers. A view shared by regulators and civic authorities is that traditional service providers
tend to take too narrow a view of opportunities. To be successful some services and applications need
multiple parties and stakeholders to come together to create business cases. In isolation they may not
appear to work but with collaboration and cooperation across larger ecosystems of stakeholders then
they can deliver real benefits to industry and communities alike.
15 Typically due to the high cost of deployment and/or low revenue generating opportunities.
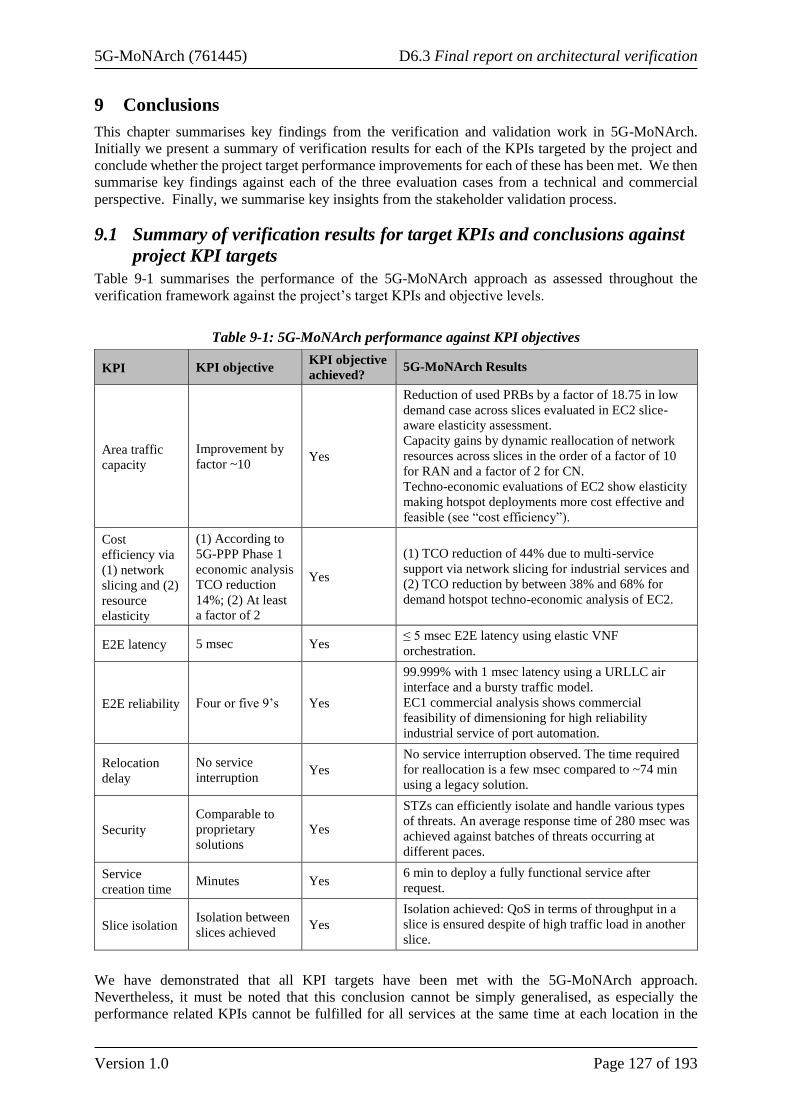
5G-MoNArch (761445) D6.3 Final report on architectural verification
Version 1.0 Page 127 of 193
9 Conclusions
This chapter summarises key findings from the verification and validation work in 5G-MoNArch.
Initially we present a summary of verification results for each of the KPIs targeted by the project and
conclude whether the project target performance improvements for each of these has been met. We then
summarise key findings against each of the three evaluation cases from a technical and commercial
perspective. Finally, we summarise key insights from the stakeholder validation process.
9.1 Summary of verification results for target KPIs and conclusions against
project KPI targets
Table 9-1 summarises the performance of the 5G-MoNArch approach as assessed throughout the
verification framework against the project’s target KPIs and objective levels.
Table 9-1: 5G-MoNArch performance against KPI objectives
KPI KPI objective KPI objective
achieved? 5G-MoNArch Results
Area traffic
capacity
Improvement by
factor ~10 Yes
Reduction of used PRBs by a factor of 18.75 in low
demand case across slices evaluated in EC2 slice-
aware elasticity assessment.
Capacity gains by dynamic reallocation of network
resources across slices in the order of a factor of 10
for RAN and a factor of 2 for CN.
Techno-economic evaluations of EC2 show elasticity
making hotspot deployments more cost effective and
feasible (see “cost efficiency”).
Cost
efficiency via
(1) network
slicing and (2)
resource
elasticity
(1) According to
5G-PPP Phase 1
economic analysis
TCO reduction
14%; (2) At least
a factor of 2
Yes
(1) TCO reduction of 44% due to multi-service
support via network slicing for industrial services and
(2) TCO reduction by between 38% and 68% for
demand hotspot techno-economic analysis of EC2.
E2E latency 5 msec Yes ≤ 5 msec E2E latency using elastic VNF
orchestration.
E2E reliability Four or five 9’s Yes
99.999% with 1 msec latency using a URLLC air
interface and a bursty traffic model.
EC1 commercial analysis shows commercial
feasibility of dimensioning for high reliability
industrial service of port automation.
Relocation
delay
No service
interruption Yes
No service interruption observed. The time required
for reallocation is a few msec compared to ~74 min
using a legacy solution.
Security
Comparable to
proprietary
solutions
Yes
STZs can efficiently isolate and handle various types
of threats. An average response time of 280 msec was
achieved against batches of threats occurring at
different paces.
Service
creation time Minutes Yes
6 min to deploy a fully functional service after
request.
Slice isolation Isolation between
slices achieved Yes
Isolation achieved: QoS in terms of throughput in a
slice is ensured despite of high traffic load in another
slice.
We have demonstrated that all KPI targets have been met with the 5G-MoNArch approach.
Nevertheless, it must be noted that this conclusion cannot be simply generalised, as especially the
performance related KPIs cannot be fulfilled for all services at the same time at each location in the

5G-MoNArch (761445) D6.3 Final report on architectural verification
Version 1.0 Page 128 of 193
coverage range of a wide area radio network. There is a strong dependency on the underlying service,
deployment, and usage scenario. As an example, in the URLLC context, high E2E reliability and low
E2E latency are simultaneously only feasible for services with very low data demand, which results in
a reduced area traffic capacity (at least temporarily) due to the high resource usage for those services on
the radio link.
There is also very often a trade-off between the infrastructure investment required and the finally
achievable KPI target levels (see the techno-economic results for the different evaluation cases in the
following sections). This is true for extreme cases of both eMBB and URLLC services. The first ones
are usually only provided in traffic demand hotspots and the latter ones in industrial environments (e.g.
an enterprise campus), but not across the whole coverage area of a radio network.
The virtualised and cloudified 5G-MoNArch architecture with its enablers and enhancements closes
many gaps identified for 5G baseline architectures as demonstrated in the qualitative verification in
Chapter 7. With the flexibility offered by the architecture, all considered scenarios with diverging
requirements can be covered in principle, but the final realisation of network deployments is an
economic decision based on SLAs between stakeholders in the business model, the infrastructure
investment needed (inclusive of operational costs), and the achievable revenues.
9.2 EC1 conclusions: 5G-MoNArch ability to realise high reliability
industrial services
Technical performance verification: 5G-MoNArch offers suitable enablers to address industrial port
services/slices with high reliability and/or low latency on top of eMBB slices for end customers of an
MNO as demanded by EC1. The E2E latency is impacted primarily by the location of application VNFs.
Orchestrating such functions near the radio processing in an edge cloud (together with a CN UPF for
local breakout) is sufficient to cover the latency requirements of the most demanding EC1 port services.
Where needed, data duplication in combination with MC can be introduced to increase the RAN
reliability. For that, the size of overlap areas between radio cells determines the range where gains for
UR(LLC) slices are achievable, but on the other hand it may result in increased interference zones for
other slices where the presented enablers are not applied to avoid resource limitations. The resulting
trade-off has to be considered by the MNO in the radio network planning and optimisation process. To
guarantee high E2E reliability values for URLLC services in the range of 4 to 5 nines, the dimensioning
of edge cloud processing power in combination with suitable resilience schemes plays an important role.
Corresponding rules, as for example shown in Figure 3-15, can be applied by the MNO during the
planning process considering also the xhaul characteristics. Central cloud and WAN connections of a
typical MNO network already offer such high reliability values, so they do not impact the E2E reliability.
Commercial verification: The benefits of the port services examined in EC1 vary from high operational
benefits due to the automation of container terminals to high social benefits from ITS services. From
our revenue assessment we anticipate that a combination of all port services could add up to 54% on
existing eMBB revenues per year for the study area by 2030. Further, combining revenues with costs
gives a positive business case for all EC1 services if MC is applied. Our results show significant ROI
gains from industrial services, with our case study of providing port automation services to container
terminal operators showing an ROI improvement of up to 16%. This is an improvement that continues
to grow due to economies of scale and scope the more services that are added. This is demonstrated by
this ROI gain increasing to 20% when combinations of industrial services are offered (port ITS and AR
in combination with container terminal automation in this case).
It is clear that the business case for providing industrial services varies depending on the services
targeted. Of the three services analysed – port ITS, port AR and port automation – we found that the
port automation service provided the most compelling business case due to the combination of:
• High and tangible operational benefits from port automation driving a high willingness to pay
and hence MSP revenue opportunity (with a 32% increase on existing eMBB revenues in the
study area forecast by 2030 from this service alone which is 60% of the entire revenue increase
from EC1 services by this time).

5G-MoNArch (761445) D6.3 Final report on architectural verification
Version 1.0 Page 129 of 193
• Requiring a high reliability service but over a localised area that does not have high existing
eMBB traffic. This keeps the incremental costs of delivering such a service limited and less
than providing a reliable service over the entire port area such as port ITS.
Analysis of the impact of MC under EC1 shows the potential to reduce the incremental cost (over eMBB
alone) of new high reliability port services by up to a factor of 2.7 compared with single connectivity.
However, the impact of MC on incremental costs is highly dependent on the location of existing macro
cells and the overlap of coverage areas in the locations of the target services.
9.3 EC2 conclusions: Benefits of resource elasticity in 5G-MoNArch
Technical performance verification: The technical verification carried out on the EC2 scenario by
considering the impact of computational, orchestration-driven, and slice-aware elasticity on the network
performance has demonstrated the achievable gains with respect to resource consumption due to flexible
adaptation of resources according to the traffic and QoS demand in the network, e.g., to cope with
temporary demand hotspots. In the presented example for the Hamburg study area a gain factor of 9 was
achieved regarding HW resources (active CPUs) and of 18.75 regarding radio resources (PRB
allocation) for an edge cloud-based implementation compared to a system without elasticity
functionality.
Commercial verification: Elasticity has been shown to give cost savings of 38% to 68% for the
considered example scenario of a cruise ship terminal. The saving observed depended on the demand
scenario and assumption on antenna site ownership and related cost sharing. For macrocell dominated
networks with high site acquisition and rental costs the antenna site costs will dominate the TCO more
than in these small cell deployments. As shown in [5GM-D42] in these cases we expect the cost saving
of elasticity to be limited to under 15%.
The flexibility of virtualisation and resource elasticity in 5G-MoNArch unlocks different deployment
options. Of the deployment options considered neutral host models showed the most promise in terms
of improving the commercial viability (MSP cost savings of up to 68% with elasticity in this case) of
serving temporary demand hotspots. This was validated with stakeholders, such as city councils, as a
partnership model that is increasingly of interest and attractive in real deployment situations.
Although for this example we selected a temporary demand hotspot in the form of a cruise ship terminal
near a port city, the principals of elasticity investigated here are equally applicable to other demand
hotspot cases where large but temporary uplifts in localised traffic are experienced such as football
stadiums and other similar locations.
The benefits analysis of EC2 shows that the opportunity to increase revenues by addressing demand
hotspots in the case of improved eMBB services is relatively limited. For the example service of
providing a premium eMBB service to cruise ship passengers whilst at the terminal building, we
anticipate limited willingness to pay and uptake resulting in incremental revenues of up to 2% compared
with study area eMBB revenues by 2030. For more targeted hotspot applications this incremental
revenue percentage increased to 13% by 2030 for the guided tour application investigated. Combining
these revenues with costs gave a negative business case for the cruise ship terminal example considered
in EC2 with an existing MNO deploying and owning their own infrastructure. This emphasises the
importance of managing costs in such scenarios, and hence the importance of cost reductions via
elasticity, as these deployments may be essential to maintaining market position.
9.4 EC3 conclusions: Ability of 5G-MoNArch to support smart city and wider
social and economic value generation
Our techno-economic results show that the commercial drivers are not sufficient for all 5G services. For
example, our analysis of smart city services, such as city ITS, has shown a negative impact on the
baseline eMBB ROI under current commercial models. However, these smart city services also have
significant social and wider economic benefits. This implies that public private partnerships and/or new
deployment models may be needed to ensure that the wider value of these services is not lost due to
commercial pressures. Our results also demonstrate, that the multi-service networks enabled by network

5G-MoNArch (761445) D6.3 Final report on architectural verification
Version 1.0 Page 130 of 193
slicing allow economies of scale and scope effects so that multiple tenants can be addressed more
efficiently from a shared network infrastructure than being addressed individually.
9.5 Conclusions from stakeholder validation of 5G-MoNArch
Our discussions with user groups, both from the sea port and venues and tourism sectors, have confirmed
that the services and applications proposed under 5G-MoNArch’s testbeds and verified in the evaluation
cases in this report are use cases that are of interest to them. Furthermore, these use cases have potential
to generate both operational and wider socio-economic benefits. However, there is clearly some way to
go to convince stakeholders that 5G is the right solution to deliver these applications with the technology
still seen as relatively immature and the business cases yet to be clearly articulated. From this perspective
the verification activities undertaken in 5G-MoNArch have been welcomed to help demonstrate the
technical ability of 5G and capture benefits against the levels of investment required.
Within the discussions mentioned above, particularly valuable feedback from stakeholders has been
obtained from the project testbeds, which involved real verticals as well as real users. The testbeds have
allowed us to demonstrate to vertical players as well as the end-users the actual benefits of the 5G
technology in a real environment and get their feedback on the actual benefits and improvements
perceived by them from the demonstrations based on real deployments.
From the feedback received, it was also highlighted that the benefits of 5G need to extend beyond the
narrow commercial objectives of businesses to target wider societal benefits. This means that
stakeholders can no longer afford to think and act unilaterally. They need to form partnerships and
alliances, creating ecosystems of stakeholders, technologies and applications that can be brought into
the mix, sharing the risk and reward and essentially making it far easier to embrace the deployment of
5G infrastructure.

5G-MoNArch (761445) D6.3 Final report on architectural verification
Version 1.0 Page 131 of 193
10 References
[3GPP-101112] 3GPP TR 101 112 , “Universal Mobile Telecommunications System (UMTS);
Selection procedures for the choice of radio transmission technologies of the
UMTS”, v3.2.0, April 1998
[3GPP-23501] 3GPP TR 23.501, “System Architecture for the 5G System; Stage 2 (Release 16)”,
V16.0.2, April 2019
[3GPP-23716] 3GPP TR 23.716, “Study on the Wireless and Wireline Convergence for the 5G
system architecture (Release 16)”, V16.0.0, December 2018
[3GPP-23793] 3GPP TR 23.793, “Study on access traffic steering, switch and splitting support in
the 5G system architecture (Release 16)”, V16.0.0, December 2018
[3GPP-33501] 3GPP TS 33.501, “Security Architecture and Procedures for 5G System (Release
15)”, V15.4.0, March 2019
[3GPP-37910] 3GPP TR 37.910, “Study on Self Evaluation towards IMT-2020 Submission
(Release 16)”, v1.1.0, December 2018
[3GPP-38] 3GPP TS 38 series “Radio technology beyond LTE”,
http://www.3gpp.org/DynaReport/38-series.htm
[3GPP-38874] 3GPP TR 38.874, “Study on Integrated Access and Backhaul (Release 16)”,
V16.0.0, December 2018
[3GPP-38460] 3GPP TS 38.460, “NG-RAN; E1 general aspects and principles (Release 15)”,
V15.3.0, March 2019
[3GPP-38470] 3GPP TS 38.470, “NG-RAN; F1 general aspects and principles (Release 15)”,
V15.5.0, March 2019
[3GPP-38803] 3GPP TR 38.803, “Study on new radio access technology: Radio Frequency (RF)
and co-existence aspects”, v14.1.0, September 2017
[5GM-D21] 5G-MoNArch, “Baseline architecture based on 5G-PPP Phase 1 results and gap
analysis”, Deliverable D2.1, November 2017
[5GM-D22] 5G-MoNArch, “Initial overall architecture and concepts for enabling innovations”,
Deliverable D2.2, July 2018
[5GM-D23] 5G-MoNArch, “Final overall architecture”, Deliverable D2.3, May 2019
[5GM-D32] 5G-MoNArch, “Final resilience and security report”, Deliverable D3.2, April
2019
[5GM-D42] 5G-MoNArch, “Final design and evaluation of resource elastic functions”,
Deliverable D4.2, April 2019
[5GM-D52] 5G-MoNArch, “Final report on testbed activities and experimental evaluation”,
Deliverable D5.2, June 2019
[5GM-D61] 5G-MoNArch, “Documentation of requirements and KPIs and definition of
suitable evaluation criteria”, Deliverable D6.1, September 2017
[5GM-D62] 5G-MoNArch, “Methodology for verification and validation of 5G-MoNArch
architectural innovations”, Deliverable D6.2, September 2017.
[5GN-D23] 5G NORMA, “Evaluation architecture design and socio-economic analysis – final
report”, Deliverable D2.3, December 2017,
http://www.it.uc3m.es/wnl/5gnorma/pdf/5g_norma_d2-3.pdf
[B+18] Bourse D. et. al., “5G PPP phase II KPIs, TB - Performance KPIs - Status
Document,” (Version 15.10.18)
[BA12] Eric Bauer, Randee Adams, “Reliability and availability of cloud computing”,
IEEE Press, 2012
[BASt19] Bundesanstalt für Straßenwesen, “Volkswirtschaftliche Kosten von
Straßenverkehrsunfällen in Deutschland - 2017”
https://www.bast.de/BASt_2017/DE/Statistik/Unfaelle/volkswirtschaftliche_koste
n.html
[Bit19] Bitkom Research, “Smartphone-Markt: Konjunktur und Trends”, 2019,
https://www.bitkom.org/sites/default/files/2019-02/Bitkom-

5G-MoNArch (761445) D6.3 Final report on architectural verification
Version 1.0 Page 132 of 193
Pressekonferenz%20Smartphone-
Markt%2020%2002%202019%20Pr%C3%A4sentation_final.pdf
[BITRE16] Bureau of Infrastructure, Transport and Regional Economics, Australian
Government, “Costs and benefits of emerging road transport technologies”, 2016,
https://bitre.gov.au/publications/2017/research-report-146-emerging-road-
transport-technologies.aspx
[BMU16] Federal Ministry for the Environment, Nature Conservation, Building and Nuclear
Safety, “Climate Action Plan 2050”, 2016,
https://www.bmu.de/download/klimaschutzplan-2050/.
[Bun17] Bundesnetzagentur, “Jahresbericht, 2017”, 2017,
https://www.bundesnetzagentur.de/SharedDocs/Downloads/DE/Allgemeines/Bun
desnetzagentur/Publikationen/Berichte/2018/JB2017.pdf?__blob=publicationFile
&v=2
[CE18] Construction Enquirer, “Pre-construction work starts on £1bn Silvertown Tunnel”,
November 2018,
https://www.constructionenquirer.com/2018/11/12/pre-construction-work-starts-
on-1bn-silvertown-tunnel/
[CED04] CE Delft et al (2004), “The Price of Transport: Overview of the Social Costs of
Transport”, 2004, CE Delft (www.ce.nl); at
www.rapportsysteem.nl/artikel/index.php?id=181&action=read
[CED12] CE Delft, “The Social Benefits and Costs of smart grids”, 2012
[Chr18] Chroniclive, “£117 million Northern Spire bridge set to open in Sunderland next
month”, July 2018,
https://www.chroniclelive.co.uk/news/north-east-news/117-million-northern-
spire-bridge-14930049
[Cis18] Cisco, VNI for Germany, June 2018,
https://www.cisco.com/c/dam/m/en_us/solutions/service-provider/vni-forecast-
highlights/pdf/Germany_Network_Connections.pdf
[Cle11] https://cleantechnica.com/2011/02/24/south-korea-investing-7-18-billion-in-new-
smart-grid/
[CoC14] City of Copenhagen, “Better mobility in Copenhagen
ITS Action Plan 2015-2016”, 2014,
https://www.kk.dk/sites/default/files/uploaded-files/ITS%20-
%20Action%20Plan%202015-2016.pdf
[Cpr15] CPRI, “Common Public Radio Interface (CPRI); Interface Specification,” v7.0,
October 2015
[Cpr17] CPRI, “Common Public Radio Interface (CPRI); eCPRI Interface Specification,”
v1.0, August 2017.
[CTIC16] Carbon Trust and Imperial College, “Energy Storage Report: Can storage help
reduce the cost of a future UK electricity system?”, 2016,
https://www.carbontrust.com/resources/reports/technology/energy-storage-report/
[DBEIS19] Department for Business, Energy and Industrial Strategy, “Carbon Valuation”,
2019, https://www.gov.uk/government/collections/carbon-valuation--2#social-
cost-of-carbonu
[DEFRA19] DEFRA, “Air quality: economic analysis”, 2019,
https://www.gov.uk/guidance/air-quality-economic-analysis
[DfT18] Department for Transport, “WebTAG Databook”, November 2018
https://www.gov.uk/government/publications/tag-data-book
[DIRDC17] Department of Infrastructure and Regional Development, Canberra, Australia,
“Costs and benefits of emerging road transport technologies”, 2017,
https://bitre.gov.au/publications/2017/research-report-146-emerging-road-
transport-technologies.aspx

5G-MoNArch (761445) D6.3 Final report on architectural verification
Version 1.0 Page 133 of 193
[DNV19] DNV-GL, “Hands free - Container terminal with automated storage systems”,
Retrieved 28-04-2019
https://www.dnvgl.com/article/hands-free-container-terminal-with-automated-
storage-systems-78962
[EBB+04] van Essen, et al, “Marginal Costs of Infrastructure Use – Towards a Simplified
Approach”, 2004
[EC13] European Commission, Cost benefit analysis accompanying “Commission
delegated regulation supplementing Directive 2010/40/EU of the European
Parliament and of the Council with regard to data and procedures for the provision
where possible, of road safety related minimum universal traffic information free
of charge to users”, 2013
[Ern12] Ernst & Young, “Smart Grid: a race worth winning”, 2012,
http://www.ey.com/Publication/vwLUAssets/Smart-Grid-A-race-worth-
winning/$FILE/EY-Smart-Grid-a-race-worth-winning.pdf.
[ERTICO15] ERTICO – ITS Europe, “Study of Intelligent Transport Systems for reducing CO2
emissions for passenger cars”, 2015, http://erticonetwork.com/wp-
content/uploads/2015/09/ITS4rCO2-Report-Final-2015-09-10-submitted.pdf
[Fie18a] Alan M. Field, “Supply Chain & Logistics Intelligence in the Age of AI, IoT and
Blockchain”, July 2018.
[Fie18b] Alan M. Field, “Working As One. How real-time cloud-based data-sharing will
benefit the maritime shipping sector”, June 2018.
[Gsm13] GSMA, “Connected Car Forecast: Global Connected Car Market to Grow
Threefold Within Five Years”, February 2013
[Gsma18] GSMA, “The Mobile Economy – Europe 2018”, 2018,
https://www.gsma.com/r/mobileeconomy/europe/
[Ham14] Hamburg Tourismus, "Hamburg Tourism Monitoring, Facts, Figures & Trends
2014", 2014, https://www.hamburg-travel.com/business-media/facts-
figures/publications/publications/
[Ham19] Hamburg Tourismus. “Sightseeing and city walks”, 2019, https://www.hamburg-
travel.com/search-book/tickets-from-eur-8/dynamic-
packaging/components/sightseeing-tours-city-
walks/?tx_naworkworkflow_piController[node]=showComponentList
[HHLA17] Hamburger Hafen und Logistik Aktiengesellschaft (HHLA), “Annual Report”,
2017,
http://report.hhla.de/annual-report-2017/
[HHLA18] Hamburger Hafen und Logistik Aktiengesellschaft (HHLA), “Annual Report”,
2018,
http://report.hhla.de/annual-report-2018/
[HHLA19] HHLA, “Expansion of the container rail terminal Burchardkai complete”, January
2019,
https://hhla.de/en/2019/01/expansion-rail-terminal.html
[HHM19] Hafen Hamburg Marketing website, “Adjustment of the navigation channel on the
Lower and Outer Elbe: Ultra-large vessels”, Retrieved 28-04-2019.
https://www.hafen-hamburg.de/en/adjustment-navigation-channel-ultra-large-
vessels
[HM18] Hannover Messe, "The largest rail bascule bridge in Europe is open to traffic”, Jan
2018,
https://www.hannovermesse.de/en/news/the-largest-rail-bascule-bridge-in-europe-
is-open-to-traffic-65408.xhtm
[HMK+10] P. Heino et al., “D5.3: WINNER+ Final Channel Models – Part I”, June 2010.
[HPA16a] HPA, “Straßenverkehrsbericht (Road Traffic Report)”, 2016,
https://www.hamburg-port-authority.de/fileadmin/user_upload/HPA-05-
0005_Broschuere_Verkehrsbericht_2016-WEB.pdf

5G-MoNArch (761445) D6.3 Final report on architectural verification
Version 1.0 Page 134 of 193
[HPA16b] Hamburg Port Authority, “HPA Annual report”, 2016,
https://www.hamburg-port-authority.de/fileadmin/user_upload/HPA-
GB_2016_eng.pdf
[HPA17a] HPA, “Straßenverkehrsbericht (Road Traffic Report)”, 2017,
https://www.hamburg-port-
authority.de/fileadmin/user_upload/Verkehrsbericht2017.pdf
[HPA17b] HPA, “Geschäftsbericht (Annual Report) 2017”, 2017, https://www.hamburg-
port-authority.de/fileadmin/user_upload/HPA-GB_2017.pdf
[HPA17c] HPA, “Environmental Policy in the Port of Hamburg”, 2017,
http://www2.convention.co.jp/ipc-kobe/pdf/program/13th/sessionC/Hamburg.pdf
[HPA19] HPA website, retrieved 27/03/2019,
https://www.hamburg-port-authority.de/en/themenseiten/the-new-koehlbrand-
crossing/
[Ign19] Ignite Visibility, “How to Lower Your Facebook CPM and Maximize Return”,
2019, https://ignitevisibility.com/lower-facebook-cpm-maximize-return/
[KSR18] Sina Khatibi, Kunjan Shah, and Mustafa Roshdi, “Modelling of Computational
Resources for 5G RAN”, EuCNC 2018, June 2018
[Mic19] Microsoft webpage retrieved 28-04-2019
https://www.microsoft.com/en-us/hololens/buy
[MK15] McKinsey and Company, “The Internet of things: mapping the value beyond the
hype”, 2015, https://www.mckinsey.com/business-functions/digital-mckinsey/our-
insights/the-internet-of-things-the-value-of-digitizing-the-physical-world
[MK16] McKinsey and Company, “Imagining construction’s digital future”, June 2016,
https://www.mckinsey.com/industries/capital-projects-and-infrastructure/our-
insights/imagining-constructions-digital-future
[MK18a] McKinsey and Company, “The Future of Automated Ports”, December 2018,
https://www.mckinsey.com/industries/travel-transport-and-logistics/our-
insights/the-future-of-automated-ports
[MK18b] McKinsey and Company, “The Future of Connectivity: Enabling the Internet of
Things”, 2018, https://www.mckinsey.com/featured-insights/internet-of-
things/our-insights/the-future-of-connectivity-enabling-the-internet-of-things
[MK18c] McKinsey and Company, “The Future of Connectivity: Enabling the Internet of
Things, 2018.
[ML19] Magic Leap webpage retrieved 28-04-2019
https://shop.magicleap.com/en/Categories/Devices/Magic-Leap-One-Creator-
Edition/p/M9001
[MLA12] Mark L. Ayers, “Telecommunications system reliability engineering, theory, and
practice”, IEEE Press, 2012
[Mob19] Mobile Europe, “Data usage rises for all mobile operators, but less than half
increase ARPU”, 2019, https://www.mobileeurope.co.uk/press-wire/data-usage-
rises-for-all-mobile-operators-but-less-than-half-increase-arpuu
[MOTI15] Mayor’s Office of Tech + Innovation, New York, “Building a smart + equitable
city”, 2015, https://www1.nyc.gov/assets/.../NYC-Smart-Equitable-City-Final.pdf
[NGMN-5GX] NGMN Deliverable “5G Extreme Requirements: End-to-End Considerations”,
Version 2.0, August 2018
[NGMN-NDL] NGMN Deliverable “A Network Data Layer Concept for the Telco Industry”,
August 2018
[Nok16] Nokia White Paper, “Ten key rules of 5G deployment”, 2016,
http://resources.alcatel-lucent.com/asset/200006
[OEC19] OEC, “Visualization of Trade in Germany”, retrieved 28-04-2019,
https://atlas.media.mit.edu/en/profile/country/deu/

5G-MoNArch (761445) D6.3 Final report on architectural verification
Version 1.0 Page 135 of 193
[OECD13] OECD, “Effective carbon prices. Country note on Germany”, 2013,
http://www.oecd.org/env/tools-evaluation/Effective-Carbon-Prices-in-
Germany.pdf
[OECD17] OECD, Rana Roy, Nils Axel Braathen, “The Rising Cost of Ambient Air
Pollution thus far in the 21st Century”, 2017,
https://www.oecd-ilibrary.org/environment/the-rising-cost-of-ambient-air-
pollution-thus-far-in-the-21st-century_d1b2b844-en
[Ofc18] Ofcom, “Communications Market Report 2018”, August 2018,
https://www.ofcom.org.uk/research-and-data/multi-sector-research/cmr/cmr-2018
[ORAN] O-RAN Alliance, https://www.o-ran.org/
[OSM] https://sumo.dlr.de/wiki/Networks/Import/OpenStreetMap
[PPM18] G. Pocovi, K. I. Pedersen, and P. Mogensen, “Joint Link Adaptation and
Scheduling for 5G Ultra-Reliable Low-Latency Communications, “ IEEE Access,
no. 6, pp. 28912–28922, May 2018
[PT16] Port Technology, “How to apply automation to bulk operations”, September 2016
https://www.porttechnology.org/news/how_to_apply_automation_to_bulk_operati
ons
[PWC18] PWC, “BIM Level 2 Benefits Measurement: Application of PwC’s BIM Level 2
Benefits Measurement Methodology to Public Sector Capital Assets”, March
2018,
https://www.cdbb.cam.ac.uk/Downloads/Level2/4.PwCBMMApplicationReport.p
df
[QC18] Qualcomm Technologies, “How can CoMP extend 5G NR to high capacity and
ultra-reliable communications?”, Webinar, July 2018
[RCR19] RCRWireless News, “Are consumers willing to pay (more) for 5G?”, 2019,
https://www.rcrwireless.com/20190124/5g/are-consumers-willing-to-pay-more-
for-5g
[RW12a] Real Wireless, “Techniques for increasing the capacity of wireless broadband
networks: UK, 2012-203”, April 2012, http://static.ofcom.org.uk/static/uhf/real-
wireless-report.pdf
[RW12b] Real Wireless, “An assessment of the value of small cell services to operators”,
October 2012.
[SAHS19] Statistisches Amt für Hamburg und Schleswig-Holstein, "Tourismus in Hamburg
im Januar 2019", 2019, https://www.statistik-
nord.de/fileadmin/Dokumente/Presseinformationen/SI19_042.pdf
[SDOT18] Seattle Department of Transport, “Transport Budget”, 2018,
http://www.seattle.gov/financedepartment/19proposedbudget/documents/SDOT.p
df
[Sta19] Statista, “Statistiken zum Thema Kfz-Versicherung”, 2019,
https://de.statista.com/themen/1152/kfz-versicherung/
[SUMO] https://sumo.dlr.de/index.html
[STI14] Shoichi Hanatani, Toshiaki Akita and Ichiro Murata, “BER estimation through
Packet Error Rate Measurement”, International Civil Aviation Organisation,
Aeronautical communications panel, 15th April web-meeting of the working group
S (SURFACE), May 2014.
[TfL15] Transport for London, Surface Intelligent Transport System, 2015
http://content.tfl.gov.uk/fpc-20150730-part-1-item08-sits.pdf
[TL15] The Local, “Double the budget and five years late La Pepa Bridge opens in
Cádiz”, September 2015. https://www.thelocal.es/20150924/double-the-budget-
and-five-years-late-la-pepa-bridge-opens-in-cadiz
[Tra98] TransFund New Zealand, “TransFund, Project Evaluation Manual”, 1998,
www.transfund.govt.nz

5G-MoNArch (761445) D6.3 Final report on architectural verification
Version 1.0 Page 136 of 193
[UKG18] UK Government, “Transport Analysis Guidance (TAG) Data Book”, 29
November 2018 https://www.gov.uk/government/publications/tag-data-book,
Adjusted for UK inflation 2010 to 2019.
[UNCTD18] United Nations Conference on Trade and Development (UNCTAD), “Review of
Maritime Transport 2018”.
https://unctad.org/en/PublicationsLibrary/rmt2018_en.pdf
[USDoT08] US Department of Transportation, Intelligent Transport Systems – Joint Program
Office, “Colorado Implementation of New Advanced Traffic Management
System”, June 2008
https://www.itsbenefits.its.dot.gov/its/benecost.nsf/SummID/B2009-00593
[VTPI19] Victoria Transport Policy Institute, Transportation Cost and Benefit Analysis II –
Travel Time Costs, 2019. http://www.vtpi.org/tca/tca0502.pdf
[xRAN18] xRAN Fronthaul Working Group, “Control, User and Synchronization Plane
Specification”, XRAN-FH.CUS.0-v02.00, July 2018

5G-MoNArch (761445) D6.3 Final report on architectural verification
Version 1.0 Page 137 of 193
Appendix A Mapping services to slice blueprints and infrastructure
This appendix contains the material referred in Section 2.5. Explanations for the overall process of
defining the baseline architecture deployment can be found in Section 2.5 and [5GM-D62]. This extra
material includes:
• List of Slice Properties for the Slice Template - This first Section A.1 will list and explain each
relevant slice property analysed for this baseline deployment.
• List of Slice Templates - A comprehensive list of slices templates is provided in Section A.2,
one for each service deployed in the evaluation cases mentioned in Section 2.5. The slice
templates are grouped by general category (eMBB, URLLC and mMTC) in three tables.
• List of Functional Setups - A list of functional and topological mappings, showing where the
NFs belonging to each slice will be placed within all the edge clouds and central cloud, is
provided in Section A.3.
A.1 List of Slices Properties for the Slice Template
Table A-1: List of slice properties relevant to the baseline deployment specification
Slice property Explanation of slice property
Purpose Description that helps the network operator to understand the needs of the tenant and the
users
Tenant-specific slice
functionality
User traffic data flow
peering point
Node (i.e. internet peering point or tenant host / gateway) to which data coming from the
terminals are forwarded
Support for terminal
mobility
Mobility types (no / nomadic / full mobility);
Terminal speed (low: terminal speed < 10km/h, medium: 10 km/h < terminal speed < 50
km/h, high: terminal speed > 50 km/h)
Generic slice functionality /
deviations from generic
slice functionality
Functionality of Physical or Virtual Network Functions (e.g. acc. to 3GPP specifications)
can serve as base line, if appropriate; deviations (unused or additional functions) should
be specified.
RAN Examples: MC, Multi-RAT, …
Geography
Location of terminal devices
(global, nationwide, regional, local, customer premises, …)
Allows to exclude terminals in the wrong location from access to service.
Influences resource provisioning
Traffic profile
Data rate Data rate per terminal (peak, average; UL and DL);
data rate within a certain time and geographic area
Mean Bitrate Mean bitrate achieved by slice aggregated over longer period of time. E.g. ~1-2 month.
Packet generation process
- E.g. purely random / Poisson, bursty, independent or dependent on other terminals in
vicinity
- Potential impact on packet loss statistics
Packet size
Delay / latency Tolerable one-way end-to-end latency
Delay jitter
Packet loss (tolerable level,
characteristics) Max. tolerable packet loss
E2E reliability Percentage of time that the system operates at or below the tolerable packet loss level
Terminal devices
Number of Terminals Average terminal density per km^2
Access technologies (Mobile: 2G, 3G, 4G, 5G, WLAN, Bluetooth, …,
Fixed: DSL, Fibre, …)
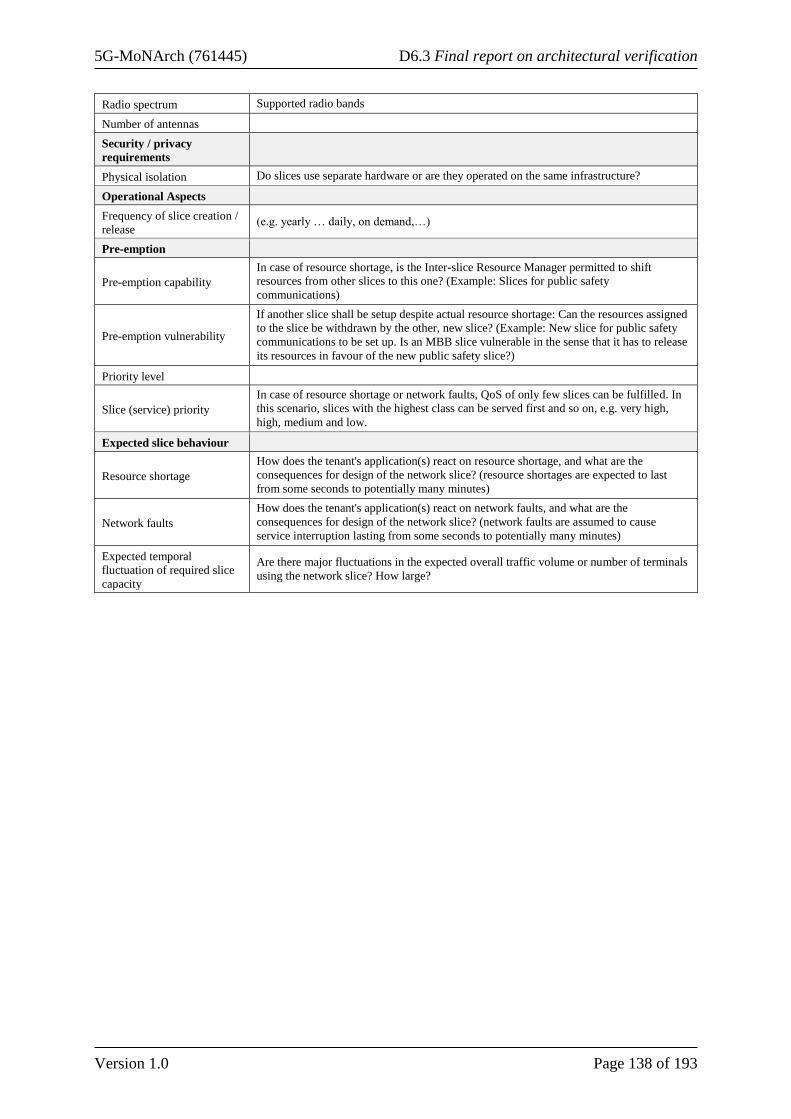
5G-MoNArch (761445) D6.3 Final report on architectural verification
Version 1.0 Page 138 of 193
Radio spectrum Supported radio bands
Number of antennas
Security / privacy
requirements
Physical isolation Do slices use separate hardware or are they operated on the same infrastructure?
Operational Aspects
Frequency of slice creation /
release (e.g. yearly … daily, on demand,…)
Pre-emption
Pre-emption capability
In case of resource shortage, is the Inter-slice Resource Manager permitted to shift
resources from other slices to this one? (Example: Slices for public safety
communications)
Pre-emption vulnerability
If another slice shall be setup despite actual resource shortage: Can the resources assigned
to the slice be withdrawn by the other, new slice? (Example: New slice for public safety
communications to be set up. Is an MBB slice vulnerable in the sense that it has to release
its resources in favour of the new public safety slice?)
Priority level
Slice (service) priority
In case of resource shortage or network faults, QoS of only few slices can be fulfilled. In
this scenario, slices with the highest class can be served first and so on, e.g. very high,
high, medium and low.
Expected slice behaviour
Resource shortage
How does the tenant's application(s) react on resource shortage, and what are the
consequences for design of the network slice? (resource shortages are expected to last
from some seconds to potentially many minutes)
Network faults
How does the tenant's application(s) react on network faults, and what are the
consequences for design of the network slice? (network faults are assumed to cause
service interruption lasting from some seconds to potentially many minutes)
Expected temporal
fluctuation of required slice
capacity
Are there major fluctuations in the expected overall traffic volume or number of terminals
using the network slice? How large?
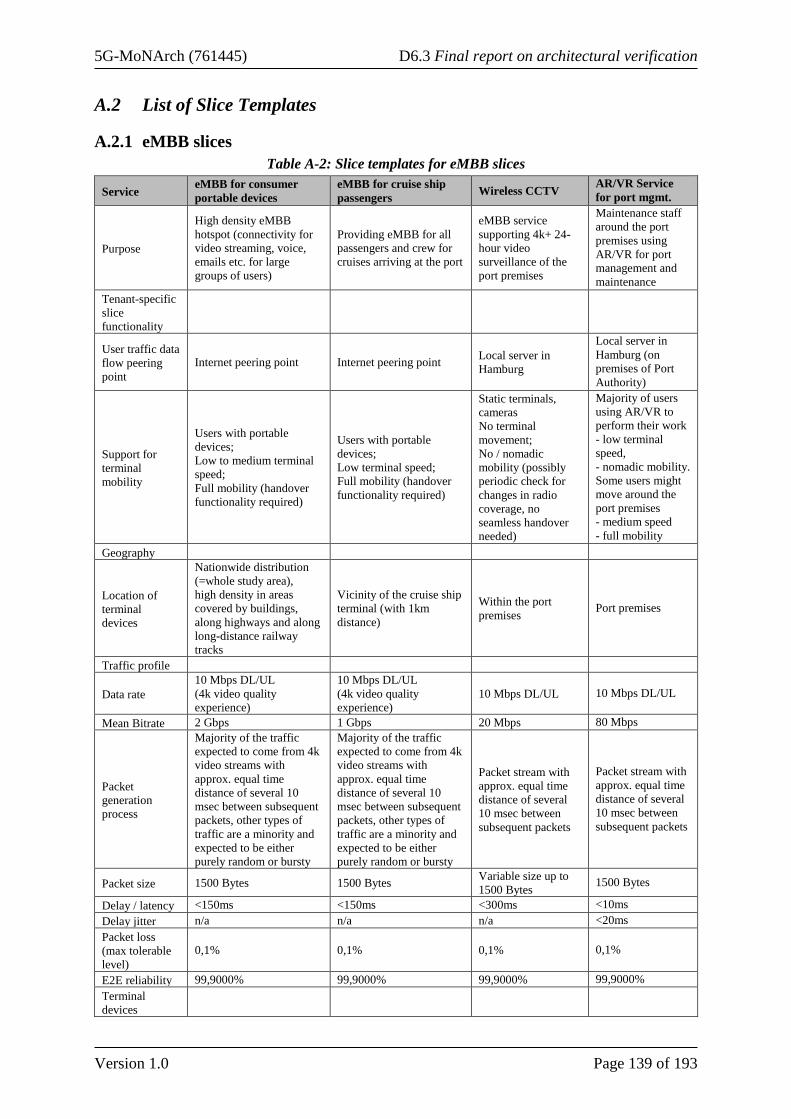
5G-MoNArch (761445) D6.3 Final report on architectural verification
Version 1.0 Page 139 of 193
A.2 List of Slice Templates
A.2.1 eMBB slices
Table A-2: Slice templates for eMBB slices
Service eMBB for consumer
portable devices
eMBB for cruise ship
passengers Wireless CCTV
AR/VR Service
for port mgmt.
Purpose
High density eMBB
hotspot (connectivity for
video streaming, voice,
emails etc. for large
groups of users)
Providing eMBB for all
passengers and crew for
cruises arriving at the port
eMBB service
supporting 4k+ 24-
hour video
surveillance of the
port premises
Maintenance staff
around the port
premises using
AR/VR for port
management and
maintenance
Tenant-specific
slice
functionality
User traffic data
flow peering
point
Internet peering point Internet peering point Local server in
Hamburg
Local server in
Hamburg (on
premises of Port
Authority)
Support for
terminal
mobility
Users with portable
devices;
Low to medium terminal
speed;
Full mobility (handover
functionality required)
Users with portable
devices;
Low terminal speed;
Full mobility (handover
functionality required)
Static terminals,
cameras
No terminal
movement;
No / nomadic
mobility (possibly
periodic check for
changes in radio
coverage, no
seamless handover
needed)
Majority of users
using AR/VR to
perform their work
- low terminal
speed,
- nomadic mobility.
Some users might
move around the
port premises
- medium speed
- full mobility
Geography
Location of
terminal
devices
Nationwide distribution
(=whole study area),
high density in areas
covered by buildings,
along highways and along
long-distance railway
tracks
Vicinity of the cruise ship
terminal (with 1km
distance)
Within the port
premises Port premises
Traffic profile
Data rate
10 Mbps DL/UL
(4k video quality
experience)
10 Mbps DL/UL
(4k video quality
experience)
10 Mbps DL/UL 10 Mbps DL/UL
Mean Bitrate 2 Gbps 1 Gbps 20 Mbps 80 Mbps
Packet
generation
process
Majority of the traffic
expected to come from 4k
video streams with
approx. equal time
distance of several 10
msec between subsequent
packets, other types of
traffic are a minority and
expected to be either
purely random or bursty
Majority of the traffic
expected to come from 4k
video streams with
approx. equal time
distance of several 10
msec between subsequent
packets, other types of
traffic are a minority and
expected to be either
purely random or bursty
Packet stream with
approx. equal time
distance of several
10 msec between
subsequent packets
Packet stream with
approx. equal time
distance of several
10 msec between
subsequent packets
Packet size 1500 Bytes 1500 Bytes Variable size up to
1500 Bytes 1500 Bytes
Delay / latency <150ms <150ms <300ms <10ms
Delay jitter n/a n/a n/a <20ms
Packet loss
(max tolerable
level)
0,1% 0,1% 0,1% 0,1%
E2E reliability 99,9000% 99,9000% 99,9000% 99,9000%
Terminal
devices

5G-MoNArch (761445) D6.3 Final report on architectural verification
Version 1.0 Page 140 of 193
Number of
Terminals
several 10s of thousand
per km2
Up to 5,000 passengers on
larger cruise ships, with
some passengers carrying
multiple terminals, so
number of terminals could
be slightly larger
Several hundred
video surveillance
points in the port
area.
10s of maintenance
staff actively using
the service across
the area
simultaneously
Access
technologies 4G and 5G 4G and 5G 4G and 5G 4G and 5G
Radio spectrum All bands likely supported All bands likely supported All bands likely
supported
All bands likely
supported
Number of
antennas 2 and 4 2 and 4 2 and 4 2 and 4
Security /
privacy
requirements
Physical
isolation No No No No
Operational
Aspects
Frequency of
slice creation /
release
2 per year (e.g. for SW
update) Daily, on demand 1 per year 1 per year
Pre-emption
Pre-emption
capability No No No No
Pre-emption
vulnerability Yes Yes No No
Priority level Low / Best Effort Low / Best Effort Medium Medium
Slice (service)
priority Low Low Medium Low
Expected slice
behaviour
Resource
shortage
There is a noticeable
reduction in QoE, lower
quality video streaming,
undesirable but acceptable
There is a noticeable
reduction in QoE, lower
quality video streaming,
undesirable but acceptable
There is a noticeable
reduction in QoE,
lower quality video
streaming,
undesirable but
acceptable
Reduction on the
quality of the
virtual simulation
and out-of-date
information in AR
Network faults
Service interruption
depending on the duration
of the fault and the
application being run by
the user.
Service interruption
depending on the duration
of the fault and the
application being run by
the user.
Cameras can operate
in offline mode
(record for a certain
period and later
upload the cached
data; obviously
limited by the
camera's internal
storage capacity).
Note that offline
operation may not be
acceptable in all
application scenarios
Service
interruption
Expected
temporal
fluctuation of
required slice
capacity
Yes
Peak hour in the early
evening
Yes
Peaks when cruise ship is
coming in and in morning
and early evening hours
No No

5G-MoNArch (761445) D6.3 Final report on architectural verification
Version 1.0 Page 141 of 193
A.2.2 URLLC slices
Table A-3: Slice templates for URLLC slices
Service Automated Vehicles and Port
Machinery Traffic signal control Semi-automated driving
Purpose Various vehicles and port
machinery driving autonomously
Connected traffic lights and
intelligent traffic signal control
Trucks and passenger
vehicles driving semi-
autonomously around the
city
Tenant-specific
slice functionality
User traffic data
flow peering point Local server in Hamburg Local server in Hamburg
Local server at network
edge / in Hamburg
Support for
terminal mobility
Trucks, cars, cranes and other port
machinery
- Medium to high speed
- Nomadic mobility (short
connection interruption tolerable,
no need for seamless HO)
Ideally, the whole area where
automatic port machines are
moving around is covered by a
single radio cell; then we do not
need any handovers at all
Static terminals (= traffic lights)
No terminal movement;
No / nomadic mobility
(possibly periodic check for
changes in radio coverage, no
seamless handover needed)
Trucks and passenger
vehicles
- High speed
- Full mobility
Generic slice
functionality /
deviations from
generic slice
functionality
RAN MC for higher resilience
Geography
Location of
terminal devices Port premises
City of Hamburg (= whole
study area)
City of Hamburg (=
whole study area)
Traffic profile
Data rate 0.5 Mbps DL/UL Minimum
connectivity n/a
Mean Bitrate 100 Mbps 10 Mbps 50 Mbps
Packet generation
process n/a
Packet stream with approx.
equal time distance between
subsequent packets, 1 message
per minute
n/a
Packet size n/a 100 byte per message n/a
Delay / latency <10ms <100ms <10ms
Delay jitter <10ms <100ms <10ms
Packet loss
(tolerable level,
characteristics)
00,0001% 00,001% 00,001%
E2E reliability 99,9990% 99,9990% 99,9990%
Terminal devices
Number of
Terminals
Up to 100s of special purpose
vehicles in the sea port across
various logistics companies
Several thousands of road
sensors in the port area.
None today;
expected to grow over the
next 10 years
Access
technologies LTE-M LTE-M LTE-M
Radio spectrum All bands likely supported Sub-1GHz 5.9GHz
Number of
antennas 2 and 4 1 and 2 1-4
Security / privacy
requirements
Physical isolation No No No
Operational
Aspects

5G-MoNArch (761445) D6.3 Final report on architectural verification
Version 1.0 Page 142 of 193
Frequency of slice
creation / release 1 per year or 1 per incoming vessel 1 per year 1 per year
Pre-emption
Pre-emption
capability No No No
Pre-emption
vulnerability No No No
Priority level High High High
Slice (service)
priority High High High
Expected slice
behaviour
Resource shortage
Slow down operating speed /
number of automatic vehicles and
port machinery. Autonomous
machines will go into a failsafe
mode and stop working when
disconnected, causing potentially
high costs.
High impact on operating costs for
ships and port, negative impact on
port image.
→ Not tolerable!!!
Control computer can drop
command messages to those
traffic lights whose
configuration does not need to
be changed.
Traffic lights with minor impact
on overall traffic situation can
be told to stop sending status
reports to the control computer
for the time of the network
congestion situation
Semi-automatic drive
operation is stopped, and
driver has to take over
control of the car or truck
Network faults
Service interruption would not be
acceptable, service completely
dependent on network connectivity.
Autonomous machines will go into
a failsafe mode and stop working
when disconnected, causing
potentially high costs
Traffic lights will continue
operation with latest
configuration, which is possibly
suboptimum for the actual road
traffic situation
Control computer does not get
actual traffic situation reports
and may take suboptimum
decisions for other traffic lights.
All in all, road traffic
congestion may occur
Truck / car on-board
electronics controls the
truck / car on its own w/o
remote assistance.
If the fault persists,
driving operation is
handed over to the human
driver.
Expected temporal
fluctuation of
required slice
capacity
No No No
A.2.3 mMTC slices
Table A-4: Slice templates for mMTC slices
Service Assisted
driving
Environmental
data analytics Cargo tracking
Smart Grid data
collection /
control
Waste mgmt.
and ITS control
Purpose
On-board
information for
drivers
Environmental
sensors spread
throughout the
port area,
collecting various
environmental
metrics
Containers
augmented with
sensors for
cargo tracking
Sensors for
various
applications
distributed
throughout the
city
Waste containers
augmented with
sensors to detect
the filling level
and report this to
a central entity
scheduling the
trucks collecting
the waste
Tenant-specific
slice functionality
User traffic data
flow peering
point
Local server at
network edge /
in Hamburg
Local server in
Hamburg or
central server
possible, operator-
internal routing
(instead of global
internet)
preferable
Internet peering
point
Internet peering
point
Internet peering
point
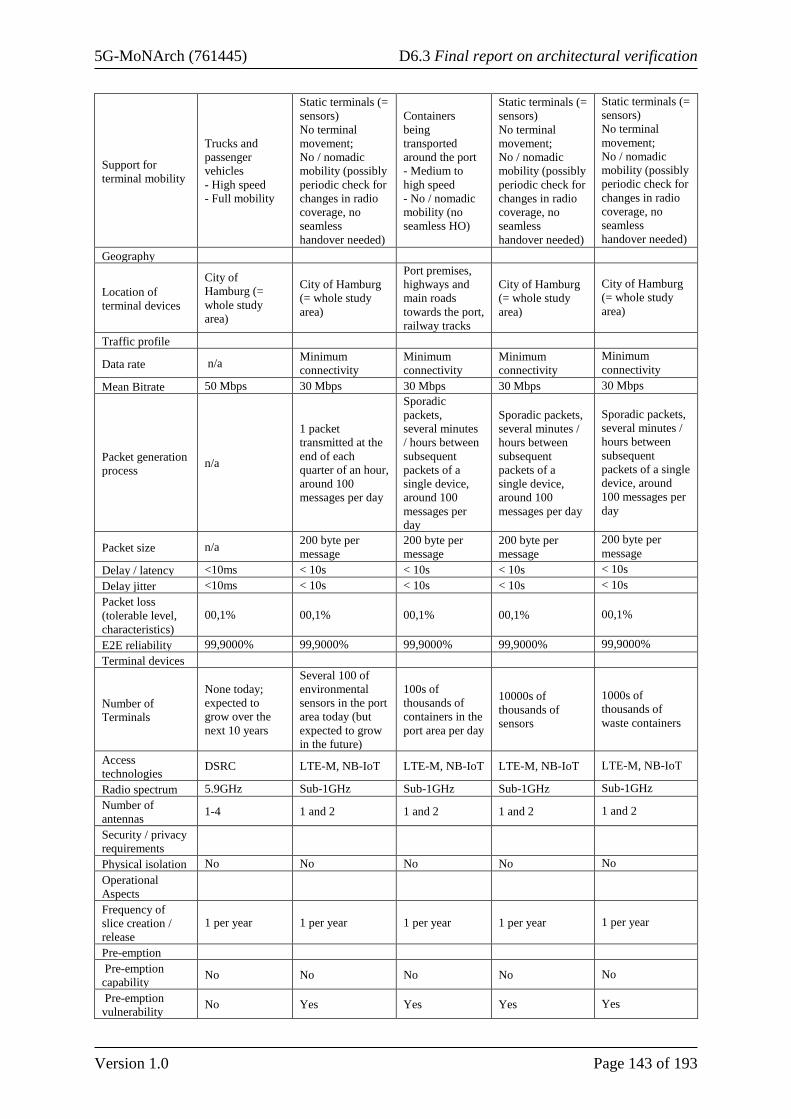
5G-MoNArch (761445) D6.3 Final report on architectural verification
Version 1.0 Page 143 of 193
Support for
terminal mobility
Trucks and
passenger
vehicles
- High speed
- Full mobility
Static terminals (=
sensors)
No terminal
movement;
No / nomadic
mobility (possibly
periodic check for
changes in radio
coverage, no
seamless
handover needed)
Containers
being
transported
around the port
- Medium to
high speed
- No / nomadic
mobility (no
seamless HO)
Static terminals (=
sensors)
No terminal
movement;
No / nomadic
mobility (possibly
periodic check for
changes in radio
coverage, no
seamless
handover needed)
Static terminals (=
sensors)
No terminal
movement;
No / nomadic
mobility (possibly
periodic check for
changes in radio
coverage, no
seamless
handover needed)
Geography
Location of
terminal devices
City of
Hamburg (=
whole study
area)
City of Hamburg
(= whole study
area)
Port premises,
highways and
main roads
towards the port,
railway tracks
City of Hamburg
(= whole study
area)
City of Hamburg
(= whole study
area)
Traffic profile
Data rate n/a Minimum
connectivity
Minimum
connectivity
Minimum
connectivity
Minimum
connectivity
Mean Bitrate 50 Mbps 30 Mbps 30 Mbps 30 Mbps 30 Mbps
Packet generation
process n/a
1 packet
transmitted at the
end of each
quarter of an hour,
around 100
messages per day
Sporadic
packets,
several minutes
/ hours between
subsequent
packets of a
single device,
around 100
messages per
day
Sporadic packets,
several minutes /
hours between
subsequent
packets of a
single device,
around 100
messages per day
Sporadic packets,
several minutes /
hours between
subsequent
packets of a single
device, around
100 messages per
day
Packet size n/a 200 byte per
message
200 byte per
message
200 byte per
message
200 byte per
message
Delay / latency <10ms < 10s < 10s < 10s < 10s
Delay jitter <10ms < 10s < 10s < 10s < 10s
Packet loss
(tolerable level,
characteristics)
00,1% 00,1% 00,1% 00,1% 00,1%
E2E reliability 99,9000% 99,9000% 99,9000% 99,9000% 99,9000%
Terminal devices
Number of
Terminals
None today;
expected to
grow over the
next 10 years
Several 100 of
environmental
sensors in the port
area today (but
expected to grow
in the future)
100s of
thousands of
containers in the
port area per day
10000s of
thousands of
sensors
1000s of
thousands of
waste containers
Access
technologies DSRC LTE-M, NB-IoT LTE-M, NB-IoT LTE-M, NB-IoT LTE-M, NB-IoT
Radio spectrum 5.9GHz Sub-1GHz Sub-1GHz Sub-1GHz Sub-1GHz
Number of
antennas 1-4 1 and 2 1 and 2 1 and 2 1 and 2
Security / privacy
requirements
Physical isolation No No No No No
Operational
Aspects
Frequency of
slice creation /
release
1 per year 1 per year 1 per year 1 per year 1 per year
Pre-emption
Pre-emption
capability No No No No No
Pre-emption
vulnerability No Yes Yes Yes Yes

5G-MoNArch (761445) D6.3 Final report on architectural verification
Version 1.0 Page 144 of 193
Priority level High Low / Best Effort Medium Low Low
Slice (service)
priority High Low Medium Low Low
Expected slice
behaviour
Resource shortage
Driving
assistance is
stopped and
driver has to
take over
control of the
car or truck
Application is not
very sensitive to
loss of data, so no
big impact from
resource loss
It would reduce
the tracking
precision until
resources are
returned
Application is not
very sensitive to
loss of data, so no
big impact from
resource loss
Application is not
very sensitive to
loss of data, so no
big impact from
resource loss
Network faults
Truck / car
onboard
electronics
controls the
truck / car on its
own w/o remote
assistance.
If the fault
persists, driving
operation is
handed over to
the human
driver.
Loss of data and
low impact
Application
would try to
relocate each
container in its
tracking list
Loss of data and
low impact
Loss of data and
low impact
Expected
temporal
fluctuation of
required slice
capacity
No No No No No
A.3 List of Functional Setups
Functional setups are functional and topological mappings indicating for each slice where the different
networks functions will be hosted, as well as where the services will be deployed. The Hamburg
verification scenario and the assumed infrastructure described in Section 2.3 are used and referred to in
these setups. The following assumptions were made when generating the functional setups for each
service in each evaluation case:
• The NFs for each service can be hosted either in:
o The MNO’s central cloud.
o One of the MNO’s edge cloud sites.
o In a tenant’s edge cloud site.
• For more details on the criteria for the placement of the NFs, please consult [5GM-D62].
• The available clouds (edge or central) used in the setups refer to the infrastructure described in
Section 2.4
• Edge cloud sites from tenants (like the port authority) are considered to have less capabilities
and to be closer to the edge.
• It is assumed that an edge cloud site is able to access all antennas in its designed area.
• The baseline deployment could use a CPRI [Cpr15] or an eCPRI [Cpr17] connection between
the RRHs and the baseband processing units. This is indicated with the split in the PHY layer
(PHY low and PHY high).
o Other splits, such as the one defined by O-RAN [ORAN] are also feasible
• Slices related to the smart port will have antennas connect to two edge clouds.
• Besides that, for slices requiring higher reliability, there is an indication of where extra measures
for achieving higher reliability will be deployed (Reliability sub-plane).
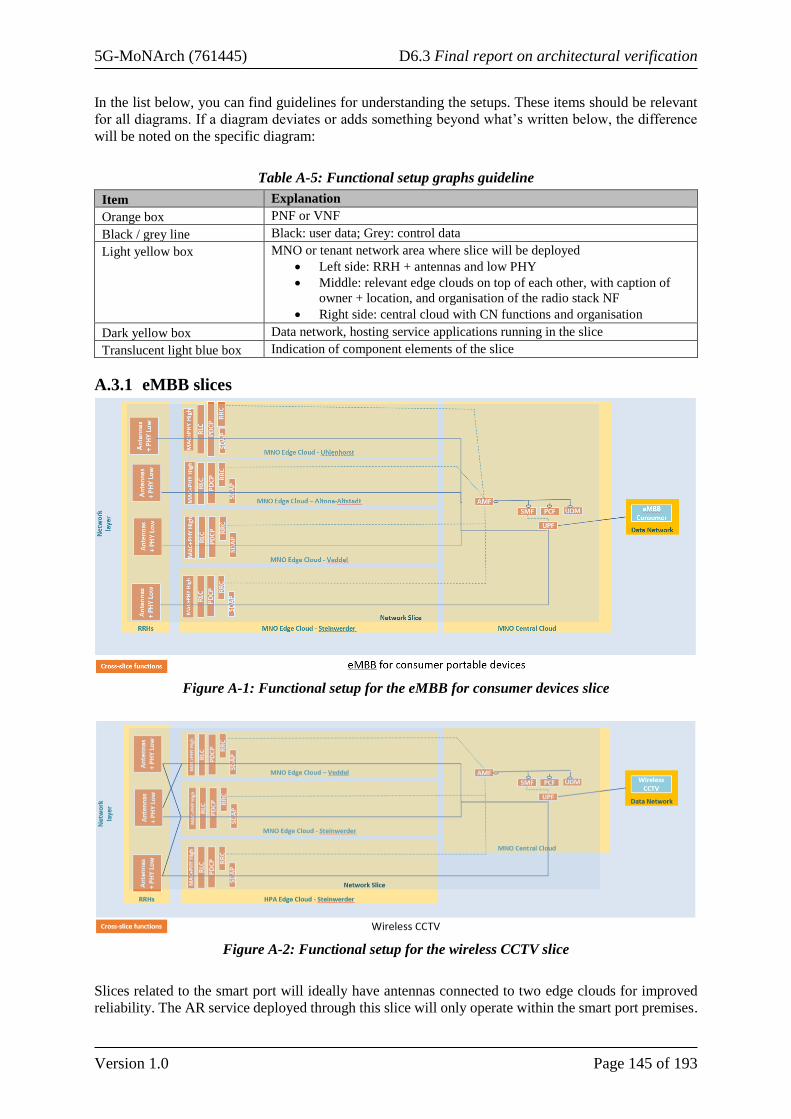
5G-MoNArch (761445) D6.3 Final report on architectural verification
Version 1.0 Page 145 of 193
In the list below, you can find guidelines for understanding the setups. These items should be relevant
for all diagrams. If a diagram deviates or adds something beyond what’s written below, the difference
will be noted on the specific diagram:
Table A-5: Functional setup graphs guideline
Item Explanation
Orange box PNF or VNF
Black / grey line Black: user data; Grey: control data
Light yellow box MNO or tenant network area where slice will be deployed
• Left side: RRH + antennas and low PHY
• Middle: relevant edge clouds on top of each other, with caption of
owner + location, and organisation of the radio stack NF
• Right side: central cloud with CN functions and organisation
Dark yellow box Data network, hosting service applications running in the slice
Translucent light blue box Indication of component elements of the slice
A.3.1 eMBB slices
Figure A-1: Functional setup for the eMBB for consumer devices slice
Figure A-2: Functional setup for the wireless CCTV slice
Slices related to the smart port will ideally have antennas connected to two edge clouds for improved
reliability. The AR service deployed through this slice will only operate within the smart port premises.

5G-MoNArch (761445) D6.3 Final report on architectural verification
Version 1.0 Page 146 of 193
Figure A-3: Functional setup for the AR / VR service for port management and maintenance slice
A.3.2 URLLC slices
As previously highlighted, slices related to the smart port may have antennas connect to two edge clouds
for additional reliability. For slices requiring higher reliability, the dotted line box is an indication of
where extra measures for achieving higher reliability will be deployed (Reliability sub-plane). The
service deployed through this slice will only operate within the smart port premises.
Figure A-4: Functional setup for the automated vehicles and port machinery slice
Figure A-5: Functional Setup for the Traffic Signal Control slice
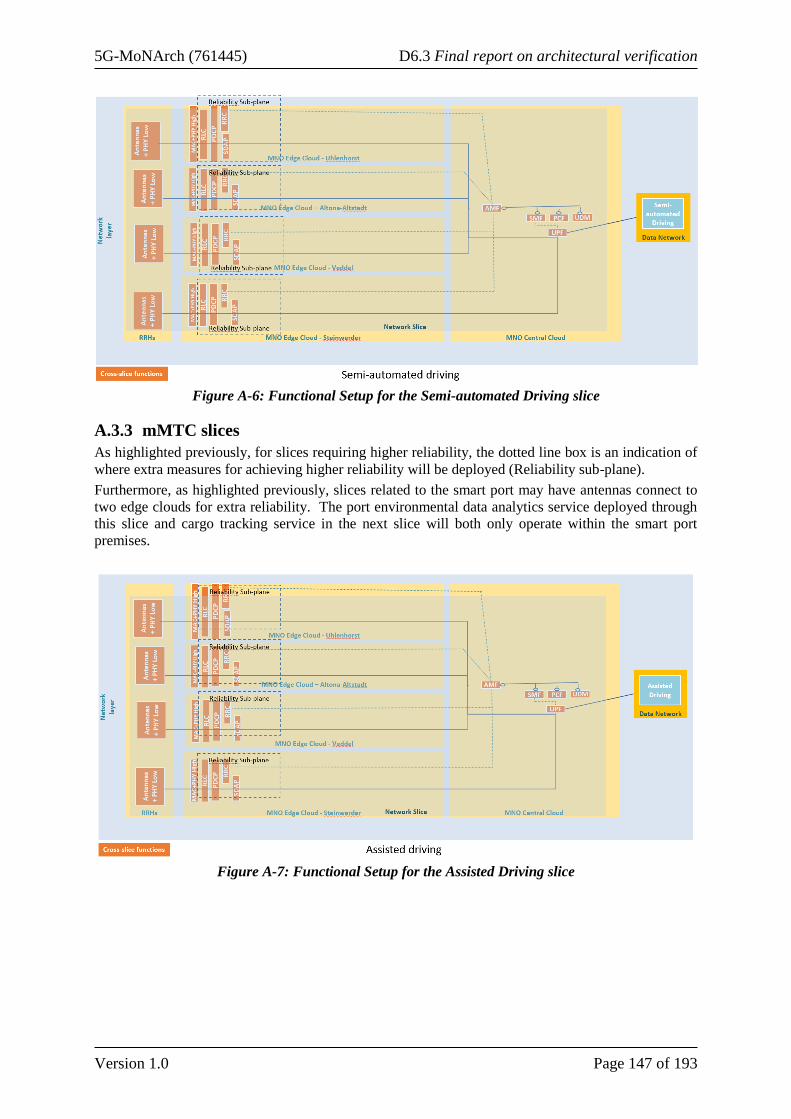
5G-MoNArch (761445) D6.3 Final report on architectural verification
Version 1.0 Page 147 of 193
Figure A-6: Functional Setup for the Semi-automated Driving slice
A.3.3 mMTC slices
As highlighted previously, for slices requiring higher reliability, the dotted line box is an indication of
where extra measures for achieving higher reliability will be deployed (Reliability sub-plane).
Furthermore, as highlighted previously, slices related to the smart port may have antennas connect to
two edge clouds for extra reliability. The port environmental data analytics service deployed through
this slice and cargo tracking service in the next slice will both only operate within the smart port
premises.
Figure A-7: Functional Setup for the Assisted Driving slice

5G-MoNArch (761445) D6.3 Final report on architectural verification
Version 1.0 Page 148 of 193
Figure A-8: Functional Setup for the Port Environmental Data Analytics slice
Figure A-9: Functional Setup for the Cargo Tracking slice
Figure A-10: Functional Setup for the Smart Grid Data Collection and Control slice
Figure A-11 describes the functional setup of multiple smart city services (logistics, environmental data,
waste management, ITS control) which share identical setups.

5G-MoNArch (761445) D6.3 Final report on architectural verification
Version 1.0 Page 149 of 193
Figure A-11: Functional Setup for the City Services slices

5G-MoNArch (761445) D6.3 Final report on architectural verification
Version 1.0 Page 150 of 193
Appendix B Further details on services modelled and scenario setup for
Mx-ART simulations
B.1 Description of network configuration and slice configuration for
Hamburg verification scenario
As described in Section 2.2, we consider Hamburg city centre including port area for technical
verification of 5G-MoNArch enablers. In this section, network configuration and slice configuration
details specific to Mx-ART (for the baseline case) are provided.
• Geographical Configuration: Simulation area of 13 km*12 km around Hamburg city centre is
simulated, covering Hamburg harbour and city centre.
• Network Configuration: 92 antenna sites have been placed in the area (combination of 3 sector
and 1 sector). At this moment Mx-ART doesn’t support multilayer network configuration and
elasticity related enablers require large higher bandwidth to achieve gains. Cells are operating
at 800 MHz band and configured bandwidth is 100 MHz (to compensate large multilayer
resource pool). Table B-1 provides the configured antenna parameters, as per baseline scenario.
Table B-1: Configuration of antenna sites assumed in Mx-ART
Parameter Value
Operating Frequency 800 MHz
Bandwidth 100 MHz
Transmit Power 53 dBm
Antenna Gain (3 sector Macro) 14 dBi
Antenna Gain (Omni Micro) 5 dBi
Antenna Height (3 sector Macro) 30 m
Antenna Height (Omni Micro) 8 m
Channel Model Winner+[HMK+10]
Antenna Configuration 4 * 4 MIMO
• Slice Configuration: 3 network slices are configured based on diverse requirements.
1) eMBB: slice created to serve MBB traffic, assigned statically 70 % of the radio resource
share. Traffic demand for this slice is changing over the time, hence KPIs related to this
slice will be a key focus after application of elasticity enablers.
2) IoT: slice is created to serve IoT traffic, assigned 10 % of the static radio resource share.
This slice is acting as a background slice.
3) URLLC: slice created to serve low latency traffic, assigned 20 % of the static radio resource
share. RAN reliability related enablers are verified with this slice.
For the baseline scenario, resource share among the slices is kept constant. However, during the
validation of slice-aware elasticity enablers, overall network performance is analysed against
elastic resource sharing vs static scheme.
• Mobility Model: Mobility model is responsible for moving terminals within study area. Based
on the use case, a mobility model cab be attached to a user group. In this section we provide an
overview of mobility model supported by Mx-ART.
1) Static: Static mobility model is attached to terminals which are expected to be at a fixed
geographic location over the course of simulation time. E.g. sensors deployed within study
area.
2) Trace File: this mobility model moves terminals as per position info provided per timestamp
in trace file.

5G-MoNArch (761445) D6.3 Final report on architectural verification
Version 1.0 Page 151 of 193
3) SUMO generated trace file: Simulation of Urban Mobility, known as SUMO is an open
source mobility simulator [SUMO]. SUMO network consists of nodes and edges. Mobility
elements are configured with parameters e.g. type (pedestrian, car), speed, source and
destination points, arrival rate etc. Major advantage of SUMO over other traffic simulators
is the support for various open source tools, like ‘open street map’ [OSM]. In combination
with OSM, realistic mobility traces for cars and pedestrians covering the complete road
network of Hamburg study area can be created to be imported into the Mx-ART simulation.
• User Group Configuration: User group concept is introduced in Mx-ART to analyse the effect
of enablers from UE side. A user group consist of UEs with similar characteristics, and KPIs
with the constraint that a UE belonging to a particular user group can only be connected to single
network slice. KPIs for such UEs can be aggregated allowing for studying overall user
experience rather than for individual UEs.
1) Pedestrian: user group represents low mobility eMBB traffic. They are configured to
connect with ‘eMBB’ slice. In terms of spatial distribution, they are spread across entire
walking ways within the study area. SUMO-generated traces are attached with this user
group, allowing UEs to roam within the Hamburg area independently and in a more realistic
manner. Each terminal is demanding CBR traffic of 5 Mbps (see total traffic demand for
the scenario in Figure B-1). The size of this group varies over time, e.g. 200 active users
demanding traffic during early morning hours while 1000 users demanding traffic during
peak evening hours. Elasticity related enablers are applied on this user group.
Figure B-1: Traffic demand for pedestrians
2) Traffic Light Controller Group: 1532 traffic lights are considered within the Hamburg study
area. Traffic lights are configured to connect with ‘URLLC’ slice. Each traffic light is at a
fixed position and demanding 2.12 kbps CBR traffic with very high reliability. These group
of UEs are examined for “Reliability” related enablers.
3) Car Group: In addition to Traffic Light UEs, 700 cars are configured to connect with
‘URLLC’ slice. UEs within these group are moving with realistic speed limits of Hamburg’s
street (fed from SUMO mobility). This group represents moderate velocity UEs.
4) Boat Group: 5 Boat UEs are configured to connect with “IoT” slice, constantly reporting
sensor measurement data. Boats are moving on predefined path in Elbe and demanding CBR
traffic of 15 kbps. This group act as a background traffic.
5) Truck Group: 6 Truck UEs are configured to connect with “IoT” slice, demanding 128 kbps
CBR traffic generating some background traffic.
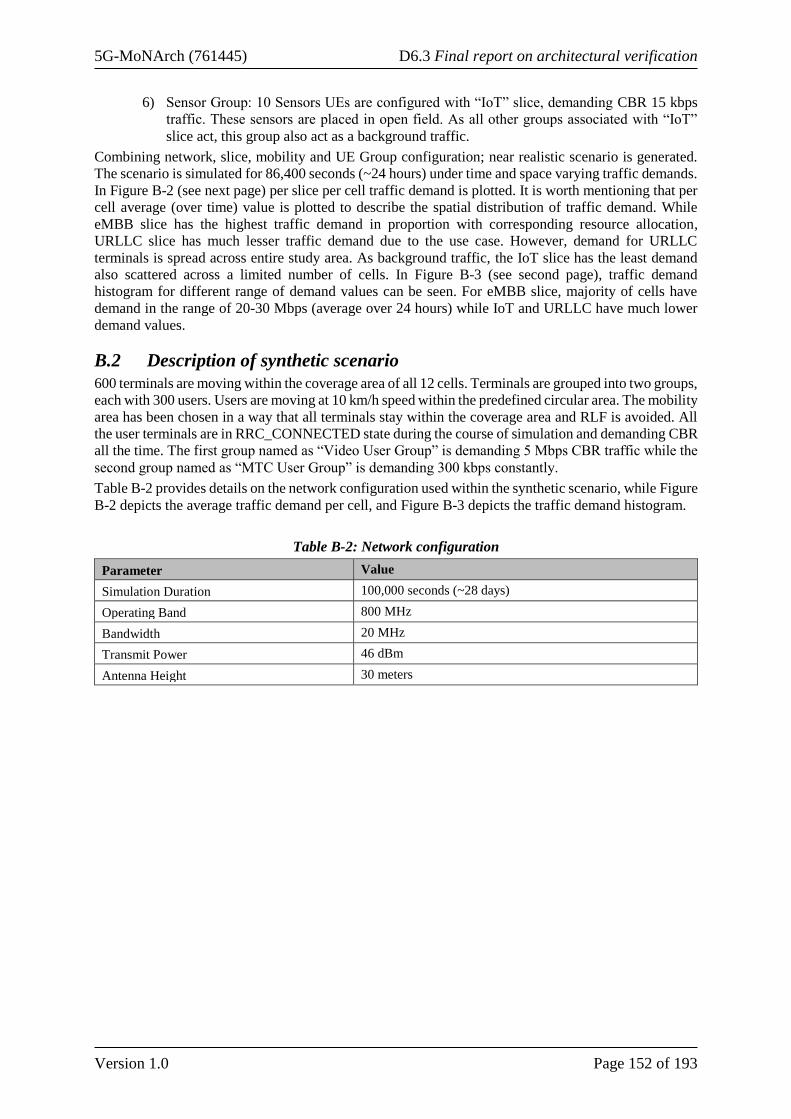
5G-MoNArch (761445) D6.3 Final report on architectural verification
Version 1.0 Page 152 of 193
6) Sensor Group: 10 Sensors UEs are configured with “IoT” slice, demanding CBR 15 kbps
traffic. These sensors are placed in open field. As all other groups associated with “IoT”
slice act, this group also act as a background traffic.
Combining network, slice, mobility and UE Group configuration; near realistic scenario is generated.
The scenario is simulated for 86,400 seconds (~24 hours) under time and space varying traffic demands.
In Figure B-2 (see next page) per slice per cell traffic demand is plotted. It is worth mentioning that per
cell average (over time) value is plotted to describe the spatial distribution of traffic demand. While
eMBB slice has the highest traffic demand in proportion with corresponding resource allocation,
URLLC slice has much lesser traffic demand due to the use case. However, demand for URLLC
terminals is spread across entire study area. As background traffic, the IoT slice has the least demand
also scattered across a limited number of cells. In Figure B-3 (see second page), traffic demand
histogram for different range of demand values can be seen. For eMBB slice, majority of cells have
demand in the range of 20-30 Mbps (average over 24 hours) while IoT and URLLC have much lower
demand values.
B.2 Description of synthetic scenario
600 terminals are moving within the coverage area of all 12 cells. Terminals are grouped into two groups,
each with 300 users. Users are moving at 10 km/h speed within the predefined circular area. The mobility
area has been chosen in a way that all terminals stay within the coverage area and RLF is avoided. All
the user terminals are in RRC_CONNECTED state during the course of simulation and demanding CBR
all the time. The first group named as “Video User Group” is demanding 5 Mbps CBR traffic while the
second group named as “MTC User Group” is demanding 300 kbps constantly.
Table B-2 provides details on the network configuration used within the synthetic scenario, while Figure
B-2 depicts the average traffic demand per cell, and Figure B-3 depicts the traffic demand histogram.
Table B-2: Network configuration
Parameter Value
Simulation Duration 100,000 seconds (~28 days)
Operating Band 800 MHz
Bandwidth 20 MHz
Transmit Power 46 dBm
Antenna Height 30 meters

5G-MoNArch (761445) D6.3 Final report on architectural verification
Version 1.0 Page 153 of 193
Figure B-2: Average traffic demand per cell

5G-MoNArch (761445) D6.3 Final report on architectural verification
Version 1.0 Page 154 of 193
Figure B-3: Traffic demand histogram

5G-MoNArch (761445) D6.3 Final report on architectural verification
Version 1.0 Page 155 of 193
Appendix C Attacks and probes used in security verification process
Table C-1 summarises the list of probes and attacks which were used for security evaluation in WP3
[5GM-D3.1, 5GM-D3.2] which is mentioned in EC1.
Table C-1: List of probes and attacks which were used for security evaluation
Security Probe Asset monitored Possible attack/detections
HSM UE with HSM
• Brute-force attack against HSM protected device
• Main in the middle attack: modification of message
integrity
• Detection of unsecure connections through HSM
Anti-jamming Wireless network
• Pulsed Based jamming attack
• Wide Band jamming attack
• Wave Form jamming attack
• LFM Chirp jamming attack
VPN Server Logging VPN server and
connections
• Detection of weak encryption in VPN connections
• DoS attack against VPN server: connection requests
flooding
• Brute-force attack against VPN server
• Settings manipulation attack: authorised change of
configuration for VPN connections
Tampering Sensor Physical devices Detection of unauthorised physical manipulation of
devices
User and Entity
Behaviour
Analytics/Network
Behavioural Analysis
(UEBA/NBA)
UE Detection of anomalies in the behaviour of UE when using
several services: SMS, Voice Calls, VR, etc.
IDS Network
• Denial of Service attack against assets (i.e. UDM)
• Brute-force attack against assets (i.e. UDM, SthD,
etc.)
• Malicious scanning of services (i.e. Port scanning)
5G-MoNArch (761445) D6.3 Final report on architectural verification
Version 1.0 Page 156 of 193
Appendix D Further details on benefits analysis and network
dimensioning for commercial verifications
This appendix provides further details on the commercial and socio-economic modelling performed in
WP6. It details:
• The approach to modelling eMBB revenues in the Hamburg study area
• The approach to modelling EC1 benefits and revenues
• The approach to modelling smart city benefits and revenues in EC3
• Network dimensioning and cost assumptions applied in the cost modelling:
o For the study area wide cost analysis
o For the cruise ship terminal small cell demand hotspot network
D.1 Revenue and benefits modelling for eMBB
This section describes the approach, key assumptions and results of our revenue and benefit forecasts
for eMBB in the Hamburg Study Area used in this project. We took the eMBB analysis of 5G NORMA
from [5GN-D23] as a starting point but made changes to the methodology and adapted the inputs to
reflect the German communications market and the demographics of the Hamburg Study Area.
D.1.1 eMBB market segmentation
The market segmentation applied in our eMBB revenue forecasts has been updated from 5G NORMA
to consider emerging trends such as unlimited data packages and variations in segments using MBB.
It is still our view that 5G take-up will vary by market segment. In addition, we believe MSPs will
continue to offer a range of packages to target different market segments. Tariff structures may vary by
country as they do today, but there is a common logic to their market segmentation. For example: as of
the beginning of 2019, some Scandinavian operators offer unlimited data, but at different headline
download speeds and hence QoE. In the UK, only one operator offers an unlimited data tariff, while in
Germany several operators offer an unlimited data tariff as their top of the range package (at a significant
premium to packages with data limits). We anticipate that unlimited data will be more important in the
future and services may be differentiated more by QoE, e.g. on the basis of minimum guaranteed
throughput, latency and international roaming allowances.
We define the following segments (though operators may have more segments than this in practice):
• Basic Needs – having a service that covers the minimum necessary to be able to participate and
communicate online in society is the key driver for this segment. Customers are either
constrained from purchasing better packages by low income or being less interested than
average in social media and online services. High quality video and AR are seen as non-essential
or luxuries;
• Standard – having good quality connectivity and coverage for a variety of everyday online uses
including social media, good quality video and AR experiences, information etc. is important
to this segment;
• High Performance – high quality SVOD and AR, and/or high-quality gaming are important to
this segment.
Our assumptions on the distribution of the population across these market segments are shown in Table
D-1.
In the baseline scenario, we assume that service quality is better than today’s networks with minimum
throughputs of 10Mbps. We assume the population split across basic needs, standard and high
performance is similar to the 5G NORMA market segments – laggards, mainstream and early adopters.
We assume that this mix of users corresponds to our medium eMBB demand scenario.
In the low scenario, we assume that service quality does not improve compared to today and is largely
best effort with a minimum throughput of 5Mbps. As a result, there are no high-performance users. We
assume that this mix of users corresponds to our low eMBB demand scenario.

5G-MoNArch (761445) D6.3 Final report on architectural verification
Version 1.0 Page 157 of 193
In the high scenario, we again assume an improvement in service quality compared to today’s networks
with a minimum throughput of 10Mbps, the same as the baseline scenario. However, to support
widespread use of SVOD services we dimension the network for a higher capacity than in the baseline
case. We assume that the proportion of the population in the basic needs section is the same as in the
low and baseline scenarios and that the high-performance segment doubles in size. We assume that this
mix of users corresponds to our high eMBB demand scenario.
Clearly, it is difficult to predict how these segments might change according to 5G functionality and
performance. Instead, we have produced a coherent set of potential future scenarios for the market.
There is some evidence to support this assumption. [Bit19] carried out market research on willingness
to pay for 5G MBB. They found that 33% would be willing to pay €10 to €30 per month more for 5G
than 4G (and 64% less than €10 per month more). This equates well with our high-performance segment
in the high scenario.
Table D-1: eMBB market segmentation by scenario
Low Baseline High
Basic Needs 16% 16% 16%
Standard 84% 68% 52%
High Performance 0% 16% 32%
D.1.2 eMBB revenues
Forecast users
We assume that the take-up of new 5G eMBB mobile plans (as shown in Table D-2) will follow a similar
saturation curve as for 4G take-up. We re-use the 5G NORMA penetration model and make a
correspondence between the new segments of basic needs, standard and high performance on the one
hand and laggards, mainstream and early adopters on the other.
Table D-2: Forecast penetration for eMBB services, Hamburg Study Area
2020 2021 2022 2023 2024 2025 2026 2027 2028 2029 2030
Basic Needs 0% 0% 1% 3% 11% 21% 29% 36% 42% 49% 57%
Standard 0.5% 3% 11% 21% 29% 36% 42% 49% 57% 66% 77%
High Performance 11% 21% 29% 36% 42% 49% 57% 66% 77% 90% 96%
There are two measures of population for the Study Area: a residential population who may or may not
work in the Study Area; and a daytime population that includes business users, commuters, shoppers,
tourists and general visitors to the area.
On the one hand, billing data is based on where customers live, not where they use their phone. On the
other hand, the network is dimensioned on the basis of the busy hour traffic and this is based on the
daytime population as measured in the busiest hour of the day, not the residential population. Measuring
revenues by the residential population alone would lead to a divergence with the basis of the traffic and
cost calculations. However, the daytime population is only present in the Study Area for a proportion of
the time. Attributing revenues from the residential and daytime population is one way to deal with this
– though this requires an assumption on the most appropriate allocation method. We decided to continue
to use the residential population for our baseline scenario.
Average Revenue per User (ARPU) for eMBB
Table D-3 below reports the ARPU assumptions that we applied across the scenarios and market
segments.
We calibrated eMBB ARPU so that the weighted average ARPU in the low scenario across the relevant
market segments matched the 2017 ARPU for Germany as a whole, reported in [Bun17]. We assumed
that this scenario captures a world where users expect the capability of MBB services to increase slowly
and steadily (i.e. without a sea change in performance) and do not expect to pay more. This would be

5G-MoNArch (761445) D6.3 Final report on architectural verification
Version 1.0 Page 158 of 193
similar to the way that 4G capability, e.g. the volume of monthly data packages, have increased over
recent years without corresponding increases in ARPU. The weighted average ARPU in the low scenario
is also applied to legacy MBB services.
The high scenario reflects higher traffic demand and a greater use of bandwidth intensive services such
as SVOD. Hence, we assumed that end-users would be willing to pay more. A few studies have shown
that consumers might be willing to pay extra for 5G eMBB, but the evidence is not conclusive. The
premium on ARPU between the low and high scenarios was informed by the studies reported in
[RCR19] and [Bit19]. Furthermore, [Mob19] shows that some operators – e.g. Zain Kuwait and DNA
Finland – have managed to increase ARPU as a result of unlimited data packages, but most are struggling
to replicate that success. We note that Basic Needs users’ willingness to pay more for eMBB is constant
across the scenarios reflecting the acute price sensitivity of this market segment.
The baseline scenario ARPUs are the average of the high and low scenarios.
Table D-3: eMBB monthly ARPU assumptions (Euros)
Low Baseline High
Basic Needs 7 7 7
Standard 16 18 20
High Performance n/a 22.5 25
Weighted Average 14.6 17.0 19.5
Note: figures are lower than headline tariffs because ARPU includes: consumers’ second and third
SIMs that may not be used intensively; and the impact of introductory offers that reduce average
revenue, introductory discounts etc.
We have assumed that ARPUs are constant, in real terms, over time so as to avoid introducing
unnecessary complexity into the analysis. In practice, MSPs may initially set prices at a higher level to
target the early adopters who are most insensitive to price, before subsequently reducing them to attract
the rest of the market segment. However, we have abstracted from such tariff strategies.
D.2 Approach to revenue and benefits modelling in EC1
This section of this appendix reports the methodology applied in deriving the economic benefit
associated with each of the EC1 port related services. This sets an upper bound on the willingness to
pay for such wireless services.
The applications considered are:
• Traffic control;
• Automated container handling;
• AR for construction and maintenance;
• Asset tracking.
There is also a strong requirement outside of peak periods for environmental sensors throughout the port
area, however since this application is most likely to generate public benefits across the city of Hamburg
it has been addressed in the revenue and benefits assessment of EC3.
D.2.1 Traffic control
Assumed port ITS devices
To meet the needs of temporary traffic control systems in the port area we estimate that up to 50 system
elements would be required. These would typically comprise:
• 20 sets of traffic lights
• 15 wireless cameras
• 15 traffic sensors.
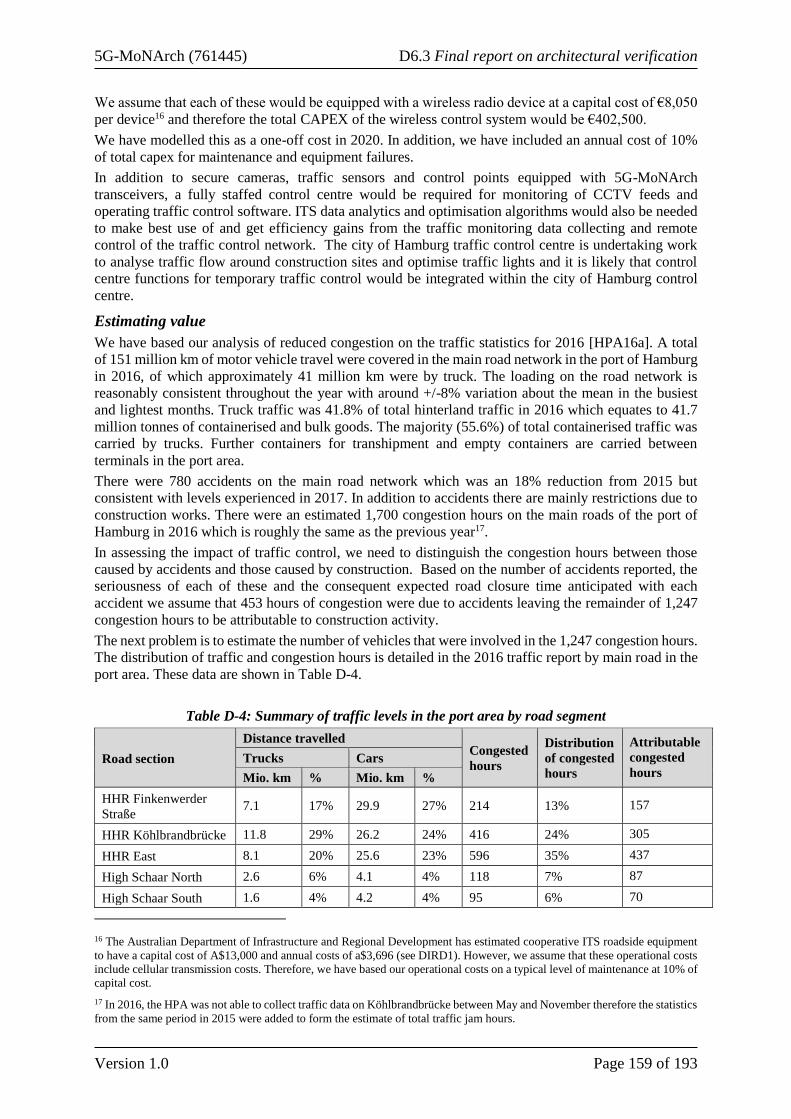
5G-MoNArch (761445) D6.3 Final report on architectural verification
Version 1.0 Page 159 of 193
We assume that each of these would be equipped with a wireless radio device at a capital cost of €8,050
per device16 and therefore the total CAPEX of the wireless control system would be €402,500.
We have modelled this as a one-off cost in 2020. In addition, we have included an annual cost of 10%
of total capex for maintenance and equipment failures.
In addition to secure cameras, traffic sensors and control points equipped with 5G-MoNArch
transceivers, a fully staffed control centre would be required for monitoring of CCTV feeds and
operating traffic control software. ITS data analytics and optimisation algorithms would also be needed
to make best use of and get efficiency gains from the traffic monitoring data collecting and remote
control of the traffic control network. The city of Hamburg traffic control centre is undertaking work
to analyse traffic flow around construction sites and optimise traffic lights and it is likely that control
centre functions for temporary traffic control would be integrated within the city of Hamburg control
centre.
Estimating value
We have based our analysis of reduced congestion on the traffic statistics for 2016 [HPA16a]. A total
of 151 million km of motor vehicle travel were covered in the main road network in the port of Hamburg
in 2016, of which approximately 41 million km were by truck. The loading on the road network is
reasonably consistent throughout the year with around +/-8% variation about the mean in the busiest
and lightest months. Truck traffic was 41.8% of total hinterland traffic in 2016 which equates to 41.7
million tonnes of containerised and bulk goods. The majority (55.6%) of total containerised traffic was
carried by trucks. Further containers for transhipment and empty containers are carried between
terminals in the port area.
There were 780 accidents on the main road network which was an 18% reduction from 2015 but
consistent with levels experienced in 2017. In addition to accidents there are mainly restrictions due to
construction works. There were an estimated 1,700 congestion hours on the main roads of the port of
Hamburg in 2016 which is roughly the same as the previous year17.
In assessing the impact of traffic control, we need to distinguish the congestion hours between those
caused by accidents and those caused by construction. Based on the number of accidents reported, the
seriousness of each of these and the consequent expected road closure time anticipated with each
accident we assume that 453 hours of congestion were due to accidents leaving the remainder of 1,247
congestion hours to be attributable to construction activity.
The next problem is to estimate the number of vehicles that were involved in the 1,247 congestion hours.
The distribution of traffic and congestion hours is detailed in the 2016 traffic report by main road in the
port area. These data are shown in Table D-4.
Table D-4: Summary of traffic levels in the port area by road segment
Road section
Distance travelled Congested
hours
Distribution
of congested
hours
Attributable
congested
hours Trucks Cars
Mio. km % Mio. km %
HHR Finkenwerder
Straße 7.1 17% 29.9 27% 214 13% 157
HHR Köhlbrandbrücke 11.8 29% 26.2 24% 416 24% 305
HHR East 8.1 20% 25.6 23% 596 35% 437
High Schaar North 2.6 6% 4.1 4% 118 7% 87
High Schaar South 1.6 4% 4.2 4% 95 6% 70
16 The Australian Department of Infrastructure and Regional Development has estimated cooperative ITS roadside equipment
to have a capital cost of A$13,000 and annual costs of a$3,696 (see DIRD1). However, we assume that these operational costs
include cellular transmission costs. Therefore, we have based our operational costs on a typical level of maintenance at 10% of
capital cost.
17 In 2016, the HPA was not able to collect traffic data on Köhlbrandbrücke between May and November therefore the statistics
from the same period in 2015 were added to form the estimate of total traffic jam hours.

5G-MoNArch (761445) D6.3 Final report on architectural verification
Version 1.0 Page 160 of 193
Kattwyk dam 1.8 4% 5.0 5% 60 4% 44
Vollhöfner pastures 2.1 5% 7.6 7% 50 3% 37
Other main roads 5.9 14% 7.4 7 151 9% 111
Totals 41.0 100% 110.0 100% 1700 100% 1247
Source: HPA traffic data [HPA16a]
Table D-4 also details the number of truck and car kms travelled in each road segment. The 2016 report
indicates that the total number of vehicles entering the port area each weekday is 59,400 cars and 15,600
trucks and we have assumed that these vehicles are distributed across road segments in proportion to the
total distance travelled by each vehicle type.
If we further assume that traffic congestion takes place primarily in the morning and evening peaks of
weekdays, then we can use the peak hour traffic loading to estimate the total number of vehicles present
on each road segment during the busiest hour. The number of vehicles in the port area are distributed
throughout a typical weekday as shown in Figure D-1 which shows that 8% of traffic occurs in the
busiest hour.
Source: HPA traffic data [HPA16a]
Figure D-1: Daily distribution of traffic (journeys) in the port area
Multiplying the number of congested hours in each road segment by the number of busy hour vehicles
in each road segment gives the number of truck hours and car hours of delay. From this calculation we
estimate that there are 288,500 hours of truck delay and 1,184,765 hours of car delay that were
attributable to construction works in the port area in 2016.
To understand how much of this congestion may be relieved using an advanced traffic management
system we can look at what improvements have been made internationally:
• A USA study based on the city of Fort Collins, Colorado found that delay reductions of 4-36%
(average 12.8%) on its main streets resulted from implementation of an integrated traffic
management systems [USDoT08];
• Traffic light control systems in Queensland, Australia were estimated to have led to between 0-
20% reduction in travel times, see [DIRDC17];
• A traffic management system in New York, ‘Midtown in Motion’ was found to have reduced
travel times by 10%, see [MOTI1];
• Smart parking trials in Salerno, Italy and Los Angeles found a reduction of 7-10% in travel
times, see [ERTICO1].
In the Hamburg port area, we must consider the fact that not all congestion will be due to construction
sites and therefore we must be reasonably conservative in our assumed benefits. However, there are only
three sets of permanent traffic lights in the port area therefore we can assume that the great majority of
ITS benefits will arise from the integration of the temporary traffic light systems.
-
0.20
0.40
0.60
0.80
1.00
1.20
1.40
1.60
1.80
2.00
1 2 3 4 5 6 7 8 9 10 11 12 13 14 15 16 17 18 19 20 21 22 23 24
Nu
mb
er o
f ve
hic
les
in m
illi
on
s
Daily distribution of journeys
Cars Trucks Cars and trucks

5G-MoNArch (761445) D6.3 Final report on architectural verification
Version 1.0 Page 161 of 193
On the basis of the scale of deployment and the international studies, we have assumed that a
sophisticated and integrated traffic control system can reduce traffic congestion by 10%. Applying this
to the estimates for the Hamburg port area results in reductions in truck and car delays of 31.2 and 151.6
thousand hours for trucks and cars respectively in 2020.
Reducing the delays for trucks and cars has the following potential benefits:
• Less wasted time for truck drivers and car drivers and passengers
• Reduced journey times for road freight
• Reduced CO2 emissions during the periods of congestion.
Each of these benefits is quantified below.
Value of wasted time for truck and car drivers
Road transport planners worldwide consider new transport schemes in the face of budget constraints and
perform Cost Benefit Analysis to select which projects are likely to maximise public benefits. Economic
literature has assessed the value of time for various types of vehicle involved in traffic delays. These are
summarised in Table D-5.
Table D-5: Summary of value of time estimates in economic literature
Country Value of time per hour in 2020 Value of avoided delay in 2020
Trucks Cars Trucks Cars Total
UK [UKG18] €17.84 €12.37 €556 k €1,876 k €2,432 k
Europe [EBB+04] €55.63 €7.76 €1,733 k €1,177 k €2,910 k
New Zealand [VTPI1] €16.99 €9.25 €529 k €1,402 k €1,931 k
Notes:
The UK values are predicted for 2020 and were published in November 2018. They relate to ordinary goods
vehicles and commuting private car use. They are converted to Euros at the 15th April 2019 exchange rate.
The Europe values were published in 2004 and have been adjusted for historic and predicted inflation to 2020.
They relate to HGV freight transport and private car use.
The New Zealand values Europe values were published in 1998 and have been adjusted for historic and
predicted inflation to 2020. They relate to a heavy commercial driver and general car use. They are converted to
Euros at the 15th April 2019 exchange rate.
There is considerable variability in the estimated value of time for trucks in international studies. It is
not clear whether the truck cost in the Europe study is solely for the drivers’ time or includes the impact
on delayed goods. There is broad consistency between the other value estimates. We have adopted the
UK based value references for this study because the values are based on current analysis and represent
a conservative estimate overall.
We estimate a total value of driver time of €2.4m in 2020 for the reduction of traffic delays in the port
area by using 5G-MoNArch connected traffic control systems for construction works. The truck
component of value is expected to grow in line with overall container throughput in the Port of Hamburg
(5.1% per year). For car traffic we have used the growth in car km between 2016 and 2017 (6.4%) and
applied this across the study period of 2020 to 2030.
Reduced journey times for road freight
The journey times for containers transported by truck are very important for business in the port area.
Shipping companies face high penalties for late delivery of goods and reliable transport links by road
increase the attractiveness of the port and may also improve its market share. It is difficult to attribute a
market share improvement directly to reduced delivery times, but it is possible to estimate the economic
benefits of reduced stock value where goods in transit constitute a level of stock that must be maintained.
We have estimated the average value of goods per truck at €68k using the assumptions in Table D-6.

5G-MoNArch (761445) D6.3 Final report on architectural verification
Version 1.0 Page 162 of 193
Table D-6: Estimate of the annual value of containerised goods transported by road through the
port area (in 2018)
Assumption Value
Annual value of Germany’s imports and exports [OEC19] $2410 billion €2121 Bn
Maritime share of imports and exports 50.5% €1071 Bn
Port of Hamburg share of maritime trade 70% €752 Bn
Proportion of trade that is containerised (by tonnage) 66.4% €499 Bn
Modal share of trucks 55.6% €277 Bn
Value of goods on working days 97% €269 Bn
Value of goods per working day 260 days €1034 million
Value of goods per truck 15.2k trucks/day €68 k
The reduced journey times as a proportion of total truck hours in the port represents the proportion of
goods that are held in stock. The period of reduced truck delay of 31.2 thousand hours in 2020 is
equivalent to 15 truck years (based on a working day of 8 hours and 260 working days per year).
Therefore, the reduction in delayed hours for trucks represents a reduction in stock holdings to the value
of €1,017k.
However, the cost of holding stock in this manner is not the value of the stock itself, rather it is the cost
of working capital to fund that level of stock. The annual cost of this working capital is the value of lost
interest on the relevant funds. Assuming a real discount rate of 10% the annual economic benefit of
reduced journey times for trucks in the port area is estimated to be €102k in 2020. We would expect this
value to increase in line with the growth in container throughput in the port (5.1%).
Increases in CO2 emissions during the delays
There are 58,000 tonnes of CO2 released annually in the port area of which 34,000 is generated by trucks
and 24,000 generated by cars. An estimate of the savings in the cost of CO2 emissions resulting from
5G-MoNArch traffic control is shown in Table D-7.
Table D-7: Estimate of the annual economic benefits of reducing CO2 emissions
Assumption Trucks Cars
Total vehicle km/year 44 m 117 m
Average vehicle speed 25 kph 40 kph
Total vehicle hours 1.76 m 2.93 m
Delayed vehicle hours 286 k 1,260 k
Reduction in delay 10% 28.6 k 126.0 k
Reduced delay as a proportion of total vehicle hours 1.6% 4.3%
Total CO2 emissions in Tonnes 34,000 24,000
Savings in CO2 emissions in Tonnes 552 1,034
Savings in CO2 emissions [UKG18] €67.46/ton €37 k €70 k
We estimate a total value of €125k in 2020 for the reduction of CO2 emissions in the port area by using
5G-MoNArch connected traffic control systems. The truck component of this value is expected to grow
in line with overall container throughput in the Port of Hamburg (5.1% per year). For car traffic we have
used the growth in car km between 2016 and 2017 (6.4%) and applied this across the study period of
2020 to 2030.
D.2.2 Automated container handling

5G-MoNArch (761445) D6.3 Final report on architectural verification
Version 1.0 Page 163 of 193
Assumed port automation system
In a container terminal, machinery is used to unload the containers from a ship, transport the containers
to a block storage area and to stack the containers efficiently ready for rail or truck transport. Therefore,
port automation in container terminals can be considered primarily in two areas:
• Block storage – the installation of automated stacking cranes allows containers to be stacked 6
high in contrast to the 2 high (3 adjacent to the aisle) in non-automated systems [DNV19]. This
can effectively double the storage capacity of a yard18. Retrieval of containers is quicker because
the stacking cranes can optimise the placement of containers in the storage block during quieter
periods.
• Yards – the operation of loading cranes is still mostly non-automated. Loading cranes pick up
or deposit containers within a secure automated area void of personnel. AGV carry the
containers between the unloading cranes and the pick-up area of the appropriate storage block.
Not all automation projects include yard automation and around 26 of 37 terminals already automated
or planned worldwide are currently for block storage only [UNCTD18]. This is likely due to the lower
cost of such systems and the immediate increases in capacity they enable. Although Hamburg’s
Altenwerder terminal can be considered to be fully automated, Burchardkai has currently only
implemented automated block storage in less than 15% of the land area allocated to storage.
Yard automation tends to be more expensive and although it has potential to greatly improve operational
efficiency and reduce costs, it has a greater impact on operations. Automation of loading cranes has not
been a major focus to date.
In yard automation, the loading cranes place containers within a secure area and all container movement
to the storage area and transport area are undertaken wholly by automated machinery, with personnel
excluded from automated areas for safety reasons. This separation of automation and personnel is being
reconsidered by HHLA as part of a research project “Container terminal 4.0 – a paradigm shift in the
automation of container terminals via human-machine interaction rather than separation” which is being
conducted as part of the German government’s Innovative Port Technologies (IHATEC) incentive
scheme [HHLA17]. The exclusion of personnel means less staffing, reduced lighting and power
consumption [DNV19]. In addition, automation allows smoother and more accurate movement of
containers enabling better precision of movement and stacking.
The AGV rely on transponders sets beneath the road surface which allow straddle carriers to travel along
predefined routes and are typically controlled using an industrial Wireless LAN system or private mobile
networks.
An automated system requires considerable investment; for example, the Burchardkai terminal
operation became operational in 2017 and HHLA made investments in 2016 and 2017 in the container
segment of €81m in each year [HHLA17]. This CAPEX was dominated by the procurement of handling
equipment and storage capacities at the Hamburg container terminals. HHLA expects to invest a further
€450m in the container handling segment by 2022 [HHLA19].
McKinsey estimates that $10bn has been spent on around 40 automation projects worldwide which
implies an average of $250m per system. At present, only the largest container terminal operators
worldwide have sufficient scale of operation to justify the investment.
The expected scale of operation of each terminal in the Port of Hamburg and the potential for automation
is summarised in Table D-8.
We can expect that the bulk of the system cost is in the heavy machinery and we have based automation
system costs on the McKinsey estimates of $250m for a typical system. However, the majority (71%)
of international systems have been for block storage only. Using the container throughput of the port in
which automated terminals are located as a proxy for the scale of automation costs we were able to
estimate the costs of block storage automation compared to the combined costs of both block storage
and yards. The results of this are that, for each terminal, block storage automation is estimated to cost
18 It should be noted that this does not mean that total storage is doubled. Rail sidings are a further substantial source of storage
in a typical port.

5G-MoNArch (761445) D6.3 Final report on architectural verification
Version 1.0 Page 164 of 193
€168m and yard automation is estimated to be €181m. For our analysis of costs and benefits we have
assumed that these costs are amortised over a typical 25-year lifetime for heavy machinery.
Table D-8: Scale of operation at Hamburg’s container terminals
Terminal
Estimated Container
throughput in 2018
(million TEU)*
Our assumed
date of
automation**
Machinery
Loading
cranes AGVs
Stacking
cranes
Altenwerder 3.3 2002 15 91 26
Burchardkai 2.5 2017 - 2023 30 177 43
Tollerort 1.4 2025 14 75 22
Eurogate 1.5 2022 21 124 37
Total 8.7 80 467 128
Notes:
* Container throughputs for Altenwerder, Burchardkai and Tollerort have been estimated based on truck and
rail capacity within HHLA terminals.
** These are hypothetical dates for automation to allow benefits and cost assessment for the purposes of this
project and do not reflect actual plans of specific container terminals.
A control centre is required that includes location tracking software and control staff. However, control
and scheduling systems are also important for non-automated terminals therefore we can expect that
much of the expenditure in control would be required anyway and additional control centre costs are not
included.
What difference will 5G-MoNArch make?
Port automation systems make use of wireless technology for communications between the control
centre and the individual automated vehicles and machinery. These systems usually use wireless LAN
technology based on licence exempt spectrum (dedicated for industrial, scientific and medical ISM use).
Internationally harmonised spectrum is available in ISM bands at 2.4 GHz and 5.8 GHz, however these
bands are also used by private Wi-Fi networks and other commercial applications which may cause
interference in the automation system.
Discussions with another European terminal operator revealed that although automation systems may
use Wi-Fi based communications technology, such systems are prone to interference from shipborne
high-power Wi-Fi systems. This anecdotal evidence suggests that automation system failure can occur
during the most critical times when ships are being unloaded. The severity of interference was such that
the terminal operators sought dedicated spectrum in International Mobile Telecommunications (IMT)
bands and operated a private LTE network. Whilst spectrum in IMT bands may become available to
private users in Germany, a system based on 5G-MoNArch technology with a network slice to support
automation (see Figure D-2) would provide the reliability and resilience necessary for the application
and keep pace with any network evolution and enhancement.
5G-MoNArch technology has the potential to provide the inherently high reliability of communications
that allows automated machinery to operate in the absence of harmful interference.
The benefits of using 5G-MoNArch technology include:
• Enables tracking and fine control of automated vehicles (allowing less reliance on transponders)
• More flexibility to reorganise operations in the terminal area
• Lower implementation cost
• Lower costs and flexibility may improve feasibility for smaller terminals
• A flexible platform for enhancement of automation features.
Although the costs of the wireless communication system are small relative to the overall costs of
automation, we believe that it will become crucially important to have a robust communications system.
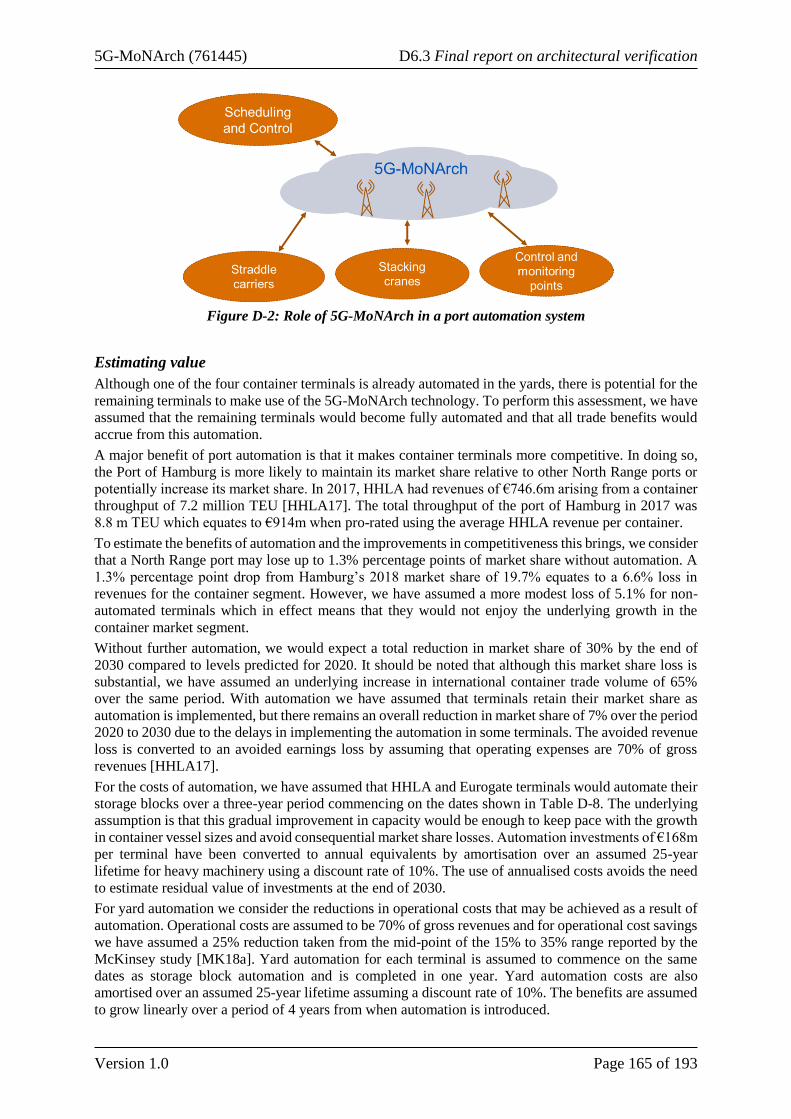
5G-MoNArch (761445) D6.3 Final report on architectural verification
Version 1.0 Page 165 of 193
Figure D-2: Role of 5G-MoNArch in a port automation system
Estimating value
Although one of the four container terminals is already automated in the yards, there is potential for the
remaining terminals to make use of the 5G-MoNArch technology. To perform this assessment, we have
assumed that the remaining terminals would become fully automated and that all trade benefits would
accrue from this automation.
A major benefit of port automation is that it makes container terminals more competitive. In doing so,
the Port of Hamburg is more likely to maintain its market share relative to other North Range ports or
potentially increase its market share. In 2017, HHLA had revenues of €746.6m arising from a container
throughput of 7.2 million TEU [HHLA17]. The total throughput of the port of Hamburg in 2017 was
8.8 m TEU which equates to €914m when pro-rated using the average HHLA revenue per container.
To estimate the benefits of automation and the improvements in competitiveness this brings, we consider
that a North Range port may lose up to 1.3% percentage points of market share without automation. A
1.3% percentage point drop from Hamburg’s 2018 market share of 19.7% equates to a 6.6% loss in
revenues for the container segment. However, we have assumed a more modest loss of 5.1% for non-
automated terminals which in effect means that they would not enjoy the underlying growth in the
container market segment.
Without further automation, we would expect a total reduction in market share of 30% by the end of
2030 compared to levels predicted for 2020. It should be noted that although this market share loss is
substantial, we have assumed an underlying increase in international container trade volume of 65%
over the same period. With automation we have assumed that terminals retain their market share as
automation is implemented, but there remains an overall reduction in market share of 7% over the period
2020 to 2030 due to the delays in implementing the automation in some terminals. The avoided revenue
loss is converted to an avoided earnings loss by assuming that operating expenses are 70% of gross
revenues [HHLA17].
For the costs of automation, we have assumed that HHLA and Eurogate terminals would automate their
storage blocks over a three-year period commencing on the dates shown in Table D-8. The underlying
assumption is that this gradual improvement in capacity would be enough to keep pace with the growth
in container vessel sizes and avoid consequential market share losses. Automation investments of €168m
per terminal have been converted to annual equivalents by amortisation over an assumed 25-year
lifetime for heavy machinery using a discount rate of 10%. The use of annualised costs avoids the need
to estimate residual value of investments at the end of 2030.
For yard automation we consider the reductions in operational costs that may be achieved as a result of
automation. Operational costs are assumed to be 70% of gross revenues and for operational cost savings
we have assumed a 25% reduction taken from the mid-point of the 15% to 35% range reported by the
McKinsey study [MK18a]. Yard automation for each terminal is assumed to commence on the same
dates as storage block automation and is completed in one year. Yard automation costs are also
amortised over an assumed 25-year lifetime assuming a discount rate of 10%. The benefits are assumed
to grow linearly over a period of 4 years from when automation is introduced.
5G-MoNArch (761445) D6.3 Final report on architectural verification
Version 1.0 Page 166 of 193
D.2.3 Augmented Reality (AR) for construction and maintenance
Assumed AR devices
A practical implementation of AR for real-time viewing of 3D images requires very high speed/low
latency and a reliable interface between the field equipment and the central BIM database.
The benefit of using 5G-MoNArch for this application is that the system can deliver the high throughput
and low latency required for AR. Deployment of an AR system of this nature would require 5G enabled
terminals equipped with AR glasses. The network slice supporting the application would need to have
an interface to the BIM system with appropriate software to structure the images for viewing based on
the inspector’s location. To deliver high throughput and low latency the wireless system is likely to
require extensive small cell coverage and flexible deployment to ensure coverage of specific
construction sites.
Such are the technical demands of AR/VR approaches it is unlikely that alternative means will be
available for field implementation of this capability. We can assume that 100% of the economic benefits
arising from AR use in constructional projects can be attributed to 5G-MoNArch technology. There
should be a similarly high willingness to pay for 5G-MoNArch services.
A practical AR based inspection system would comprise:
• AR glasses with positioning and orientation capability
• A 5G-MoNArch transceiver providing a high-speed low latency connection for the real-time
transfer of images
• A network slice able to extract and structure the images for viewing.
To estimate the cost of AR terminals we have assumed that engineers will use glasses similar to
Microsoft Hololens 2 or Magic Leap One. These are currently priced at around €3,010 [Mic19] and
€1,970 [ML19] respectively. At an average price of €2,500/device we would expect 30 units to cost
€75k. Communications would be achieved using 5G mobile handsets.
To support multiple construction projects a substantial proportion of the 100 HPA civil engineers will
need to be equipped with AR headsets. At an average price of €2,500/device we would expect an initial
4 units to cost €10k in 2020 and we have assumed that a further 26 engineers would be equipped
gradually over the study period. We have assumed that all HPA engineers would be equipped with 5G
mobile handsets anyway for general communications purposes. On top of the hardware costs we have
assumed €1,000 will be needed for training each user and we have included a one off €100k cost for AR
system development with annual costs of 10k for updating the software.
Estimating value
Development of the port and its facilities is a constant process of replacement and improvement.
Therefore, we can expect continuous expenditure over the next 10 years. The HPA has invested €217m
in infrastructure projects during 2016 and the HPA foresaw €242m of CAPEX on infrastructure projects
in 2017. Capital investment by HPA had been roughly at this level for the 3 years prior to 2016. With
the ongoing wharf expansion and future development of Steinwerder-Sud it is reasonable to expect
investment to continue at this level in real terms over the next 10 years. In addition, we have assumed
for the purpose of analysis that a new Köhlbrand crossing will cost €500m spread evenly over the period
2022 to 2025. Together these investments total €3.2bn in the period 2020 to 2030.
To illustrate the potential savings that might accrue over this period we need to make some assumptions
about the extent and risk of overruns in these projects. We are not aware of specific overruns in terms
of time or cost with these projects, however, there is risk that any construction project can overrun due
to the accumulation of mistakes, remedial measures and late delivery of key components.
A survey of major construction projects worldwide undertaken by McKinsey [MK16] concluded that
large projects typically overrun in time by 20%, and in cost by 80%. The McKinsey report suggests that
80% of cost overrun may be typical for large projects but the definition of large is not stated in the
report. Indeed, when compared to the cost of new hospitals, schools, office blocks and roads, the type
of infrastructure project in the port area is likely to be at the lower end of the range considered by
McKinsey. Therefore, we have assumed that 80% is an upper bound on the potential savings and we

5G-MoNArch (761445) D6.3 Final report on architectural verification
Version 1.0 Page 167 of 193
have chosen a level at 50% of this to illustrate the range of potential savings that might accrue to smaller
scale construction projects in a typical port.
Furthermore, we do not have access to the original budget information for the Hamburg port
infrastructure projects, so we are not able to determine whether historical overruns have matched this
level of overrun. Nevertheless, it would be reasonable to assume that the expenditure stated includes the
cost of any overruns.
Applying these statistics to construction projects in the HPA operational area suggests that mistakes and
overruns could cost HPA, its contractors or terminal operators up to €259m per year. Clearly a rigorous
AR based inspection routine may not prevent all of these costs, but earlier identification may help
mitigate them.
The benefits of BIM in UK public sector construction projects were studied by PWC in 2018 [PWC18].
In a sample project subjected to rigorous analysis, the study identified modest savings of around 1% of
construction costs from “clash detection”, which is the kind of benefit that would be enhanced through
use of AR. However, the study authors acknowledged that obtaining evidence of potential clashes was
difficult (given the hypothetical nature of the evidence) and that potential benefits were probably
significantly understated. The PWC study states that it had reviewed other case studies where savings
from clash detection were 10% of total construction value. For this study we have taken a conservative
assumption that 5% of total cost overruns might be saved.
D.2.4 Asset tracking
Digitisation in the port environment
Digitisation and the IoT is having a profound influence on the provision of goods and services. The
connection of a multitude of devices in our personal and working lives promises to facilitate data
collection on an unprecedented scale, enabling more control for consumers, customised goods and
services and more optimised service provision.
This transformation will be mirrored in internal business operations. According to IHS Markit [Fie18a],
the number of connected IoT devices globally is predicted to grow from 31 billion in 2018 to 125 billion
in 2030. Digitisation is not only transforming the operations of individual companies, it is enhancing the
performance and resilience of entire value chains. The E2E sharing of data is improving operational
efficiency, allowing optimisation of delivery for goods and services and easing contractual relationships
and payment flows. The combination of connected equipment, AI, cloud computing and real-time
exchange of data promises to enhance:
• Information gathering – implementing more sensors and obtaining more data
• Decision making – more algorithmic, incorporating feedback loops and predictive
• Information sharing – across the value chain and not just immediate trading partners.
A 2015 McKinsey report [MK15] estimated that that the use of IoT across worksites worldwide could
yield an economic value of $160 billion to $930 billion per year in 2025, with the biggest benefit coming
from improvements in operating efficiency derived from improved business processes, automation
(including self-driving vehicles), and reductions in labour and energy costs. It foresees the second-
largest potential impact coming from condition-based and predictive maintenance practices, which will
cut routine maintenance costs, reduce breakdowns, increase productive uptime, and extend the useful
life of machinery.
In the maritime industry too, digitisation is seen as the way forward. International shipping is an industry
reliant on schedules and the mutual cooperation of many parties in the value chain including shipping
companies, freight forwarders, intermodal logistics companies, terminal operators and port authorities.
Activities are focussed on initiatives like Port 4.0 which anticipates the sharing and exploitation of data
between companies across the supply chain. A 2018 survey conducted by IHS Markit [Fie18b] found
that 50% of the shipping industry executives and professionals interviewed believed their operational
performance would improve by at least 50 percent if they could share their real-time operational
information and 98% believed that the industry should adopt new technologies to enable real-time
collaboration. More than half were actively considering collaboration projects and 70% felt that real-
time collaboration would happen within a 5-year timeframe.

5G-MoNArch (761445) D6.3 Final report on architectural verification
Version 1.0 Page 168 of 193
By providing visibility and predictability across the supply chain, logistics companies believe that they
can gain a competitive edge. Each party can plan their operations based on standardised real-time
information giving earlier awareness of disruptions, service differentiation around speed and reliability,
better on-time performance (with lower demurrage and detention fees) and more precise planning that
reduces port congestion and better utilisation of resources. Cloud-based collaborative data-sharing
platforms promise a move away from traditional peer to peer Electronic Data Interchanges (EDI)
processes to Application Programming Interface (API) connections to a common platform. If this
visibility is extended to customers, then it would give manufacturers important insights into the potential
timing of materials and parts from tier 1 and tier2 suppliers thereby supporting Just-In-Time (JIT)
operations.
At the port of Hamburg, promoting digitisation has been a major objective of the HPA. In 2014, HPA
commenced a strategic initiative called smartPORT with the aim of advancing digitisation in the port of
Hamburg and increasing the efficiency of all modes of transport as well as improving the logistical and
traffic related processes in the port. Developments from smartPORT have included the digital Touch
Table which provides instantaneous water depths in the port, the Virtual Depot aimed at coordinating
empty containers. In parallel, the smartROAD project coordinates information from sensors placed in
roads and bridges and enables more efficient investment decisions. HPA sees that with increasing traffic
volumes, digitisation of traffic processes is required to maintain the efficiency of its maintenance and
project management systems.
The container terminal operator HHLA plans to be a driving force behind digitisation. In 2017 it
introduced a slot-based booking process for trucks [HHLA17]. In 2018, further development work was
undertaken by the Hamburg Vessel Coordination Centre (a joint venture between the two main container
terminal operators at Hamburg: HHLA and Eurogate) as part of the IHATEC subsidy programme. The
project is called “HVCC software – further development of interface- and real time-based software for
the cross-operator coordination of barges, feeder ships and mega-ships at a universal and multiterminal
port with nautical restrictions”. The project’s main aims are to meet the challenge of growth in the
volume and size of container vessels, boost international competitiveness and avoid unnecessary and
inefficient transport, accelerate the use of digital networks in maritime logistics and the port industry
while making more effective and efficient use of the infrastructure of the Port of Hamburg and its
upstream waterways [HHLA2].
The benefits of digitisation rely fundamentally on sources of data being available and efficient data
collection. Communications networks are essential to support the collection of data and the transfer of
data between parties in the maritime value chain. In most instances, cloud computing and blockchain
technology over the internet provides a ready means for data transfer between companies and fixed
communications links facilitate data collection.
However, there is a role for wireless technologies for information gathering where connections are
required to entities that are in motion, in locations that change frequently or in difficult to reach locations
(e.g. on ships, barges and buoys). Such information gathering applications include sensors and asset
tracking. Sensors are used extensively by the HPA for water level monitoring and assessment of
pollution (pollution control is considered in this report in our analysis of EC3). In this section we have
focussed on asset tracking as a means of providing real-time information of the current location and use
of containerised goods and resources.
Asset tracking in the port environment
We can consider asset tracking in two main areas: assets that are captive to a terminal and goods in
transit.
Tracking of plant and equipment
By monitoring the health of plant and equipment terminal operators and other port organisations may
obtain operational efficiency benefits. Maintenance scheduling can be optimised and availability for
service optimised. This kind of monitoring is an inherent part of an automated container terminal.
Tracking of goods in transit
The location of goods is a useful source of information for customers. The location of containers on
ships is known from the ship’s manifest. In a container terminal, containers are stored in discrete

5G-MoNArch (761445) D6.3 Final report on architectural verification
Version 1.0 Page 169 of 193
locations managed by a centralised control system. Therefore, retrieval is straightforward and there is
little need for interrogation of GPS sensors or continuous reaffirmation of location. Outside of the port,
containers are assigned to specific trucks or railway goods wagons.
Some customers also need to be sure that appropriate conditions have been maintained during the
shipping process (e.g. temperature, humidity vibration). Environmental control is clearly important for
perishable goods. JIT manufacturing relies on goods being immediately usable upon delivery;
monitoring the environment in the container and the condition of the container itself (e.g. corrosion,
damage or security status) may allow risk assessment and contingency planning.
Logistics companies may install sensors to record the environment in the container throughout its
journey. These sensors may be interrogated manually upon arrival at the port or read remotely by
wireless means. The early provision of this information may be beneficial to customers, and as a value-
added service, an additional source of revenue to container terminal operators.
Although there is anecdotal evidence to support the idea of customer driven container monitoring, there
is not yet widespread adoption of such techniques sufficiently for us to quantify economic benefits.
Therefore, in our following analysis we discussed the nature of systems that may be used but we have
not attempted to quantify the potential economic benefits of asset tracking.
What is a comprehensive asset tracking system?
There is little evidence of asset tracking in the port environment at present, although systems are
available from suppliers. An asset tracking system can be considered in two areas:
• The electronic tag and sensors installed on containers
• The data communications path between the tag the control centre
Each of these are discussed in turn.
Electronic tags
Discussions with container terminal operators suggests that electronic tags are not frequently used at
present. However, standards have been defined by the International Standards Organisation (ISO) for
electronic tags mounted on the outside of containers with potential for connection to sensors within the
container. Tags are typically read at close proximity by interrogation devices operating at 2.4 GHz or
other licence exempt frequency bands.
There are also solutions offered that are based on GPS in combination with mobile technology. However
as discussed above, there does not appear to be a global need for GPS position detection.
Data communications path
There are a number of options for providing the communications path from the container to the control
centre. A study by McKinsey segments communications technology by peak data rate and range from
which devices can be interrogated [MK18c], see also Figure D-3.
• Short range licence-exempt technology can provide high speed data connections (examples are
Bluetooth and Zigbee)
• Low power wide area (LPWA) technology can improve the range at low data rates (e.g. NB-
IoT and LoraWAN)
• Cellular technologies extend the range at high speed (LTE and 5G technology)
• Satellite systems allow long range connections.
The first three of these are potential solutions for container terminal in a port environment. The
disadvantage of short-range devices is that more manual intervention is required in the interrogation-of
devices. LPWA and cellular networks can deliver the functionality and range, but cellular technologies
are more likely to be readily available in multiple ports and across the road and rail network. 5G in
particular is designed to accommodate large numbers of IoT devices.

5G-MoNArch (761445) D6.3 Final report on architectural verification
Version 1.0 Page 170 of 193
Figure D-3: The IoT connectivity solutions fall into four categories with significant areas of overlap
(Source: McKinsey)
What are the economic benefits of asset tracking?
There appears industry consensus that there is great potential for efficiency gains in future arising from
sharing of information across the logistics value chain. Digitisation is a necessary first step, but in most
cases, information is likely to be obtainable from existing scheduling systems.
Asset tracking and monitoring of containers and sharing this with customers has potential to enhance
service quality and open new revenue streams for terminal operators. Customers would be able to adjust
to their processes early to cope with the state of received goods and JIT manufacture can be refined.
Container tracking would be a service improvement for the logistics operator and likely help them
maintain market share or increase revenues.
What difference will 5G-MoNArch make?
The 5G-MoNArch technology can support this vision by facilitating logistics tracking in the supply
chain and other operational services for companies in the port area. Generally, the 5G network should
be able to provide these services from macro cells, although specific operational requirements may
require more focussed coverage (e.g. container block storage areas and yards). However, the 5G
technology is not the only enabler required to obtain these benefits. Big data is important to be able to
collate, analyse and make best use of data collected for HPA operationally or for third parties in the port
area.
The benefits of 5G-MoNArch in this application are:
• Ability to cope with large volumes of individual devices
• Can provide pervasive coverage across the port area
• A network slice able to address the polling needs of many asset classes
• A common asset tracking platform accessible by companies and authorities in the port
• More comprehensive land-based coverage outside the port area.
Many of these benefits can also be provided using LTE technology. However, by providing a high speed,
high capacity, reliable and structured data communications platform capable of supporting a vast number
of connected devices, 5G-MoNArch has potential to play a major role in digitisation in the port
environment. However, there is insufficient evidence of interest in wireless based asset tracking for us
to forecast future implementation. Therefore, we have not attempted to quantify the potential economic
benefits of asset tracking in this report.

5G-MoNArch (761445) D6.3 Final report on architectural verification
Version 1.0 Page 171 of 193
D.2.5 Translating benefits to revenues
The potential benefits represent the absolute maximum that the end user organisation should be willing
to pay for services. However, the actual price paid for services will be the result of negotiation between
the end user and the MSP.
The price agreed between the end user organisation and MSP parties will be influenced by:
• How important the specific features of 5G-MoNArch are to the application.
• How demanding the service is in terms of data throughput and latency.
• What industrial grade service performance attributes are required for the application such as
Maximum network outage, MTBF, MTTR.
• The level of participation by the MSP in developing the service concept and network slice.
• The competitive environment between MSPs and the availability of alternative means of
achieving the application.
• How tangible the benefits are to the end user organisation (i.e. what risk is there that the benefits
will not materialise). This is related to how easily the benefits may be monetised.
We have summarised the importance of each of the above aspects for the each of the EC1 applications
by assigning a weighting of 0, 1, 2 or 3 to each attribute.
Table D-9: Importance of 5G-MoNArch to each application and weighted score
Service aspect
Score
Traffic
control
Port
automation
AR in
construction
Importance of specific 5G-MoNArch features 2 3 3
Service throughput and latency? 1 1 3
Industrial grade service performance reliability 2 3 1
Degree of participation by MSP in service development 2 2 2
Competitive environment and availability of alternatives 2 1 2
Tangibility of benefits 0 2 1
Total score 9 12 12
As a % of the maximum score 50% 67% 67%
The scoring in Table D-9 provides a useful guide to the bargaining power of the MSP when establishing
a service contract. However, it does not consider the huge outlay undertaken by the container terminal
operators in the port automation case. There is significant risk that anticipated benefits in market share
and operational cost savings do not materialise or must be passed through to customers to remain
competitive. Furthermore, when considering the benefits of AR in construction, the avoided costs of
overrun are by their nature, highly uncertain and difficult to verify; therefore, there is considerable risk
to the HPA that benefits are overstated. By contrast, the MSP does not share these risks. We have taken
this into account by applying a higher discount rate of 20% to reflect the higher risk faced by the terminal
operator or HPA (compared to the 10% discount rate used to represent more typical commercial returns
in this study). This reduces the NPV of expected port automation cashflows from €144m to €55m and
expected AR in construction cashflows from €36m to €22m.
As a practical upper bound we have assumed that an end user might be prepared to share 50% of the
potential benefits arising from the service with the MSP. As a lower bound we have assumed that the
MSP would provide data throughput at average consumer prices for eMBB services.
Applying the percentage scores to the upper bound of 50% of the NPV of benefits, we form an estimate
of MSP revenues as shown in Table D-10.

5G-MoNArch (761445) D6.3 Final report on architectural verification
Version 1.0 Page 172 of 193
Table D-10: Estimation of MSP revenues
Service aspect Value in M€
Traffic control Port automation AR in construction
NPV of total benefits from application 22 55 22
Upper bound on potential MSP revenues 10.8 27.5 11.0
Weighted estimate of MSP revenues 5.4 18.3 7.4
D.3 Benefits and revenues assessment for EC3
In EC3 we assess the potential MSP revenues and social benefits associated with smart city services.
This section of the appendix outlines our approach and methodology to this benefits assessment.
D.3.1 Approach for ITS revenues and social benefits
We expect that the client for ITS will be a local or municipal authority. We have looked at city authorities
in our analysis, as this corresponds with the Hamburg Study Area, though ITS can also apply to less
urban areas and road networks between cities. As in 5G NORMA we based our ARPU predictions on
actual ITS contracts, whose relevant costs we applied pro rata to the Study Area population. However,
on the basis of past ITS deployments, we expect ITS to increase in scope and functionality over time, as
innovations develop and spread from city to city. We used information on ITS from London [TfL15],
Copenhagen [CoC14] and Seattle [SDOT18] to inform our calculations.
The projected annualised spending per head is similar in London and Copenhagen, but roughly 3 times
higher in Seattle (which is the most recent of the three). Differences could reflect different
implementation approaches, or a different mix of applications.
As a result, we decided to base 2020 ARPU on London and Copenhagen (adjusted for population) to be
conservative and to then increase it over time towards the Seattle level to consider increases in the range
of ITS applications offered. This resulted in a 5% per year increase (63% in total over 2020-30). We
also assumed a proportion of ITS spend goes to the MSP, the rest to the providers of roadside equipment
and software applications for transport management. We used operational costs as a proportion of total
ITS costs in the London ITS – 46% – as a proxy for the MSP share of revenue.
As in 5G NORMA, we assume that social benefits will follow the stated aims of ITS projects:
• Reduced congestion and travel times due to better traffic flow management, smart parking and
accident response;
• Reduced greenhouse gas emissions from reduced congestion and better traffic flow
management;
• Reduced accidents from better signage and information on road conditions. We exclude the
impact of assisted driving services which fall under connected vehicles (V2I) rather than ITS.
There is some evidence on the impact of ITS on these above issues:
• Traffic light control systems in Queensland were estimated to have led to between 0-20%
reduction in travel times, see [DIRDC17];
• A traffic management system in New York, ‘Midtown in Motion’ was found to have reduced
travel times by 10%, see [MOTI15];
• Smart parking trials in Salerno, Italy and Los Angeles found a reduction of 7-10% in travel
times, see [ERTICO15];
• An ITS in Queensland was estimated to have led to between 10-30% reduction in accidents, see
[DIRDC17].
• A European Commission cost benefit analysis [EC13] found that using information message
boards could reduce accidents by 1.8-2.7%.
Since we only have a few observations on the potential impact of ITS, we take a conservative view of
these assumptions. Taking averages from the above, ITS could produce benefits of c. 10% in reduced
travel time. We assume that the reduction in travel time will also translate directly to potential reductions

5G-MoNArch (761445) D6.3 Final report on architectural verification
Version 1.0 Page 173 of 193
in greenhouse gas emissions. The potential impact on accidents varies with the type of ITS service. To
simplify the analysis, we assume that the overall impact of ITS on the reduction of accidents will also
be 10%.
We would attribute 50% of these benefits to the use of wireless in our Baseline scenario (in line with
the proportion of ITS spend we attribute to MSPs). This gives reductions of 5% for travel time,
greenhouse gas emissions and accidents. For the high and low scenarios, we assume reductions of 10%
and 2.5% respectively to cover the significant uncertainty in these figures.
We looked at a range of sources to value savings in CO2 emissions (€ per tonne avoided). Carbon trading
prices in the EU Emissions Trading System (EU ETS) are judged by many, including the UK
Government [DBEIS19], as below the true carbon price needed to meet EU emissions targets.
Hence, we decided to follow the approach taken in 5G NORMA and use UK Department for Transport
estimates of the cost of abating CO2 emissions from 2020-2030, [DfT18], since we did not find
equivalent government estimates for Germany. In addition, the Organisation for Economic Cooperation
and Development, OECD has found that carbon prices are similar between the UK and Germany
[OECD13]. The central estimates give a cost per tonne of CO2 equivalent rising from €81-95 over the
period 2020-2030 compared to traded carbon prices of around €20-25 over the last 2 years.
Other data sources used in our ITS benefits analysis were as follows:
• The economic cost of traffic accidents to calculate the value of reductions in accidents came
from Germany’s Federal Highways Research Institute [BASt19];
• The average number of congested hours per driver for Hamburg was based on data from [Inr18];
• [DfT18] provided estimates of the value of travel time to commuters and other travellers. We
also looked at other sources of information on the value of travel time from as a cross-check.
Data from [Tra98], a 1998 New Zealand study, produces travel time values 42% lower than the
UK whereas two European sources from 2004, [EBB+04] and [CED04] produce values just 8%
less than the UK. Since the other data are the same order of magnitude as [DfT18] and the UK
data is more recent, we feel it is appropriate to follow 5G NORMA and use the UK data.
D.3.2 Approach for smart energy grids – revenues and social benefits
We modelled smart meters and grids together as smart energy grids, in contrast to 5G NORMA which
modelled them separately. This is because the energy industry now sees anything beyond basic smart
metering capability as part of smart grid, for example sensor/actuators which would enable energy
suppliers to adjust individual consumers’ non-essential electricity use within pre-agreed limits as part
of a dynamic load balancing system. Moreover, basic smart meter capabilities are being delivered today
by legacy technology. Smart grid capability could also include substation automation, sensors to monitor
and maintain the distribution network, integration of distributed energy generation points such as
household solar panels and e-vehicle charging points. The client(s) for smart energy services will be the
operator(s) of the country’s energy grid system. They may be separate organisations or vertically
integrated supply and distribution companies depending on the market structure in each country.
We used the 5G NORMA data on smart grid ARPU, because little relevant data has emerged since that
analysis. This is based on electricity smart grid costs for the UK [Ern12]. We compared smart grid
expenditure forecasts for the Netherlands and South Korea from the same period – [CED12] and [Cle11]
respectively – as a check on the robustness of the UK figures. We found that the annualised cost per
head of population of total smart grid costs was the same order of magnitude as in the UK (€17 per
person per year) compared to the Netherlands (€13) and South Korea (€10). Moreover, a recent study
[CTIC16] estimated the benefits of smart grids in the UK at £17 billion up to 2050. This is similar to
the projected £19 billion of cost savings due to smart grid deployment in the UK, as estimated by
[Ern12], and reinforces our decision to apply the 5G NORMA data.
[Ern12] predicted that 14% of smart grid Gross Value Added (GVA) would go to communications
services – equal to £1.9 billion over 2012-2050 in present value terms. We use these figures to calculate
an average annual figure for communications smart grid spending in undiscounted terms. However, we
assume that smart grid ARPU is likely to rise over time because new applications will be launched
requiring more intensive communications use. We use Germany’s CO2 reduction target [BMU16]

5G-MoNArch (761445) D6.3 Final report on architectural verification
Version 1.0 Page 174 of 193
(which rises year on year) as a scaling factor for the increasing intensity of smart grid usage. This allows
us to calculate a new forecast for smart grid communications revenue for the period 2020-2030.
However, we apply the scaling factor so that the NPV of the resulting revenue forecast is equal to the
initial NPV for smart grid communications revenue that we started with.
The forecast is scaled down to the Hamburg Study Area on the basis of population. As in 5G NORMA,
we assume a 50% uplift on electricity smart grid spending to consider smart gas grids.
The main social benefit from smart energy is the contribution to reducing greenhouse gas emissions. As
in 5G NORMA we modelled the benefit from smart grids as equivalent to bringing forward the target
for CO2 reductions by one year. The forecast was scaled down to the Hamburg Study Area pro rata to
the population.
Finally, we apply the cost of abating CO2 emissions [DfT18] to calculate the social benefits of emissions
costs savings.
D.3.3 Approach for smart water
As in 5G NORMA, we base smart water revenues on the smart grid revenue forecasts scaling them
down pro rata based on the relative GVA of the energy and water sectors in Germany. The likely clients
for smart water services are the private or government run water utilities.
D.3.4 Approach for environmental monitoring
For environmental monitoring services, we focus on the revenues and social benefits of controlling air
pollution. Water pollution also has environmental impacts, but the impact on human life is rather limited
in developed economies such as Germany. Impacts on wildlife may be more significant than impacts on
humans, but data was not readily available on this.
We make a distinction between environmental monitoring carried out by the City of Hamburg in the
Study Area, and that potentially carried out by HPA and private businesses in the port. This is because
the pollution arising from the typical activities in a city, road transport and business activity, is very
different to that in the port, i.e. shipping and industrial activity. We report our assessment of
environmental monitoring by HPA and port-based businesses in Section 5.3.1.1 on synergies.
We model environmental monitoring revenues on the basis of the expected benefits it may deliver. We
took this indirect approach because the market is in its early stages and little data on public authorities’
willingness to pay was publicly available.
The basis of the calculation is the cost of ambient air19 pollution in Germany, estimated in [OECD17].
This calculates the cost of air pollution based on the number of premature deaths from air pollution and
the value of statistical life (based on what people would pay to reduce the risk of dying prematurely).
We assume that 5G enabled environmental monitoring can reduce a proportion of the premature deaths.
Revenues should be a fraction of the potential benefits. Revenues for MSPs, data analysis and other
specialist service providers and monitoring equipment providers are costs from the client’s perspective.
So, revenues can be inferred by taking the estimated benefits and a relevant benefit-cost ratio (as
produced in economic impact assessments). We did not find suitable information on benefit-cost ratios
directly for environmental monitoring and so have used benefit-cost ratios from related activities, such
as intelligent transport systems as a proxy instead. Studies such as [BITRE16] suggest that benefit-cost
ratios mostly fall between 1:1 and 1:10, though some are considerably higher. To calculate the potential
revenues for MSPs we make the following assumptions:
• [MK15] estimate that IoT based environmental monitoring could lead to a 15% reduction in air
pollution globally through leading to actions such as tighter regulation of industrial pollution
and/or the use of wood powered heaters in urban areas which is separate from ITS. We have
taken a more conservative view in applying this to an advanced economy such as Germany.
Because more measures to control air pollution are in place in advanced countries than middle-
and lower-income countries (who suffer worst from air pollution) we have assumed that the
impact of environmental monitoring is lower and have set it to 5%. This is additional to other
19 We have not explicitly estimated the cost of water pollution which is relatively small in relation to air pollution

5G-MoNArch (761445) D6.3 Final report on architectural verification
Version 1.0 Page 175 of 193
measures which will reduce air pollution such as increasing electric car usage and the
decarbonisation of electricity production;
• A benefit-cost ratio of 5, which we believe is conservative and which implies that costs (and
revenues) = 20% of benefits;
• 15% of revenues go to communications, the rest on software systems and equipment, in line
with our assumption for smart energy grids;
• Revenues for the Hamburg Study Area compared with Germany as a whole vary according to
population.
We assume that air pollution falls in line with the German Government’s targets for reducing CO2
emissions over 2020-30 which will be delivered from a variety of initiatives from electric cars, to
renewable energy to smart technologies.
D.4 Network dimensioning assumptions
This section of the appendix outlines the network dimensioning assumptions as applied in the study area
wide cost modelling presented in this report. We note that the network dimensioning applied in the cost
modelling in this report focuses on U-plane processing costs for the RAN and excludes CP signalling,
network orchestrators or controllers, CN applications and wider business & administrative costs.
D.4.1 Spectrum availability and supported site configuration assumptions over
the study period
The macro cells in the study area are permitted to have different site configurations from each other, in
terms of number of antennas, bandwidth and frequency bands supported. This depends on the demand
of the area that each macrocell is serving and the maximum number of antennas and spectrum that can
be supported in a given year. In 2020, for frequency bands below 3 GHz macrocell sites are assumed
to be equipped with cross polarised antennas (supporting 2T4R for eMBB, where user terminals are
anticipated under 5G NR to support 4 antenna ports) and to have access to up to 2x40 MHz of spectrum
at low bands plus an additional 2x10 MHz at sub 1 GHz bands. Additionally, we assume that 1x80 MHz
of spectrum in the medium frequency band is already available by 2020 and that active antennas
supporting 32x4 MIMO would be available in this band. By 2030 macro cells could, if demand required,
be equipped with up to 4 antennas in sub 1 GHz/low-band (4T4R for eMBB), with access to 170 MHz
for DL across all bands.
In the network dimensioning behind the cost modelling in this report, when demand in a given year
warrants it, the different upgrade options of a macrocell are compared against other network
improvement options (such as new sites) by means of maximisation of the merit. Merit here is defined
as served demand over cost. Because of the spatially-inhomogeneous traffic demand in the study area,
at any given simulated year there was a diverseness of macrocell capacity installed in the network. From
2019 we assume that all macro cells are with C-RAN configuration.
The small cells in the study area can also have varying site configurations. We assumed that the small
cells are on different channels from the macrocell layer. In 2020 they are assumed to be equipped with
cross polarised antennas (2T4R for eMBB) and to have access to 1x20 MHz of spectrum at the low
band. By 2030 they were assumed to be capable of supporting up to 4 antennas in the low and medium
bands (4T4R for eMBB), with access to 1x40 MHz of spectrum in total across both bands. The option
of upgrading existing small cells is also compared against other network improvement options by means
of maximisation of merit in the network dimensioning. At any given simulated year there was a spatial
diverseness of small cell capacity in the network. All small cells are also assumed to be of C-RAN
configuration from 2019 onwards.
D.4.2 Spectrum efficiency assumptions
For both macrocell and small cell layers, we have used the SE values given in [5GN-D23] as the start
point for deriving capacity per cell. These include taking reported SE simulation results and applying
factors, for example, for MIMO order, NR and non-full buffer traffic. For example, a headline mean SE
per cell for 2x2 MU-MIMO FDD of 2.62 bit/s/Hz is multiplied with a factor of 0.65 to correspond to a
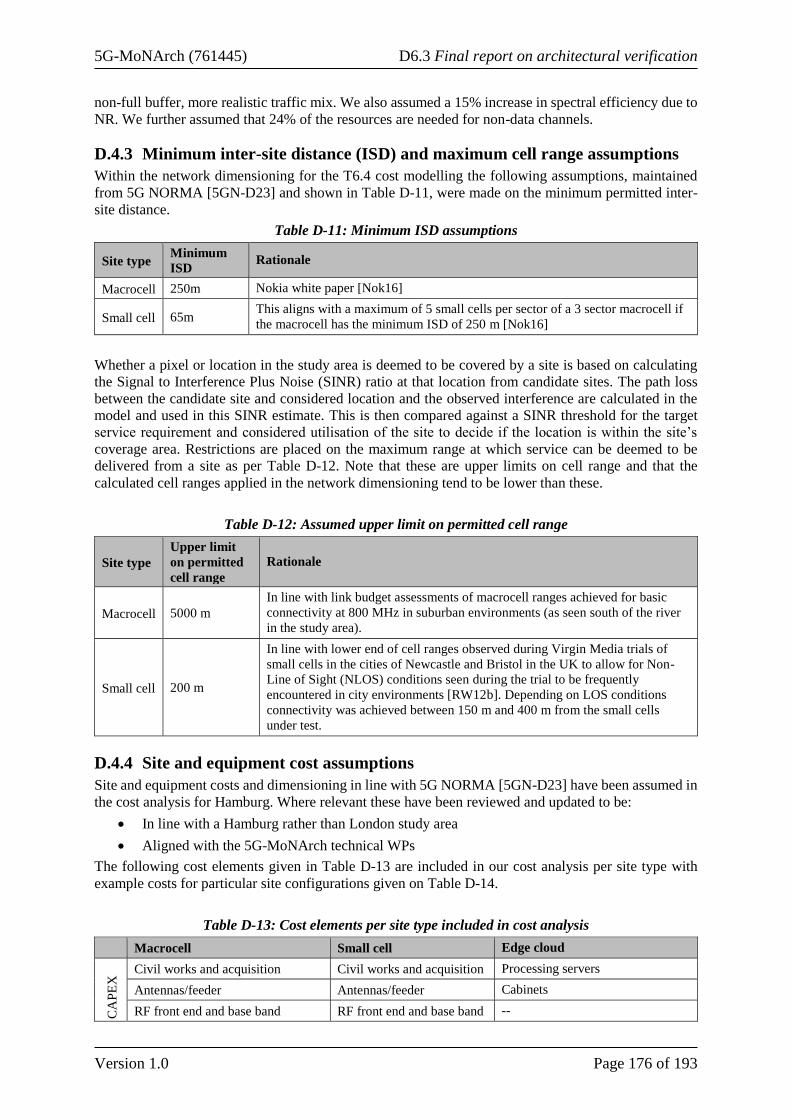
5G-MoNArch (761445) D6.3 Final report on architectural verification
Version 1.0 Page 176 of 193
non-full buffer, more realistic traffic mix. We also assumed a 15% increase in spectral efficiency due to
NR. We further assumed that 24% of the resources are needed for non-data channels.
D.4.3 Minimum inter-site distance (ISD) and maximum cell range assumptions
Within the network dimensioning for the T6.4 cost modelling the following assumptions, maintained
from 5G NORMA [5GN-D23] and shown in Table D-11, were made on the minimum permitted inter-
site distance.
Table D-11: Minimum ISD assumptions
Site type Minimum
ISD Rationale
Macrocell 250m Nokia white paper [Nok16]
Small cell 65m This aligns with a maximum of 5 small cells per sector of a 3 sector macrocell if
the macrocell has the minimum ISD of 250 m [Nok16]
Whether a pixel or location in the study area is deemed to be covered by a site is based on calculating
the Signal to Interference Plus Noise (SINR) ratio at that location from candidate sites. The path loss
between the candidate site and considered location and the observed interference are calculated in the
model and used in this SINR estimate. This is then compared against a SINR threshold for the target
service requirement and considered utilisation of the site to decide if the location is within the site’s
coverage area. Restrictions are placed on the maximum range at which service can be deemed to be
delivered from a site as per Table D-12. Note that these are upper limits on cell range and that the
calculated cell ranges applied in the network dimensioning tend to be lower than these.
Table D-12: Assumed upper limit on permitted cell range
Site type
Upper limit
on permitted
cell range
Rationale
Macrocell 5000 m
In line with link budget assessments of macrocell ranges achieved for basic
connectivity at 800 MHz in suburban environments (as seen south of the river
in the study area).
Small cell 200 m
In line with lower end of cell ranges observed during Virgin Media trials of
small cells in the cities of Newcastle and Bristol in the UK to allow for Non-
Line of Sight (NLOS) conditions seen during the trial to be frequently
encountered in city environments [RW12b]. Depending on LOS conditions
connectivity was achieved between 150 m and 400 m from the small cells
under test.
D.4.4 Site and equipment cost assumptions
Site and equipment costs and dimensioning in line with 5G NORMA [5GN-D23] have been assumed in
the cost analysis for Hamburg. Where relevant these have been reviewed and updated to be:
• In line with a Hamburg rather than London study area
• Aligned with the 5G-MoNArch technical WPs
The following cost elements given in Table D-13 are included in our cost analysis per site type with
example costs for particular site configurations given on Table D-14.
Table D-13: Cost elements per site type included in cost analysis
Macrocell Small cell Edge cloud
CA
PE
X Civil works and acquisition Civil works and acquisition Processing servers
Antennas/feeder Antennas/feeder Cabinets
RF front end and base band RF front end and base band --

5G-MoNArch (761445) D6.3 Final report on architectural verification
Version 1.0 Page 177 of 193
Labour Labour Labour
Transport Transport Transport O
PE
X
Site rental Site rental Site rental
Power costs Power costs Power costs
Licensing and maintenance Licensing and maintenance Licensing and maintenance
Transport Transport Transport
Site visits and on-site maintenance Site visits and on-site maintenance
Table D-14: Example costs for different site configurations
Example site configuration Example cost
Macrocell site with {low band, 2x4, 20 MHz} CAPEX: €80k
OPEX: €20k pa
Macrocell site with {low band, 2x4, 40 MHz} plus {midband, 32x4, 80 MHz} CAPEX: €190k
OPEX: €29k pa
Small cell site with {low band, 2x4, 20 MHz} CAPEX: €27k
OPEX: €2k pa
Edge cloud site upgrade cost* CAPEX: €51k
Edge cloud site running cost** OPEX: €52k pa
* In 2025 a typical edge cloud site adds 3 working + 1 spare server, and refreshes 4 working servers
** In 2025 a typical edge cloud site has 26 working + 3 spare servers
D.5 Network dimensioning assumptions for small cell network at cruise ship
terminal under EC2
This section of the appendix outlines the network dimensioning assumptions as applied in the cruise
ship terminal demand hotspot under EC2.
D.5.1 eMBB demand at cruise ship terminal
The EC2 eMBB demand hotspot at the cruise ship terminal is based on the following assumptions:
• The daily demand per user is in line with the low, medium and high demand forecasts given
in Section 3.3.1.1.
• The proportion of daily eMBB traffic consumed in the busy hour at the cruise ship terminal
is 25%. This is a higher proportion of daily traffic than typically dimensioned on cellular
networks to allow for all passengers and the crew members being likely to use their data services
once they arrive at the cruise ship terminal to plan the rest of the day and generally sync up their
mobile devices having had limited connectivity whilst on board the ship. Depending on the route
taken, there may be some mobile connectivity to cruise ships from the macrocell network when
the cruise ship is travelling close to shore, but we assume that this is intermittent and limited.
• The volume of mobile users is approximately 5,800 when a large cruise ship arrives. This is
made up of up to 4,300 passengers and 1,500 staff. This is in line with information received
from discussions with Cruise Gate Hamburg who manage the Steinwerder cruise ship terminal
in Hamburg.
D.5.2 Small cell capacity and supporting network equipment assumed
To evaluate the benefits of elasticity, we first consider a traditional deployment scenario where an MNO
deploys a small cell network using their own spectrum. We assumed a 33% market share per MNO i.e.
the market share is equally distributed among three MNOs. Therefore, the available spectrum and the
demand is equally distributed among three MNOs with each having 20 MHz of spectrum in the low
frequency band (i.e. 1.8 GHz, 2.1 GHz and 2.6 GHz spectrum bands) and 60 MHz of spectrum in the
medium frequency band (covering carriers around 3.5 GHz) available for their small cell layer of their

5G-MoNArch (761445) D6.3 Final report on architectural verification
Version 1.0 Page 178 of 193
network. We assume that the MNO uses virtualised small cells consisting of RRHs on the antenna site
and BS processing being done in a separate data centre location.
The capacity per small cell for the different available frequency bands in each year is shown in Figure
D-4. The maximum capacity per small cell is calculated from the available bandwidth, antenna
configurations and spectrum efficiency of the SC in each year.
Figure D-4:Calculated capacity per small cell over time
We make the following assumptions when costing the small cell network at the cruise ship terminal:
• Fronthaul connectivity related assumptions: The demand hotspot is inside and in the vicinity of
the main terminal building which covers the indoor and the outdoor area around the main
terminal building. Therefore, we assume that a single 100 Gbps fronthaul connection into the
main terminal building is sufficient to carry all traffic generated by the small cell network
serving the cruise ship terminal area. The SCs that are deployed outside the terminal building
are likely to be connected with a small cell aggregation site located at the terminal building via
a maximum of 2 wireless hop sites. We assume that 50% of the small cells are located outside
the main terminal building and require 2 wireless hops.
• Deployment process: New SCs can be deployed each year if needed to meet the increasing
demand. For practical reasons, the number of SC sites that can be deployed is limited. The SCs
initially deployed were assumed to be using low frequency spectrum. If the demand cannot be
served with the low frequency spectrum, the model uses the medium frequency band spectrum,
collocated with the low frequency band SCs. Once a SC is deployed it is assumed to operate for
5 years. If the total capacity of the fronthaul is sufficient to serve traffic from both low and
medium frequency SCs, a single fronthaul connection is assumed to be sufficient for the site.
• Lifetime and upgrades at the end of the lifetime: SCs and servers are assumed to have a 5-year
lifetime. SCs and servers are replaced at the end of their lifetime. Note that the SC technology
(e.g. the bandwidth processed and the MIMO order) evolves over the time. When replacing SCs,
we assume that the SCs with the latest technology are deployed. This will enable extra capacity
to be served from the new SCs if the technology has improved at the time of the replacement.
However, we assume that SCs are replaced only at the end of their life time. Therefore, at the
time of the replacement, there could be a combination of legacy SCs and advanced SCs in
operation in the network.
Cost elements:
• SC cost: We assume that the antenna and RF front end costs increase with the bandwidth and
MIMO order and are as described in deliverable D2.3 of 5G NORMA [5GN-D23] with
conversion to allow for the change of study area applied.
• Edge cloud cost: We assume that the processing for small cells is accommodated on an existing
edge cloud site serving the main macrocell network but is dimensioned for in addition to the
processing already installed for the macrocell busy hour network loading.

5G-MoNArch (761445) D6.3 Final report on architectural verification
Version 1.0 Page 179 of 193
D.5.3 Spectrum assumptions for small cell hotspot deployment models
Under the sensitivity analysis of EC2 we consider three different models for deploying the small cell
network at the Steinwerder cruise ship terminal. The spectrum assumptions for each of these are given
in Figure D-5.
Figure D-5: Assumed spectrum availability between the deployment scenarios considered

5G-MoNArch (761445) D6.3 Final report on architectural verification
Version 1.0 Page 180 of 193
Appendix E Sensitivity analysis results for Mx-ART
Mobile networks are usually tuned for particular use cases by applying configuration parameter sets. In
order to have a clear understanding of parameter impacts related to each 5G-MoNArch enabler used in
the network level simulations with the Mx-ART tool, we have carried out a sensitivity analysis. E.g.
applying data duplication via MC, we achieve higher reliability at the cost of reduced area traffic
capacity as additional radio resources are allocated on secondary links to deliver the duplicated
information. As configuration parameter tuning is not practical for the whole Hamburg scenario, we use
a simplified baseline scenario for the sensitivity analysis. By performing this task, we also validate the
Mx-ART tool and its simulation capabilities.
Configuration Parameters for Baseline Scenario:
Due to the dynamicity and the amount of efforts require to sweep parameters, simplified scenario
(compared to Hamburg as defined in EC1 – EC2) has been chosen.
• Synthetic scenario, i.e. flat terrain, no buildings.
• Uniformly distributed terminals; no movement of UEs (static).
• 4 BS sites (3 cells per site) – 12 cells in total.
• Operating band: 800 MHz; signal bandwidth: 20 MHz.
• Each cell is transmitted with 46 dBm EIRP.
• Antenna configuration: SISO (single input single output).
• Number of VNF instances per cell: 4.
• Two slices: Video (90 % PRBs of entire bandwidth) & IoT (10 % PRBs of entire bandwidth).
Results of sensitivity analysis:
In Table E-1, the impact of network densification is presented. By applying site densification i.e. reduced
inter-site distance), the ‘coverage area probability’ and ‘user experienced data rate’ improves (the RAN
reliability as target KPI has been kept constant). While we modify the bandwidth (keeping the site
density constant), we observe improvement in ‘user experienced data rate’, however ‘coverage area
probability’ reduces due to the reduction in received power density as the EIRP is kept constant (see
Table E-2). The impact of the traffic demand while keeping the coverage area probability constant is
reflected in Table E-3.
Table E-1: Parameter modified: Site Density
Site density (Number of Sites in
fixed study area)
Coverage area
probability (%)
User experienced data
rate (bits/sec)
RAN
Reliability
2 0.503345996 174100 1
4 0.9108439982 323222.22 1
8 0.9750289991 426488.89 1
Table E-2: Parameter modified: Bandwidth
Bandwidth
(MHz)
Coverage area probability
(%)
User experienced data rate
(bits/sec)
RAN
Reliability
10 0.9754530005 174333.33 1
20 0.9108439982 323222.22 1
40 0.780282006 444611.11 1

5G-MoNArch (761445) D6.3 Final report on architectural verification
Version 1.0 Page 181 of 193
Table E-3: Parameter modified: Traffic Demand
Overall traffic demand
(bits/sec)
Coverage area
probability (%)
User experienced data rate
(bits/sec)
RAN
Reliability
95400000 0.9108439982 266622.22 1
190800000 0.9108439982 323222.22 1
381600000 0.9108439982 333044.44 1
For the sensitivity analysis of “data duplication”, we sweep the “Link imbalance threshold” parameter
(which translate to serving more/less terminals with “data duplication”) and observe the impact on
“Packet drop rate” KPI (described in detail in Section 3.2.1.1). In Table E-4, we observed that after
sweeping the parameter, we don’t observe any improvement in packet drop rate due to lack of radio
resources. In order to mitigate the shortage of radio resources, the signal bandwidth is scaled up (100
MHz) and the simulation is performed again. As presented in Table E-5, packet drop rate reduces by
increasing “Link imbalance threshold”. Hence, we conclude that availability of radio resources plays a
crucial role in addition to the coverage condition of the terminals.
To better compare these results, based on them we calculate and present the percentage (%) changes
between the different Link thresholds and redundancy schemes. For the “MC” enabler results, the
analysis confirms that the enabler requires free resources for data duplication, i.e. it is not functional in
the case of a fully loaded network. A scenario where data duplication is applied to an IoT slice using
higher link imbalances thresholds, packet drop rate decreases, coverage area probability remains
unaffected and a small decrease occurs in user experienced data rate as shown in Table E-6.
Table E-4: Parameter modified: Link Imbalance Threshold (BW=20 MHz)
Link imbalance
threshold
Coverage area
probability
User experienced data
rate (bits/sec)
RAN
Reliability
Packet drop rate
(%)
0 dB 0.9108439982 323222.22 1 0.00079968306
3 dB 0.9108439982 323222.22 1 0.00079968306
6 dB 0.9108439982 323222.22 1 0.00079968306
Table E-5: Parameter modified: Link Imbalance Threshold (BW=100 MHz)
Link imbalance
threshold
Coverage area
probability
User experienced data
rate (bits/sec)
RAN
Reliability
Packet drop rate (IoT
slice) (%)
0 dB 0.533506006 548988.89 1 0.000799683067
3 dB 0.533506006 544500 1 0.000671000000
6 dB 0.533506006 543500 1 0.000660000000
Table E-6: Sensitivity analysis results for RAN reliability
Link
Thresholds
Coverage area probability
change (%)
UE data rate change
(%)
Packet drop rate change
(%)
0 dB – 3 dB 0 -0.82 -19.18
0 dB – 6 dB 0 - 0.9998 -21.16
In Table E-7 we study the impact on “Telco-cloud reliability” enabler while sweeping different
“Redundancy schemes” (assumptions: VNF instance failure probability of 0.001 (for an individual
instance), number of active instances: N=4, number of redundant instances: M=1). While it is evident
that “Reliability” improvement results are similar as reported in Section 3.2.1, it is worth mentioning
that “Coverage area probability”, “User experienced data rate” and “Packet drop rate” remain unaffected
regardless of the “Redundancy Scheme” (as shown in Table E-8).

5G-MoNArch (761445) D6.3 Final report on architectural verification
Version 1.0 Page 182 of 193
Table E-7: Parameter modified: Redundancy Scheme
Redundancy
scheme
RAN
Reliability
Coverage area
probability
User experienced data
rate(bits/sec)
Packet drop rate
(%)
Active_only 0.996402859687 0.9108439982 323222.22 0.00079968306
Active_standby 0.997333094477 0.9108439982 323222.22 0.00079968306
Load_sharing 0.997597162922 0.9108439982 323222.22 0.00079968306
Active_Active 0.998836651444 0.9108439982 323222.22 0.00079968306
Table E-8: Sensitivity analysis results for Telco-cloud Reliability
Redundancy schemes Coverage area probability, User experienced data
rate, Packet drop rate change (%)
Reliability
change (%)
Active_Active -Active_only 0 0.25
Active_Active -
Active_standby 0 0.15
Active_Active -Load_sharing 0 0.12
In 5G-MoNArch WP4, we study 3 dimensions of elasticity namely “Slice-aware”, “Orchestration
driven” and “Computational” elasticity. In Table E-9 we sweep “Resource Share” per slice and observe
the impact of per slice throughput while all other KPIs remain constant. Furthermore, we observe that
after application of “Orchestration driven elasticity” (Table E-10) and “Computational elasticity” (Table
E-11), “User experienced data rate” is affected while other KPIs remain constant.
Table E-9: Parameter modified: Resource Share
Resource
share (%)
Coverage
area
probability
(%)
User
experienced
data rate
(bits/sec)
RAN
Reliability
Packet
drop rate
(%)
Experienced
data rate -
Video slice
(bits/sec)
Experienced
data rate - IoT
slice (bits/sec)
Video 0.9
/ IoT 0.1 0.91 323222.22 1 0.0007996 550000.0000 90000.0000
Video 0.5
/ IoT 0.5 0.91 340000 1 0.0007996 380000.00000 300000.000
Video 0.1
/ IoT 0.9 0.91 240250 1 0.0007996 96500.000000 384000.000
Table E-10: Parameter modified: Allocated VNFs Per Cell
Allocated VNFs
per cell
Coverage area
probability(%)
User experienced data
rate (bits/sec)
RAN
Reliability
Packet drop
rate (%)
4 0.911 323222.22 1 0.0007997
2 0.911 283000.00 1 0.0007997
1 0.911 149125.00 1 0.0007997
Table E-11: Parameter modified: Max MCS Index
Max_MCS_index Coverage area
probability (%)
User experienced data
rate (bits/sec)
RAN
Reliability
Packet drop
rate (%)
27 1 323222 1 0.0007996
10 1 211000 1 0.0007996
5 1 132000 1 0.0007996

5G-MoNArch (761445) D6.3 Final report on architectural verification
Version 1.0 Page 183 of 193
For each experiment, two services are hosted in the network with two existing slices (Video and IoT).
For the “Slice-aware elasticity” enabler, different VNFs were assigned per a cell while maintaining the
same coverage area probability, reliability and packet drop rate. The size of the resource share is highly
correlated to the total user experienced data rate and very highly correlated to the data rate of each slice
as shown in Table E-12.
Table E-12: Correlation results between slice resource share and user experienced data rate
User experienced data
rate (Total)
User experienced data
rate (Video)
User experienced data
rate (IoT)
Correlation (ρ) with
Resource share 0.776744 0.989721 0.9707253
For the “Orchestration driven elasticity” enabler, different proportions of resources were given to two
slices while maintaining the same Coverage area probability, Reliability and Packet drop Rate. The size
of the resource share is highly correlated to both the total and individual slices User experienced data
rate as shown in Table E-13.
Table E-13: Correlation results between number of VNFs assigned and user experienced data rate
User experienced data
rate (Total)
User experienced data
rate (Video)
User experienced data
rate (IoT)
Correlation (ρ) with number
of VNF assigned 0.8817406 0.8523994 0.9305009
For the “Computational elasticity” enabler, a maximum limit was imposed on the MCS index (5, 10,
27) while maintaining the same Coverage area probability, Reliability and Packet drop Rate. The size
of the resource share is highly correlated to both the total and individual slices User experienced data
rate as shown in Table E-14.
Table E-14: Correlation results between max MCS index and user experienced data rate
User experienced data
rate (Total)
User experienced data
rate (Video)
User experienced data
rate (IoT)
Correlation (ρ) with Max
MCS index 0.9532711 0.9661138 0.8924826

5G-MoNArch (761445) D6.3 Final report on architectural verification
Version 1.0 Page 184 of 193
Appendix F Stakeholder questionnaires
Questionnaire administered to verticals in Hamburg workshop
The following questions formed a questionnaire that was administered to verticals who attended the
final 5G-MoNArch event/workshop in Hamburg.
1) What is your area of business: City council, Freight operator in a sea port, Tourism venue or
organisation, Manufacturer, Logistics Company, Other?
2) What size is your organisation in terms of number of employees: Small with less than 100
employees, Medium with between 100 and 1,000 employees, Large with over 1,000 employees.
3) How important is wireless to the daily operations of your business? Answered in a 1 (not
important at all) to 5 scale (extremely important).
4) Are existing wireless solutions adequate for your current and future needs? Answered in a 1
(Extremely inadequate) to 5 scale (Extremely adequate).
4a) Please elaborate on the kind of wireless solutions you are currently using and where relevant
any issues with these.
5) Would you willing to pay more than what you are currently investing in wireless solution to
enjoy 5G enabled services? Answered by Yes or No.
6) Do you think that 5G technology as shown at the workshop could help in your daily operations?
Answered in a 1 (Completely Agree) to 5 scale (Completely Agree)
7) If yes, in what way might it help? Automation of machinery and equipment, Remote control of
machinery and equipment, Ability to gather data remotely and visualise them to assist decision
making for your business, Provide more data on the operational environment and asset locations,
Provide a more reliable, more flexible, or cheaper replacement for fixed telecoms connections,
Provide new immersive experiences via Virtual or Augmented Reality (VR/AR) to visitors at
your venue, Provide new employee training or assistance methods using AR applications, Allow
using IOT devices such as smart resource consumption meters , Provide security measures that
ensure safe and reliable operation of services, Capability to rapidly define the functional
requirements of a network slice and then deploy it, only when needed – Network as a service
(NAAS) model, Provide visitors/tourists access to locations otherwise inaccessible via VR,
Other.
8) If 5G services were used to improve your daily operations, who would you expect to pay for the
network equipment to support these? Expect to pay an annual subscription charge for mobile
services with the MSP paying for any network installation, Willing to contribute towards initial
network installation costs specific to my services and then have an on-going subscription charge,
Other.
9) What do you consider to be the greatest barriers to adopting wireless solutions in your daily
operations?
10) Does your organisation have access to existing fibre, street furniture (benches, streetlamps,
traffic lights & signs etc) or other assets that you might consider making available to wireless
service providers? If so, what would you expect in return for access to these assets?
11) What is currently your approx. spending on wireless each year?
a) <1000€ b) 1,000 -5,000€ c) 5,000 -10,000€ d) 10,000 – 50,000€ e) 50,000 – 100,000€
f) 100,000 – 250,000 € g) 250,000 – 500,000 € h) 500,000 € (i) Do not know
12) Would you be willing to invest to incorporate the kind of technologies that 5G-MoNArch offers,
into your operations? Answered by Yes or No.
Questionnaire administered to end users in Turin workshop
The VR application questionnaire was administered to visitors in the Turin testbed. Most of the questions
were answered a scale of 1 to 5, with 5 being “strongly agree” and 1 being “strongly disagree”. For the
remaining questions, the available answers are listed in the questionnaire below.

5G-MoNArch (761445) D6.3 Final report on architectural verification
Version 1.0 Page 185 of 193
Familiarity with Virtual Reality (VR) applications
How experienced are you with using Virtual Reality applications?
• This is the first time I use a VR application
• I am familiar with using VR applications
• I am a frequent user of VR applications
General questions
The VR experience delivered by the 5G-MoNArch solution provided a close equivalent to a physical
museum experience
The VR delivered by 5G provides a worthwhile enhancement to a physical museum experience and
would make me more likely to visit this museum
Would you be willing to pay for a VR experience in a museum and if so in which price range?
• Nothing (would expect it to be free of charge or included in entrance fee)
• Less than an audio guide (< 5 €)
• More than an audio guide (5-10 €)
• Much more than an audio guide (> 10 €)
• Price I would pay (if > 10 € selected above): ______________________
Quality of Experience (QoS) questions
• I felt it was easy to successfully complete the tasks inside the application
• I did not have to spend a lot of time to complete the tasks inside the application
• I felt inconsistency in motion response during the use of the VR application
System Usability Scale (SUS) questions
• I felt very confident using the VR application
• I think that I would like to use this VR application frequently
• I thought the VR application was easy to use
• I would imagine that most people would learn to use the VR application very quickly
• I found the various functions in the VR application were well integrated
• I think that I would need the support of a technical person to be able to use this VR application
• I needed to learn a lot of things before I could get going with the VR application
• I found the VR application very cumbersome to use
• I found the VR application unnecessarily complex
• I thought there was too much inconsistency in way the VR application controls were applied

5G-MoNArch (761445) D6.3 Final report on architectural verification
Version 1.0 Page 186 of 193
Appendix G Details on qualitative verification of architectural and
functional requirements
The following tables in this appendix provide a detailed overview of all general architectural and
functional requirements set by D6.1 [5GM-D61] and their fulfilment by the 5G-MoNArch approach. In
particular, the following requirements are provided:
• Generic requirements (Table G-1)
• Requirements on network slicing (Table G-2)
• RAN-related requirements (Table G-3)
• Capability exposure requirements (Table G-4)
• Security requirements (Table G-5)
It has to be noted that not all of those requirements were directly addressed by 5G-MoNArch as they are
e.g. out of scope of the project. Such requirements are marked as “Not applicable” and explanations for
the assessment are given.
Table G-1: Generic requirements on the overall 5G system
No. Generic requirement Fulfilled by 5G-MoNArch approach?
1
The 5G system shall leverage novel technology
enablers (e.g. NFV and SDN) to reduce the TCO and
to improve operational efficiency, energy efficiency,
and simplicity and flexibility for offering new
services.
Yes.
For 5G-MoNArch a flexible and adaptable
approach has been chosen, taken care of
SDN/NFV/SBA principles (e.g. CU/UP split,
flexible instantiation of NFs in the underlying
infrastructure clouds); see [5GM-D23]. The
approach supports network slicing in a multi-
tenant/-service environment. A Proof of
Concept (PoC) was performed in the 2 testbeds
of the project; see [5GM-D52].
2
The 5G system shall support the concept of
dedicated network slices, understood as the
allocation of dedicated network resources to serve a
defined business purpose, customer, or use case.
Yes.
As noted in the statement to req. no. 1 of this
table, the chosen approach fully supports the
creation of different network slices based on
selected purposes; see [5GM-D23] and [5GM-
D52].
3
The dependencies between 5G RAN and CN should
be minimised to allow separate evolutionary steps,
i.e. the architecture should be defined with a
converged access-agnostic CN with a common RAN
- CN interface which integrates different wireless
access types (3GPP, non-3GPP), but which may also
cover fixed access types (targeting Fixed-Mobile
Convergence (FMC)).
Yes.
The chosen approach allows the independent
evolution of RAN and CN NFs. Integration of
different wireless access types incl. of FMC
was not in focus of 5G-MoNArch, but solutions
derived by 3GPP SA2 on wireless and wireline
convergence [3GPP-23716] as well as access
traffic steering, switch, and splitting [3GPP-
23793] can be complementary integrated in the
given architecture.
4 The 5G system design shall support infrastructure
sharing and multi-tenancy.
Yes.
Both features are inherently supported by the
5G-MoNArch approach; see statement at req.
no. 1 of this table.
5
The 5G system shall support the separation of UP
functions (UPNFs) from CP functions (CPNFs),
allowing independent scalability, evolution and
flexible deployments, e.g. centralised location or
distributed (remote) location.
Yes.
The 5G-MoNArch architecture uses SDN/NFV
principles.
6 The 5G system shall allow a modularised function
design (based on the decomposition of RAN and CN
Yes.
See statement to req. no. 1 of this table.

5G-MoNArch (761445) D6.3 Final report on architectural verification
Version 1.0 Page 187 of 193
No. Generic requirement Fulfilled by 5G-MoNArch approach?
NFs), e.g. to enable flexible and efficient network
slicing by adaptive placement of those NFs at
different locations within the network infrastructure.
7
The 5G system shall allow for deployment
flexibility, e.g. to host relevant RAN and CN NFs
and application functions close together at the edges
of the network, when needed, e.g. to enable context
aware service delivery, low latency services, etc.
Yes.
See statement to req. no. 1 of this table.
8
Wherever applicable, procedures (i.e. the set of
interactions between NFs) shall be defined as
services so that their re-use is possible.
Yes.
This SBA approach is at least supported for CN
NFs and higher layer RAN NFs; see statement
to req. no. 1 of this table. For lower layer RAN
NFs the SBA approach is not feasible due to
required real-time behaviour.
9
NFs shall be enabled to interact with other NFs
directly if required. The architecture should not
preclude the use of an intermediate function to help
to route CP messages.
Yes.
See statement to req. no. 1 of this table.
10
The 5G system shall be able to manage both VNFs
and PNFs. Fault, configuration, account,
performance, and security (FCAPS) management, as
well as lifecycle management (LCM) of VNFs, shall
be based on NFV-MANO principles [ETSI-
MAN001] [ETSI-WP5G].
Yes.
Details on the M&O approach applied in 5G-
MoNArch are given in [5GM-D23].
11
The 5G system shall support "stateless" NFs, where
the "computational" resource is decoupled from the
"storage" resource.
Partially.
The principle of “stateless” NFs is applied at
least for CN NFs applying a so-called shared or
network data layer (SDL/NDL); see e.g.
[NGMN-NDL].
12
The 5G system shall support a unified authentication
and identity management framework across different
access networks. Special provisions shall be offered
for IoT devices (e.g. low-cost sensors) with limited
capabilities.
Not applicable.
An authentication and identity management
framework was not in focus of 5G-MoNArch
activities. Solutions for those topics specified
for 5G by 3GPP in Rel-15+ can be integrated
without loss of generality.
13
The 5G system shall allow operators to optimise
network behaviour (e.g. mobility management
support) based on the mobility patterns (e.g.
stationary, nomadic, spatially restricted mobility, full
mobility) of a user equipment (UE) or group of UEs.
Yes.
The 5G-MoNArch architecture supports a
general framework for network automation
covering data collection functions in both RAN
and CN and additionally an AI/ML-based data
analytics layer which can provide dedicated
information to CP NFs for policy- and
situation-dependent decisions (e.g. for mobility
management or SON functions); see [5GM-
D23].
14
The 5G system shall be able to self-configure and
self-heal in case of failures by the implementation of
self-organising/optimisation network (SON)
procedures.
Yes.
See statement to req. no. 13 of this table.
15
The 5G system shall efficiently support network
resource utilisation and optimisation based on system
information (context awareness), providing
mechanisms to collect such information (e.g.
network conditions, information on served UEs, user
subscription profiles, application characteristics)
within an operator configured time scale.
Yes.
See statement to req. no. 13 of this table.

5G-MoNArch (761445) D6.3 Final report on architectural verification
Version 1.0 Page 188 of 193
No. Generic requirement Fulfilled by 5G-MoNArch approach?
16 The 5G system shall support different levels of
resilience for the services provided.
Yes.
According to service/slice demands the
specified orchestration management can
flexibly initiate service/slice-specific NFs on
the underlying cloudified infrastructure in a
way that the required E2E reliability and
availability thresholds are fulfilled. The only
limitation is seen regarding the basic physical
infrastructure installation which is in principle
extendable as in today’s system (e.g. via
additional lines, antenna sites, servers, …).
17
The 5G system shall allow flexible mechanisms to
establish and enforce priority policies among the
different services and users (subject to regional or
national regulatory and operator policies).
Yes.
Due to its flexibility and the integrated E2E
QoS-based network slicing concept the 5G-
MoNArch architecture supports the realisation
of different policies related to the services and
users, which may vary also dependent on the
location.
18
The 5G system shall be able to provide the required
E2E QoS (e.g. reliability, latency, and bandwidth)
for a service and support prioritisation of resources
when necessary for that service.
Yes.
In addition to the statement to req. no. 17 of
this table the service/slice specific NFs (CP and
UP) can be instantiated and dynamically
parametrised in the different network parts
(RAN, CN, TN) allowing together with the
resource management the fulfilment of the E2E
QoS requirements.
Table G-2: Requirements on network slicing
No. Requirement on NW slicing Fulfilled by 5G-MoNArch approach?
1
The 5G system should allow the realisation of
NSIs across several infrastructure domains which
may be owned by different parties (multi-domain
operation).
Yes.
The 5G-MoNArch architecture supports network
slicing in a multi-tenant/-service environment
across different infrastructure domains; see
[5GM-D23]. The handling of NSIs is done by the
Management & Orchestration layer of the overall
functional architecture. A PoC was performed in
the 2 testbeds of the project; see [5GM-D52]. The
network slicing approach is also considered in the
stakeholder business model developed in 5G-
MoNArch; see [5GM-D61].
2
The 5G system shall allow the operator to create,
modify and delete an NSI (or network slice subset
instance (NSSI), and to define and update the set
of services and capabilities supported in an NSI.
Yes.
See statement to req. no. 1 of this table.
3
The 5G system shall allow the operator to
configure the information which associates a UE
or a service to an NSI.
Yes.
See statement to req. no. 1 of this table.
4
The 5G system shall allow the operator to assign a
UE to an NSI, to move a UE from one NSI to
another, and to remove a UE from an NSI based
on subscription, UE capabilities, the access
technology used by the UE, operator's policies and
services provided by the NSI.
Yes.
See statement to req. no. 1 of this table.

5G-MoNArch (761445) D6.3 Final report on architectural verification
Version 1.0 Page 189 of 193
No. Requirement on NW slicing Fulfilled by 5G-MoNArch approach?
5
The 5G system shall enable a UE to be
simultaneously assigned to and access services
from more than one NSI of one operator.
Yes.
See statement to req. no. 1 of this table. The
chosen approach is in line with the 3GPP Rel-15+
specifications on that topic.
6
Traffic and services in one NSI shall be logically
isolated from traffic and services in other NSIs in
the same network.
Yes.
See statement to req. no. 1 of this table.
7
Creation, modification and deletion of an NSI
shall have no or minimal impact on traffic and
services in other NSIs on the same network.
Yes.
See statement to req. no. 1 of this table.
8 The 5G system shall support scaling of an NSI, i.e.
adaptation of its capacity.
Yes.
See statement to req. no. 1 of this table. 5G-
MoNArch has defined suitable inter- and intra-
slice resource management functionalities; see
[5GM-D23].
9
The 5G system shall enable the network operator
to define a minimum available capacity as well as
a maximum capacity for an NSI. Scaling of other
NSIs on the same network shall have no impact on
the availability of the minimum capacity for that
NSI.
Yes.
See statements to req. no. 1 and 8 of this table.
10
The 5G system shall enable the network operator
to define a priority order between different NSIs in
case multiple NSIs compete for resources on the
same network.
Yes.
See statements to req. no. 1 and 8 of this table.
11
The 5G system shall support means by which the
operator can differentiate policy control,
functionality and performance provided in
different NSIs.
Yes.
See statements to req. no. 1 and 8 of this table.
12
In a shared 5G network configuration, each
operator shall be able to apply all the requirements
from this clause to their allocated network
resources.
Yes.
See statements to req. no. 1 and 8 of this table.
13
The 5G system shall provide the implementation
of suitable network slice management functions
(NSMFs) allowing efficient fault, configuration,
performance, lifecycle, and policy management of
NSIs and NSSIs, respectively, also for automated
(i.e. SON-based) reconfiguration, optimisation,
and healing.
Yes.
See statement to req. no. 1 of this table.
Table G-3: RAN-related requirements
No. RAN-related requirement Fulfilled by 5G-MoNArch approach?
1
The 5G RAN shall be highly scalable with
respect to parameters like throughput, number
of devices or number of connections to support
a wide range of 5G service types with
diverging requirements (like those spanned by
the triangle of eMBB, mMTC, and URLLC).
Yes.
The flexible and adaptable approach of 5G-MoNArch
based on SDN/NFV/SBA principles allows to cope in
the RAN with services/slices with diverging
requirements, see [5GM-D23]. A PoC was performed
in the 2 testbeds of the project; see [5GM-D52].
2
The 5G RAN shall be designed to operate in a
wide spectrum range with diverse
characteristics such as bandwidths and
propagation conditions. For higher frequency
Yes.
Even if dedicated air interface aspects are not in the
scope of 5G-MoNArch, features designed by 3GPP
in TS 38 series [3GPP-38] on NR (waveform,
transmission frame structure, frequency bands,

5G-MoNArch (761445) D6.3 Final report on architectural verification
Version 1.0 Page 190 of 193
No. RAN-related requirement Fulfilled by 5G-MoNArch approach?
bands such as millimetre wave (mmW),
beamforming (BF) will become essential.
Massive MIMO, etc.). are fully applicable within the
developed architecture and are considered to be
controlled via the (radio) resource management
framework, see [5GM-D23]. Those features are also
considered in the techno-economic analysis
performed by WP6.
3
It shall be possible for efficiency purposes to
run one or more NSI with varying service
characteristics on the same frequency band by
sharing of time-frequency resources.
Yes.
See statements to req. no. 1 and 2 of this table.
4
The 5G RAN should enable a tight
interworking between different 5G air interface
variants (AIVs) incl. LTE-A Pro evolution.
Yes.
This is covered by the MC approach considered in
5G-MoNArch RAN design. See also statement at req.
no. 5 of this table.
5
The 5G RAN shall natively and efficiently
support MC, i.e. the case when a UE is
connected to more than one transmission-
reception point (TRxP) (inter-site, i.e. not co-
located) and/or more than one AIV (which
may be co-located or not). MC shall be
supported for both throughput increases via
aggregation of parallel data flows as well as for
link reliability improvement via data
duplication and/or NC features.
Yes.
The RAN within 5G-MoNArch was designed to
inherently consider the MC feature, especially to
support UR services via data duplication; see [5GM-
D23] and [5GM-D32].
6 The 5G system shall support UEs with single
and multiple radio capabilities.
Yes.
See statements to req. no. 4 and 5 of this table. A
single radio capability for a UE covers a subset of the
multi-radio capability.
7
When a UE is able to use two or more AIVs
simultaneously, the 5G system shall be able to
select between AIVs in use, considering, e.g.
service, traffic characteristics, radio
characteristics, and UE's moving speed.
Yes.
This is considered by 5G-MoNArch’s RRM. Please
note that the number of active AIVs is limited to 2 as
also stated by 3GPP.
8
The 5G RAN shall natively support network-
controlled device-to-device (D2D)
communication (side link, i.e. point-to-point,
multicast and broadcast), both in as well as out
of coverage of TRxPs (important for, e.g. V2X
scenarios).
Not applicable (yes, respectively).
D2D was not in dedicated scope of 5G-MoNArch,
but as noted in statement to req. no. 2 specified 3GPP
AIV features for LTE and NR in Rel-15+ can be seen
as covered by the RAN design in 5G-MoNArch.
9
The 5G RAN shall enable operators to support
wireless self-backhauling using 5G AIVs with
flexible resource partitioning between access
and backhaul functions. The self-backhauling
functionality shall be multi-hop capable and
support topologically redundant connectivity.
Not applicable.
Self-backhauling solutions were not in scope of 5G-
MoNArch. 3GPP has finished its study on
“Integrated access and backhaul” (IAB) for NR end
of 2018 [3GPP-38874] and is currently working on
the IAB specification. Up to now there is no aspect
identified that would hinder to integrate the IAB
approach into the 5G-MoNArch architecture.
10
The 5G RAN should support an RRM covering
both AIV-specific and AIV-overarching
aspects for data traffic steering/aggregation and
interference management.
Yes.
This is considered by 5G-MoNArch’s RRM.
11
The 5G RAN design must be energy efficient.
This means that permanently active NFs or
signals transmissions (e.g. reference symbols)
have to be avoided.
Yes.
See statement to req. no. 2 of this table.

5G-MoNArch (761445) D6.3 Final report on architectural verification
Version 1.0 Page 191 of 193
No. RAN-related requirement Fulfilled by 5G-MoNArch approach?
12 The 5G RAN shall minimise the signalling that
is required prior to user data transmission.
Yes.
See statements to req. no. 1 and 2 of this table.
13
The 5G RAN shall optimise the CP and UP
resource usage for data transmission taken care
of UE capabilities (mobility type, location, …),
communication pattern (e.g. Tx-only, frequent
or infrequent), payload characteristics (e.g.
small or large size data), application
characteristics (e.g. provisioning operation,
normal data transfer) etc.
Yes.
See statements to req. no. 1 and 2 of this table
(resource management taken also care of data
analytics).
14
The 5G system shall be able to support
seamless mobility/handover between the 5G
AIVs and/or TRxPs.
Yes.
See statement to req. no. 2 of this table.
15
The 5G RAN shall support different means for
reducing UE power consumption while UE is
in periods with data traffic as well as in periods
without data traffic.
Yes.
See statement to req. no. 2 of this table.
16
The 5G RAN shall support the operation of DL
only broadcast/multicast over specific
geographic areas (e.g. a cell sector, a cell or a
group of cells) to both stationary and mobile
UEs.
Not applicable.
Broad-/multicast was not in focus of 5G-MoNarch.
Also, 3GPP has not specified this feature in NR Rel-
15, just eMBMS is defined for LTE-based AIV.
17
Different options and flexibility for splitting
the 5G RAN architecture shall be allowed.
This shall cover both the horizontal split (split
between or inside radio protocol stack layers)
and the vertical split (i.e. CP/UP separation).
Yes.
The SDN approach applied in 5G-MoNArch
inherently supports the CP/UP split. The flexibility
regarding the RAN NF placement in 5G-MoNArch
offers a high number of possible horizontal split
options, but especially due to complexity of inter-
operability testing, just a low number of options
makes sense from a commercial perspective.
Therefore, only the higher layer split of 3GPP known
as F1 interface [3GPP-38470] (plus E1 regarding the
CU/UP split within the CU [3GPP-38460]) was of
most interest. Concerning low layer split, the xRAN
fronthaul interface [xRAN18] based on eCPRI
[eCPRI17]and the “classical” CPRI interface
[CPRI15] are under consideration for techno-
economic analysis in WP6 evaluations.
18
The 5G RAN shall be designed such that it can
maximally leverage from the centralised
processing of radio layers, but also operate
well in the case of distributed TRxPs with
imperfect x-haul (back-/mid-/front-haul)
infrastructure (split between a centralised unit
(CU) and distributed units (DUs) near the
antenna sites)
Yes.
The 5G-MoNArch architecture is primarily designed
for a cloudified infrastructure layer covering also the
RAN, but it can be applied also the “classical” D-
RAN approach. Regarding x-haul see statement to
req. no. 17 of this table.
19
The RAN-CN interfaces and RAN-internal
interfaces shall be open for multi-vendor
interoperability.
Yes.
See statement to req. no. 1 of this table. Usage of
open interfaces between NEs and/or functions to
allow multi-vendor support is one if the basic design
criteria of the 5G-MoNArch architecture.
Table G-4: Capability exposure requirements

5G-MoNArch (761445) D6.3 Final report on architectural verification
Version 1.0 Page 192 of 193
No. Capability exposure requirements Fulfilled by 5G-MoNArch
approach?
1
The 5G system shall support capability exposure to third
parties through a set of open Application Programming
Interfaces (APIs), allowing different provider business models
to be implementable (e.g. XaaS).
Yes.
Different XaaS-based business
models are supported by the 5G-
MoNArch architecture; see [5GM-
D23].
2
Based on operator policy, the 5G system shall provide suitable
APIs to allow a trusted third party to create, modify, delete and
monitor NSIs used for the third party as well as to manage the
set of services and capabilities within and access of UEs to
those NSIs (incl. capacity and QoS features).
Yes.
This is inherently covered by the
network slicing approach in 5G-
MoNArch taken care of the
Management & Orchestration layer
functionalities.
3
The 5G system shall support concurrent access to local and
centralised services. To support low latency services and
access to local data networks, UPNFs may be deployed close
to the RAN.
Yes.
The SDN/NFV/SBA approach in 5G-
MoNArch allows the flexible
placement of functions and service
applications within the infrastructure
layer.
4
The 5G system shall enable a service hosting environment
provided by an operator, support configuration of that
environment and be able to interact with applications in that
environment for efficient network resource utilisation and
possible offloading of data traffic.
Yes.
See statements to req. no. 1 to 3 of
this table.
5
Based on operator policy, the 5G system shall provide suitable
APIs to allow a trusted third party to manage and monitor this
trusted third party’s owned application(s) in the operator's
service hosting environment (e.g. for offloading purposes
close the UEs' location).
Yes.
See statements to req. no. 1 to 3 of
this table.
6
Based on operator policy, application needs or both, the 5G
system shall support an efficient UP path between UEs
attached to the same network, modifying the path as needed
when the UE moves during an active communication.
Yes.
See statements to req. no. 1 to 3 of
this table.
7
Based on operator policy, the 5G system shall be able to
support routing of data traffic between a UE attached to the
network and an application in a service hosting environment
for specific services, modifying the path as needed when the
UE moves during an active communication.
Yes.
See statements to req. no. 1 to 3 of
this table.
Table G-5: Security requirements
No. Security requirement Fulfilled by 5G-MoNArch approach?
1
The 5G system shall be designed in a way that it secures
the network, its users and their traffic effectively against
cyber-attacks, and may provide flexible security
mechanisms that can be tailored to the needs of the
different use cases that are supported.
Yes.
Regarding security aspects, relevant
especially for integration of verticals, 5G-
MoNArch introduced the concept of STZs
in the architecture.
2
The 5G system shall provide mechanisms to verify the
integrity of radio messages. These mechanisms shall
allow the detection of unauthorised radio messages,
detection of "false BSs" and verification of an authorised
network. The mechanisms defined should cater for high-
speed communications envisioned in 5G and for battery
efficient low volume data as well.
Not applicable.
The focus of 5G-MoNArch regarding
security aspects was especially on
conceptual level as well as on security
threat detection, prevention and reaction
within Management & Orchestration layer.
Radio protocol related security features for
5G are implementable in the 5G-MoNArch
architecture according to 3GPP
specification [3GPP-33501].

5G-MoNArch (761445) D6.3 Final report on architectural verification
Version 1.0 Page 193 of 193
No. Security requirement Fulfilled by 5G-MoNArch approach?
3
The security mechanisms defined in the 5G system shall
be able to be configured to comply with local lawful
interception laws and regulations.
Not applicable.
See statement to req. no. 2 of this table.
4
The security mechanisms defined in the 5G system shall
be able to be configured to confidentially protect voice,
data and signalling, as well as subscriber's privacy.
Not applicable.
See statement to req. no. 2 of this table.
5
The security mechanisms defined in the 5G system shall
be able to be configured to provide authorisation services
for users, devices and networks both at a bearer level and
at a services level.
Not applicable.
See statement to req. no. 2 of this table.
6
The security mechanisms defined in the 5G system shall
be able to be configured to provide authorisation,
integrity protection and confidentiality between NEs and
between networks.
Yes
The STZ approach designed in 5G-
MoNArch allows to customise the security
probes deployed, adapting them to the
security requirements of the network slice
to protect. This includes security probes
such as Network Intrusion Detection
Systems (NIDS) and Host-based Intrusion
Detection Systems (HIDS) for detecting
brute-force attacks and other authorisation
related incidents. The STZ approach is
flexible enough to customise it with
dedicated security probes for checking
integrity of communication channels and
prevent Man in the Middle attacks
7
The security mechanisms defined in the 5G system shall
be able to be configured to provide authorisation,
integrity protection and confidentiality for new 5G
services.
8
As the 5G system networks may be active up to and
beyond 2030 and as the ability to attack security
mechanisms increases over time, the security mechanisms
specified for the 5G system shall be extensible to new
algorithms and procedures that will be defined during the
lifetime of the specifications, where appropriate.
Yes.
The security components deployed within
a Network Slice can be updated or
replaced by updated ones. STZs can be
extended with additional security probes or
security components that allows to adapt
the security detection capabilities to the
requirements of the 5G infrastructure
9
The CP shall be protected against denial of service
attacks from UEs. Mechanisms should be specified which
limit the effect which signalling attacks may cause to the
network. Signalling caused by UEs should not be able to
degrade the network performance for other end users and
the network itself.
Yes.
NIDS security probes are an effective
mechanism to detect DoS attacks, which
can be easily integrated in STZs. The STZ
approach considers the usage of Security
Threat Reaction capabilities that mitigate
DoS attacks in a transparent way without
degrading the network performance.
10
UEs shall be protected against denial of service attacks
from the network. Mechanisms should be specified which
limit the effect which signalling attacks may cause to
UEs. Signalling caused by the network should not be able
to degrade the network performance for end users.
11
UEs and the 5G network should be protected against
denial of service attack from external networks, e.g. the
internet, and from other UEs. The impact to network and
end user signalling or data processing due to external
attacks should be minimised. Signalling and data
processing caused by external network traffic should not
degrade the network performance for end users and the
network itself, as well as the UE performance, e.g. the
power consumption.


