Discrete Probability Distributions. Probability Distributions.
date post
19-Dec-2015Category
view
230download
0
5E Note 4
Statistics with Economics and Statistics with Economics and Business ApplicationsBusiness Applications
Chapter 3 Probability and Discrete Probability Distributions
Experiment, Event, Sample space, Probability, Counting rules, Conditional probability, Bayes’s rule, random variables, mean,
variance
5E Note 4
ReviewReview
I. I. What’s in last lecture?What’s in last lecture?
Descriptive Statistics – Numerical Measures. Chapter 2.
II. II. What's in this and the next two lectures?What's in this and the next two lectures?
Experiment, Event, Sample space, Probability, Counting rules, Conditional probability, Bayes’s rule, random variables, mean, variance. Read Chapter 3.

5E Note 4
Descriptive and Inferential StatisticsDescriptive and Inferential Statistics
Statistics can be broken into two basic types:
• Descriptive Statistics (Chapter 2):
We have already learnt this topic
• Inferential Statistics (Chapters 7-13):
Methods that making decisions or predictions about a population based on sampled data.
• What are Chapters 3-6?
Probability
5E Note 4
Why Learn Probability?Why Learn Probability?
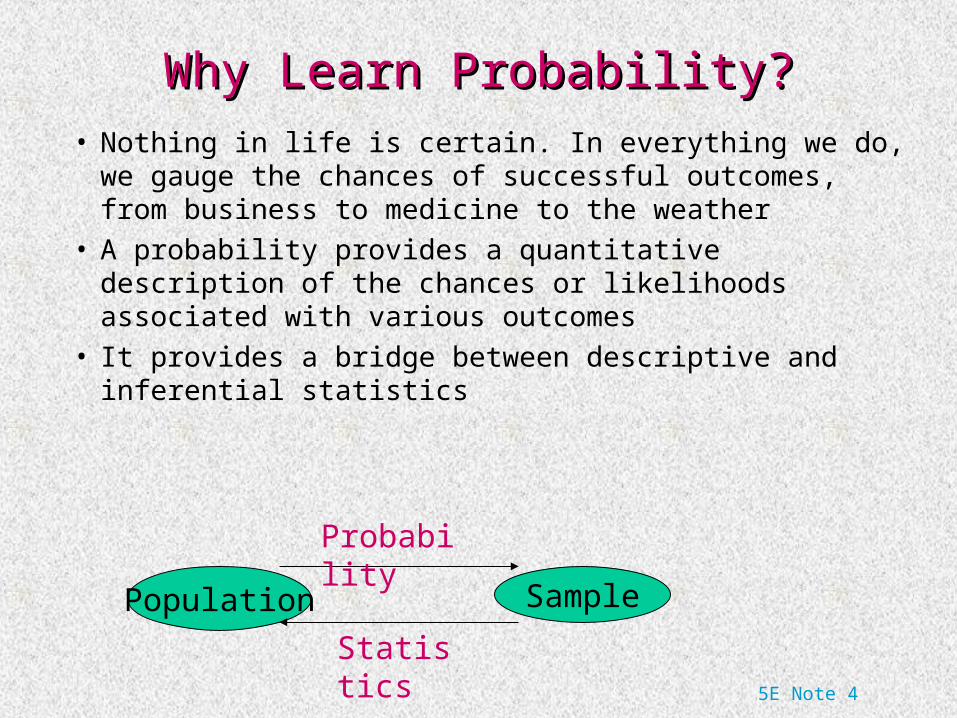
• Nothing in life is certain. In everything we do, we gauge the chances of successful outcomes, from business to medicine to the weather
• A probability provides a quantitative description of the chances or likelihoods associated with various outcomes
• It provides a bridge between descriptive and inferential statistics
Population Sample
Probability
Statistics

5E Note 4
Probabilistic vs Statistical ReasoningProbabilistic vs Statistical Reasoning
• Suppose I know exactly the proportions of car makes in California. Then I can find the probability that the first car I see in the street is a Ford. This is probabilistic reasoning as I know the population and predict the sample
• Now suppose that I do not know the proportions of car makes in California, but would like to estimate them. I observe a random sample of cars in the street and then I have an estimate of the proportions of the population. This is statistical reasoning

Note 5 of 5E
What is Probability?What is Probability?• In Chapters 2, we used graphs and
numerical measures to describe data sets which were usually samples.samples.
• We measured “how often” using
Relative frequency = f/nRelative frequency = f/n
SampleAnd “How often”= Relative frequency
Population
Probability
• As n gets larger,
Note 5 of 5E
Basic ConceptsBasic Concepts• An experimentexperiment is the process by which
an observation (or measurement) is obtained.
• An eventevent is an outcome of an experiment, usually denoted by a capital letter. – The basic element to which probability
is applied– When an experiment is performed, a
particular event either happens, or it doesn’t!

Note 5 of 5E
Experiments and EventsExperiments and Events• Experiment: Record an ageExperiment: Record an age
– A: person is 30 years old– B: person is older than 65
• Experiment: Toss a dieExperiment: Toss a die– A: observe an odd number– B: observe a number greater than 2

Note 5 of 5E
Basic ConceptsBasic Concepts
• Two events are mutually exclusivemutually exclusive if, when one event occurs, the other cannot, and vice versa.
•Experiment: Toss a dieExperiment: Toss a die–A: observe an odd number–B: observe a number greater than 2–C: observe a 6–D: observe a 3
Not Mutually Exclusive
Mutually Exclusive
B and C?B and D?

Note 5 of 5E
Basic ConceptsBasic Concepts
• An event that cannot be decomposed is called a simple eventsimple event. .
• Denoted by E with a subscript.
• Each simple event will be assigned a probability, measuring “how often” it occurs.
• The set of all simple events of an experiment is called the sample space, Ssample space, S..

Note 5 of 5E
ExampleExample• The die toss:The die toss:
• Simple events: Sample space: 11
22
33
44
55
66
E1
E2
E3
E4
E5
E6
S ={E1, E2, E3, E4, E5, E6}
SS•E1
•E6•E2
•E3
•E4
•E5

Note 5 of 5E
Basic ConceptsBasic Concepts
• An eventevent is a collection of one or more simple eventssimple events. .
•The die toss:The die toss:–A: an odd number–B: a number > 2
SS
A ={E1, E3, E5}
B ={E3, E4, E5, E6}
BBAA
•E1
•E6•E2
•E3
•E4
•E5
Note 5 of 5E
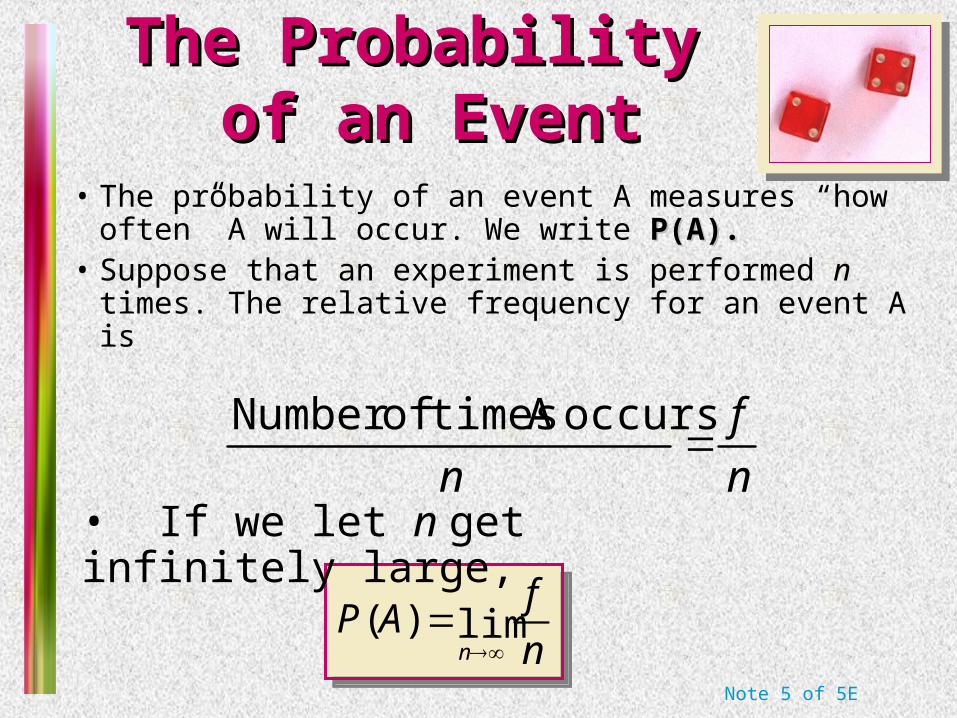
The Probability The Probability of an Eventof an Event
• The probability of an event A measures “how often” A will occur. We write P(A). P(A).
• Suppose that an experiment is performed n times. The relative frequency for an event A is
n
f
n
occurs A times ofNumber
n
fAP
nlim)(
n
fAP
nlim)(
• If we let n get infinitely large,
Note 5 of 5E
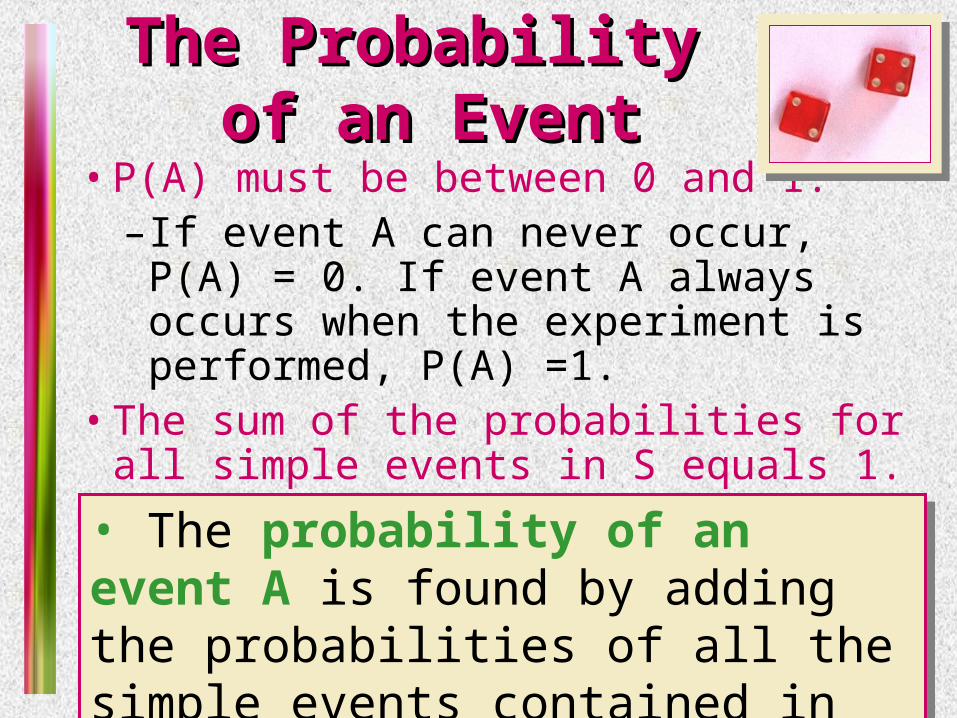
The Probability The Probability of an Eventof an Event
• P(A) must be between 0 and 1. – If event A can never occur, P(A) = 0. If
event A always occurs when the experiment is performed, P(A) =1.
• The sum of the probabilities for all simple events in S equals 1.
• The probability of an event A is found by adding the probabilities of all the simple events contained in A.
• The probability of an event A is found by adding the probabilities of all the simple events contained in A.

Note 5 of 5E
– Suppose that 10% of the U.S. population has red hair. Then for a person selected at random,
Finding ProbabilitiesFinding Probabilities
• Probabilities can be found using– Estimates from empirical studies– Common sense estimates based on
equally likely events.
P(Head) = 1/2
P(Red hair) = .10
• Examples: Examples: –Toss a fair coin.

Note 5 of 5E
Using Simple EventsUsing Simple Events
• The probability of an event A is equal to the sum of the probabilities of the simple events contained in A
• If the simple events in an experiment are equally likely, you can calculate
events simple ofnumber total
Ain events simple ofnumber )(
N
nAP A
events simple ofnumber total
Ain events simple ofnumber )(
N
nAP A

Note 5 of 5E
Example 1Example 1
Toss a fair coin twice. What is the probability of observing at least one head?
HH
1st Coin 2nd Coin Ei P(Ei)
HH
TT
TT
HH
TT
HHHH
HTHT
THTH
TTTT
1/4
1/4
1/4
1/4
P(at least 1 head)
= P(E1) + P(E2) + P(E3)
= 1/4 + 1/4 + 1/4 = 3/4
P(at least 1 head)
= P(E1) + P(E2) + P(E3)
= 1/4 + 1/4 + 1/4 = 3/4
Note 5 of 5E
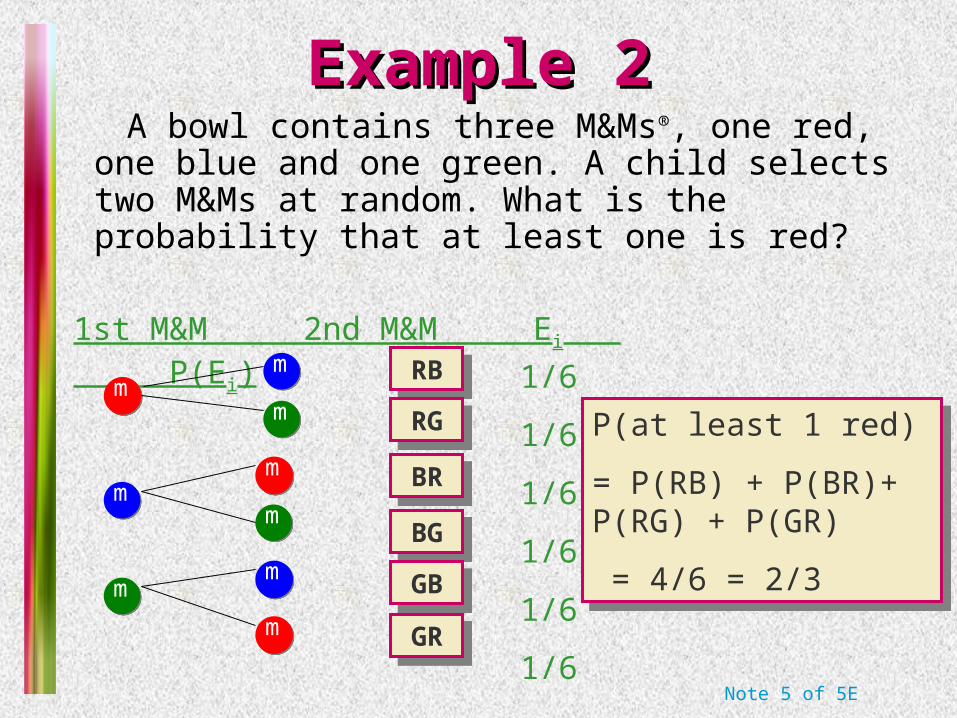
Example 2Example 2 A bowl contains three M&Ms®, one red, one blue
and one green. A child selects two M&Ms at random. What is the probability that at least one is red?
1st M&M 2nd M&M Ei P(Ei)
RBRB
RGRG
BRBR
BGBG
1/6
1/6
1/6
1/6
1/6
1/6
P(at least 1 red)
= P(RB) + P(BR)+ P(RG) + P(GR)
= 4/6 = 2/3
P(at least 1 red)
= P(RB) + P(BR)+ P(RG) + P(GR)
= 4/6 = 2/3
m
m
m
m
m
m
m
m
mGBGB
GRGR

Note 5 of 5E
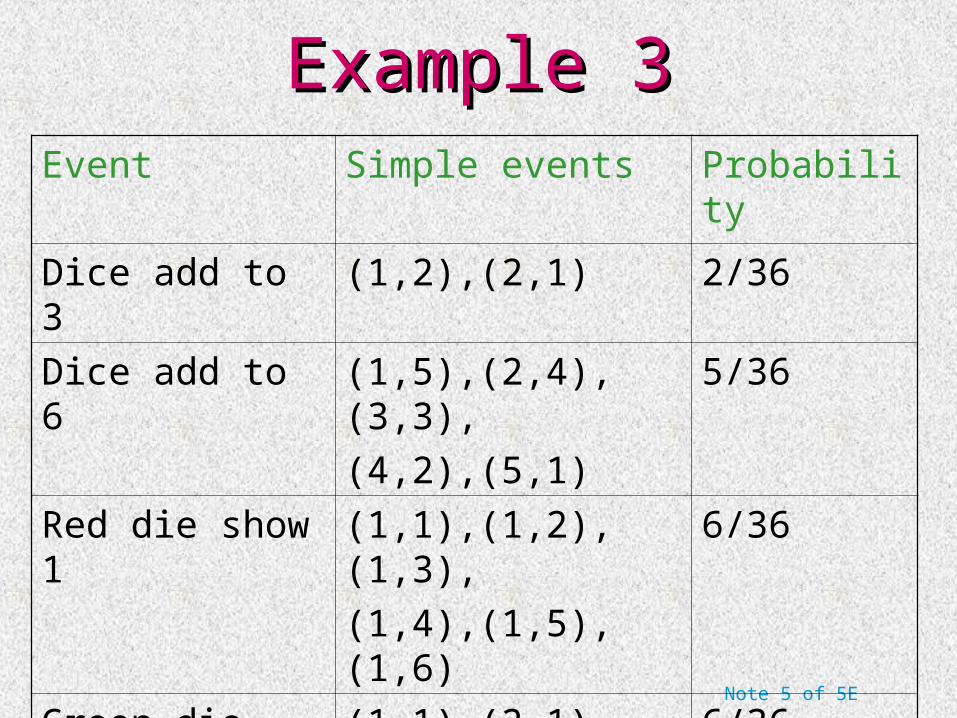
Example 3Example 3The sample space of throwing a pair of dice is
Note 5 of 5E
Example 3Example 3Event Simple events Probability
Dice add to 3 (1,2),(2,1) 2/36
Dice add to 6 (1,5),(2,4),(3,3),
(4,2),(5,1)
5/36
Red die show 1 (1,1),(1,2),(1,3),
(1,4),(1,5),(1,6)
6/36
Green die show 1 (1,1),(2,1),(3,1),
(4,1),(5,1),(6,1)
6/36

Note 5 of 5E
Counting RulesCounting Rules
• Sample space of throwing 3 dice has 216 entries, sample space of throwing 4 dice has 1296 entries, …
• At some point, we have to stop listing and start thinking …
• We need some counting rules

Note 5 of 5E
The The mn mn RuleRule• If an experiment is performed in two stages,
with m ways to accomplish the first stage and n ways to accomplish the second stage, then there are mn ways to accomplish the experiment.
• This rule is easily extended to k stages, with the number of ways equal to
n1 n2 n3 … nk
Example: Example: Toss two coins. The total number of simple events is:
2 2 = 42 2 = 4

Note 5 of 5E
ExamplesExamplesExample: Example: Toss three coins. The total number of simple events is: 2 2 2 = 82 2 2 = 8
Example: Example: Two M&Ms are drawn from a dish containing two red and two blue candies. The total number of simple events is:
6 6 = 366 6 = 36
Example: Example: Toss two dice. The total number of simple events is:
m
m
4 3 = 124 3 = 12
Example: Example: Toss three dice. The total number of simple events is:
6 6 6 = 216
6 6 6 = 216

Note 5 of 5E
PermutationsPermutations
• The number of ways you can arrange n distinct objects, taking them r at a time
is
Example: Example: How many 3-digit lock combinations can we make from the numbers 1, 2, 3, and 4?
.1!0 and )1)(2)...(2)(1(! where
)!(
!
nnnn
rn
nPn
r
24)2)(3(4!1
!443 P 24)2)(3(4
!1
!443 PThe order of the choice is
important!

Note 5 of 5E
ExamplesExamples
Example: Example: A lock consists of five parts and can be assembled in any order. A quality control engineer wants to test each order for efficiency of assembly. How many orders are there?
120)1)(2)(3)(4(5!0
!555 P 120)1)(2)(3)(4(5
!0
!555 P
The order of the choice is important!

Note 5 of 5E
CombinationsCombinations• The number of distinct combinations of n
distinct objects that can be formed, taking them r at a time is
Example: Example: Three members of a 5-person committee must be chosen to form a subcommittee. How many different subcommittees could be formed?
)!(!
!
rnr
nC n
r
101)2(
)4(5
1)2)(1)(2(3
1)2)(3)(4(5
)!35(!3
!553
C 10
1)2(
)4(5
1)2)(1)(2(3
1)2)(3)(4(5
)!35(!3
!553
CThe order of
the choice is not important!
Note 5 of 5E
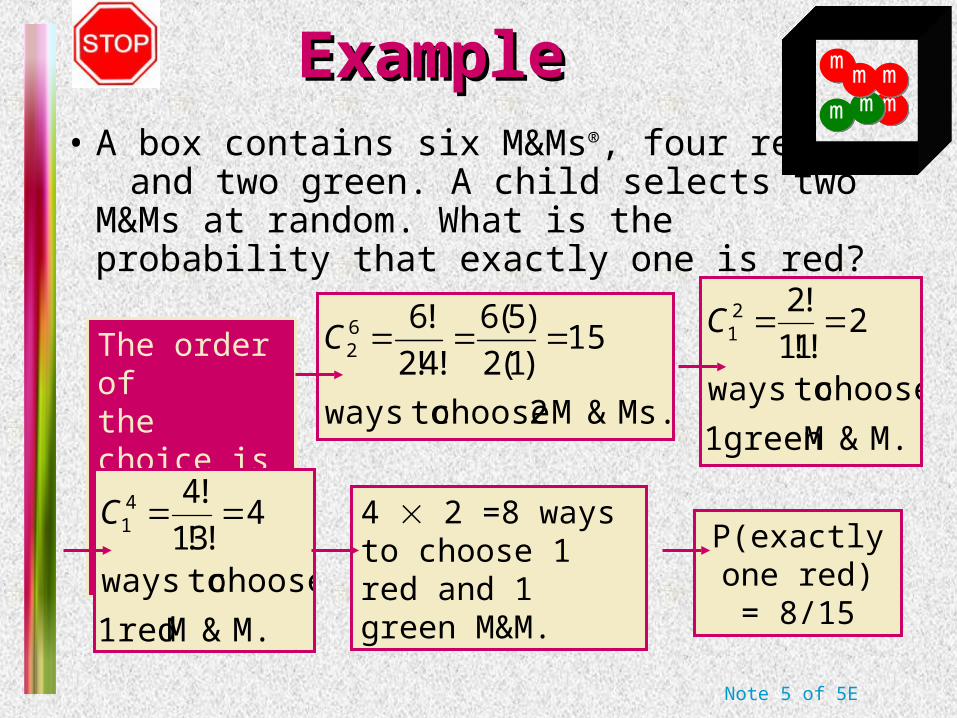
ExampleExample• A box contains six M&Ms®, four red and two green. A child selects two M&Ms at
random. What is the probability that exactly one is red?
The order of the choice is not important!
m
m
mmm m
Ms.&M 2 choose toways
15)1(2
)5(6
!4!2
!662 C
M.&Mgreen 1
choose toways
2!1!1
!221 C
M.&M red 1
choose toways
4!3!1
!441 C 4 2 =8 ways to
choose 1 red and 1 green M&M.
P(exactly one red) = 8/15
Note 5 of 5E
ExampleExample
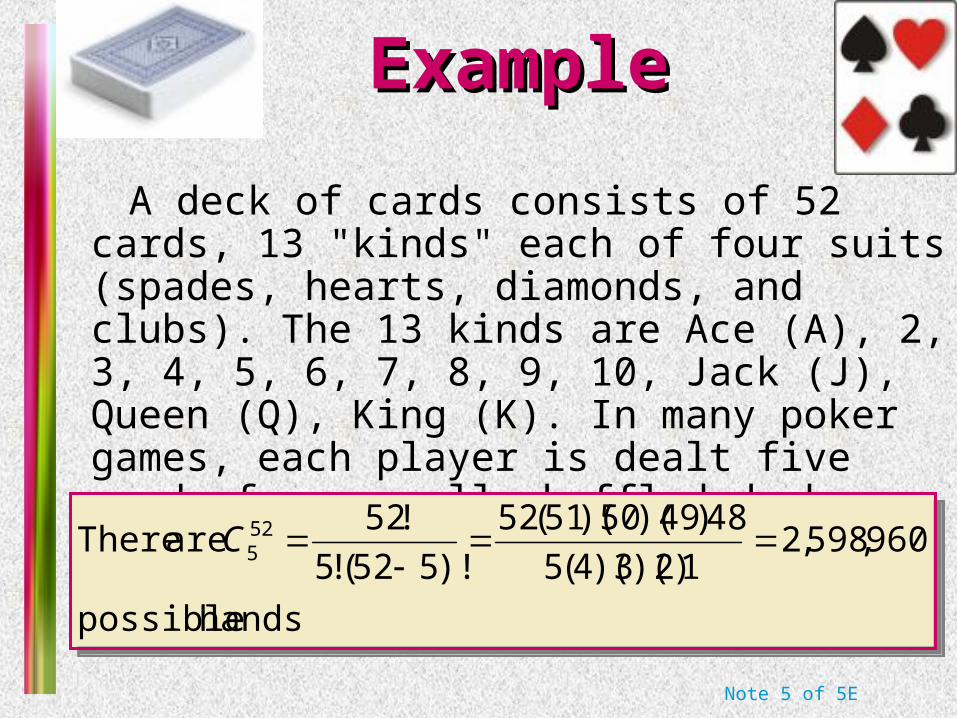
A deck of cards consists of 52 cards, 13 "kinds" each of four suits (spades, hearts, diamonds, and clubs). The 13 kinds are Ace (A), 2, 3, 4, 5, 6, 7, 8, 9, 10, Jack (J), Queen (Q), King (K). In many poker games, each player is dealt five cards from a well shuffled deck.
hands possible
960,598,21)2)(3)(4(5
48)49)(50)(51(52
)!552(!5
!52 are There 52
5
C
hands possible
960,598,21)2)(3)(4(5
48)49)(50)(51(52
)!552(!5
!52 are There 52
5
C

Note 5 of 5E
ExampleExample
Four of a kind: 4 of the 5 cards are the same “kind”. What is the probability of getting four of a kind in a five card hand?
and
There are 13 possible choices for the kind of which to have four, and 52-4=48 choices for the fifth card. Once the kind has been specified, the four are completely determined: you need all four cards of that kind. Thus there are 13×48=624 ways to get four of a kind.
The probability=624/2598960=.000240096

Note 5 of 5E
ExampleExample One pair: two of the cards are of one kind,
the other three are of three different kinds. What is the probability of getting one pair
in a five card hand?
kind that of cardsfour theof
twoof choices possible 6 are there
choice, given the pair; a have which toof
kind for the choices possible 13 are There
42 C
kind that of cardsfour theof
twoof choices possible 6 are there
choice, given the pair; a have which toof
kind for the choices possible 13 are There
42 C
Note 5 of 5E
ExampleExample
There are 12 kinds remaining from which to select the other three cards in the hand. We must insist that the kinds be different from each other and from the kind of which we have a pair, or we could end up with a second pair, three or four of a kind, or a full house.

Note 5 of 5E
ExampleExample
422569.
989601098240/25 y probabilit The
1,098,240. 64220613
is hands pair" one" ofnumber theTherefore
three.all of suits for the choices 64 4 of
totala cards, three thoseofeach ofsuit for the
choices 4 are There cards. threeremaining the
of kinds pick the to ways220 are There
3
123
C
422569.
989601098240/25 y probabilit The
1,098,240. 64220613
is hands pair" one" ofnumber theTherefore
three.all of suits for the choices 64 4 of
totala cards, three thoseofeach ofsuit for the
choices 4 are There cards. threeremaining the
of kinds pick the to ways220 are There
3
123
C

Note 5 of 5E
S
Event RelationsEvent Relations The beauty of using events, rather than simple events, is
that we can combine events to make other events using logical operations: and, or and not.
The unionunion of two events, A and B, is the event that either A or B or bothor both occur when the experiment is performed. We write
A B
A BBA
Note 5 of 5E
S
A B
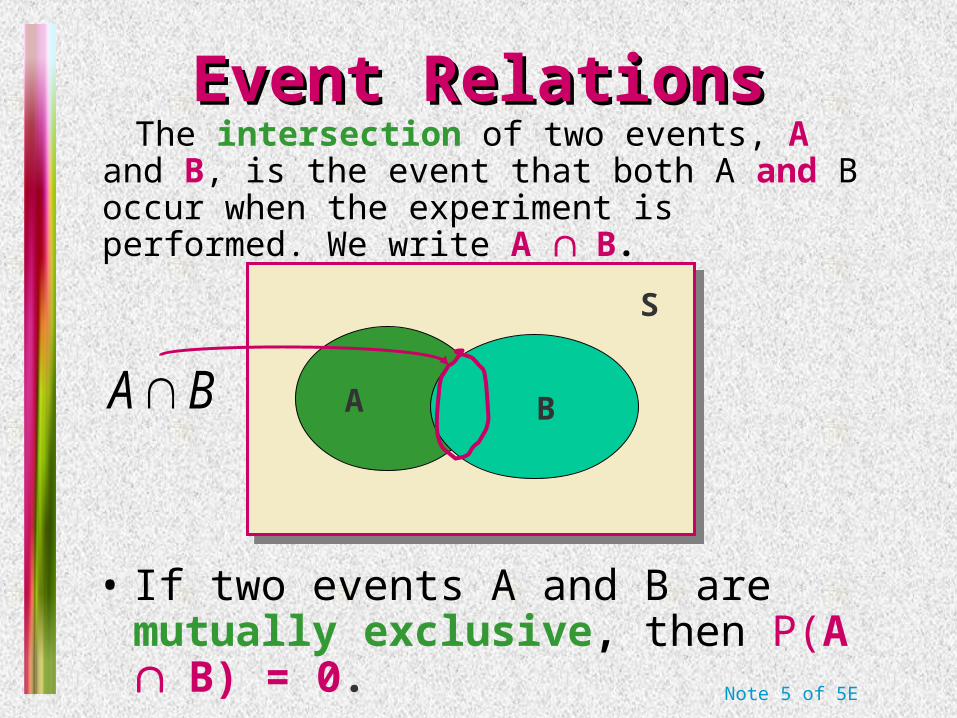
Event RelationsEvent Relations The intersection of two events, A and B, is
the event that both A and B occur when the experiment is performed. We write A B.
BA
• If two events A and B are mutually exclusive, then P(A B) = 0.
Note 5 of 5E
SS
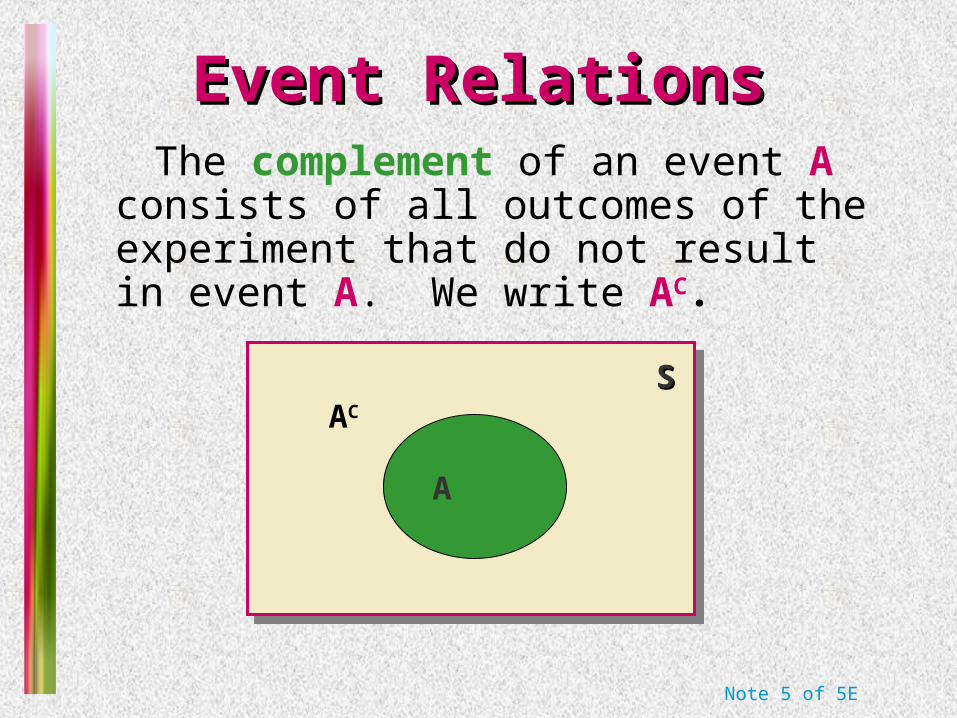
Event RelationsEvent Relations The complement of an event A consists of
all outcomes of the experiment that do not result in event A. We write AC.
A
AC
Note 5 of 5E
ExampleExample
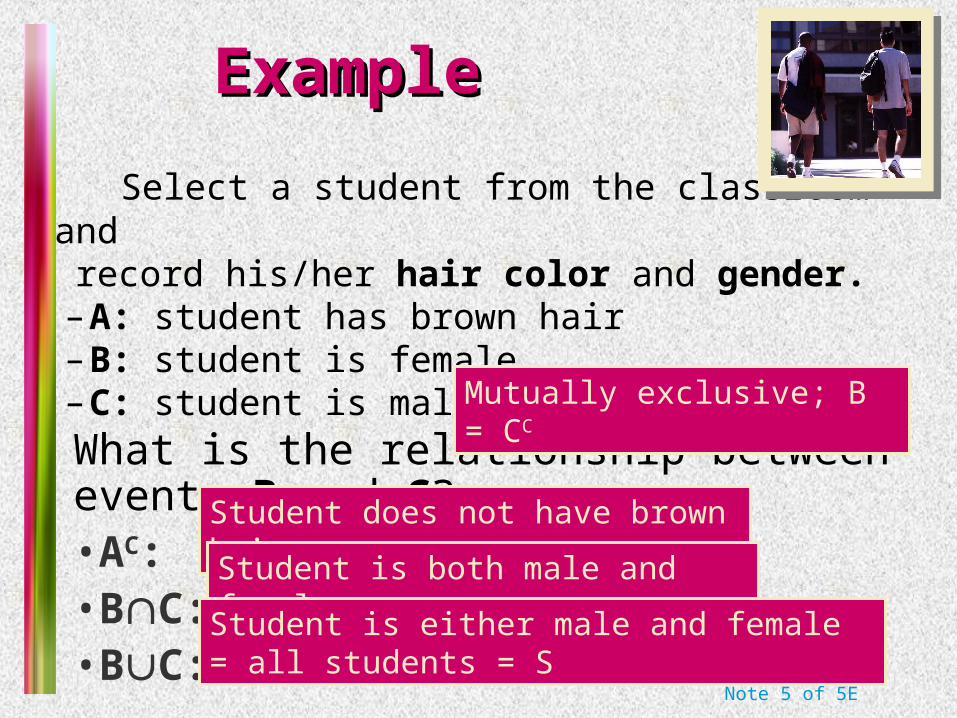
Select a student from the classroom and record his/her hair color and gender.– A: student has brown hair– B: student is female– C: student is maleWhat is the relationship between events B and C?•AC: •BC: •BC:
Mutually exclusive; B = CC
Student does not have brown hair
Student is both male and female =
Student is either male and female = all students = S
Note 5 of 5E
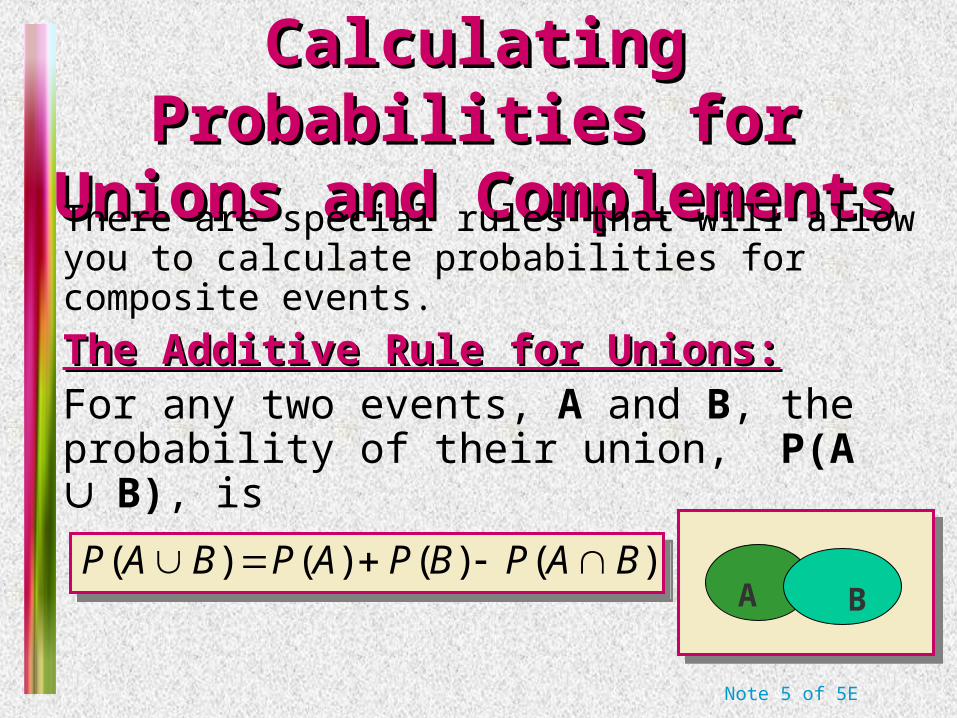
Calculating Probabilities for Calculating Probabilities for Unions and ComplementsUnions and Complements
• There are special rules that will allow you to calculate probabilities for composite events.
• The Additive Rule for Unions:The Additive Rule for Unions: • For any two events, A and B, the probability
of their union, P(A B), is
)()()()( BAPBPAPBAP )()()()( BAPBPAPBAP A B
Note 5 of 5E
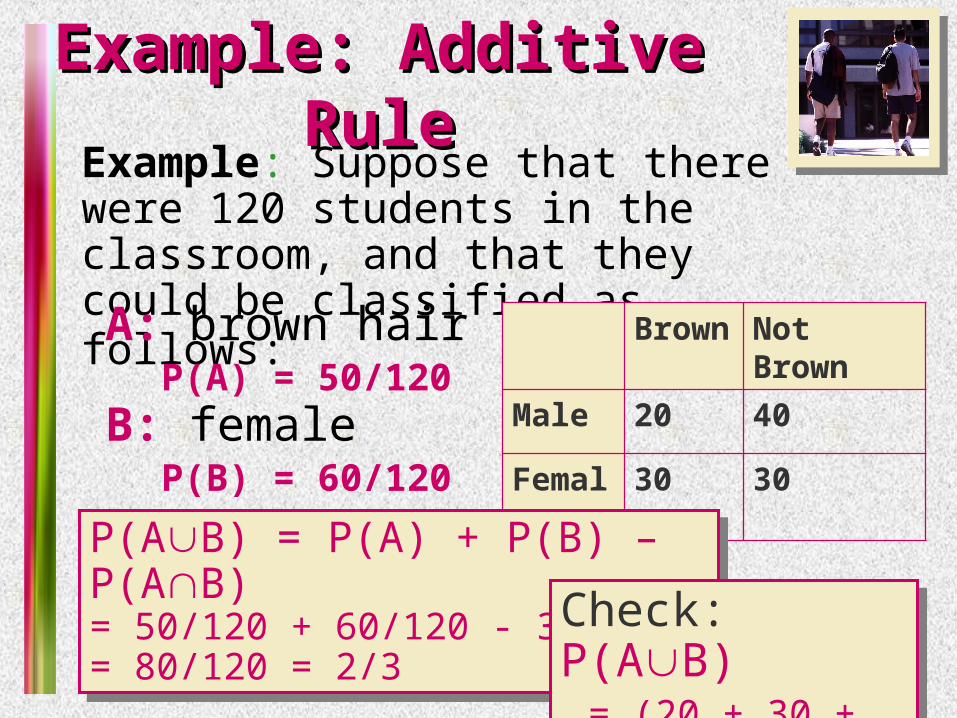
Example: Additive RuleExample: Additive RuleExample: Suppose that there were 120 students in the classroom, and that they could be classified as follows:
Brown Not Brown
Male 20 40
Female 30 30
A: brown hair P(A) = 50/120B: female P(B) = 60/120
P(AB) = P(A) + P(B) – P(AB)= 50/120 + 60/120 - 30/120 = 80/120 = 2/3
P(AB) = P(A) + P(B) – P(AB)= 50/120 + 60/120 - 30/120 = 80/120 = 2/3 Check: P(AB)
= (20 + 30 + 30)/120
Check: P(AB) = (20 + 30 + 30)/120
Note 5 of 5E
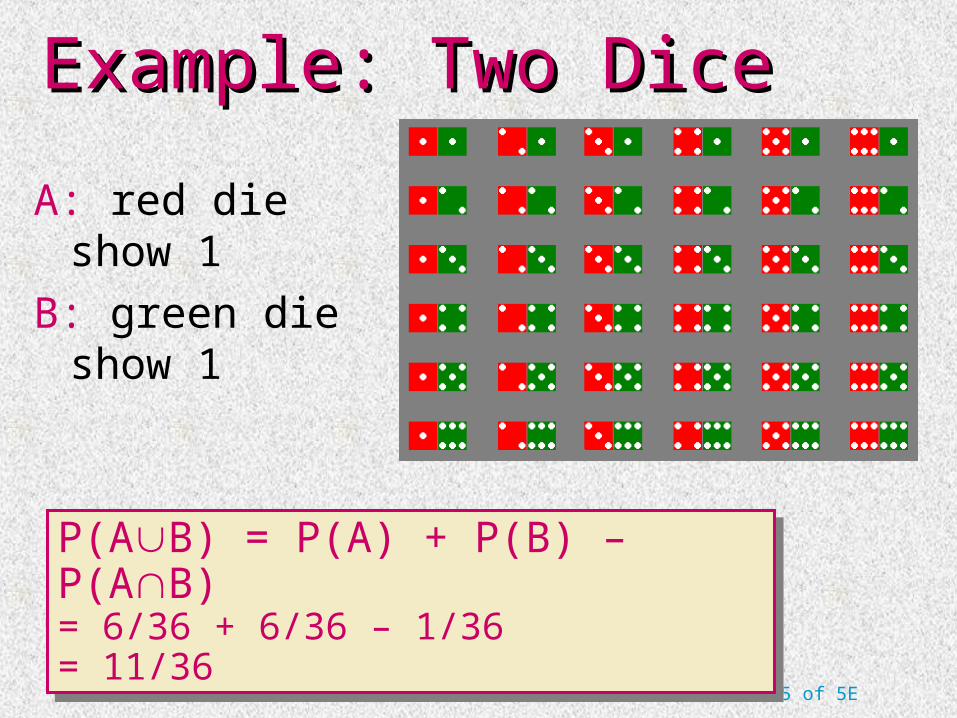
Example: Two DiceExample: Two Dice
A: red die show 1
B: green die show 1
P(AB) = P(A) + P(B) – P(AB)= 6/36 + 6/36 – 1/36= 11/36
P(AB) = P(A) + P(B) – P(AB)= 6/36 + 6/36 – 1/36= 11/36

Note 5 of 5E
A Special CaseA Special CaseWhen two events A and B are mutually exclusivemutually exclusive, , P(AB) = 0 and P(AB) = P(A) + P(B).
Brown Not Brown
Male 20 40
Female 30 30
A: male with brown hairP(A) = 20/120
B: female with brown hairP(B) = 30/120
P(AB) = P(A) + P(B)= 20/120 + 30/120= 50/120
P(AB) = P(A) + P(B)= 20/120 + 30/120= 50/120
A and B are mutually exclusive, so that

Note 5 of 5E
Example: Two DiceExample: Two Dice
A: dice add to 3
B: dice add to 6
A and B are mutually exclusive, so that
P(AB) = P(A) + P(B)= 2/36 + 5/36= 7/36
P(AB) = P(A) + P(B)= 2/36 + 5/36= 7/36
Note 5 of 5E
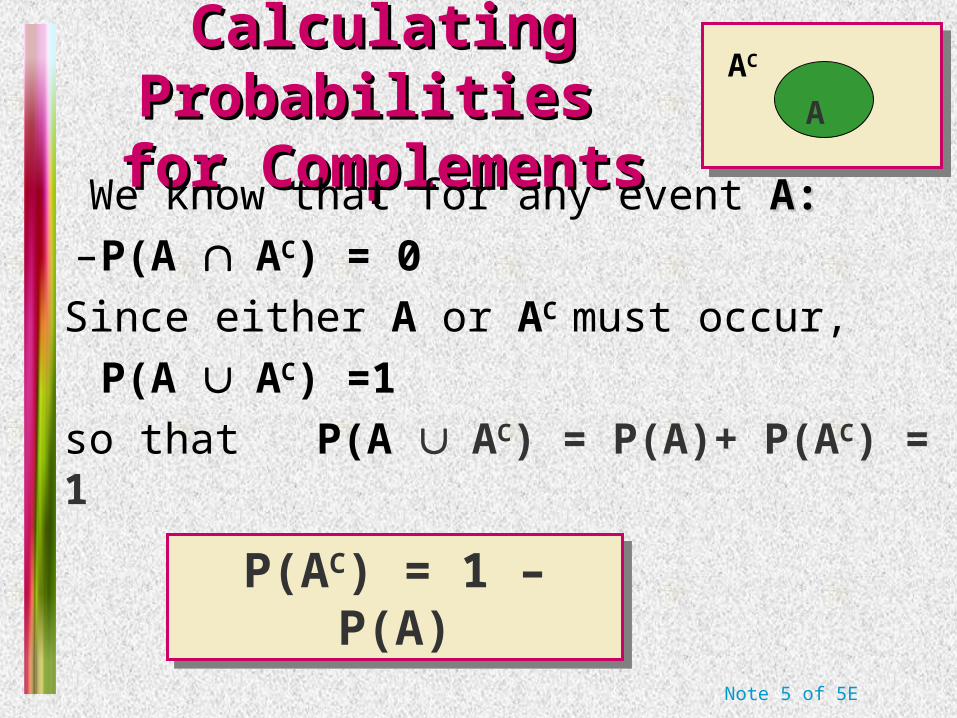
Calculating Probabilities Calculating Probabilities for Complementsfor Complements
• We know that for any event A:A:
– P(A AC) = 0
• Since either A or AC must occur,
P(A AC) =1
• so that P(A AC) = P(A)+ P(AC) = 1
P(AC) = 1 – P(A)P(AC) = 1 – P(A)
A
AC

Note 5 of 5E
ExampleExample
Brown Not Brown
Male 20 40
Female 30 30
A: male P(A) = 60/120
B: female P(B) = ?
P(B) = 1- P(A)= 1- 60/120 = 60/120P(B) = 1- P(A)= 1- 60/120 = 60/120
A and B are complementary, so that
Select a student at random from the classroom. Define:

Note 5 of 5E
Calculating Probabilities for Calculating Probabilities for IntersectionsIntersections
In the previous example, we found P(A B) directly from the table. Sometimes this is impractical or impossible. The rule for calculating P(A B) depends on the idea of independent independent and dependent eventsand dependent events..
Two events, A and B, are said to be independentindependent if the occurrence or nonoccurrence of one of the events does not change the probability of the occurrence of the other event.
Two events, A and B, are said to be independentindependent if the occurrence or nonoccurrence of one of the events does not change the probability of the occurrence of the other event.
Note 5 of 5E
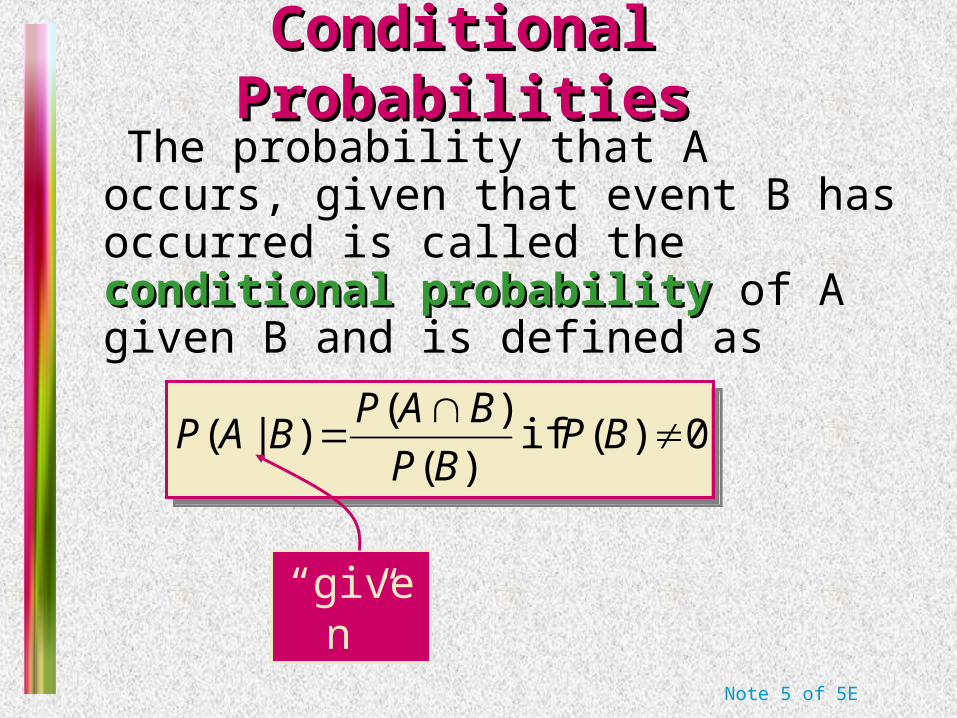
Conditional ProbabilitiesConditional Probabilities
The probability that A occurs, given that event B has occurred is called the conditional probabilityconditional probability of A given B and is defined as
0)( if )(
)()|(
BP
BP
BAPBAP 0)( if
)(
)()|(
BP
BP
BAPBAP
“given”

Note 5 of 5E
Example 1Example 1 Toss a fair coin twice. Define
– A: head on second toss– B: head on first toss
HTHT
THTH
TTTT
1/4
1/4
1/4
1/4
P(A|B) = ½
P(A|not B) = ½
P(A|B) = ½
P(A|not B) = ½ HHHH
P(A) does not change, whether B happens or not…
A and B are independent!
Note 5 of 5E
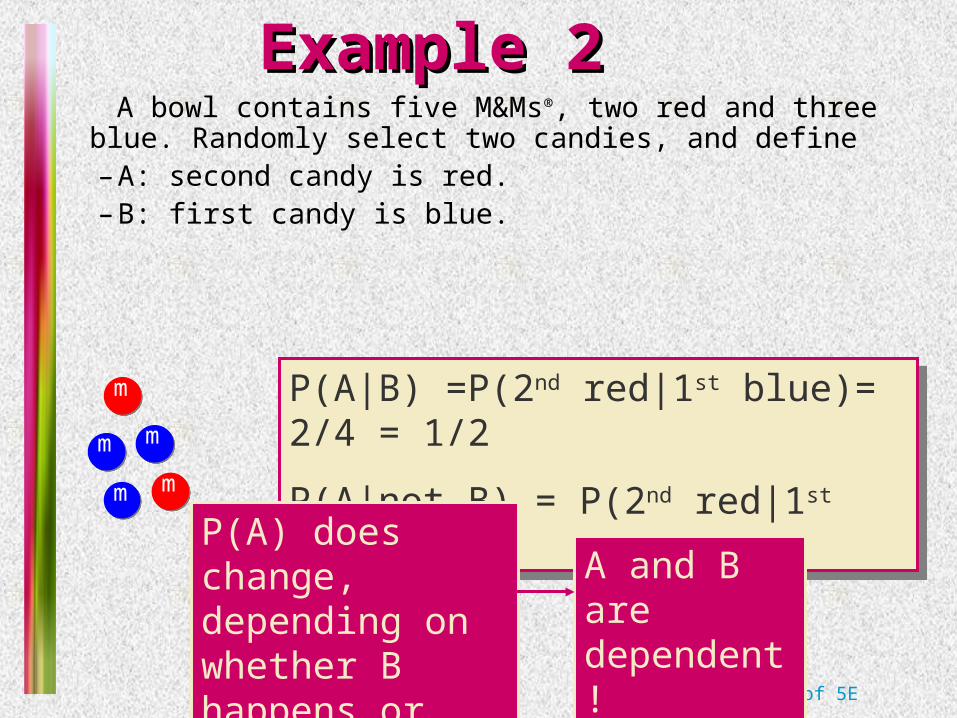
Example 2Example 2 A bowl contains five M&Ms®, two red and three blue.
Randomly select two candies, and define– A: second candy is red.– B: first candy is blue.
m
m
m
m
m
P(A|B) =P(2nd red|1st blue)= 2/4 = 1/2
P(A|not B) = P(2nd red|1st red) = 1/4
P(A|B) =P(2nd red|1st blue)= 2/4 = 1/2
P(A|not B) = P(2nd red|1st red) = 1/4
P(A) does change, depending on whether B happens or not…
A and B are dependent!

Note 5 of 5E
Example 3: Two DiceExample 3: Two Dice Toss a pair of fair dice. Define
– A: red die show 1– B: green die show 1
P(A|B) = P(A and B)/P(B)
=1/36/1/6=1/6=P(A)
P(A|B) = P(A and B)/P(B)
=1/36/1/6=1/6=P(A)
P(A) does not change, whether B happens or not…
A and B are independent!

Note 5 of 5E
Example 3: Two DiceExample 3: Two DiceToss a pair of fair dice. Define
– A: add to 3– B: add to 6
P(A|B) = P(A and B)/P(B)
=0/36/5/6=0
P(A|B) = P(A and B)/P(B)
=0/36/5/6=0
P(A) does change when B happens
A and B are dependent! In fact, when B happens, A can’t
Note 5 of 5E
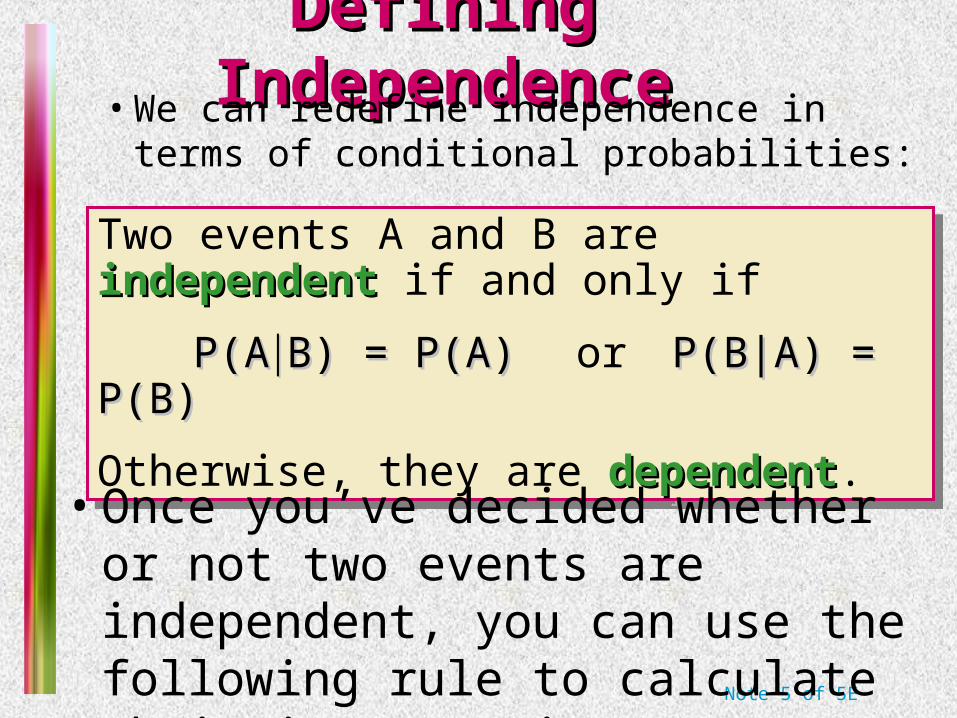
Defining IndependenceDefining Independence• We can redefine independence in terms
of conditional probabilities:
Two events A and B are independentindependent if and only if
P(AP(AB) = P(A)B) = P(A) or P(B|A) = P(B)P(B|A) = P(B)
Otherwise, they are dependentdependent.
Two events A and B are independentindependent if and only if
P(AP(AB) = P(A)B) = P(A) or P(B|A) = P(B)P(B|A) = P(B)
Otherwise, they are dependentdependent.
• Once you’ve decided whether or not two events are independent, you can use the following rule to calculate their intersection.

Note 5 of 5E
The Multiplicative Rule for The Multiplicative Rule for IntersectionsIntersections
• For any two events, A and B, the probability that both A and B occur is
P(A B) = P(A) P(B given that A occurred) = P(A)P(B|A)P(A B) = P(A) P(B given that A occurred) = P(A)P(B|A)
• If the events A and B are independent, then the probability that both A and B occur is
P(A B) = P(A) P(B) P(A B) = P(A) P(B)
Note 5 of 5E
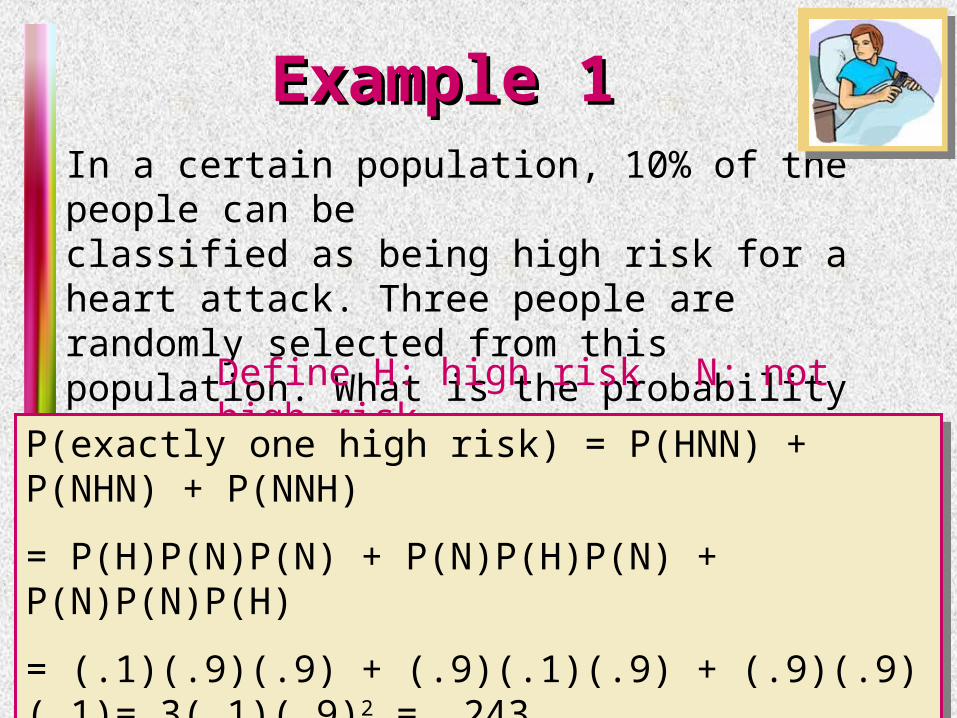
Example 1Example 1In a certain population, 10% of the people can be classified as being high risk for a heart attack. Three people are randomly selected from this population. What is the probability that exactly one of the three are high risk?
Define H: high risk N: not high risk
P(exactly one high risk) = P(HNN) + P(NHN) + P(NNH)
= P(H)P(N)P(N) + P(N)P(H)P(N) + P(N)P(N)P(H)
= (.1)(.9)(.9) + (.9)(.1)(.9) + (.9)(.9)(.1)= 3(.1)(.9)2 = .243
P(exactly one high risk) = P(HNN) + P(NHN) + P(NNH)
= P(H)P(N)P(N) + P(N)P(H)P(N) + P(N)P(N)P(H)
= (.1)(.9)(.9) + (.9)(.1)(.9) + (.9)(.9)(.1)= 3(.1)(.9)2 = .243

Note 5 of 5E
Example 2Example 2Suppose we have additional information in the previous example. We know that only 49% of the population are female. Also, of the female patients, 8% are high risk. A single person is selected at random. What is the probability that it is a high risk female?
Define H: high risk F: female
From the example, P(F) = .49 and P(H|F) = .08. Use the Multiplicative Rule:
P(high risk female) = P(HF)
= P(F)P(H|F) =.49(.08) = .0392
From the example, P(F) = .49 and P(H|F) = .08. Use the Multiplicative Rule:
P(high risk female) = P(HF)
= P(F)P(H|F) =.49(.08) = .0392
Note 5 of 5E
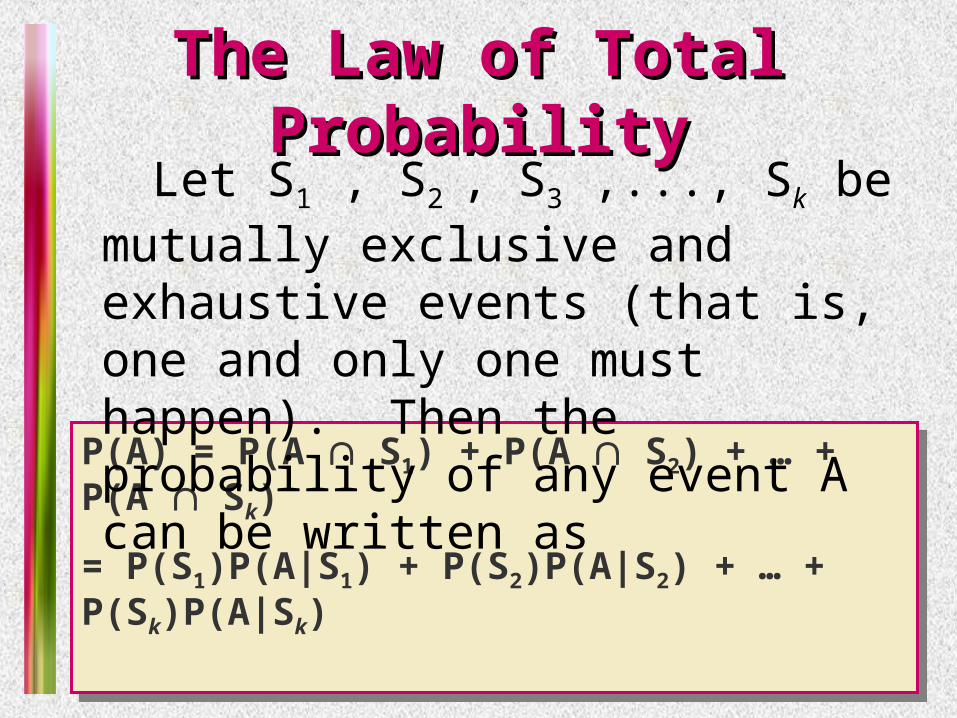
The Law of Total ProbabilityThe Law of Total Probability
P(A) = P(A S1) + P(A S2) + … + P(A Sk)
= P(S1)P(A|S1) + P(S2)P(A|S2) + … + P(Sk)P(A|Sk)
P(A) = P(A S1) + P(A S2) + … + P(A Sk)
= P(S1)P(A|S1) + P(S2)P(A|S2) + … + P(Sk)P(A|Sk)
Let S1 , S2 , S3 ,..., Sk be mutually exclusive and exhaustive events (that is, one and only one must happen). Then the probability of any event A can be written as

Note 5 of 5E
The Law of Total ProbabilityThe Law of Total Probability
AA Sk
A S1
S2….
S1
Sk
P(A) = P(A S1) + P(A S2) + … + P(A Sk)
= P(S1)P(A|S1) + P(S2)P(A|S2) + … + P(Sk)P(A|Sk)
P(A) = P(A S1) + P(A S2) + … + P(A Sk)
= P(S1)P(A|S1) + P(S2)P(A|S2) + … + P(Sk)P(A|Sk)

Note 5 of 5E
Bayes’ RuleBayes’ Rule Let S1 , S2 , S3 ,..., Sk be mutually exclusive and
exhaustive events with prior probabilities P(S1), P(S2),…,P(Sk). If an event A occurs, the posterior probability of Si, given that A occurred is
,...k, i SAPSP
SAPSPASP
ii
iii 21for
)|()(
)|()()|(
,...k, i
SAPSP
SAPSPASP
ii
iii 21for
)|()(
)|()()|(
)|()(
)|()(
)(
)()|(
)|()()()(
)()|(
Proof
ii
iiii
iiii
ii
SAPSP
SAPSP
AP
ASPASP
SAPSPASPSP
ASPSAP
)|()(
)|()(
)(
)()|(
)|()()()(
)()|(
Proof
ii
iiii
iiii
ii
SAPSP
SAPSP
AP
ASPASP
SAPSPASPSP
ASPSAP

Note 5 of 5E
We know:P(F) = P(M) = P(H|F) = P(H|M) =
We know:P(F) = P(M) = P(H|F) = P(H|M) =
ExampleExampleFrom a previous example, we know that 49% of the population are female. Of the female patients, 8% are high risk for heart attack, while 12% of the male patients are high risk. A single person is selected at random and found to be high risk. What is the probability that it is a male? Define H: high risk F: female M: male
61.)08(.49.)12(.51.
)12(.51.
)|()()|()()|()(
)|(
FHPFPMHPMP
MHPMPHMP
61.)08(.49.)12(.51.
)12(.51.
)|()()|()()|()(
)|(
FHPFPMHPMP
MHPMPHMP
.12
.08
.51
.49

Note 5 of 5E
ExampleExample Suppose a rare disease infects one out of
every 1000 people in a population. And suppose that there is a good, but not perfect, test for this disease: if a person has the disease, the test comes back positive 99% of the time. On the other hand, the test also produces some false positives: 2% of uninfected people are also test positive. And someone just tested positive. What are his chances of having this disease?

Note 5 of 5E
We know:P(A) = .001 P(Ac) =.999 P(B|A) = .99 P(B|Ac) =.02
We know:P(A) = .001 P(Ac) =.999 P(B|A) = .99 P(B|Ac) =.02
ExampleExampleDefine A: has the disease B: test positive
0472.02. 999.99.001.
99.001.
)|()()|()(
)|()()|(
cABPcAPABPAP
ABPAPBAP
0472.02. 999.99.001.
99.001.
)|()()|()(
)|()()|(
cABPcAPABPAP
ABPAPBAP
We want to know P(A|B)=?
Note 5 of 5E
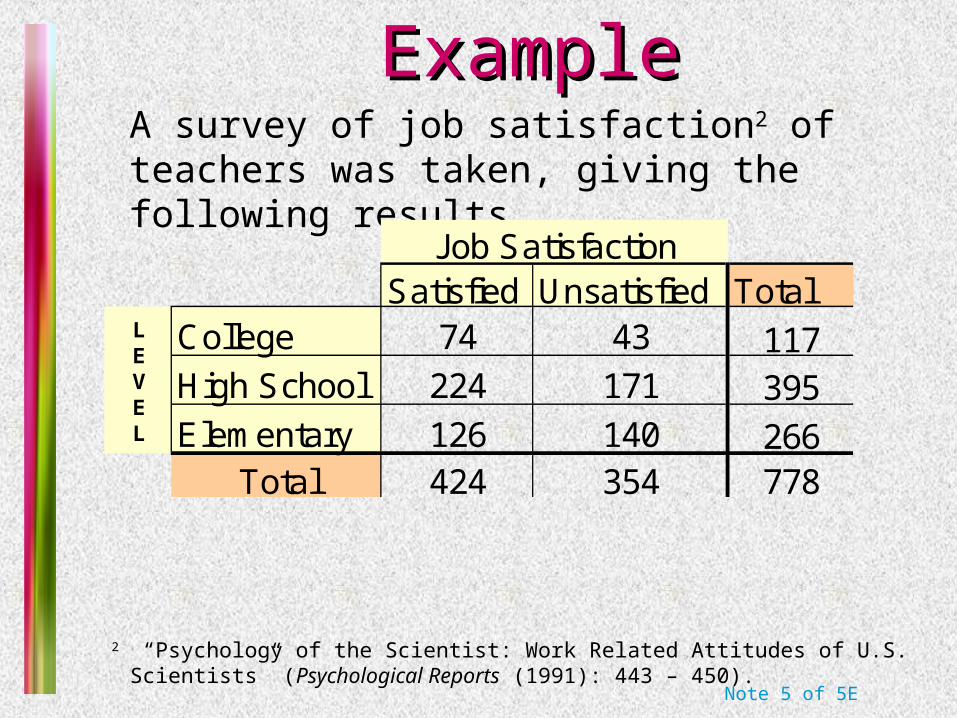
ExampleExampleA survey of job satisfaction2 of teachers was taken, giving the following results
2 “Psychology of the Scientist: Work Related Attitudes of U.S. Scientists” (Psychological Reports (1991): 443 – 450).
Satisfied Unsatisfied TotalCollege 74 43 117High School 224 171 395Elementary 126 140 266
Total 424 354 778
Job Satisfaction
LEVEL
Note 5 of 5E
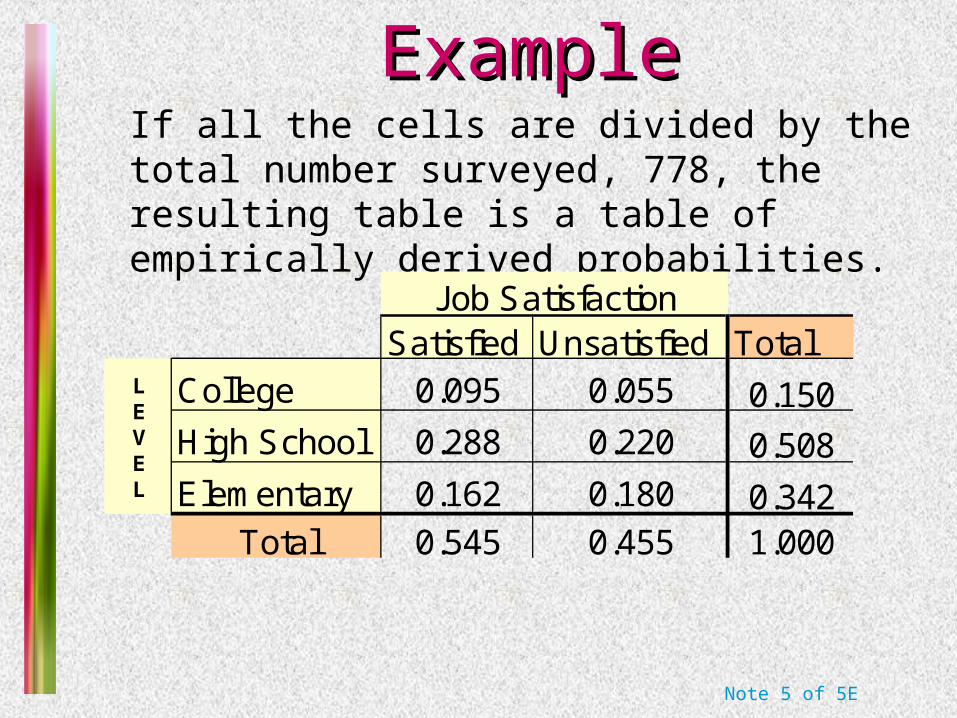
ExampleExampleIf all the cells are divided by the total number surveyed, 778, the resulting table is a table of empirically derived probabilities.
Satisfied Unsatisfied TotalCollege 0.095 0.055 0.150High School 0.288 0.220 0.508
Elementary 0.162 0.180 0.342Total 0.545 0.455 1.000
LEVEL
Job Satisfaction
Note 5 of 5E
ExampleExample
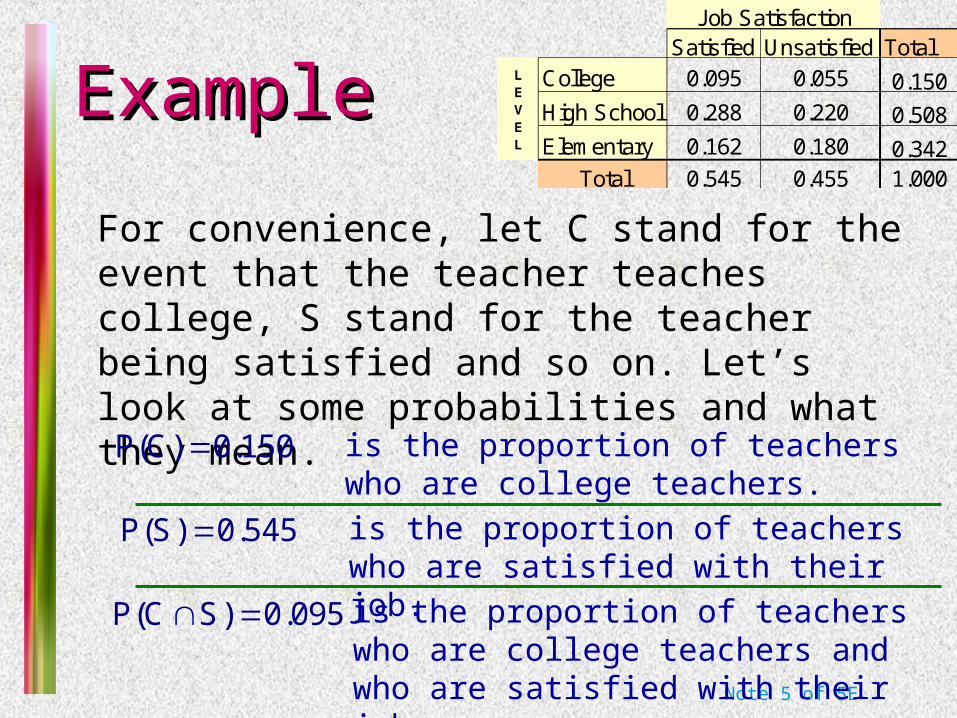
For convenience, let C stand for the event that the teacher teaches college, S stand for the teacher being satisfied and so on. Let’s look at some probabilities and what they mean.
is the proportion of teachers who are college teachers.
P(C) 0.150
is the proportion of teachers who are satisfied with their job.
P(S) 0.545
is the proportion of teachers who are college teachers and who are satisfied with their job.
P(C S) 0.095
Satisfied Unsatisfied TotalCollege 0.095 0.055 0.150High School 0.288 0.220 0.508
Elementary 0.162 0.180 0.342Total 0.545 0.455 1.000
LEVEL
Job Satisfaction
Note 5 of 5E
ExampleExample
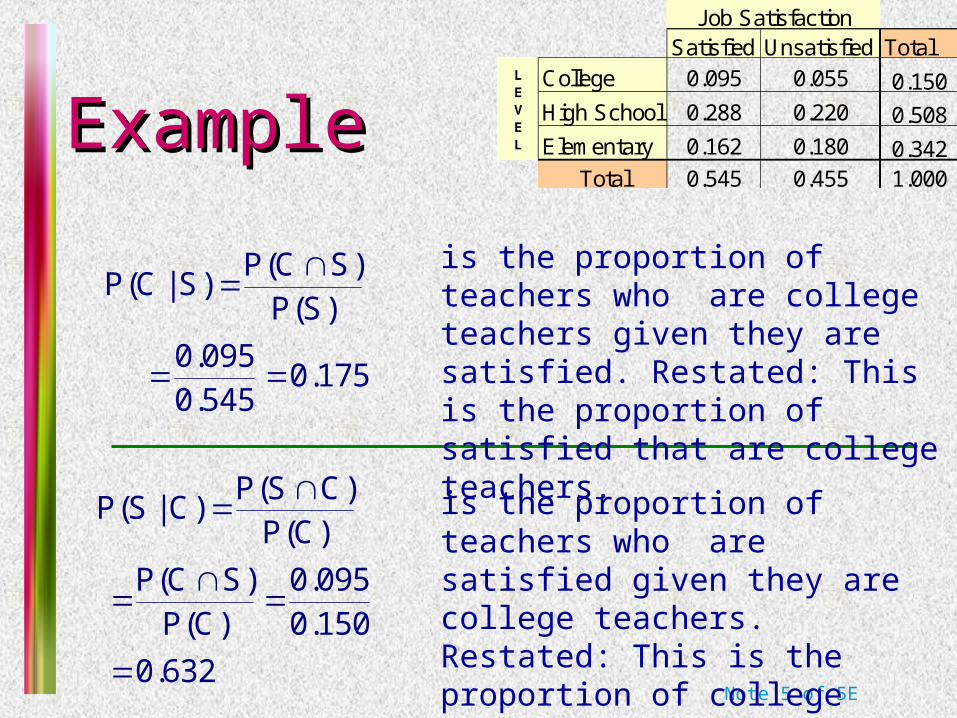
is the proportion of teachers who are college teachers given they are satisfied. Restated: This is the proportion of satisfied that are college teachers.
P(C S)P(C | S)
P(S)
0.0950.175
0.545
is the proportion of teachers who are satisfied given they are college teachers. Restated: This is the proportion of college teachers that are satisfied.
P(S C)P(S | C)
P(C)
P(C S) 0.095P(C) 0.150
0.632
Satisfied Unsatisfied TotalCollege 0.095 0.055 0.150High School 0.288 0.220 0.508
Elementary 0.162 0.180 0.342Total 0.545 0.455 1.000
LEVEL
Job Satisfaction
Note 5 of 5E
ExampleExample
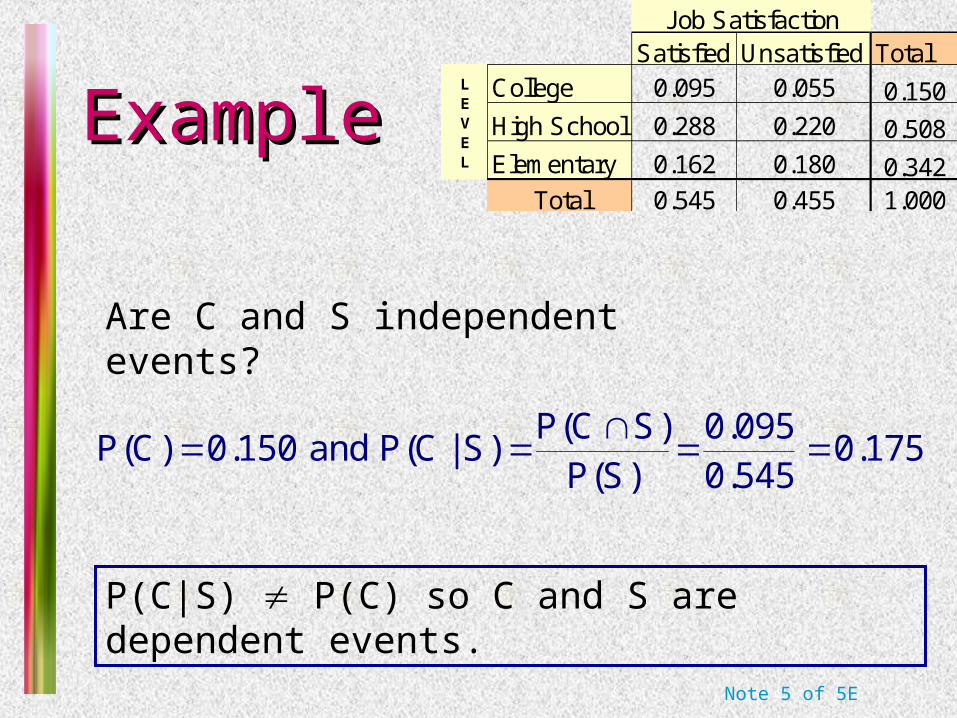
P(C S) 0.095P(C) 0.150 and P(C | S) 0.175
P(S) 0.545
Satisfied Unsatisfied TotalCollege 0.095 0.055 0.150High School 0.288 0.220 0.508
Elementary 0.162 0.180 0.342Total 0.545 0.455 1.000
LEVEL
Job Satisfaction
P(C|S) P(C) so C and S are dependent events.
Are C and S independent events?
Note 5 of 5E
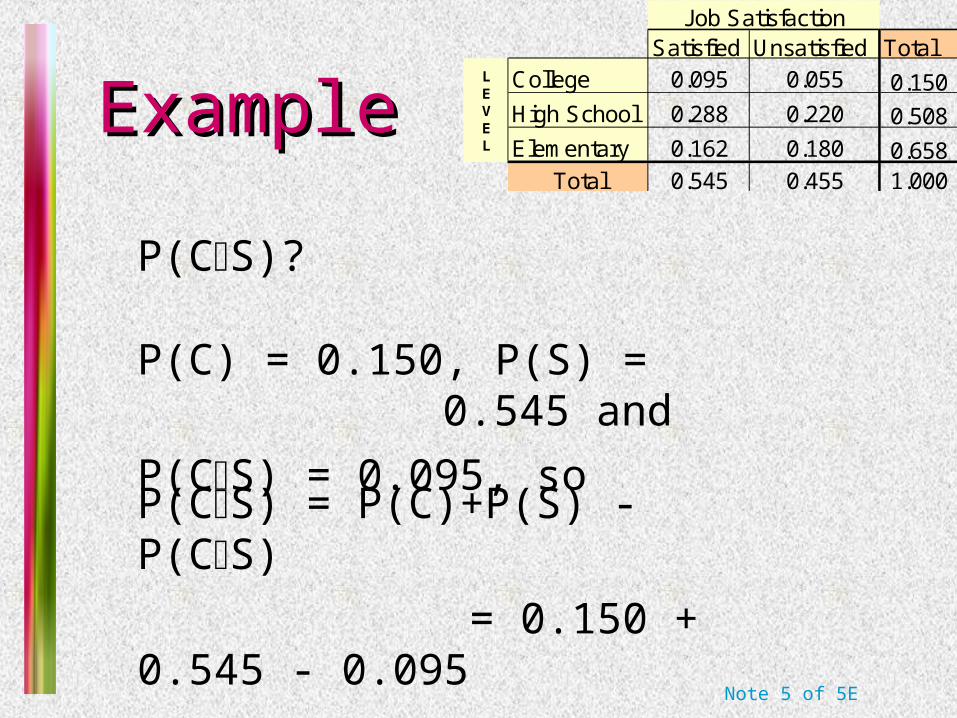
ExampleExampleSatisfied Unsatisfied Total
College 0.095 0.055 0.150High School 0.288 0.220 0.508
Elementary 0.162 0.180 0.658Total 0.545 0.455 1.000
LEVEL
Job Satisfaction
P(C) = 0.150, P(S) = 0.545 and
P(CS) = 0.095, so
P(CS) = P(C)+P(S) - P(CS)
= 0.150 + 0.545 - 0.095
= 0.600
P(CS)?
Note 5 of 5E
Tom and Dick are going to take
a driver's test at the nearest DMV office. Tom estimates that his chances to pass the test are 70% and Dick estimates his as 80%. Tom and Dick take their tests independently.
Define D = {Dick passes the driving test}
T = {Tom passes the driving test}
T and D are independent.
P (T) = 0.7, P (D) = 0.8
ExampleExample

Note 5 of 5E
What is the probability that at most one of the two friends will pass the test?
ExampleExample
P(At most one person pass)
= P(Dc Tc) + P(Dc T) + P(D Tc)
= (1 - 0.8) (1 – 0.7) + (0.7) (1 – 0.8) + (0.8) (1 – 0.7)
= .44
P(At most one person pass)
= P(Dc Tc) + P(Dc T) + P(D Tc)
= (1 - 0.8) (1 – 0.7) + (0.7) (1 – 0.8) + (0.8) (1 – 0.7)
= .44
P(At most one person pass)
= 1-P(both pass) = 1- 0.8 x 0.7 = .44
P(At most one person pass)
= 1-P(both pass) = 1- 0.8 x 0.7 = .44

Note 5 of 5E
What is the probability that at least one of the two friends will pass the test?
ExampleExample
P(At least one person pass)
= P(D T)
= 0.8 + 0.7 - 0.8 x 0.7
= .94
P(At least one person pass)
= P(D T)
= 0.8 + 0.7 - 0.8 x 0.7
= .94
P(At least one person pass)
= 1-P(neither passes) = 1- (1-0.8) x (1-0.7) = .94
P(At least one person pass)
= 1-P(neither passes) = 1- (1-0.8) x (1-0.7) = .94

Note 5 of 5E
Suppose we know that only one of the two friends passed the test. What is the probability that it was Dick?
ExampleExample
P(D | exactly one person passed)
= P(D exactly one person passed) / P(exactly one person passed)
= P(D Tc) / (P(D Tc) + P(Dc T) )
= 0.8 x (1-0.7)/(0.8 x (1-0.7)+(1-.8) x 0.7)
= .63
P(D | exactly one person passed)
= P(D exactly one person passed) / P(exactly one person passed)
= P(D Tc) / (P(D Tc) + P(Dc T) )
= 0.8 x (1-0.7)/(0.8 x (1-0.7)+(1-.8) x 0.7)
= .63

Note 5 of 5E
Random VariablesRandom Variables• A quantitative variable x is a random variablerandom variable if
the value that it assumes, corresponding to the outcome of an experiment is a chance or random event.
• Random variables can be discretediscrete or continuouscontinuous..
• Examples: Examples: x = SAT score for a randomly selected studentx = number of people in a room at a randomly
selected time of dayx = number on the upper face of a randomly
tossed die

Note 5 of 5E
Probability Distributions for Probability Distributions for Discrete Random VariablesDiscrete Random Variables
The probability distribution for a discrete probability distribution for a discrete random variable random variable xx resembles the relative frequency distributions we constructed in Chapter 2. It is a graph, table or formula that gives the possible values of x and the probability p(x) associated with each value.
1)( and 1)(0
havemust We
xpxp 1)( and 1)(0
havemust We
xpxp
Note 5 of 5E
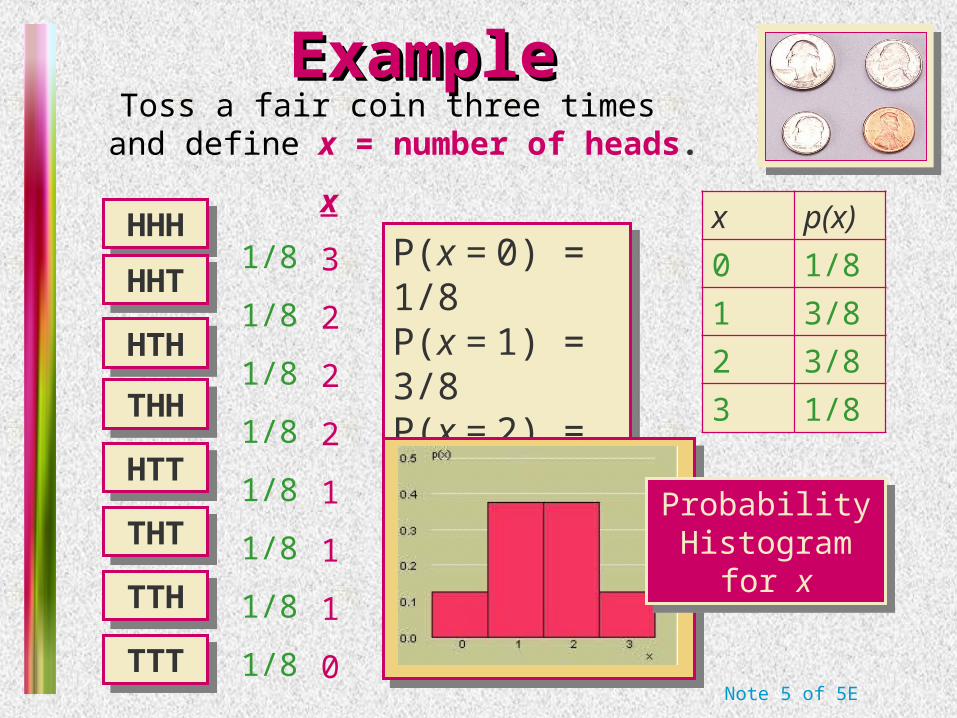
ExampleExample Toss a fair coin three times and
define x = number of heads.
1/8
1/8
1/8
1/8
1/8
1/8
1/8
1/8
P(x = 0) = 1/8P(x = 1) = 3/8P(x = 2) = 3/8P(x = 3) = 1/8
P(x = 0) = 1/8P(x = 1) = 3/8P(x = 2) = 3/8P(x = 3) = 1/8
HHHHHH
HHTHHT
HTHHTH
THHTHH
HTTHTT
THTTHT
TTHTTH
TTTTTT
x
3
2
2
2
1
1
1
0
x p(x)
0 1/8
1 3/8
2 3/8
3 1/8
Probability Histogram for x
Probability Histogram for x

Note 5 of 5E
ExampleExample Toss two dice and define x = sum of two dice. x p(x)
2 1/36
3 2/36
4 3/36
5 4/36
6 5/36
7 6/36
8 5/36
9 4/36
10 3/36
11 2/36
12 1/36

Note 5 of 5E
Probability DistributionsProbability Distributions
Probability distributions can be used to describe the population, just as we described samples in Chapter 2.
– Shape:Shape: Symmetric, skewed, mound-shaped…
– Outliers:Outliers: unusual or unlikely measurements
– Center and spread:Center and spread: mean and standard deviation. A population mean is called and a population standard deviation is called
Note 5 of 5E
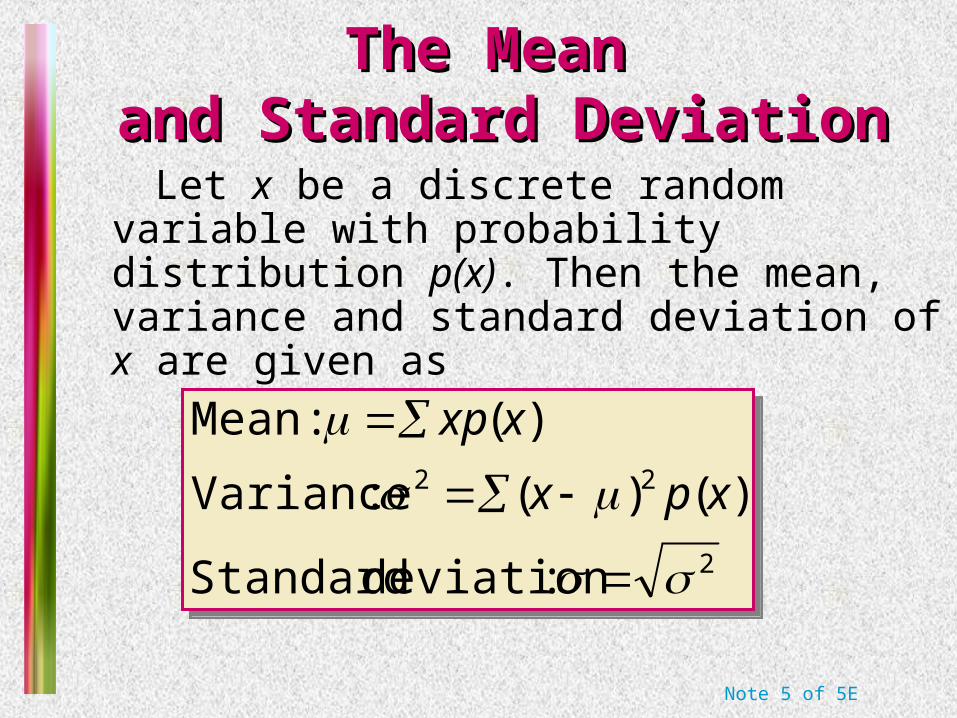
The Mean The Mean and Standard Deviationand Standard Deviation
Let x be a discrete random variable with probability distribution p(x). Then the mean, variance and standard deviation of x are given as
2
22
:deviation Standard
)()( :Variance
)( :Mean
xpx
xxp
2
22
:deviation Standard
)()( :Variance
)( :Mean
xpx
xxp

Note 5 of 5E
ExampleExample Toss a fair coin 3 times and
record x the number of heads.x p(x) xp(x) (x-2p(x)
0 1/8 0 (-1.5)2(1/8)
1 3/8 3/8 (-0.5)2(3/8)
2 3/8 6/8 (0.5)2(3/8)
3 1/8 3/8 (1.5)2(1/8)
5.18
12)( xxp 5.1
8
12)( xxp
)()( 22 xpx )()( 22 xpx
688.75.
75.28125.09375.09375.28125.2
688.75.
75.28125.09375.09375.28125.2
Note 5 of 5E
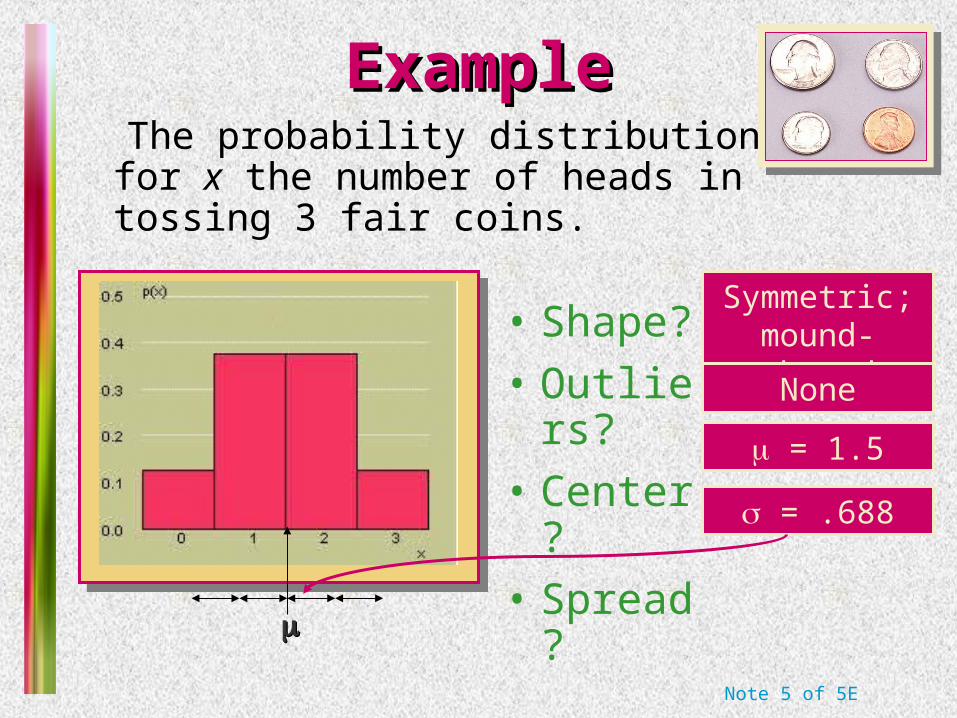
ExampleExample The probability distribution for x the
number of heads in tossing 3 fair coins.
• Shape?
• Outliers?
• Center?
• Spread?
Symmetric; mound-shaped
None
= 1.5
= .688

Note 5 of 5E
Key ConceptsKey ConceptsI. Experiments and the Sample SpaceI. Experiments and the Sample Space
1. Experiments, events, mutually exclusive events, simple events
2. The sample space
II. ProbabilitiesII. Probabilities
1. Relative frequency definition of probability
2. Properties of probabilities
a. Each probability lies between 0 and 1.
b. Sum of all simple-event probabilities equals 1.
3. P(A), the sum of the probabilities for all simple events in A

Note 5 of 5E
Key ConceptsKey ConceptsIII. Counting Rules III. Counting Rules
1. mn Rule; extended mn Rule2. Permutations:
3. Combinations:IV. Event RelationsIV. Event Relations
1. Unions and intersections2. Events
a. Disjoint or mutually exclusive: P(A B) 0
b. Complementary: P(A) 1 P(AC )
)!(!
!
)!(
!
rnr
nC
rn
nP
nr
nr

Note 5 of 5E
Key ConceptsKey Concepts3. Conditional probability:
4. Independent and dependent events
5. Additive Rule of Probability:
6. Multiplicative Rule of Probability:
7. Law of Total Probability
8. Bayes’ Rule
)(
)()|(
BP
BAPBAP
)()()()( BAPBPAPBAP
)|()()( ABPAPBAP
Note 5 of 5E
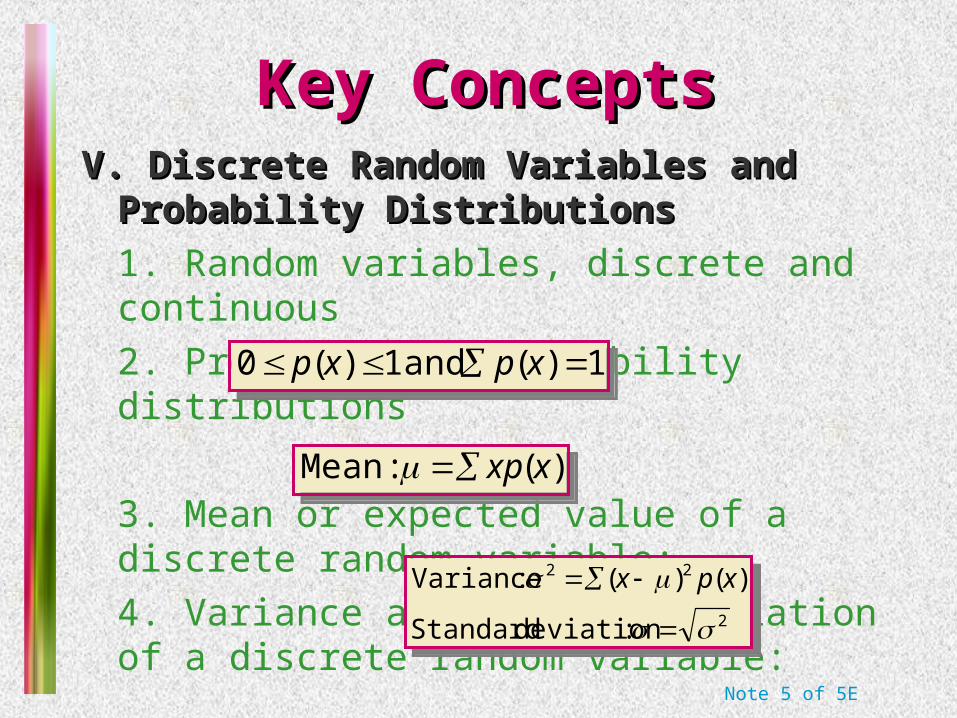
Key ConceptsKey ConceptsV. Discrete Random Variables and Probability V. Discrete Random Variables and Probability
DistributionsDistributions
1. Random variables, discrete and continuous
2. Properties of probability distributions
3. Mean or expected value of a discrete random variable:
4. Variance and standard deviation of a discrete random variable:
1)( and 1)(0 xpxp 1)( and 1)(0 xpxp
2
22
:deviation Standard
)()( :Variance
xpx2
22
:deviation Standard
)()( :Variance
xpx
)( :Mean xxp )( :Mean xxp