5908 United States Mining 21 Sep 16 - Acquisdata the subsidiary. We expect that the sale of PTNNT...
77
This Week’s News • Platts - Alliance closing Pattiki thermal coal mine in Illinois - 19/9/2016 Alliance Resource Partners is shutting its Pattiki underground thermal coal mine near Carmi in White County, Illinois, later this fall. For the complete story see: http://www.platts.com/latest-news/coal/louisville-kentucky/alliance-closing-pattiki- thermal-coal-mine-in-21551024 • Reuters - Barrick says Argentina mine may resume within two weeks - 19/9/2016 Barrick Gold’s Veladero gold mine in Argentina, one of its five core mines, could resume operations in the next two weeks. For the complete story see: http://www.reuters.com/article/us-mining-gold-barrick-gold-idUSKCN11P219?il=0 • INFORUM - N.D. coal mine using drone for land surveys - 17/9/2016 A North Dakota coal mine is the first surface mine in the country to use a drone to conduct land surveys that can cover 500 acres in less than an hour. For the complete story see: http://www.inforum.com/news/4117633-nd-coal-mine-using-drone-land-surveys Other Stories • Mining Weekly - US mining industry in flux as policy, economic and enviro challenges force change - 16/9/2016 • Platts - Arch Coal closer to bankruptcy exit as US court confirms plan - 14/9/2016 • Daily Caller - Coal Prices Just Doubled Despite Obama’s Best Efforts - 14/9/2016 Media Releases • GoldCorp Inc. - Goldcorp Announces Appointment of Charlie Sartain to Board of Directors – 19/9/2016 • Barrick Gold of North America - Temporary Suspension of Operations at Veladero Mine – 15/9/2016 • Newmont Mining Corporation - Newmont Subsidiary Repays Outstanding Balance on Revolving Credit Facility – 13/9/2016 Latest Research • Risk management: Adapting Riskgate for underground coal mines in the United States - By Jong, E. C, Restrepo, J. A, Luxbacher, K. D., Kirsch, P. A., Mitra, R., Hebblewhite, B. K., Schafrik, S. J. Overviews of Leading Companies Alpha Natural Resources, LLC (OTCMKTS: ANRZQ) Anglo Gold Ashanti North America Inc. Barrick Gold of North America (NYSE:ABX)(TSX:ABX) Consol Energy, Inc (NYSE: CNX) Freeport McMoran Copper (NYSE: FCX) GoldCorp Inc. (TSX: G, NYSE: GG) Newmont Mining Corporation (NYSE: NEM) Peabody Energy (NYSE: BTU) # Acquisdata is proud to be hosting a league on Estimize. Want the opportunity to win free subscriptions? Then join the Acquisdata Media and Telecommunications League at: https://www.estimize.com/leagues/acquisdata-media-and-telecommunications # UNITED STATES MINING 21 September 2016 Industry SnapShots Up to date business intelligence reports covering developments in the world’s fastest growing industries Follow us on : • News and Commentary • Media Releases • Latest Research • The Industry • Leading Companies in the Industry Contents N0.: 5908 Disclaimer of Warranties and Liability Due to the number of sources from which the information and services on the Acquisdata Pty Ltd Service are obtained, and the inherent hazards of electronic distribution, there may be delays, omissions or inaccuracies in such information and services. Acquisdata Pty Ltd and its affiliates, agents, sales representatives, distributors, and licensors cannot and do not warrant the accuracy, completeness, currentness, merchant ability or fitness for a particular purpose of the information or services available through the Acquisdata Pty Ltd service. In no event will Acquisdata Pty Ltd, its affiliates, agents, sales representatives, distributors or licensors be liable to licensee or anyone else for any loss or injury caused in whole or part by contingencies beyond its control in procuring, compiling, interpreting, editing, writing, reporting or delivering any information or services through the Acquisdata Pty Ltd Service. In no event will Acquisdata Pty Ltd or its affiliates, agents, sales representatives, distributors or licensors be liable to licensee or anyone else for any decision made or action taken by licensee in reliance upon such information or services or for any consequential, special or similar damages, even if advised of the possibility of such damages. licensee agrees that the liability of Acquisdata Pty Ltd, its affiliates, agents, sales representatives, distributors and licensors, if any, arising out of any kind of legal claim (whether in contract, tort or otherwise) in any way connected with the Acquisdata Pty Ltd service shall not exceed the amount licensee paid for the use of the Acquisdata Pty Ltd service in the twelve (12) months immediately preceding the event giving rise to such claim. Industry SnapShots Published by Acquisdata Pty Ltd A.C.N. 147 825 536 ISSN 2203-2738 (Electronic) ©Acquisdata Pty Ltd 2016 www.acquisdata.com
Transcript of 5908 United States Mining 21 Sep 16 - Acquisdata the subsidiary. We expect that the sale of PTNNT...

This Week’s News• Platts-AllianceclosingPattikithermalcoalmineinIllinois-19/9/2016 Alliance Resource Partners is shutting its Pattiki underground thermal coal mine near Carmi in
White County, Illinois, later this fall. For the complete story see: http://www.platts.com/latest-news/coal/louisville-kentucky/alliance-closing-pattiki-
thermal-coal-mine-in-21551024•Reuters-BarricksaysArgentinaminemayresumewithintwoweeks-19/9/2016 Barrick Gold’s Veladero gold mine inArgentina, one of its five core mines, could resume
operations in the next two weeks. For the complete story see: http://www.reuters.com/article/us-mining-gold-barrick-gold-idUSKCN11P219?il=0• INFORUM-N.D.coalmineusingdroneforlandsurveys-17/9/2016 ANorthDakotacoalmineisthefirstsurfacemineinthecountrytouseadronetoconductland
surveys that can cover 500 acres in less than an hour. For the complete story see: http://www.inforum.com/news/4117633-nd-coal-mine-using-drone-land-surveys
OtherStories•MiningWeekly -USmining industry influxaspolicy,economicandenvirochallenges force
change - 16/9/2016•Platts-ArchCoalclosertobankruptcyexitasUScourtconfirmsplan-14/9/2016•Daily Caller - Coal Prices Just Doubled Despite Obama’s Best Efforts - 14/9/2016
MediaReleases•GoldCorp Inc. - Goldcorp Announces Appointment of Charlie Sartain to Board of Directors –
19/9/2016•Barrick Gold of North America - Temporary Suspension of Operations at Veladero Mine –
15/9/2016•Newmont Mining Corporation - Newmont Subsidiary Repays Outstanding Balance on Revolving
Credit Facility – 13/9/2016
LatestResearch•Risk management: Adapting Riskgate for underground coal mines in the United States - By
Jong, E. C, Restrepo, J. A, Luxbacher, K. D., Kirsch, P. A., Mitra, R., Hebblewhite, B. K., Schafrik, S. J.
OverviewsofLeadingCompaniesAlpha Natural Resources, LLC (OTCMKTS: ANRZQ)Anglo Gold Ashanti North America Inc.Barrick Gold of North America (NYSE:ABX)(TSX:ABX)Consol Energy, Inc (NYSE: CNX)Freeport McMoran Copper (NYSE: FCX)GoldCorp Inc. (TSX: G, NYSE: GG)Newmont Mining Corporation (NYSE: NEM)Peabody Energy (NYSE: BTU)
# Acquisdata is proud to be hosting a league on Estimize. Want the opportunity to win free subscriptions? Then join the Acquisdata Media and Telecommunications League at:https://www.estimize.com/leagues/acquisdata-media-and-telecommunications #
UNITED STATES MINING21September2016
Industry SnapShots
Up to date business
intelligence reports covering
developments in the world’s
fastest growing industries
Followuson:
• NewsandCommentary
• MediaReleases
• LatestResearch
• TheIndustry
• LeadingCompaniesintheIndustry
C o n t e n t s
N0.:5908
DisclaimerofWarrantiesandLiability
Due to the number of sources from which the information and services on the Acquisdata Pty Ltd Service are obtained, and the inherent hazards of electronic distribution, there may be delays, omissions or inaccuracies in such information and services. Acquisdata Pty Ltd and its affiliates, agents, sales representatives,distributors, and licensors cannot and do not warrant the accuracy, completeness, currentness, merchant ability or fitness for a particular purpose of the information orservices available through the Acquisdata Pty Ltd service. InnoeventwillAcquisdataPtyLtd, itsaffiliates,agents,sales representatives, distributors or licensors be liable to licensee or anyone else for any loss or injury caused in whole or part by contingencies beyond its control in procuring, compiling, interpreting, editing, writing, reporting or delivering any information or services through the Acquisdata Pty Ltd Service. In no event will Acquisdata Pty Ltd or its affiliates, agents, sales representatives,distributors or licensors be liable to licensee or anyone else for any decision made or action taken by licensee in reliance upon such information or services or for any consequential, special or similar damages, even if advised of the possibility of such damages. licensee agreesthattheliabilityofAcquisdataPtyLtd,itsaffiliates,agents, sales representatives, distributors and licensors, if any, arising out of any kind of legal claim (whether in contract, tort or otherwise) in any way connected with the Acquisdata Pty Ltd service shall not exceed the amount licensee paid for the use of the Acquisdata Pty Ltd service in the twelve (12) months immediately preceding the event giving rise to such claim.
IndustrySnapShotsPublished byAcquisdataPtyLtdA.C.N. 147 825 536
ISSN 2203-2738 (Electronic)
©Acquisdata Pty Ltd 2016
www.acquisdata.com

United States – Mining
21 September 2016 1
https://twitter.com/acquisdata
https://www.facebook.com/acquisdata/
News and Commentary Platts - Alliance closing Pattiki thermal coal mine in Illinois - 19/9/2016 Alliance Resource Partners is shutting its Pattiki underground thermal coal mine near Carmi in White County, Illinois, later this fall. For the complete story see: http://www.platts.com/latest-news/coal/louisville-kentucky/alliance-closing-pattiki-thermal-coal-mine-in-21551024 Reuters - Barrick says Argentina mine may resume within two weeks - 19/9/2016 Barrick Gold's Veladero gold mine in Argentina, one of its five core mines, could resume operations in the next two weeks. For the complete story see: http://www.reuters.com/article/us-mining-gold-barrick-gold-idUSKCN11P219?il=0 INFORUM - N.D. coal mine using drone for land surveys - 17/9/2016 A North Dakota coal mine is the first surface mine in the country to use a drone to conduct land surveys that can cover 500 acres in less than an hour. For the complete story see: http://www.inforum.com/news/4117633-nd-coal-mine-using-drone-land-surveys Mining Weekly - US mining industry in flux as policy, economic and enviro challenges force change - 16/9/2016 The outcome of the November 2016 US Presidential election will not reverse the decline in the US mining industry’s value as the beleaguered coal industry continues to face market headwinds. For the complete story see: http://www.miningweekly.com/article/us-mining-industry-in-flux-as-policy-economic-and-enviro-challenges-force-change-2016-09-14 Platts - Arch Coal closer to bankruptcy exit as US court confirms plan - 14/9/2016 A federal court has confirmed bankruptcy plans for Arch Coal, paving the way for the US coal miner to emerge from Chapter 11 bankruptcy in early October. For the complete story see: http://www.platts.com/latest-news/coal/houston/arch-coal-closer-to-bankruptcy-exit-as-us-court-21510805 Daily Caller - Coal Prices Just Doubled Despite Obama’s Best Efforts - 14/9/2016 Global coal prices more than doubled over the last year, which could cause a renaissance in the U.S. mining industry. For the complete story see: http://dailycaller.com/2016/09/14/coal-prices-just-doubled-despite-obamas-best-efforts/

United States – Mining
21 September 2016 2
https://twitter.com/acquisdata
https://www.facebook.com/acquisdata/
See http://www.macrosourcemedia.com/store/p7/High-Tech_Shipping_Market_Report_%2874_pages%29.html https://www.facebook.com/acquisdata/ https://twitter.com/acquisdata

United States – Mining
21 September 2016 3
https://twitter.com/acquisdata
https://www.facebook.com/acquisdata/
Media Releases GoldCorp Inc. - Goldcorp Announces Appointment of Charlie Sartain to Board of Directors – 19/9/2016 GOLDCORP INC. today announced the appointment of Charlie Sartain to the Company's Board of Directors, effective as of January 1, 2017. "Charlie will be a tremendous addition to our Board of Directors," said Ian Telfer, Chairman of the Board of Goldcorp. "His technical knowledge and operational experience will be invaluable as we continue to optimize our portfolio and advance our organic pipeline." Mr. Sartain, 55, is a mining engineer with over 30 years of mining experience and is fluent in Spanish. Previously, he was the Chief Executive Officer of Xstrata's global copper business and under his nine-year tenure grew the business to become one of the world's leading copper producers with mining operations and projects spanning seven countries. Prior to that, Mr. Sartain had extensive operating and executive experience with MIM Holdings Ltd., including General Manager at Ravenswood Gold Mines and General Manager at Ernest Henry Mine in Queensland Australia, President of Minera Alumbrera Ltd. in Argentina and Executive General Manager for Latin America. Mr. Sartain holds a Bachelor of Engineering Degree with Honours from the University of Melbourne, Australia. He is currently a Member of the Senate of the University of Queensland and a Director and Chairman of the Advisory Board of the Sustainable Minerals Institute at the University of Queensland. He is also a Director of the Wesley Medical Research Institute and a Non-Executive Director on the Boards of ASX-listed Austin Engineering Ltd. and ASX-listed ALS Limited. http://www.goldcorp.com/English/Investor-Resources/News/News-Details/2016/Goldcorp-Announces-Appointment-of-Charlie-Sartain-to-Board-of-Directors/default.aspx Barrick Gold of North America - Temporary Suspension of Operations at Veladero Mine – 15/9/2016 Barrick Gold Corporation (NYSE:ABX)(TSX:ABX) (Barrick or the "company") today reported that the Government of San Juan province, Argentina, has announced a temporary suspension of operations at the Veladero mine pending further inspections of the mine's heap leach area. The company will work with provincial authorities to confirm the integrity and safety of the heap leach facility as quickly as possible, beginning today. The safety of people and the environment remains Barrick's top priority at Veladero. On September 8, 2016, a pipe carrying process solution in the heap leach area was damaged when it was struck by a large block of ice that had rolled down the heap leach valley slope. A small quantity of solution left the leach pad as a result. No solution from this damaged pipe reached any water diversion channels or watercourses, and the impacted area in the leach valley has now been remediated. The incident did not pose any threat to the health of employees, communities, or the environment. Environmental monitoring of surface and sub-surface water has been intensified, and no anomalies have been detected. At this time, we do not anticipate any material impact to Veladero's 2016 operating guidance. http://www.barrick.com/investors/news/news-details/2016/Barrick-Gold-Corporation-Temporary-Suspension-of-Operations-at-Veladero-Mine/default.aspx

United States – Mining
21 September 2016 4
https://twitter.com/acquisdata
https://www.facebook.com/acquisdata/
Newmont Mining Corporation - Newmont Subsidiary Repays Outstanding Balance on Revolving Credit Facility – 13/9/2016 Newmont Mining Corporation (NYSE: NEM) (Newmont or the Company) today announced its Indonesian subsidiary PTNNT repaid the remaining $190 million balance under its Revolving Credit Facility due in 2017. Year-to-date, Newmont has reduced its consolidated debt by more than $1.1 billion. “Repayment of the PTNNT Credit Facility is an important step in completion of the sale of PTNNT,” said Laurie Brlas, Executive Vice President and Chief Financial Officer. “The remaining balance of $190 million was paid from cash held at the subsidiary. We expect that the sale of PTNNT will close later this quarter or early in the fourth quarter. Newmont continues to evaluate options for optimizing the best uses of cash, including investing in profitable new production, repaying debt and returning capital to shareholders.” Since 2013, Newmont has generated $1.9 billion in fairly valued asset sales, which will increase to $2.8 billion upon closing of the sale of PTNNT. http://www.newmont.com/newsroom/newsroom-details/2016/Newmont-Subsidiary-Repays-Outstanding-Balance-on-Revolving-Credit-Facility/default.aspx
# Reportal: a vast archive of corporate documents from listed companies around the world www.reportaldata.com #

United States – Mining
21 September 2016 5
https://twitter.com/acquisdata
https://www.facebook.com/acquisdata/
Latest Research Risk management: Adapting Riskgate for underground coal mines in the United States Jong, E. C, Restrepo, J. A, Luxbacher, K. D., Kirsch, P. A., Mitra, R., Hebblewhite, B. K., Schafrik, S. J. Abstract The U.S. underground coal mining industry has recently seen the occurrences of several multifatality events that have interrupted an otherwise steadily improving safety record. These events transpired even with an unprecedented level of government regulations and safety technologies. These events may indicate that current safety practices have reached a level of diminishing returns. Risk management, a safety approach that has been successfully applied in numerous industries including mining, may provide a means to overcome this plateau. Riskgate is an Australian mining risk management program that may be successfully applied in the United States. However, fundamental differences between the Australian and U.S. coal mining industries prevent direct implementation. This paper discusses aspects of the Riskgate body of knowledge that require adaptation for its application in the United States. http://web.b.ebscohost.com/abstract?direct=true&profile=ehost&scope=site&authtype=crawler&jrnl=00265187&AN=113738237&h=UP%2bQlz6JmYMnkFGJ7jOUgwqymPX2JoYoaYqPrVGQ63%2fbI5HWkRnmusmTWo7FdLxslJ5hWSKKgjG9NlgM%2f9qVeA%3d%3d&crl=c&resultNs=AdminWebAuth&resultLocal=ErrCrlNotAuth&crlhashurl=login.aspx%3fdirect%3dtrue%26profile%3dehost%26scope%3dsite%26authtype%3dcrawler%26jrnl%3d00265187%26AN%3d113738237

United States – Mining
21 September 2016 6
https://twitter.com/acquisdata
https://www.facebook.com/acquisdata/
The Industry Introduction The U.S total domestic mining and waste removal for nonfuel mineral materials production amounted to 5.9 billion metric tons (Gt) in 2007 (most current year final statistics are available). These materials included 4.5 Gt of crude ore mined or quarried and 1.4 Gt of mine ore and waste from development operations. Overall, 97% of nonfuel mineral materials was mined and quarried using surface methods, and 3% was mined underground. Most non-fuel mining activities took place in: Nevada, Arizona, Florida, Minnesota, Utah, California, Texas, Michigan, Pennsylvania, and Georgia. These 10 States accounted for 63% of the tonnage removed in the production of nonfuel mineral materials mined in the United States. U.S. coal production in 2008 (most current year final statistics are available) reached a record level of 1,171.5 million short tons, with 389.8 million short tons from the Appalachia Region, 146.7 million short tons from the Interior Region, and 633.6 million short tons from the Western Region. In 2008, U.S. coal consumption declined in every coal-consuming sector. With such a large and active industry, the U.S. mining sector has increased its focus on sustainable mining practices in the 21st century. Special initiatives throughout the country have brought together the public, industry, and government to find innovative ways to ensure mineral extraction and processing activities have minimal environmental impacts and are sustainable. U.S laws and regulatory agencies provide a framework and baseline for increased sustainability focus for mining activities. The members of the National Mining Association (NMA) have adopted sustainable development principles and have issued the National Mining Association Sustainable Development Pledge: The members of the National Mining Association pledge to conduct their activities in a manner that recognizes the needs of society and the needs for economic prosperity, national security and a healthy environment. Accordingly, we are committed to integrating social, environmental, and economic principles in our mining operations from exploration through development, operation, reclamation, closure and post closure activities, and in operations associated with preparing our products for further use: http://www.nma.org/issues/environment/sustainable_development.asp To further improve health and safety at the nation's underground and surface mines through greater safety awareness, improved training and advanced technology, NMA is launching the "Safety First: Stay Alert" safety initiative aimed at reducing accidents and fatalities associated with unsafe behavior and practices at mining facilities. "Stay Away, Stay Alive" is a safety initiative aimed at reducing accidents and fatalities associated with unsafe activity in proximity to continuous miner machinery. This initiative is a first step and lays the groundwork for the next generation of underground mining technology that will be used to detect unsafe proximity to mining equipment. Drive Safe, Arrive Safe" is a safety initiative aimed at reducing accidents and fatalities associated with unsafe behavior and practices at mining facilities. http://www.nma.org/stay_alert.asp,http://www.nma.org/stay_alive.asp, http://www.nma.org/drive_safe.asp. The regulatory and technical aspects of the U.S. mining industry are complex, with overlapping laws, regulatory agencies, and state and federal roles for the different types of mining. Each mine faces a somewhat unique set of regulatory requirements, depending upon state statute or regulation; whether it is on state, federal, tribal, or private land; local regulations; the kind of mining and metal recovery operation proposed; and the specific environmental considerations unique to the site. Mining activities in the U.S. are regulated by various entities with states playing a key role in oversight. The U.S. Army Corps of Engineers (USACE); U.S. Department of Interior’s Bureau of Land Management (BLM), National Park Service (NPS), Office of Surface Mining (OSM), U.S. Geological Survey (USGS);

United States – Mining
21 September 2016 7
https://twitter.com/acquisdata
https://www.facebook.com/acquisdata/
U.S. Agriculture’s Forest Service (USFS); U.S. Department of Labor’s (DOL) Mine Safety and Health Administration (MSHA); Environmental Protection Agency’s (EPA) Office of Water and the Office of Solid Waste and Emergency Response all play a role in influencing environmental outcomes at mine sites where they have ownership or jurisdiction. The overlapping laws and agencies provide an intricate network of oversight of mining activities, from exploration and permitting through closure and site reuse. 1. Domestically Focused Mining Agencies and Programs 1.A: Interagency Federal Mining Dialogue (FMD) The Federal Mining Dialogue, FMD, is a cooperative initiative among federal environmental and land management agencies for remediating contamination, improving safety, and minimizing releases from operating, abandoned, and inactive hardrock mining and mineral processing sites. Member agencies encourage efficient management of the nation's public land and mineral resources in an environmentally sound manner. FMD member agencies include USACE, USDA, USFS, BLM, OSM, USGS, NPS, Department of Justice, MSHA, and EPA. One goal of the FMD is to focus on future uses of abandoned mine lands (AMLs), and identify the economic, environmental, and social benefits that accrue from their reuse. Reuse may serve as a catalyst for expediting environmental risk reduction. https://www.abandonedmines.gov 1.B Department of Interior The Surface Mining Control and Reclamation Act of 1977 (SMCRA), calls on the Office of Surface Mining, OSM, of the Department of Interior, DOI, to balance the environmentally adverse effects of surface coal mining with the Nation's need for coal as an essential energy source. OSM ensures that coal mining is conducted in an environmentally responsible manner and that the land is adequately reclaimed during and following the mining process. OSM requires plans that assure that mining sites will be restored to their original contours and to mitigate acid mine drainage before a permit is granted for mining operations. The primary responsibility for regulating surface coal mining now rests with the coal-mining States, with OSM performing an oversight role. OSM works with colleges and universities and other state and federal agencies to further the science of reclaiming mined lands and protecting the environment. These initiatives include promoting the planting of trees and establishing much-needed wildlife habitat. http://www.osmre.gov/index.shtm Appalachian Regional Reforestation Initiative (ARRI) The ARRI is a coalition of citizens, the coal industry, and government that is dedicated to restoring forests on coal mined lands in the Eastern United States. The goals of the initiative are to • Plant more high-value hardwood trees on reclaimed coal mined lands in Appalachia • Increase the survival rates and growth rates of planted trees • Expedite the establishment of forest habitat through natural succession ARRI advocates using a technique known as the Forestry Reclamation Approach to plant trees on reclaimed coal mined lands. Highly productive forestland can be created on reclaimed mine lands under existing laws and regulations by using the Forestry Reclamation Approach. http://www.arri.osmre.gov/

United States – Mining
21 September 2016 8
https://twitter.com/acquisdata
https://www.facebook.com/acquisdata/
DOI BLM The Department of Interior’s Bureau of Land Management, BLM, manages public lands under its domain using the principles of multiple use and sustained yield. BLM’s statutory mandate under the Federal Land Policy and Management Act of 1976 (FLPMA) is to prevent unnecessary or undue degradation. Exploration and mining activities on mining claims on BLM administered lands are subject to the regulations in 43 CFR 3809 and for Wilderness Study Areas, 43 CFR 3802. For activities other than casual use, they require the operator to submit either a notice or a plan of operations and a reclamation plan. A plan of operations must describe in detail the site and the proposed operation, including measures that will be taken to prevent undue and unnecessary degradation and to reclaim the site to regulatory standards. Reclamation must include salvaging topsoil for later use, erosion and runoff control, toxic materials isolation and control, reshaping the area, reapplication of topsoil, and revegetation (where reasonably practical). General Info: http://www.blm.gov/wo/st/en.html Coal Mining: http://www.blm.gov/wo/st/en/prog/energy/coal_and_non-energy.html BLM AML Program: The Bureau of Land Management’s Abandoned Mine Lands Program, BLM AML, works in partnerships with EPA, state agencies, tribes, private parties, and other groups to accelerate the rate of cleanup of watersheds affected by abandoned hard rock mines. http://www.blm.gov/wo/st/en/prog/more/Abandoned_Mine_Lands.html DOI NPS The National Park Service, NPS, has the responsibility for managing the National Park System to conserve scenery, natural and historic objects, and wildlife, and to provide for the public enjoyment of those resources that will leave lands unimpaired for the enjoyment of future generations. NPS ensures that mineral activities prevent or minimize damage to the environment and that the pristine beauty is preserved for the benefit of present and future generations. http://www.nature.nps.gov/geology/mining/ NPS Abandoned Mineral Land Restoration Program: The Abandoned Mineral Land Restoration Program encourages the full restoration of lands affected by mining activities, addresses environmental concerns (metals contamination, acid mine drainage), safety hazards (vertical mine openings, unstable slopes), and the sustainability of bat species, which may rely on mine shafts for habitat. http://www.nature.nps.gov/geology/aml/index.cfm DOI USGS Under the Geological Survey Organic Act of 1879 and the Economy Act of 1932, the United States Geological Survey, USGS, provides statistics and information on the worldwide supply of, demand for, and flow of minerals and materials essential to the U.S. economy, the national security, and protection of the environment. USGS publishes the annual Mineral Commodity Summaries and Minerals Yearbook. The USGS Minerals Yearbook also provides mining information for most of the countries of the world (see next International Section for more details). http://minerals.usgs.gov/minerals/pubs/mcs/ http://minerals.usgs.gov/minerals/pubs/myb.html USGS also provides scientific expertise to help land managers minimize or eliminate the adverse environmental effects of AMLs. The U.S. Geological Survey Mine Waste Characterization Project has taken a multidisciplinary approach to assemble, develop, and refine methods and tools for characterizing and screening weathered solid-mine

United States – Mining
21 September 2016 9
https://twitter.com/acquisdata
https://www.facebook.com/acquisdata/
wastes. Researchers from a variety of disciplines, including geophysics, geochemistry analytical chemistry, geology, mineralogy, remote sensing, and spatial modeling, have worked together at metal mining waste sites in Colorado and New Mexico to develop an integrated "toolkit" for the rapid screening and characterization of historical mine-waste piles. Detailed studies have been conducted at eight main mine-dump sites (six are located in Colorado), representing both igneous-hosted and carbonate-hosted polymetallic deposits, to examine the influence of carbonate materials. Two other sites are arid analog mine-waste piles in southwestern New Mexico have been chosen to study the influence of climate. Tools developed from this work can be used in ranking and prioritizing historical mine-waste piles. http://mine-drainage.usgs.gov/ DOI MMS The Minerals Management Service (MMS), a bureau in the U.S. Department of the Interior, is the Federal Agency that manages the nation's natural gas, oil and other mineral resources on the outer continental shelf (OCS). The agency also collects, accounts for and disburses more than $8 billion per year in revenues from Federal offshore mineral leases and from onshore mineral leases on Federal and Indian lands. MMS’s mission is to manage the ocean energy and mineral resources on the Outer Continental Shelf and Federal and Indian mineral revenues to enhance public and trust benefits, promote responsible use, and realize fair value. http://www.mms.gov/ 1.C Department of Agriculture Forest Service (USFS) The United States Forest Service, USFS, regulates the use of public lands in accordance with various authorities and program specific statutes. Exploration and mining activities on lands administered by the USFS are subject to the regulations in 36 CFR 228(A). Any proposed operation that could likely cause significant disturbance of surface resources must gain the approval of the USFS. USFS ensures mines and oil, gas and geothermal energy operations on federal lands are in compliance with pollution control laws, standards or implementation plans, or land management requirements. http://www.fs.fed.us/ An important part of the USFS Minerals and Geology Management Program’s mission is the restoration of land disturbed by historic mining activities. In 1995 the USDA Forest Service, using data compiled by the US Bureau of Mines, estimated the number of abandoned mines inside National Forest boundaries to be 38, 991 total abandoned mine site and that 13, 597 or 34% of the total were mines with records of mineral production. Many involved minerals like arsenic, cadmium, copper, lead, mercury and zinc which can cause human health and environmental impacts. http://www.fs.fed.us/geology/aml-index.htm 1.D EPA EPA Superfund Program Under the Comprehensive Environmental Response, Compensation, and Liability Act (CERCLA), commonly known as Superfund, EPA has remediated over 500 mining and mineral processing sites, focusing on sites where other regulatory tools have not achieved protection goals. EPA’s Superfund program established the Beneficial Use of Mining Waste workgroup to identify, resolve and/or clarify key issues with respect to the beneficial use of mining and mineral processing wastes for non-residential use purposes. EPA’s AML Program is coordinated through the National Mining Team (NMT) and Abandoned Mine Lands Team (AMLT). http://www.epa.gov/superfund/ http://www.epa.gov/superfund/programs/aml/

United States – Mining
21 September 2016 10
https://twitter.com/acquisdata
https://www.facebook.com/acquisdata/
EPA Brownfields Program It is estimated that there are more than 450,000 brownfields in the U.S. EPA’s Brownfields Program provides grants and technical assistance to communities, states, tribes, and other stakeholders to prevent, assess, safely clean up, and sustainably reuse brownfields. The Mine-Scarred Lands initiative provides technical assistance to communities to reclaim and reuse mine-scarred lands. http://epa.gov/brownfields/index.html http://epa.gov/brownfields/policy/initiatives_sb.htm#msl EPA Office of Federal Activities The National Environmental Policy Act (NEPA) requires federal agencies to consider potential environmental impacts before taking major actions, such as issuing mining permits or making decisions that affect federal lands. This environmental assessment (EA) is used to assess the adequacy of proposed mitigation measures and reclamation procedures to prevent unnecessary and undue degradation. If significant impacts are likely from mining activities, the agency must prepare an environmental impact statement (EIS). EPA reviews EISs on proposed Federal Agency actions and prepares written comments and complies with NEPA by writing EAs or EISs for certain EPA actions. http://www.epa.gov/Compliance/nepa/ EPA RE-Powering America’s Land Initiative EPA encourages renewable energy development on current and formerly contaminated land and mining sites. Eight wind turbines were installed on an old slag pile at the Bethlehem Steel site in Lackawanna, NY that now produce enough electricity to power 7,000 homes. http://www.epa.gov/renewableenergyland/ EPA Office of Water The Clean Water Act (CWA) is one of the most widely used regulatory tools for ensuring environmental sustainability at mining sites by providing limitations on impacts to the nation’s waterways. Under Section 402 of the CWA, all point source discharges from mining must be authorized under a National Pollutant Discharge Elimination System (NPDES) permit. Under the stormwater program, runoff from mining operations requires a permit if it comes into contact with overburden, raw material, intermediate products, finished product, byproduct, or waste products located on the site of such operations. http://cfpub.epa.gov/npdes/indpermitting/mining.cfm Although most Section 402 mining permits are issued by states, the Office of Water (OW) may review permits to ensure that the permits contain appropriate technologybased and water quality-based effluent limitations. Section 404 of the CWA provides authority for regulating the discharge of “dredged or fill material.” Section 404 permits are generally issued by the Corps of Engineers. http://www.epa.gov/ow/ EPA Resource Conservation and Recovery Act (RCRA) Program Regulation affecting mineral processing wastes was developed through a long process covering the period 1980 to 1991. EPA has jurisdiction to regulate solid wastes from mining activities in the United States under the Resource Conservation and Recovery Act (RCRA). However, the current program focuses primarily on hardrock mining (i.e. mining of metallic ores and phosphate rock). http://www.epa.gov/osw/nonhaz/industrial/special/mining/

United States – Mining
21 September 2016 11
https://twitter.com/acquisdata
https://www.facebook.com/acquisdata/
1.E Army Corps of Engineers (USACE) The Restoration of Abandoned Mines (RAMS) Program utilizes the United States Army Corps of Engineers, USACE, environmental authorities to provide technical, planning, and design assistance to Federal and non-Federal interests in carrying out projects to address water quality problems caused by drainage and related activities from abandoned and inactive non-coal mines. https://www.nwo.usace.army.mil/html/rams/rams.html 1.F Department of Labor (DOL) Mine Safety and Health Administration (MSHA) The mission of the Mine Safety and Health Administration (MSHA) is to administer the provisions of the Federal Mine Safety and Health Act of 1977 (Mine Act), as amended by the Mine Improvement and New Emergency Response Act of 2006 (MINER Act), and to enforce compliance with mandatory safety and health standards as a means to eliminate fatal accidents; to reduce the frequency and severity of nonfatal accidents; to minimize health hazards; and to promote improved safety and health conditions in the Nation’s mines. http://www.msha.gov/sosa/webresc.asp 1.G States and Tribes The EPA works with other federal agencies, state and local governments, and Indian tribes to develop and enforce regulations under existing environmental laws. The EPA, which is responsible for researching and setting national standards for a variety of federal environmental programs, delegates to states and tribes the responsibilities for issuing permits and monitoring and enforcing compliance. Where national standards are not met, the EPA can issue sanctions and take other steps to assist the states and tribes in reaching the desired levels of environmental quality. States and Tribes are the leaders in mining regulation. All States have general environmental statutes that provide coverage to mining operations. Many states have been authorized to implement federal environmental programs, such as the National Pollutant Discharge Elimination System (NPDES) program under the Clean Water Act (CWA) and the hazardous waste program under the Resource Conservation and Recovery Act (RCRA). http://web.ead.anl.gov/dwm/regs/federal/epa/index.cfm 2. Internationally Focused Programs and Activities USGS Minerals Information Team: As noted in the previous section, the Team collects and publishes production data, trade data, and other information for most of the countries of the world. Information on mining and investment laws, ownership, and country infrastructure is published in the country chapters of the USGS Minerals Yearbook. http://www.mms.gov/ USGS also supports many international scientific studies and provides technical expertise throughout the world. The Department of the Interior’s Minerals Management Service (MMS) disbursed more than $10.68 billion in Fiscal Year 2009 from revenues collected from energy and mineral production on Federal and American Indian lands, including energy and mineral production on the Federal Outer Continental Shelf. The billions of dollars being disbursed will support much needed projects such as land and water conservation efforts around the United States, power and water projects in the West, critical infrastructure improvements, and funding for education. A complete breakout of FY 2009 disbursements is available at www.mrm.mms.gov. http://international.usgs.gov/index.htm

United States – Mining
21 September 2016 12
https://twitter.com/acquisdata
https://www.facebook.com/acquisdata/
USFS International Program The USFS International Program promotes sustainable forest management and biodiversity conservation internationally. By linking the skills of USFS field-based staff with partners overseas, the program addresses the most critical global forestry issues and concerns. International Programs has three main staff units: Technical Cooperation, Policy, and Disaster. Both Technical Cooperation and DASP work closely with United States Agency for International Development (USAID). Technical Cooperation, specifically, develops and manages natural resource projects overseas on a wide range of topics (i.e. fire management and forest health). There are two main disaster programs: Disaster Assistance Support Program (DASP) and the Disaster Mitigation Program. Funded by USAID's Office of Foreign Disaster Assistance, DASP trains and mobilizes personnel domestically to respond and mitigate foreign disasters, such as the drought in Ethiopia and the locust response in West Africa. The Disaster Mitigation Program, on the other hand, trains and provides technical expertise to partners overseas in emergency preparedness, response and disaster mitigation. http://www.fs.fed.us/global/index.html DOI International Technical Assistance Program In 1995, the U.S. Agency for International Development (USAID) and DOI established the DOI International Technical Assistance Program (ITAP) to provide capacity building in other countries using the diverse expertise of DOI bureaus. DOI-ITAP capacity building includes, but is not limited to: on-site technical assistance, study tours, mentoring, train-the-trainers workshops, procurement, and training in operations and maintenance of equipment. http://www.doi.gov/intl/itap/overview.html OSM’s Environmental Operations Division The Environmental Operations Division coordinates OSM's international programs including international technical assistance activities. USAID Projects in Europe and Eurasia GEF: The GEF (global environment facility) was created in 1990 to address global environmental issues, including the protection of international waters, and a reduction in ozone depleting chemicals. The GEF/Danube project was awarded a $150 million contribution by United States to the GEF. The GEF/Danube River project achieved its objective of monitoring and reducing pollution across three international boundaries from industrial sources including the two mines. The international boundaries cover: Slovakia/Ukraine, Hungary/Slovakia, and Hungary/Romania borders. USAID: USAID’s contribution to in the mining sector proved vital to the economic redevelopment of the Kosovo area. An environmental assessment was part of the Kosovo Strategy that addressed Kosovo’s Trepca Mining, Smelting and Refining Complex sites which provide raw materials (primary lead and zinc) for the economic development of Kosovo. This project helped in the development of an environmentally sound mining and industrial production corridor in Kosovo which resulted in local jobs and strong local economic development. Among other works USAID provided Technical Assistance to uranium and copper mines in Romania. Sarajevo: USAID helped to restore electricity produced by coal fired power plants by restoring operations at the Vrtliste surface coal mine to ensure a sustainable supply of coal for coal-fired electrical plants. USAID also helped Sarajevo restore its electric power generation capacity by repairing the Kakanj thermal Power Plant. Cyprus: USAID addressed the consequences of mining in a post-conflict situation, including the closure and restart of mining operations. A mine reclamation plan was prepared which addressed the impact of mining operations on the

United States – Mining
21 September 2016 13
https://twitter.com/acquisdata
https://www.facebook.com/acquisdata/
quality of surface and ground waters in northern Cyprus and the Mediterranean Sea. USAID helped the mine located in Lefka-Xeros to identify environmental impacts and mitigation procedures. Romania: A USAID Contribution to Emergency Response-Cyanide Spill in Romania: In 2000, approximately 100,000 square meters of hazardous liquid waste began flowing out of a holding pond from a gold mine in Baia Mare, northern Romania, into the Szamos River, which is a tributary to the Danube River. The mine is jointly owned by an Australian company and a Romanian state-owned mining company. The liquid waste contained high concentrations of cyanide and heavy metals, which are used to extract gold from mine tailings. USAID responded to this environmental catastrophe by working with the respective stakeholders. A team of engineering experts engaged in evaluating the integrity of the impoundment at Baia Mare Gold Mine and other Romanian sites to prevent spills of mining chemicals and tailings in the future. Another team of experts studied the affected region in Romania/Hungary, and responded to needs of the affected population and the environment. USAID Projects in Africa The Central African PRADD project The Property Rights and Alluvial Diamond Development, PRADD, which was co-sponsored by State Dept, as part of the Kimberley identification process is a project in Central African Republic, CAR. PRADD is designed to identify, clarify, and reinforce property rights to land and minerals at alluvial diamond mining pilot sites. It has been established that artisanal diamond miners capture only a small share of the value of alluvial rough (i.e., unprocessed) diamonds. The PRADD project: PRADD is working in cooperation with a small team of national experts, and in close collaboration with the Ministry of Energy, Mines and Hydraulics (MEMH) in CAR. During the first year they conducted participatory rural appraisals (PRAs), a census of miners, a socioeconomic survey of all 253 artisanal miners in the pilot area, and mine-specific surveys. The information thus gathered permitted the development of a property rights claims registry of all 253 artisanal miners in the pilot zones linked to a basic production and sales information management framework in a geographic information system, GIS. This property information management system framework represents an internal control mechanism that will strengthen CAR’s capacity to monitor illicit activities and trace diamonds along the earth-to-export chain of custody. PRADD’s efforts included sponsorship of GIS training at the University of Bangui for five ministry technicians. These reviews, presented during national level workshops, have stimulated lively debate on the effectiveness of CAR’s internal control systems and created increased awareness of the positive contribution that strengthened property rights could play. Senegal: In Senegal, the USAID Agriculture and Natural Resources Management program “Wula Nafaa” is involved with artisanal gold miners. An Environmental Protection Agency (EPA) team requested USAID to follow-up on their activities in Kedougou as their funding was ending. The EPA had focused on reducing the hazards related to the use of mercury by artisanal gold miners. During an USAID/EPA workshop in Dakar it became evident that the problems in this mining sector go far beyond just the improper use of mercury and reducing the environmental impact of artisanal mining would require an intensive, integrated approach. In light of the enormous environmental, health, legal, social problems and commercial issues involved in artisanal gold mining, USAID concluded that Wula Nafaa could play a key role especially in communities where we already have developed local conventions. USAID/ Dakar has included local governments in land use planning and has developed community based management schemes to manage resources. This project is on-going. USA Projects in Latin America and Caribbean Best Practices Manual: USAID developed a manual and a CD of best practices for the entire non-ferrous mining industry using the know-how of US Experts and has distributed it to the World Mining Congress in Las Vegas, NV in 2000. Over 1000 copies were distributed worldwide. It was well received and is still available.

United States – Mining
21 September 2016 14
https://twitter.com/acquisdata
https://www.facebook.com/acquisdata/
Barbados-open pit mining operations: A project to reduce the release of land-based pollution into estuaries and the sea, which threatens marine biodiversity. The impact assessment of quarrying on marine biodiversity showed that most negative impact was sedimentation that killed organisms directly; stressed coral reefs and made aquatic species more vulnerable to disease and global warming effects, and altered or degraded habitats so significantly that multiple species could no longer survive. This project focuses on improving the legal regulations for operating an open pit quarry in the Commonwealth of Dominica. USAID CAFTA Projects Mining Manual: USAID and EPA are developing, with support from the Department of Interior an (environmental assessment) EIA Technical Review Guideline and Terms of Reference (TORs) for commercial mining, under CAFTA DR environmental cooperation agreement. The guidelines will include the US experience as well as those of other nations and international organizations, will identify what is best practice, but offer a range of alternatives for mitigating and avoiding negative impacts. It is being developed with an expert team drawn from CAFTA DR country environmental and mining Ministries, and institutions in these countries which offer mining expertise. The guidelines will be ready for pilot use soon. Based on pilot testing and industry workshops CAFTA will provide feedback to the member mining ministers to decide how to use the guidelines. USEPA Projects Kyrgyzstan Mercury Mining: EPA is supporting a joint UNEP/UNITAR project to assist the Government of Kyrgyzstan in developing an action plan to address primary mercury mining. Reducing the supply of mercury has been identified as a priority by the UNEP Governing Council, which considers mercury mining as an important activity to be limited in order to reduce releases of mercury to the environment. Kyrgyzstan is the last remaining major supplier of mined mercury to the international marketplace. This project was initiated to assist Kyrgyzstan in phasing out mercury production at the Khaidarkan Mercury Mine. As part of the overall project, assessments are being undertaken aimed to facilitate the involvement of donors (such as the GEF, World Bank, Asia Development Bank and others) in the eventual cessation of mercury mining activities in an environmentally and socially sound manner, and in remediation of contamination caused by mining activity. Amazon Gold Mining (Brazil and Peru): EPA developed and piloted, through its contractor, Argonne National Laboratory, a low-cost, locally appropriate mercury emissions control technology . This emission technology is designed to limit release of mercury from secondary gold refining which is carried out in enclosed gold shops, which are prevalent throughout the Amazon. EPA developed and evaluated the prototype technology in the Tapajos Region of Brazil, and in the Madre de Dios region in Peru. The gold shop mercury capture system is now in the replication phase, where the Agency is providing training and outreach for its further dissemination and sustainability. Replication is occurring at the local level in Brazil, as orders come into metal workers to construct the system for additional gold shops. The government of Peru, through the Ministry of Energy and Mines, is taking the lead on replication of the technology across Peru, with EPA assistance in workshops. A final report about the technology, as well as a construction manual and outreach documents are available in Portuguese, Spanish, and French. The system captures more than 80% of mercury being used. Since mercury is easily recycled, it will be managed according to a government plan. To date, EPA estimates a capture of about 337kg of mercury from participating gold shops. http://www.ipd.anl.gov/anlpubs/2008/06/61757.pd http://www.un.org/esa/dsd/dsd_aofw_ni/ni_pdfs/NationalReports/usa/mining.pdf

United States – Mining
21 September 2016 15
https://twitter.com/acquisdata
https://www.facebook.com/acquisdata/
Leading Companies Alpha Natural Resources, LLC (OTCMKTS: ANRZQ) About Us Alpha Natural Resources is one of America's leading producers of coal, which is an essential part of our daily lives. From generating light and heat to helping make the steel that goes into our roads, bridges and buildings, coal powers our future. In fact, coal generates 40% of the world's electricity and powers almost 70% of global steel production. Coal is sometimes called “buried sunlight,” the product of decayed plant matter from eons ago. Here you can follow The Story of Coal on its 300 million-year journey from prehistoric swamps to your light switch at home. Ensuring the sustainability of this important resource as well as looking after our employees, communities and environment is not just important, it's a priority we're deeply committed to. We call it Running Right, and it's just the way we do business. VISION Running Right...it's what we do. We protect the safety and health of our employees, and watch out for one another. Every employee is empowered to do the right thing at all times. We aim to be the employer of choice. We provide a challenging work environment, where hard work and achievement are rewarded. The more our people are involved, the more successful we become. We're in it for our customers. We build relationships with our customers by providing essential products and services that exceed their expectations. We make a difference. We demonstrate environmental excellence through operating practices that respect the land and minimize our impact on it. We add to our communities by creating jobs, supporting local organizations and helping our neighbors. When we put it all together, everyone wins. We deliver consistent, industry leading financial results and earn the confidence of our shareholders, customers, employees and communities. We're ready for the future. We continually assess opportunities and risks to ensure we have options and a strategy to succeed. We anticipate changes in the marketplace, and maintain the ability to move swiftly. VALUES Running Right...it's who we are. We conduct our business safely, ethically, honestly and with integrity at all times. We care. Caring for one another helps us all return to our families safe and healthy. We treat each other how we want to be treated.

United States – Mining
21 September 2016 16
https://twitter.com/acquisdata
https://www.facebook.com/acquisdata/
We trust our people and work together as a team. All employees have an opportunity to contribute their ideas and share in our success. We communicate openly, build on what we know and learn, and make informed decisions to keep us ahead of the competition. We embrace change, continuously improving ourselves and our business. http://www.alphanr.com/Pages/Default.aspx Anglo Gold Ashanti North America Inc. Headquartered in Johannesburg, South Africa, AngloGold Ashanti has 19 gold mining operations in 9 countries, as well as several exploration programmes in both the established and new gold producing regions of the world. AngloGold Ashanti produced 4.4Moz of gold in 2014, generating $5.2bn in gold income, utilising $1.21bn capital expenditure. AngloGold Ashanti has an attributable Ore Reserve of 57.5Moz of gold and an attributable Mineral Resource of 232.0Moz Our five key business objectives - Supporting our core strategy… • Focus on people, safety and sustainability: our business must operate according to our values if it is to
remain sustainable in the long term.
• Optimise overhead, costs and capital expenditure: all spending decisions must be checked and double checked to ensure they are necessary to fulfil our core business objective.
• Improve portfolio quality: we have a portfolio of assets that must be actively managed as we strive for a competitive valuation as a business.
• Ensure financial flexibility: the balance sheet is the foundation of our company and we must ensure it always remains able to meet our core funding needs.
• Maintain long-term optionality: while we are focused on ensuring the most efficient day-to-day operation of our business we must keep an eye on creating a competitive pipeline of long-term opportunities
http://www.anglogoldashanti.com/en/About-Us/Pages/default.aspx RESULTS FOR THE FOURTH QUARTER and year ended 31 December 2015 AngloGold Ashanti Has $160m Q4 Free Cash Flow, Cuts Net Debt 30% 22 February 2016 AngloGold Ashanti today said it cut net debt by almost a third last year after margins increased despite lower gold prices, and the company generated free cash flow of $160m in the fourth quarter. AngloGold Ashanti delivered on a range of self-help measures last year to reduce debt using internally generated funds, without diluting shareholders. The Cripple Creek & Victor mine in the US was sold for $820m plus a royalty, and most of the proceeds were used to buy back a portion of the company’s most expensive debt. At the same time, a strong performance from the company’s international mines helped expand margins even as gold prices fell.

United States – Mining
21 September 2016 17
https://twitter.com/acquisdata
https://www.facebook.com/acquisdata/
“We’ve again shown consistency in hitting our production guidance, beating cost estimates, delivering free cash flow and delivering a sharp reduction in net debt levels,” Chief Executive Officer Srinivasan Venkatakrishnan said. “We achieved all of that despite lower gold prices. ” Net debt fell by 30% to $2.19bn from $3.13bn at the end of 2014, lowering the amount the company will pay in interest charges. All-in sustaining costs (AISC) improved to an average of $910/oz in 2015, more than 11% lower than the $1,020/oz recorded the previous year, and lower than guidance of $950/oz to $980/oz. Production of 3.95Moz was at the top end of guidance of 3.8Moz to 4.0Moz. AngloGold Ashanti has for 12 consecutive quarters either met, or beaten, its cost and production guidance. The significant year-on-year improvement in AISC reflects an especially strong showing from the International Operations, which saw their AISC for the year fall by more than 16% to $822/oz. Geita was once again a standout performer in Continental Africa, with AISC of $717/oz, whilst the American operations as a whole had AISC of $792/oz. The robust performance of the International Operations once again offset a drop in output at the South African operations to 1.004Moz, from 1.22Moz in 2014, due mainly to a combination of lower grades and safety-related disruptions during the year. The full-year AISC of $1,088/oz at the South Africa operations was $24/oz higher than the previous year, reflecting the weaker operating performance, which was only partially offset by the weaker Rand. The fourth quarter showed an improving trend, however, with the South African operations reporting AISC of $988/oz. AngloGold Ashanti’s costs also benefit from weaker currencies relative to the dollar in South Africa, Brazil, Argentina and Australia, where the Rand, peso, real and Australian dollar often weaken along with the gold price, cushioning the blow. Together, these regions account for about two-thirds of production. Lower prices for oil also benefit the company given that diesel is used to power generators and fleet at many of the company’s operations. Adjusted earnings before interest, tax, depreciation and amortisation (adjusted EBITDA) for the full year was $1,472m, compared to $1,616m in 2014, reflecting lower production year-on-year and weaker average price received. Free cash flow for the full year improved to $141m compared with an outflow of $112m in 2014. This achievement was all the more noteworthy given that it occurred despite the 8% drop in the gold price. Net debt to adjusted EBITDA levels ended the year at 1.49 times, lower than the 1.94 times recorded at the end of 2014, highlighting the success of the decisive, deleveraging efforts. SAFETY Eleven of our colleagues lost their lives in the workplace during 2015, underlining safety as the most pressing challenge for the company, primarily at its South African operations. Significant effort is being expended to not only understand the cause of each of these incidents, but also the root cause of other high potential incidents that could have resulted in fatalities. There has been some success in this regard, with the all-injury frequency rate, the broadest measure of workplace safety, improving to 7.18 per million hours worked, from 7.36 the previous year. FOURTH QUARTER AngloGold Ashanti delivered another strong operating and financial result for the three months ended 31 December 2015 ahead of cost and production guidance despite safety-related stoppages that lowered output in South Africa. Fourth quarter production of 997,000oz was 14% lower than the corresponding period in 2014 but 2% better than the prior quarter and better than guidance of 900,000oz-950,000oz. AISC of $860/oz were 14% better than the corresponding period in 2014, reflecting rigorous cost and capital allocation discipline across the company. South Africa started to show a modest recovery from its operational challenges related principally to safety disruptions in the first three quarters of the year. Whilst production was 16% lower than the corresponding period in 2014, it was – as previously flagged -- consistent with the third quarter at 252,000oz. AISC of $988/oz was 10%

United States – Mining
21 September 2016 18
https://twitter.com/acquisdata
https://www.facebook.com/acquisdata/
better than the fourth quarter of 2014, and 16% better than the previous quarter. The International Operations delivered production of 745,000oz at AISC of $786/oz, which corresponded to a 7% decrease in production but a 17% improvement in AISC on the same quarter of 2014. OUTLOOK Production guidance for 2016 year is estimated to be between 3.6Moz to 3.8Moz. Total cash costs are estimated to be between $680/oz and $720/oz and all-in sustaining costs between $900/oz and $960/oz at average exchange rates against the US dollar of 15.00 (Rand), 4.00 (Brazil Real), 0.70 (Aus $) and 14.90 (Argentina Peso), with oil at $35/bl average for the year. Capital expenditure is anticipated to be between $790m and $850m, of which $120m to $140m is earmarked for projects. Corporate and marketing costs are estimated to be between $75m and $90m and expensed exploration and study costs including equity accounted investments at $130m to $150m. Depreciation and amortisation is forecast at $820m and interest and finance costs are expected to be $190m (income statement) and $175m (cash flow statement). http://www.anglogoldashanti.com/en/Media/Reports/Quarterly%20Reports/PR%2020160222_Q4Results.pdf Barrick Gold of North America (NYSE:ABX)(TSX:ABX) Our vision is the generation of wealth through responsible mining — wealth for our owners, our people, and the countries and communities with which we partner. We aim to be the leading mining company focused on gold, growing our cash flow per share by developing and operating high quality assets through disciplined allocation of human and financial capital and operational excellence. We are committed to a culture of partnership and the values underpinning such a culture: trust, transparency and shared responsibility and accountability. Our leaders must have deep emotional and financial ownership in the business. The company is returning to its roots as a lean and nimble organization, with minimal bureaucracy. As in Barrick’s early days, a small head office manages the company with a balance of entrepreneurialism and prudence, focusing on only a few core activities: defining and implementing strategy, allocating human and financial capital, and fulfilling the obligations required of a public company. Leaders at the operational level have greater autonomy, responsibility, and accountability, functioning as business owners. Free from bureaucracy and middle management, they are focused on maximizing free cash flow, and the head office is focused on allocating that cash flow to maximize shareholder returns. Barrick has mining operations in Argentina, Australia, Canada, Chile, Dominican Republic, Papua New Guinea, Peru, Saudi Arabia, United States and Zambia. More than 75 percent of the company’s gold production comes from the Americas region. http://www.barrick.com/company/default.aspx Barrick Reports Second Quarter 2016 Results July 27, 2016
• Barrick reported net earnings of $138 million ($0.12 per share), and adjusted net earnings1 of $158 million ($0.14 per share) for the second quarter. Second quarter EBITDA2 was $881 million.

United States – Mining
21 September 2016 19
https://twitter.com/acquisdata
https://www.facebook.com/acquisdata/
• The company reported revenues of $2.01 billion in the second quarter, and net cash provided by operating activities ("operating cash flow") was $527 million. Barrick generated $274 million in free cash flow3 in the second quarter, marking five consecutive quarters of positive free cash flow.
• Gold production in the second quarter was 1.34 million ounces at a cost of sales applicable to gold of $1.23 billion, and all-in sustaining costs4 of $782 per ounce.
• Compared to the first half of 2015, cost of sales applicable to gold has declined by 14 percent to $2.43 billion. Over the same period, we have reduced our all-in sustaining costs4 by 19 percent.
• For the full year, we expect cost of sales applicable to gold to be in the range of $5.2-$5.5 billion. All-in sustaining cost4 guidance for 2016 has been reduced to $750-$790 per ounce, down from $760-$810 per ounce at the end of the first quarter, and below our original 2016 guidance of $775-$825 per ounce. We continue to expect gold production of 5.0-5.5 million ounces for the year.
• We have reduced total debt by $968 million year-to-date, and remain on track to achieve our $2 billion debt reduction target for the year.
• Commercial production has commenced at the Jabal Sayid copper mine in Saudi Arabia. Reflecting this milestone, we have increased our 2016 copper guidance to 380-430 million pounds, up from our original guidance of 370-410 million pounds.
Barrick Gold Corporation (NYSE:ABX)(TSX:ABX) (Barrick or the company) today reported net earnings of $138 million ($0.12 per share) for the second quarter, and adjusted net earnings1of $158 million ($0.14 per share). Second quarter EBITDA2 was $881 million. Second quarter revenues were $2.01 billion and operating cash flow was $527 million. The company generated $274 million in free cash flow3 in the second quarter, marking five consecutive quarters of positive free cash flow. Second quarter cost of sales applicable to gold was $1.23 billion, a reduction of 13 percent compared to the prior-year period. Production in the quarter was 1.34 million ounces of gold at all-in sustaining costs4 of $782 per ounce. We continue to expect full-year production of 5.0-5.5 million ounces of gold. We expect cost of sales applicable to gold for 2016 to be in the range of $5.2-$5.5 billion. We have reduced our all-in sustaining cost4guidance to $750-$790 per ounce, down from our most recent range of $760-$810 per ounce. Our operations continued to deliver robust performance in the second quarter, demonstrating capital discipline, improved operational efficiency and productivity, and stronger cost management as we target Best-in-Class performance. This is driving growing margins and profitability across the entire business, in support of our overriding objective to grow free cash flow per share. At the same time, we continue to strengthen our balance sheet with nearly $1 billion in debt repayments completed so far this year, or roughly half of our $2 billion debt reduction target for 2016. Lower debt levels have better positioned the company to withstand gold price volatility while setting us up to invest in future growth. Barrick has the industry's largest gold reserves and resources, with an average reserve grade significantly higher than our peer group average.5 This represents an immense source of value and optionality for the company. Our Growth Group is actively advancing a strategy to grow our free cash flow per share by allocating capital to the opportunities with the best returns. We are pursuing a multi-faceted approach that will optimize the development of our existing reserves and resources, invest in exploration to discover the next major deposit, and assess external opportunities for acquisitions, seed financing, earn-ins, and other partnerships and joint ventures. Ultimately, the investments we make will be focused on growing our free cash flow per share while maintaining strict capital discipline, such that we are continuously upgrading the long-term value of our portfolio. Our existing operations will also contribute to growth by achieving step changes in performance that will drive down our cost structure and expand margins. We will do this by leveraging innovation and new technology, which is a core pillar of our Best-in-Class philosophy.

United States – Mining
21 September 2016 20
https://twitter.com/acquisdata
https://www.facebook.com/acquisdata/
FINANCIAL HIGHLIGHTS Second quarter net earnings were $138 million ($0.12 per share) compared to a net loss of $9 million ($0.01 per share) in the prior year period. Adjusted net earnings1 for the second quarter were $158 million ($0.14 per share), compared to $60 million ($0.05 per share) in the prior year period. Higher net earnings reflect a decrease in operating costs, particularly lower fuel and energy prices (even when factoring in fuel hedges above spot prices), favorable foreign exchange movements, reduced royalty expense, and the impact of Best-in-Class initiatives, including lower labor, contractor, and consumable costs, and other operating efficiencies. In addition, earnings benefited from lower exploration, evaluation, and project expenses. The company generated $881 million of EBITDA2 in the second quarter compared to $690 million in the prior year period. Second quarter revenues were $2.01 billion, compared to $2.23 billion in the prior year period. Operating cash flow in the second quarter was $527 million, compared to $525 million in the second quarter of 2015. Despite lower production as a result of non-core asset sales, operating cash flow remained in line with the prior year period. This was driven by higher gold prices and lower operating costs, as a result of lower energy and fuel costs, combined with lower labor, consumable, and contractor costs, and improved operating efficiencies driven by Best-in-Class initiatives. These gains were partially offset by an increase in working capital, combined with the impact of higher income taxes paid, compared to the prior year period. Free cash flow3 for the second quarter was $274 million, marking five consecutive quarters of positive free cash flow. This reflects our driving focus on maximizing free cash flow per share through capital discipline, improved operational efficiency and productivity, and stronger cost management. RESTORING A STRONG BALANCE SHEET Strengthening our balance sheet remains a top priority. In 2016, we intend to reduce our total debt by at least $2 billion by drawing on our existing cash balance, and by maximizing free cash flow from operations, as well as potential non-core asset sales. So far this year, we have reduced our total debt by $968 million, representing approximately half of our debt reduction target for the year. We will continue to pursue non-core asset sales with discipline, and will only proceed with transactions that make sense for the business, on terms we consider favorable to our shareholders. In this regard, we intend to initiate a process to explore the sale of our 50 percent stake in the KCGM operation in Western Australia. The company's liquidity position is strong and continues to improve, underpinned by free cash flow generation across the business, and modest near-term debt repayment obligations. At the end of the second quarter, Barrick had a consolidated cash balance of approximately $2.4 billion.6 The company now has less than $150 million7 in debt due before 2018, and about $5 billion of our outstanding debt of $9 billion does not mature until after 2032. Over the medium term, we aim to reduce our total debt to below $5 billion. OPERATING HIGHLIGHTS AND OUTLOOK Our over-arching objective as a business is to grow our free cash flow per share. In support of this objective, we are focused on driving industry-leading margins by improving the productivity and efficiency of our operations. This means a continuous, relentless cycle of improvement and innovation, underpinned by our Best-in-Class program. Our aspiration is to achieve all-in sustaining costs below $700 per ounce by 2019.

United States – Mining
21 September 2016 21
https://twitter.com/acquisdata
https://www.facebook.com/acquisdata/
Barrick produced 1.34 million ounces of gold in the second quarter at a cost of sales of $1.23 billion, compared to 1.45 million ounces at a cost of sales of $1.41 billion in the prior year period. All-in sustaining costs4 in the second quarter were $782 per ounce, compared to $895 per ounce in the second quarter of 2015. Excluding the impact of divested mines, production for the second quarter increased by 126,000 ounces. Compared to the first half of 2015, cost of sales applicable to gold declined by 14 percent to $2.43 billion, primarily due to fewer ounces sold as a result of divestments. Cost of sales at our remaining operations was in line with the prior-year period, with higher grades and sales volumes offset by a decrease in direct mining costs. Compared to the first half of 2015, all-in sustaining costs4 have fallen by 19 percent. These reductions reflect decreased direct mining costs, particularly lower fuel and energy prices, reduced royalty expense, and the impact of Best-in-Class initiatives, including lower labor, contractor, and consumable costs, and more predictive and precise maintenance. Lower mine site sustaining capital expenditures and a higher proportion of production from lower cost operations also contributed to lower all-in sustaining costs. Please see page 31 of Barrick's Second Quarter 2016 Management Discussion and Analysis for individual operating segment performance details. We continue to expect full-year gold production of 5.0-5.5 million ounces. For the full year, we expect cost of sales applicable to gold to be in the range of $5.2-$5.5 billion. We have reduced our all-in sustaining cost4 guidance for 2016 to $750-$790 per ounce, down from $760-$810 per ounce at the end of the first quarter, and below our original 2016 guidance of $775-$825 per ounce. All-in sustaining costs are now expected to be highest in the third quarter, reflecting a shift in the timing of certain sustaining capital expenditures to the second half of the year. Capital expenditures for 2016 are now expected to be $1.25-$1.40 billion, down from $1.35-$1.55 billion at the end of the first quarter, and below our original 2016 guidance range of $1.35-$1.65 billion. As we continue to embed Best-in-Class across the portfolio, we expect to identify additional savings opportunities over the course of the year.
Second Quarter Current Original Gold 2016 2016 Guidance 2016 Guidance Production8 (000s of ounces) 1,340 5,000-5,500 5,000-5,500 Cost of sales applicable to gold ($millions) 1,227 5,200-5,500 N/A All-in sustaining costs4 ($per ounce) 782 750-790 775-825 Cash costs4($per ounce) 578 540-570 550-590 Copper Production8(millions of pounds) 103 380-430 370-410 Cost of sales applicable to copper ($millions) 79 275-320 N/A All-in sustaining costs9($per pound) 2.14 1.95-2.25 2.05-2.35 C1 cash costs9($per pound) 1.52 1.35-1.65 1.45-1.75 Total Capital Expenditures10($millions) 284 1,250-1,400 1,350-1,650 Mine Site Guidance Updates Based on improved operational performance, we now anticipate higher production and lower costs at both Cortez and Turquoise Ridge. Cortez is now expected to produce 980,000-1,050,000 ounces of gold at all-in sustaining costs4 of $520-$550 per ounce, compared to our previous guidance range of 900,000-1,000,000 ounces at all-in sustaining costs of $580-$640 per ounce. At Turquoise Ridge, our share of production is now anticipated to be in the range of 240,000-260,000 ounces of gold at all-in sustaining costs of $640-$700 per ounce, compared to our previous guidance range of 200,000-220,000 ounces at all-in sustaining costs of $770-$850 per ounce.

United States – Mining
21 September 2016 22
https://twitter.com/acquisdata
https://www.facebook.com/acquisdata/
Reflecting the impact of severe winter weather conditions in the first half of 2016, we now expect full year gold production at Veladero to be in the range of 580,000-640,000 ounces, down from our previous guidance of 630,000-690,000 ounces. All-in sustaining cost4 guidance remains unchanged at $790-$860 per ounce.
Copper
Copper production in the second quarter was 103 million pounds at a cost of sales of $79 million, and all-in sustaining costs9of $2.14 per pound. The Jabal Sayid project, a 50-50 joint venture with Saudi Arabian Mining Company (Ma'aden), commenced commercial production on July 1. Barrick's share of 2016 copper production from Jabal Sayid is expected to be 10-20 million pounds at all-in sustaining costs of $2.80-$3.10 per pound. The mine is expected to ramp up to a production rate of about 100 million pounds per year in the second half of 2017, as additional underground development is completed.
Reflecting the start of commercial production at Jabal Sayid, we have increased our copper production guidance for 2016 to 380-430 million pounds, up from our original guidance of 370-410 million pounds. For the full year, we expect cost of sales applicable to copper to be in the range of $275-$320 million. Copper all-in sustaining cost9 guidance remains unchanged at $1.95-$2.25 per pound.
In June 2016, the Zambian government passed legislation to amend the royalty tax for mining operations to a variable rate based on the prevailing copper price, effective June 1, 2016. These rates are four percent at copper prices below $2.04; five percent at copper prices between $2.04 and $2.72; and six percent at copper prices of $2.72 and above. Legislation was also passed to remove the 15 percent variable profit tax on income from mining companies. Our 2016 copper guidance takes into consideration the revised royalty rates commencing June 1.
BEST-IN-CLASS IN ACTION
Pueblo Viejo Autoclaves Case Study
Applying Creative Thinking and Knowledge to Unlock Potential
The key to unlocking the massive refractory ore body at Pueblo Viejo rests within four giant autoclaves-the largest ever used in the gold mining industry. Each autoclave weighs 780 tonnes, and is roughly 38 meters long and six meters in diameter-about as wide as a Boeing 747 fuselage. Improving the availability and throughput of the autoclaves has the potential to unlock substantial value for the mine.
Until recently, each autoclave has required, on average, a 22-day maintenance shutdown every six months. Large metal walls that separate the compartments inside each autoclave begin to fail as a result of the forces generated by continuous agitation of the ore slurry. A buckled or failed wall can interfere with normal operation, damaging the agitator blades and shafts, and accelerating the build-up of scale and sand, thereby requiring frequent maintenance.
Challenging and pushing past technical limits is a critical component of our Best-in-Class philosophy. Faced with this challenge, the team at Pueblo Viejo came up with a plan to increase autoclave availability and throughput by extending the period between maintenance shutdowns-from every six months, to every seven or potentially eight months.
To achieve this, the team applied Barrick's extensive autoclave operating experience to propose a number of critical modifications to the autoclaves. High oxidization rates inside the autoclaves implied the number of interior compartments could be reduced, thereby mitigating the build-up of scale, and the associated maintenance requirements. However, the remaining compartment walls would continue to fail at a similar rate, limiting the potential gains. To solve this problem, the team worked with an engineering partner to develop a new design for the interior compartment walls. The design better integrates the walls into the autoclaves using stronger titanium structure sections, improved bracing, and larger bolts.

United States – Mining
21 September 2016 23
https://twitter.com/acquisdata
https://www.facebook.com/acquisdata/
The new walls have been successfully installed in two of the mine's four autoclaves. Initial results have been positive, indicating that increased run-time between shutdown maintenance is achievable. If successful in all four autoclaves, this initiative has the potential to increase throughput at Pueblo Viejo by 240,000 tonnes per year (100 percent basis), increasing autoclave availability from 84 percent to 86.5 percent-driving increased production, lower unit costs, and additional free cash flow from the operation. Other benefits include reducing materials cost for autoclave maintenance work (spare parts, valves, and ancillary equipment), and reducing contractor costs, due to fewer shutdowns per year.
Goldstrike Open Pit Haulage Case Study
When Challenging Conventional Wisdom Pays Off
Over nearly 30 years of managing one of the largest open pit gold mines in the world, conventional wisdom at Goldstrike suggested that the technical limit for open pit haul truck utilization was 79 percent, taking into account the mine runs two open pits seven miles apart. In simple terms, for every hour of potential operating time, the average truck achieved about 48 minutes of productive work time. At the end of 2015, the mine was operating a fleet of 29 Komatsu 930 haul trucks.
Motivated by a desire to challenge conventional wisdom in pursuit of Best-in-Class performance, the open pit team at Goldstrike evaluated how to increase haul truck availability to a level the mine had never achieved. Drawing on other experiences from across the industry, they came up with a concept that allows some haul trucks to be parked, while significantly increasing utilization of the trucks remaining in service. The secret was breaks-but not the brakes on the trucks. Typically, when haul truck drivers at Goldstrike were scheduled to take a break, they simply pulled over in a safe location and enjoyed a rest, usually spent inside the cab of the truck itself. This had trucks idling, rather than engaging in productive work.
Earlier this year, Goldstrike began testing a new system. The mine is in the process of installing a series of modular break rooms at strategic locations around the open pit where drivers can rest. While drivers are on break, relief drivers take over operation of the trucks. In just six months, the results have been impressive: a six percent improvement in haul truck utilization in the open pit, moving from 79 percent to 85 percent; and six haul trucks taken out of the fleet. Today, the mine is moving the same amount of material in the open pit, with fewer trucks. This initiative, combined with other improvement projects, has helped to reduce open pit mining costs at Goldstrike from $1.40 per tonne at the start of the year to $1.25 per tonne today. The shift to using properly-configured break rooms also increases safety, by promoting a more restful environment for operators.
As often happens, when you remove one bottleneck, other opportunities for improvement present themselves. The open pit team is now evaluating how to further optimize shovel use at the mine, matching the right shovels with the right haulage plans and ore types.
TECHNICAL INFORMATION
The scientific and technical information contained in this press release has been reviewed and approved by Steven Haggarty, P. Eng., Senior Director, Metallurgy of Barrick who is a "Qualified Person" as defined in National Instrument 43-101 - Standards of Disclosure for Mineral Projects.
ENDNOTE 1
"Adjusted net earnings" and "adjusted net earnings per share" are non-GAAP financial performance measures. Adjusted net earnings excludes the following from net earnings: certain impairment charges (reversals), gains (losses) and other one-time costs relating to acquisitions or dispositions, foreign currency translation gains (losses), significant tax adjustments not related to current period earnings and unrealized gains (losses) on non-hedge derivative instruments. The company uses this measure internally to evaluate our underlying operating performance for the reporting periods presented and to assist with the planning and forecasting of future operating results. Barrick believes that adjusted net earnings is a useful measure of our performance because these adjusting items do not reflect the underlying operating performance of our core mining business and are not necessarily indicative of future

United States – Mining
21 September 2016 24
https://twitter.com/acquisdata
https://www.facebook.com/acquisdata/
operating results. Adjusted net earnings and adjusted net earnings per share are intended to provide additional information only and do not have any standardized meaning under IFRS and may not be comparable to similar measures of performance presented by other companies. They should not be considered in isolation or as a substitute for measures of performance prepared in accordance with IFRS. Further details on these non-GAAP measures are provided in the MD&A accompanying Barrick's financial statements filed from time to time on SEDAR at http://www.sedar.com/ and on EDGAR at http://www.sec.gov/.
ENDNOTE 2
"EBITDA" and "adjusted EBITDA" are non-GAAP financial performance measures. EBITDA excludes income tax expense, finance costs, finance income and depreciation from net earnings. Barrick believes that EBITDA is a valuable indicator of our ability to generate liquidity by producing operating cash flow. EBITDA is also frequently used by investors and analysts for valuation purposes. Adjusted EBITDA removes the effect of "impairment charges" which are not reflective of our ability to generate liquidity by producing operating cash flow. EBITDA and adjusted EBITDA are intended to provide additional information only and do not have any standardized meaning under IFRS and may not be comparable to similar measures of performance presented by other companies. They should not be considered in isolation or as a substitute for measures of performance prepared in accordance with IFRS. Further details on these non-GAAP measures are provided in the MD&A accompanying Barrick's financial statements filed from time to time on SEDAR at http://www.sedar.com/ and on EDGAR at http://www.sec.gov/.
ENDNOTE 3
"Free cash flow" is a non-GAAP financial performance measure which excludes capital expenditures from Net cash provided by operating activities. Barrick believes this to be a useful indicator of our ability to operate without reliance on additional borrowing or usage of existing cash. Free cash flow is intended to provide additional information only and does not have any standardized meaning under IFRS and may not be comparable to similar measures of performance presented by other companies. Free cash flow should not be considered in isolation or as a substitute for measures of performance prepared in accordance with IFRS.
ENDNOTE 4
"Cash costs" per ounce and "All-in sustaining costs" per ounce are non-GAAP financial performance measures. "Cash costs" per ounce is based on cost of sales but excludes, among other items, the impact of depreciation. "All-in sustaining costs" per ounce begins with "Cash costs" per ounce and adds further costs which reflect the additional costs of operating a mine, primarily sustaining capital expenditures, general & administrative costs and minesite exploration and evaluation costs. Barrick believes that the use of "cash costs" per ounce and "all-in sustaining costs" per ounce will assist investors, analysts and other stakeholders in understanding the costs associated with producing gold, understanding the economics of gold mining, assessing our operating performance and also our ability to generate free cash flow from current operations and to generate free cash flow on an overall company basis. "Cash costs" per ounce and "All-in sustaining costs" per ounce are intended to provide additional information only and do not have any standardized meaning under IFRS. Although a standardized definition of all-in sustaining costs was published in 2013 by the World Gold Council (a market development organization for the gold industry comprised of and funded by 18 gold mining companies from around the world, including Barrick), it is not a regulatory organization, and other companies may calculate this measure differently. These measures should not be considered in isolation or as a substitute for measures prepared in accordance with IFRS. Further details on these non-GAAP measures are provided in the MD&A accompanying Barrick's financial statements filed from time to time on SEDAR at http://www.sedar.com/ and on EDGAR at http://www.sec.gov/.
ENDNOTE 5
Comparison based on the total reserves and resources and average overall reserve grade for Goldcorp Inc., Kinross Gold Corporation, Newmont Mining Corporation, and Newcrest Mining Limited, as reported in each of the reserve

United States – Mining
21 September 2016 25
https://twitter.com/acquisdata
https://www.facebook.com/acquisdata/
reports for Goldcorp Inc., Kinross Gold Corporation, Newmont Mining Corporation, and Newcrest Mining Limited as of December 31, 2015.
ENDNOTE 6
Includes $699 million cash held at Acacia and Pueblo Viejo, which may not be readily deployed outside of Acacia and/or Pueblo Viejo.
ENDNOTE 7
Amount excludes capital leases and includes project financing payments at Pueblo Viejo (60 percent basis) and Acacia (100 percent basis).
ENDNOTE 8
Barrick's share.
ENDNOTE 9
"C1 cash costs" per pound and "All-in sustaining costs" per pound are non-GAAP financial performance measures. "C1 cash costs" per pound is based on cost of sales but excludes the impact of depreciation and royalties and includes treatment and refinement charges. "All-in sustaining costs" per pound begins with "C1 cash costs" per pound and adds further costs which reflect the additional costs of operating a mine, primarily sustaining capital expenditures, general & administrative costs and royalties. Barrick believes that the use of "C1 cash costs" per pound and "all-in sustaining costs" per pound will assist investors, analysts, and other stakeholders in understanding the costs associated with producing copper, understanding the economics of copper mining, assessing our operating performance, and also our ability to generate free cash flow from current operations and to generate free cash flow on an overall company basis. "C1 cash costs" per pound and "All-in sustaining costs" per pound are intended to provide additional information only, do not have any standardized meaning under IFRS, and may not be comparable to similar measures of performance presented by other companies. These measures should not be considered in isolation or as a substitute for measures of performance prepared in accordance with IFRS. Further details on these non-GAAP measures are provided in the MD&A accompanying Barrick's financial statements filed from time to time on SEDAR at http://www.sedar.com/ and on EDGAR at http://www.sec.gov/.
ENDNOTE 10
Barrick's share on an accrued basis.
ENDNOTE 11
Operating unit guidance ranges for production reflect expectations at each individual operating unit, but do not add up to corporate-wide guidance range total.
ENDNOTE 12
We have combined our previous capital expenditure categories of Minesite expansion and Projects into one category called Project.
ENDNOTE 13
Due to our fuel hedging activities, which are reflected in these sensitivities, we are partialy protected against changes in this factor.
http://www.barrick.com/investors/news/news-details/2016/Barrick-Reports-Second-Quarter-2016-Results/default.aspx

United States – Mining
21 September 2016 26
https://twitter.com/acquisdata
https://www.facebook.com/acquisdata/
Consol Energy, Inc (NYSE: CNX)
CONSOL Energy, a publicly owned Pittsburgh-based producer of natural gas and coal, is one of the leading diversified energy companies in the United States of America. Our premium Appalachian coals are sold worldwide to electricity generators and steelmakers, and our Natural Gas Division has grown from a pure-play coalbed methane producer to a full-fledged exploration and production operation. We are a leading producer in the Marcellus Shale and we conduct an active exploration program in the Utica Shale.
Since our founding in 1860 and our first active mining operations in 1864, CONSOL has powered the nation with affordable, abundant, reliable domestic energy. Today, CONSOL's employees help generate the fuels - natural gas and coal - that comprise two thirds of the nation's power supply. Our energy supports the American way of life by helping deliver electricity 24/7, creating family-sustaining jobs and keeping our nation competitive in the global marketplace.
Our strong record of environmental stewardship and our commitment to community have helped enable us to become the dynamic and accomplished energy company we are today. CONSOL Energy maintains the largest private research and development facility in the U.S. industry that is devoted exclusively to coal and energy utilization and production. In addition to supporting the production of CONSOL Energy's gas and coal operations, it also focuses on energy development, improving energy efficiency and reducing pollution. This facility was borne out of our core values -Safety, Compliance and Continuous Improvement - and enables us to identify opportunities and implement solutions that drive safety, production, and utilization of our strategic resources in smarter, more efficient ways.
CONSOL Energy's coal mines are highly technical operating environments that require specialized training. The days of pick axes and shovels have been replaced with technologically advanced processes such as longwall mining, enhanced safety protocols, digital technologies and sophisticated communications technologies such as those employed at our centralized Communications Center at corporate headquarters. These advances have helped make the mining process safer and more productive, more than doubling resource recovery.
CONSOL Energy's natural gas operations include coal bed methane extraction, conventional and shale gas exploration and production, all of which require expertise and technology that continues to evolve and advance. From safety to environmental protocols, techniques and equipment, advances in these areas are continuous, improving recovery, enhancing safety, and providing more environmentally protective methods.
http://www.consolenergy.com/about-us/about-consol-energy.aspx
CONSOL Energy Reports Second Quarter Results; Record Quarterly E&P Production of 99.3 Bcfe; Decreased E&P Division Operating Costs to $2.27 Per Mcfe; Decreased 2016 E&P Division Capital Budget to $190-$205 Million; Increased 2016 E&P Division Production Guidance to 380-385 Bcfe
July 26, 2016 CONSOL Energy Inc. (NYSE: CNX) reported net cash provided by operating activities in the just-ended quarter of $95 million, compared to $66 million in the year-earlier quarter, which includes $12 million and $24 million of net cash provided by discontinued operating activities, respectively. "During the quarter, CONSOL drove down E&P unit costs by 18%, compared to the prior-year quarter, generated $46 million in organic free cash flow from continuing operations1, paid down approximately $390 million in debt, and increased estimated ultimate recoveries (EURs) in its prolific Marcellus Shale Green Hill field to 3.0-3.5 Bcfe," commented Nicholas J. DeIuliis, president and CEO. "These accomplishments not only helped us exceed our internal 18-month free cash flow plan, but also drove our NAV per share and liquidity position higher. As a result, we have made the decision to employ a two-rig program in the second half of 2016 since expected rates of return nicely exceed our cost of capital, while supporting our free cash flow plan and liquidity goals. Despite the decision to resume modest drilling activity, which will add approximately $25 million of capital expenditures in 2016, CONSOL expects

United States – Mining
21 September 2016 27
https://twitter.com/acquisdata
https://www.facebook.com/acquisdata/
the annual E&P Division capital budget to decrease to $190-$205 million due to continued capital efficiency improvements. CONSOL's main focus remains staying disciplined on deploying capital in order to grow our NAV per share." On a GAAP basis, the second quarter earnings included the following pre-tax items attributable to continuing operations: Recorded a $279.7 million unrealized loss on commodity derivative instruments, related to changes in the fair market value of existing hedges on a mark-to-market basis; Recorded a $13.7 million loss related to pension settlement, caused by lump sum distributions from the plan which increased due to the sale of the Buchanan Mine in the first quarter of 2016; Recorded a $6.3 million gain related to a customer's partial buyout of a coal contract; and, Recorded $1.5 million in expense related to severance in connection with the company's ongoing cost reduction efforts. Taking these items into account, the company reported a net loss from continuing operations of $233 million for the quarter, or ($1.02) per diluted share. Including the loss from discontinued operations, net of tax, of $236 million, less net income attributable to noncontrolling interest, the company reported a net loss attributable to CONSOL Energy shareholders of $470 million or ($2.05) per diluted share. Earnings before deducting net interest expense (interest expense less interest income), income taxes and depreciation, depletion and amortization (EBITDA), from continuing operations1 were a negative $151 million for the 2016 second quarter, compared to a negative $695 million in the year-earlier quarter. After adjusting for certain items, which are listed in the EBITDA reconciliation table, the company had an adjusted net loss from continuing operations1 in the 2016 second quarter of $49 million, or ($0.21) per diluted share. Adjusted EBITDA from continuing operations1 was $136 million for the 2016 second quarter, compared to $138 million in the year-earlier quarter.
CONSOL Energy's Miller Creek Mining Complex and Fola Mining Complex subsidiaries have entered into agreements for the sale of those Central Appalachia mining operations. The Miller Creek Complex, located in West Virginia, has an active surface mining operation, which produced 2.1 million tons in 2015, and two underground mines, which are idle. The Fola Mining Complex is a closed surface mining operation in West Virginia. The Miller Creek and Fola Mining Complexes each have 114 million tons of owned and leased coal reserves, and they have a total of $103 million of mine closing and reclamation liabilities on CONSOL's Consolidated Balance Sheets. These assets and liabilities are classified as held for sale in discontinued operations on the company's Consolidated Balance Sheets, their results of operations are included in discontinued operations on the Consolidated Statement of Income, and the reclassification of these assets resulted in an impairment charge of $356 million in the quarter.
In the transaction, the buyer will acquire the Miller Creek and Fola assets and will assume the Miller Creek and Fola mine closing and reclamation liabilities; in order to equalize the value exchange, CONSOL will pay the buyer $27 million cash at the closing, of which a portion will be held in escrow for purposes of obtaining the surety bonds required for the permits to transfer, and an additional $17 million in installments over the next four years. These payments will result in an additional loss of $44 million that CONSOL expects to record during the third quarter of 2016. CONSOL Energy estimated a negative EBITDA contribution for full year 2016 associated with these assets. The transaction is expected to close in the third quarter.
1The terms "adjusted net loss from continuing operations," "EBITDA from continuing operations," "adjusted EBITDA from continuing operations," "free cash flow," and "organic free cash from continuing operations" are non-GAAP financial measures, which are defined and reconciled to the GAAP net income below, under the caption "Non-GAAP Financial Measures."

United States – Mining
21 September 2016 28
https://twitter.com/acquisdata
https://www.facebook.com/acquisdata/
E&P Division: CONSOL plans to add back two horizontal rigs to resume drilling starting in August 2016. The company expects to drill 8 dry Utica Shale wells, located in Monroe County, Ohio, where CONSOL maintains a 100% working interest, and 2 Marcellus Shale wells, located in Washington County, Pennsylvania, which fall within the joint venture where CONSOL maintains a 50% working interest. The 2 new Marcellus Shale wells are located on a 6-well pad that contains 4 existing drilled but uncompleted (DUC) wells. CONSOL expects to finish drilling the remaining 2 wells in order to complete the pad. CONSOL expects that the lateral length for the 10 wells to average approximately 8,700 feet. Despite the planned increased drilling activity, due to continued capital efficiency improvements, the company reduced its E&P Division capital budget to $190-$205 million. CONSOL expects to see a partial year production benefit from these new wells starting inApril 2017. Also, the company anticipates its DUC well inventory to grow to 91 gross Marcellus and Utica shale wells exiting 2016, which includes 76 wells that are located in the wet areas.
During the second quarter of 2016, CONSOL's E&P Division achieved record production of 99.3 Bcfe, or an increase of 32% from the 75.5 Bcfe produced in the year-earlier quarter. The E&P Division's total unit cash costs declined during the quarter to $1.23 per Mcfe, compared to $1.58 per Mcfe during the year-earlier quarter, or an improvement of approximately 22%, driven by reductions to lease operating and gathering, transportation, and compression expenses.
Marcellus Shale production volumes, including liquids, in the 2016 second quarter were 53.1 Bcfe, or 33% higher than the 39.9 Bcfe produced in the 2015 second quarter. Marcellus Shale total unit cash costs were $1.27 per Mcfe in the just-ended quarter, which is a $0.31 per Mcfe improvement from the second quarter of 2015 cash costs of $1.58 per Mcfe, which benefited in part from the company requiring less processing by shifting more towards drier gas.
CONSOL Energy's Utica Shale production volumes, including liquids, in the 2016 second quarter were 23.3 Bcfe, up from 10.7 Bcfe in the year-earlier quarter. Utica Shale total unit cash costs were $0.83 per Mcfe in the just-ended quarter, which is a $0.39 per Mcfe improvement from the second quarter of 2015 total unit cash costs of $1.22 per Mcfe. The significant cost improvements across the Utica Shale were primarily driven by reductions to lease operating expenses and gathering and transportation.
E&P Division capital expenditures declined further in the second quarter to $23.4 million, when compared to the first quarter of 2016, due to further efficiency improvements and reduced activity.
E&P Division Second Quarter Operations Summary: CONSOL's E&P activity continued to focus on completing the company's DUC inventory in the second quarter.
During the quarter, CONSOL began completion operations on a 6-well pad in Greene County, completing two of the wells. Also, CONSOL turned-in-line (TIL) 16 Marcellus Shale wells in Greene, Washington, and Allegheny counties, Pennsylvania, which included the first pad located at the company's Pittsburgh International Airport project. CONSOL's Green Hill Marcellus Shale wells located in Greene County, Pennsylvania, continue to outperform, with EURs now at 3.0-3.5 Bcfe per 1,000 feet of lateral. In the Utica Shale CONSOL's joint venture partner completed two wells and TIL five wells in Harrison County, Ohio.
CONSOL's previously completed 10-well GH53 pad, which was completed in the first quarter of 2016 and incorporated plugless completion technology, has now cumulatively produced over 4.8 Bcfe in its first 60 days of production with 9 out of 10 wells in-line, with one well shut-in due to an offset well completion. The strongest well on the GH53 pad, the GH53F, has produced 0.83 Bcfe in its first 60 days. Lastly, CONSOL's 12-well GH46 pad located in Greene County, Pennsylvania, which was previously completed and TIL in the first quarter of 2016, has cumulatively produced 10.5 Bcfe in the first 90 days of production.

United States – Mining
21 September 2016 29
https://twitter.com/acquisdata
https://www.facebook.com/acquisdata/
CONSOL's confidence in the dry Utica program grows as time progresses and as the company continues to monitor the performance of the dry Utica Shale wells in Monroe County, Ohio, and Greene and Westmoreland counties, Pennsylvania. CONSOL's Gaut 4I well, in Westmoreland County, Pennsylvania, remains the second strongest producing well in the dryUtica across the industry. The Gaut 4I well has cumulatively produced 3.4 Bcfe in its first six months.
E&P Marketing Update:
For the second quarter of 2016, CONSOL's average sales price for natural gas, natural gas liquids (NGL), oil, and condensate was $2.50 per Mcfe. CONSOL's average price for natural gas was $1.58 per Mcf for the quarter and, including cash settlements from hedging, was $2.49 per Mcf. The average realized price for all liquids for the second quarter of 2016 was $15.73 per barrel.
In April, CONSOL began recovering and selling ethane primarily via Sunoco Logistics' Mariner East project, which ships ethane to the Marcus Hook Industrial Complex for export. Such ethane sales are expected to improve NGL netbacks. On an equivalent basis, during the second quarter of 2016 these ethane sales yielded a significantly higher price than the Texas Eastern M2 market where sales would generally have occurred had the volumes been rejected into the natural gas stream. CONSOL expects further revenue enhancement in 2016 and beyond as its recovered ethane volumes grow and as the Mariner East project expands in 2017.
Coal Division:
CONSOL Energy's Pennsylvania Operations sold 6.2 million tons in the 2016 second quarter, compared to 5.7 million tons during the year-earlier quarter. The Board of Directors of CNX Coal Resources' LP (NYSE: CNXC) General Partner declared a cash distribution of $0.5125 per unit to the Partnership's common unitholders for the second quarter of 2016. The distribution will be made on August 15, 2016 to the common unitholders of record at the close of business on August 8, 2016. The General Partner has elected to not pay a distribution to holders of subordinated units, as a result of the current distribution coverage shortfall, to preserve liquidity and maintain balance sheet strength. The expected cash impact to CONSOL Energy is approximately $6 million starting in the third quarter of 2016.
Coal Division Second Quarter Summary:
During the second quarter of 2016, the Pennsylvania Operations total unit costs were $34.46 per ton, compared to $44.15 per ton in the year-earlier quarter.
As reported by CNX Coal Resources LP (CNXC) in their second quarter 2016 earnings press release, dated July 25, 2016, "From an operational standpoint, the second quarter came in ahead of our expectations primarily due to higher shipments. Our operational team delivered those tons despite four longwall moves, difficult mining conditions at the Enlow Fork Mine, and difficult longwall recovery conditions during one of the Bailey longwall moves. The Harvey Mine, which was idled in January 2016, was brought back online during the second quarter to meet customer demands, while the Bailey and Enlow Fork mines were undergoing longwall moves. Based on our current outlook for shipment volumes, we expect to run all five longwalls for the rest of 2016. Productivity for the second quarter, as measured by tons per employee-hour, improved by 17% compared to the year-ago period, despite the higher number of longwall moves negatively impacting production. For the third quarter, CNXC expects coal shipments and average realized price per ton to increase slightly, and cost of coal sold per ton to decrease compared to the second quarter."
During the quarter, CONSOL's active coal operations generated $78 million of cash from continuing operations before capital expenditures.

United States – Mining
21 September 2016 30
https://twitter.com/acquisdata
https://www.facebook.com/acquisdata/
E&P Division Guidance:
CONSOL Energy increases its annual 2016 E&P Division production to 380-385 Bcfe, compared to previous quarter's guidance of approximately 378 Bcfe.
Liquidity:
As of June 30, 2016, CONSOL Energy had $1,313.7 million in total liquidity, which is comprised of $88.7 million of cash, excluding the CNXC cash balance, and $1,225.0 million available to be borrowed under its $2.0 billion bank facility. During the quarter, CONSOL's liquidity improved $34.0 million due to $56.6 million of cash generated from operations offset by an increase of $22.6 million in outstanding letters of credit. In addition, CONSOL holds 12.7 million CNXC limited partnership units with a current market value of approximately $138 million and 19.1 million CONE Midstream Partners LP ("CNNX") limited partnership units with a current market value of approximately $325 million, as of July 19, 2016.
CONSOL Energy used the $66.3 million of free cash flow generated during the quarter and the $426.7 million of the cash on hand from March 31, 2016 to reduce outstanding borrowings on the revolving credit facility, which increased liquidity and de-levered the balance sheet.
"While we have seen the industry issue equity to improve liquidity and manage leverage ratios, CONSOL has focused on cutting costs, improving capital efficiencies, and monetizing assets," commented David M. Khani, executive vice president and CFO. "Over the past two years, the company has reduced administrative costs and legacy liabilities by several hundred million dollars per year, reduced E&P operating cash costs on a per unit basis by approximately 34%, and sold over $1.3 billion of assets. Also, since implementing our free cash flow plan in the second quarter of 2015, we have paid down debt by approximately $650 million, which excludes approximately $200 million of CNXC revolver borrowings that are consolidated on CONSOL's balance sheet."
http://phx.corporate-ir.net/phoenix.zhtml?c=66439&p=irol-newsArticle&ID=2188143
Freeport McMoran Copper (NYSE: FCX) Freeport-McMoRan Inc. (FCX) is a premier U.S.-based natural resources company with headquarters in Phoenix, Arizona. FCX operates large, long-lived, geographically diverse assets with significant proven and probable reserves of copper, gold, molybdenum, cobalt, oil and natural gas. FCX has a dynamic portfolio of operating, expansion and growth projects in the copper industry. FCX is the world’s largest publically traded copper producer, the world’s largest producer of molybdenum and a significant gold, oil and natural gas producer. FCX’s portfolio of minerals assets includes the Grasberg minerals district in Indonesia, one of the world’s largest copper and gold deposits; significant mining operations in the Americas, including the large-scale Morenci minerals district in North America and the Cerro Verde operation in South America; and the Tenke Fungurume minerals district in the Democratic Republic of Congo. FCX’s portfolio of oil and natural gas assets includes significant oil production facilities and growth potential in the Deepwater Gulf of Mexico (GOM), established oil production onshore and offshore California, large onshore natural gas resources in the Haynesville shale play in Louisiana, natural gas production from the Madden area in central Wyoming, and a position in the Inboard Lower Tertiary/Cretaceous natural gas trend located onshore in South Louisiana. Our global workforce, comprised of employees and contractors, includes approximately 80,000 members. FCX has a strong commitment to safety performance, environmental management and to the local communities where it
United States – Mining
21 September 2016 31
https://twitter.com/acquisdata
https://www.facebook.com/acquisdata/
operates. FCX is a founding member of the International Council on Mining and Metals (ICMM) and committed to implementation of the ICMM Sustainable Development Framework. Our stock trades on the New York Stock Exchange under the ticker symbol “FCX”. http://www.fcx.com/company/who.htm Freeport-McMoRan Reports Second-Quarter and Six-Month 2016 July 26, 2016 Freeport-McMoRan Inc. (NYSE: FCX):
• Net loss attributable to common stock totaled $479 million, $0.38 per share, for second-quarter 2016. After adjusting for net charges totaling $452 million, $0.36 per share, second-quarter 2016 adjusted net loss attributable to common stock totaled $27 million, $0.02 per share.
• Consolidated sales (including volumes from Tenke Fungurume (Tenke), which is being reported as a discontinued operation) totaled 1.1 billion pounds of copper, 156 thousand ounces of gold, 19 million pounds of molybdenum and 12.4 million barrels of oil equivalents (MMBOE) for second-quarter 2016, compared with 964 million pounds of copper, 352 thousand ounces of gold, 23 million pounds of molybdenum and 13.1 MMBOE for second-quarter 2015.
• Consolidated sales for the year 2016 (including volumes from Tenke through the anticipated closing date) are expected to approximate 5.0 billion pounds of copper, 1.7 million ounces of gold, 76 million pounds of molybdenum and 47.4 MMBOE, including 1.3 billion pounds of copper, 410 thousand ounces of gold, 20 million pounds of molybdenum and 11.4 MMBOE for third-quarter 2016.
• Average realized prices were $2.18 per pound of copper, $1,292 per ounce for gold and $41.10 per barrel for oil for second-quarter 2016.
• Average unit net cash costs were $1.33 per pound of copper for mining operations and $15.00 per barrel of oil equivalents (BOE) for oil and gas operations for second-quarter 2016. Unit net cash costs for the year 2016 are expected to average $1.06 per pound of copper for mining operations (including Tenke) and $15.50 per BOE for oil and gas operations.
• Operating cash flows totaled $874 million (including $278 million in working capital sources and changes in other tax payments) for second-quarter 2016. Based on current sales volume and cost estimates and assuming average prices of $2.25 per pound for copper, $1,300 per ounce for gold, $6 per pound for molybdenum and $48 per barrel for Brent crude oil for the second half of 2016, operating cash flows for the year 2016 are expected to approximate $4.5 billion (including $0.7 billion in working capital sources and changes in other tax payments).
• Capital expenditures totaled $833 million for second-quarter 2016, consisting of $441 million for mining operations (including $350 million for major projects) and $392 million for oil and gas operations. Capital expenditures are expected to approximate $3.1 billion for the year 2016, consisting of $1.7 billion for mining operations (including $1.3 billion for major projects) and $1.4 billion for oil and gas operations.
• During second-quarter 2016, FCX completed previously announced asset sales for aggregate cash consideration of $1.3 billion, including the $1.0 billion sale of an additional 13 percent undivided interest in Morenci. In May 2016, FCX entered into a definitive agreement to sell its interest in TF Holdings Limited for $2.65 billion in cash and contingent consideration of up to $120 million. In accordance with accounting guidelines, the results of Tenke are reported as discontinued operations for all periods presented.

United States – Mining
21 September 2016 32
https://twitter.com/acquisdata
https://www.facebook.com/acquisdata/
• During second-quarter 2016, FCX entered into agreements to terminate FM O&G's three drilling rig contracts for a total of $755 million and potential contingent consideration depending on future oil prices. The settlements result in aggregate savings of approximately $350 million, compared to the previously contracted commitments.
• Through July 25, 2016, FCX exchanged $369 million in senior notes for approximately 28 million shares of its common stock in a series of privately negotiated transactions, including $268 million exchanged during second-quarter 2016.
• At June 30, 2016, consolidated debt totaled $19.3 billion and consolidated cash totaled $352 million. At June 30, 2016, FCX had no borrowings and $3.5 billion available under its $3.5 billion revolving credit facility.
Freeport-McMoRan Inc. (NYSE: FCX) reported net losses attributable to common stock of $479 million, $0.38 per share, for second-quarter 2016 and $4.7 billion, $3.70 per share, for the first six months of 2016, compared with $1.85 billion, $1.78 per share, for second-quarter 2015 and $4.3 billion, $4.16 per share, for the first six months of 2015. FCX’s net losses attributable to common stock include net charges totaling $452 million, $0.36 per share, for second-quarter 2016 and $4.4 billion, $3.53 per share, for the first six months of 2016, primarily for impairment of oil and gas properties and drillship settlements/idle rig costs, partly offset by net gains on the sales of assets. Second-quarter 2015 included net charges of $2.0 billion, $1.92 per share, and the first six months of 2015 included net charges of $4.4 billion, $4.24 per share, primarily for the impairment of oil and gas properties. For further discussion of these net charges refer to the supplemental schedule "Adjusted Net (Loss) Income," on page IX, which is available on FCX's website, "fcx.com." Richard C. Adkerson, President and Chief Executive Officer, said, "We are pleased to report significant progress toward our immediate objective of strengthening FCX’s balance sheet and enhancing shareholder value in a challenging market environment. Our global team continues to execute on our strategy to constrain costs and capital spending in a manner that protects the long-term values of our large resources. Our announced asset sale transactions totaling over $4 billion year-to-date demonstrate the attractiveness of our high-quality asset base. We are focused on executing our operating plans, which position us for significant free cash flow generation in the balance of 2016 and 2017, and on building long-term values from our portfolio of low-cost, long-lived reserves and resources for the benefit of our shareholders." a. For segment financial results, refer to the supplemental schedules, "Business Segments," beginning on page XII, which are available on FCX's website, "fcx.com." b. Includes (unfavorable) favorable adjustments to provisionally priced concentrate and cathode copper sales recognized in prior periods totaling $(28) million ($(15) million to net loss attributable to common stock from continuing operations or $(0.01) per share) in second-quarter 2016, $(22) million ($(11) million to net loss attributable to common stock from continuing operations or $(0.01) per share) in second-quarter 2015, $5 million ($2 million to net loss attributable to common stock from continuing operations or less than $0.01 per share) for the first six months of 2016 and $(99) million ($(47) million to net loss attributable to common stock from continuing operations or $(0.04) per share) for the first six months of 2015. For further discussion, refer to the supplemental schedule, "Derivative Instruments," on page XI, which is available on FCX's website, "fcx.com." c. Net (loss) income from discontinued operations includes charges for (i) allocated interest expense totaling $11 million in second-quarter 2016, $7 million in second-quarter 2015, $21 million for the first six months of 2016 and $14 million for the first six months of 2015 associated with the portion of the term loan that is required to be repaid as a result of the sale of FCX's interest in Tenke and (ii) income tax (benefit) provision totaling $(16) million in second-quarter 2016, $12 million in second-quarter 2015, $(23) million for the first six months of 2016 and $31 million for the first six months of 2015. In accordance with accounting guidelines, the second quarter and first six months of 2016 are also net of an estimated loss on disposal, which will be adjusted through closing of the transaction (refer to the supplemental schedule, “Adjusted Net (Loss) Income,” on page IX, which is available on FCX’s website, “fcx.com”).

United States – Mining
21 September 2016 33
https://twitter.com/acquisdata
https://www.facebook.com/acquisdata/
d. Includes net charges totaling $452 million ($0.36 per share) in second-quarter 2016, $2.0 billion ($1.92 per share) in second-quarter 2015, $4.4 billion ($3.53 per share) for the first six months of 2016 and $4.4 billion ($4.24 per share) for the first six months of 2015, which are described in the supplemental schedule, “Adjusted Net (Loss) Income,” on page IX, which is available on FCX’s website, “fcx.com.” e. FCX defers recognizing profits on intercompany sales until final sales to third parties occur. For a summary of net impacts from changes in these deferrals, refer to the supplemental schedule, "Deferred Profits," on page XI, which is available on FCX's website, "fcx.com." f. Includes net working capital sources (uses) and changes in other tax payments of $278 million in second-quarter 2016, $(104) million in second-quarter 2015, $466 million for the first six months of 2016 and $(190) million for the first six months of 2015. DEBT REDUCTION INITIATIVES
FCX previously announced plans to reduce debt and restore its balance sheet strength through a combination of asset sale transactions, cash flow from operations and potential capital market transactions. To date, FCX has announced over $4 billion in transactions and has received aggregate cash consideration of $1.4 billion, including $87 million in July 2016. The $2.65 billion Tenke Fungurume (Tenke) transaction is expected to close in fourth-quarter 2016. In addition, FCX continues to aggressively manage production, exploration and administrative costs and capital spending.
During second-quarter 2016, FCX restructured its oil and gas business to reduce costs and align capital allocation for the business with FCX’s corporate debt reduction initiatives. During the quarter, FCX terminated contracts for Freeport-McMoRan Oil & Gas LLC’s (FM O&G) deepwater drillships, and settled aggregate commitments totaling $1.1 billion for $755 million, of which $540 million was funded with shares of FCX common stock. In addition to the drillship contract savings of approximately $350 million, FCX has identified annual operating and administrative cost savings in excess of $150 million in connection with restructuring efforts.
During 2016, FCX has retired $369 million of its senior notes through a series of privately negotiated exchanges for 28 million shares of its common stock (including $268 million during second-quarter 2016, which resulted in a $39 million gain on early extinguishment of debt). These transactions will reduce annual interest expense by $17 million. FCX will continue to evaluate opportunities for transactions, which may include open-market purchases of its debt, debt for debt exchanges, and privately negotiated exchanges of its debt for equity or equity-linked securities. FCX may also issue additional debt or convertible securities to repay or refinance existing debt. The completion and amount of these transactions, if any, are subject to a number of factors, including market conditions, FCX's financial position and its ability to complete such transactions on economically attractive terms.
With the successful completion of the Cerro Verde expansion and access to higher grade ore from the Grasberg mine in future quarters, FCX expects to generate substantial cash flows over the next 18 months for debt reduction.
As part of its plan to reduce outstanding indebtedness, FCX intends to commence, subject to market conditions, a registered at-the-market offering of up to $1.5 billion of common stock and use the proceeds to retire outstanding indebtedness. FCX believes the proceeds of this offering, together with previously announced asset sale transactions and anticipated cash flow from operations, will enable it to achieve its near-term debt reduction objectives.
While additional asset sales may be considered, FCX remains focused on retaining a high-quality portfolio of long-lived copper assets positioned to generate value as market conditions improve. In addition to debt reduction plans, FCX is pursuing opportunities to create additional value through mine designs that would increase copper reserves, reduce costs and provide opportunities to enhance net present values, and continues to advance studies for future development of its copper resources, the timing of which will be dependent on market conditions.

United States – Mining
21 September 2016 34
https://twitter.com/acquisdata
https://www.facebook.com/acquisdata/
Following provides a summary of FCX’s completed and pending asset sales (in billions):
Closing or Expected
Cash
Closing Date
Consideration a
Morenci (13 percent interest) Second-quarter 2016 $ 1.00 Timok exploration project in Serbia Second-quarter 2016 0.13
b Oil and gas royalty interests Second-quarter 2016 0.10 Other land sales Second-quarter 2016 0.06 Haynesville shale assets Third-quarter 2016 0.09 Tenke Fourth-quarter 2016 2.65 c Total, excluding potential transactions and contingent consideration 4.03 Potential Freeport Cobalt/Kinsanfu transactionsd 0.15 Contingent considerationb,c 0.23 Total $ 4.41 a. Reflects aggregate cash consideration. b. Excludes contingent consideration of up to $107 million payable to FCX in stages based upon achievement of defined development milestones. c. Excludes contingent consideration of up to $120 million, consisting of $60 million if the average copper price exceeds $3.50 per pound and $60 million if the average cobalt price exceeds $20 per pound, for the 24-month period ending December 31, 2019. d. FCX has agreed to negotiate exclusively with China Molybdenum Co., Ltd. (CMOC) until December 31, 2016, to enter into a definitive agreement to sell its interests in Freeport Cobalt for $100 million and the Kinsanfu exploration project in the Democratic Republic of Congo (DRC) for $50 million in separate transactions.
SUMMARY OPERATING DATA
Three Months Ended Six Months Ended June 30, June 30, 2016 2015 2016 2015 Copper (millions of recoverable pounds) Productiona 1,133 977 2,230 1,892 Sales, excluding purchasesa 1,111 964 2,234 1,924 Average realized price per pounda $ 2.18 $ 2.71 $ 2.16 $ 2.70 Site production and delivery costs per poundb $ 1.43 $ 1.85 $ 1.47 $ 1.89 Unit net cash costs per poundb $ 1.33 $ 1.50 $ 1.35 $ 1.57
Gold (thousands of recoverable ounces) Production 166 367 350 626 Sales, excluding purchases 156 352 357 615 Average realized price per ounce $ 1,292 $ 1,174 $ 1,259 $ 1,183
Molybdenum (millions of recoverable pounds) Production 19 25 39 49

United States – Mining
21 September 2016 35
https://twitter.com/acquisdata
https://www.facebook.com/acquisdata/
Sales, excluding purchases 19 23 36 46 Average realized price per pound $ 8.34 $ 9.51 $ 7.99 $ 9.84
Oil Equivalents Sales volumes
MMBOE 12.4 13.1 24.5 25.6 Thousand BOE (MBOE) per day 136 144 135 142
Cash operating margin per BOEc Realized revenues $ 32.70 $ 50.04
d $ 28.29 $ 46.95 d
Cash production costs (15.00 ) (19.04 ) (15.42 ) (19.62 ) Cash operating margin $ 17.70 $ 31.00 $ 12.87 $ 27.33 a. Includes production and sales volumes from the Tenke mine, which is reported as a discontinued operation. Copper sales volumes from the Tenke mine totaled 124 million pounds in second-quarter 2016, 104 million pounds in second-quarter 2015, 247 million pounds for the first six months of 2016 and 237 million pounds for the first six months of 2015. For realized copper prices (excluding Tenke), refer to the supplemental schedules, "Selected Mining Operating Data," beginning on page I, which are available on FCX's website, "fcx.com." b. Reflects per pound weighted-average production and delivery costs and unit net cash costs (net of by-product credits) for all copper mines (including Tenke), before net noncash and other costs. Excluding the Tenke mine, mining unit net cash costs averaged $1.33 per pound in second-quarter 2016, $1.56 per pound in second-quarter 2015, $1.36 per pound for the first six months of 2016 and $1.63 per pound for the first six months of 2015. For reconciliations of per pound unit costs by operating division to production and delivery costs applicable to sales reported in FCX's consolidated financial statements, refer to the supplemental schedules, "Product Revenues and Production Costs," beginning on page XV, which are available on FCX's website, "fcx.com." c. Cash operating margin for oil and gas operations reflects realized revenues less cash production costs. Cash production costs exclude accretion and other costs. For reconciliations of realized revenues and cash production costs per BOE to revenues and production and delivery costs reported in FCX's consolidated financial statements, refer to the supplemental schedules, “Product Revenues and Production Costs,” beginning on page XV, which are available on FCX's website, “fcx.com.” d. Includes realized cash gains on crude oil derivative contracts of $7.73 per BOE in second-quarter 2015 and $7.87 per BOE for the first six months of 2015. FCX currently does not have oil and gas derivative contracts in place for 2016 or future years.
Consolidated Sales Volumes
Second-quarter 2016 consolidated copper sales (including Tenke) totaled 1.1 billion pounds, approximately 5 percent below the April 2016 estimate because of lower sales from Indonesia, and were higher than second-quarter 2015 sales of 964 million pounds, primarily reflecting higher volumes from Cerro Verde.
Second-quarter 2016 consolidated gold sales of 156 thousand ounces were lower than the April 2016 estimate of 195 thousand ounces primarily reflecting lower mining rates in Indonesia, and were lower than second-quarter 2015 sales of 352 thousand ounces, primarily reflecting lower ore grades and lower mining and milling rates.
Second-quarter 2016 consolidated molybdenum sales of 19 million pounds approximated the April 2016 estimate and were lower than second-quarter 2015 sales of 23 million pounds, primarily reflecting market-driven curtailed production volumes from the primary molybdenum mines.

United States – Mining
21 September 2016 36
https://twitter.com/acquisdata
https://www.facebook.com/acquisdata/
Second-quarter 2016 sales from oil and gas operations of 12.4 MMBOE, including 8.65 million barrels (MMBbls) of crude oil, 18.8 billion cubic feet (Bcf) of natural gas and 0.6 MMBbls of natural gas liquids (NGLs), were lower than the April 2016 estimate of 13.5 MMBOE, primarily reflecting lower than anticipated well performance and start-up delays at new wells, and were lower than second-quarter 2015 sales of 13.1 MMBOE, primarily reflecting lower natural gas volumes from Haynesville.
Sales volumes for the year 2016 are expected to approximate 5.0 billion pounds of copper (including 440 million pounds for Tenke through the anticipated closing date), 1.7 million ounces of gold, 76 million pounds of molybdenum and 47.4 MMBOE, including 1.3 billion pounds of copper (including 115 million pounds for Tenke), 410 thousand ounces of gold, 20 million pounds of molybdenum and 11.4 MMBOE for third-quarter 2016. Anticipated higher grades from the Grasberg mine are expected to result in approximately 30 percent of 2016 copper sales and 55 percent of 2016 gold sales to occur in fourth-quarter 2016.
Consolidated Unit Costs
Mining Unit Net Cash Costs. Consolidated average unit net cash costs (net of by-product credits) for FCX's copper mines (including Tenke) of $1.33 per pound of copper in second-quarter 2016 were lower than unit net cash costs of $1.50 per pound in second-quarter 2015, primarily reflecting higher copper sales volumes and the impact of ongoing cost reduction initiatives, partly offset by lower gold and silver credits.
Assuming average prices of $1,300 per ounce of gold and $6 per pound of molybdenum for the second half of 2016 and achievement of current sales volume and cost estimates, consolidated unit net cash costs (net of by-product credits) for copper mines (including Tenke) are expected to average $1.06 per pound of copper for the year 2016. The impact of price changes for the second half of 2016 on consolidated unit net cash costs would approximate $0.015 per pound for each $50 per ounce change in the average price of gold and $0.01 per pound for each $2 per pound change in the average price of molybdenum. Quarterly unit net cash costs vary with fluctuations in sales volumes and realized prices primarily for gold and molybdenum.
Oil and Gas Cash Production Costs per BOE. Cash production costs for oil and gas operations of $15.00 per BOE in second-quarter 2016 were lower than cash production costs of $19.04 per BOE in second-quarter 2015, primarily reflecting higher production from Gulf of Mexico (GOM) wells and ongoing cost reduction efforts.
Based on current sales volume and cost estimates, cash production costs are expected to approximate $15.50 per BOE for the year 2016.
MINING OPERATIONS
North America Copper Mines. FCX operates seven open-pit copper mines in North America-Morenci, Bagdad, Safford, Sierrita and Miami in Arizona, and Chino and Tyrone in New Mexico. In addition to copper, molybdenum concentrate and silver are also produced by certain of FCX's North America copper mines.
All of the North America mining operations are wholly owned, except for Morenci. FCX records its undivided joint venture interest in Morenci using the proportionate consolidation method. On May 31, 2016, FCX completed the sale of an additional 13 percent undivided interest in Morenci for $1.0 billion in cash. As a result of the transaction, FCX's undivided interest in Morenci was prospectively reduced from 85 percent to 72 percent.
Operating and Development Activities. FCX has significant undeveloped reserves and resources in North America and a portfolio of long-term development projects. In the near term, FCX is deferring development of new projects as a result of current market conditions. Future investments will be undertaken based on the results of economic and technical feasibility studies, and market conditions.

United States – Mining
21 September 2016 37
https://twitter.com/acquisdata
https://www.facebook.com/acquisdata/
During 2015, FCX's revised plans for its North America copper mines to incorporate reductions in mining rates to reduce operating and capital costs. In addition, FCX curtailed operations at the Miami and Tyrone mines and is operating its Sierrita mine at reduced rates. The revised plans at each of the operations incorporate the impacts of lower energy, acid and other consumables, reduced labor costs and a significant reduction in capital spending plans. These operating plans continue to be reviewed and additional adjustments will be made as market conditions warrant.
Operating Data. Following is a summary of consolidated operating data for the North America copper mines for the second quarters and first six months of 2016 and 2015:
Three Months Ended Six Months Ended
June 30,
June 30,
2016 2015
2016 2015
Copper (millions of recoverable pounds)
Production
469
469
956
921
Sales
464
486
967
958
Average realized price per pound
$ 2.18
$ 2.77
$ 2.17
$ 2.73
Molybdenum (millions of recoverable pounds)
Productiona
8
10
16
19
Unit net cash costs per pound of copperb
Site production and delivery, excluding adjustments
$ 1.40
$ 1.78
$ 1.40
$ 1.79
By-product credits
(0.11 )
(0.16 )
(0.10 )
(0.17 )
Treatment charges
0.11
0.12
0.11
0.13
Unit net cash costs
$ 1.40
$ 1.74
$ 1.41
$ 1.75
a. Refer to summary operating data on page 4 for FCX's consolidated molybdenum sales, which includes sales of molybdenum produced at the North America copper mines. b. For a reconciliation of unit net cash costs per pound to production and delivery costs applicable to sales reported in FCX's consolidated financial statements, refer to the supplemental schedules, "Product Revenues and Production Costs," beginning on page XV, which are available on FCX's website, "fcx.com." North America's consolidated copper sales volumes totaling 464 million pounds in second-quarter 2016 were lower than 486 million pounds in second-quarter 2015 primarily because of timing of sales in the 2015 period. North America copper sales are estimated to approximate 1.8 billion pounds for the year 2016, compared with 2.0 billion pounds in 2015.

United States – Mining
21 September 2016 38
https://twitter.com/acquisdata
https://www.facebook.com/acquisdata/
Average unit net cash costs (net of by-product credits) for the North America copper mines of $1.40 per pound of copper in second-quarter 2016 were lower than the unit net cash costs of $1.74 per pound in second-quarter 2015, primarily reflecting cost reduction initiatives and lower energy and other input costs. Average unit net cash costs (net of by-product credits) for the North America copper mines are expected to approximate $1.42 per pound of copper for the year 2016, based on achievement of current sales volume and cost estimates and assuming an average molybdenum price of $6 per pound for the second half of 2016. North America's average unit net cash costs would change by approximately $0.012 per pound for each $2 per pound change in the average price of molybdenum. South America Mining. FCX operates two copper mines in South America - Cerro Verde in Peru (in which FCX owns a 53.56 percent interest) and El Abra in Chile (in which FCX owns a 51 percent interest). These operations are consolidated in FCX's financial statements. In addition to copper, the Cerro Verde mine produces molybdenum concentrate and silver. Operating and Development Activities. In September 2015, the Cerro Verde expansion project commenced operations, and achieved capacity operating rates during first-quarter 2016. Cerro Verde's expanded operations benefit from its large-scale, long-lived reserves and cost efficiencies. The project expanded the concentrator facilities from 120,000 metric tons of ore per day to 360,000 metric tons of ore per day and is on track to provide incremental annual production of approximately 600 million pounds of copper and 15 million pounds of molybdenum. During 2015, FCX revised plans for its South America copper mines, principally to reflect adjustments to the mine plan at El Abra to reduce mining and stacking rates by approximately 50 percent to achieve lower operating and labor costs, defer capital expenditures and extend the life of the existing operations. FCX continues to evaluate a potential large-scale milling operation at El Abra to process additional sulfide material and to achieve higher recoveries. Exploration results in recent years at El Abra indicate a significant sulfide resource, which could potentially support a major mill project. Future investments will depend on technical studies, economic factors and global copper market conditions.
Operating Data. Following is a summary of consolidated operating data for the South America mining operations for the second quarters and first six months of 2016 and 2015:
Three Months Ended
Six Months Ended
June 30,
June 30,
2016 2015
2016 2015
Copper (millions of recoverable pounds)
Production
334
188
669
381
Sales
327
178
650
378
Average realized price per pound
$ 2.19
$ 2.69
$ 2.18
$ 2.68
Molybdenum (millions of recoverable pounds)
Productiona
4
2
9
4

United States – Mining
21 September 2016 39
https://twitter.com/acquisdata
https://www.facebook.com/acquisdata/
Unit net cash costs per pound of copperb
Site production and delivery, excluding adjustments
$ 1.20
$ 1.77
$ 1.22
$ 1.76
By-product credits
(0.12 )
(0.04 )
(0.10 )
(0.06 )
Treatment charges
0.23
0.17
0.23
0.17
Royalty on metals
—
—
0.01
—
Unit net cash costs
$ 1.31
$ 1.90
$ 1.36
$ 1.87
a. Refer to summary operating data on page 4 for FCX's consolidated molybdenum sales, which includes sales of molybdenum produced at Cerro Verde.
b. For a reconciliation of unit net cash costs per pound to production and delivery costs applicable to sales reported in FCX's consolidated financial statements, refer to the supplemental schedules, "Product Revenues and Production Costs," beginning on page XV, which are available on FCX's website, "fcx.com."
South America's consolidated copper sales volumes of 327 million pounds in second-quarter 2016 were significantly higher than second-quarter 2015 sales of 178 million pounds, primarily reflecting Cerro Verde's expanded operations. Sales from South America mining are expected to approximate 1.36 billion pounds of copper for the year 2016, compared with 871 million pounds of copper in 2015.
Average unit net cash costs (net of by-product credits) for South America mining of $1.31 per pound of copper in second-quarter 2016 were significantly lower than unit net cash costs of $1.90 per pound in second-quarter 2015, primarily reflecting higher copper sales volumes and economies of scale associated with the Cerro Verde expansion. Average unit net cash costs (net of by-product credits) for South America mining are expected to approximate $1.40 per pound of copper for the year 2016, based on current sales volume and cost estimates and assuming average prices of $6 per pound of molybdenum for the second half of 2016.
Indonesia Mining. Through its 90.64 percent owned and consolidated subsidiary PT Freeport Indonesia (PT-FI), FCX's assets include one of the world's largest copper and gold deposits at the Grasberg minerals district in Papua, Indonesia. PT-FI operates a proportionately consolidated joint venture, which produces copper concentrates that contain significant quantities of gold and silver.
Regulatory Matters. In October 2015, the Indonesian government provided a letter of assurance to PT-FI indicating that it will approve the extension of operations beyond 2021, and provide the same rights and the same level of legal and fiscal certainty provided under its current Contract of Work (COW). PT-FI continues to engage in discussions with the Indonesian government to obtain extension of its long-term rights available under the COW.
In connection with its COW negotiations and subject to concluding an agreement to extend PT-FI's operations beyond 2021 on acceptable terms, PT-FI has agreed to construct new smelter capacity in Indonesia and to divest an additional 20.64 percent interest in PT-FI at fair market value.
PT-FI is required to apply for renewal of export permits at six-month intervals. In February 2016, PT-FI's export permit was renewed through August 8, 2016. PT-FI has applied for an extension of this permit. The Indonesian government continues to impose a 5.0 percent export duty while it reviews PT-FI's smelter plans.
Operating and Development Activities. PT-FI's revised operating plans incorporate improved operational efficiencies, reductions in input costs, supplies and contractor costs, foreign exchange impacts and an approximate 20 percent deferral of capital expenditures that had been planned for 2016.

United States – Mining
21 September 2016 40
https://twitter.com/acquisdata
https://www.facebook.com/acquisdata/
PT-FI has several projects in progress in the Grasberg minerals district related to the development of its large-scale, long-lived, high-grade underground ore bodies. In aggregate, these underground ore bodies are expected to produce large-scale quantities of copper and gold following the transition from the Grasberg open pit, currently anticipated to occur in early 2018. From 2016 to 2020, estimated aggregate capital spending on these projects is currently expected to average $1.0 billion per year ($0.8 billion per year net to PT-FI). Considering the long-term nature and size of these projects, actual costs could vary from these estimates. In response to market conditions and Indonesian regulatory uncertainty, the timing of these expenditures continues to be reviewed.
Operating Data. Following is a summary of consolidated operating data for the Indonesia mining operations for the second quarters and first six months of 2016 and 2015:
Three Months Ended
Six Months Ended
June 30,
June 30,
2016 2015
2016 2015
Copper (millions of recoverable pounds)
Production
208
205
373
359
Sales
196
196
370
351
Average realized price per pound
$ 2.20
$ 2.61
$ 2.17
$ 2.66
Gold (thousands of recoverable ounces)
Production
158
360
336
615
Sales
151
346
346
606
Average realized price per ounce
$ 1,292
$ 1,173
$ 1,260
$ 1,183
Unit net cash costs per pound of coppera
Site production and delivery, excluding adjustments
$ 1.77
$ 2.26
$ 1.99
$ 2.51
Gold and silver credits
(1.05 )
(2.13 )
(1.27 )
(2.11 )
Treatment charges
0.29
0.32
0.30
0.31
Export duties
0.08
0.18
0.08
0.16
Royalty on metals
0.11
0.18
0.12
0.17
Unit net cash costs
$ 1.20
$ 0.81
$ 1.22
$ 1.04
a. For a reconciliation of unit net cash costs per pound to production and delivery costs applicable to sales
reported in FCX's consolidated financial statements, refer to the supplemental schedules, "Product Revenues and Production Costs," beginning on page XV, which are available on FCX's website, "fcx.com."

United States – Mining
21 September 2016 41
https://twitter.com/acquisdata
https://www.facebook.com/acquisdata/
Indonesia's consolidated copper sales totaled 196 million pounds in both the second quarters of 2016 and 2015 as higher copper ore grades in the 2016 period were offset by lower mining and milling rates. Indonesia's second-quarter 2016 gold sales of 151 thousand ounces were lower than second-quarter 2015 sales of 346 thousand ounces, primarily reflecting lower gold ore grades and lower mining and milling rates.
During second-quarter 2016, PT-FI completed repairs to its large-scale concentrating facility, which required 23 days of downtime to repair one of the milling circuits. PT-FI’s second-quarter 2016 production was also impacted by lower than expected mining rates and productivity in the Grasberg open pit, which affects the timing of metal production. Productivity in the Grasberg open pit has improved in July.
At the Grasberg mine, the sequencing of mining areas with varying ore grades causes fluctuations in quarterly and annual production of copper and gold. Consolidated sales volumes from Indonesia mining operations are expected to approximate 1.3 billion pounds of copper and 1.7 million ounces of gold for the year 2016, compared with 744 million pounds of copper and 1.2 million ounces of gold for the year 2015. PT-FI expects ore grades to improve significantly, with approximately 40 percent of its 2016 copper sales and 55 percent of its 2016 gold sales anticipated in fourth-quarter 2016.
A significant portion of PT-FI's costs are fixed and unit costs vary depending on volumes and other factors. Indonesia's unit net cash costs (including gold and silver credits) of $1.20 per pound of copper in second-quarter 2016 were higher than unit net cash costs of $0.81 per pound in second-quarter 2015, primarily reflecting lower gold credits, partly offset by lower royalties, export duties and energy costs.
Based on current sales volume and cost estimates, and assuming an average gold price of $1,300 per ounce for the second half of 2016, unit net cash costs (net of gold and silver credits) for Indonesia mining are expected to approximate $0.12 per pound of copper for the year 2016 and $0.43 per pound for third-quarter 2016. Indonesia mining's unit net cash costs for the year 2016 would change by approximately $0.05 per pound for each $50 per ounce change in the average price of gold. Because of the fixed nature of a large portion of Indonesia mining's costs, unit costs vary from quarter to quarter depending on copper and gold volumes. Anticipated higher ore grades from the Grasberg mine are expected to result in lower unit net cash costs in the second half of 2016.
Africa Mining. Africa mining includes the Tenke Fungurume Mining S.A. (TFM) minerals district, in which FCX holds an effective 56 percent interest in the Tenke copper and cobalt mining concessions in the Southeast region of the DRC. In May 2016, FCX entered into a definitive agreement to sell its interest in TF Holdings Limited. As a result and in accordance with accounting guidelines, the operating results of Africa mining have been separately reported as discontinued operations in FCX’s consolidated statements of operations for all periods presented. The transaction is expected to close in fourth-quarter 2016, subject to regulatory approvals, CMOC shareholder approval and other customary closing conditions.
Operating and Development Activities. Revised plans at Tenke incorporate a 50 percent reduction in capital spending for 2016 and various initiatives to reduce operating, administrative and exploration costs. TFM successfully commissioned a sulphuric acid plant in first-quarter 2016, which will reduce requirements for third-party acid purchases.
Operating Data. Following is a summary of operating data for the Africa mining operations for the second quarters and first six months of 2016 and 2015:
Three Months Ended
Six Months Ended
June 30,
June 30,
2016 2015
2016 2015

United States – Mining
21 September 2016 42
https://twitter.com/acquisdata
https://www.facebook.com/acquisdata/
Copper (millions of recoverable pounds)
Production
122
115
232
231
Sales
124
104
247
237
Average realized price per pounda
$ 2.07
$ 2.63
$ 2.08
$ 2.66
Cobalt (millions of contained pounds)
Production
10
9
19
16
Sales
10
8
20
16
Average realized price per pound
$ 6.58
$ 9.27
$ 6.52
$ 9.23
Unit net cash costs per pound of copperb
Site production and delivery, excluding adjustments
$ 1.62
$ 1.54
$ 1.63
$ 1.56
Cobalt creditsc
(0.33 )
(0.53 )
(0.35 )
(0.44 )
Royalty on metals
0.05
0.06
0.05
0.06
Unit net cash costs
$ 1.34
$ 1.07
$ 1.33
$ 1.18
a. Includes point-of-sale transportation costs as negotiated in customer contracts.
b. For a reconciliation of unit net cash costs per pound to production and delivery costs applicable to sales reported in net (loss) income from discontinued operations in FCX's consolidated financial statements, refer to the supplemental schedules, "Product Revenues and Production Costs," beginning on page XV, which are available on FCX's website, "fcx.com."
c. Net of cobalt downstream processing and freight costs.
Africa mining's copper sales of 124 million pounds in second-quarter 2016 were higher than second-quarter 2015 copper sales of 104 million pounds, primarily reflecting higher mining rates and timing of sales in the 2015 period. Africa mining's sales for 2016 (through the anticipated closing date) are expected to approximate 440 million pounds of copper and 35 million pounds of cobalt, compared with 467 million pounds of copper and 35 million pounds of cobalt for the year 2015.
Africa mining's unit net cash costs (net of cobalt credits) of $1.34 per pound of copper in second-quarter 2016 were higher than unit net cash costs of $1.07 per pound of copper in second-quarter 2015, primarily reflecting lower cobalt credits. Unit net cash costs (net of cobalt credits) for Africa mining are expected to approximate $1.28 per pound of copper for the year 2016, based on current sales volume and cost estimates and assuming an average cobalt price of $11 per pound for the second half of 2016. Africa mining's unit net cash costs for the year 2016 would change by approximately $0.045 per pound for each $2 per pound change in the average price of cobalt.

United States – Mining
21 September 2016 43
https://twitter.com/acquisdata
https://www.facebook.com/acquisdata/
Molybdenum Mines. FCX has two wholly owned molybdenum mines in North America - the Henderson underground mine and the Climax open-pit mine, both in Colorado. The Henderson and Climax mines produce high-purity, chemical-grade molybdenum concentrate, which is typically further processed into value-added molybdenum chemical products. The majority of molybdenum concentrate produced at the Henderson and Climax mines, as well as from FCX's North and South America copper mines, is processed at FCX's conversion facilities.
Operating and Development Activities. In response to market conditions, the revised plans for the Henderson molybdenum mine incorporate lower operating rates, resulting in an approximate 65 percent reduction in Henderson's annual production volumes. FCX also adjusted production plans at its by-product mines, including reduced production at its Sierrita mine. Additionally, FCX incorporated changes in the commercial pricing structure for its chemicals products to promote continuation of chemical-grade production.
Production from the Molybdenum mines totaled 7 million pounds of molybdenum in second-quarter 2016 and 13 million pounds in second-quarter 2015. Refer to summary operating data on page 4 for FCX's consolidated molybdenum sales, which includes sales of molybdenum produced at the Molybdenum mines, and from FCX's North and South America copper mines.
Average unit net cash costs for the Molybdenum mines of $7.80 per pound of molybdenum in second-quarter 2016 were higher than average unit net cash costs of $7.19 per pound in second-quarter 2015, primarily reflecting lower volumes. Based on current sales volume and cost estimates, unit net cash costs for the Molybdenum mines are expected to average approximately $8.60 per pound of molybdenum for the year 2016.
For a reconciliation of unit net cash costs per pound to production and delivery costs applicable to sales reported in FCX's consolidated financial statements, refer to the supplemental schedules, "Product Revenues and Production Costs," beginning on page XV, which are available on FCX's website, "fcx.com."
Mining Exploration Activities. FCX's mining exploration activities are generally associated with its existing mines focusing on opportunities to expand reserves and resources to support development of additional future production capacity. Exploration results continue to indicate opportunities for significant future potential reserve additions in North and South America. Exploration spending continues to be constrained by market conditions and is expected to approximate $45 million for the year 2016.
OIL AND GAS OPERATIONS
Through its wholly owned oil and gas subsidiary, FM O&G, FCX's principal oil and gas assets include significant oil production facilities and growth potential in the Deepwater GOM and established oil production facilities in California. For the first six months of 2016, approximately 90 percent of FCX's oil and gas revenues were from oil and NGLs.
During second-quarter 2016, FM O&G completed the sale of certain oil and gas royalty interests for cash consideration of $102 million (before closing adjustments), and in July 2016, completed the sale of its Haynesville shale assets in North Louisiana for cash consideration of $87 million (before closing adjustments). Under full cost accounting rules, the proceeds from these transactions are recorded as a reduction of capitalized oil and gas properties, with no gain or loss recognition.
Impairment of Oil and Gas Properties. FM O&G follows the full cost method of accounting, whereby all costs associated with oil and gas property acquisition, exploration and development activities are capitalized and amortized to expense under the unit-of-production method on a country-by-country basis using estimates of proved oil and gas reserves relating to each country where such activities are conducted. The costs of unproved oil and gas properties are excluded from amortization until the properties are evaluated.
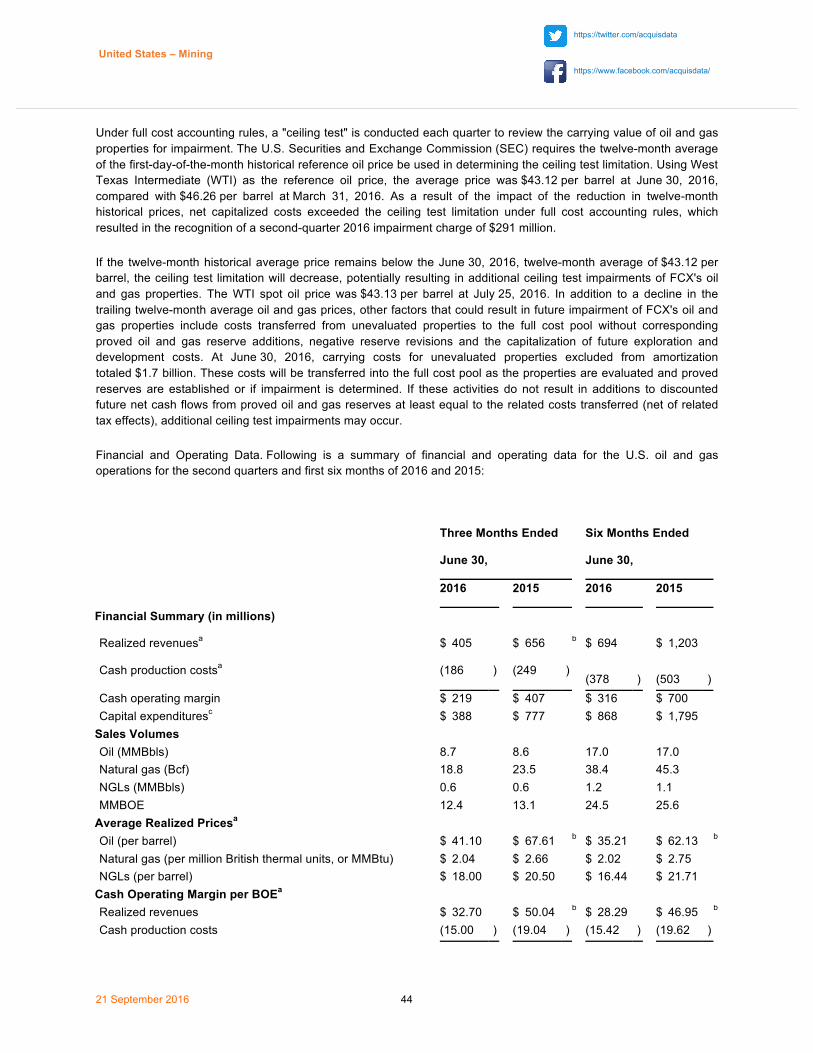
United States – Mining
21 September 2016 44
https://twitter.com/acquisdata
https://www.facebook.com/acquisdata/
Under full cost accounting rules, a "ceiling test" is conducted each quarter to review the carrying value of oil and gas properties for impairment. The U.S. Securities and Exchange Commission (SEC) requires the twelve-month average of the first-day-of-the-month historical reference oil price be used in determining the ceiling test limitation. Using West Texas Intermediate (WTI) as the reference oil price, the average price was $43.12 per barrel at June 30, 2016, compared with $46.26 per barrel at March 31, 2016. As a result of the impact of the reduction in twelve-month historical prices, net capitalized costs exceeded the ceiling test limitation under full cost accounting rules, which resulted in the recognition of a second-quarter 2016 impairment charge of $291 million.
If the twelve-month historical average price remains below the June 30, 2016, twelve-month average of $43.12 per barrel, the ceiling test limitation will decrease, potentially resulting in additional ceiling test impairments of FCX's oil and gas properties. The WTI spot oil price was $43.13 per barrel at July 25, 2016. In addition to a decline in the trailing twelve-month average oil and gas prices, other factors that could result in future impairment of FCX's oil and gas properties include costs transferred from unevaluated properties to the full cost pool without corresponding proved oil and gas reserve additions, negative reserve revisions and the capitalization of future exploration and development costs. At June 30, 2016, carrying costs for unevaluated properties excluded from amortization totaled $1.7 billion. These costs will be transferred into the full cost pool as the properties are evaluated and proved reserves are established or if impairment is determined. If these activities do not result in additions to discounted future net cash flows from proved oil and gas reserves at least equal to the related costs transferred (net of related tax effects), additional ceiling test impairments may occur.
Financial and Operating Data. Following is a summary of financial and operating data for the U.S. oil and gas operations for the second quarters and first six months of 2016 and 2015:
Three Months Ended
Six Months Ended
June 30,
June 30,
2016 2015
2016 2015
Financial Summary (in millions)
Realized revenuesa
$ 405
$ 656
b
$ 694
$ 1,203
Cash production costsa
(186 )
(249 )
(378 ) (503 ) Cash operating margin $ 219 $ 407 $ 316 $ 700 Capital expendituresc $ 388 $ 777 $ 868 $ 1,795
Sales Volumes Oil (MMBbls) 8.7 8.6 17.0 17.0 Natural gas (Bcf) 18.8 23.5 38.4 45.3 NGLs (MMBbls) 0.6 0.6 1.2 1.1 MMBOE 12.4 13.1 24.5 25.6
Average Realized Pricesa Oil (per barrel) $ 41.10 $ 67.61
b $ 35.21 $ 62.13 b
Natural gas (per million British thermal units, or MMBtu) $ 2.04 $ 2.66 $ 2.02 $ 2.75 NGLs (per barrel) $ 18.00 $ 20.50 $ 16.44 $ 21.71
Cash Operating Margin per BOEa Realized revenues $ 32.70 $ 50.04
b $ 28.29 $ 46.95 b
Cash production costs (15.00 ) (19.04 ) (15.42 ) (19.62 )

United States – Mining
21 September 2016 45
https://twitter.com/acquisdata
https://www.facebook.com/acquisdata/
Cash operating margin $ 17.70 $ 31.00 $ 12.87 $ 27.33
a. Cash operating margin for oil and gas operations reflects realized revenues less cash production costs. Cash production costs exclude accretion and other costs. For reconciliations of realized revenues (including average realized prices for oil, natural gas and NGLs) and cash production costs to revenues and production and delivery costs reported in FCX's consolidated financial statements, refer to the supplemental schedules, “Product Revenues and Production Costs,” beginning on page XV, which are available on FCX's website, “fcx.com.”
b. Includes realized cash gains on crude oil derivative contracts of $101 million ($11.79 per barrel of oil and $7.73 per BOE) in second-quarter 2015 and $201 million ($11.88 per barrel of oil and $7.87 per BOE) for the first six months of 2015. FCX currently does not have oil and gas derivative contracts in place for 2016 or future years.
c. Excludes international oil and gas expenditures totaling $4 million in second-quarter 2016, $29 million in second-quarter 2015, $47 million for the first six months of 2016 and $44 million for the first six months of 2015, primarily related to the Morocco oil and gas properties.
FM O&G's average realized price for crude oil was $41.10 per barrel in second-quarter 2016 (87 percent of the average Brent crude oil price of $47.03 per barrel). FM O&G's average realized price for natural gas was $2.04 per MMBtu in second-quarter 2016, compared to the New York Mercantile Exchange natural gas price average of $1.95 per MMBtu for the April through June 2016 contracts.
Lower realized revenues for oil and gas operations of $32.70 per BOE in second-quarter 2016, compared to $50.04 per BOE in second-quarter 2015, primarily reflects lower oil prices and the impact of realized cash gains on derivative contracts of $7.73 per BOE in second-quarter 2015.
Cash production costs for oil and gas operations of $15.00 per BOE in second-quarter 2016 were lower than cash production costs of $19.04 per BOE in second-quarter 2015, primarily reflecting higher production from GOM wells and ongoing cost reduction efforts.
Following is a summary of average oil and gas sales volumes per day by region for the second quarters and first six months of 2016 and 2015:
Three Months Ended
Six Months Ended
June 30,
June 30,
Sales Volumes (MBOE per day)
2016 2015
2016 2015
GOMa
88
80
85
77
California
32
38
32
39
Haynesville/Madden/Otherb
16
26
18
26
Total oil and gas operations
136
144
135
142
a. Includes sales from properties on the GOM Shelf and in the Deepwater GOM, and the Inboard Lower Tertiary/Cretaceous natural gas trend.

United States – Mining
21 September 2016 46
https://twitter.com/acquisdata
https://www.facebook.com/acquisdata/
b. In July 2016, FM O&G completed the sale of the Haynesville shale assets.
Daily sales volumes averaged 136 MBOE for second-quarter 2016, including 95 thousand barrels (MBbls) of crude oil, 207 million cubic feet (MMcf) of natural gas and 6 MBbls of NGLs. Since year-end 2015, FM O&G has commenced production from six 100-percent-owned Deepwater GOM wells. Oil and gas sales volumes are expected to average 130 MBOE per day for the year 2016, comprised of 73 percent oil, 5 percent natural gas and 22 percent NGLs. These estimates are below the April 2016 estimates of 149 MBOE per day, reflecting revised estimates for three Holstein Deep wells that commenced production in second-quarter 2016, the sale of the Haynesville shale assets and production constraints following a fire at a third-party natural gas processing plant.
In late June 2016, a fire at a third-party natural gas processing plant in Pascagoula, Mississippi resulted in the shutdown of the plant and the pipeline that transports gas supply from several offshore platforms, including FM O&G’s Horn Mountain and Marlin facilities (representing approximately 45 percent of FM O&G's GOM BOE production). As a result, production has been temporarily constrained and FM O&G is currently accessing an alternative pipeline as an interim solution. FM O&G is working with third parties on alternative routes to resume normal production and does not expect long-term impacts from this event.
Based on current sales volume and cost estimates, cash production costs are expected to approximate $15.50 per BOE for the year 2016.
Oil and Gas Exploration, Operating and Development Activities. In second-quarter 2016, FM O&G remained focused on managing costs and enhancing asset values in response to the current market environment. FM O&G achieved a number of important operational milestones during the quarter, including the commencement of production from five 100-percent-owned Deepwater GOM tieback wells, including three at Holstein Deep and two in the Horn Mountain area. At Lucius and Heidelberg, the operator drilled development wells with favorable results that we believe will further benefit future oil production.
During second-quarter 2016, FCX negotiated the termination and settlement of FM O&G's drilling rig contracts with Noble Drilling (U.S.) LLC (Noble) and Rowan Companies plc (Rowan). As a result of the settlements, FM O&G was released from a total of $1.1 billion in payment obligations under its three drilling rig contracts. In aggregate, reductions in previously contracted commitments for deepwater drillships approximate $350 million. During second-quarter 2016, FCX issued 48 million shares of its common stock (representing a value of $540 million) and paid $85 million cash in connection with the settlements. FCX will fund the remaining $130 million in cash during third-quarter 2016. FCX also agreed to provide contingent payments of up to $105 million, depending on the average price of crude oil over the 12-month period ending June 30, 2017. A net charge of $0.6 billion was recorded in second-quarter 2016 associated with the termination of these contracts.
Assuming an average oil price of $49 per barrel, combined with these actions, operating cash flows from the oil and gas business are expected to exceed its capital expenditures in the second half of 2016 and 2017.
Since commencing development activities in 2014 at its three 100-percent-owned production platforms in the Deepwater GOM, FM O&G has drilled 14 wells in producing fields with positive results; 10 of these wells have been brought on production, including five wells during second-quarter 2016.
Oil and Gas Capital Expenditures. Capital expenditures for oil and gas operations in second-quarter 2016 totaled $388 million in the U.S. (including $205 million incurred for GOM and approximately $150 million associated with the change in capital expenditure accruals) and $4 million associated with international oil and gas properties.

United States – Mining
21 September 2016 47
https://twitter.com/acquisdata
https://www.facebook.com/acquisdata/
Capital expenditures for oil and gas operations for the year 2016 are estimated to total $1.4 billion, with approximately 90 percent of the capital budget expected to be directed to the GOM.
Deepwater GOM. FM O&G operates and owns 100-percent working interests in the Holstein, Marlin and Horn Mountain deepwater production platforms, which in total have processing capacity of 250 MBbls of oil per day. In addition, FM O&G has interests in the Lucius, Heidelberg, Ram Powell and Hoover producing oil fields and the Atwater Valley undeveloped area.
During second-quarter 2016, production from six wells in the Lucius field in the Keathley Canyon area averaged 20 MBOE per day, net to FM O&G’s 25-percent working interest. The field has performed well since initial production commenced in first-quarter 2015. In second-quarter 2016, the operator completed the seventh well in the field. Approximately 80 percent of FM O&G’s working interest is held through its consolidated subsidiary Plains Offshore Operations Inc. (POI). Third parties hold a preferred interest in POI and are entitled to a liquidation preference and to receive preferred distributions.
In January 2016, first oil production commenced from three initial subsea wells in the Heidelberg oil field in the Green Canyon area. Heidelberg is a subsea oil development consisting of five subsea wells tied back to a truss spar hull located in 5,300 feet of water. In second-quarter 2016, the operator commenced drilling a fourth well in the field, and in July 2016, logging results confirmed oil pay with similar characteristics to a good offset producing well. The fifth and final well of the initial development phase commenced drilling in third-quarter 2016. Heidelberg field was discovered in February 2009, and the subsequent development project was sanctioned in early 2013. FM O&G has a 12.5 percent working interest in Heidelberg.
At the 100-percent-owned Holstein Deep, three wells commenced production in second-quarter 2016 and are currently producing at a gross rate of approximately 9 MBOE per day. The rates are below previous estimates, reflecting lower than expected crude oil quality and lower permeability. The Holstein Deep development is located in Green Canyon Block 643, west of the 100-percent-owned Holstein platform in 3,890 feet of water, with production facilities capable of processing 113 MBbls of oil per day.
FM O&G’s 100-percent-owned Horn Mountain field is located in the Mississippi Canyon area and has production facilities capable of processing 75 MBbls of oil per day. The Quebec/Victory and Kilo/Oscar wells commenced production in second-quarter 2016. To enhance recovery of remaining oil in place, future development plans will target subsea tieback from multiple stacked sands in the area.
FM O&G’s well inventory also includes the Horn Mountain Deep discovery well, where successful drilling results in 2015 indicated the presence of sand sections deeper than known pay sections in the field. These positive results and geophysical data support the existence of Middle Miocene reservoir potential for additional development opportunities in the Horn Mountain Deep area, including five 100-percent-owned exploration prospects with significant future potential. FM O&G controls rights to over 55,000 acres associated with these prospects.
FM O&G’s 100-percent-owned Marlin Hub is located in the Mississippi Canyon area and has production facilities capable of processing 60 MBbls of oil per day. FM O&G has drilled five successful tieback opportunities in the area since 2014. The King D-12 and Dorado wells commenced production in 2015, and the King D-13 well commenced production in first-quarter 2016.
CASH FLOWS, CASH and DEBT TRANSACTIONS
Operating Cash Flows. FCX generated operating cash flows of $874 million (including $278 million in working capital sources and changes in other tax payments) for second-quarter 2016 and $1.6 billion (including $466 million in working capital sources and changes in other tax payments) for the first six months of 2016.

United States – Mining
21 September 2016 48
https://twitter.com/acquisdata
https://www.facebook.com/acquisdata/
Based on current sales volume and cost estimates and assuming average prices of $2.25 per pound of copper, $1,300 per ounce of gold, $6 per pound of molybdenum and $48 per barrel of Brent crude oil for the second half of 2016, FCX's consolidated operating cash flows are estimated to approximate $4.5 billion for the year 2016 (including $0.7 billion in working capital sources and other tax payments). The impact of price changes for the second half of 2016 on operating cash flows would approximate $260 million for each $0.10 per pound change in the average price of copper, $40 million for each $50 per ounce change in the average price of gold, $35 million for each $2 per pound change in the average price of molybdenum and $55 million for each $5 per barrel change in the average Brent crude oil price.
Capital Expenditures. Capital expenditures totaled $833 million for second-quarter 2016, consisting of $441 million for mining operations (including $350 million for major projects) and $392 million for oil and gas operations. Capital expenditures for the first six months of 2016 totaled $1.8 billion, consisting of $900 million for mining operations (including $0.7 billion for major projects) and $915 million for oil and gas operations.
Capital expenditures are expected to approximate $3.1 billion for the year 2016, consisting of $1.7 billion for mining operations (including $1.3 billion for major projects, primarily for underground development activities at Grasberg and remaining costs for the Cerro Verde expansion) and $1.4 billion for oil and gas operations.
http://investors.fcx.com/investor-center/news-releases/news-release-details/2016/Freeport-McMoRan-Reports-Second-Quarter-and-Six-Month-2016-Results/default.aspx GoldCorp Inc. (TSX: G, NYSE: GG) Goldcorp is a leading gold producer focused on responsible mining practices with safe, low-cost production throughout the Americas. A portfolio of long-lived, high-quality assets positions the Company to deliver long-term value. A Canadian company headquartered in Vancouver, British Columbia, Goldcorp employs more than 18,000 people worldwide. The Company is committed to responsible mining practices and is well positioned to deliver sustained, industry-leading growth and performance. To achieve its goals, Goldcorp remains focused on five key attributes: quality growth; low cash costs; cost management; maintaining a peer-leading balance sheet; operating in regions with low political risk; and conducting business in a responsible manner.
Goldcorp’s operating assets include four mines in Canada, three mines in Mexico, and four in Central and South America. Goldcorp also has a pipeline of projects, the Cochenour project in Ontario, Canada, and the El Morro project in Chile.
http://www.goldcorp.com/English/About-Us/default.aspx
Our Culture
At Goldcorp, our culture is the core of our business. This culture is represented by our vision, our values and our six pillars.
Our Vision
At Goldcorp, our vision, Together Creating Sustainable Value, describes why we’re in business.
Together: We cannot achieve our goals alone. We work as a team, with all others in the organization, building collaborative partnerships with communities, governments and stakeholders for mutual success.
Creating: We find and mine gold safely. Everything we do throughout our organization, across locations, is focused on safe production and creating value.

United States – Mining
21 September 2016 49
https://twitter.com/acquisdata
https://www.facebook.com/acquisdata/
Sustainable Value: We create value for our investors and our employees. But more importantly, we also create careers, support community development activities, and our operations create wealth on a local, regional and a national basis every day. We are committed to making sure that the places where we operate are left as good or better than how we found them. And most importantly, that we make a lasting positive impact on people’s lives through our business.
Our Values
Our Values allow us to stand apart; they shape our culture and drive our success going forward. It is our Values that define who we are and most importantly, how we work.
At Goldcorp, we believe in:
Safe Production: We CARE, THINK and ACT safely because no ounce of gold is worth dying for. Safe Production means taking accountability and caring about your own safety and the safety of others. It is about creating a workplace that is Safe Enough for Our Families.
Acting Ethically: Ethics is more than a set of rules – it’s about having the courage to say and do the right thing, no matter what. Acting ethically means having integrity and treating others with respect. We consistently do the right thing, do an honest day’s work, protect personal and corporate data, conserve company resources, and abide by our Code of Conduct.
Respecting All Our Stakeholders: Respect is about building partnerships, being a team player and treating people fairly. We are in business to provide benefits to a broad range of stakeholders; our investors, our employees, our neighbours – and the only way that we can do this, is by respecting and truly listening to those that are impacted by what we do.
Open Communication: Open Communication is about having the courage to speak honestly and straight from the heart. It is admitting when we have made a mistake. We share ideas, give feedback and take the time to listen. It’s only through Open Communication that fresh new ideas will come forward and this is how we will continue to be successful.
Empowering Others: Ours is a culture of mentoring, leading by example and fostering career opportunities. We provide the time, resources and tools to set others up for success and celebrate the wins, achievements and contributions of others. Empowering Others is about taking responsibility for your performance and that of your team.
Innovation: The freedom to come up with great new ideas and to take reasonable risks to explore these ideas – these are key ingredients that have made Goldcorp successful. We encourage our people to be innovative and display entrepreneurial thinking to move our business forward. Innovation will drive continuous improvement, operating for Excellence and encourages us all to keep questioning for possibilities.
Our Six Pillars
Our Six Pillars guide what we do every day. They support our Strategy, guide our Vision and are grounded in our Values.
Grow People
We provide opportunities for personal and professional development. It’s about helping our people reach their full potential. We value and respect each individual’s contributions. Working at Goldcorp is more than just a job - it’s a life choice.

United States – Mining
21 September 2016 50
https://twitter.com/acquisdata
https://www.facebook.com/acquisdata/
Grow Safety
We are committed to protecting our people by looking out for each other, by recognizing the complexity of the task at hand, and by enhancing our abilities to recognize and deal with risk. Goldcorp leads safety because We Care.
Grow Sustainability
We are accountable for leaving a positive economic, social and environmental legacy everywhere that we operate. Our results are driven by good governance, collaborative partnerships, innovation and responsible stewardship of resources.
Grow Safe Production
We strive to continually improve our quality and output in whatever technical measure is relevant to where we work. Our overall gold production is the result of thousands of different technical inputs.
Grow Reserves
Growing our reserves is fundamental to the long-term viability of our business. By replacing the gold we produce, we provide the resources for future development. Growing Reserves ensures Goldcorp’s future.
Grow Margins
Every one of us must be aware, at all times, of the financial implications of our decisions. Strong margins will ensure Goldcorp remains one of the lowest cost gold producers and will allow us to deliver on our commitment to shareholders. Goldcorp is a business-focused corporation with an eye on the bottom line.
http://www.goldcorp.com/English/About-Us/Our-Culture/default.aspx
Goldcorp named to NASDAQ Global Sustainability Index
Goldcorp Inc. announced today that it has again been named to the semi-annual re-ranking of the NASDAQ OMX CRD Global Sustainability Index. This listing ranks Goldcorp as one of the top 100 companies in the world for its sustainability reporting and performance. Goldcorp was recognized for taking a leadership role in measuring, managing and communicating the impacts of its sustainable development efforts and shared value-creation.
"We continue to embed sustainability throughout Goldcorp and recognize the importance of strong and transparent social, environmental and economic performance," said Chuck Jeannes, Goldcorp President and Chief Executive Officer. "This ranking recognizes our progress towards our vision of 'Together, Creating Sustainable Value' and that's incredibly gratifying."
"Sustainability is one of the foundational pillars to how Goldcorp does business. Our aim is to continue to innovate in this area, through initiatives such as the implementation of our Sustainability Excellence Management System," said Brent Bergeron, Goldcorp Executive Vice President, Corporate Affairs & Sustainability. "To be named amongst such a prestigious group of companies focused on sustainability performance is very rewarding."
The NASDAQ OMX CRD Global Sustainability Index (NASDAQ:QCRD) is an equally weighted equity index that serves as a benchmark for stocks of companies taking a leadership role in sustainability performance reporting and are traded on a major US stock exchange. Companies included voluntarily disclose their current environmental, social and governance risks as well as their revenue opportunities and how it will affect future performance. The Index is evaluated on a semi-annual basis in May and November. For more information about the NASDAQ OMX CRD Global Sustainability Index, including detailed eligibility criteria, visit https://indexes.nasdaqomx.com/.
More information on Goldcorp's social, environmental and economic performance can be found in the company's annual sustainability report (http://csr.goldcorp.com/2014/index.php). The report is published as part of the company's

United States – Mining
21 September 2016 51
https://twitter.com/acquisdata
https://www.facebook.com/acquisdata/
ongoing obligations as a member of the International Council on Mining and Metals and in accordance with its commitments under the United Nations' Global Compact and the Voluntary Principles on Security and Human Rights.
About Goldcorp
Goldcorp is a leading gold producer focused on responsible mining practices with safe, low-cost production throughout the Americas. A portfolio of long-lived, high-quality assets positions Goldcorp to deliver long-term value.
http://www.goldcorp.com/English/Investor-Resources/News/News-Details/2015/Goldcorp-named-to-NASDAQ-Global-Sustainability-Index/default.aspx
Goldcorp Reports Second Quarter 2016 Results; Expansions Approved at Peñasquito and Musselwhite July 27, 2016 GOLDCORP INC. today reported its second quarter 2016 results and a decision to proceed with expansions at both its Peñasquito and Musselwhite mines. Second Quarter 2016 Highlights Gold production(1) of 613,400 ounces at all-in sustaining costs(1)(3) ("AISC") of $1,067 per ounce, compared to 908,000 ounces at AISC of $853 per ounce in 2015. Lower gold production was expected in the second quarter mainly due to planned lower ore grades, a 10-day mill shutdown for planned maintenance at Peñasquito and the exhaustion of surface stockpiles at Cerro Negro which contributed significantly to mill feed in 2015. Further, a slower than expected ramp up after the mill shutdown at Peñasquito and the decision to accelerate a large workforce reduction at Cerro Negro had a short-term, negative impact on second quarter gold production. 2016 guidance reconfirmed for gold production of between 2.8 and 3.1 million ounces, at AISC of between $850 and $925 per ounce. Production is expected to increase in the third and fourth quarter as the plant at Peñasquito returned to normal operations in July and higher grades are expected from a number of mines. AISC are expected to decrease as a result of higher production. Approximately 50% of targeted $250 million sustainable annual efficiencies identified. Workforce reductions and other improvement initiatives are underway at Cerro Negro which are expected to deliver approximately $65 million of annual efficiencies. Additionally, approximately $55 million in annual administrative cost savings were identified in July and are expected to be fully realized in 2017 as the decentralization of the Company was initiated with a one-third decrease in the number of employees at corporate and regional offices. The Company is on schedule to achieve its $250 million efficiency target by 2018. Adjusted operating cash flows(1,2) of $307 million, compared to $523 million in 2015. The decrease in adjusted operating cash flows in the second quarter of 2016 compared to 2015 was primarily due to lower production, partially offset by an increase in the realized gold price. Net loss of $78 million, or $0.09 per share, compared to net earnings of $392 million, or $0.47 per share, in 2015. Net earnings in 2015 included non-recurring after-tax gains on the sale of non-core assets of $358 million, or $0.43 per share. Second quarter 2016 earnings were negatively impacted by lower production, partially offset by an increase in the realized gold price. Project pipeline advanced: expansions approved at Peñasquito and Musselwhite; Kaminak Gold acquisition closed and Coffee project acquired. During the quarter, the Company advanced its project pipeline with the completion of the Hoyle Deep project at Porcupine. In addition, the Company received Board approval to proceed with the Pyrite Leach Project at Peñasquito ("PLP"), with an expected capital investment of approximately $420 million, and the

United States – Mining
21 September 2016 52
https://twitter.com/acquisdata
https://www.facebook.com/acquisdata/
Materials Handling Project at Musselwhite, with an expected capital investment of approximately $90 million, each of which are expected to increase gold production commencing in 2019. The acquisition of Kaminak, and its Coffee project in the Yukon, Canada was completed after quarter end and is expected to provide the Company with a medium-term opportunity for low-cost, high return gold production to complement a robust pipeline of expansion opportunities at existing mines. "While lower production was expected in the second quarter, the decision to accelerate a significant organizational restructuring had a short-term, negative impact on gold production. With the decentralization of our business well underway and new mine management installed at the majority of our operations to reflect the new business model, Goldcorp is poised to deliver better gold production and cost performance," said David Garofalo, Goldcorp President and CEO. "We continued to advance our robust project pipeline with the decision to proceed to construction with high rate of return expansions at our Peñasquito and Musselwhite mines." ORGANIZATION STRENGTHENED Going forward, the mine general managers will have much greater accountability for growing the net asset value of their individual businesses. The focus of the corporate office will be to provide oversight and allocate capital. To those ends, mine management changes were undertaken and the Company reduced the number of employees at the corporate and regional offices by approximately one-third. As part of the organizational re-design, the Company has strengthened the senior management team with the recruitment of several key individuals. Paul Harbidge has been appointed Senior Vice-President ("SVP"), Exploration reporting to George Burns, Executive Vice President ("EVP") and Chief Operating Officer. Paul will be responsible for the development, implementation and management of the global exploration function, within the decentralized model. Paul brings over 20 years of mining experience to Goldcorp, most recently as head of exploration at Randgold Resources. Paul holds a Bachelor of Science in Geology from Kingston University in the UK, as well as a Master of Science in Mineral Exploration and Mining Geology from Leicester University in the UK. Jason Attew has been appointed SVP, Corporate Development & Strategy, reporting to Russell Ball, EVP and Chief Financial Officer ("CFO"). Jason will lead the optimization of the Company's portfolio of assets, while evaluating new opportunities that are consistent with the strategy of increasing net asset value per share. Jason is a mining and metals banking executive with over 20 years of experience and holds a Bachelor of Science from the University of British Columbia, as well as a Master of Business Administration from Queen's University in Ontario. Wade Bristol has been appointed SVP, Canada, reporting to George Burns. Wade joined Goldcorp in July 2014 as the Vice President, Mine Improvement & Support. Prior to Goldcorp he served in various General Manager capacities for Newmont Mining in North America. Wade has a Bachelor of Science in Mining Engineering Degree from Montana Tech of the University of Montana. Steven Thomas has been appointed to the new role of CFO, Canada, reporting to Wade Bristol and David Splett has been appointed to the new role of CFO, Latin America reporting to Joe Dick, SVP, Latin America. As part of the regional leadership teams, Steven and David will provide financial analysis, interpretation and metrics to facilitate strategic decision making related to the management of the regional businesses. Steven brings over 30 years of financial experience, with the last 13 years in the mining industry with De Beers Canada Inc. Steven holds a Bachelor of Science Joint Honours Degree in Accountancy and Economics from the University of Wales in the UK, and is a Fellow of the Institute of Chartered Accountants. David brings with him over 24 years of experience in the resource industry, most recently as VP Finance for Mosaic Corporation. David holds a Bachelor of Arts, Economics from the University of Regina, a Master of Arts, Management Systems from the University of Hull in the UK, as well as an MBA from Queens University in Ontario and is a Certified Management Accountant.

United States – Mining
21 September 2016 53
https://twitter.com/acquisdata
https://www.facebook.com/acquisdata/
During the second quarter of 2016, the Company began implementing a company-wide program to optimize all areas of Goldcorp's business and deliver $250 million in sustainable annual efficiencies by 2018. Cerro Negro began the implementation of a substantial workforce reduction and along with other improvement initiatives is expected to provide increased efficiencies of approximately $65 million. In addition, approximately $55 million of administrative cost savings have been identified through the reduction of employees at corporate and regional offices by approximately one-third as part of the broader decentralization effort. The Company is undertaking a comprehensive optimization effort at each of the mine sites that is expected to allow it to achieve the balance of the $250 million target. FINANCIAL AND OPERATING RESULTS REVIEW
(millions except where noted) Three months ended
June 30 Six months ended
June 30 2016 2015 2016 2015
Gold production1 (ounces) 613,400 908,000 1,397,100 1,633,000 Gold sales1 (ounces) 616,000 903,000 1,415,000 1,730,000 Operating cash flows $234 $528 $293 $579 Adjusted operating cash flows1,2 $307 $523 $396 $641 Net earnings (loss) $(78) $392 $2 $305 Net earnings (loss) per share $(0.09) $0.47 $0.00 $0.37 By-product cash costs1,4 (per ounce) $728 $547 $631 $565 AISC1,3 (per ounce) $1,067 $853 $936 $868 Net loss and net loss per share in the second quarter of 2016 and the net earnings and net earnings per share in 2015 were affected by, among other things, the following non-cash or other items that management believes are not reflective of the performance of the underlying operations:
(millions except where noted) Three months ended
June 30, 2016 Three months ended
June 30, 2015 Pre-tax After-tax Per share Pre-tax After-tax Per share
Negative deferred tax effects of foreign exchange on tax assets and liabilities and losses
$- $60 $0.07 $- $10 $0.01
Restructuring costs $16 $11 $0.01 $- $- $- Gains on dispositions of, and dilution of ownership interest in, mining interests
$- $- $- $(414) $(358) $(0.43)
Total cash costs on a by-product basis for the second quarter of 2016 were $728 per ounce compared to $547 per ounce for the second quarter of 2015.AISC for the second quarter of 2016 were $1,067 per ounce, compared to $853 per ounce in the second quarter of 2015. The higher AISC was primarily a result of lower sales volumes at Peñasquito, Cerro Negro and Red Lake, partially offset by lower production costs and the favorable impact of the strengthening US dollar against the Argentine and Mexican pesos and the Canadian dollar. As of June 30, 2016, the Company had total liquidity of approximately $3.2 billion, including $0.3 billion in cash, cash equivalents and money market investments and $2.9 billion in available credit. The Company's $3 billion revolving credit facility was recently extended by a year to June 22, 2021.

United States – Mining
21 September 2016 54
https://twitter.com/acquisdata
https://www.facebook.com/acquisdata/
OPERATIONS REVIEW AND GUIDANCE The Company reconfirmed 2016 gold production guidance between 2.8 and 3.1 million ounces at AISC between $850 and $925 per ounce. Third and fourth quarter production is expected to increase over the second quarter as Peñasquito returns to normal operations after its maintenance shutdown and grades are expected to increase at a number of mine sites. In addition, AISC are expected to decrease in the third and fourth quarter as compared to the second quarter of 2016 as a result of higher production. With the approval to proceed to construction of the PLP and the Materials Handling Project, and the addition of the Coffee Project, growth capital for 2016 is expected to increase by approximately $90 - $100 million to approximately $190 - $200 million. Peñasquito, Mexico (100%-owned) Brian Berney has been appointed Mine General Manager at Peñasquito. Brian has a successful track record of bringing projects to operations and his focus on continuous improvement and safe production will help bring Peñasquito to the next stage of productivity and efficiency. Brian comes to Goldcorp with broad mining and project development experience in large operations including Teck's Quebrada Blanca mine, leading and participating in Barrick's Pueblo Viejo and Pascua Lama Projects, and leading the Technical Services areas in former Placer Dome operations. Brian holds a Bachelor's degree in Civil Engineering from the University of Queensland. Second quarter gold production totaled 36,000 ounces at an AISC of $3,094 per ounce. AISC were significantly higher compared to the second quarter of 2015, primarily as a result of lower gold production and lower by-product revenues. Production declined compared to the second quarter of 2015 as a result of lower ore grade and recovery from the upper transitional ore and low grade stockpiles in 2016 compared with 2015, when ore was being sourced from the heart of the deposit. Additionally, production declined as a result of a shutdown for 10 days for plant maintenance and a longer than anticipated period to ramp the plant up to full production due to a variety of restart issues. The plant has operated normally in July. Over the next three years, mining activities in the pit are expected to be focused on lower grade ore in the upper parts of the Peñasco pit while stripping is emphasized to ensure an economically optimal pit shell design to maximize the net asset value of the operation. By 2019, Peñasquito's gold production is expected to benefit from an improvement in mined grades as it recommences mining higher grades at the bottom of the Peñasco pit and significantly enhanced metallurgical recoveries with the planned completion of the recently approved PLP. Further information on PLP is described within the 'Project Pipeline Review' below. At the Northern Well Field project, 15% of the total fresh water production was commissioned by June 30 and the balance is expected to be completed by the end of the third quarter of 2016. Cerro Negro, Argentina (100%-owned) Vern Baker has been appointed Mine General Manager at Cerro Negro. Vern has more than 30 years of mining experience, including more than 10 years as Mine General Manager of multiple open pit and underground operations, working for Barrick, Teck and Antofagasta, among others. Vern holds a Bachelor's degree of Science in Mining Engineering from the Mackay School of Mines at the University of Nevada and an MBA from Stanford University. Second quarter gold production totaled 86,000 ounces at an AISC of $808 per ounce. Production decreased compared to the second quarter of 2015 as a result of lower mill tonnage processed due to the exhaustion of surface stockpiles which contributed significantly to mill feed in 2015. While underground ore production improved from 2015 levels, productivity was negatively affected by a large workforce reduction as part of the restructuring process that commenced during the second quarter. This reduction resulted in a five-day shutdown of the site in May. These reductions and other improvement initiatives, which have been undertaken in order to reduce the large labour

United States – Mining
21 September 2016 55
https://twitter.com/acquisdata
https://www.facebook.com/acquisdata/
productivity gap between this mine and the Company's North American operations, are expected to deliver approximately $65 million in annual efficiencies. The Marianas Complex Life of Mine Study is progressing and is focused on developing an optimal mine design, development execution plan and production schedule to maximize net asset value for Cerro Negro. The short-term plan is to enable ore development from Mariana Norte in 2017 to provide a third source of ore which would allow the mill to be operated at its designed capacity of 4,000 tonnes per day in 2018. During the second quarter of 2016, exploration continued to focus on resource and reserve expansion from surface drilling at the Marianas Complex, with 24,263 metres drilled at the Emilia and Mariana Norte Este B veins. Additional reserve expansion at these two zones has the potential to further enhance the value of synergies being developed by the Marianas Complex Life of Mine Study. The most significant result received to date at the Emilia Vein, which is interpreted to be a fault offset structure to the east of the Mariana Central mine, was in hole MDD-16041 which intersected 4.66 metres true width at 149.17 g/t Au and 858.2 g/t Ag in a step-out approximately 150 meters to the east of the December 31, 2015 inferred resource boundary. The most significant result received at Mariana Norte Este B was in hole MDD-16053 which intersected 15.47 metres true width at 31.22 g/t Au and 184.0 g/t Ag, in a step-out approximately 135 metres east of the main December 31, 2015 inferred resource body and 100 metres up dip of the nearest hole from the 2015 drilling program. Both of these holes are noteworthy in that they are step-out holes greater than 100 meters to the east of the December 31, 2015 inferred resource boundaries, represent grade thicknesses in excess of deposit averages, and additional ore grade results have been encountered in nearby holes. Pueblo Viejo, Dominican Republic (40%-owned) Second quarter gold production totaled 100,000 ounces at an AISC of $587 per ounce. Gold production increased compared to the second quarter of 2015 primarily due to higher grades. Silver production increased compared to the second quarter of 2015 primarily due to higher recoveries due to the preg-robbing characteristics of ore processed in 2015. Éléonore, Quebec (100%-owned) Second quarter gold production totaled 74,000 ounces at an AISC of $919 per ounce. Gold production increased compared to the second quarter of 2015 as a result of higher throughput and grades. AISC decreased as a result of substantially higher production. Higher tonnes processed were the result of greater tonnes mined as mining continued across four horizons compared to two in the second quarter of 2015. Higher grades were the result of improved stope designs after accounting for the folding and faulting of the ore body. The focus continues to be on optimizing stope designs to lower dilution. Work on the production shaft continued and is expected to be fully operational by the end of 2016, which will result in increased efficiencies and reduced operating costs. During the second quarter of 2016, exploration drilling was focused on the 494 area (below 650 metres) and tested the deep projection of the south and central portion of the deposit (below 1,000 metres). In the third quarter of 2016, exploration will be focusing on the 494 zone, on the deep projection of the south and central portion of the deposit and on the upper horizons (upper 650 metres). Red Lake, Ontario (100%-owned) Bill Gascon has been appointed Mine General Manager at Red Lake. Bill joined Goldcorp in October 2013 as the Mine General Manager of Musselwhite and under his leadership has significantly improved the profitability of the mine. He has more than 20 years of underground mining experience. He originally started his mining career as an underground miner and has progressed through to a senior operational leadership level by taking on roles of

United States – Mining
21 September 2016 56
https://twitter.com/acquisdata
https://www.facebook.com/acquisdata/
increasing scope and responsibility. Prior to Goldcorp he was the Underground Mine Manager at Barrick's Hemlo Operation. Second quarter gold production totaled 73,000 ounces at an AISC of $958 per ounce. Production decreased compared to the second quarter of 2015 due to lower grades processed and lower mill throughput. Production from the Upper Red Lake zones continues to increase with the completion of a more efficient material handling system and improved mining efficiencies through the conversion to bulk mining. As expected, lower grades and lower tonnes from the High Grade Zone and Campbell offset these improvements. Trade-off studies continued to advance on the rationalization of the infrastructure with results expected by year-end. During the second quarter of 2016, exploration drilling focused on the R Zone, Upper Red Lake and Far East and HG Young. Porcupine, Ontario (100%-owned) Marc Lauzier has been appointed Mine General Manager at Porcupine. Marc has held roles with increasing responsibility including Manager of Mining at Red Lake and Mine General Manager of Porcupine. His most recent role at Goldcorp was Vice President, Operational Support, Canada & US. Second quarter gold production totaled 73,000 ounces at an AISC of $844 per ounce. Production increased compared to the second quarter of 2015 as a result of higher grades and recoveries, offset by lower tonnes processed. Grades were positively impacted by increased Hollinger pit material displacing lower grade stockpile material and higher grades from Dome underground. Lower milled tonnes were due to the longer grinding time required for Hollinger material to optimize recovery as well as lower tonnes from Dome underground. The Dome underground has deferred closure activities, which were previously scheduled for mid-2016. With the recent increase in gold prices and operating cost reductions that have resulted in higher margins, the site is determining options to extend mine life. The Hoyle Deep project was completed early in the quarter and has allowed for more efficient movement of personnel and material to the lower levels of the mine. Since completion, travel time has been reduced by two hours per shift, and together with increased production levels in 2016 has resulted in an additional 100 meters of development per month. Further production increases beyond the current 1,000 tonnes of ore per day are expected as development expands and efficiencies from the new infrastructure are leveraged. Musselwhite, Ontario (100%-owned) Peter Gula has been appointed Mine General Manager at Musselwhite. Peter has over 27 years of mining experience. He has held a variety of roles increasing in responsibility during his career at Goldcorp. His most recent role was Operations Manager at Musselwhite. Peter received a mining diploma from Haileybury School of Mines, holds a Bachelor Degree in Mining Engineering from Laurentian University and is a Professional Engineer of Ontario. Second quarter gold production totaled 59,000 ounces at an AISC of $721 per ounce. Production was essentially unchanged compared to the second quarter of 2015. Following a decision to proceed with the Materials Handling Project, incremental production of approximately 20% is expected beginning in 2019. Further information on the Materials Handling Project is described within the 'Project Pipeline Review' below. PROJECT PIPELINE REVIEW Peñasquito District Pyrite Leach Project ("PLP") (100%-owned)

United States – Mining
21 September 2016 57
https://twitter.com/acquisdata
https://www.facebook.com/acquisdata/
PLP was approved by the Board on July 27 and mobilization will commence in August 2016. The project is expected to increase overall gold and silver recovery by treating the zinc tailings before discharge to the tailings storage facility. Based on a feasibility study entitled "Feasibility Study Report Peñasquito Metallurgical Enhancement Project" completed December 2015 by Fluor Canada Inc. (the "feasibility study"), the PLP is expected to recover approximately 40% of the gold and 48% of the silver currently reporting to the tailings. PLP is expected to add annual incremental production of approximately 100,000 – 140,000 gold ounces and approximately 4.0 – 6.0 million silver ounces. Commercial production is expected in the first quarter of 2019. Based on the feasibility study the project is expected to have an after-tax internal rate of return ("IRR") of approximately 17% at long-term gold and silver prices of $1,250 per ounce and $18.00 per ounce, respectively. Every $100 change in the gold price and $1.50 change in the silver price would impact the project IRR by approximately 2.5%. PLP operating costs are expected to be approximately $1.75 per tonne. The project has a minimal impact on the site water balance and will not require upgrades to the water supply as the Pyrite Leach processing plant recirculates existing plant processing water. Camino Rojo (100%-owned) At Camino Rojo, located approximately 50 kilometres from Peñasquito, the pre-feasibility study on the oxide resource continues to advance and is on track to be completed by the fourth quarter of 2016. Musselwhite Materials Handling (100%-owned) The Materials Handling System was approved by the Board on July 27. Mobilizing a contractor for additional development will commence in August and the winze raisebore construction is expected to commence in December. Currently, mining is at a depth below 1,000 metres under Lake Opapimiskan and the truck haulage distance is 7.5 km to the 400 mL underground crusher. This growth has resulted in a haul truck fleet size of 17 haul trucks, necessitating a more economical and practical means of transporting ore as the current ventilation system cannot support the additional haul truck fleet required to extend mine life. The project will enable hoisting of ore through an underground winze and associated infrastructure which will result in reduced reliance on high-cost truck haulage by significantly reducing uphill truck haulage between the winze and underground crushers leading to improved energy efficiency, reduced ventilation requirements, reduced mining costs, enhanced production profile and potential to extend mine life through exploration success. Based on an internal study, the project is expected to have an after-tax IRR of approximately 25% (exclusive of resources). Borden (100%-owned) The Borden project, located 160 kilometres west of Porcupine, has the potential to further enhance the long-term economics of Porcupine. A pre-feasibility study is underway to determine the optimization of a combined Borden-Porcupine operation and is expected to be completed during the first quarter of 2017. An advanced exploration permit is expected to be received by late 2016 or early 2017 to allow for the construction of a ramp into the deposit and the extraction of a 30,000 tonne bulk sample, providing an underground platform for exploration drilling on a deposit that remains open at depth and laterally. Exploration for the second quarter of 2016 continued to focus on discovery of additional resources along strike from the known Borden deposit as well as on high potential targets away from the main ore body, both to the east and northwest to look for new zones in the regional land package.

United States – Mining
21 September 2016 58
https://twitter.com/acquisdata
https://www.facebook.com/acquisdata/
Red Lake (100%-owned) At the HG Young deposit, a high-grade exploration discovery near the Red Lake operation, a concept study is advancing and is expected to be completed in the fourth quarter of 2016. Assuming a positive business case from the concept study, a pre-feasibility study is expected to commence in the first half of 2017 with a decline from surface that will provide access to the higher confidence areas for further exploration and bulk sampling. Exploration drilling has focused on increasing the confidence of the continuity of the mineralization and defining the plunge of the mineralization at 14 level. At Cochenour, the focus during the second quarter continued on exploration drilling. Drilling in the core area of the deposit (3,990 foot level) continues to increase data density and is moving to push the known mineralization downward toward the 5320 foot level. Sill development along the Upper Main Zone commenced on both the 3990 and 4060 foot levels with all the material being stockpiled for processing through a sample tower in the third quarter. A rigorous face sampling program was initiated this quarter and will allow reconciliation with the mined material. During the second quarter, one economic test stope was successfully mined on the 5320 level and the results were as expected. Further drilling, sampling and test mining is expected to be completed by the end of 2016. Coffee (100%-owned) Following the announcement of the closing of the transaction on July 19, 2016, the Company appointed Buddy Crill as Mine General Manager for the Coffee project. Buddy joined Goldcorp in April 2015 as the Energy Manager for the Latin America region. In July 2015, he accepted the role of Interim Director of Operations Support for the region to manage business improvement, supply chain, maintenance, and information technology/operations technology functions within the region. Prior to joining Goldcorp he was with Barrick in a variety of roles, most recently as the Asset Manager at the Pueblo Viejo Mine. Buddy holds a B.S. Electrical Engineering from the University of Idaho. The Coffee Gold project ("Coffee"), is a structurally hosted hydrothermal deposit located approximately 130 kilometres south of the City of Dawson, Yukon. Coffee is a high-grade, open pit, heap leach mining project located in a top tier mining jurisdiction. The Coffee land package, comprising over 60,000 hectares, demonstrates potential for near-mine discoveries, with mineralization remaining open along strike and at depth, and the potential for the discovery of a major new mineral system. An expanded exploration program will commence in August and the Company expects to invest $15 million in 2016 with a focus on exploration, permitting process, infrastructure upgrades and basic engineering. The Company has retained the core team of Kaminak geologists, including members of the initial discovery team to lead exploration activities. The drilling program is expected to follow-up on existing targets peripheral to existing resources and reserves, test potential gaps in the existing resource models and numerous near-surface oxide mineralization targets which have been identified with gold-in-soil anomalies while also investigating the potential for additional high-grade sulphide mineralization at depth. The permit application is expected to be submitted to the authorities in the Fall of 2016 based on positive consultations with First Nations. An Environmental Socioeconomic Assessment (ESA), Water Use License and Quartz Mining License will be permitted simultaneously.The Company expects permitting and construction activities to take four years with first gold production targeted for the end of 2020. About Goldcorp Goldcorp is a senior gold producer focused on responsible mining practices with safe, low-cost production from a high-quality portfolio of mines.

United States – Mining
21 September 2016 59
https://twitter.com/acquisdata
https://www.facebook.com/acquisdata/
This release should be read in conjunction with Goldcorp's second quarter 2016 interim consolidated financial statements and Management's Discussion and Analysis ("MD&A") report on the Company's website, in the "Investor Resources – Reports & Filings" section under "Quarterly Reports". Footnotes The Company has included non-GAAP performance measures on an attributable basis (Goldcorp share) throughout this document. Attributable performance measures include the Company's mining operations and projects and the Company's share from Alumbrera, Pueblo Viejo and NuevaUnión subsequent to the formation of the joint venture on November 24, 2015. Adjusted operating cash flows comprises Goldcorp's share of operating cash flows, calculated on an attributable basis to include the Company's share of Alumbrera, Pueblo Viejo and NuevaUnión's operating cash flows. The Company believes that, in addition to conventional measures prepared in accordance with GAAP, the Company and certain investors use this information to evaluate the Company's performance and ability to operate without reliance on additional external funding or use of available cash. In prior periods, adjusted operating cash flows was presented on an attributable basis before working capital changes to provide a consistent measure of the Company's performance of its core business operations as the Company, at times, can experience changes in working capital from one period to another. In the current quarter, the Company revised its presentation of adjusted operating cash flows to use operating cash flows as shown on the Company's statement of cash flows and adjusts it to include operating cash flows of the Company's associates. The Company believes this measure provides a better measure of cash available to the Company for financing and investing purposes. AISC include total production cash costs incurred at the Company's mining operations, which forms the basis of the Company's by-product cash costs. Additionally, the Company includes sustaining capital expenditures, corporate administrative expense, exploration and evaluation costs, and reclamation cost accretion and amortization. The measure seeks to reflect the full cost of gold production from current operations, therefore growth capital is excluded. Certain other cash expenditures, including tax payments, dividends and financing costs are also excluded. The Company believes that this measure represents the total costs of producing gold from current operations, and provides the Company and other stakeholders of the Company with additional information of the Company's operational performance and ability to generate cash flows. AISC, as a key performance measure, allows the Company to assess its ability to support capital expenditures and to sustain future production from the generation of operating cash flows. This information provides management with the ability to more actively manage capital programs and to make more prudent capital investment decisions. The Company reports AISC on a gold ounces sold basis. This performance measure was adopted as a result of an initiative undertaken within the gold mining industry; however, this performance measure has no standardized meaning and should not be considered in isolation or as a substitute for measures of performance prepared in accordance with GAAP. The Company follows the guidance note released by the World Gold Council, which became effective January 1, 2014. The World Gold Council is a non-regulatory market development organization for the gold industry whose members comprise global senior gold mining companies. The Company has included a non-GAAP performance measure - total cash costs: by-product in this document. Total cash costs: by-product incorporate Goldcorp's share of all production costs, including adjustments to inventory carrying values, adjusted for changes in estimates in reclamation and closure costs at the Company's closed mines which are non-cash in nature, and include Goldcorp's share of by-product silver, lead, zinc and copper credits, and treatment and refining charges included within revenue. Additionally, cash costs are adjusted for realized gains and losses arising on the Company's commodity and foreign currency contracts which the Company enters into to mitigate its exposure to fluctuations in by-product metal prices, heating oil prices and foreign exchange rates, which may impact the Company's operating costs.

United States – Mining
21 September 2016 60
https://twitter.com/acquisdata
https://www.facebook.com/acquisdata/
In addition to conventional measures, the Company assesses this per ounce measure in a manner that isolates the impacts of gold production volumes, the by-product credits, and operating costs fluctuations such that the non-controllable and controllable variability is independently addressed. The Company uses total cash costs: by product per gold ounce to monitor its operating performance internally, including operating cash costs, as well as in its assessment of potential development projects and acquisition targets. The Company believes this measure provides investors and analysts with useful information about the Company's underlying cash costs of operations and the impact of by-product credits on the Company's cost structure and is a relevant metric used to understand the Company's operating profitability and ability to generate cash flow. When deriving the production costs associated with an ounce of gold, the Company includes by-product credits as the Company considers that the cost to produce the gold is reduced as a result of the by-product sales incidental to the gold production process, thereby allowing the Company's management and other stakeholders to assess the net costs of gold production. The Company reports total cash costs: by-product on a gold ounces sold basis. In the gold mining industry, this is a common performance measure but does not have any standardized meaning. The Company follows the recommendations of the Gold Institute Production Cost Standard. The Gold Institute, which ceased operations in 2002, was a non-regulatory body and represented a global group of producers of gold and gold products. The production cost standard developed by the Gold Institute remains the generally accepted standard of reporting cash costs of production by gold mining companies. The estimated effective tax rate is on net income exclusive of share-based compensation, the effects of foreign currency translation of deferred tax balances, impacts of foreign exchange fluctuation on tax losses and deductions and balances and other discrete events. Cautionary Note Regarding Reserves and Resources Scientific and technical information contained in this press release was reviewed and approved by Gil Lawson, P.Eng., Vice President, Geology and Mine Planning for Goldcorp, and a "qualified person" as defined by National Instrument 43-101 - Standards of Disclosure for Mineral Projects ("NI 43-101"). All Mineral Reserves and Mineral Resources have been calculated in accordance with the standards of the Canadian Institute of Mining, Metallurgy and Petroleum ("CIM") and NI 43-101, or the Australasian Code for Reporting of Exploration Results, Mineral Resources and Ore Reserves equivalent. All Mineral Resources are reported exclusive of Mineral Reserves. Mineral Resources that are not Mineral Reserves do not have demonstrated economic viability. Information on data verification performed on the mineral properties mentioned in this press release that are considered to be material mineral properties to the Company are contained in Goldcorp's annual information form for the year ended December 31, 2015 and the current technical report for those properties, all available at www.sedar.com. Cautionary Note to United States investors concerning estimates of measured, indicated and inferred resources: The Mineral Resource and Mineral Reserve estimates contained in this news release have been prepared in accordance with the requirements of the securities laws in effect in Canada, which differ from the requirements of United States securities laws and uses terms that are not recognized by the United States Securities and Exchange Commission ("SEC"). The terms "Mineral Reserve", "Proven Mineral Reserve" and "Probable Mineral Reserve" are Canadian mining terms as defined in accordance with the CIM -Definition Standards adopted by CIM Council on May 10, 2014 (the "CIM Definition Standards") which were incorporated by reference in NI 43-101. These definitions differ from the definitions in SEC Industry Guide 7 ("SEC Industry Guide 7") under United States securities laws. Under SEC Industry Guide 7 standards, a "final" or "bankable" feasibility study is required to report reserves or cash flow analysis to designate reserves and the primary environmental analysis or report must be filed with the appropriate governmental authority. In addition, the terms "Mineral Resource", "Measured Mineral Resource", "Indicated Mineral Resource" and "Inferred Mineral Resource" are defined in and required to be disclosed by NI 43-101; however, these terms are not defined terms under SEC Industry Guide 7 and are normally not permitted to be used in reports and registration statements filed with the SEC. United States investors are cautioned not to assume that any part or all of mineral deposits in these categories will ever be converted into reserves. "Inferred Mineral Resources" have a great amount of

United States – Mining
21 September 2016 61
https://twitter.com/acquisdata
https://www.facebook.com/acquisdata/
uncertainty as to their existence, and great uncertainty as to their economic and legal feasibility. A significant amount of exploration must be completed in order to determine whether an Inferred Mineral Resource may be upgraded to a higher category. Under Canadian regulations, estimates of Inferred Mineral Resources may not form the basis of feasibility or pre-feasibility studies, except in rare cases. United States investors are cautioned not to assume that all or any part of an Inferred Mineral Resource exists or is economically or legally mineable. Disclosure of "contained ounces" in a resource is permitted disclosure under Canadian regulations if such disclosure includes the grade or quality and the quantity for each category of Mineral Resource and Mineral Reserve; however, the SEC normally only permits issuers to report mineralization that does not constitute "reserves" by SEC standards as in place tonnage and grade without reference to unit measures. Accordingly, information contained in this press release containing descriptions of the Goldcorp's mineral deposits may not be comparable to similar information made public by United States companies subject to the reporting and disclosure requirements under the United States federal securities laws and the rules and regulations thereunder. Cautionary Statement Regarding Forward Looking Statements This press release contains "forward-looking statements", within the meaning of Section 27A of the United States Securities Act of 1933, as amended, Section 21E of the United States Exchange Act of 1934, as amended, or the United States Private Securities Litigation Reform Act of 1995 and "forward-looking information" under the provisions of applicable Canadian securities legislation, concerning the business, operations and financial performance and condition of Goldcorp. Forward-looking statements include, but are not limited to, statements with respect to the future price of gold, silver, copper, lead and zinc, the estimation of Mineral Reserves (as defined above) and Mineral Resources (as defined above), the realization of Mineral Reserve estimates, the timing and amount of estimated future production, costs of production, targeted cost reductions, capital expenditures, free cash flow, costs and timing of the development of new deposits, success of exploration activities, permitting time lines, hedging practices, currency exchange rate fluctuations, requirements for additional capital, government regulation of mining operations, environmental risks, unanticipated reclamation expenses, timing and possible outcome of pending litigation, title disputes or claims and limitations on insurance coverage. Generally, these forward-looking statements can be identified by the use of words such as "plans", "expects", "is expected", "budget", "scheduled", "estimates", "forecasts", "intends", "anticipates", "believes" or variations of such words and phrases or statements that certain actions, events or results "may", "could", "would", "might" or "will", "occur" or "be achieved" or the negative connotation thereof. Forward-looking statements are necessarily based upon a number of factors that, if untrue, could cause the actual results, performances or achievements of Goldcorp to be materially different from future results, performances or achievements expressed or implied by such statements. Such statements and information are based on numerous assumptions regarding present and future business strategies and the environment in which Goldcorp will operate in the future, including the price of gold and other by-product metals, anticipated costs and ability to achieve goals. Certain important factors that could cause actual results, performances or achievements to differ materially from those in the forward-looking statements include, among others, gold and other by-product metals price volatility, discrepancies between actual and estimated production, mineral reserves and mineral resources and metallurgical recoveries, mining operational and development risks, litigation risks, regulatory restrictions (including environmental regulatory restrictions and liability), changes in national and local government legislation, taxation, controls or regulations and/or change in the administration of laws, policies and practices, expropriation or nationalization of property and political or economic developments in Canada, the United States and other jurisdictions in which the Company does or may carry on business in the future, delays, suspension and technical challenges associated with capital projects, higher prices for fuel, steel, power, labour and other consumables, currency fluctuations, the speculative nature of gold exploration, the global economic climate, dilution, share price volatility, competition, loss of key employees, additional funding requirements and defective title to mineral claims or property. Although Goldcorp believes its expectations are based upon reasonable assumptions and has attempted to identify important factors that could cause actual actions, events or results to differ materially from those described in forward-looking statements, there may be other factors that cause actions, events or results not to be as anticipated, estimated or intended.

United States – Mining
21 September 2016 62
https://twitter.com/acquisdata
https://www.facebook.com/acquisdata/
Forward-looking statements are subject to known and unknown risks, uncertainties and other important factors that may cause the actual results, level of activity, performance or achievements of Goldcorp to be materially different from those expressed or implied by such forward-looking statements, including but not limited to: risks related to international operations including economic and political instability in foreign jurisdictions in which Goldcorp operates; risks related to current global financial conditions; risks related to joint venture operations; actual results of current exploration activities; actual results of current reclamation activities; environmental risks; conclusions of economic evaluations; changes in project parameters as plans continue to be refined; future prices of gold and other by-product metals; possible variations in ore reserves, grade or recovery rates; failure of plant, equipment or processes to operate as anticipated; risks related to the integration of acquisitions; accidents, labour disputes; delays in obtaining governmental approvals or financing or in the completion of development or construction activities and other risks of the mining industry, as well as those factors discussed in the section entitled "Description of the Business – Risk Factors" in Goldcorp's most recent annual information form available on SEDAR at www.sedar.com and on EDGAR at www.sec.gov. Although Goldcorp has attempted to identify important factors that could cause actual results to differ materially from those contained in forward-looking statements, there may be other factors that cause results not to be as anticipated, estimated or intended. There can be no assurance that such statements will prove to be accurate, as actual results and future events could differ materially from those anticipated in such statements. Accordingly, readers should not place undue reliance on forward-looking statements. Forward-looking statements are made as of the date hereof and, accordingly, are subject to change after such date. Except as otherwise indicated by Goldcorp, these statements do not reflect the potential impact of any non-recurring or other special items or of any dispositions, monetizations, mergers, acquisitions, other business combinations or other transactions that may be announced or that may occur after the date hereof. Forward-looking statements are provided for the purpose of providing information about management's current expectations and plans and allowing investors and others to get a better understanding of the Company's operating environment. Goldcorp does not intend or undertake to publicly update any forward-looking statements that are included in this document, whether as a result of new information, future events or otherwise, except in accordance with applicable securities laws. http://www.goldcorp.com/English/Investor-Resources/News/News-Details/2016/Goldcorp-Reports-Second-Quarter-2016-Results-Expansions-Approved-at-Peasquito-and-Musselwhite/default.aspx Newmont Mining Corporation (NYSE: NEM)
Newmont is one of the world’s leading gold producers, and an industry leader in safety and sustainability. The Company was founded in 1921 and has been publicly traded since 1925. Headquartered in Colorado, Newmont has approximately 28,000 employees and contractors, the majority of whom work at operations in the United States, Australia, New Zealand, Peru, Indonesia and Ghana.
http://www.newmont.com/about-us/default.aspx
Our History
Newmont Mining Corporation’s rich legacy spans most of the 20th century and is intimately linked to many of the key industrial milestones of the 1900s.
Colonel William Boyce Thompson founded the Newmont Company in 1916 as a holding company for private acquisitions in oil and gas, mining and minerals enterprises. Thompson named the company “Newmont” because, as one biographer described it, “he grew up in Montana and made his money in New York.”
Publicly traded on the New York Stock Exchange (NYSE) since 1940, Newmont Mining Corporation has spent a century primarily in the natural resources industry, mining gold, copper, silver, lead, zinc, lithium, uranium, coal, nickel and aggregates, and even developing oil and gas. Today, Newmont is one of the world’s leading gold companies, with approximately 28,000 employees and contractors operate on five continents in seven countries across the globe.

United States – Mining
21 September 2016 63
https://twitter.com/acquisdata
https://www.facebook.com/acquisdata/
As one of a relatively small number of companies that have been listed on the NYSE since 1940, Newmont continues to create value and opportunities for our shareholders, employees and host communities.
http://www.newmont.com/about-us/history/default.aspx
Newmont Declares Quarterly Dividend of $0.025 Per Share April 19, 2016
Newmont Mining Corporation (NYSE: NEM) (Newmont or the Company) announced its Board of Directors declared a quarterly dividend of $0.025 per share of common stock, payable on June 23, 2016, to holders of record at the close of business on June 9, 2016.
Newmont's gold price-linked dividend policy includes a quarterly dividend payable based on the average LBMA P.M. Gold Price for the preceding quarter (Gold Price). The policy recommends an annual dividend of $0.10 per share or $0.025 per quarter at a Gold Price of up to $1,300 per ounce and an annual dividend of $0.20 per share or $0.05 per quarter at a Gold Price between $1,300 and $1,399 per ounce. For each $100 per ounce increase in the Gold Price above $1,399 per ounce, the annual payout increases at a rate of $0.20 per share or $0.05 per quarter.
The declaration and payment of dividends remains at the discretion of the Board of Directors and will depend on the Company's financial results, cash requirements, future prospects and other factors deemed relevant by the Board.
http://www.newmont.com/newsroom/newsroom-details/2016/Newmont-Declares-Quarterly-Dividend-of-0025-Per-Share-4192016/default.aspx
Newmont Declares Quarterly Dividend of $0.025 Per Share July 20, 2016
Newmont Mining Corporation (NYSE: NEM) (Newmont or the Company) announced its Board of Directors declared a quarterly dividend of $0.025 per share of common stock, payable on September 29, 2016, to holders of record at the close of business on September 15, 2016.
Newmont's gold price-linked dividend policy includes a quarterly dividend payable based on the average LBMA P.M. Gold Price for the preceding quarter (Gold Price). The policy recommends an annual dividend of $0.10 per share or $0.025 per quarter at a Gold Price of up to $1,300 per ounce and an annual dividend of $0.20 per share or $0.05 per quarter at a Gold Price between $1,300 and $1,399 per ounce. For each $100 per ounce increase in the Gold Price above $1,399 per ounce, the annual payout increases at a rate of $0.20 per share or $0.05 per quarter.
The declaration and payment of dividends remains at the discretion of the Board of Directors and will depend on the Company's financial results, cash requirements, future prospects and other factors deemed relevant by the Board.
http://www.newmont.com/newsroom/newsroom-details/2016/Newmont-Declares-Quarterly-Dividend-of-0025-Per-Share-7202016/default.aspx
Newmont Announces Second Quarter Operating and Financial Results July 20, 2016 Newmont Mining Corporation (NYSE: NEM) (Newmont or the Company) announced second quarter results.
• Net income: Reported GAAP net income attributable to shareholders from continuing operations of $50 million, or $0.09 per share, compared to $63 million, or $0.13 per share in the prior year quarter; achieved adjusted net income of $231 million, or $0.44 per basic share, compared to $131 million or $0.26 per share in the prior year quarter
• EBITDA: Achieved adjusted EBITDA2 of $804 million in the second quarter, compared to $692 million in the prior year quarter

United States – Mining
21 September 2016 64
https://twitter.com/acquisdata
https://www.facebook.com/acquisdata/
• Cash flow: Generated net cash from continuing operating activities of $780 million and free cash flow of $486 million, compared to $441 million and $119 million in the prior year quarter
• Attributable production: Produced 1.3 million ounces and 38,000 tonnes of attributable gold and copper, respectively, compared to 1.2 million ounces and 42,000 tonnes in the prior year quarter
• Costs applicable to sales (CAS): Improved gold CAS to $637 per ounce4 compared to $642 per ounce in the prior year quarter, and reported copper CAS of $1.21 per pound unchanged from the prior year quarter
• All-in sustaining costs (AISC) : Improved gold AISC to $876 per ounce compared to $909 per ounce in the prior year quarter, and improved copper AISC to $1.53 per pound compared to $1.61 per pound in the prior year quarter
• Outlook: Improved 2016 outlook and long term cost outlook; updated outlook excludes Batu Hijau • Portfolio: Merian, Long Canyon, Cripple Creek & Victor (CC&V) and Tanami projects progressing on
schedule and at or below budget. Northwest Exodus has been approved and is expected to reach irst gold production in Q3 2016; announced agreement to sell Newmont’s ownership stake in PTNNT
• Shareholder returns: Maintained second quarter dividend of $0.025 per share Newmont Announces First Quarter Operating and Financial Results
“Newmont’s strong second quarter results included delivering adjusted EBITDA of more than $800 million, free cash flow of $486 million, and announcing the sale of our 48.5 percent stake in PTNNT for total consideration of $1.3 billion including $920 million cash at close.” said Gary Goldberg, President and Chief Executive Officer. “Consistently strong operational performance has given us the means to strengthen our portfolio and balance sheet, and position Newmont to continue outperforming. We progressed construction of two new mines, and are now building three higher margin expansion projects including Northwest Exodus – on time and at or below budget. We have also been able to reduce our net debt by nearly 50% since 2013.” Second Quarter Summary Results GAAP Net income attributable to Newmont stockholders from continuing operations was $50 million, or $0.09 per share, compared to $63 million or $0.13 per share in the prior year quarter. Adjusted Net Income was $231 million or $0.44 per share, compared to $131 million or $0.26 per share in the prior year quarter. The primary adjustment to net income in the second quarter is a $174 million movement in tax valuation allowances and tax adjustments related to prior period earnings. Revenue totaled $2.0 billion in the quarter, in line with $1.9 billion in the second quarter of 2015 as higher gold volumes and pricing offset lower copper volumes and pricing. Average net realized gold and copper price was $1,260 per ounce and $1.94 per pound, respectively, compared with $1,179 per ounce and $2.41 per pound in the prior year quarter. Attributable production totaled 1.3 million ounces, compared to 1.2 million ounces in the second quarter of 2015. During the quarter, new production from CC&V and higher production at Tanami, Kalgoorlie and Ahafo more than offset declining production at Yanacocha and the sale of Waihi. Attributable copper production totaled 38,000 tonnes compared to 42,000 tonnes in the prior year period due to slightly lower grade and throughput at Batu Hijau. CAS Total costs applicable to sales of $1,059 million and $637 per ounce in the second quarter compared to $1,027 million and $642 per ounce in the prior year quarter. Second quarter CAS per ounce improvements were led by Kalgoorlie and the inclusion of CC&V. Higher production offset processing lower grade and deep transitional ore at Yanacocha. Copper CAS was $1.21 per pound in the second quarter, no change from the prior year quarter. AISC was $876 per ounce and $1.53 per pound, respectively, compared to $909 per ounce and $1.61 per pound in the prior year quarter. AISC benefitted from production and CAS improvements detailed above and further improved

United States – Mining
21 September 2016 65
https://twitter.com/acquisdata
https://www.facebook.com/acquisdata/
due to timing-related reductions in sustaining capital. Full year sustaining capital is expected to be slightly lower due to ongoing cost and efficiency improvements. Capital expenditures for the second quarter were $294 million, including $155 million of sustaining capital, compared to $322 million in the prior year quarter, including $170 million sustaining capital. Sustaining capital for the quarter declined slightly due to timing of spend. Development capital was used to construct projects, including new mines at Merian and Long Canyon, and expansions at CC&V and Tanami. Net cash provided by continuing operating activities was $780 million in the second quarter, compared to $441 million in the prior year quarter primarily due to increased gold pricing and volumes, assisted by lower costs. Free cash flow was $486 million in the second quarter, compared to $119 million in the prior year quarter. The company held $2,902 million of consolidated cash on its balance sheet at the end of the second quarter. Newmont has also generated approximately $1.9 billion in asset sales since 2013 while maintaining steady attributable gold production. Gross proceeds from asset sales would increase further with the expected sale of Batu Hijau. On June 30, Newmont announced an agreement to sell its interests in PTNNT, which operates the Batu Hijau copper and gold mine in Indonesia. The total consideration of $1.3 billion for Newmont’s 48.5 percent economic interest includes cash proceeds of $920 million expected to be paid at closing and contingent payments of $403 million tied to metal price upside and development of the Elang deposit. Projects Update Cripple Creek & Victor (CC&V) expansion includes a new leach pad, recovery plant and mill. Leach pad construction finished ahead of schedule with first production in March 2016. The recovery plant remains on schedule to be completed later this year. Gold production for 2016 is expected to be between 350,000 and 400,000 ounces at CAS of between $500 and $550 per ounce and AISC of between $600 and $650 per ounce, with production weighted toward the latter part of the year. CC&V development capital is forecasted at approximately $185 million, with $70 million to be spent in 2016. Merian is a new mine in Suriname expected to deliver more than a decade of profitable production and accretive returns. Construction is approximately 90% complete. The project remains $100 million below initial budget and is on track to reach commercial production in the second half of 2016. Merian will produce between 400,000 and 500,000 ounces (on a 100% basis) of gold annually during its first five years at CAS of between $575 and $675 per ounce and AISC of between $650 and $750 per ounce. Newmont’s 75% share of development capital is estimated at between $575 million and $625 million, with an expenditure of between $170 million and $210 million in 2016. Long Canyon is an oxide ore body that provides significant exploration upside potential in an emerging district. The Phase 1 project is approximately 80% complete and remains on budget and on schedule to reach commercial production in the first quarter of 2017. This first phase of development includes an open pit mine and heap leach operation. Production is expected to average between 100,000 and 150,000 ounces per year at CAS of between $400 and $500 per ounce and AISC of between $500 and $600 per ounce over an eight year mine life. Approximately half of the total capital costs of between $250 million and $300 million will be spent in 2016 with minimal spending in 2017. Tanami Expansion Project includes constructing a second decline in the mine and building incremental capacity in the plant to increase profitable production and serve as a platform for future expansion. The project is on budget and on schedule to deliver additional production beginning in 2017. The expansion expects to maintain annual gold production of between 425,000 and 475,000 ounces per year at CAS of between $550 and $600 per ounce and AISC of between $700 and $750 per ounce for the first five years. The expansion will also increase mine life by three years.

United States – Mining
21 September 2016 66
https://twitter.com/acquisdata
https://www.facebook.com/acquisdata/
Capital costs for the project are estimated at between $100 million and $120 million with approximately half of that amount spent in 2016. Northwest Exodus is a sustaining capital underground extension in the Carlin North Area that is expected to extend mine life by seven years, to produce incremental gold production between 50,000 and 75,000 ounces per year in the first five years, and to improve Carlin’s CAS by an average of $20 per ounce and AISC by an average of $25 per ounce. The project will produce first gold in Q3 2016. Ahafo Mill Expansion and Subika Underground represent opportunities not currently included in Newmont’s outlook. The two projects would increase profitable production at Ahafo while lowering costs and offsetting the impacts of lower grades and harder ore. Both projects will be reviewed in the second half of 2016. Outlook Outlook excludes Batu Hijau for all periods for illustrative purposes. The transaction is expected to close in the third quarter following receipt of regulatory approvals and satisfaction of other conditions precedent. Attributable gold production is expected to increase from between 4.7 and 5.0 million ounces in 2016 to between 4.9 and 5.4 million ounces in 2017, and remain stable at between 4.5 and 5.0 million ounces through 2020. New production at CC&V, Long Canyon Phase 1, Northwest Exodus, Tanami and Merian is expected to offset the impacts of maturing operations at Yanacocha and the sale of Batu Hijau. Projects that are not yet approved, including Ahafo Mill Expansion and Subika Underground, represent production upside of between 200,000 and 300,000 ounces of gold beginning in 2018. Attributable copper production is expected to be between 40,000 and 60,000 tonnes in 2016 and between 40,000 and 65,000 tonnes in 2017 and 2018, with stable production expected at Phoenix Copper Leach and Boddington. Gold cost outlook – CAS is expected to be between $630 and $680 per ounce in 2016, and remain stable at between $650 and $750 per ounce in 2017 and 2018. Costs benefit from higher grades at Carlin underground mines through 2017, and from lower cost production at Tanami and Merian through 2018. Ongoing cost and efficiency improvements are expected to offset lower grades and throughput at Ahafo and maturing operations at Yanacocha. Full Potential savings and lower cost ounces from projects that have yet to be approved could further improve costs in 2017 and beyond. AISC is expected to improve to between $870 and $930 per ounce in 2016, holding relatively steady at between $850 and $950 per ounce in 2017. Long term AISC guidance is improved to between $880 and $980 per ounce based on inclusion of Northwest Exodus and improved oil price assumptions. Copper cost outlook – Copper CAS is expected to be between $1.80 and $2.00 per pound in 2016 and 2017 rising temporarily to between $2.30 and $2.50 per pound in 2018 due to stripping at Boddington. Copper AISC is expected to average between $2.20 and $2.40 per pound in 2016 increasing to between $2.30 and $2.60 in 2017 due to timing on sustaining capital spend. Copper AISC is expected to increase to between $2.75 and $2.95 per pound in 2018 due to stripping at Boddington. Capital – 2016 capital is expected to be between $1.1 and $1.3 billion including between $650 and $700 million of sustaining capital. Sustaining capital is expected to increase to between $800 and $900 million in 2017 to cover equipment rebuilds, water treatment and tailings storage facilities. Technical and operational cost and efficiency improvements represent further upside. Long-term sustaining capital is expected to remain stable at between $700 and $800 million to cover infrastructure, equipment and ongoing mine development. Debt – The company expects approximately $260 to $280 million of interest expense in 2016. Year-todate, Newmont has reduced debt by more than $600 million in 2016. The Company remains on track to repay $800 million to $1.3 billion of debt between 2016 and 2018, targeting the highest rates and nearestterm maturities first.

United States – Mining
21 September 2016 67
https://twitter.com/acquisdata
https://www.facebook.com/acquisdata/
Non-GAAP Financial Measures Non-GAAP financial measures are intended to provide additional information only and do not have any standard meaning prescribed by generally accepted accounting principles (GAAP). These measures should not be considered in isolation or as a substitute for measures of performance prepared in accordance with GAAP. Adjusted net income (loss) Management uses Adjusted net income (loss) to evaluate the Company’s operating performance, and for planning and forecasting future business operations. The Company believes the use of Adjusted net income (loss) allows investors and analysts to understand the results of the continuing operations of the Company and its direct and indirect subsidiaries relating to the production and sale of minerals, by excluding certain items that have a disproportionate impact on our results for a particular period. The net income (loss) adjustments are presented net of tax generally at the Company’s statutory effective tax rate of 35% and net of our partners’ noncontrolling interests when applicable. The impact of the adjustments through the Company’s Valuation allowance is shown separately. The tax adjustment includes items such as foreign tax credits, alternative minimum tax credits, capital losses and disallowed foreign losses. Management’s determination of the components of Adjusted net income (loss) are evaluated periodically and based, in part, on a review of non-GAAP financial measures used by mining industry analysts. Net income (loss) attributable to Newmont stockholders is reconciled to Adjusted net income (loss) as follows: Adjusted Earnings Before Interest, Taxes, Depreciation, and Amortization (Adjusted EBITDA) Management uses Earnings before interest, taxes and depreciation and amortization (“EBITDA”) and EBITDA adjusted for non-core or certain items that have a disproportionate impact on our results for a particular period (“Adjusted EBITDA”) as non-GAAP measures to evaluate the Company’s operating performance. EBITDA and Adjusted EBITDA do not represent, and should not be considered an alternative to, net earnings (loss), operating earnings (loss), or cash flow from operations as those terms are defined by GAAP, and does not necessarily indicate whether cash flows will be sufficient to fund cash needs. Although Adjusted EBITDA and similar measures are frequently used as measures of operations and the ability to meet debt service requirements by other companies, our calculation of Adjusted EBITDA is not necessarily comparable to such other similarly titled captions of other companies. The Company believes that Adjusted EBITDA provides useful information to investors and others in understanding and evaluating our operating results in the same manner as our management and board of directors. Management’s determination of the components of Adjusted EBITDA are evaluated periodically and based, in part, on a review of non-GAAP financial measures used by mining industry analysts. Net income (loss) attributable to Newmont stockholders is reconciled to EBITDA and Adjusted EBITDA as follows: Free Cash Flow Management uses Free Cash Flow as a non-GAAP measure to analyze cash flows generated from operations. Free Cash Flow is Net cash provided by operating activities plus Net cash used in discontinued operations less Additions to property, plant and mine development as presented on the Condensed Consolidated Statements of Cash Flow. The Company believes Free Cash Flow is also useful as one of the bases for comparing the Company’s performance with its competitors. Although Free Cash Flow and similar measures are frequently used as measures of cash flows generated from operations by other companies, the Company’s calculation of Free Cash Flow is not necessarily comparable to such other similarly titled captions of other companies. The presentation of non-GAAP Free Cash Flow is not meant to be considered in isolation or as an alternative to net income as an indicator of the Company’s performance, or as an alternative to cash flows from operating activities as a measure of liquidity as those terms are defined by GAAP, and does not necessarily indicate whether cash flows will be sufficient to fund cash needs. The Company’s definition of Free Cash Flow is limited in that it does not represent residual cash flows available for discretionary expenditures due to the fact that the measure does not deduct the payments required for debt service and other contractual obligations or payments made for business acquisitions.
United States – Mining
21 September 2016 68
https://twitter.com/acquisdata
https://www.facebook.com/acquisdata/
Therefore, the Company believes it is important to view Free Cash Flow as a measure that provides supplemental information to the Company’s Condensed Consolidated Statements of Cash Flow. The following table sets forth a reconciliation of Free Cash Flow, a non-GAAP financial measure, to Net cash provided by operating activities, which the Company believes to be the GAAP financial measure most directly comparable to Free Cash Flow, as well as information regarding net cash used in investing activities and net cash used in financing activities. Costs applicable to sales per ounce/pound Costs applicable to sales per ounce/pound are non-GAAP financial measures. These measures are calculated by dividing the costs applicable to sales of gold and copper by gold ounces or copper pounds sold, respectively. These measures are calculated on a consistent basis for the periods presented on a consolidated basis. Costs applicable to sales per ounce/pound statistics are intended to provide additional information only and do not have any standardized meaning prescribed by GAAP and should not be considered in isolation or as a substitute for measures of performance prepared in accordance with GAAP. The measures are not necessarily indicative of operating profit or cash flow from operations as determined under GAAP. Other companies may calculate these measures differently. The following tables reconcile these non-GAAP measures to the most directly comparable GAAP measures. All-In Sustaining Costs Newmont has worked to develop a metric that expands on GAAP measures such as cost of goods sold and non-GAAP measures, such as Costs applicable to sales per ounce, to provide visibility into the economics of our mining operations related to expenditures, operating performance and the ability to generate cash flow from operations. Current GAAP-measures used in the mining industry, such as cost of goods sold, do not capture all of the expenditures incurred to discover, develop, and sustain gold production. Therefore, we believe that all-in sustaining costs is a non-GAAP measure that provides additional information to management, investors, and analysts that aid in the understanding of the economics of our operations and performance compared to other producers and in the investor’s visibility by better defining the total costs associated with production. All-in sustaining cost (“AISC”) amounts are intended to provide additional information only and do not have any standardized meaning prescribed by GAAP and should not be considered in isolation or as a substitute for measures of performance prepared in accordance with GAAP. The measures are not necessarily indicative of operating profit or cash flow from operations as determined under GAAP. Other companies may calculate these measures differently as a result of differences in the underlying accounting principles, policies applied and in accounting frameworks such as in International Financial Reporting Standards (“IFRS”), or by reflecting the benefit from selling non-gold metals as a reduction to AISC. Differences may also arise related to definitional differences of sustaining versus development capital activities based upon each company’s internal policies. The following disclosure provides information regarding the adjustments made in determining the all-in sustaining costs measure: Cost Applicable to Sales - Includes all direct and indirect costs related to current gold production incurred to execute the current mine plan. Costs Applicable to Sales (“CAS”) includes by-product credits from certain metals obtained during the process of extracting and processing the primary ore-body. CAS is accounted for on an accrual basis and excludes Amortization and Reclamation and remediation, which is consistent with our presentation of CAS on the Statement of Consolidated Income. In determining AISC, only the CAS associated with producing and selling an ounce of gold is included in the measure. Therefore, the amount of gold CAS included in AISC is derived from the CAS presented in the Company’s Statement of Consolidated Income less the amount of CAS attributable to the production of copper at our Phoenix, Boddington and Batu Hijau mines. The copper CAS at those mine sites is

United States – Mining
21 September 2016 69
https://twitter.com/acquisdata
https://www.facebook.com/acquisdata/
disclosed in Note 4 to the Condensed Consolidated Financial Statements. The allocation of CAS between gold and copper at the Phoenix, Boddington and Batu Hijau mines is based upon the relative sales percentage of copper and gold sold during the period. Remediation Costs - Includes accretion expense related to asset retirement obligations (“ARO”) and the amortization of the related Asset Retirement Cost (“ARC”) for the Company’s operating properties recorded as an ARC asset. Accretion related to ARO and the amortization of the ARC assets for reclamation and remediation do not reflect annual cash outflows but are calculated in accordance with GAAP. The accretion and amortization reflect the periodic costs of reclamation and remediation associated with current gold production and are therefore included in the measure. The allocation of these costs to gold and copper is determined using the same allocation used in the allocation of CAS between gold and copper at the Phoenix, Boddington and Batu Hijau mines. Advanced Projects and Exploration - Includes incurred expenses related to projects that are designed to increase or enhance current gold production and gold exploration. We note that as current resources are depleted, exploration and advanced projects are necessary for us to replace the depleting reserves or enhance the recovery and processing of the current reserves. As this relates to sustaining our gold production, and is considered a continuing cost of a mining company, these costs are included in the AISC measure. These costs are derived from the Advanced projects, research and development and Exploration amounts presented in the Company’s Statement of Consolidated Income less the amount attributable to the production of copper at our Phoenix, Boddington and Batu Hijau mines. The allocation of these costs to gold and copper is determined using the same allocation used in the allocation of CAS between gold and copper at the Batu Hijau, Boddington and Phoenix mines. General and Administrative - Includes cost related to administrative tasks not directly related to current gold production, but rather related to support our corporate structure and fulfilling our obligations to operate as a public company. Including these expenses in the AISC metric provides visibility of the impact that general and administrative activities have on current operations and profitability on a per ounce basis. Other expense, net - Includes administrative costs to support current gold production. We exclude certain exceptional or unusual expenses from Other expense, net, such as restructuring, as these are not indicative to sustaining our current gold operations. Furthermore, this adjustment to Other expense, net is also consistent with the nature of the adjustments made to Net income (loss) as disclosed in the Company’s non-GAAP financial measure Adjusted net income (loss). The allocation of these costs to gold and copper is determined using the same allocation used in the allocation of CAS between gold and copper at the Phoenix, Boddington and Batu Hijau mines. Treatment and Refining Costs - Includes costs paid to smelters for treatment and refining of our concentrates to produce the salable metal. These costs are presented net as a reduction of Sales. Sustaining Capital - We determined sustaining capital as those capital expenditures that are necessary to maintain current gold production and execute the current mine plan. Capital expenditures to develop new operations, or related to projects at existing operations where these projects will enhance gold production or reserves, are considered development. We determined the breakout of sustaining and development capital costs based on a systematic review of our project portfolio in light of the nature of each project. Sustaining capital costs are relevant to the AISC metric as these are needed to maintain the Company’s current gold operations and provide improved transparency related to our ability to finance these expenditures from current operations. The allocation of these costs to gold and copper is determined using the same allocation used in the allocation of CAS between gold and copper at the Batu Hijau, Boddington and Phoenix mines. Net average realized price per ounce/ pound Average realized price per ounce/ pound are non-GAAP financial measures. The measures are calculated by dividing the Net consolidated gold and copper sales by the consolidated gold ounces or copper pounds sold, respectively. These measures are calculated on a consistent basis for the periods presented on a consolidated basis. Average

United States – Mining
21 September 2016 70
https://twitter.com/acquisdata
https://www.facebook.com/acquisdata/
realized price per ounce/ pound statistics are intended to provide additional information only, do not have any standardized meaning prescribed by GAAP and should not be considered in isolation or as a substitute for measures of performance prepared in accordance with GAAP. The measures are not necessarily indicative of operating profit or cash flow from operations as determined under GAAP. Other companies may calculate these measures differently. Gold By-Product Metrics Copper is a by-product often obtained during the process of extracting and processing the primary ore-body. In our GAAP Condensed Consolidated Financial Statements, the value of these by-products is recorded as a credit to our CAS and the value of the primary ore is recorded as Sales. In certain instances, copper is a co-product, or significant resource in the primary ore-body, and the revenue is recorded as Sales in our GAAP Condensed Consolidated Financial Statements. Gold By-Product Metrics are non-GAAP financial measures that serve as a basis for comparing the Company’s performance with certain competitors. As Newmont’s operations are primarily focused on gold production, “Gold By-Product Metrics” were developed to allow investors to view Sales, CAS per ounce and AISC per ounce calculations that classify all copper production as a by-product, even when copper is the primary ore-body. These metrics are calculated by subtracting copper sales recognized from Sales and including these amounts as offsets to CAS. Gold By-Product Metrics are calculated on a consistent basis for the periods presented on a consolidated basis. These metrics are intended to provide supplemental information only, do not have any standardized meaning prescribed by GAAP and should not be considered in isolation or as a substitute for measures of performance prepared in accordance with GAAP. Other companies may calculate these measures differently as a result of differences in the underlying accounting principles, policies applied and in accounting frameworks, such as in IFRS. http://s1.q4cdn.com/259923520/files/doc_financials/quarterly/2016/Q2/Q2-Earnings-Release.pdf Peabody Energy (NYSE: BTU) Peabody Energy is the world’s largest private-sector coal company and a global leader in sustainable mining and clean coal solutions. The company serves metallurgical and thermal coal customers in nearly 25 countries on six continents. Peabody’s global platform reaches six continents and creates a strategic advantage. The company has, through its subsidiaries, majority interests in 26 coal operations located throughout all major U.S. coal-producing regions and in Australia. Peabody marked many notable accomplishments in 2014: Achieved another year of record safety results; • Delivered revenues totaling $6.79 billion, leading to Adjusted EBITDA of $814 million;
• Saved $525 million from cost initiatives over the last two years; and reduced capital investments to $194.4 million;
• Increased Australia sales volumes to a record setting 38.2 million tons, with metallurgical coal sales rising to 17.6 million tons;
• Generated $336.6 million of operating cash flow;
• Named Energy Company of the Year and CEO of the Year at the 2014 Platts Global Energy Awards;

United States – Mining
21 September 2016 71
https://twitter.com/acquisdata
https://www.facebook.com/acquisdata/
• Earned more than 10 awards for safety, land restoration, mine recognition, community involvement and corporate excellence.
http://www.peabodyenergy.com/content/113/peabody-at-a-glance Mission Our mission is to create superior value for shareholders as the leading global supplier of coal, which enables economic prosperity and a better quality of life. Our Values • Safety: We commit to safety and health as a way of life.
• Customer Focus: We provide customers with quality products and excellent service.
• Leadership: We have the courage to lead, and do so through inspiration, innovation, collaboration and execution.
• People: We offer an inclusive work environment and engage, recognize and develop employees.
• Excellence: We are accountable for our own success. We operate cost-competitive mines by applying continuous improvement and technology-driven solutions.
• Integrity: We act in an honest and ethical manner.
• Sustainability: We take responsibility for the environment, benefit our communities and restore the land for generations that follow.
http://www.peabodyenergy.com/content/114/mission-and-values Peabody Energy Announces Results For The Year Ended December 31, 2015 • 2015 revenues of $5.61 billion lead to Adjusted EBITDA of $434.6 million, including $23.5 million in
restructuring charges
• Diluted Loss Per Share from Continuing Operations totals $(102.62); Adjusted Diluted EPS totals $(36.39)
• Australian costs per ton improve 24% to record low for platform; U.S. costs per ton improve 5% even with lower volumes; Capital spending declines 35% to $127 million
• 2016 targets include 18 to 28 million ton decline in U.S.; Reduced hedging losses; Lower SG&A expense
• Amid difficult market conditions, additional aggressive steps underway to improve the business, preserve liquidity and reduce debt
Februari 11, 2016 Peabody Energy (NYSE: BTU) today reported full-year 2015 revenues of $5.61 billion. Adjusted EBITDA totaled $434.6 million, which includes $23.5 million in restructuring charges related to reductions in corporate and regional staff and Australian Mining Operations. Full-year Adjusted EBITDA excludes the impact of $1.28 billion in charges related to asset impairments. Diluted Loss Per Share from Continuing Operations totaled $(102.62) and Adjusted Diluted EPS totaled $(36.39). "Against a brutal industry backdrop, the Peabody team delivered a strong operating performance as we improved safety, achieved over $620 million in lower costs, further reduced capital, streamlined the organization and advanced

United States – Mining
21 September 2016 72
https://twitter.com/acquisdata
https://www.facebook.com/acquisdata/
multiple work streams to address our portfolio and financial objectives," said Peabody Energy President and Chief Executive Officer Glenn Kellow. "It is clear that more must be done, and we are taking further steps to confront a prolonged industry downturn by targeting additional cost reductions, advancing non-core asset sales and pursuing aggressive actions to preserve liquidity and delever our balance sheet." RESULTS FROM CONTINUING OPERATIONS 2015 revenues totaled $5.61 billion compared with $6.79 billion in the prior year due to lower realized pricing in the U.S. and Australia and a 21.0 million ton decline in sales. These factors drove full-year Adjusted EBITDA down 47 percent to $434.6 million as approximately $620 million in cost improvements mitigated more than $450 million in lower pricing and$387.2 million in hedge losses compared to the prior year. Adjusted EBITDA also includes $23.5 million in charges related to reductions in corporate and regional staff and Australian Mining Operations. In the fourth quarter, Adjusted EBITDA declined 59 percent from the third quarter to $53.0 million as a result of a $32.8 million reduction in Trading and Brokerage results, a $14.3 million charge related to the assignment of excess Australian port capacity, a decline in U.S. shipments and a decrease in Australian pricing. U.S. sales were impacted by lower energy demand, declining natural gas prices and high customer stockpiles that resulted in approximately 4 million tons of deferrals from the fourth quarter, with a significant portion of the deferrals occurring in December. 2015 U.S. Mining Adjusted EBITDA declined $145.6 million to $937.2 million, primarily due to a 13.5 million ton volume decrease as a result of lower utility coal demand based on natural gas prices and a planned reduction in volumes associated with export shipments from the Twentymile Mine. U.S. Mining costs per ton improved 5 percent as a result of lower fuel expense and cost savings initiatives. Despite approximately $420 million in impacts from lower pricing, 2015 Australian Mining Adjusted EBITDA increased $62.4 million to $175.4 million on sharply lower costs. Cost improvements included the benefit of a weaker Australian dollar, lower fuel prices, operational improvements and mine plan changes announced previously in the year. These resulted in record low costs for this platform of $51.07 per ton, even with lower volumes. 2015 Australian Metallurgical gross margins were adversely impacted by over $2.50 per ton from the Burton Mine, the company's only contractor-operated mine. Australian volumes decreased to 35.8 million tons and included 15.7 million tons of metallurgical coal sold at$75.04 per ton and 12.6 million tons of export thermal coal at $53.76 per ton, with the remainder delivered under domestic thermal contracts. Trading and Brokerage Adjusted EBITDA for 2015 increased $12.1 million to $27.0 million, primarily due to favorable trading activities and a $7 million litigation settlement benefit recorded in the third quarter. Full-year results include impairment charges of $1.28 billion, including $377.0 million in the fourth quarter. Full-year impairment charges included $969.2 million largely related to certain Australian metallurgical coal assets and $308.6 million primarily from certain non-producing reserve and non-mining assets in the United States. Results also include $67.8 million in debt extinguishment charges from refinancing the company's 2016 Senior Notes in the first half of 2015. Peabody's 2015 tax benefit totaled $135.0 million compared to a tax provision of $201.2 million the prior year. The changes include a $75.3 million benefit related to impairments recorded in 2015 as well as a $284.0 million valuation allowance recorded in 2014 against deferred U.S. income tax assets. Loss from Continuing Operations totaled $1.86 billion compared to $749.1 million in the prior year. Diluted Loss from Continuing Operations totaled $(102.62) per share and Adjusted Diluted EPS totaled $(36.39), which reflects adjustments from the 1-for-15 reverse stock split enacted in the fourth quarter. Loss from Discontinued Operations totaled$182.2 million. 2015 Operating Cash Flows reflect a usage of $14.4 million as cash generated by the operations was not sufficient to cover cash interest and health benefit trust payments. Proceeds from property disposals generated approximately $70 million in cash, while capital spending of $126.8 million was at the lowest level since 2001.

United States – Mining
21 September 2016 73
https://twitter.com/acquisdata
https://www.facebook.com/acquisdata/
Regarding the company's liquidity position: • Liquidity totaled $1.20 billion at the end of December. Peabody also had $709.0 million in letters of credit.
• The company accessed the remaining capacity under its $1.65 billion revolving credit facility, which provides Peabody with the maximum amount of control and flexibility with respect to its liquidity position in light of continued challenging market conditions.
As of Feb. 9, 2016, liquidity totaled $902.6 million, which consisted of $778.5 million in cash, $123.0 million available under the company's accounts receivable securitization and the remainder under the revolving credit facility. Peabody also had $823.7 million in letters of credit. Peabody has previously disclosed that reported Adjusted EBITDA differs from the credit agreement terms used for calculating compliance. The adjustments may include, in certain instances, cash proceeds from asset monetization activities. Peabody continues to qualify for self-bonding in all relevant states and, in the fourth quarter, the state of Wyoming reaffirmed self-bonding eligibility for the North Antelope Rochelle and Rawhide surface mines. GLOBAL COAL MARKETS Slowing global economic growth drove a wide range of commodity prices lower in 2015, resulting in the largest broad commodity market decline since 1991. Seaborne coal prices continued to fall in 2015 as a reduction in Chinese imports more than offset supply cutbacks, and U.S. coal demand was impacted by lower natural gas prices. Within seaborne metallurgical coal markets, domestic Chinese steel demand declined approximately 5 percent in 2015 due to reduced economic growth and oversupply in the property sector, while steel production declined 2 percent. As a result, China was a net exporter of "refined" metallurgical coal in 2015 as steel exports increased 20 percent to a new record of 110 million tonnes, while Chinese metallurgical coal imports decreased more than 20 percent. Metallurgical coal price settlements declined throughout the year, and first quarter 2016 settlements for premium hard coking coal fell 9 percent to $81 per tonne. The benchmark for low-vol PCI eased from $71 to $69 per tonne, showing relative strength to the premium coking coal product. Seaborne metallurgical coal demand declined approximately 15 million tonnes in 2015 resulting in accelerated production cutbacks primarily in the U.S. and Canada. Peabody projects modest seaborne metallurgical coal supply reductions in 2016 as further declines in the U.S. overcome small production increases from other exporting nations. In seaborne thermal coal markets, demand declined 8 percent on a nearly 75 million tonne reduction in Chinese imports, lower European demand and a decline in international liquefied natural gas prices. The overall decline in seaborne thermal demand primarily impacted U.S. and Indonesian exports, which were down 41 percent and 23 percent, respectively. Within U.S. coal markets, demand from electric utilities declined approximately 110 million tons in 2015 on mild weather and lower natural gas prices. Natural gas prices fell nearly 40 percent in 2015 to an average of $2.63 per mm/Btu, which drove coal's share of electricity generation in the power sector down to 34 percent compared with 40 percent in the prior year. U.S. coal production declined approximately 105 million tons in 2015 as production cutbacks accelerated during the year. As a result, fourth quarter production was down approximately 50 million tons compared with the same period in 2014. Despite supply rationalizations, reduced coal demand led to utility inventories rising nearly 30 percent above prior-year levels. Peabody expects 2016 U.S. utility coal consumption to decline approximately 40 to 60 million tons based on projected plant retirements and lower natural gas prices. The decline in demand, combined with an expected significant reduction in utility stockpiles and lower exports, is projected to result in a 150 to 170 million ton decline in

United States – Mining
21 September 2016 74
https://twitter.com/acquisdata
https://www.facebook.com/acquisdata/
2016 U.S. coal shipments. As a result, Peabody is lowering its 2016 U.S. sales targets by 13 percent at the midpoint, and is now fully priced for the year. 2016 CORE PRIORITIES Peabody achieved a number of accomplishments in 2015, and the company is expanding on previous successes with a major focus on operational, portfolio and financial initiatives across the business. Core priorities for 2016 include: • Driving continuous improvement in safety, productivity and costs. In 2015, Peabody transformed its
operations to respond to difficult market conditions. The company set a new record for safety, with a 13 percent reduction in the global safety incidence rate to 1.25 per 200,000 hours worked for employees and contractors. In the U.S. and Australia, Peabody improved costs by 5 percent and 24 percent, respectively, and gross margins across four of the company's five operating segments averaged 26 percent. 2015 capital spending declined 35 percent, and extensive efforts were advanced to streamline the organization leading to a 22 percent reduction in SG&A expenses, the lowest levels in nearly a decade. Given ongoing market challenges, the company continues to drive cost improvements at all levels of the organization.
• Preserving liquidity while reducing debt. The company continued to preserve liquidity in 2015 by completing a bond offering, modifying its credit agreement, reducing costs and lowering capital spending. Peabody and its advisors are currently in discussions with debt holders to evaluate financial alternatives, including potential debt exchanges, debt buybacks and new financing, to preserve liquidity and delever the balance sheet. Peabody also has a number of committed obligations that expire or meaningfully decline in the next two years:
The company's final PRB reserve installment of approximately $250 million is scheduled to be paid in the second half of 2016. The payment is related to the company's last lease-by-application process in 2012. As a result of investments in prior years, Peabody's PRB reserves represent more than 25 years of current production, which provides a competitive advantage relative to other producers. Peabody's existing currency and fuel hedges decline in 2016 and expire by the end of 2017. As these positions expire, the company expects progressively lower cash settlements in 2016 and 2017 relative to realized 2015 hedge losses of $436.8 million. The company proactively assigned excess Australian port capacity to another producer, which is expected to reduce infrastructure costs by approximately $60 millionthrough 2020. In addition, Peabody recently amended contracts to reduce certain U.S. transportation and logistics costs expected to be due in early 2017. In connection with these amendments, Peabody will realize a net reduction of approximately $45 million in estimated liquidated damage payments that otherwise would have become due in early 2017. The company recently amended its 2013 agreement with the United Mine Workers of America, improving Peabody's expected 2017 cash flows by $70 million while deferring the 2016 payments over 10 months. Reshaping the portfolio to unlock value. Peabody announced the planned sale of its New Mexico and Colorado assets for $358 million in November, and the purchaser is currently arranging financing. Peabody also announced plans to divest its interest in the Prairie State Energy Campus for $57 million. In 2015, the company realized cash proceeds of $70 million related to its ongoing resource management activities through the sale of surplus land and coal reserves. Peabody continues to evaluate its portfolio to target the best markets, with a filter that includes strategic fit, value consideration, growth and cash requirements as the company further emphasizes its core mining assets in the PRB, Illinois Basin and Australia. OUTLOOK

United States – Mining
21 September 2016 75
https://twitter.com/acquisdata
https://www.facebook.com/acquisdata/
Peabody has lowered 2016 U.S. sales guidance by 18 to 28 million tons below 2015 levels. As a result, projected 2016 U.S. production is now fully priced, with 2017 production 35 to 45 percent unpriced based on targeted 2016 production levels. After incorporating deferrals to later periods and a change in customer mix, Peabody now has 116 million tons of PRB priced for 2016 delivery at an average of $13.30 per ton. 2016 U.S. revenues and costs per ton targets primarily reflect a reduced proportion of PRB sales compared to 2015. In the PRB, the company is working to optimize production levels and mix at the North Antelope Rochelle Mine to maximize margins. 2016 guidance includes the contributions from mines in Colorado and New Mexico, for which a sales agreement is in place. In Australia, Peabody is lowering targeted metallurgical coal production levels in 2016 to reflect operational changes made in 2015, which is expected to result in lower PCI sales. The company also plans to place the Burton Mine on care and maintenance by the end of 2016. Peabody expects first quarter Adjusted EBITDA to reflect current reduced seaborne coal pricing, lower PRB volumes, the impact of planned longwall moves at the Wambo and Twentymile mines, and the realization of fuel and currency hedges that are expected to improve each quarter as the year progresses. While cost improvements continue to remain a priority for Peabody, current pricing levels are a strong headwind. The company also expects to have an approximately $70 million benefit to continuing operations from the recently amended 2013 agreement with the United Mine Workers of America. http://peabodyenergy.investorroom.com/2016-02-11-Peabody-Energy-Announces-Results-For-The-Year-Ended-December-31-2015?printable

•ChinaPetroleumandChemicals•ChinaInformationTechnology•ChinaBiotechnology•ChinaBanking•ChinaAutomotive•ChinaMining•ChinaCement•ChinaShipbuilding•ChinaRenewableEnergy•IndiaInformationTechnology•IndiaBanking•AustraliaMetalandMining•AustraliaSpecialtyMinerals•AustraliaBiotechnologyandPharmaceuticals•AustraliaGrains•AustraliaBanking•AustraliaTourism•BrazilBanking•BrazilMetalandMining•CanadaMining•CanadaGrains•CanadaMedia•CanadaTelecommunications•JapanShipbuilding•JapanPharmaceuticals•JapanAutomotive•JapanTelecommunications•MexicoMining
•SouthKoreaMetalandMining•SouthKoreaShipbuilding•SouthKoreaAutomotive•USPharmaceuticals•USAutomotive•USMining•USPetroleumandGas•USArmaments•USBiotechnology•USTextiles•USSoftwareandInformationTechnology•USGrains•USTelecommunications•USMedia•USRenewableEnergy•RussiaArmaments•FranceArmaments•FrancePharmaceuticals•UKArmaments•UKPharmaceuticals•UKPetrochemicals•UKHedgeFunds•GermanyAutomotive•GermanyShipbuilding•GermanyPharmaceuticals•SouthAfricaMining•SouthAfricaPetrochemicals•SaudiArabiaPetrochemicals,OilandGas
SectorCoverage