58 d ninh&thao
28
Viet Nam experience on language classroom mapping: a tool for planning and managing bilingual education 4th International Language and Education Conference: Multilingual Education for ALL in Asia and the Pacific – Policies, Practices and Processes 6 th -8 th November 2013 Bangkok
-
Upload
education-and-resilience -
Category
Documents
-
view
80 -
download
0
Transcript of 58 d ninh&thao

Viet Nam experience on language classroom mapping:
a tool for planning and managing bilingual education
4th International Language and Education Conference:Multilingual Education for ALL in Asia and the Pacific – Policies,
Practices and Processes6th-8th November 2013 Bangkok
UNICEF
Please note the title of the conference is 4th International Conference on Language and Education: Multilingual Education for All in Asia and the Pacific - Policies, Practices and Processes

Contents of the Presentation
1) 1. Country context
2) 2. Purpose and research questions
3) 2. Process and methodology
4) 3. Results and applications

1. Viet Nam country context Linguistic and Cultural Diversity in Viet Nam
Population: 86 million53 ethnic minority groups (13% of the total population of Viet Nam;)
54 ethnic groups speaking approximately 100 languages; 30 languages with scripts;Rich diversity as to language genetic affinities
Distinctive characteristic of language situation all over the country: mixed population distribution
Multilingual education as a way towards achieving quality UPE in Vietnam
UNICEF
Sources: SIL International (www.ethnologue.com)

1.Viet Nam country context Quality and equity in Ethnic Minorities Education in Viet Nam
UNICEF
Multilingual education as a way towards achieving quality UPE in Vietnam
Source: VIES and INTREC/Mekong Economics, (2008). Assessing learning results in Vietnamese Reading and Mathematic of children grade 5, school year 2006-2007.

1. Positive Experience on Mother Tongue Based Bilingual Education in Viet Nam
- Vietnamese subject: children learning, speaking; they are good at the oral of VN
- Math: the initial result is positive;
- For other subjects, MTBBE students got A+ marks;
- MTBBE students have good behaviours in school.
Levels MTBBE Non-MTTBE
Excellent (86-100%)
67,5% 29,57%
Very good (66-85%)
24,78% 31,49%
Good (50-65%)
6,03% 19,41%
Fair (30-49%)
1,30% 9,32%
Fail (0-29%)
0,75% 10,18%

1. Country context: Assessment results primary level 2010-2011 school
- MTBBE students had better learning outcomes than their peers.
- MTBBE contributed to better learning outcomes of ethnic minority children.
6

2. Purpose and Research Questions
Purpose of Research:
- To understand the language situation in the classroom so that education can be appropriate for all the students and their communities.
- Students learn best when they can begin studying in the language that they know best.
Research Questions: - How many classes and locations are there where all the students
speak the same language? What is the situation for these students?
- How many classes and locations are there where students don't share the same strongest language?
- What are the language abilities of the teachers?

3. Process of Language Mapping
Project Planning Training
Data Collection
Data Anlaysis/ Mapping
Presenting Results
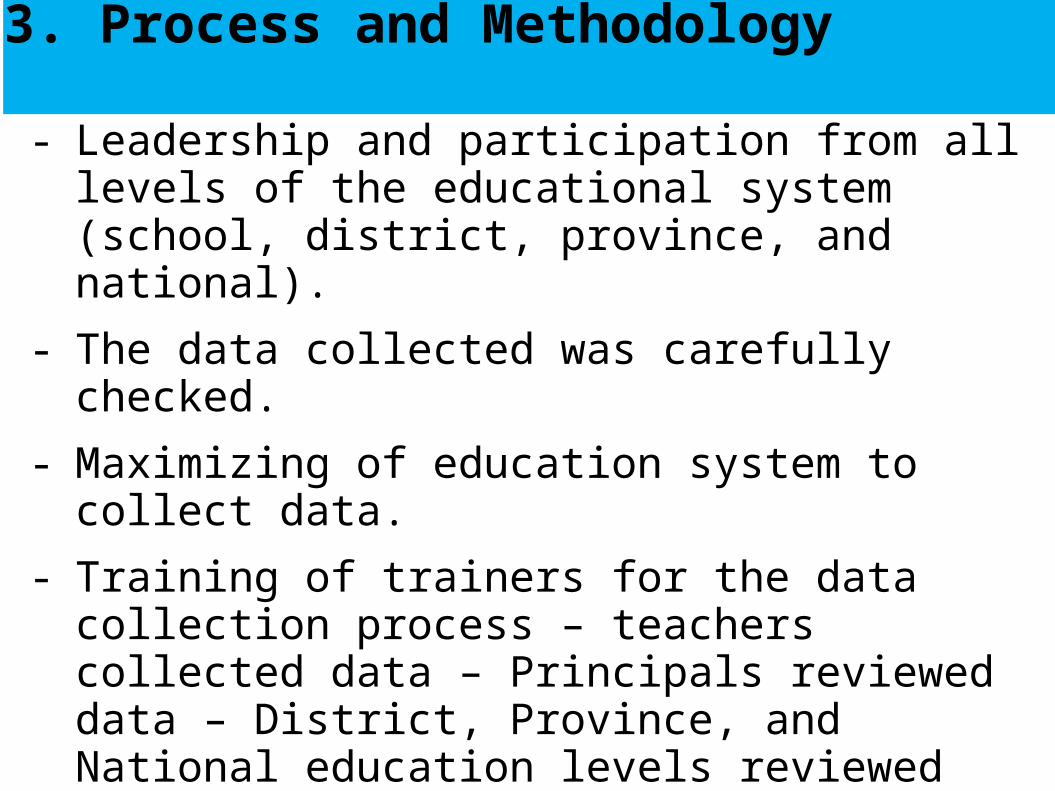
3. Process and Methodology
- Leadership and participation from all levels of the educational system (school, district, province, and national).
- The data collected was carefully checked.
- Maximizing of education system to collect data.
- Training of trainers for the data collection process – teachers collected data – Principals reviewed data – District, Province, and National education levels reviewed the information.
- Basic information was collected that could easily be collected by teachers and mapped using GIS software.

3. Process and Methodology
Reviewing Important Points in research
School • Main School
• Satellite
• Classroom
Information collected according to • Language
• Location
• Classroom
What are the other factors related to language and location (academic performance, poverty...)?

Grade 3
1 Satellite School many Class Rooms
Grade 2
Kindergarten
Grade 1

Language Scenario at School
Is this the situation in every school, at every location, in every classroom??
Language BLanguage C
Language A

There are at least two possibilities
Multi-language School(A) but single language satellites
Multi-language School(A) and multi- language satellites

3.Statistics Primary Schools – Lào Cai
Year Schools Classes PupilsEthnic
Minority Pupils
Percentage of total
2007 229 3,753 62,465 47,852 76.61%
2008 234 3,770 60,735 45,188 74.40%
2009 236 3,897 61,298 44,215 72.13%
2011 241 3,805 60,965 43,904 72.02%

GIS Project File

3. Classroom Language Scenarios
One language shared by all students and teacher
Học sinh Giáo viên

3.Classroom Language Scenario
Students speak 2 different ethnic languages with Kinh speaking teacher

51%
13%
36%Single Lan-guage (Mong, Dao, Tay,...)
Single Lan-guage (Kinh)
Multi Lan-guage
3.Single Language vs Multi Language Classrooms
Students in 51% of Lao Cai primary school classroomsshare the same home languages - Mong, Dao, and Tay.However, their home languages are not used for teaching.

3.Students' Strongest Language
33%
22%16%
12%
6%
Mong
Kinh
Dao
Tay
not recorded
Nung
Giay
Xa Pho
Ha Nhi
other lan-guages

3.Percentage of Primary Classrooms with 1 to 8 Languages
2011 – 2012
1 2 3 4 5 6 7 80%
10%
20%
30%
40%
50%
60%
70%
80%
90%
100%
Languages per Class
Pe
rce
nt
of
Cla
sse
s
64% of primary school classes in Lao Cai have students that all speak the same language - Mông, Kinh, Dao, Tày -

70%
12%
5%3%
KinhTayNungMuongGiayMongDaonot recordedPhu LaPa DiTu DiXa PhoThaiSan DiuHoaCao Lan
Teacher Ethnicities

Teachers StudentsEthnicities Strongest Language
In Lao Cai primary schools, 70% of the teachers are Kinh and speak Vietnamese as their mother tongue but Vietnamese is the strongest language of
only 22% of the students.

Single Language Classes with the Ethnicity of Their Teachers.
Teachers Language of Class
Ethnicity of Teachers Mông Dao Kinh Tày Giáy Nùng
Kinh 2426 1565 649 309 277 92 56 19
Tay 585 392 210 66 46 21 15 14
Nung 218 135 78 31 5 4 3 6
Mong 105 73 48 14 5 1 1 3
Muong 114 63 26 19 7 4 4
Giay 108 60 30 12 5 4 4 3
Dao 90 51 22 7 8 6 3 2
Total Classes 3808 2440 1122 475 361 140 83 55
Teacher Student Match 14.88% 363 48 7 277 21 4 6
Ethnic Classes Single Lg 1932
4.45% 86 48 7 21 4 6
25.98% 502 105 90 140 83 55
All classes
Single Lg
Classes
Teacher Ethnic Student match
Maximum Teacher Ethnic Student Match Possible

How many students can be helped by MTBBE in single language classrooms?
Mong Dao Kinh Tay Giay Nung0
5,000
10,000
15,000
20,000
25,000
Study Environment - Single vs Multi Language
Total Students Students at Monolingual Site
Approximately 19,000 Mong and Dao students could immediately be a part of an MTBBE program.

Percent Students in Monolingual Class per Grade
1 2 3 4 50%
10%
20%
30%
40%
50%
60%
70%
80%
90%
100%
Monolingual Class Mong Monolingual Class DaoGrade
Stu
de
nts
in M
on
olin
gu
al C
lass
The percentage of students in monolingual classes is farily consistent across grades which would allow MTBBE through grade 5.

Grade 1 Academic Performance 2010-2011
Excellent Good Average Weak0%
10%
20%
30%
40%
50%
60%
Kinh
MTBBE
Province Average Grade 1
Mong
The MTBBE program is helping Mong children close the learning gap between themselves and other ethnic groups.


4. Applications
Local:
Adjust teacher training and allocation especially ethnic teachers to match student languages.
Expand for MTBBE planning.
Conduct further research, expand mapping to other levels (Kindergarten and Secondary school).
Inform policy and plans for human resource training, management and development to support the education system.
Ministry of Education and Training:
Share the methods and results of language mapping with other programs to strengthen ethnic education and make it more effective.