5510-0145-00ppr_WEB
24
Propulsion of 2,200-2,800 teu Container Vessel
Transcript of 5510-0145-00ppr_WEB

Propulsion of 2,200-2,800 teuContainer Vessel


Content
Introduction .................................................................................................5
EEDI and Major Ship and Main Engine Parameters........................................6
Energy Efficiency Design Index (EEDI) ......................................................6
Major propeller and engine parameters ....................................................7
2,500 teu container vessel ......................................................................8
Main Engine Operating Costs – 20.0 knots ...................................................9
Fuel consumption and EEDI .................................................................. 10
Operating costs .................................................................................... 12
Main Engine Operating Costs – 19.0 knots ................................................. 13
Fuel consumption and EEDI .................................................................. 13
Operating costs .................................................................................... 15
Retrofit of Existing 7L70ME-C8.2 with EGB-LL for Reduced Ship Speeds ... 16
Exhaust gas bypass – Low Load (EGB-LL) ............................................ 17
Saving in operating costs and payback time .......................................... 17
Summary ................................................................................................... 18
3Propulsion of 2,200-2,800 teu Container Vessel

Propulsion of 2,200-2,800 teu Container Vessel
Introduction
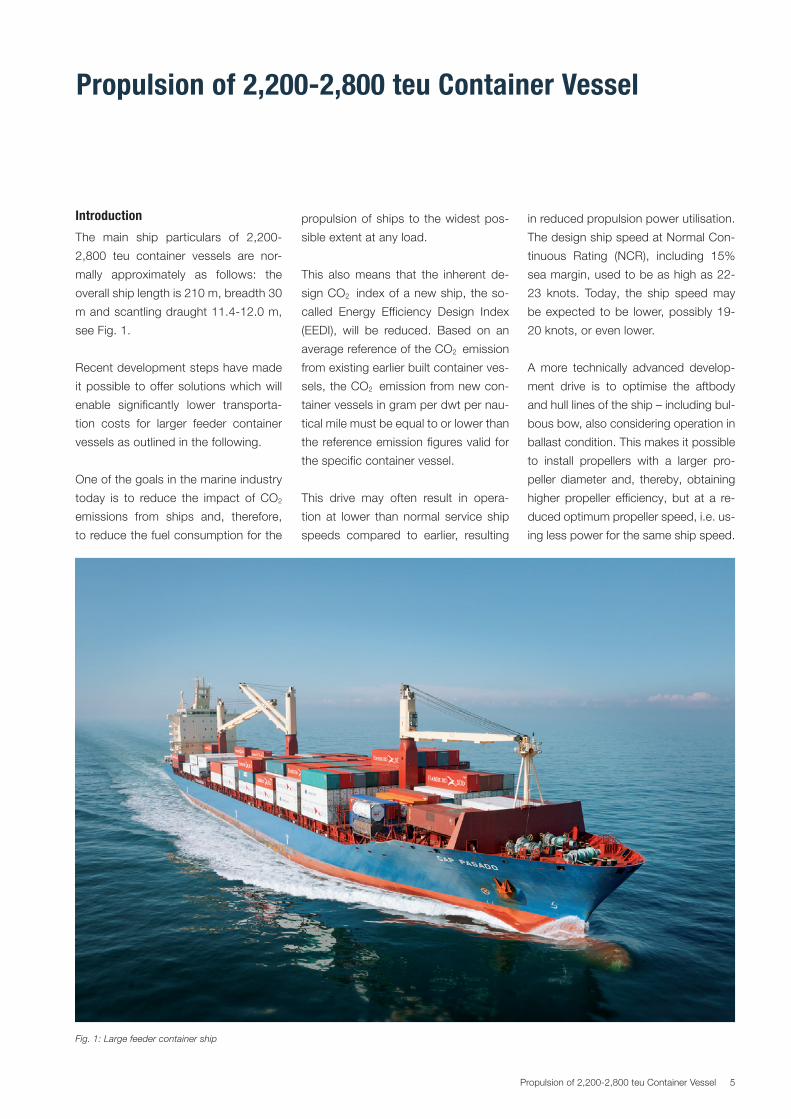
The main ship particulars of 2,200-
2,800 teu container vessels are nor-
mally approximately as follows: the
overall ship length is 210 m, breadth 30
m and scantling draught 11.4-12.0 m,
see Fig. 1.
Recent development steps have made
it possible to offer solutions which will
enable significantly lower transporta-
tion costs for larger feeder container
vessels as outlined in the following.
One of the goals in the marine industry
today is to reduce the impact of CO2
emissions from ships and, therefore,
to reduce the fuel consumption for the
propulsion of ships to the widest pos-
sible extent at any load.
This also means that the inherent de-
sign CO2 index of a new ship, the so-
called Energy Efficiency Design Index
(EEDI), will be reduced. Based on an
average reference of the CO2 emission
from existing earlier built container ves-
sels, the CO2 emission from new con-
tainer vessels in gram per dwt per nau-
tical mile must be equal to or lower than
the reference emission figures valid for
the specific container vessel.
This drive may often result in opera-
tion at lower than normal service ship
speeds compared to earlier, resulting
in reduced propulsion power utilisation.
The design ship speed at Normal Con-
tinuous Rating (NCR), including 15%
sea margin, used to be as high as 22-
23 knots. Today, the ship speed may
be expected to be lower, possibly 19-
20 knots, or even lower.
A more technically advanced develop-
ment drive is to optimise the aftbody
and hull lines of the ship – including bul-
bous bow, also considering operation in
ballast condition. This makes it possible
to install propellers with a larger pro-
peller diameter and, thereby, obtaining
higher propeller efficiency, but at a re-
duced optimum propeller speed, i.e. us-
ing less power for the same ship speed.
Fig. 1: Large feeder container ship
5Propulsion of 2,200-2,800 teu Container Vessel
Furthermore, the wish to reduce fuel
costs and thereby to reduce the design
ship speed from 22-23 knots to about
19-20 or even lower, may involve lower
main engine power, but also a demand
to have lower engine speeds.
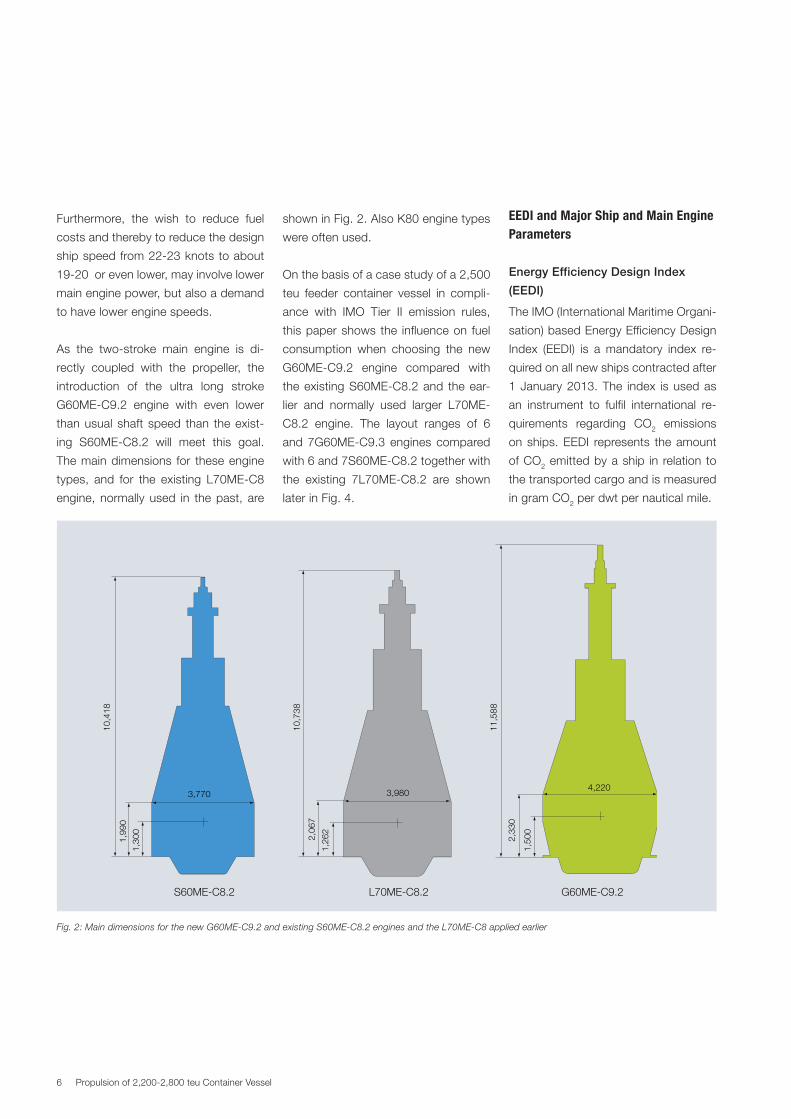
As the two-stroke main engine is di-
rectly coupled with the propeller, the
introduction of the ultra long stroke
G60ME-C9.2 engine with even lower
than usual shaft speed than the exist-
ing S60ME-C8.2 will meet this goal.
The main dimensions for these engine
types, and for the existing L70ME-C8
engine, normally used in the past, are
shown in Fig. 2. Also K80 engine types
were often used.
On the basis of a case study of a 2,500
teu feeder container vessel in compli-
ance with IMO Tier II emission rules,
this paper shows the influence on fuel
consumption when choosing the new
G60ME-C9.2 engine compared with
the existing S60ME-C8.2 and the ear-
lier and normally used larger L70ME-
C8.2 engine. The layout ranges of 6
and 7G60ME-C9.3 engines compared
with 6 and 7S60ME-C8.2 together with
the existing 7L70ME-C8.2 are shown
later in Fig. 4.
L70ME-C8.2 G60ME-C9.2S60ME-C8.2
3,770
1,26
2
1,50
0
1,30
0
1,99
0
2,33
0
2,06
7
10,4
18
11,5
88
10,7
38
4,2203,980
Fig. 2: Main dimensions for the new G60ME-C9.2 and existing S60ME-C8.2 engines and the L70ME-C8 applied earlier
EEDI and Major Ship and Main Engine Parameters
Energy Efficiency Design Index
(EEDI)
The IMO (International Maritime Organi-
sation) based Energy Efficiency Design
Index (EEDI) is a mandatory index re-
quired on all new ships contracted after
1 January 2013. The index is used as
an instrument to fulfil international re-
quirements regarding CO2 emissions
on ships. EEDI represents the amount
of CO2 emitted by a ship in relation to
the transported cargo and is measured
in gram CO2 per dwt per nautical mile.
6 Propulsion of 2,200-2,800 teu Container Vessel

Fig. 3: Influence of propeller diameter and pitch/diameter ratio on SMCR for a 2,500 teu feeder container
vessel operating at 19.0 knots
The EEDI value for container ships is
calculated on the basis of 70% of the
maximum cargo capacity, propulsion
power, ship speed, SFOC (Specific
Fuel Oil Consumption) and fuel type.
Depending on the date of contract,
the EEDI is required to be a certain
percentage lower than an IMO defined
reference value depending on the type
and capacity of the ship.
The main engine’s 75% SMCR (Speci-
fied Maximum Continuous Rating) fig-
ure is as standard applied in the cal-
culation of the EEDI figure, in which
also the CO2 emission from the auxiliary
engines of the ship is included. How-
ever, certain correction factors are ap-
plicable, e.g. for installed waste heat
recovery systems.
According to the rules finally decided
on 15 July 2011, the EEDI of a new ship
is reduced to a certain factor compared
to a reference value. Thus, a ship built
after 2025 is required to have a 30%
lower EEDI than the 2013 reference fig-
ure, see later in Figs. 8 and 14.
Major propeller and engine param-
eters
In general, the highest possible pro-
pulsive efficiency required to provide a
given ship speed is obtained with the
largest possible propeller diameter d,
in combination with the corresponding,
optimum pitch/diameter ratio p/d.
A lower number of propeller blades, for
example when going from 5 to 4 blades
if possible, means approximately 10%
higher optimum propeller speed, and
the propeller efficiency will be slightly
increased, and vice versa when going
from 5 to 6 blades, see later in Fig. 4.
As an example, this is illustrated for a
2,500 teu feeder container ship with
a 5-bladed FP propeller and with a
service ship speed of 19 knots, see
the black curve in Fig. 3. The needed
propulsion SMCR (Specified Maximum
Continuous Rating) power and speed
is shown for a given optimum propeller
diameter d and p/d ratio.
According to the black curve, the ex-
isting propeller diameter of 6.8 m may
have the optimum pitch/diameter ratio
of 0.95, and the lowest possible SMCR
shaft power of about 12,540 kW at
about 97 r/min.
The black curve shows that if a bigger
propeller diameter of 7.2 m is possible,
the necessary SMCR shaft power will be
reduced to about 12,280 kW at about
87 r/min, i.e. the bigger the propeller,
the lower the optimum propeller speed.
If the pitch for this diameter is changed,
the propulsive efficiency will be re-
duced, i.e. the necessary SMCR shaft
power will increase, see the red curve.
The red curve also shows that propul-
sion-wise it will always be an advantage
to choose the largest possible propel-
ler diameter, even though the optimum
pitch/diameter ratio would involve a
too low propeller speed (in relation to
the required main engine speed). Thus,
when using a somewhat lower pitch/
diameter ratio, compared with the op-
timum ratio, the propeller/engine speed
may be increased and will only cause a
minor extra power increase.
The efficiency of a two-stroke main en-
gine particularly depends on the ratio of
the maximum (firing) pressure and the
mean effective pressure. The higher the
ratio, the higher the engine efficiency,
i.e. the lower the Specific Fuel Oil Con-
sumption (SFOC).
Furthermore, the higher the stroke/bore
ratio of a two-stroke engine, the higher
11,000
12,500
13,000
11,500
12,000
13,500
60 70 80 90 100 110 r/minEngine/propeller speed at SMCR
PropulsionSMCR power
kW
Power and speed curve for the given propeller diameterd = 7.2 m with different p/d ratios
Power and speed curve for various propeller diameters (d) with optimum p/d ratio
SMCR power and speed are inclusive of:15% sea margin10% engine margin 5% propeller light running
5-bladed FP-propellersd = Propeller diameterp/d = Pitch/diameter ratio Design Ship Speed = 19.0 knDesign Draught = 10.0 m
S60ME-C8.2
G60ME-C9.2
1.201.10 0.900.98
0.950.80
7.6 m
1.01
7.2 m
6.8 m
dp/d
p/d
7Propulsion of 2,200-2,800 teu Container Vessel

0
5,000
10,000
15,000
20,000
25,000
30,000
60 70 80 90 100 110 120 130 140 r/minEngine and propeller speed at SMCR
PropulsionSMCR powerkW
M1
M
M2’
M3’
M1’M4’
M6
M5’
M5
M4 M2M37G60ME-C9.2
6G60ME-C9.2
6L70ME-C8.2
7S60ME-C8.2
6S60ME-C8.2
7L70ME-C8.28L70ME-C8.2
Future7.6 m × 5
7.6 m × 4 7.2 m × 4 6.8 m × 4
Existing7.2 m × 5
Existing7.0 m × 6
Existing6.8 m × 5
23.0 kn
22.0 kn
21.0 kn
20.0 kn
19.0 kn
18.0 kn
∝
∝
∝
∝
∝
∝
Dprop × = Nblade:
23.0 kn (for EEDI calculations)23.0 kn, 7.0 m × 6MM = 26,160 kW × 108 r/min (8L70ME-C8.2)
22.0 kn22.0 kn, 7.1 m × 5M = 21,780 kW × 108 r/min (7L70ME-C8.2)
20.0 kn20.0 kn, 6.7 m × 5M1 = 15,200 kW × 105 r/min (7S60ME-C8.2)
20.0 kn, 7.0 m × 5M2 = 14,970 kW × 97 r/min (7S60ME-C8.2)
20.0 kn, 7.0 m × 5M3 = 14,970 kW × 97 r/min (6G60ME-C9.2)
20.0 kn, 7.4 m × 5M4 = 14,730 kW × 89 r/min (6G60ME-C9.2)
20.0 kn, 7.4 m × 5M5 = 14,730 kW × 89 r/min (7G60ME-C9.2)
20.0 kn, 7.6 m × 5M6 = 14,570 kW × 84 r/min (7G60ME-C9.2)
19.0 kn19.0 kn, 6.7 m × 5M1’ = 12,570 kW × 98 r/min (6S60ME-C8.2)
19.0 kn, 7.0 m × 5M2’ = 12,420 kW × 92 r/min (6S60ME-C8.2)
19.0 kn, 7.0 m × 5M3’ = 12,420 kW × 92 r/min (6G60ME-C9.2)
19.0 kn, 7.4 m × 5M4’ = 12,180 kW × 83 r/min (6G60ME-C9.2)
19.0 kn, 7.6 m × 5M5’ = 12,070 kW × 79 r/min (6G60ME-C9.2)
4, 5 and 6-bladed FP-propellersconstant ship speed coefficient ∝ = 0.19
SMCR power and speed are inclusive of:15% sea margin10% engine margin5% light running
Tdes = 10.0 m
108 r/min97 r/min
105 r/min
MM
Fig. 4: Different main engine and propeller layouts and SMCR possibilities (M1, M2, M3, etc. for 20.0 knots and M1’, M2’, M3’, etc. for 19.0 knots) for a 2,500
teu container ship operating at 20.0 knots and 19.0 knots, respectively
the engine efficiency. This means, for
example, that an ultra long stroke en-
gine type, as the G60ME-C9.2, may
have a higher efficiency compared with
a shorter stroke engine type, like a
super long stroke S60ME-C8.2 and a
long stroke L70ME-C8.2.
The application of new propeller design
technologies may also motivate use of
main engines with lower rpm. Thus, for
the same propeller diameter, these pro-
peller types can demonstrate an up to
4% improved overall efficiency gain at
the same or a slightly lower propeller
speed.
This is valid for propellers with Kappel
technology available at MAN Diesel &
Turbo, Frederikshavn, Denmark.
Furthermore, due to lower emitted
pressure impulses, the kappel propel-
ler requires less tip clearance that can
be utilised for installing an even larger
propeller diameter, resulting in a further
increase of the propeller efficiency.
Hence, with such a propeller type,
the advantage of the new low speed
G60ME-C9.2 engine can be utilised
also in case a correspondingly larger
propeller cannot be accommodated.
2,500 teu container vessel
For a new 2,500 teu feeder container
ship, the following case study illus-
trates the potential for reducing fuel
consumption by reduced ship speed
and by increasing the propeller diam-
eter and introducing the G60ME-C9.2
as main engine.
8 Propulsion of 2,200-2,800 teu Container Vessel
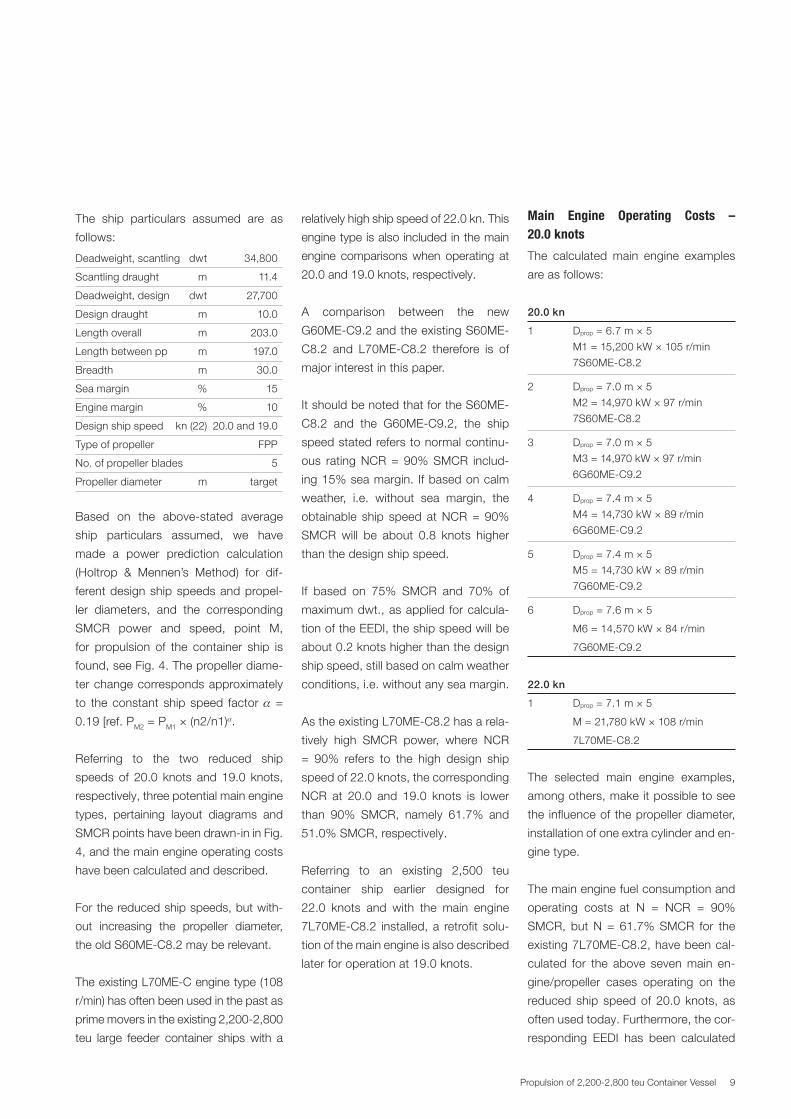
The ship particulars assumed are as
follows:
Deadweight, scantling dwt 34,800
Scantling draught m 11.4
Deadweight, design dwt 27,700
Design draught m 10.0
Length overall m 203.0
Length between pp m 197.0
Breadth m 30.0
Sea margin % 15
Engine margin % 10
Design ship speed kn (22) 20.0 and 19.0
Type of propeller FPP
No. of propeller blades 5
Propeller diameter m target
Based on the above-stated average
ship particulars assumed, we have
made a power prediction calculation
(Holtrop & Mennen’s Method) for dif-
ferent design ship speeds and propel-
ler diameters, and the corresponding
SMCR power and speed, point M,
for propulsion of the container ship is
found, see Fig. 4. The propeller diame-
ter change corresponds approximately
to the constant ship speed factor α =
0.19 [ref. PM2 = PM1 × (n2/n1)α.
Referring to the two reduced ship
speeds of 20.0 knots and 19.0 knots,
respectively, three potential main engine
types, pertaining layout diagrams and
SMCR points have been drawn-in in Fig.
4, and the main engine operating costs
have been calculated and described.
For the reduced ship speeds, but with-
out increasing the propeller diameter,
the old S60ME-C8.2 may be relevant.
The existing L70ME-C engine type (108
r/min) has often been used in the past as
prime movers in the existing 2,200-2,800
teu large feeder container ships with a
relatively high ship speed of 22.0 kn. This
engine type is also included in the main
engine comparisons when operating at
20.0 and 19.0 knots, respectively.
A comparison between the new
G60ME-C9.2 and the existing S60ME-
C8.2 and L70ME-C8.2 therefore is of
major interest in this paper.
It should be noted that for the S60ME-
C8.2 and the G60ME-C9.2, the ship
speed stated refers to normal continu-
ous rating NCR = 90% SMCR includ-
ing 15% sea margin. If based on calm
weather, i.e. without sea margin, the
obtainable ship speed at NCR = 90%
SMCR will be about 0.8 knots higher
than the design ship speed.
If based on 75% SMCR and 70% of
maximum dwt., as applied for calcula-
tion of the EEDI, the ship speed will be
about 0.2 knots higher than the design
ship speed, still based on calm weather
conditions, i.e. without any sea margin.
As the existing L70ME-C8.2 has a rela-
tively high SMCR power, where NCR
= 90% refers to the high design ship
speed of 22.0 knots, the corresponding
NCR at 20.0 and 19.0 knots is lower
than 90% SMCR, namely 61.7% and
51.0% SMCR, respectively.
Referring to an existing 2,500 teu
container ship earlier designed for
22.0 knots and with the main engine
7L70ME-C8.2 installed, a retrofit solu-
tion of the main engine is also described
later for operation at 19.0 knots.
Main Engine Operating Costs – 20.0 knots
The calculated main engine examples
are as follows:
20.0 kn
1 Dprop = 6.7 m × 5
M1 = 15,200 kW × 105 r/min
7S60ME-C8.2
2 Dprop = 7.0 m × 5
M2 = 14,970 kW × 97 r/min
7S60ME-C8.2
3 Dprop = 7.0 m × 5
M3 = 14,970 kW × 97 r/min
6G60ME-C9.2
4 Dprop = 7.4 m × 5
M4 = 14,730 kW × 89 r/min
6G60ME-C9.2
5 Dprop = 7.4 m × 5
M5 = 14,730 kW × 89 r/min
7G60ME-C9.2
6 Dprop = 7.6 m × 5
M6 = 14,570 kW × 84 r/min
7G60ME-C9.2
22.0 kn
1 Dprop = 7.1 m × 5
M = 21,780 kW × 108 r/min
7L70ME-C8.2
The selected main engine examples,
among others, make it possible to see
the influence of the propeller diameter,
installation of one extra cylinder and en-
gine type.
The main engine fuel consumption and
operating costs at N = NCR = 90%
SMCR, but N = 61.7% SMCR for the
existing 7L70ME-C8.2, have been cal-
culated for the above seven main en-
gine/propeller cases operating on the
reduced ship speed of 20.0 knots, as
often used today. Furthermore, the cor-
responding EEDI has been calculated
9Propulsion of 2,200-2,800 teu Container Vessel

1
6,000
8,000
10,000
2
3
12,000
16,000
14,000
4
5
6
7
8
Relative powerreduction
%
Propulsion power demand at N = NCR
kW
0
2,000
4,000
0
Dprop:
13,680 kW
7S60ME-C8.2N1
6.7 m × 5
13,473 kW
7S60ME-C8.2N2
7.0 m × 5
13,473 kW
6G60ME-C9.2N3
7.0 m × 5
13,257 kW
6G60ME-C9.2N4
7.4 m × 5
13,257 kW
7G60ME-C9.2N5
7.4 m × 5
13,113 kW
7G60ME-C9.2N6
7.6 m × 5
13,428 kW
7L70ME-C8.2N
7.1 m × 5
Including a 15% sea margin
0%
1.5% 1.5%
3.1% 3.1%
4.1%
1.8%
Fig. 5: Expected propulsion power demand at N=NCR = 90% SMCR for 20.0 knots (N = 61.7% SMCR for 7L70ME-C8.2)
on the basis of the 75% SMCR-related
figures for 70% of max. dwt. (without
sea margin).
Fuel consumption and EEDI
Fig. 5 shows the influence of the pro-
peller diameter with five propeller
blades when going from about 6.7 m to
7.6 m. Thus, N6 for the 7G60ME-C8.2
with a 7.6 m propeller diameter has a
propulsion power demand that is about
4.1% lower compared with N1 used as
basis valid for the 7S60ME-C8.2. with a
propeller diameter of about 6.7 m.
Fig. 6 shows the influence on the main
engine efficiency, indicated by the Spe-
cific Fuel Oil Consumption, SFOC, for
the seven cases. For N1 = 90% M1
used as basis with the 7S60ME-C8.2
SFOC is 164.2 g/kWh, for N5 = 90%
M5 with 7G60ME-C8.2 SFOC is 160.5
g/kWh and for N = 61.7% M with
7L70ME-C8.2 SFOC is 165.4 g/kWh.
In N5, the SFOC is about 2.3% lower
compared with N1.
When multiplying the propulsion power
demand at N (Fig. 5) with the SFOC (Fig.
6), the daily fuel consumption is found
and is shown in Fig. 7. Compared with
N1 for the existing 7S60ME-C8.2, the
total reduction of fuel consumption of
the new 7G60ME-C9.2 at N6 is about
5.6% (see also the above-mentioned
savings of 4.1% and 1.5% stated in
Figs. 5 and 6).
Engine shaft power
174
175
176
25 30 35 40 45 50 55 60 65 70 75 80 85 90 95 100% SMCR156
157
158
159
160
161
162
163
164
165
166
167
168
169
170
SFOCg/kWh
171
172
173
IMO Tier llISO ambient conditionsLCV = 42,700 kJ/kg
Standard high-loadoptimised engines
For 7L70ME-C8.2 61.7% 68.6%M = SMCRN = NCR
N4
N5
N6
N2
N
N3
N1
Savings in SFOC
0.0%Basis
-0.7%-1.1%
-0.4%
0.9%
1.5%
2.3%
DpropM2 7S60ME-C8.2 7.0 m x 5
M1 7S60ME-C8.2 6.7 m x 5 BasisM4 6G60ME-C9.2 7.4 m x 5
(M) 7L70ME-C8.2 7.1 m x 5M3 6G60ME-C9.2 7.0 m x 5
M5 7G60ME-C9.2 7.4 m x 5
M6 7G60ME-C9.2 7.6 m x 5
Fig. 6: Expected SFOC for 20.0 knots
10 Propulsion of 2,200-2,800 teu Container Vessel

The reference and the actual EEDI
figures have been calculated and are
shown in Fig. 8 (EEDIref = 174.22 x max.
dwt -0.201, 15 July 2011). As can be seen
for all six cases with S60ME-C8.2 and
G60ME-C9.2 and layouted for 20.0
2013Year
Contract datebefore 1 January
2015
2020
2025
Dprop:
0
5
10
15
20
25
0
10
20
30
40
50
60
70
80
90
100
110
Reference and actual EEDICO2 emissionsgram per dwt/n mile Actual/Reference EEDI %
6G60ME-C9.2N4
7.4 m × 5
62%
7L70ME-C8.2N
7.1 m × 5(22.0 kn)
83%
8L70ME-C8.2NN
7.0 m × 5(23.0 kn)
96%
7G60ME-C9.2N5
7.4 m × 5
60%
7G60ME-C9.2N6
7.6 m × 5
60%
EEDI reference (21.29/100%) EEDI actual
7S60ME-C8.2N1
6.7 m × 5
63%
7S60ME-C8.2N2
7.0 m × 5
63%
6G60ME-C9.2N3
7.0 m × 5
62%
75% SMCR and 70% of max dwt: 20.2 kn without sea margin
13.13
20.44
12.81 12.7613.49 13.43 13.19
17.69
Fig. 8: Reference and actual Energy Efficiency Design Index (EEDI) for 20.0 knots
2
30
40
50
4
6
60
70
8
10
12
14
Relative saving of fuel consumption
%
Fuel consumptionof main engine
t/24h
IMO Tier llISO ambient conditions
LCV = 42,700 kJ/kg
0
10
20
0
Dprop:
53.91t/24h
7S60ME-C8.2N1
6.7 m × 5
0%
53.68t/24h
7S60ME-C8.2N2
7.0 m × 5
0.4%
52.63t/24h
6G60ME-C9.2N3
7.0 m × 5
2.4%
52.42t/24h
6G60ME-C9.2N4
7.4 m × 5
2.8%
51.06t/24h
7G60ME-C9.2N5
7.4 m × 5
5.3%
50.90t/24h
7G60ME-C9.2N6
7.6 m × 5
5.6%
53.30t/24h
7L70ME-C8.2N
7.1 m × 5
1.1%
Fig. 7: Expected fuel consumption at N = NCR = 90% SMCR for 20.0 knots (N = 61.7% SMCR for 7L70ME-C8.2)
knots, the actual EEDI figures are rela-
tively low with the lowest EEDI (60%)
for cases 5 and 6 with 7G60ME-C9.2.
All these cases may also meet the
stricter EEDI reference figure valid after
2025.
For information, the calculated EEDI
valid for the old cases 7L70ME-C8.2 (22
kn.) and 8L70ME-C8.2 (23 kn.) is also
shown in Fig. 8. The old 8L70ME-C8.2
(23 kn.) is more or less the reason for the
100% EEDI reference figure used today.
11Propulsion of 2,200-2,800 teu Container Vessel

Fig. 9: Total annual main engine operating costs for 20.0 knots
0.0
2.0
4.0
6.0
1.0
3.0
5.0
Annual operating costsMillion USD/Year
Relative saving in operating costs
%
Dprop:
7.0
8.0
9.0
10.0
0
2
4
6
1
3
5
7
8
9
10
7S60ME-C8.2N1
6.7 m × 5
0%
7S60ME-C8.2N2
7.0 m × 5
0.4%
6G60ME-C9.2N3
7.0 m × 5
2.5%
6G60ME-C9.2N4
7.4 m × 5
2.9%
7G60ME-C9.2N5
7.4 m × 5
5.1%
7G60ME-C9.2N6
7.6 m × 5
5.4%
7L70ME-C8.2N
7.1 m × 5
0.8%
MaintenanceLubricating oil
Fuel oil
IMO Tier llISO ambient conditions
250 days/yearNCR = 90% SMCR (61.7% for 7L70ME-C8.2)
Fuel price: 700 USD/t
YearsLifetime
0
2
1
3
0 5 10 15 20 25 30
4
5
6
7
8
9
Saving in operating costs (Net Present Value)Million USD
10
11
IMO Tier llISO ambient conditionsN = NCR = 90% SMCR (61.7% for 7L70ME-C8.2)250 days/yearFuel price: 700 USD/tRate of interest and discount: 6% p.a.Rate of inflation: 3% p.a.
N2: 7.0 m × 57S60ME-C8.2
N3: 7.0 m × 56G60ME-C9.2
N4: 7.4 m × 56G60ME-C9.2
N5: 7.4 m × 57G60ME-C9.2
N6: 7.6 m × 57G60ME-C9.2
N1: 6.7 m × 57S60ME-C8.2
N:7.1 m × 57L70ME-C8.2
Fig. 10: Relative saving in main engine operating costs (NPV) for 20.0 knots
Operating costs
The total main engine operating costs
per year, 250 days/year, and fuel price
of 700 USD/t, are shown in Fig. 9. The
lube oil and maintenance costs are
shown too. As can be seen, the major
operating costs originate from the fuel
costs – about 96%.
After some years in service, the rela-
tive savings in operating costs in Net
Present Value (NPV), see Fig. 10, with
the existing 7S60ME-C8.2 used as
basis N1 with the propeller diameter
of about 6.7 m, indicates an NPV sav-
ing for the new 7G60ME-C9.2 engine.
After 25 years in operation, the saving
is about 8.7 million USD for N5 with
7G60ME-C9.2 with the SMCR speed
of 89.0 r/min and propeller diameter of
about 7.4 m.
12 Propulsion of 2,200-2,800 teu Container Vessel

Main Engine Operating Costs – 19.0 knots
The calculated main engine examples
are as follows:
19.0 kn
1 Dprop = 6.7 m × 5
M1’ = 12,570 kW × 98 r/min
6S60ME-C8.2
2 Dprop = 7.0 m × 5
M2’ = 12,420 kW × 92 r/min
6S60ME-C8.2
3 Dprop = 7.0 m × 5
M3’ = 12,420 kW × 92 r/min
6G60ME-C9.2
4 Dprop = 7.4 m × 5
M4’ = 12,180 kW × 83 r/min
6G60ME-C9.2
5 Dprop = 7.6 m × 5
M5’ = 12,070 kW × 79 r/min
6G60ME-C9.2
22.0 kn
1 Dprop = 7.1 m × 5
M’ = 21,780 kW × 108 r/min
7L70ME-C8.2
The main engine fuel consumption and
operating costs at N’ = NCR = 90%
SMCR, but N’ = 51% SMCR for the ex-
isting 7L70ME-C8.2, have been calcu-
lated for the above six main engine/pro-
peller cases operating on the reduced
ship speed of 19.0 knots, which is prob-
ably going to be a more normal choice
in the future. Furthermore, the EEDI has
been calculated on the basis of the 75%
SMCR-related figures for 70% of max.
dwt. (without sea margin).
Fuel consumption and EEDI
Fig. 11 shows the influence of the pro-
peller diameter with five propeller blades
when going from about 6.7 m to 7.6 m.
Thus, N5’ for the 6G60ME-C9.2 with
an about 7.6 m propeller diameter has
1
6,000
8,000
10,000
2
3
12,000
14,000
4
5
6
7
Relative powerreduction
%Including a 15% sea margin
Propulsion power demand at N’ = NCR
kW
0
2,000
4,000
0
Dprop:
11,178 kW
6S60ME-C8.2N2’
7.0 m × 5
11,313 kW
6S60ME-C8.2N1’
6.7 m × 5
11,178 kW
6G60ME-C9.2N3’
7.0 m × 5
10,962 kW
6G60ME-C9.2N4’
7.4 m × 5
10,863 kW
6G60ME-C9.2N5’
7.6 m × 5
11,117 kW
7L70ME-C8.2N’
7.1 m × 5
0%
1.2% 1.2%
3.1%
4.0%
1.7%
Fig. 11: Expected propulsion power demand at N = NCR = 90% SMCR for 19.0 knots (N’ = 51% SMCR
for 7L70ME-C8.2)
a propulsion power demand that is
about 4.0% lower compared with the
N1’ used as basis for the 6S60ME-C8.2
with an about 6.7 m propeller diameter.
Fig. 12 shows the influence on the main
engine efficiency, indicated by the Spe-
cific Fuel Oil Consumption, SFOC, for
the six cases. For N1’ = 90% M1’ with
the 6S60ME-C8.2 used as basis SFOC
is 165.1 g/kWh compared with the
159.2 g/kWh for N3’ = 90% M3’ for the
6G60ME-C9.2, i.e. an SFOC reduction
for N3’ of about 3.6%. For N’ = 51.0%
M’ with 7L70ME-C8.2 SFOC is 167.3
g/kWh, i.e. an SFOC increase of about
1.3%.
The daily fuel consumption is found by
multiplying the propulsion power de-
mand at N’ (Fig. 11) with the SFOC (Fig.
12), see Fig. 13. The total reduction of
fuel consumption of the new 6G60ME-
C9.2, N5’ with propeller diameter 7.6
m, is about 5.5% compared with N1’
for the existing 6S60ME-C8.2.
Engine shaft power
174
175
176
25 30 35 40 45 50 55 60 65 70 75 80 85 90 95 100% SMCR156
157
158
159
160
161
162
163
164
165
166
167
168
169
170
SFOCg/kWh
171
172
173
IMO Tier llISO ambient conditionsLCV = 42,700 kJ/kg
Standard high-loadoptimised engines
For 7L70ME-C8.2 51.0% 56.7%M’ = SMCRN’ = NCR
N1’
N3’
N2’N’
N4’
N5’
Savings in SFOC
0.0%Basis
-1.3%-0.9%
1.6%
2.2%
3.6%
Dprop
M2’ 6S60ME-C8.2 7.0 m x 5
M1’ 6S60ME-C8.2 6.7 m x 5 Basis(M’) 7L70ME-C8.2 7.1 m x 5
M5’ 6G60ME-C9.2 7.6 m x 5
M4’ 6G60ME-C9.2 7.4 m x 5
M3’ 6G60ME-C9.2 7.0 m x 5
Fig. 12: Expected SFOC for 19.0 knots
13Propulsion of 2,200-2,800 teu Container Vessel

The reference and the actual EEDI
figures have been calculated and are
shown in Fig. 14 (EEDIref = 174.22 ×
max. dwt -0.201, 15 July 2011). As can
be seen for all five cases with 6S60ME-
C8.2 and 6G60ME-C9.2 and layouted
for 19.0 knots, the actual EEDI figures
are much lower than the reference fig-
ure because of the relatively low ship
speed of 19.0 knots.
All these cases may also meet the
stricter EEDI reference figure valid after
2025.
As for the earlier stated cases based
on 20 knots, the EEDI for the old cases
7L70ME-C8.2 (22 kn.) and 8L70ME-
C8.2 (23 kn.) is also shown in Fig. 14
for information.
2
30
40
50
4
6
60
70
8
10
12
14
Relative saving of fuel consumption
%
Fuel consumptionof main engine
t/24h
IMO Tier llISO ambient conditions
LCV = 42,700 kJ/kg
0
10
20
0
44.69t/24h
6S60ME-C8.2N2’
7.0 m × 5
44.83t/24h
6S60ME-C8.2N1’
6.7 m × 5
42.72t/24h
6G60ME-C9.2N3’
7.0 m × 5
42.46t/24h
6G60ME-C9.2N4’
7.4 m × 5
42.36t/24h
6G60ME-C9.2N5’
7.6 m × 5
44.64t/24h
7L70ME-C8.2N’
7.1 m × 5
0%0.3%
4.7%5.3% 5.5%
0.4%
Dprop:
6S60ME-C8.2N1’
6.7 m × 5
6S60ME-C8.2N2’
7.0 m × 5
6G60ME-C9.2N3’
7.0 m × 5
6G60ME-C9.2N4’
7.4 m × 5
6G60ME-C9.2N5’
7.6 m × 5
7L70ME-C8.2N’
7.1 m × 5(22.0 kn)
Dprop:
0
5
10
15
20
25
0
10
20
30
40
50
60
70
80
90
100
110
Reference and actual EEDICO2 emissionsgram per dwt/n mile
Actual/ReferenceEEDI %
2013Year
Contract datebefore 1 January
2015
2020
2025
56% 53% 53%
83%
53%
EEDI actualEEDI reference (21.29/100%)
56%
8L70ME-C8.2NN’
7.0 m × 5(23.0 kn)
96%
75% SMCR and 70% of max dwt: 19.2 kn without sea margin
11.82 11.33 11.26
17.69
11.2311.86
20.44
Fig. 14: Reference and actual Energy Efficiency Design Index (EEDI) for 19.0 knots
Fig. 13: Expected fuel consumption at N’ = NCR = 90% SMCR for 19.0 knots (N’ = 51% SMCR for
7L70ME-C8.2)
14 Propulsion of 2,200-2,800 teu Container Vessel
0.0
2.0
4.0
6.0
1.0
-1.0
3.0
5.0
Annual operating costsMillion USD/Year
Relative saving in operating costs
%
Dprop:
7.0
8.0
9.0
0
2
4
6
1
-1
3
5
7
8
9
6S60ME-C8.2N1’
6.7 m × 5
6S60ME-C8.2N2’
7.0 m × 5
6G60ME-C9.2N3’
7.0 m × 5
6G60ME-C9.2N4’
7.4 m × 5
6G60ME-C9.2N5’
7.6 m × 5
7L70ME-C8.2N’
7.1 m × 5
0%
0.3%
4.5%5.1%
5.4%
-0.3%
MaintenanceLubricating oil
Fuel oil
IMO Tier llISO ambient conditions
250 days/yearNCR = 90% SMCR (51.0% for 7L70ME-C8.2)
Fuel price: 700 USD/t
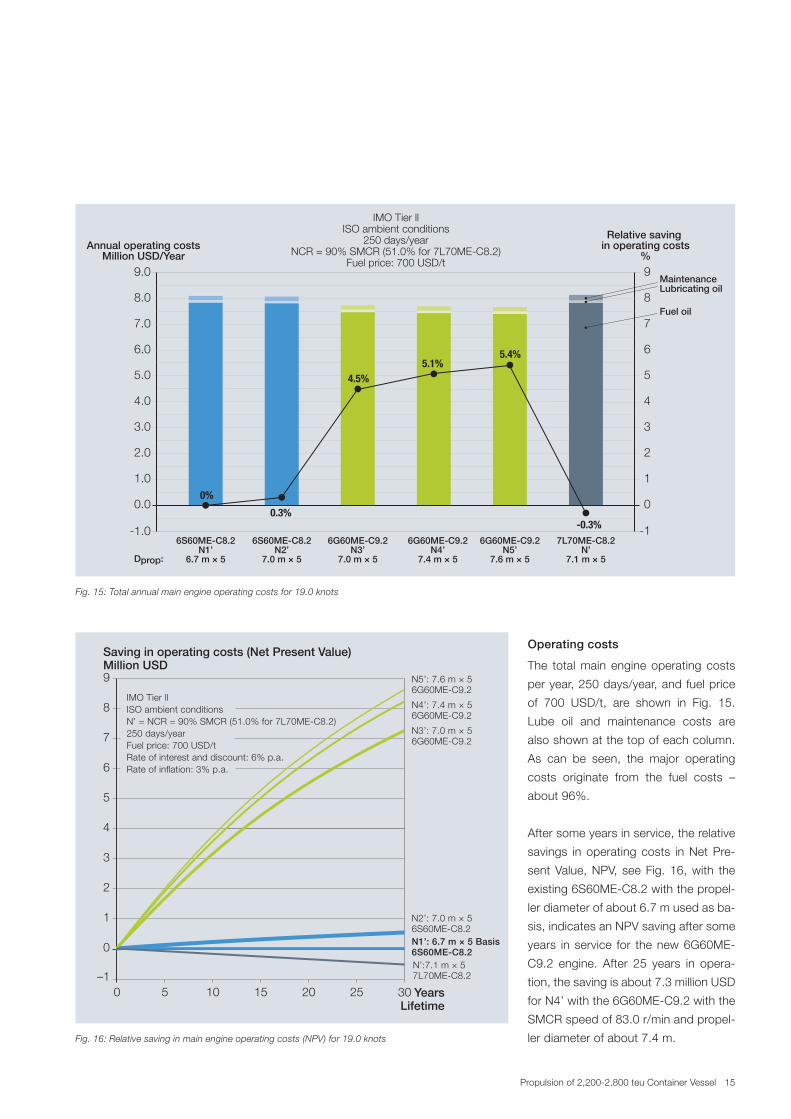
Fig. 15: Total annual main engine operating costs for 19.0 knots
YearsLifetime
0
–1
2
1
3
0 5 10 15 20 25 30
4
5
6
7
8
9
Saving in operating costs (Net Present Value)Million USD
IMO Tier llISO ambient conditionsN’ = NCR = 90% SMCR (51.0% for 7L70ME-C8.2)250 days/yearFuel price: 700 USD/tRate of interest and discount: 6% p.a.Rate of inflation: 3% p.a.
N2’: 7.0 m × 56S60ME-C8.2
N3’: 7.0 m × 56G60ME-C9.2
N4’: 7.4 m × 56G60ME-C9.2
N5’: 7.6 m × 56G60ME-C9.2
N1’: 6.7 m × 5 Basis6S60ME-C8.2N’:7.1 m × 57L70ME-C8.2
Fig. 16: Relative saving in main engine operating costs (NPV) for 19.0 knots
Operating costs
The total main engine operating costs
per year, 250 days/year, and fuel price
of 700 USD/t, are shown in Fig. 15.
Lube oil and maintenance costs are
also shown at the top of each column.
As can be seen, the major operating
costs originate from the fuel costs –
about 96%.
After some years in service, the relative
savings in operating costs in Net Pre-
sent Value, NPV, see Fig. 16, with the
existing 6S60ME-C8.2 with the propel-
ler diameter of about 6.7 m used as ba-
sis, indicates an NPV saving after some
years in service for the new 6G60ME-
C9.2 engine. After 25 years in opera-
tion, the saving is about 7.3 million USD
for N4’ with the 6G60ME-C9.2 with the
SMCR speed of 83.0 r/min and propel-
ler diameter of about 7.4 m.
15Propulsion of 2,200-2,800 teu Container Vessel
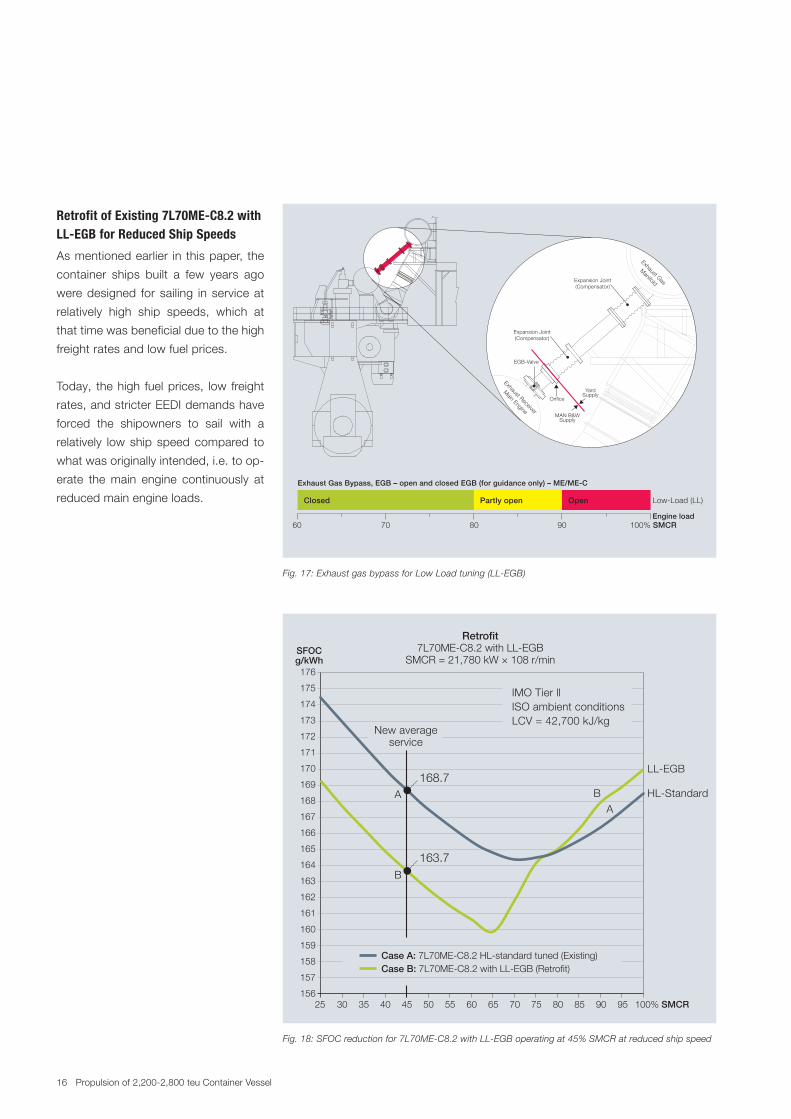
Retrofit of Existing 7L70ME-C8.2 with LL-EGB for Reduced Ship Speeds
As mentioned earlier in this paper, the
container ships built a few years ago
were designed for sailing in service at
relatively high ship speeds, which at
that time was beneficial due to the high
freight rates and low fuel prices.
Today, the high fuel prices, low freight
rates, and stricter EEDI demands have
forced the shipowners to sail with a
relatively low ship speed compared to
what was originally intended, i.e. to op-
erate the main engine continuously at
reduced main engine loads.
60
Low-Load (LL)
70
Closed Partly open Open
80 90 100% SMCREngine load
Exhaust Gas Bypass, EGB – open and closed EGB (for guidance only) – ME/ME-C
EGB-Valve
Expansion Joint(Compensator)
Expansion Joint(Compensator)
Orifice
YardSupply
MAN B&WSupply
Exhaust Receiver
Main Engine
Exhaust Gas
Manifold
Fig. 17: Exhaust gas bypass for Low Load tuning (LL-EGB)
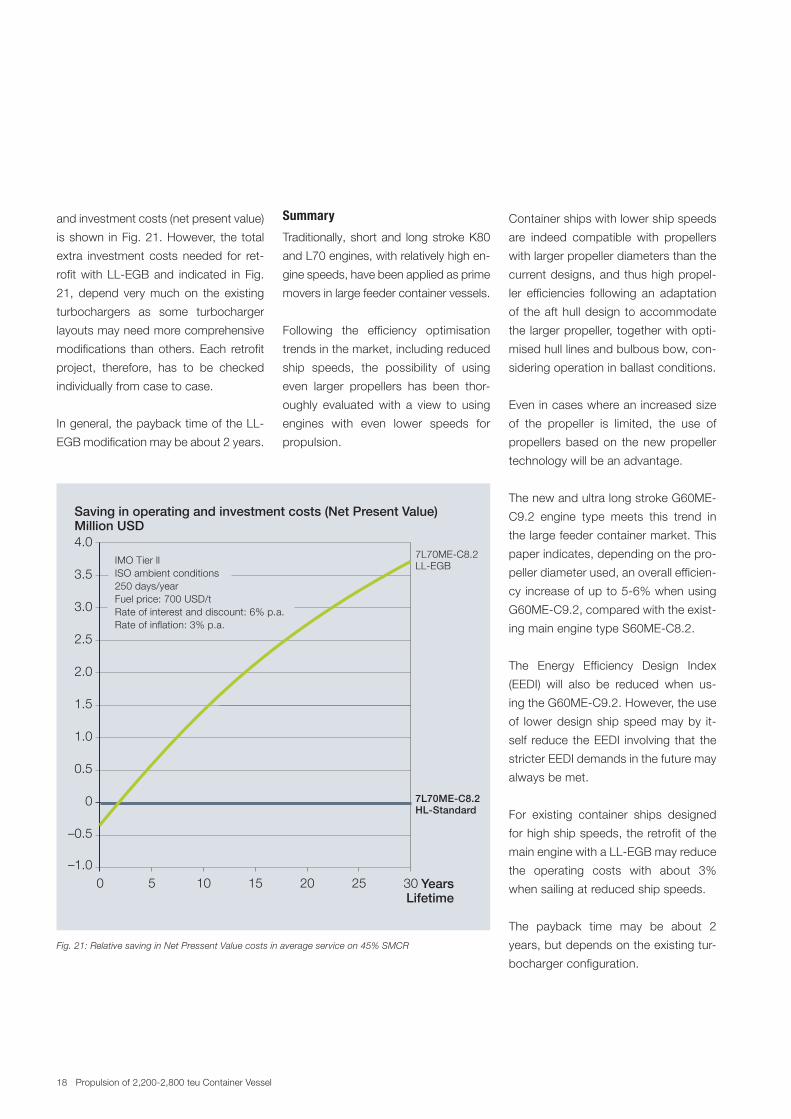
Fig. 18: SFOC reduction for 7L70ME-C8.2 with LL-EGB operating at 45% SMCR at reduced ship speed
174
175
176
25 30 35 40 45 50 55 60
168.7
163.7
65 70 75 80 85 90 95 100% SMCR156
157
158
159
160
161
162
163
164
165
166
167
168
169
170
SFOCg/kWh
171
172
173
IMO Tier llISO ambient conditionsLCV = 42,700 kJ/kg
New averageservice
AA
B
LL-EGB
HL-Standard
Case A: 7L70ME-C8.2 HL-standard tuned (Existing)Case B: 7L70ME-C8.2 with LL-EGB (Retrofit)
Retrofit7L70ME-C8.2 with LL-EGB
SMCR = 21,780 kW × 108 r/min
B
16 Propulsion of 2,200-2,800 teu Container Vessel

Exhaust Gas Bypass – Low Load
(LL-EGB)
A reduction of SFOC when operating at
low loads is possible but is limited by
NOx regulations on two-stroke engines.
Thus, NOx emission will increase if the
SFOC is reduced and vice versa.
Compared to a standard high load op-
timised ME-C engine, an SFOC reduc-
tion of 5g/kWh at low load is possible,
but at the expense of a higher SFOC in
the high-load range without exceeding
the IMO NOx limit.
This is possible by means of an exhaust
gas bypass, low load optimised, see Fig.
17. The corresponding SFOC curve for
a 7L70ME-C8.2 with SMCR = 21,780
kW x 108 r/min is shown in Fig. 18.
Saving in operating costs and pay-
back time
The existing standard high load op-
timised 7L70ME-C8.2 with SMCR =
21,780 kW x 108 r/min and design ship
speed of 22.0 knots has been used as
basis.
The SFOC and fuel consumptions have
been calculated valid for the new aver-
age engine service load of 45% SMCR
which more or less corresponds to
the reduced average ship speed of 19
knots, case A, see Figs. 18 and 19.
The corresponding SFOC and fuel
consumptions valid for LL-EGB, case
B, is also shown in Figs. 18 and 19.
The LL-EGB case B has an about 3%
lower fuel consumption than for the HL-
standard tuned engine, case A.
The annual operating costs are shown
in Fig. 20, and the saving in operating
Fig. 20: Total annual main engine operating costs in average service on 45% SMCR
0.0
2.0
4.0
6.0
1.0
3.0
5.0
Annual operating costsMillion USD/Year
Relative saving in operating costs
%
7.0
8.0
9.0
10.0
0
1
2
3
4
5
0%
7L70ME-C8.2LL-EGB
B
7L70ME-C8.2HL-Standard
A
2.9%
MaintenanceLubricating oil
Fuel oil
Retrofit7L70ME-C8.2 with LL-EGB
SMCR = 21,780 kW × 108 r/min250 days/year
Fuel price: 700 USD/t
1
30
40
50
2
3
60
70
4
5
6
7
Relative saving of fuel consumption
%
Fuel consumptionof main engine
t/24h
IMO Tier llISO ambient conditions
LCV = 42,700 kJ/kg
0
10
20
0
Retrofit7L70ME-C8.2 with LL-EGB
SMCR = 21,780 kW × 108 r/min
39.67t/24h
0%
7L70ME-C8.2HL-Standard
A
38.50t/24h
7L70ME-C8.2LL-EGB
B
3.0%
Fig. 19: Expected fuel consumption in average service on 45% SMCR
17Propulsion of 2,200-2,800 teu Container Vessel
and investment costs (net present value)
is shown in Fig. 21. However, the total
extra investment costs needed for ret-
rofit with LL-EGB and indicated in Fig.
21, depend very much on the existing
turbochargers as some turbocharger
layouts may need more comprehensive
modifications than others. Each retrofit
project, therefore, has to be checked
individually from case to case.
In general, the payback time of the LL-
EGB modification may be about 2 years.
Summary
Traditionally, short and long stroke K80
and L70 engines, with relatively high en-
gine speeds, have been applied as prime
movers in large feeder container vessels.
Following the efficiency optimisation
trends in the market, including reduced
ship speeds, the possibility of using
even larger propellers has been thor-
oughly evaluated with a view to using
engines with even lower speeds for
propulsion.
Container ships with lower ship speeds
are indeed compatible with propellers
with larger propeller diameters than the
current designs, and thus high propel-
ler efficiencies following an adaptation
of the aft hull design to accommodate
the larger propeller, together with opti-
mised hull lines and bulbous bow, con-
sidering operation in ballast conditions.
Even in cases where an increased size
of the propeller is limited, the use of
propellers based on the new propeller
technology will be an advantage.
The new and ultra long stroke G60ME-
C9.2 engine type meets this trend in
the large feeder container market. This
paper indicates, depending on the pro-
peller diameter used, an overall efficien-
cy increase of up to 5-6% when using
G60ME-C9.2, compared with the exist-
ing main engine type S60ME-C8.2.
The Energy Efficiency Design Index
(EEDI) will also be reduced when us-
ing the G60ME-C9.2. However, the use
of lower design ship speed may by it-
self reduce the EEDI involving that the
stricter EEDI demands in the future may
always be met.
For existing container ships designed
for high ship speeds, the retrofit of the
main engine with a LL-EGB may reduce
the operating costs with about 3%
when sailing at reduced ship speeds.
The payback time may be about 2
years, but depends on the existing tur-
bocharger configuration.
Fig. 21: Relative saving in Net Pressent Value costs in average service on 45% SMCR
YearsLifetime
–0.5
–1.0
0.5
0
1.0
0 5 10 15 20 25 30
1.5
2.0
2.5
3.0
3.5
4.0
Saving in operating and investment costs (Net Present Value)Million USD
IMO Tier llISO ambient conditions250 days/yearFuel price: 700 USD/tRate of interest and discount: 6% p.a.Rate of inflation: 3% p.a.
7L70ME-C8.2HL-Standard
7L70ME-C8.2LL-EGB
18 Propulsion of 2,200-2,800 teu Container Vessel


MAN Diesel & TurboTeglholmsgade 412450 Copenhagen SV, DenmarkPhone +45 33 85 11 00Fax +45 33 85 10 [email protected]
MAN Diesel & Turbo – a member of the MAN Group
All data provided in this document is non-binding. This data serves informational purposes only and is especially not guaranteed in any way. Depending on the subsequent specific individual projects, the relevant data may be subject to changes and will be assessed and determined individually for each project. This will depend on the particular characteristics of each individual project, especially specific site and operational conditions. Copyright © MAN Diesel & Turbo. 5510-0145-00ppr Oct 2013 Printed in Denmark