519 Simulation Analysis of Process Piping Construction Min - IAARC
8
Automation and Robotics in Construction X G.H. Watson, R.L. Tucker and J .K. Walters (Editors) 1993 Elsevier Science Publishers B.V. All rights reserved. 519 Simulation Analysis of Process Piping Construction Min-Yuan Chenga and James T. O'Connorb aDepartment of Construction Engineering & Technology, National Taiwan Institute of Technology, Associate Professor bDepartment of Civil Engineering, University of Texas at Austin, Associate Professor Abstract Previous research has demonstrated that automation can improve industrial pipe lifting productivity. However, there is little information on finding how much productivity can be improved in the other parts of pipe erection processes to coordinate with the productivity improvement in pipe lifting. The processes of piping construction include pipe delivery, pipe lifting, pipe alignment, pipe connection, and pipe inspection & connection. This paper studied the potential productivity improvement by simulating the process of piping operations in order to synchronize with the productivity improvement in piping lifting. This paper is based in part on previous findings from studies performed by Glass and Fisher at the University of Texas at Austin in 1984 and 1989. The semi-automated environment for piping erection assumes a Grove Pipe Manipulator attached to the boom nose of a 22-ton crane as the base piece of equipment for piping erection. A system model is established to simulate and analyze the process of piping construction. A simulation technique is developed in this study to identify the possible critical tasks and the factors of obstruction in the process of piping construction that would eliminate the productivity improvement in piping erection. 1. BACKGROUND The Manipulator was first brought into construction in 1980. Since then the Pipe Manipulator has been modified several times for the problems of technical utilization and was tested in the construction industry for handling large scale of piping construction. The Pipe Manipulator is an electrohydraulically control, multifunction, large bore pipe handling device which consists of five major components, namely a side mounted gravity leveling operator's basket with control panel, an attaching support frame, a telescoping boom, a pipe grappling and pivot head assembly, and a free standing storage rack for the unit when it is not being used (Glass 1984). Glass developed his study in comparing the productivity of the Pipe Manipulator with conventional piping erection method using a small, 15-ton hydraulic "Cherry Picker"(Glass 1984). In the Glass' study, it was found that the Pipe Manipulator was superior to conventional piping erection when lifting large diameter, vertical and bent pipe configurations. Fisher, in 1989, summarized piping erection activities and the percentage of cycle breakdowns of time, from two of Glass' time lapse films, for horizontal piping erection (film D-3 and D-4). Fisher's findings, from the imitation of the paths in time lapse films D-3 and D-4 to record the process of simulation on plastic and computer models, indicated that the Pipe Manipulator could be improved through four phases of piping erection method. In each phase, constructability issues associated with piping construction was explored and improved to promote a more automated operation.
Transcript of 519 Simulation Analysis of Process Piping Construction Min - IAARC
Automation and Robotics in Construction X
G.H. Watson, R.L. Tucker and J .K. Walters (Editors)
1993 Elsevier Science Publishers B.V. All rights reserved.519
Simulation Analysis of Process Piping Construction
Min-Yuan Chenga and James T. O'Connorb
aDepartment of Construction Engineering & Technology, National Taiwan Institute of
Technology, Associate Professor
bDepartment of Civil Engineering, University of Texas at Austin, Associate Professor
AbstractPrevious research has demonstrated that automation can improve industrial pipe lifting
productivity. However, there is little information on finding how much productivity can beimproved in the other parts of pipe erection processes to coordinate with the productivityimprovement in pipe lifting. The processes of piping construction include pipe delivery, pipelifting, pipe alignment, pipe connection, and pipe inspection & connection. This paper studiedthe potential productivity improvement by simulating the process of piping operations in orderto synchronize with the productivity improvement in piping lifting. This paper is based in parton previous findings from studies performed by Glass and Fisher at the University of Texas atAustin in 1984 and 1989. The semi-automated environment for piping erection assumes aGrove Pipe Manipulator attached to the boom nose of a 22-ton crane as the base piece ofequipment for piping erection. A system model is established to simulate and analyze theprocess of piping construction. A simulation technique is developed in this study to identifythe possible critical tasks and the factors of obstruction in the process of piping constructionthat would eliminate the productivity improvement in piping erection.
1. BACKGROUND
The Manipulator was first brought into construction in 1980. Since then the PipeManipulator has been modified several times for the problems of technical utilization and wastested in the construction industry for handling large scale of piping construction. The PipeManipulator is an electrohydraulically control, multifunction, large bore pipe handling devicewhich consists of five major components, namely a side mounted gravity leveling operator'sbasket with control panel, an attaching support frame, a telescoping boom, a pipe grapplingand pivot head assembly, and a free standing storage rack for the unit when it is not being used(Glass 1984). Glass developed his study in comparing the productivity of the PipeManipulator with conventional piping erection method using a small, 15-ton hydraulic "CherryPicker"(Glass 1984). In the Glass' study, it was found that the Pipe Manipulator was superiorto conventional piping erection when lifting large diameter, vertical and bent pipeconfigurations. Fisher, in 1989, summarized piping erection activities and the percentage ofcycle breakdowns of time, from two of Glass' time lapse films, for horizontal piping erection(film D-3 and D-4). Fisher's findings, from the imitation of the paths in time lapse films D-3and D-4 to record the process of simulation on plastic and computer models, indicated that thePipe Manipulator could be improved through four phases of piping erection method. In eachphase, constructability issues associated with piping construction was explored and improved
to promote a more automated operation.
520
2. METHODOLOGY
This study was conducted in three steps:1. establish a cycle model to simulate the piping installation process,2. identify the critical work tasks (i.e., bottleneck activities), and3. study sensitivity analysis to determine the optimal combinations of labor crew (i.e.,
fitter and welder) under different circumstances.
2.1 The Cycle Model
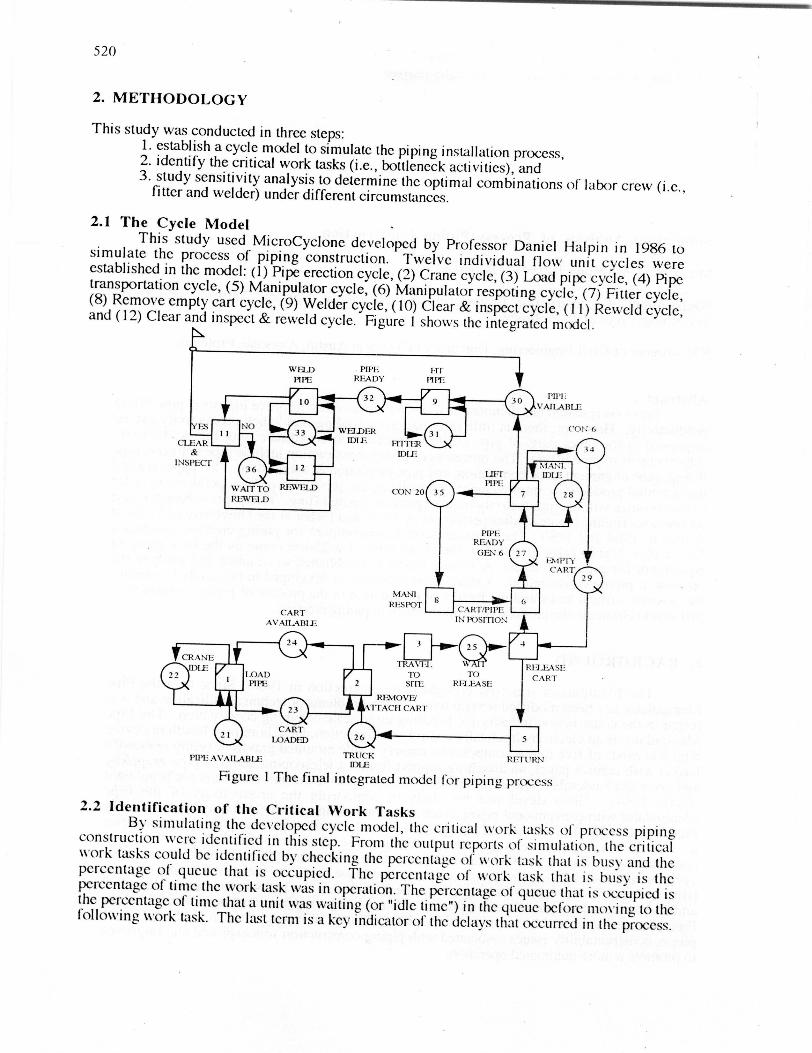
This study used MicroCyclone developed by Professor Daniel Halpin in 1986 tosimulate the process of piping construction. Twelve individual flow unit cycles wereestablished in the model: (1) Pipe erection cycle, (2) Crane cycle, (3) Load pipe cycle, (4) Pipetransportation cycle, (5) Manipulator cycle, (6) Manipulator respoting cycle, (7) Fitter cycle,(8) Remove empty cart cycle, (9) Welder cycle, (10) Clear & inspect cycle, (11) Reweld cycle,and (12) Clear and inspect & reweld cycle. Figure 1 shows the integrated model.
N
W IWJ)
PIPE
10
CLEAR
NO33
INSPECr36 12
WAIT TO REWELD
RI:\VEI.D
PIPIT 1-7r
READY PIPE
32
W EJDFRIDLE ITrI"CR
IDLE
CON 20
P11'Ii
VAILABI1:
MANE
IDlE
PIPEREADY
GEN6
CART
AVAIIARIE
MANI
RESPO1
C
0
Q
GCA RT7PI PL
IN POSrITON
TRAVII.
TOSrITP
IT KIMOVE/
CART
L.OADLI)
PIPE AVAILABLE
Figure 1 The final
4TfACI I CART'
26
TRUCKIDLE
El
('ON 6
♦♦
1IM-e ,
RLI.IJ\SI:CART
S
RI LI'RN
integrated model for piping process
2.2 Identification of the Critical Work TasksBy simulating the developed cycle model, the critical work tasks of, process piping
construction were identified in this step. From the output reports of simulation, the criticalwork tasks could be identified by checking the percentage of work task that is busy and thepercentage of queue that is occupied. The percentage of work task that is busy is thepercentage of time the work task was in operation. The percentage of queue that is occupied isthe percentage of time that a unit was waiting (or "idle time") in the queue before moving to thefollowing work task. The last term is a key indicator of the delays that occurred in the process.
521
2.3 Sensitivity AnalysisThis section discusses the objective statements and both the Tree Algorithm and the
Time Deviation methods used for analyzing this study. Tree Algorithm method includes a treecombination of resources and comparison of different interest to approach the decision-makingprocess. Time Deviation method analyzes the best range of time control of critical activity thatcould achieve maximum productivity increase.
2.3.1 Objective StatementThe purposes of this study is to establish a cycle model to simulate the piping
installation process, identify the critical work tasks (i.e.., bottleneck activities), analyze thefrequency of pipe delivery (# of trucks), and determine the number of labor crew (i.e.., fitterand welder) under different circumstances. This study involves different effects, givendifferent combinations of trucks, fitting crews, welding crews, and productivity rates betweenconventional and improved piping erection methods.
Three major objectives are concerned in this study:Objective 1: Use standard and conventional piping erection process in the model tosimulate and identify the possible critical work task. Analyze the combination of trucks, fittingcrews and welding crews required in coordinating with pipe lifting activity. Different goalssuch as maximum productivity per hour (Spools/HR), maximum productivity per man-hour(Spools/MH), least idle time of pipe waiting the Manipulator to lift can be achieved with a TreeAlgorithm method. Depending on the different interests, the decision-maker would like totrade-off according to the results to make his best decision.Objective 2: Findings from D.J. Fisher "Piping Erection Constructability Issues In aSemi-Automated Environment" include specific suggestions that would improve the PipeManipulator performance by 48% over conventional piping erection methods. Four types ofstudies to improve Pipe Manipulator installation cycle time were identified in Fisher's study(see Table 1). Based on the improvement of cycle time in each phase, this paper identified thebest combination of trucks and labor crews to coordinate with the productivity improvement ofthe Pipe Manipulator. Also, under each Manipulator cycle time the sensiti:,ty analysis (TreeAlgonthrn method) is used to analyze the goals as mentioned in objective 1.
Table 1 Total Cycle Time of Pipe Manipulator
ANALYSISMETHOD Time Lapse
1. computer21. Plastic
1. computer2. Plastic
1. computer2. Plastic
Condition Time Lapse Time Lapse Nominal Optimal
Total Cycle Time 11 16 ( sec) 901 .5 832.5 702
Objective 3: Under a certain combination derived from objective 2, the model is simulatedbased on increasing or decreasing the percentage of the operation time of the critical work task."FIT PIPE" and "WELD PIPE" were analyzed by increasing or decreasing the activity durationtwenty percent each time. Calculating and comparing the slope of productivity on eachincreasing or decreasing phase, the modeler can tell the optimal phase (i.e., the phase with themaximum slope) of improving the duration of activity that may achieve the maximumproductivity increment.
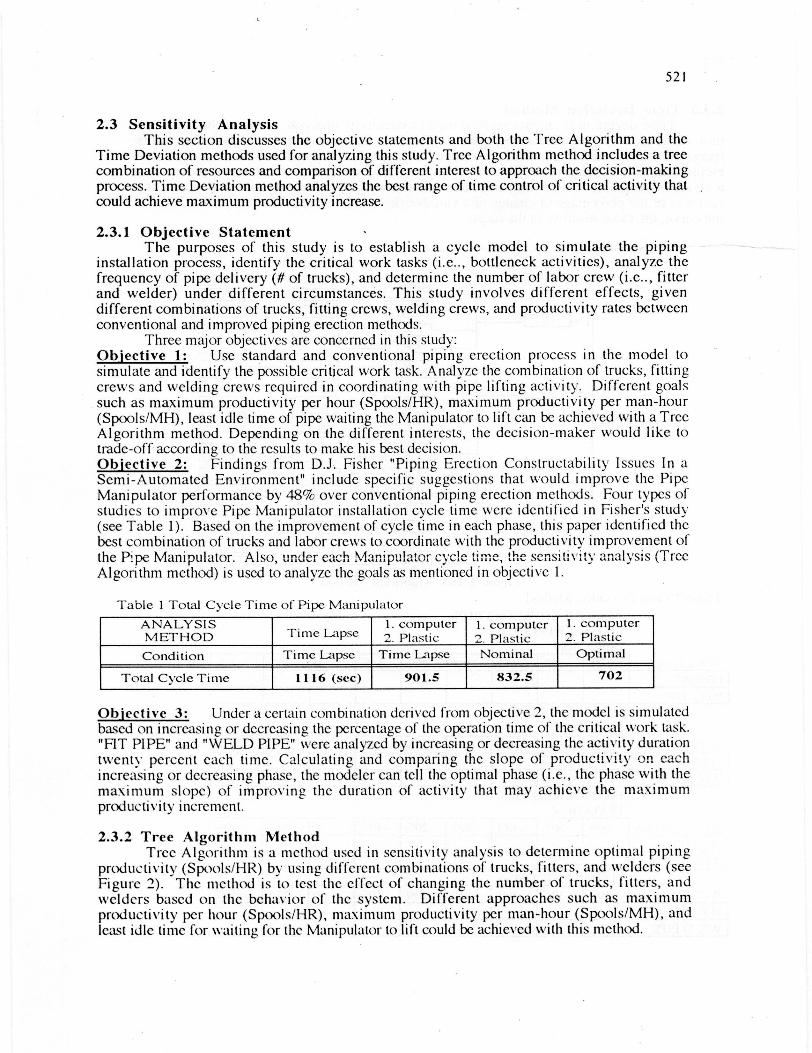
2.3.2 Tree Algorithm MethodTree Algorithm is a method used in sensitivity analysis to determine optimal piping
productivity (Spools/HR) by using different combinations of trucks, fitters, and welders (seeFigure 2). The method is to test the effect of changing the number of trucks, fitters, andwelders based on the behavior of the system. Different approaches such as maximumproductivity per hour (Spools/HR), maximum productivity per man-hour (Spools/MH), andleast idle time for waiting for the Manipulator to lift could be achieved with this method.
522
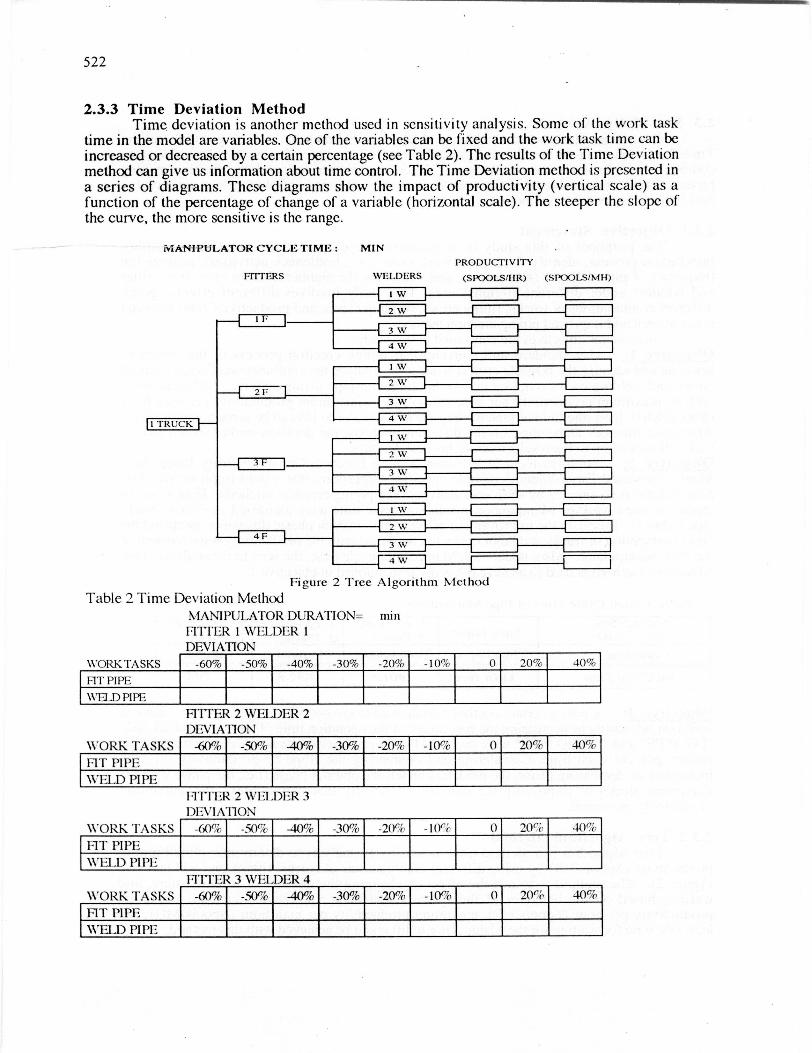
2.3.3 Time Deviation MethodTime, deviation is another method used in sensitivity analysis. Some of the work task
time in the model are variables. One of the variables can be fixed and the work task time can beincreased or decreased by a certain percentage (see Table 2). The results of the Time Deviationmethod can give us information about time control. The Time Deviation method is presented ina series of diagrams. These diagrams show the impact of productivity (vertical scale) as afunction of the percentage of change of a variable (horizontal scale). The steeper the slope ofthe curve, the more sensitive is the range.
MANIPULATOR CYCLE TIME: MIN
FITTERS \VELDERS
I F
2F
PRODUCTIVITY
(SPOOLS/HR) (SPOOLS/MH)
1W
2W
2 W
I TRUCK
3F
4F
2 \V
I AV
2 \V
3 W
l 4W r-
Figure 2 Tree Algorithm Method
Table 2 Time Deviation MethodMANIPULATOR DURATION= minFITTER 1 WELDER 1DEVIATION
\VORKTASKS -60% -50% -40% -30% -20% -1040 0 20% 40%
FIT PIPE I\VF7-D PIPE _+
FITTER 2 WELDER 2DEVIATION
\VORK TASKS -60% -50% -0% -30% -20% - 100 0 20% 40%
FIT PIPE,WELD PIPI;
ITI-ITR 2 \V1;I,DER 31)1;VIA'IiON
\VORK TASKS -60% -50% 40'/,, -30% - 20% -10'- (" 0 20^i -1(h
FIT PIPEWELD PIPI;
FI lT :R 3 \VEI I)l R 4
\VORK TASKS -60%, -50% -40% -30% -20% -10% 0 20ni' 411%
FIT PIPE.\V'I1.D PIPI;
523
3. DATA ANALYSIS AND RESULTS
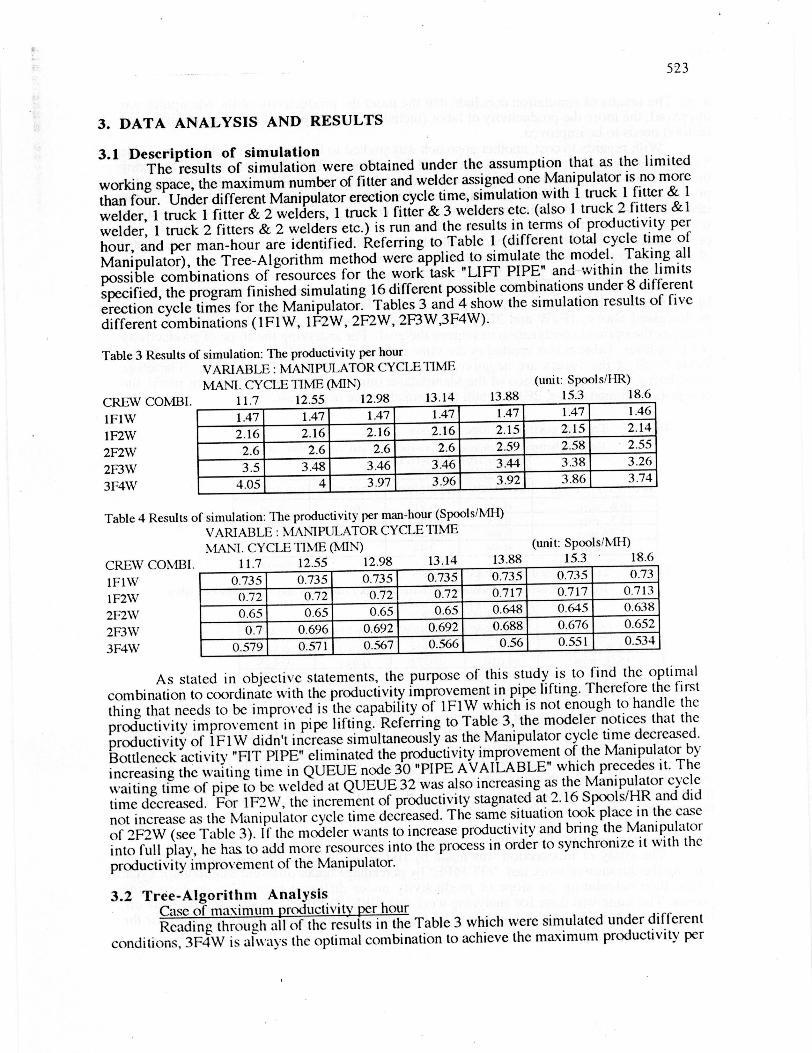
3.1 Description of simulationThe results of simulation were obtained under the assumption that as the limited
working space, the maximum number of fitter and welder assigned one Manipulator is no morethan four. Under different Manipulator erection cycle time, simulation with 1 truck 1 fitter & 1welder, 1 truck 1 fitter & 2 welders, 1 truck 1 fitter & 3 welders etc. (also 1 truck 2 fitters &1welder, 1 truck 2 fitters & 2 welders etc.) is run and the results in terms of productivity perhour, and per man-hour are identified. Referring to Table 1 (different total cycle time ofManipulator), the Tree-Algorithm method were applied to simulate the model. Taking allpossible combinations of resources for the work task "LIFT PIPE" and within the limitsspecified, the program finished simulating 16 different possible combinations under 8 differenterection cycle times for the Manipulator. Tables 3 and 4 show the simulation results of fivedifferent combinations (IFIW, 1F2W, 2F2W, 2F3W,3F4W).
Table 3 Results of simulation : The productivity per hourVARIABLE : MANIPULATOR CYCLE TIMEMANI. CYCLE TIME (MIN)
CREW COMBI.
1F1W
1172W2F2W2F3W
3F4W
14
(unit : Spools/I-IR)
13.88 15.3 18.6
1.47 1.47 1.47 1.47 1.47 1.47 1.46
2.16 2.16 2.16 2.16 2.15 2.15 2.14
2.6 2.6 2.6 2.6 2.59 2.58 2.55
3.5 3.48 3.46 3.46 3.44 3.38 3.26
4.05 4 3.97 3.96 3.92 3.86 3.74
Table 4 Results of simulation : The productivity per man-hour (Spools/M14)
VARIABLE : MANIPULATOR CYCLE TIMEMAN. CYCLE TIME (MIN)
CREW COMBI.
1F1W
1172W2F2W
2F3W3F4W
.14
(unit: Spools/MH)13.88 15.3 18.6
0.735 0.735 0.735 0.735 0.735 0.735 0.73
0.72 0.72 0.72 0.72 0.717 0.717 0.713
0.65 0.65 0.65 0.65 0.648 0.645 0.638
0.7 0.696 0.692 0.692 0.688 0.676 0.652
0.579 0.571 0.567 0.566 0.56 0.551 0.534
As stated in objective statements, the purpose of this study is to find the optimalcombination to coordinate with the productivity improvement in pipe lifting. Therefore the firstthing that needs to be improved is the capability of 1F1W which is not enough to handle theproductivity improvement in pipe lifting. Referring to Table 3, the modeler notices that theproductivity of 1F1W didn't increase simultaneously as the Manipulator cycle time decreased.Bottleneck activity "FIT PIPE" eliminated the productivity improvement of the Manipulator byincreasing the waiting time in QUEUE node 30 "PIPE AVAILABLE" which precedes it. Thewaiting time of pipe to be welded at QUEUE 32 was also increasing as the Manipulator cycletime decreased. For 1F2W, the increment of productivity stagnated at 2.16 Spools/HR and didnot increase as the Manipulator cycle time decreased. The same situation took place in the caseof 2F2W (see Table 3). If the modeler wants to increase productivity and bring the Manipulatorinto full play, he has to add more resources into the process in order to synchronize it with theproductivity improvement of the Manipulator.
3.2 Tree-Algorithm AnalysisCase of maximum productivity per hourReading through all of the results in the Table 3 which were simulated under different
conditions, 3F4W is always the optimal combination to achieve the maximum productivity per

524
hour. The results of simulation conclude that the more the productivity of the Manipulator isimproved, the more the productivity of labor (including the number of laborers and motivuIionfactors) needs to be improved.
With regards to cost, another approach was studied to find the best combination. Table5 shows the productivity slope analysis derived from Table 3. The table was obtained by fixingthe cycle time of the Manipulator (the vertical column) and calculating the slope of theproductivity between different combinations of working crews (the horizontal row). In thetable, the value of productivity increase in the third column is always the largest in comparisonwith the value in the other columns. Therefore the maximum increase in the rate ofproductivity can be obtained for additional labor from 2F2W to 2F3W. Considering the factorof profit and cost, 2F3W will become the optimal choice.
Case of maximum productivity per man-hourIn Table 4, the productivity of 1F1W is always the largest of all under different
Manipulator cycle times. But considering the synchronization of the Manipulator improvementas discussed above, 1F1W and 2F2W will be ignored because of the flat slope and 2F3Wbecomes the optimal combination to achieve the goal. For analyzing the slope of productivityper man-hour, Table 6 was created in the same manner in which Table 5 was created. In theTable 6, all of the values are negative except the values in the third column. Thereforeconsidering the synchronization of the Manipulator improvement and the factor of profit andcost just mentioned above, 2F3W is still the optimal choice in this case.
Table 5 Tree -Algorithm : slope analysisRelation between the increase of productivity and the number of labor
PRODUCTIVITY P1 R I I OU R:VA RIAT ION OF LA 130R
MANIP.CYC.TIME IFIW-1F2W 1F2W-2F2W 2F2W-2F3W 2F3W-3F4W
196 min 068 041 L71 0481 5 3 0.80 04813.88 min 0.68 0.44 0.85 0.4811.7 min 0.69 0.44 0.90 0.55
Table 6 Tree-Algorithm : slope analysis(writ s M d s FIR)
Relation be tween the increase of productivity per man-hour and the number of labor
PRODUCTIV I7Y PER MAN-HOU R:VARIATION0FIA130R
MA NIP.CYC.TIME 1FIW-1F2W 1F2V 2F2W 2F2W-2F3\V 213W-3F4\V
19 6 min -0017 -0075 nniA -oils15.3 min - 0.018 -0 .072 -0.1 2513.88 mi n -0. 018 -0.069 0040 -0. 128
11.7 nun -0.015 -0.070 Q050 -0. 1 21
(lllit: S1 ds'NIR)
Case of least idle time of pipe waiting manipulator to liftThe least the idle time of pipe waits Manipulator to lift, the more the percentage of the
Manipulator is busy. A comparison of the percentage of waiting time in QUEUE 27"CART/PIPE READY" is identified. When Manipulator cycle time equals 18.6 minutes, thebest combination for achieving the goal is 3F4W. As Manipulator cycle time equals 15.3minutes, the optimal combination switches to 2F3W. In the case of 13.88 and 11.7 minutes,the optimal combination changes back to 3F4W.
3.3 Time -Deviation AnalysisThe study of this section was made by fixing the duration of all tasks initially and
varying the duration of work task "FIT PIPE" by percentage under different Manipulator cycletimes, then calculating the slope of productivity under different increasing or decreasingphases. The same was done for analyzing work task "WELD PIPE". Consequently, there aretwo objectives to be identified in the study: (1) The maximum productivity increase for the
525
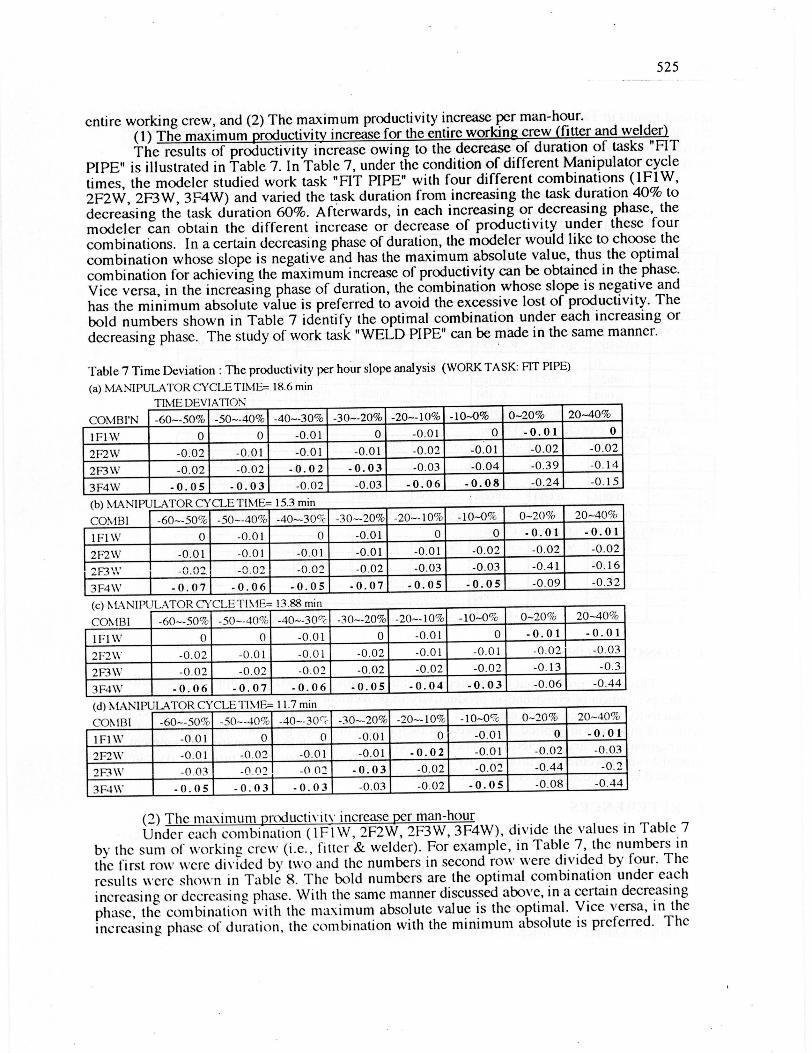
entire working crew, and (2) The maximum productivity increase per man-hour.(1) The maximum productivity increase for the entire working crew (fitter and welder)The results of productivity increase owing to the decrease of duration of tasks "FIT
PIPE" is illustrated in Table 7. In Table 7, under the condition of different Manipulator cycletimes, the modeler studied work task "FIT PIPE" with four different combinations (1F1W,2F2W, 2F3W, 3F4W) and varied the task duration from increasing the task duration 40% todecreasing the task duration 60%. Afterwards, in each increasing or decreasing phase, themodeler can obtain the different increase or decrease of productivity under these fourcombinations. In a certain decreasing phase of duration, the modeler would like to choose thecombination whose slope is negative and has the maximum absolute value, thus the optimalcombination for achieving the maximum increase of productivity can be obtained in the phase.Vice versa, in the increasing phase of duration, the combination whose slope is negative andhas the minimum absolute value is preferred to avoid the excessive lost of productivity. Thebold numbers shown in Table 7 identify the optimal combination under each increasing ordecreasing phase. The study of work task "WELD PIPE" can be made in the same manner.
Table 7 Time Deviation : The productivity per hour slope analysis (WORK TASK: FIT PIPE)
(a) MANIPULATOR CYCLE TIME- 18.6 min'rn,rr- FIE%rTA r'in.r
COMBI'N +60--50% -50---40% -40---30% -30--20% -20---10% -10-0% 0--20% 20--40%
1F1\V 0 0 -0.01 0 -0.01 0 -0.01 0
2F2\\' -0.02 -0.01 -0.01 -0.01 -0.02 -0.01 -0.02 -0.02
2F3\W -0.02 -0.02 - 0.0 2 - 0. 0 3 -0.03 -0.04 -0.39 -0.14
3F4\\ -0.05 -0.03 -0.02 -0.03 -0.06 -0.08 -0.24 -0.15
T/^n !'•\,'!^T C -rT % 4C-
CO\1BI -60---50% -50---40% -40---30rc -30---20% -20--10% -10---0% 0-20% 20--40%
IF1W 0 -0.01 0 -0.01 0 0 -0. 01 -0.01
2F2\\' -0.01 -0.01 -0.01 -0.01 -0.01 -0.02 -0.02 -0.02
2F3 0.02 0 0^ -0.0 2 -0.02 -0.03 -0.03 -0.41 -0.16
31`4\\' -0.07 - 0.06 -0 . 05 -0.07 - 0.05 -0 .05 -0.09 -0.32
UTD! TI ATnI (\' U I TRfr:- I'i
CO\1BI .60---50% -50--40% -40--30 (-c -30--20% -20---10% -10--0% 0-20% 20-40%
1F1\y 0 0 -0.01 0 -0. 01 0 -0.01 -0.01
2F2\V -0.02 -0.01 -0.01 -0.02 -0.01 -0.01 -0.02 -0.03
2F3\V -0.02 -0.02 -0.02 -0.02 -0.02 -0.02 -0.13E -0.3
3F4\V -0.06 -0.07 - 0.06 -0 . 05 -0.04 - 0.03 -0 .06 -0.44
nnT IT A TrnD r-Vr-T T. Tt\ fr-- 11 7 rn
COMBI -60--50`'0 -50--40% -40--30-, -30---20% -20---10% -10-0^c 0 20% 20 40%
1 F1 W -0.01 0 0 -0 .01 0 -0.01 0 - 0. 0 1
2F2\W -0.01 -0.02 -0.01 -0.01 -0. 02 -0.01 -0.02 -0.03
2F3\y _0.03 _0,02 -0 01 -0.03 -0.02 -0.02 -0.44 -0.2
3F4\\" -0.05 -0.03 - 0.03 -0 . 03 -0.02 -0 .05 -0.08 -0.441
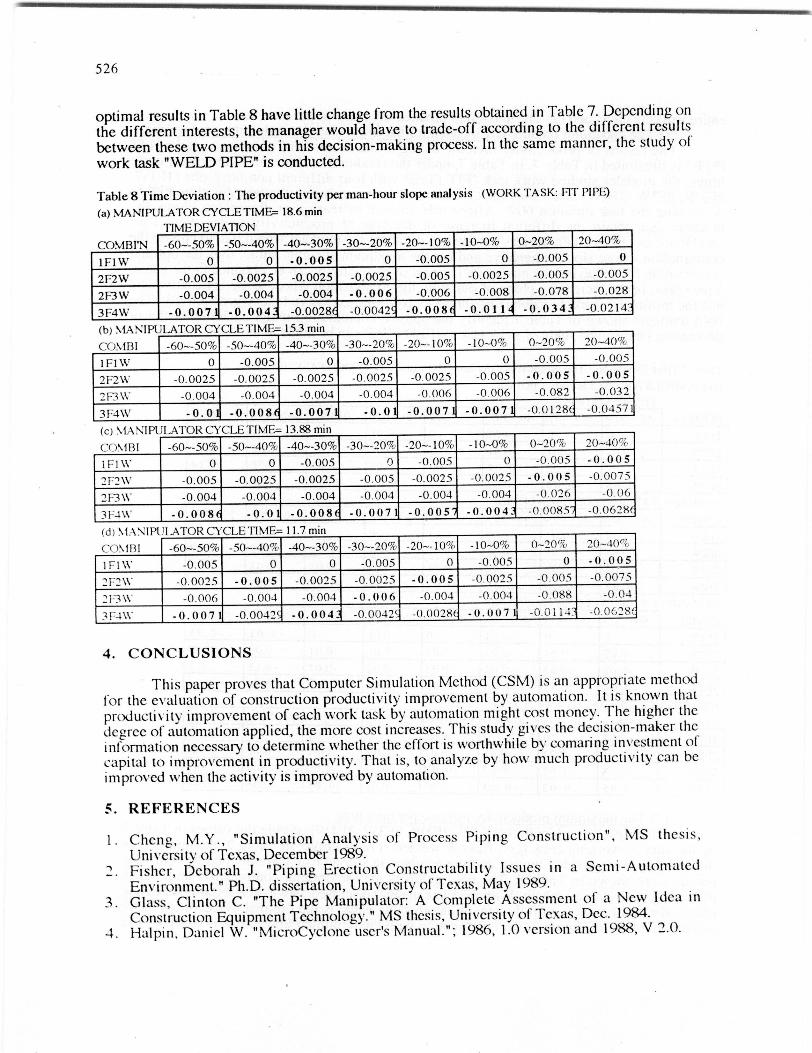
(2) The maximum Productivity increase per man-hourUnder each combination (IF1W, 2F2W, 2F3W, 3F4W), divide the values in Table 7
by the sum of working crew (i.e., fitter & welder). For example, in Table 7, the numbers inthe first row were divided by two and the numbers in second row were divided by four. Theresults were shown in Table 8. The bold numbers are the optimal combination under eachincreasing or decreasing phase. With the same manner discussed above, in a certain decreasingphase, the combination with the maximum absolute value is the optimal. Vice versa, in theincreasing phase of duration, the combination with the minimum absolute is preferred. The
526
optimal results in Table 8 have little change from the results obtained in Table 7. Depending on
the different interests , the manager would have to trade -off according to the different resultsbetween these two methods in his decision -making process . In the same manner , the study of
work task "WELD PIPE" is conducted.
Table 8 Time Deviation : The productivity per man -hour slope analysis (WORK TASK: FIT PIPIT)
(a) MANIPULATOR CYCLE TIME- 18.6 min
COM.BI'N -60--50% -50--40% -40--30% -30--20% -20--10% -10--0% 0--20% 2040%
1F1W 0 0 -0. 005 0 -0.005 0 -0.005 0
2F2W -0.005 -0.0025 -0.0025 -0.0025 -0.005 -0.0025 -0.005 -0.005
2F3W -0.004 -0.004 -0.004 -0. 006 -0 .006 -0.008 -0.078 -0.028
3F4W -0. 007 -0 . 004 -0 .0028 -0.0042 -0. 008 -0 . 011 -0.034 . -0.0214.
CO\IBI -60----50% -50--40% -40---30% -30---20% -20--10% -10--0% 0--20% 20--40%
1 F1 \V' 0 -0.005 0 -0.005 0 0 -0.005 -0.005
21`2W -0.0025 -0.0025 -0.0025 -0.0025 -0.0025 -0.00 S - 0. 0 0 5 - 0.0 0 5
2F3\V -0.004 -0.004 -0.004 -0.004 -0.006 -0.006 -0.082 -0.032
3F4\V - 0.0 -0.008 - 0.007 - 0.0 -0.007 - 0.007 -0.0128( -0.0457
WT r. TInAF-
COyIBI -60---50% -50---40% -40--30% -30---20% -20---10% -10-0% 0-20% 20--403c
1 1:1 W 0 0 -0.005 0 -0.005 0 -0.005 - 0.0 0 5
2F2\V" -0.005 -0.0025 -0.0025 -0.005 -0.0025 -0.0025 - 0.0 0 5 -0.0075
2F3\C -0.004 -0.004 -0.004 -0.004 -0.004 -0.004 -0.026 -0.06
3F4\V -0.008 - 0.0 -0.008 - 0.007 -0 . 005 -0.004 . -0.0085 -0.0628(
NIPU1 J\TOR CYCLE TIN
CON 1131 -60---50 % - 50--40% -40--30 % -30---20% -20---10% -10-0% 0--200 20-40`-
1 F1 \V' -0.005 0 0 -0.005 0 - 0.005 0 - 0.0 0 5
212\V - 0.0025 -0.005 -0.0025 - 0.0025 -0.005 -0.0025 -0.005 -0.0075
21=3 \V -0.006 -0. 004 -0.004 - 0 . 0 0 6 -0.004 - 0.004 -0.088 -0.04
3F_4%%_ - 0.0 0 7 - 0.0042' - 0.0 0 4 . - 0.0042( -0.0028( -0 .0 07 -0.01 14 _ -0.0628(
4. CONCLUSIONS
This paper proves that Computer Simulation Method (CSM) is an appropriate methodfor the evaluation of construction productivity improvement by automation. It is known thatproductivity improvement of each work task by automation might cost money. The higher thedegree of automation applied, the more cost increases. This study gives the decision-maker theinformation necessary to determine whether the effort is worthwhile by comanng investment ofcapital to improvement in productivity. That is, to analyze by how much productivity can beimproved when the activity is improved by automation.
5. REFERENCES
I . Cheng, M.Y., "Simulation Analysis of Process Piping Construction", MS thesis,University of Texas, December 1989.
2. Fisher, Deborah J. "Piping Erection Constructability Issues in a Scmi-AutomatedEnvironment." Ph.D. dissertation, University of Texas, May 1989.
3. Glass, Clinton C. "The Pipe Manipulator: A Complete Assessment of a New Idea inConstruction Equipment Technology." MS thesis, University of Texas, Dec. 1984.
4. Halpin, Daniel W. "MicroCyclone user's Manual."; 1986, 1.0 version and 1988, V 2.0.