5.14 TRANSPORTATION AND TRAFFIC - Downtown San Bernardino 072505/DEIR Ch 05_… · 5.14...
46
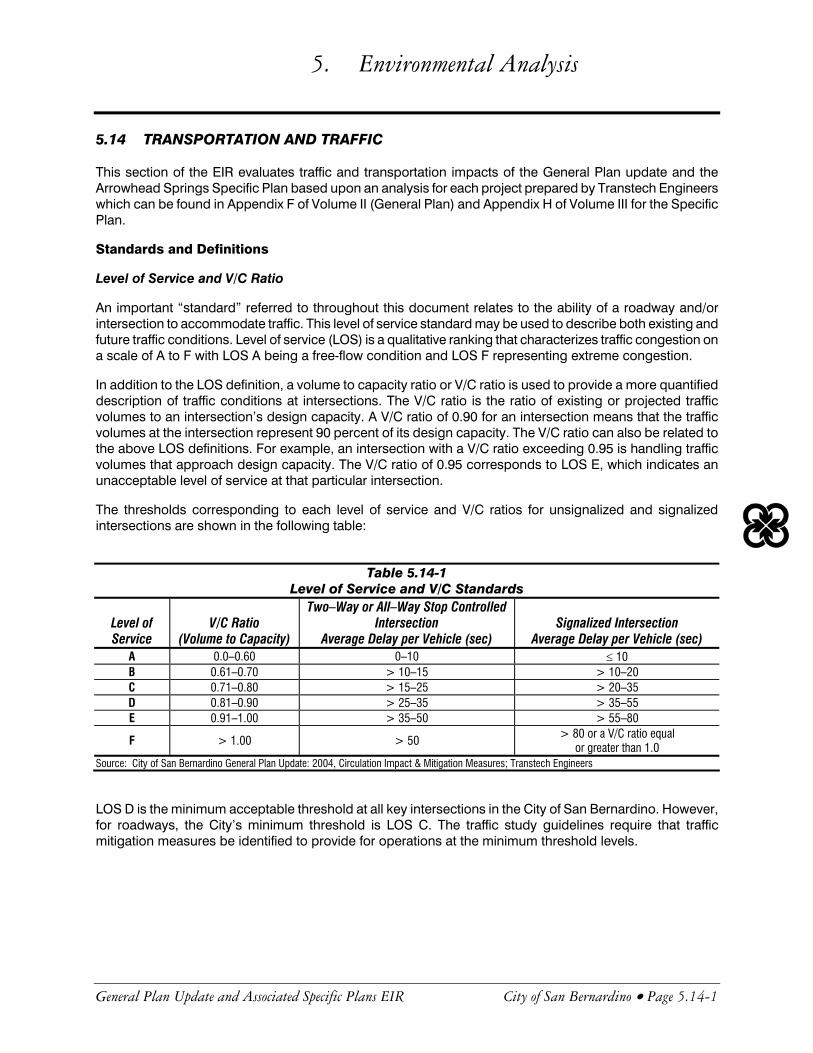
5. Environmental Analysis General Plan Update and Associated Specific Plans EIR City of San Bernardino • Page 5.14-1 5.14 TRANSPORTATION AND TRAFFIC This section of the EIR evaluates traffic and transportation impacts of the General Plan update and the Arrowhead Springs Specific Plan based upon an analysis for each project prepared by Transtech Engineers which can be found in Appendix F of Volume II (General Plan) and Appendix H of Volume III for the Specific Plan. Standards and Definitions Level of Service and V/C Ratio An important “standard” referred to throughout this document relates to the ability of a roadway and/or intersection to accommodate traffic. This level of service standard may be used to describe both existing and future traffic conditions. Level of service (LOS) is a qualitative ranking that characterizes traffic congestion on a scale of A to F with LOS A being a free-flow condition and LOS F representing extreme congestion. In addition to the LOS definition, a volume to capacity ratio or V/C ratio is used to provide a more quantified description of traffic conditions at intersections. The V/C ratio is the ratio of existing or projected traffic volumes to an intersection’s design capacity. A V/C ratio of 0.90 for an intersection means that the traffic volumes at the intersection represent 90 percent of its design capacity. The V/C ratio can also be related to the above LOS definitions. For example, an intersection with a V/C ratio exceeding 0.95 is handling traffic volumes that approach design capacity. The V/C ratio of 0.95 corresponds to LOS E, which indicates an unacceptable level of service at that particular intersection. The thresholds corresponding to each level of service and V/C ratios for unsignalized and signalized intersections are shown in the following table: Table 5.14-1 Level of Service and V/C Standards Level of Service V/C Ratio (Volume to Capacity) Two–Way or All–Way Stop Controlled Intersection Average Delay per Vehicle (sec) Signalized Intersection Average Delay per Vehicle (sec) A 0.0–0.60 0–10 ≤ 10 B 0.61–0.70 > 10–15 > 10–20 C 0.71–0.80 > 15–25 > 20–35 D 0.81–0.90 > 25–35 > 35–55 E 0.91–1.00 > 35–50 > 55–80 F > 1.00 > 50 > 80 or a V/C ratio equal or greater than 1.0 Source: City of San Bernardino General Plan Update: 2004, Circulation Impact & Mitigation Measures; Transtech Engineers LOS D is the minimum acceptable threshold at all key intersections in the City of San Bernardino. However, for roadways, the City’s minimum threshold is LOS C. The traffic study guidelines require that traffic mitigation measures be identified to provide for operations at the minimum threshold levels.
Transcript of 5.14 TRANSPORTATION AND TRAFFIC - Downtown San Bernardino 072505/DEIR Ch 05_… · 5.14...
5. Environmental Analysis
General Plan Update and Associated Specific Plans EIR City of San Bernardino • Page 5.14-1
5.14 TRANSPORTATION AND TRAFFIC
This section of the EIR evaluates traffic and transportation impacts of the General Plan update and the Arrowhead Springs Specific Plan based upon an analysis for each project prepared by Transtech Engineers which can be found in Appendix F of Volume II (General Plan) and Appendix H of Volume III for the Specific Plan.
Standards and Definitions
Level of Service and V/C Ratio
An important “standard” referred to throughout this document relates to the ability of a roadway and/or intersection to accommodate traffic. This level of service standard may be used to describe both existing and future traffic conditions. Level of service (LOS) is a qualitative ranking that characterizes traffic congestion on a scale of A to F with LOS A being a free-flow condition and LOS F representing extreme congestion.
In addition to the LOS definition, a volume to capacity ratio or V/C ratio is used to provide a more quantified description of traffic conditions at intersections. The V/C ratio is the ratio of existing or projected traffic volumes to an intersection’s design capacity. A V/C ratio of 0.90 for an intersection means that the traffic volumes at the intersection represent 90 percent of its design capacity. The V/C ratio can also be related to the above LOS definitions. For example, an intersection with a V/C ratio exceeding 0.95 is handling traffic volumes that approach design capacity. The V/C ratio of 0.95 corresponds to LOS E, which indicates an unacceptable level of service at that particular intersection.
The thresholds corresponding to each level of service and V/C ratios for unsignalized and signalized intersections are shown in the following table:
Table 5.14-1
Level of Service and V/C Standards
Level of Service
V/C Ratio (Volume to Capacity)
Two–Way or All–Way Stop Controlled Intersection
Average Delay per Vehicle (sec) Signalized Intersection
Average Delay per Vehicle (sec) A 0.0–0.60 0–10 ≤ 10 B 0.61–0.70 > 10–15 > 10–20 C 0.71–0.80 > 15–25 > 20–35 D 0.81–0.90 > 25–35 > 35–55 E 0.91–1.00 > 35–50 > 55–80
F > 1.00 > 50 > 80 or a V/C ratio equal or greater than 1.0
Source: City of San Bernardino General Plan Update: 2004, Circulation Impact & Mitigation Measures; Transtech Engineers
LOS D is the minimum acceptable threshold at all key intersections in the City of San Bernardino. However, for roadways, the City’s minimum threshold is LOS C. The traffic study guidelines require that traffic mitigation measures be identified to provide for operations at the minimum threshold levels.

5. Environmental Analysis
Page 5.14-2 • The Planning Center June 2005
Roadway Capacity Standards and Passenger Car Equivalents
The following is a list of roadway capacity standards for various types of facilities, used in the roadway capacity analysis for the General Plan:
• 4-lane Major Arterial: 40,000 vehicles per day • 2-lane Major Arterial: 15,000 vehicles per day • 4-lane Secondary Arterial: 30,000 vehicles per day • 2-lane Secondary Arterial: 12,000 vehicles per day • 4-lane Collector Street: 25,000 vehicles per day • 2-lane Collector Street: 10,000 vehicles per day
Also, in determining passenger car equivalent (PCE) factors for various trucks, the following factors were used:
• 2-axle Trucks: Equivalent to 2.0 passenger cars • 3-axle Trucks: Equivalent to 2.5 passenger cars • 4- or more axle Trucks: Equivalent to 3.0 passenger cars
San Bernardino County Congestion Management Program (CMP)
Proposition 111, passed in June 1990, provided additional transportation funding through a $.09 per gallon increase in the state gas tax. This equates to an estimated annual return of more than $6.25 per person for cities within San Bernardino County, and $7.1 million for the County. Included with the provision for additional transportation funding was a requirement to undertake a Congestion Management Program within each county with an urbanized area of more than 50,000 population, to be developed and adopted by a designated Congestion Management Agency (CMA). Within San Bernardino County, SANBAG was designated the CMA by the County Board of Supervisors and a majority of the cities representing a majority of the incorporated population. CMP Roadways and Intersections in the City are identified throughout this analysis with the “CMP” identifier.
5.14.1 Environmental Setting
5.14.1.1 San Bernardino General Plan
Roadways
The City of San Bernardino has a circulation system consisting of major and secondary arterial roadways, collector roadways, and local streets.
Major Arterials accommodate six or eight travel lanes and may have raised medians. These facilities carry high traffic volumes and are the primary thoroughfares linking San Bernardino with adjacent cities and the regional highway system. Driveway access to these roadways is typically limited to provide efficient high volume traffic flow. Major Arterials include Waterman Avenue, Mount Vernon Avenue, Highland Avenue, and Baseline Street.
Secondary Arterials are typically four-lane streets, providing two lanes in each direction. These highways carry traffic along the perimeters of major developments, provide support to the major arterials, and are also through streets enabling traffic to travel uninterrupted for longer distances through the City. Secondary Arterials Include Little Mountain Drive, 9th Street, Arrowhead Avenue (North of 5th Street), and Sierra Way.

5. Environmental Analysis
General Plan Update and Associated Specific Plans EIR City of San Bernardino • Page 5.14-3
Collector Streets are typically two-lane streets that connect the local streets with the secondary arterials allowing local traffic to access the regional transportation facilities. Collector Streets include California Street, 6th Street, Arrowhead Avenue (north of 30th Street) and Meridian Avenue.
Local Streets are typically two-lane streets that are designed to serve neighborhoods within residential areas. There are several variations on local streets depending on location, length of the street, and type of land use.
Freeways and Highways
Freeways/Highways are controlled-access, separated roadways that provide for high volumes of vehicular traffic at high speeds. There are three freeways within the City of San Bernardino and one State highway:
The San Bernardino Freeway (I-10) is the major east-west freeway providing access west to Los Angeles and east to the desert communities and beyond.
Interstate 215 provides north-south freeway access to Riverside and San Diego counties to the south and the high desert communities to the north.
Interstate 210 provides local east-west service between I-215 and State Route 330 (SR-330). As of 2005, this freeway was under construction and was also known as State Route 30 (SR-30) and will become the future I-210 when completed.
State Route 18 (SR-18) provides a connection from I-210 to the mountain resorts/communities of Lake Gregory.
Rail
San Bernardino includes both major (main line) and minor (spurs) railroads that accommodate both freight and passenger rail services. Both Amtrak and Metrolink provide long-distance passenger train service from the Historic Depot in San Bernardino.
Amtrak trains operate west to Los Angeles; southeast to Palm Springs on to Florida; and northeast to Needles on to Illinois.
Commuter Rail service is provided by the Southern California Regional Rail Authority (SCRRA), which operates the Metrolink train service. The City of San Bernardino is served by the San Bernardino Line, which is Metrolink's busiest line, with a station located at the historic Santa Fe Depot. The San Bernardino Line connects rapidly growing San Bernardino County with the communities of the San Gabriel Valley and downtown Los Angeles. The San Bernardino Line is currently the only line with service seven days a week. On weekdays, there are 15 round trips per day on the San Bernardino Line with about half of them during commute hours, but with close to hourly service in the mid-day.
Transit
Bus Service
Public transportation in the San Bernardino area is provided by Omnitrans, the regional Public Transit operator for San Bernardino County. Omnitrans operates 21 local-fixed routes, 14 of which serve the San Bernardino Planning Area. General service hours are between 6:00 a.m. and 8:00 p.m., Monday through Saturday.
The Southern California Rapid Transit District provides express bus service between San Bernardino-Riverside and Los Angeles (Line 496) under contract with Omnitrans and the Riverside Transit Agency. Service is provided Sunday through Saturday.

5. Environmental Analysis
Page 5.14-4 • The Planning Center June 2005
Intercity bus service is provided to downtown San Bernardino by Greyhound and Continental Trailways that recently merged. The Greyhound bus depot is at 6th and G Streets.
Omnitrans periodically updates its service plan through the preparation of a Short Range Transit Plan (SRTP), which evaluates service for a five-year period. A SRTP for the years 2004-2009 has recently been adopted and includes some changes in routes within San Bernardino. A current route, schedule, and rate map can be obtained from Omnitrans.
Demand/Response System
Omnitrans provides San Bernardino residents that qualify for service under the Americans with Disabilities Act with a demand/response transportation system known as "Access." A resident may call and request a pick-up and delivery to a requested destination on a space-available basis with a reservation made 24 hours in advance.
Existing Traffic Conditions
This section summarizes the existing circulation conditions in the City of San Bernardino. Eighty intersections, 23 roadway segments and 12 freeway segments were included in the study area for analysis. The analysis is based on the existing amount of traffic volume on various street corridors and the capacity of the streets and intersections to carry traffic. The capacity measures the ability of the street system to meet and serve the demands from traffic. The capacity of a roadway is affected by a number of factors, e.g., the street width, the number of travel lanes, the number of crossing streets, the type of traffic control devices, the presence of on-street parking, the number of access driveways, the streets horizontal and vertical alignments, etc.
For the study area intersections, the TRAFFIX computer software, Version 7.6 has been utilized to determine intersection levels of service. Levels of service are presented for the entire intersection, consistent with the Highway Capacity Manual’s Operation Delay (HCM) methodology. While the level of service concepts and analysis methodology provide an indication of the performance of the entire intersection, the single letter grade A through F cannot describe specific operational deficiencies at intersections. Progression, queue formation, and left-turn storage are examples of the operational issues that affect the performance of an intersection, but do not factor into the strict calculation of level of service. However, the TRAFFIX software does provide an output that quantifies operational features at intersections, such as vehicle clearance, queue formation, and left-turn storage requirements.
Existing LOS and V/C Ratios
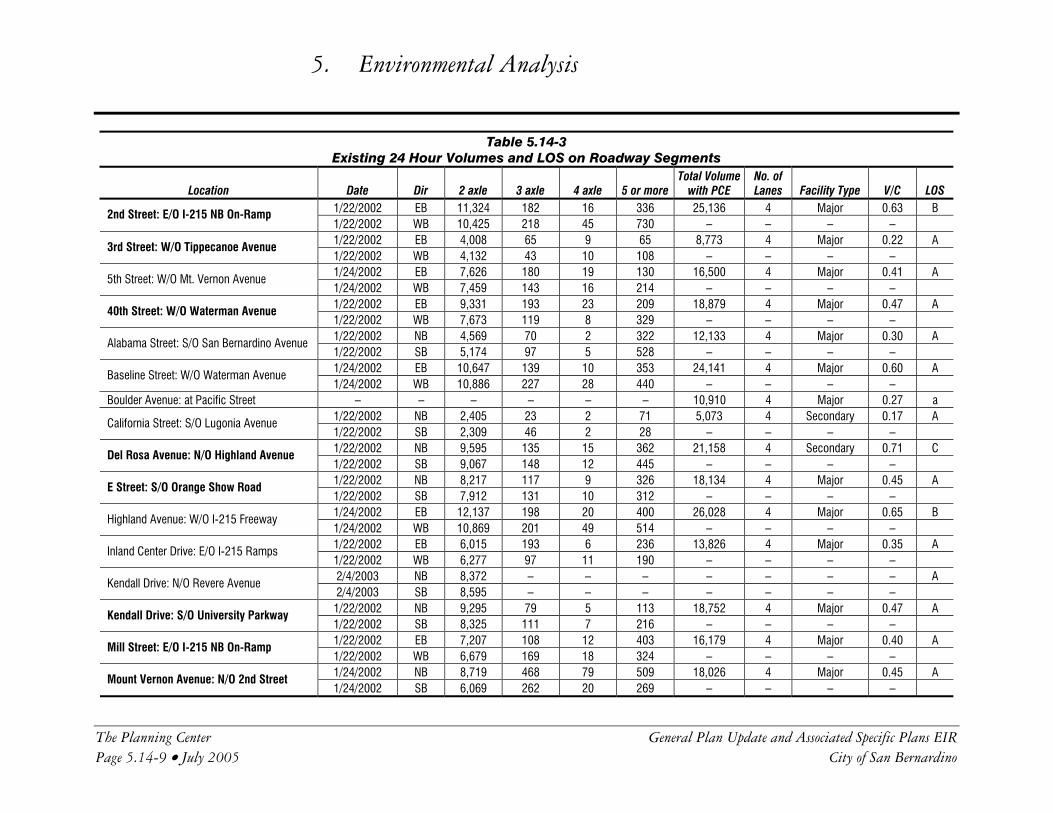
Existing traffic counts were conducted at various roadway segments and major intersections in 2003 to determine existing V/C and LOS at these facilities. The LOS of roadway segments is based on average daily traffic (ADT) volumes and their traffic handling capacities on a daily basis. The LOS of intersections is based on traffic volumes at the intersections during the AM and PM peak hours and the traffic handling capacity of the intersection’s critical lane. Truck trips have been converted to passenger car equivalents (PCE) for consistency of analysis. The results are shown in Table 5.14-2 for intersections and Table 5.14.3 for local roadway segments. CMP intersections and local roadway segments are noted in bold typeface. Intersection peak hour volumes and LOS calculation sheets are shown in Appendix F of Volume II. Most 24-hour volumes were based on existing vehicle classification counts conducted for this study and converted into passenger equivalents (pce) using appropriate factors for various types of trucks. Some volumes were obtained from various sources in pce.
Existing (1999) traffic volume, V/C ratio and LOS for various freeway segments is shown in Table 5.14-4. This information was obtained from the 2003 San Bernardino County CMP Update.

5. Environmental Analysis
General Plan Update and Associated Specific Plans EIR City of San Bernardino • Page 5.14-5
Table 5.14-2
Intersection Level of Service Summary Existing (2003) Conditions
Intersection Peak Hour LOS Delay
sec/veh V/C Ratio
AM B 11.3 – 30th Street @ Lynwood Drive PM A 7.2 – AM D 39.1 0.687 Arden Avenue @ Highland Avenue PM C 34.2 0.633 AM B 16.5 0.339 Arden Avenue @ SR–30 EB Ramps PM B 14.2 0.345 AM A 0 – Arden Avenue @ SR–30 WB Ramps PM A 0 – AM B 14.7 0.724 Arrowhead Avenue @ Baseline Street PM D 38.3 1.043 AM B 10.1 0.354 Belmont Avenue @ Palm Avenue PM A 8.5 0.232 AM C 33.8 0.245 Boulder Avenue @ Highland Avenue PM C 34.6 0.490 AM C 21.4 0.395 Del Rosa Avenue @ Baseline Street PM C 24.7 0.396 AM B 20 0.380 Del Rosa Avenue @ Date Street PM C 23 0.527 AM B 11.2 – Del Rosa Avenue @ Foothill Drive PM B 11.5 – AM B 14.8 0.270 Del Rosa Avenue @ Lynwood Drive PM B 13.9 0.339 AM C 24.4 0.579 Del Rosa Avenue @ SR–30 EB Ramp PM C 29 0.810 AM C 22.8 0.795 Del Rosa Avenue @ SR–30 WB Ramp PM C 27.4 0.855 AM C 27.5 0.398 Del Rosa Avenue @ Third Street PM C 31.1 0.469 AM C 24.3 0.505 E Street @ 2nd Street PM C 34.2 0.576 AM B 14.8 0.476 E Street @ 30th Street PM B 12.6 0.562 AM B 18 0.407 E Street @ Baseline Street PM B 19.4 0.566 AM B 18.6 0.765 E Street @ Highland Avenue PM C 21.7 0.400 AM C 27.2 0.423
E Street @ Orange Show Road PM D 37.5 0.631 AM B 12.1 – Harrison Street @ 40th Street PM B 13.3 – AM C 27 0.536 Hospitality Lane @ Carnegie Drive PM D 41.1 0.906 AM F OVL – Hunts Lane @ E Street PM F OVL –
I Street @ 2nd Street AM B 14.1 0.189

5. Environmental Analysis
Page 5.14-6 • The Planning Center June 2005
Table 5.14-2 Intersection Level of Service Summary
Existing (2003) Conditions
Intersection Peak Hour LOS Delay
sec/veh V/C Ratio PM B 13.6 0.221 AM A 9.8 – K Street @ 3rd Street PM A 9.3 – AM C 21.7 0.169 Kendall Drive @ 40th Street PM C 25.9 0.436 AM C 26.2 0.572 Kendall Drive @ Palm Avenue PM C 23.9 0.480 AM C 32.2 0.490 Kendall Drive @ University Parkway PM C 28.6 0.595 AM B 18.1 0.178 Lena Road @ Mill Street PM B 18 0.206 AM B 17.2 0.598 Leroy/SR–30 WB On-Ramp @ 30th Street PM B 17.4 0.401 AM E 36.3 – Meridian Avenue @ Rialto Avenue PM F 75.1 – AM C 20.1 0.458 Mt. Vernon Avenue @ Baseline PM C 23.3 0.532 AM B 19.8 0.454 Mt. Vernon Avenue @ 2nd Street PM C 30 0.643 AM C 22.5 0.405 Mt.. Vernon Avenue @ 5th Street PM C 22.5 0.489 AM C 27.8 0.617 Mt. Vernon Avenue @ Highland Avenue PM C 27.5 0.679 AM C 30.4 0.520 Mt. Vernon Avenue @ Mill Street PM C 31.7 0.677 AM B 14.5 0.292 Mt. Vernon Avenue @ Rialto Avenue PM B 14 0.384 AM B 12.9 0.535 Mountain View Avenue @ San Bernardino PM F 90.2 1.36 AM A 9 –
Northpark Boulevard @ Fairview Drive PM A 9.6 – AM B 10.4 – Northpark Boulevard @ Sierra Way PM C 16.1 – AM C 21.4 0.284 Northpark Boulevard @ University Parkway PM D 39.6 0.689 AM A 9.9 Ohio Avenue @ Palm Avenue PM A 9.6 – AM D 35.8 0.288 Palm Avenue @ Highland Avenue PM C 32.4 0.520 AM C 33.1 0.465 Pepper Avenue @ Mill Street PM C 30.4 0.450 AM B 14.6 0.366 Pepper Avenue @ Rialto Avenue PM B 16.4 0.496 AM C 31.2 0.746 Pepper Avenue @ Valley Boulevard PM C 31.7 0.755

5. Environmental Analysis
General Plan Update and Associated Specific Plans EIR City of San Bernardino • Page 5.14-7
Table 5.14-2 Intersection Level of Service Summary
Existing (2003) Conditions
Intersection Peak Hour LOS Delay
sec/veh V/C Ratio AM F 119.6 – Rancho Avenue @ 5th Street/Foothill PM F OVL – AM B 15 0.255 Sierra Way @ 30th Street PM B 15 0.361 AM B 19 0.270 Sierra Way @ 40th Street PM C 21.3 0.432 AM D 35.8 0.288 SR-30 EB Ramps @ Highland Avenue PM B 18.5 0.464 AM F 298.3 – SR-30 WB Off-Ramp @ 30th Street PM F 946.1 – AM B 15.7 0.385 SR-30 WB Ramps @ Highland Avenue PM B 14.2 0.469 AM B 15.4 0.480 State Street @ Baseline Street PM A 5.5 0.335 AM A 8.7 0.499 State Street @ Highland Avenue PM A 9.3 0.594 AM A 7.8 0.156 Sterling Avenue @ Foothill Drive PM A 7.9 0.131 AM C 29.6 0.328 Sterling Avenue @ Highland Avenue PM A 7.9 0.131 AM B 12.5 0.463 Sterling Avenue @ Lynwood Drive PM B 12.6 0.437 AM C 26.5 0.464
Tippecanoe Avenue @ 3rd Street PM C 32.5 0.698 AM C 22.7 0.482 Tippecanoe Avenue @ Harry Shepard PM C 20.2 0.828 AM B 12.2 – Tippecanoe Avenue @ Hospitality Lane PM C 25.3 0.621 AM B 13.4 0.454 Tippecanoe Avenue @ Mill Street PM C 22.2 0.790 AM D 25.6 – Tippecanoe Avenue @ Rialto Avenue PM F 102.6 – AM C 33.1 0.421 Tippecanoe Avenue @ San Bernardino PM D 42.1 0.828 AM B 14.7 0.233 Valencia Avenue @ 30th Street PM B 14.8 0.257 AM A 9.9 0.305 Valencia Avenue @ 40th Street PM B 11.5 0.412 AM D 36.1 0.602 Victoria Avenue @ Highland Avenue PM D 39.9 0.683 AM C 27.1 0.801 Waterman Avenue @ 30th Street PM C 23.4 0.654 AM D 26.2 – Waterman Avenue @ 34th Street PM D 29.9 – AM E 37.9 – Waterman Avenue @ 36th Street PM C 23.8 –

5. Environmental Analysis
Page 5.14-8 • The Planning Center June 2005
Table 5.14-2 Intersection Level of Service Summary
Existing (2003) Conditions
Intersection Peak Hour LOS Delay
sec/veh V/C Ratio AM C 26.1 0.637 Waterman Avenue @ 40th Street PM C 24.8 0.506 AM C 25.7 0.663 Waterman Avenue @ Barton Road PM D 40.3 0.944 AM E 63 1.081 Waterman Avenue @ 5th Street PM F 256.2 1.593 AM D 36.4 0.482 Waterman Avenue @ Highland Avenue PM D 39.2 0.650 AM C 30.5 0.715 Waterman Avenue @ Hospitality Lane PM D 46.8 0.984 AM A 3.2 0.507 Waterman Avenue @ Marshall Boulevard PM A 4.0 0.451 AM C 29.8 0.354
Waterman Avenue @ Mill Street PM D 35.2 0.540 AM C 38 0.425 Waterman Avenue @ Orange Show Road PM D 35.7 0.652 AM B 10.4 0.592 Waterman Avenue @ Parkdale Avenue PM B 11.1 0.501 AM C 32.3 0.852 Waterman Avenue @ SR-30 EB Ramp PM F 90.4 1.171 AM B 19.6 0.358 Waterman Avenue @ Vanderbilt Way PM C 23.3 0.584
As shown in Table 5.14-2, the following intersections are currently operating at an unacceptable LOS, i.e., the LOS at these intersections is worse than LOS D (LOS E or F):
• Hunts Lane @ E Street • Meridian Avenue @ Rialto Avenue • Mountain View Avenue @ San Bernardino Avenue • Rancho Avenue @ 5th Street/Foothill Boulevard • SR-30 WB Off-Ramp @ 30th Street • Tippecanoe Avenue @ Rialto Avenue • Waterman Avenue @ 36th Street • Waterman Avenue @ 5th Street (CMP intersection) • Waterman Avenue @ SR-30 EB Ramp (CMP intersection)
5. Environmental Analysis
The Planning Center General Plan Update and Associated Specific Plans EIR Page 5.14-9 • July 2005 City of San Bernardino
Table 5.14-3 Existing 24 Hour Volumes and LOS on Roadway Segments
Location Date Dir 2 axle 3 axle 4 axle 5 or more Total Volume
with PCE No. of Lanes Facility Type V/C LOS
1/22/2002 EB 11,324 182 16 336 25,136 4 Major 0.63 B 2nd Street: E/O I-215 NB On-Ramp 1/22/2002 WB 10,425 218 45 730 – – – – 1/22/2002 EB 4,008 65 9 65 8,773 4 Major 0.22 A 3rd Street: W/O Tippecanoe Avenue 1/22/2002 WB 4,132 43 10 108 – – – – 1/24/2002 EB 7,626 180 19 130 16,500 4 Major 0.41 A 5th Street: W/O Mt. Vernon Avenue 1/24/2002 WB 7,459 143 16 214 – – – – 1/22/2002 EB 9,331 193 23 209 18,879 4 Major 0.47 A 40th Street: W/O Waterman Avenue 1/22/2002 WB 7,673 119 8 329 – – – – 1/22/2002 NB 4,569 70 2 322 12,133 4 Major 0.30 A Alabama Street: S/O San Bernardino Avenue 1/22/2002 SB 5,174 97 5 528 – – – – 1/24/2002 EB 10,647 139 10 353 24,141 4 Major 0.60 A Baseline Street: W/O Waterman Avenue 1/24/2002 WB 10,886 227 28 440 – – – –
Boulder Avenue: at Pacific Street – – – – – – 10,910 4 Major 0.27 a 1/22/2002 NB 2,405 23 2 71 5,073 4 Secondary 0.17 A California Street: S/O Lugonia Avenue 1/22/2002 SB 2,309 46 2 28 – – – – 1/22/2002 NB 9,595 135 15 362 21,158 4 Secondary 0.71 C Del Rosa Avenue: N/O Highland Avenue 1/22/2002 SB 9,067 148 12 445 – – – – 1/22/2002 NB 8,217 117 9 326 18,134 4 Major 0.45 A E Street: S/O Orange Show Road 1/22/2002 SB 7,912 131 10 312 – – – – 1/24/2002 EB 12,137 198 20 400 26,028 4 Major 0.65 B Highland Avenue: W/O I-215 Freeway 1/24/2002 WB 10,869 201 49 514 – – – – 1/22/2002 EB 6,015 193 6 236 13,826 4 Major 0.35 A Inland Center Drive: E/O I-215 Ramps 1/22/2002 WB 6,277 97 11 190 – – – – 2/4/2003 NB 8,372 – – – – – – – A Kendall Drive: N/O Revere Avenue 2/4/2003 SB 8,595 – – – – – – – 1/22/2002 NB 9,295 79 5 113 18,752 4 Major 0.47 A Kendall Drive: S/O University Parkway 1/22/2002 SB 8,325 111 7 216 – – – – 1/22/2002 EB 7,207 108 12 403 16,179 4 Major 0.40 A Mill Street: E/O I-215 NB On-Ramp 1/22/2002 WB 6,679 169 18 324 – – – – 1/24/2002 NB 8,719 468 79 509 18,026 4 Major 0.45 A Mount Vernon Avenue: N/O 2nd Street 1/24/2002 SB 6,069 262 20 269 – – – –

5. Environmental Analysis
The Planning Center General Plan and Associated Specific Plans EIR Page 5.14-10 • July 2005 City of San Bernardino
Table 5.14-3 Existing 24 Hour Volumes and LOS on Roadway Segments
Location Date Dir 2 axle 3 axle 4 axle 5 or more Total Volume
with PCE No. of Lanes Facility Type V/C LOS
1/22/2002 NB 4,369 47 0 74 8,313 4 Major 0.21 A Mountain View Avenue: S/O Lugonia Avenue 1/22/2002 SB 3,447 65 2 56 – – – – 2/4/2003 NB 4,221 – – – 8,327 4 Major 0.21 A Northpark Boulevard: N/O University Parkway 2/4/2003 SB 4,106 – – – – – – –
Palm Avenue: N/O Pacific Street – – – – – – 9,940 4 Major 0.25 A Pepper Avenue: S/O Foothill Boulevard – – – – – – 13,600 4 Major 0.34 A
1/24/2002 NB 5,096 42 3 71 10,566 4 Major 0.26 A Rancho Avenue: S/O Mill Street 1/24/2002 SB 4,829 39 4 131 – – – – 1/22/2002 EB 4,151 135 18 238 14,554 4 Major 0.36 A Redlands Blvd.: E/O I-10 Freeway Ramp 1/22/2002 WB 8,071 246 12 442 – – – – 1/22/2002 EB 4,864 65 5 227 11,200 4 Major 0.28 A San Bernardino Avenue: E/O Tippecanoe 1/22/2002 WB 5,104 75 1 177 – – – – 2/4/2003 EB 13,761 – – – 28,400 4 Major 0.71 C University Parkway: W/O Northpark
Boulevard. 2/4/2003 WB 14,639 – – – – – – – 1/22/2002 NB 14,949 351 38 535 33,387 4 Major 0.83 D Tippecanoe Avenue: S/O Hospitality Lane 1/22/2002 SB 13,450 523 48 867 – – – – 1/22/2002 NB 8,792 355 80 310 22,144 4 Major 0.55 A Waterman Avenue: N/O I-10 Freeway 1/22/2002 SB 10,006 200 48 593 – – – –
Only the following roadway segments shows an unacceptable LOS (i.e., LOS D or worse) based on capacity analysis of 24-hour volumes:
• Tippecanoe Avenue South of Hospitality Lane
The CMP standard for acceptable LOS at intersections and roadway segments is LOS E or better. No local roadway segment falls into this category. The City uses a higher Standard of LOS D as a minimum acceptable service level for intersections and LOS C for roadway segments.

5. Environmental Analysis
General Plan Update and Associated Specific Plans EIR City of San Bernardino • Page 5.14-11
Table 5.14-4
Existing (1999) Freeway Segments Volume/Capacity and LOS Freeway Segment Existing Conditions
Freeway From To Peak Hour Dir. Capacity Volume V/C LOS
EB 11,000 7,753 0.705 C AM WB 11,000 10,482 0.953 E EB 11,000 10,482 0.953 E
I-10 Jct. I-215 Waterman Avenue PM
WB 11,000 7,753 0.705 C EB 8,800 6,347 0.721 C
AM WB 8,800 8,600 0.977 E EB 8,800 8,600 0.977 E
I-10 Waterman Avenue Tippecanoe Avenue PM
WB 8,800 6,347 0.721 C EB 8,800 6,305 0.716 C
AM WB 8,800 8,537 0.970 E EB 8,800 8,537 0.970 E
I-10 Tippecanoe Avenue Mountain View PM
WB 8,800 6,305 0.716 C EB 4,400 684 0.155 A
AM WB 4,400 842 0.191 A EB 4,400 842 0.191 A
SR-30 Highland Avenue Jct. I-215 PM
WB 4,400 684 0.155 A EB 4,400 1,421 0.323 A
AM WB 4,400 1,737 0.395 A EB 4,400 1,737 0.395 A
SR-30 Jct. I-215 H Street PM
WB 4,400 1,421 0.323 A EB 4,400 1,463 0.333 A
AM WB 4,400 1,800 0.409 A EB 4,400 1,800 0.409 A
SR-30 H Street SR-259 PM
WB 4,400 1,463 0.333 A EB 6,600 3,000 0.455 A
AM WB 6,600 3,667 0.556 A EB 6,600 3,667 0.556 A
SR-30 SR-259 Waterman Avenue PM
WB 6,600 3,000 0.455 A EB 6,600 3,000 0.455 A
AM WB 6,600 3,667 0.556 A EB 6,600 3,667 0.556 A
SR-30 Waterman Avenue Del Rosa Drive PM
WB 6,600 3,000 0.455 A NB 8,800 7,211 0.819 D
AM SB 8,800 7,211 0.819 D NB 8,800 7,211 0.819 D
I-215 Jct. I-10 Orange Show Road PM
SB 8,800 7,211 0.819 D NB 8,800 6,789 0.771 C
AM SB 8,800 6,789 0.771 C NB 8,800 6,789 0.771 C
I-215 Orange Show Road Inland Center Drive PM
SB 8,800 6,789 0.771 C NB 6,600 5,116 0.775 C
AM SB 6,600 6,253 0.947 E NB 6,600 6,253 0.947 E
I-215 Jct. Route 66 Baseline Street PM
SB 6,600 5,116 0.775 C NB 4,400 2,232 0.507 A
AM SB 4,400 3,347 0.761 C NB 4,400 3,347 0.761 C
I-215 Jct. SR-30 University Parkway PM
SB 4,400 2,232 0.507 A Note: Existing volumes are taken from the San Bernardino County CMP, 2003 Update.

5. Environmental Analysis
Page 5.14-12 • The Planning Center July 2005
All freeway segments are currently operating at the CMP acceptable LOS of E or better.
5.14.1.2 Arrowhead Springs Specific Plan
The existing Arrowhead Springs resort area is accessed from SR-18 (Rim of the World Highway) via Old Waterman Canyon Road and Arrowhead Springs Road. Entrance to the gated private property is restricted to employees and business guests. Old Waterman Canyon Road is a two-lane roadway with access currently restricted to local residents while on-going flood repairs are taking place. All roadways within the Arrowhead Springs property are two-lane.
Existing Traffic Conditions within the Study Area
The traffic study area for potential impacts due to the Arrowhead Springs project was determined to include 8 roadway sections and 14 intersections in San Bernardino south of the Arrowhead Springs property. The analysis of existing conditions is based on the existing amount of traffic volume on various street corridors and the capacity of the streets and intersections to carry traffic. Capacity measures the ability of the street system to meet and serve the demands from traffic. The capacity of a roadway is affected by a number of factors, e.g., the street width, the number of travel lanes, the number of crossing streets, the type of traffic control devices, the presence of on-street parking, the number of access driveways, the streets horizontal and vertical alignments, etc.
Existing LOS and V/C Ratios
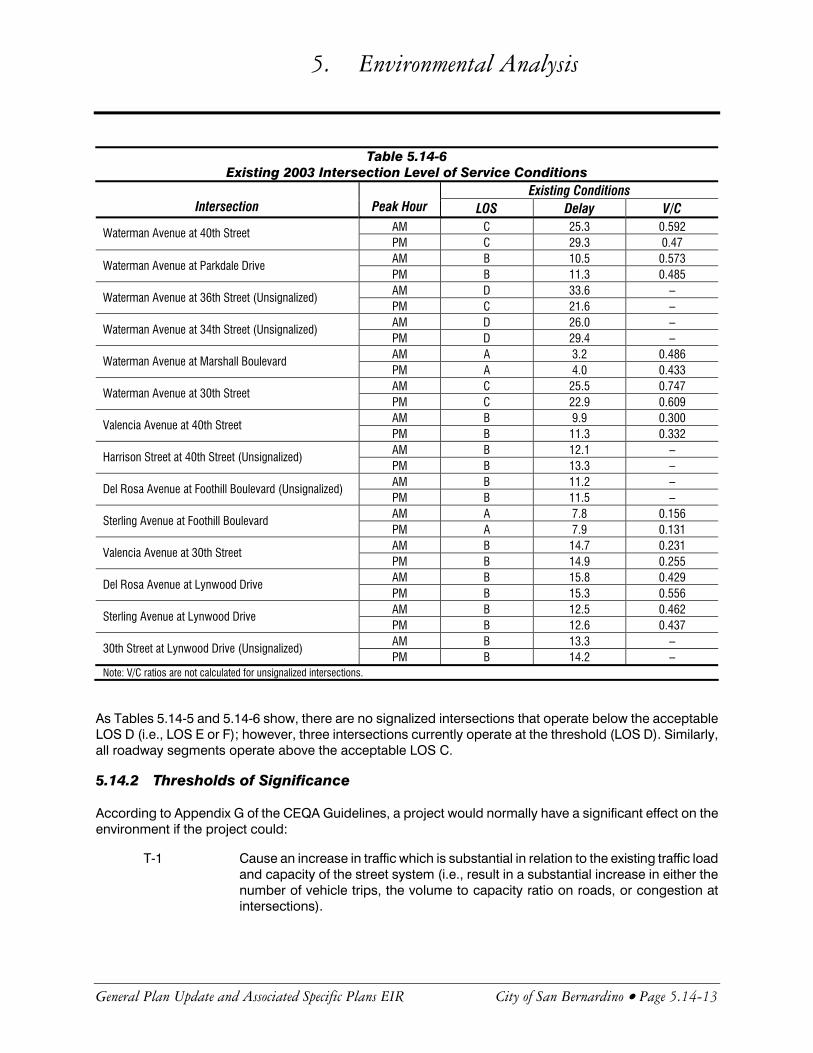
Daily traffic (ADT) counts as well as peak hour traffic counts of turn movements were conducted during the months of March and April, 2003 to determine existing traffic volume conditions. The capacity and level of service (LOS) calculations were also conducted for peak hour traffic conditions at these mid-block locations. The TRAFFIX intersection capacity software version 7.6, based on Highway Capacity Manual’s Operation Delay methodology was used in intersection LOS calculations. The results are shown in Table 5-14-5 for roadway segments and Table 5.14-6 for intersections. CMP roadway segments are shown in bold type face. No CMP intersections are located in the study area for Arrowhead Springs. Intersection peak hour volumes and LOS calculation sheets are shown in Appendix F of Volume II.
Table 5.14-5
Existing 2003 Average Daily Traffic (ADT) Volumes and LOS on Roadways in the Vicinity of Arrowhead Springs
Existing 2003 Conditions
Roadways Facility Type No. of Lanes
Capacity Veh/Day
(C)
Volume, Veh/Day
(V) V/C
Ratio LOS Highway 18 N/O Waterman Avenue Major Arterial 4 40,000 19,194 0.480 A Waterman Avenue S/O 40th Street Major Arterial 4 40,000 17,170 0.429 A Waterman Avenue N/O 30th Street Major Arterial 4 40,000 21,220 0.531 A 40th Street E/O Waterman Avenue Major Arterial 4 40,000 10,150 0.254 A Harrison Street S/O 40th Street Secondary Arterial 2 12,000 960 0.080 A Sterling Avenue S/O Foothill Drive Major Arterial 2 15,000 1,510 0.101 A Valencia Avenue S/O 40th Street Secondary Arterial 2 12,000 4,110 0.343 A Valencia Avenue N/O 30th Street Secondary Arterial 2 12,000 4,320 0.360 A Note: Existing ADT volumes were determined based on Caltrans publications, existing 24-hour traffic counts or peak hour traffic counts, assuming that PM peak hour volume represents approx. 10% of ADT volumes.
5. Environmental Analysis
General Plan Update and Associated Specific Plans EIR City of San Bernardino • Page 5.14-13
Table 5.14-6
Existing 2003 Intersection Level of Service Conditions Existing Conditions
Intersection Peak Hour LOS Delay V/C AM C 25.3 0.592 Waterman Avenue at 40th Street PM C 29.3 0.47 AM B 10.5 0.573
Waterman Avenue at Parkdale Drive PM B 11.3 0.485 AM D 33.6 –
Waterman Avenue at 36th Street (Unsignalized) PM C 21.6 – AM D 26.0 –
Waterman Avenue at 34th Street (Unsignalized) PM D 29.4 – AM A 3.2 0.486
Waterman Avenue at Marshall Boulevard PM A 4.0 0.433 AM C 25.5 0.747
Waterman Avenue at 30th Street PM C 22.9 0.609 AM B 9.9 0.300
Valencia Avenue at 40th Street PM B 11.3 0.332 AM B 12.1 –
Harrison Street at 40th Street (Unsignalized) PM B 13.3 – AM B 11.2 –
Del Rosa Avenue at Foothill Boulevard (Unsignalized) PM B 11.5 – AM A 7.8 0.156
Sterling Avenue at Foothill Boulevard PM A 7.9 0.131 AM B 14.7 0.231
Valencia Avenue at 30th Street PM B 14.9 0.255 AM B 15.8 0.429
Del Rosa Avenue at Lynwood Drive PM B 15.3 0.556 AM B 12.5 0.462
Sterling Avenue at Lynwood Drive PM B 12.6 0.437 AM B 13.3 –
30th Street at Lynwood Drive (Unsignalized) PM B 14.2 –
Note: V/C ratios are not calculated for unsignalized intersections.
As Tables 5.14-5 and 5.14-6 show, there are no signalized intersections that operate below the acceptable LOS D (i.e., LOS E or F); however, three intersections currently operate at the threshold (LOS D). Similarly, all roadway segments operate above the acceptable LOS C.
5.14.2 Thresholds of Significance
According to Appendix G of the CEQA Guidelines, a project would normally have a significant effect on the environment if the project could:
T-1 Cause an increase in traffic which is substantial in relation to the existing traffic load and capacity of the street system (i.e., result in a substantial increase in either the number of vehicle trips, the volume to capacity ratio on roads, or congestion at intersections).

5. Environmental Analysis
Page 5.14-14 • The Planning Center July 2005
T-2 Exceed, either individually or cumulatively, a level of service standard established by the county congestion management agency for designated roads or highways.
T-3 Result in a change in air traffic patterns, including either an increase in traffic levels or a change in location that results in substantial safety risks.
T-4 Substantially increase hazards due to a design feature (e.g., sharp curves or dangerous intersections) or incompatible uses (e.g., farm equipment).
T-5 Result in inadequate emergency access.
T-6 Result in inadequate parking capacity.
T-7 Conflict with adopted policies, plans, or programs supporting alternative trans-portation (e.g., bus turnouts, bicycle racks).
The Initial Study, included as Appendix A, Volume II, substantiates that impacts associated with the following thresholds would be less than significant: T-7. Therefore, this topic will not be addressed in the following analysis.
A project’s traffic impact is determined based upon whether or not traffic volume associated with the project deteriorates the level of service at an intersection location to an unacceptable LOS E or F and for roadway segments below LOS C.
According to the City of San Bernardino Traffic Impact Study Guidelines, traffic impacts at an intersection are to be considered “significant” when any of the following changes in the volume to capacity (V/C) ratios occur between the “without project” and the “with project” conditions:
LOS V/C with Project Increases
C > 0.0400
D > 0.0200
E and F > 0.0100
The LOS and V/C ratios above are based on the delay methodology outlined in the Highway Capacity Manual.
5.14.3 Environmental Impacts
The following impact analysis addresses thresholds of significance for which the Initial Study disclosed potentially significant impacts. The applicable thresholds are identified in parentheses after the impact statement.
5.14.3.1 San Bernardino General Plan
Through the General Plan update, the City has identified a number of roadway improvements, reclassi-fication, and addition/deletion of certain roadway segments in order to improve its circulation conditions to handle existing as well as future traffic volumes. There are approximately 64 changes throughout the City that are proposed as part of the Circulation Element for General Plan, which are listed in Volume II, Appendix F. For the future traffic conditions analysis, these improvements have been assumed to be in place in the circulation system. The proposed Circulation Plan for the General Plan update is shown on Figure 5.14-1.

5. Environmental Analysis
General Plan Update and Associated Specific Plans EIR City of San Bernardino • Page 5.14-15
Focused Travel Demand Model
As part of this circulation system analysis, a focused travel demand model was developed to analyze the traffic impacts of projected development within the City, including Arrowhead Springs, at “build-out” of the proposed General Plan. The latest version of the RIVSAN CTP Model, which has a year 2000 base-year and year 2030 as the horizon year, was used. The City and its Sphere of Influence are comprised of approximately 564 traffic analysis zones (TAZs) in this model.
Land use quantities (in acres) were estimated for the build-out conditions for each of the TAZs. These land use quantities were then converted to the number of single and multiple dwelling units, population, retail, and total employment. The CTP model highway network was also obtained from SCAG and refined by adding secondary and collector streets and zonal connectors (per the City’s recommended network modification/improvement list) to represent a more detailed network consistent with the finer zone system.
The model input data for the disaggregated TAZs were submitted to SCAG Inland Empire Office. From these data, SCAG generated trips for all study area zones. The EVTM model was run using these new build-out trips in the project area. Trip generation, distribution, and mode choice functions for the model were carried out and the four-period trip tables (AM, PM peak, mid-day and night-time) were provided to the General Plan team. The team performed traffic assignments for all four periods and combined them to generate total daily volumes. These daily trip volumes were assigned to the City of San Bernardino’s future planned circulation network with the total trips shown below:
Table 5.14-7
Total Daily Trips at General Plan Buildout Daily Trips at Build-out Proposed General Plan
From San Bernardino TAZs to All SCAG TAZs 793,557 To San Bernardino TAZs from All SCAG TAZs 797,888 Total 1,591,445 Source: City of San Bernardino General Plan Update: 2004, Circulation Impact & Mitigation Measures; Transtech Engineers

5. Environmental Analysis
Page 5.14-16 • The Planning Center July 2005
This page intentionally left blank.


5. Environmental Analysis
Page 5.14-18 • The Planning Center July 2005
This page left intentionally blank.

5. Environmental Analysis
General Plan Update and Associated Specific Plans EIR City of San Bernardino • Page 5.14-19
GP IMPACT 5.14-1: TRIP GENERATION AT BUILD-OUT OF THE GENERAL PLAN WOULD IMPACT LEVELS OF SERVICE FOR THE EXISTING AREA ROADWAY SYSTEM. [THRESHOLD T-1]
Impact Analysis: The future build-out traffic conditions within the City were analyzed based on the traffic volume data obtained from EVTM runs. The traffic volume data were post-processed using the “B-Turns” program per SANBAG’s requirement. The year 2030 was considered to determine the impacts of the proposed General Plan in comparison with existing conditions.
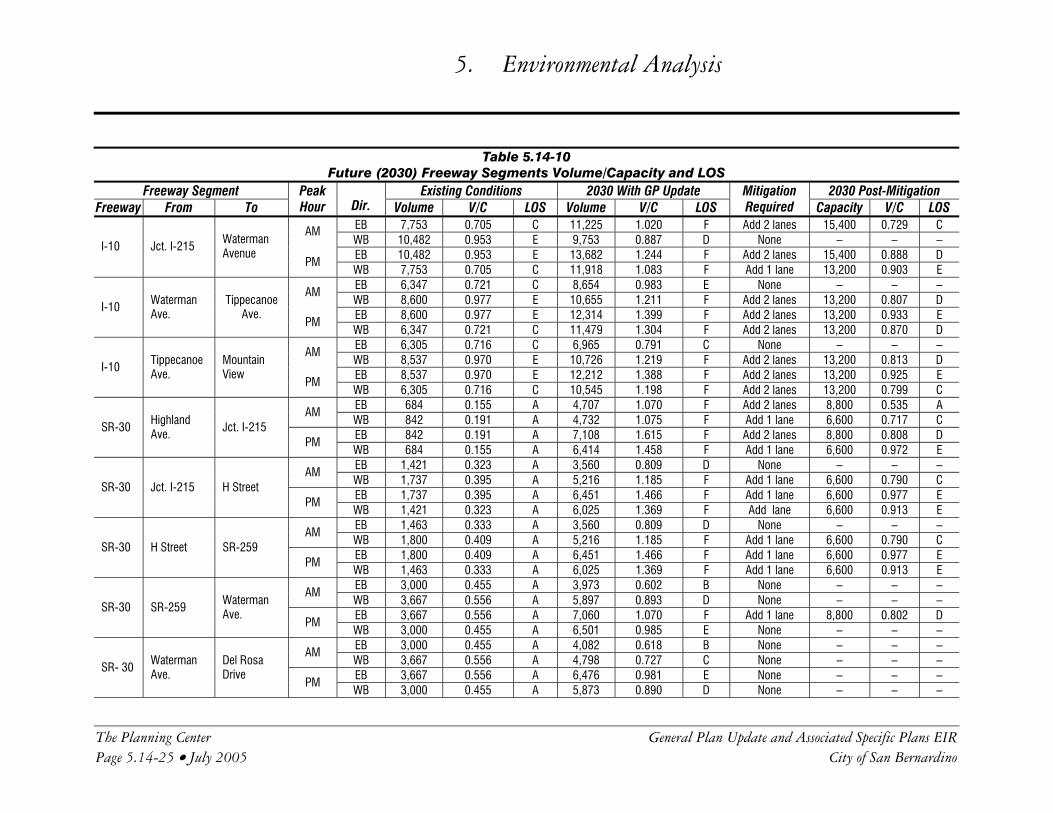
Tables 5.14-8 and 5.14-9 show the results of intersection and roadway LOS analysis for 2030 under existing conditions and with proposed General Plan. This table shows the roadway segments LOS for 2030 under existing conditions and with the proposed General Plan. The projected volumes were divided by the assumed future capacities to identify the future volume/capacity ratios, LOS, potential future capacity deficiencies and expected congestion problems. Intersection peak hour volumes and LOS calculation sheets are shown in Volume II, Appendix F. CMP intersections are shown in bold typeface in Table 5.14-7. Table 5.14-10 shows the results of the freeway segments analysis with existing conditions and buildout of the General Plan update.
Table 5.14-8
Intersection Level of Service Summary for Future Conditions (2030) Existing Conditions
2003 Gen. Plan Conditions
2030
Intersection Peak Hour LOS
Delay, sec/veh
V/C Ratio LOS
Delay, sec/veh
V/C Ratio
G.P. Impact
AM B 11.3 – A 9.7 0 30th Street @ Lynwood Drive
PM A 7.2 – B 11.5 0 AM D 39.1 0.687 C 34.9 0.707
Arden Avenue @ Highland Avenue PM C 34.2 0.633 D 46.1 0.892 AM B 16.5 0.339 B 15.7 0.417
Arden Avenue @ SR-30 EB Ramps PM B 14.2 0.345 B 18.2 0.583 AM 0.0 – – A 0.0 0.000
Arden Avenue @ SR-30 WB Ramps PM 0.0 – – A 0.0 0.000 AM B 14.7 0.724 B 12.6 0.430
Arrowhead Avenue @ Baseline Street PM D 38.3 1.043 B 16.5 0.531 AM B 10.1 0.354 A 8.1 0.178
Belmont Avenue @ Palm Avenue PM A 8.5 0.232 A 7.9 0.147 AM C 33.8 0.245 C 25.0 0.320
Boulder Avenue @ Highland Avenue PM C 34.6 0.490 C 29.3 0.658 AM C 27.5 0.398 D 39.5 0.679 Del Rosa Avenue @ 3rd Street PM C 31.1 0.469 D 47.4 0.839 AM C 21.4 0.395 D 36.2 0.869 Del Rosa Avenue @ Base Line Street PM C 24.7 0.396 C 33.0 0.823 AM B 11.2 – B 14.8 –
Del Rosa Avenue @ Foothill Drive PM B 11.5 – C 17.5 – AM B 14.8 0.270 B 16.6 0.558
Del Rosa Avenue @ Lynwood Drive PM B 13.9 0.339 B 12.7 0.612 AM C 24.4 0.579 C 26.5 0.695 Del Rosa Avenue @ SR-30 EB Ramps PM C 29.0 0.810 C 28.5 0.748 AM C 22.8 0.795 B 18.9 0.740 Del Rosa Avenue @ SR-30 WB Ramps PM C 27.4 0.855 E 57.0 1.088

5. Environmental Analysis
Page 5.14-20 • The Planning Center July 2005
Table 5.14-8 Intersection Level of Service Summary for Future Conditions (2030)
Existing Conditions 2003
Gen. Plan Conditions 2030
Intersection Peak Hour LOS
Delay, sec/veh
V/C Ratio LOS
Delay, sec/veh
V/C Ratio
G.P. Impact
AM B 20.0 0.380 B 11.7 0.342 Del Rosa Avenue @ Dale Street PM C 23.0 0.527 B 12.1 0.465 AM C 24.3 0.505 C 29.5 0.654 E Street @ 2nd Street PM C 34.2 0.576 D 40.3 0.816 AM B 14.8 0.476 B 15.3 0.449
E Street @ 30th Street PM B 12.6 0.562 B 14.8 0.754 AM B 18.0 0.407 C 23.1 0.593 E Street @ Baseline Street PM B 19.4 0.566 C 24.9 0.686 AM B 18.6 0.765 B 16.6 0.428
E Street @ Highland Avenue PM C 21.7 0.400 B 16.5 0.475 AM C 27.2 0.423 C 33.4 0.660 E Street @ Orange Show Road PM D 37.5 0.631 D 49.7 0.945 AM B 12.1 – D 26.6 –
Harrison Street @ 40th Street PM B 13.3 – F OF – Yes AM C 27.0 0.536 C 28.9 0.565
Hospitality Lane @ Carnegie Drive PM D 41.1 0.906 C 30.7 0.649 AM F OVF – F 744.5 – Yes
Hunts Lane @ E Street PM F OVF – F OVF – Yes AM C 26.2 0.572 B 12.8 0.285
Kendall Drive @ 40th Street PM C 23.9 0.480 B 18.2 0.542 AM C 32.2 0.490 B 17.0 0.071
Kendall Drive @ Palm Avenue PM C 28.6 0.595 B 17.7 0.072 AM C 32.2 0.490 C 30.5 0.513
Kendall Drive @ University Parkway PM C 28.6 0.595 C 30.6 0.501 AM B 18.1 0.178 C 22.2 0.377
Lena Road @ Mill Street PM B 18.0 0.206 C 22.6 0.502 AM B 17.2 0.598 B 10.2 0.520 Leroy Street/SR-30 WB On-Ramp @
30th Street PM B 17.4 0.401 B 17.5 0.594 AM E 36.3 – C 16.5 – Meridian Avenue @ Rialto Avenue PM F 75.1 – F 65.6 – Yes AM B 12.9 0.535 F 107.1 1.372 Yes Mountain View Avenue @ San Bernardino
Road PM F 90.2 1.360 F 308.8 2.440 Yes AM B 191.8 0.454 B 17.6 0.325 Mt. Vernon Avenue @ 2nd Street PM C 30.0 0.643 C 31.2 0.682 AM C 22.5 0.405 C 25.4 0.486
Mt. Vernon Avenue @ 5th Street PM C 22.5 0.489 C 24.7 0.611 AM C 20.1 0.458 C 22.0 0.527 Mt. Vernon Avenue @ Base Line Street PM C 23.3 0.532 C 22.8 0.531 AM C 27.8 0.617 C 22.0 0.488 Mt. Vernon Avenue @ Highland Avenue PM C 27.5 0.679 C 31.7 0.598 AM C 30.4 0.520 C 34.7 0.673 Mt. Vernon Avenue @ Mill Street PM C 31.7 0.677 D 35.1 0.799 AM B 14.5 0.292 B 16.6 0.355 Mt. Vernon Avenue @ Rialto Avenue PM B 14 0.384 B 17.0 0.502

5. Environmental Analysis
General Plan Update and Associated Specific Plans EIR City of San Bernardino • Page 5.14-21
Table 5.14-8 Intersection Level of Service Summary for Future Conditions (2030)
Existing Conditions 2003
Gen. Plan Conditions 2030
Intersection Peak Hour LOS
Delay, sec/veh
V/C Ratio LOS
Delay, sec/veh
V/C Ratio
G.P. Impact
AM C 28.8 0.354 D 38.6 0.533 Waterman Avenue @ Mill Street PM D 35.2 0.540 D 47.2 0.889 AM C 21.4 0.284 C 28.0 0.091
Northpark Boulevard @ University Parkway PM D 39.6 0.689 C 26.0 0.142 AM A 9.9 – A 9.3 0.000
Ohio Avenue @ Palm Avenue PM A 9.6 – A 9.3 0.000 AM D 35.8 0.288 D 39.7 0.725
Palm Avenue @ Highland Avenue PM C 32.4 0.520 D 42.0 0.665 AM C 33.1 0.465 D 37.1 0.525 Pepper Avenue @ Mill Street PM C 30.4 0.450 D 37.2 0.730 AM B 14.6 0.366 B 17.5 0.574
Pepper Avenue @ Rialto Avenue PM B 16.4 0.496 C 20.6 0.728 AM F 119.6 – F OF 0.000 Yes Rancho Avenue @ 5th Street/Foothill
Boulevard PM F OVF – F OF 0.000 Yes AM D 35.8 0.288 C 20.3 0.600 SR-30 EB Ramps @ Highland Avenue PM B 18.5 0.464 C 20.8 0.625 AM B 15.7 0.385 B 13.5 0.317 SR-30 WB ramps @ Highland Avenue PM B 14.2 0.469 B 14.5 0.562 AM F 298.3 – F 465.7 – Yes
SR-30 WB Off-Ramp @ 30th Street PM F 946.1 – F OVF – Yes AM A 7.8 0.156 A 8.1 0.245
Sterling Avenue @ Foothill Drive PM A 7.9 0.131 B 10.2 0.419 AM C 29.6 0.328 C 28.8 0.58 Sterling Avenue @ Highland Avenue PM A 7.9 0.131 C 31.8 0.606 AM B 12.5 0.463 B 11.2 0.366
Sterling Avenue @ Lynwood Drive PM B 12.6 0.437 C 20.0 0.775 AM B 15.0 0.255 B 13.9 0.530
Sierra Way @ 30th Street PM B 15.0 0.361 B 17.6 0.764 AM B 19.0 0.270 C 26.0 0.626
Sierra Way @ 40th Street PM C 21.3 0.432 C 34.6 0.920 AM B 15.4 0.480 B 19.3 0.516
State Street @ Baseline Street PM A 5.5 0.335 B 19.2 0.560 AM A 8.7 0.499 B 15.2 0.539
State Street @ Highland Avenue PM A 9.3 0.594 B 16.3 0.510 AM C 22.7 0.482 A 6.7 0.516 Tippecanoe Avenue @ Harry Sheppard
Boulevard PM C 20.2 0.828 B 11.6 0.683 AM D 25.6 – F 91.7 0.000 Yes
Tippecanoe Avenue @ Rialto Avenue PM F 102.6 – F 242.1 0.000 Yes AM C 26.5 0.464 C 30.8 0.573 Tippecanoe Avenue @ 3rd Street PM C 32.5 0.698 D 49.0 0.882 AM B 12.2 0.258 B 17.9 0.432
Tippecanoe Avenue @ Hospitality Lane PM C 25.3 0.621 C 24.5 0.505 AM B 13.4 0.454 C 24.0 0.629 Tippecanoe Avenue @ Mill Street PM C 22.2 .0790 B 19.5 0.747

5. Environmental Analysis
Page 5.14-22 • The Planning Center July 2005
Table 5.14-8 Intersection Level of Service Summary for Future Conditions (2030)
Existing Conditions 2003
Gen. Plan Conditions 2030
Intersection Peak Hour LOS
Delay, sec/veh
V/C Ratio LOS
Delay, sec/veh
V/C Ratio
G.P. Impact
AM C 33.1 0.421 D 37.6 0.698 Tippecanoe Avenue @ San Bernardino Road PM D 42.1 0.828 D 48.1 0.863 AM B 14.7 0.233 A 1.0 0.137
Valencia Avenue @ 30th Street PM B 14.8 0.257 B 12.7 0.304 AM A 9.9 0.305 C 15.0 0.667
Valencia Avenue @ 40th Street PM B 11.5 0.412 F 72.4 1.129 Yes AM D 36.1 0.602 C 26.0 0.382
Victoria Avenue @ Highland Avenue PM D 39.9 0.683 C 31.6 0.610 AM E 63 1.081 D 36.6 0.797 Waterman Avenue @ 5th Street PM F 256.2 1.593 D 40.2 0.811 AM C 27.1 0.801 F 138.9 1.215 Yes
Waterman Avenue @ 30th Street PM C 23.4 0.654 F 96.5 1.180 Yes AM D 26.2 – D 26.7 –
Waterman Avenue @ 34th Street PM D 29.9 – F 110.6 – Yes AM E 37.9 – F 54.8 – Yes
Waterman Avenue @ 36th Street PM C 23.8 – F 87.5 – Yes AM C 26.1 0.637 C 28.5 0.820
Waterman Avenue @ 40th Street PM C 24.8 0.506 D 42.9 0.982 AM C 25.7 .0663 C 27.7 0.885 Waterman Avenue @ Barton Road PM D 40.3 0.944 C 31.7 0.972 AM C 30.4 0.715 C 30.7 0.637 Waterman Avenue @ Hospitality Lane PM D 46.8 0.984 C 33.4 0.762 AM A 3.2 0.507 A 4.6 0.626
Waterman Avenue @ Marshall Boulevard PM A 4.0 0.451 A 5.0 0.633 AM B 10.4 0.592 A 3.7 0.553
Waterman Avenue @ Parkdale Avenue PM B 11.1 0.501 A 5.3 0.651 AM C 38.0 0.442 D 35.1 0.648
Waterman Avenue @ Orange Show Road PM D 35.7 0.652 D 40.1 0.832 AM C 32.3 0.852 E 60.9 1.053 Yes Waterman Avenue @ SR-30 EB Ramps PM F 90.4 1.171 F 127.9 1.288 Yes AM B 19.6 0.358 B 10.3 0.391 Waterman Avenue @ Vanderbilt Way PM C 23.3 0.584 B 13.7 0.641 AM D 36.4 0.482 D 37.3 0.628
Waterman Avenue @ Highland Avenue PM D 39.2 0.650 D 40.0 0.707
As shown on the preceding table, the following 12 intersections are expected to perform at an unacceptable level of service at build-out of the General Plan:
• Harrison Street @ 40th Street • Hunts Lane @ E Street • Meridian Avenue @ Rialto Avenue • Mountain View @ San Bernardino Road • Rancho Avenue @ 5th Street/Foothill Boulevard

5. Environmental Analysis
General Plan Update and Associated Specific Plans EIR City of San Bernardino • Page 5.14-23
• SR-30 WB Off-ramp @ 30th Street • Tippecanoe Avenue @ Rialto Avenue • Valencia Avenue @ 40th Street • Waterman Avenue @ 30th Street • Waterman Avenue @ SR-30 EB Ramps • Waterman Avenue @ 34th Street • Waterman Avenue @ 36th Street
Table 5.14-9 shows the future local roadway segment conditions at build-out of the proposed General Plan.
Table 5.14-9
Future Roadway LOS with Proposed General Plan Volumes FUTURE CONDITIONS WITH PROPOSED GP
Roadway Segment
CMP Street (Y/N)?
Facility Type
No. of Lanes
Capacity (C)
Build-out ADT
(V) V/C LOS Mitigation Required?
East-West Streets 2ND Street E/O I-215 NB On Ramp Y Major 6 60,000 19,608 0.323 A 3rd Street W/O Tippecanoe Y Major 4 40,000 25842 0.671 C 4th Street I-215–Arrowhead N Major 4 40,000 24,633 0.616 B 5th Street Pepper–I-215 N Major 4 40,000 19,238 0.481 A 5th Street I-215–Waterman N Major 4 40,000 24,007 0.600 A 5th Street Waterman–Victoria Y Major 4 40,000 17,878 0.447 A 5th Street Victoria–Palm Y Major 4 40,000 14,370 0.359 A 9th Street Medical Center–I-215 N Secondary 4 30,000 5,219 0.174 A 9th Street I-215–Waterman N Secondary 4 30,000 8,367 0.279 A 9th Street Waterman–Tippecanoe N Secondary 4 30,000 5,927 0.198 A 9th Street Tippecanoe–Del Rosa N Secondary 2 12,000 5,712 0.476 A 40th Street Valencia–Waterman N Major 4 40,000 17,908 0.448 A 40th Street Waterman–Sierra Y Major 4 40,000 22,625 0.566 A 40th Street Sierra–Mountain View Y Major 4 40,000 31,279 0.782 C Baseline Street SR-30–Palm Y Major 4 40,000 25,185 0.630 B Baseline Street Palm–Valencia Y Major 4 40,000 34,286 0.857 D Yes Baseline Street Valencia–I-215 Y Major 4 40,000 23,585 0.590 A Baseline Street I-215–Riverside Y Major 4 40,000 18,194 0.455 A Highland Ave. Riverside–I-215 Y Major 4 40,000 8,447 0.211 A Highland Ave. I-215–Victoria Y Major 4 40,000 26,775 0.669 B Highland Ave. Victoria–SR-30 Y Major 4 40,000 27,788 0.695 B Highland Ave. SR-30–E. City Limit N Major 4 40,000 23,666 0.592 A Hospitality Lane E Street–Hunts N Secondary 4 30,000 13,972 0.466 A Hospitality Lane Hunts–Waterman N Secondary 4 30,000 18,460 0.615 B Inland Center Dr. E/O I-215 Ramps N Major 4 40,000 11,861 0.296 A Mill Street Tippecanoe–Waterman N Major 4 40,000 19,150 0.479 A Mill Street Waterman–Mt Vernon Y Major 4 40,000 30,155 0.754 C Mill Street Mt Vernon–Bordwell Y Major 4 40,000 31,126 0.778 C Redlands Blvd. I-215–Waterman Y Secondary 4 30,000 18,011 0.600 A Rialto Ave. Riverside–Rancho N Major 4 40,000 16,287 0.407 A Rialto Ave. Rancho–I Street N Major 4 40,000 16,970 0.424 A Rialto Ave. I St–Sierra N Major 4 40,000 8,628 0.216 A

5. Environmental Analysis
Page 5.14-24 • The Planning Center July 2005
Table 5.14-9 Future Roadway LOS with Proposed General Plan Volumes
FUTURE CONDITIONS WITH PROPOSED GP
Roadway Segment
CMP Street (Y/N)?
Facility Type
No. of Lanes
Capacity (C)
Build-out ADT
(V) V/C LOS Mitigation Required?
Rialto Ave. Sierra–Tippecanoe N Major 4 40,000 7,688 0.192 A San Bernardino road E/O Tippecanoe Y Major 4 40,000 16,742 0.419 A North-South Streets Alabama Street S/O San Bernardino Y Major 4 40,000 19,463 0.419 A Boulder Ave. Atlantic–Pacific N Major 4 40,000 14,853 0.371 A California Street S/O Lugonia Y Major 6 60,000 14,691 0.245 A Del Rosa Drive 3rd St–Paloma Y Secondary 4 30,000 14,877 0.496 A Del Rosa Drive Baseline–SR-30 Y Secondary 4 30,000 21,995 0.733 C Del Rosa Drive SR-30–Quail Canyon N Secondary 4 30,000 1,445 0.048 A E Street I-10- Fairway Y Major 4 40,000 23,208 0.580 A E Street Fairway–9th Street Y Major 4 40,000 18,814 0.470 A E Street 9th St–Kendall Y Major 4 40,000 35,103 0.878 D Yes Kendall Drive S/O University Pkwy. Y Major 4 40,000 18,915 0.473 A Kendall Drive N/O Revere N Major 4 40,000 13,142 0.328 A Mountain View Ave. S/o Lugonia Y Major 4 40,000 16,962 0.424 A Mount Vernon Ave. N/O 2nd Street Y Major 4 40,000 13,052 0.326 A Northpark Blvd. N/O University Pkwy N Major 6 60,000 3,273 0.055 A Palm Ave. Pacific–Highland Y Major 4 40,000 19,826 0.496 A Pepper Ave. I-10–Foothill Y Major 4 40,000 44,034 1.101 F Yes Rancho Ave. I-10–Mill Y Major 4 40,000 21,870 0.547 A Rancho Ave. Mill–Rialto Y Major 4 40,000 23,685 0.592 A Rancho Ave. Rialto–Foothill Y Major 4 40,000 20,783 0.520 A Sierra Way Waterman–40th Street N Major 4 40,000 37,828 0.946 E Yes Sierra Way 40th Street–5th Street N Major 2 15,000 2,112 0.141 A Sierra Way 5th Street–2nd Street N Major 4 40,000 5,505 0.138 A Sierra Way 2nd Street–Mill N Major 4 40,000 5,789 0.145 A Tippeecanoe S/O Hospitality Lane Y Major 6 60,000 32,065 0.534 A University Pkwy. W/O Northpark Blvd. N Major 6 60,000 7,834 0.131 A Victoria Ave. Lynwood–Baseline N Secondary 4 30,000 9,412 0.314 A Victoria Ave. Baseline–3rd Street Y Secondary 4 30,000 6,158 0.205 A Waterman Ave. I-10–Highland Y Major 6 60,000 26,590 0.443 A Waterman Ave. Highland–Sierra Y/N Major 4 40,000 24,062 0.602 A
As shown on the preceding table, the following 4 roadway segments are expected to perform at an unacceptable level of service (LOS D or worse) at build-out of the General Plan according to standards established by the City:
• Baseline Street between Palm Avenue and Valencia Avenue • E Street between 9th Street and Kendall Drive • Pepper Avenue between I-10 and Foothill Boulevard • Sierra Way between Waterman Avenue and 40th Street
5. Environmental Analysis
The Planning Center General Plan Update and Associated Specific Plans EIR Page 5.14-25 • July 2005 City of San Bernardino
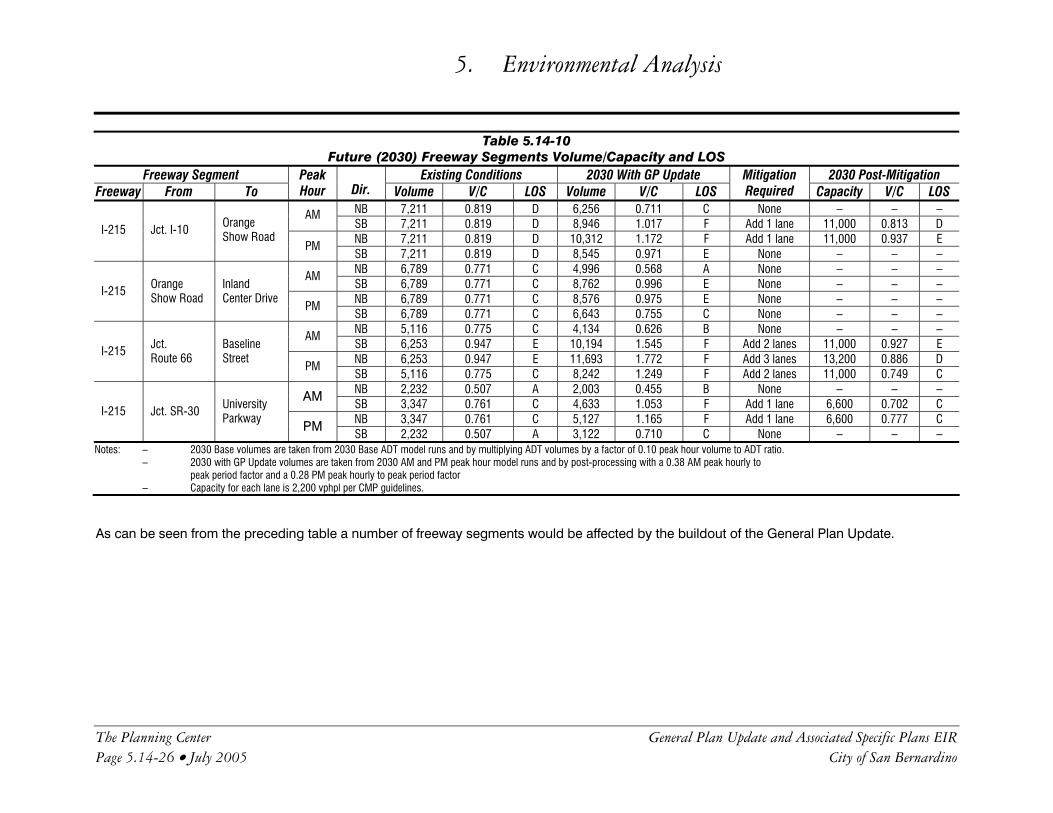
Table 5.14-10
Future (2030) Freeway Segments Volume/Capacity and LOS Freeway Segment Existing Conditions 2030 With GP Update 2030 Post-Mitigation
Freeway From To Peak Hour Dir. Volume V/C LOS Volume V/C LOS
Mitigation Required Capacity V/C LOS
EB 7,753 0.705 C 11,225 1.020 F Add 2 lanes 15,400 0.729 C AM WB 10,482 0.953 E 9,753 0.887 D None – – – EB 10,482 0.953 E 13,682 1.244 F Add 2 lanes 15,400 0.888 D
I-10 Jct. I-215 Waterman Avenue
PM WB 7,753 0.705 C 11,918 1.083 F Add 1 lane 13,200 0.903 E EB 6,347 0.721 C 8,654 0.983 E None – – –
AM WB 8,600 0.977 E 10,655 1.211 F Add 2 lanes 13,200 0.807 D EB 8,600 0.977 E 12,314 1.399 F Add 2 lanes 13,200 0.933 E
I-10 Waterman Ave.
Tippecanoe Ave.
PM WB 6,347 0.721 C 11,479 1.304 F Add 2 lanes 13,200 0.870 D EB 6,305 0.716 C 6,965 0.791 C None – – –
AM WB 8,537 0.970 E 10,726 1.219 F Add 2 lanes 13,200 0.813 D EB 8,537 0.970 E 12,212 1.388 F Add 2 lanes 13,200 0.925 E
I-10 Tippecanoe Ave.
Mountain View
PM WB 6,305 0.716 C 10,545 1.198 F Add 2 lanes 13,200 0.799 C EB 684 0.155 A 4,707 1.070 F Add 2 lanes 8,800 0.535 A
AM WB 842 0.191 A 4,732 1.075 F Add 1 lane 6,600 0.717 C EB 842 0.191 A 7,108 1.615 F Add 2 lanes 8,800 0.808 D
SR-30 Highland Ave.
Jct. I-215 PM
WB 684 0.155 A 6,414 1.458 F Add 1 lane 6,600 0.972 E EB 1,421 0.323 A 3,560 0.809 D None – – –
AM WB 1,737 0.395 A 5,216 1.185 F Add 1 lane 6,600 0.790 C EB 1,737 0.395 A 6,451 1.466 F Add 1 lane 6,600 0.977 E
SR-30 Jct. I-215 H Street PM
WB 1,421 0.323 A 6,025 1.369 F Add lane 6,600 0.913 E EB 1,463 0.333 A 3,560 0.809 D None – – –
AM WB 1,800 0.409 A 5,216 1.185 F Add 1 lane 6,600 0.790 C EB 1,800 0.409 A 6,451 1.466 F Add 1 lane 6,600 0.977 E
SR-30 H Street SR-259 PM
WB 1,463 0.333 A 6,025 1.369 F Add 1 lane 6,600 0.913 E EB 3,000 0.455 A 3,973 0.602 B None – – –
AM WB 3,667 0.556 A 5,897 0.893 D None – – – EB 3,667 0.556 A 7,060 1.070 F Add 1 lane 8,800 0.802 D
SR-30 SR-259 Waterman Ave.
PM WB 3,000 0.455 A 6,501 0.985 E None – – – EB 3,000 0.455 A 4,082 0.618 B None – – –
AM WB 3,667 0.556 A 4,798 0.727 C None – – – EB 3,667 0.556 A 6,476 0.981 E None – – –
SR- 30 Waterman Ave.
Del Rosa Drive
PM WB 3,000 0.455 A 5,873 0.890 D None – – –
5. Environmental Analysis
The Planning Center General Plan Update and Associated Specific Plans EIR Page 5.14-26 • July 2005 City of San Bernardino
Table 5.14-10 Future (2030) Freeway Segments Volume/Capacity and LOS
Freeway Segment Existing Conditions 2030 With GP Update 2030 Post-Mitigation Freeway From To
Peak Hour Dir. Volume V/C LOS Volume V/C LOS
Mitigation Required Capacity V/C LOS
NB 7,211 0.819 D 6,256 0.711 C None – – – AM SB 7,211 0.819 D 8,946 1.017 F Add 1 lane 11,000 0.813 D NB 7,211 0.819 D 10,312 1.172 F Add 1 lane 11,000 0.937 E
I-215 Jct. I-10 Orange Show Road
PM SB 7,211 0.819 D 8,545 0.971 E None – – – NB 6,789 0.771 C 4,996 0.568 A None – – –
AM SB 6,789 0.771 C 8,762 0.996 E None – – – NB 6,789 0.771 C 8,576 0.975 E None – – –
I-215 Orange Show Road
Inland Center Drive
PM SB 6,789 0.771 C 6,643 0.755 C None – – – NB 5,116 0.775 C 4,134 0.626 B None – – –
AM SB 6,253 0.947 E 10,194 1.545 F Add 2 lanes 11,000 0.927 E NB 6,253 0.947 E 11,693 1.772 F Add 3 lanes 13,200 0.886 D
I-215 Jct. Route 66
Baseline Street
PM SB 5,116 0.775 C 8,242 1.249 F Add 2 lanes 11,000 0.749 C NB 2,232 0.507 A 2,003 0.455 B None – – – AM SB 3,347 0.761 C 4,633 1.053 F Add 1 lane 6,600 0.702 C NB 3,347 0.761 C 5,127 1.165 F Add 1 lane 6,600 0.777 C
I-215 Jct. SR-30 University Parkway
PM SB 2,232 0.507 A 3,122 0.710 C None – – –
Notes: – 2030 Base volumes are taken from 2030 Base ADT model runs and by multiplying ADT volumes by a factor of 0.10 peak hour volume to ADT ratio. – 2030 with GP Update volumes are taken from 2030 AM and PM peak hour model runs and by post-processing with a 0.38 AM peak hourly to peak period factor and a 0.28 PM peak hourly to peak period factor – Capacity for each lane is 2,200 vphpl per CMP guidelines.
As can be seen from the preceding table a number of freeway segments would be affected by the buildout of the General Plan Update.

5. Environmental Analysis
General Plan Update and Associated Specific Plans EIR City of San Bernardino • Page 5.14-27
GP IMPACT 5.14-2: GENERAL PLAN RELATED TRIP GENERATION IN COMBINATION WITH EXISTING AND PROPOSED CUMULATIVE DEVELOPMENT WOULD RESULT IN DESIGNATED INTERSECTIONS, ROAD AND/OR HIGHWAYS EXCEEDING COUNTY CONGESTION MANAGEMENT AGENCY SERVICE STANDARDS. [THRESHOLD T-2]
Impact Analysis: The CMP intersections and roadway segments have been noted in GP Impact 5.14-1. Table 5.14-8 indicates that only one CMP intersection would not meet an acceptable LOS of E or better: Waterman Avenue @ SR-30 EB ramps. Table 5.14-9 indicates that one CMP roadway segment (Pepper Avenue between I-10 and Foothill) would function at an unacceptable LOS F and several freeway segments would function at an unacceptable LOS F as indicated in Table 5.14-10.
GP IMPACT 5.14-3: THE PROPOSED GENERAL PLAN WOULD NOT CHANGE AIR TRAFFIC PATTERNS THAT WOULD RESULT IN SUBSTANTIAL SAFETY RISKS. [THRESHOLD T-3]
Impact Analysis: As discussed in Section 5.8, Land Use and Planning, the proposed General Plan will incorporate the Airport Master Plan and the Comprehensive Land Use Plan (CLUP) for the San Bernardino International Airport (SBIA). Please note that as of the writing of this report, the CLUP for SBIAA were in the process of being prepared and the Airport was operating under an Interim Airport Operating Plan. As a consequence, the precise noise contours and safety zones were not available. However, relative policies have been included in the General Plan. In addition, the Airport Land Use Compatibility Plan for the SBIA was not available for use in this Plan. Upon adoption of the Airport Master Plan and CLUP, the new noise and safety zones will be incorporated into the General Plan and the Airport Land Use Compatibility Plan analyzed for relative information.
GP IMPACT 5.14-4: PROJECT CIRCULATION IMPROVEMENTS HAVE BEEN DESIGNED TO ADEQUATELY ADDRESS POTENTIALLY HAZARDOUS CONDITIONS (SHARP CURVES, ETC), POTENTIAL CONFLICTING USES, AND EMERGENCY ACCESS. [THRESHOLDS T-4 AND T-5]
Impact Analysis: The proposed Circulation Element of the General Plan includes several changes in roadway classifications and alignments. These changes are intended to address issues of capacity, access, and safety and are detailed in Appendix F. With one exception (Harrison Parkway), the changes to the General Plan circulation system are only depicted at a policy level to show classification and general alignment. When the roadways are designed, they will comply with City and/or Caltrans standards for design, sight lines, access, speeds, and emergency access.
GP IMPACT 5.15-5: ADEQUATE PARKING WOULD BE PROVIDED WITH IMPLEMENTATION OF THE GENERAL PLAN UPDATE. [THRESHOLD T-6]
Impact Analysis: The proposed General Plan update does not fundamentally change the current land use patterns but does encourage improvement in quality of life which may include revitalization of some areas and the introduction of infill development. It also stresses pedestrian friendly development with use of mass transit which could reduce the need for abundant parking. The General Plan update includes goals and polices to achieve balance between parking and demand. New developments would be required to provide adequate parking to meet the parking demand generated.
General Plan Policies and Programs
Land Use Element
Proposed General Plan policies related to the provision/accommodation of alternative transportation options:
5. Environmental Analysis
Page 5.14-28 • The Planning Center July 2005
Policy 2.2.5: Establish and maintain an ongoing liaison with Caltrans, the railroads, and other agencies to help minimize impacts and improve aesthetics of their facilities and operations; including possible noise walls, berms, limitation on hours and types of operations, landscaped setbacks and decorative walls along its periphery.
Proposed General Plan policies related to general circulation issues:
Policy 2.3.6: Circulation system improvements shall continue to be pursued that facilitate connectivity across freeway and rail corridors.
Policy 2.3.7: Improvements shall be made to transportation corridors that promote physical connectivity and reflect consistently high aesthetic values.
Policy 2.7.4: Reserve lands for the continuation and expansion of public streets and highways in accordance with the Master Plan of Highways.
Proposed General Plan policies related to air traffic:
Policy 2.9.1: Require that all new development be consistent with the adopted Comprehensive Land Use Plan for the San Bernardino International Airport and ensure that no structures or activities encroach upon or adversely affect the use of navigable airspace.
Policy 2.9.2: Refer any adoption or amendment of this General Plan, specific plan, zoning ordinance, or building regulation within the planning boundary of the adopted Comprehensive Airport Master Plan for the SBIA to the airport authority as provided by the Airport Land Use Law.
Policy 2.9.3: Limit the type of development, population density, maximum site coverage, and height of structures as specified in the applicable safety zones in the Comprehensive Land Use Plan for the SBIA and as shown on Figure LU-4.
Policy 2.9.4: Limit the development of sensitive land uses (e.g., residential, hospitals, schools) within the 65 decibel (dB) Community Noise Equivalent Level (CNEL) contour, as shown on Figure LU-4.
Policy 2.9.5: Ensure that the height of structures do not impact navigable airspace, as defined in the Comprehensive Land Use Plan for the SBIA.
Policy 2.9.6: As required by State Law for real estate transactions within the Airport Influence Area, as shown on Figure LU-4, require notification/disclosure statements to alert potential buyers and tenants of the presence of and potential impacts from the San Bernardino International Airport.
Circulation Element
Proposed General Plan policies related to design of roadways, safety, and the elimination/mitigation of impacts:
Policy 6.3.3: Require that all City streets be constructed in accordance with the Circulation Plan (Figure C-2) and the standards established by the Development Services Director.
Policy 6.3.4: Require appropriate right-of-way dedications of all new developments to facilitate construction of roadways shown on the Circulation Plan.
Policy 6.3.5: Limit direct access from adjacent private properties to arterials to maintain an efficient and desirable quality of traffic flow.

5. Environmental Analysis
General Plan Update and Associated Specific Plans EIR City of San Bernardino • Page 5.14-29
Policy 6.3.6: Locate new development and their access points in such a way that traffic is not encouraged to utilize local residential streets and alleys.
Policy 6.3.7: Require that adequate access be provided to all developments in the City including secondary access to facilitate emergency access and egress
Proposed General Plan policies related to mass transit and rail:
Policy 6.6.1: Support the efforts of regional, state, and federal agencies to provide additional local and express bus service in the City.
Policy 6.6.2: Create a partnership with Omnitrans to identify public transportation infrastructure needs that improve mobility.
Policy 6.6.3: In cooperation with Omnitrans, require new development to provide transit facilities, such as bus shelters and turnouts, as necessary and warranted by the scale of the development.
Policy 6.6.4: Ensure accessibility to public transportation for seniors and persons with disabilities.
Policy 6.6.5: In cooperation with Omnitrans, explore methods to improve the use, speed, and efficiency for transit services. These methods might include dedicated or priority lanes/signals, reduced parking standards for selected core areas, and incorporating Intelligent Transportation System architecture.
Policy 6.6.6: Support and encourage the provision of a range of paratransit opportunities to complement bus and rail service for specialized transit needs.
Policy 6.6.7 Encourage measures that will reduce the number of vehicle-miles traveled during peak periods, including the following examples of these types of measures:
• Incentives for car-pooling and vanpooling. • Preferential parking for car-pools and vanpools. • Conveniently located bus stops with shelters. • An adequate, safe, and interconnected system of pedestrian and bicycle paths
Policy 6.6.8: Promote the use of car-pools and vanpools by providing safe, convenient park-and-ride facilities.
Policy 6.7.1: Accommodate railroad services that allow for the movement of people and goods while minimizing their impact on adjacent land uses.
Policy 6.7.2: Coordinate with SANBAG, SCAG, the County and other regional, state or federal agencies and the railroads regarding plans for the provision of passenger, commuter, and high-speed rail service.
Policy 6.7.3: Encourage the provision of a buffer between residential land uses and railway facilities and encourage the construction of sound walls or other mitigating noise barriers between railway facilities and adjacent land uses.
Policy 6.7.4: Identify existing and future high volume at-grade railroad crossings and pursue available sources of funding (e.g., California Public Utilities Commission) to implement grade separations where appropriate.
General Plan policies relating to parking:

5. Environmental Analysis
Page 5.14-30 • The Planning Center July 2005
Policy 6.9.1: Ensure that developments provide an adequate supply of parking to meet the needs, on-site or within close proximity to the developments generating the demand for parking.
Policy 6.9.2: Study the parking standards in the Development Code to determine if they accurately reflect demand and if adequate flexibility is available to accommodate certain situations, such as shared parking, senior housing, or transit oriented developments.
Policy 6.9.3: Require that all new developments provide adequate parking to meet their parking demands on-site or in consolidated parking facilities within close proximity to their site, except for developments within the Central City Parking District.
Policy 6.9.4: Continue to expand the supply of public parking in off-street parking facilities in downtown San Bernardino.
Policy 6.9.5: Continue to provide an in-lieu parking fee option for developments in the downtown area to satisfy all or part of their parking requirement through the payment of an in-lieu fee which will be utilized to provide parking in consolidated public parking facilities.
Policy 6.9.6: Require that new developments submit a parking demand analysis to the City Engineer for review and approval whenever a proposal is made to provide less than the full code requirement of parking for each individual land use on-site at the proposed development.
Policy 6.9.7: Consider all concepts relating to joint use, shared parking, and off-peak demand to maximize the utilization of existing and proposed parking in the Central Business District.
Policy 6.9.8: Develop parking and traffic control plans for those neighborhoods adversely impacted by spillover parking and traffic.
5.14.3.2 Arrowhead Springs Specific Plan
The traffic analysis for the Arrowhead Springs Specific Plan was calculated for two phases of development. Phase one was assumed to be completed by the year 2007, prior to construction of the secondary access shown on figures as (Arrowhead Springs) Village Parkway or improvements to Harrison Boulevard. Until construction of Village Parkway, traffic to/from Arrowhead Springs would use the existing external circulation network by accessing the development from SR-18. Within Arrowhead Springs, site-specific roadway and intersection improvements would be completed based on project-related impacts expected with Phase one traffic volumes. Therefore, roadway and intersection traffic analysis was conducted separately for Phase one development and the 2030 build-out development, which includes completion of Village Parkway. This analysis is very conservative in that development included in Phase I for the traffic analysis would in fact take longer than the year 2007.
AHS IMPACT 5.15-1: PROJECT-RELATED TRIP GENERATION WOULD IMPACT LEVELS OF SERVICE FOR THE EXISTING AREA ROADWAY SYSTEM. [THRESHOLD T-1]
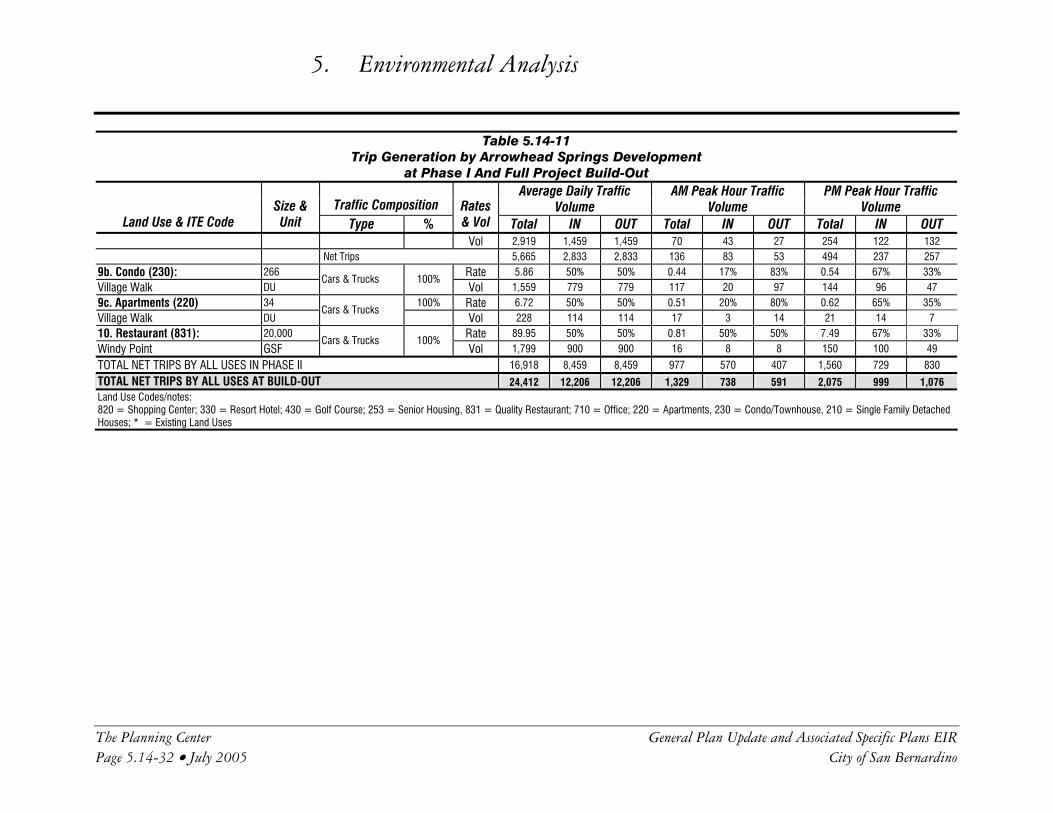
Impact Analysis: At build-out, the Arrowhead Springs Specific Plan is expected to generate approximately 24,412 new vehicular trips per day on an average weekday, of which approximately 1,329 trips would be during the AM commuter peak hour (one hour between 7 a.m. and 9 a.m.) and 2,075 trips will be during the PM commuter peak hour (one hour between 4:00 p.m. and 6:00 p.m.). These estimates are based on the proposed land uses for the Arrowhead Springs development and trip generation rates for these land uses published by the Institute of Transportation Engineers (ITE, 2004) and other applicable trip generation data and information. Table 5.14-11 shows traffic generation estimates for the Arrowhead Springs development.

5. Environmental Analysis
The Planning Center General Plan Update and Associated Specific Plans EIR Page 5.14-31 • July 2005 City of San Bernardino
Table 5.14-11
Trip Generation by Arrowhead Springs Development at Phase I And Full Project Build-Out
Traffic Composition Average Daily Traffic
Volume AM Peak Hour Traffic
Volume PM Peak Hour Traffic
Volume Land Use & ITE Code
Size & Unit Type %
Rates & Vol Total IN OUT Total IN OUT Total IN OUT
PHASE I 1a. Hotel and Spa (330)*: 193 Rate 8.00 50% 50% 0.37 72% 28% 0.49 43% 57%
Conf.Ctr./Bungalows/Spa Room Cars & Trucks 100%
Vol 1,544 772 772 71 51 20 95 41 54 1b. Hotel (330): 115 Rate 8.00 50% 50% 0.37 72% 28% 0.49 43% 57%
Annex Room Cars & Trucks 100%
Vol 920 460 460 43 31 12 56 24 32 3a. Condo (230): 285 Rate 5.86 50% 50% 0.44 17% 83% 0.54 67% 33% Townhomes/ Hilltown DU
Cars & Trucks 100% Vol 1,670 835 835 125 21 104 154 103 51
3b. Commercial (820): Rate 42.92 50% 50% 1.03 61% 39% 3.74 48% 52%
Golf-related:22,000 sf 34,167 Cars & Trucks 100%
Vol 1,466 733 733 35 21 14 128 61 66 Chapel*: 1,500 sf GSF Rate 14.59 50% 50% 0.35 61% 39% 1.27 48% 52%
Spring House*: 2,667 sf Pass-By Trips 34%
Vol 499 249 249 12 7 5 43 21 23 Hilltown Shops: 8,000 sf Net Trips 968 484 484 23 14 9 84 40 44
199 Rate 5.04 50% 50% 0.21 74% 26% 0.30 34% 66% 4. Golf Course (430)
Acre Cars & Trucks 100%
Vol 1,003 501 501 42 31 11 60 20 39 5a. Estate Homes (210): 24 Rate 9.57 50% 50% 0.75 25% 75% 1.01 64% 36% Res. North DU
Cars & Trucks 100% Vol 230 115 115 18 5 14 24 16 9
6a. Estate Homes (210): 12 Rate 9.57 50% 50% 0.75 25% 75% 1.01 64% 36% Res. South DU
Cars & Trucks 100% Vol 115 57 57 9 2 7 12 8 4
300 Rate 3.48 50% 50% 0.07 63% 37% 0.10 59% 41% 6b. Senior Housing (253)
DU Cars & Trucks 100%
Vol 1,044 522 522 21 13 8 30 18 12
PHASE II 5b. Condo (230): 429 Rate 5.86 50% 50% 0.44 17% 83% 0.54 67% 33% Townhomes/ Res. North DU
Cars & Trucks 100% Vol 2,514 1,257 1,257 189 32 157 232 155 76
7. Hotel (330): 300 Rate 8.00 50% 50% 0.37 72% 28% 0.49 43% 57%
IHEI Room Cars & Trucks 100%
Vol 2,400 1,200 1,200 111 80 31 147 63 84 250,000 Rate 11.01 50% 50% 1.56 88% 12% 1.49 17% 83%
8. Office (710) GSF
Cars & Trucks 100% Vol 2,753 1,376 1,376 390 343 47 373 63 309
9a. Commercial (820): Rate 42.92 50% 50% 1.03 61% 39% 3.74 48% 52% Village Walk:200,000 sf 200,000
Cars & Trucks 100% Vol 8,584 4,292 4,292 206 126 80 748 359 389
GSF Pass-By Trips 34% Rate 14.59 50% 50% 0.35 61% 39% 1.27 48% 52%
5. Environmental Analysis
The Planning Center General Plan Update and Associated Specific Plans EIR Page 5.14-32 • July 2005 City of San Bernardino
Table 5.14-11 Trip Generation by Arrowhead Springs Development
at Phase I And Full Project Build-Out
Traffic Composition Average Daily Traffic
Volume AM Peak Hour Traffic
Volume PM Peak Hour Traffic
Volume Land Use & ITE Code
Size & Unit Type %
Rates & Vol Total IN OUT Total IN OUT Total IN OUT
Vol 2,919 1,459 1,459 70 43 27 254 122 132 Net Trips 5,665 2,833 2,833 136 83 53 494 237 257 9b. Condo (230): 266 Rate 5.86 50% 50% 0.44 17% 83% 0.54 67% 33% Village Walk DU
Cars & Trucks 100% Vol 1,559 779 779 117 20 97 144 96 47
9c. Apartments (220) 34 100% Rate 6.72 50% 50% 0.51 20% 80% 0.62 65% 35% Village Walk DU
Cars & Trucks Vol 228 114 114 17 3 14 21 14 7
10. Restaurant (831): 20,000 Rate 89.95 50% 50% 0.81 50% 50% 7.49 67% 33%
Windy Point GSF Cars & Trucks 100%
Vol 1,799 900 900 16 8 8 150 100 49
TOTAL NET TRIPS BY ALL USES IN PHASE II 16,918 8,459 8,459 977 570 407 1,560 729 830
TOTAL NET TRIPS BY ALL USES AT BUILD-OUT 24,412 12,206 12,206 1,329 738 591 2,075 999 1,076 Land Use Codes/notes: 820 = Shopping Center; 330 = Resort Hotel; 430 = Golf Course; 253 = Senior Housing, 831 = Quality Restaurant; 710 = Office; 220 = Apartments, 230 = Condo/Townhouse, 210 = Single Family Detached Houses; * = Existing Land Uses

5. Environmental Analysis
General Plan Update and Associated Specific Plans EIR City of San Bernardino • Page 5.14-33
Figure 5.14-2 illustrates the distribution of traffic from the project and how traffic disperses at any given intersection after the construction of Village Parkway. Appendix H of Volume III contains specific information on the number trips dispersed along these roadways.
Table 5.14-12 shows the results of roadway LOS analysis with and without Phase one development by 2007.
Table 5.14-12
2007 Average Daily Traffic (ADT) Volumes and LOS on Roadways Within the Arrowhead Springs Study Area
2007 W/O Project Conditions
2007 With Project Conditions
Roadways Facility Type No. of Lanes
Capacity, Veh/Day
(C )
Volume, Veh/Day
(V) V/C
Ratio LOS
Volume, Veh/Day
(V) V/C
Ratio LOS
Diff. in V/C by Project
Highway 18 N/O Waterman Avenue
Major Arterial 4 40,000 20,730 0.518 A 27,474 0.687 B 0.169
Waterman Avenue S/O 40th Street Major Arterial 4 40,000 18,544 0.464 A 23,789 0.595 A 0.131
Waterman Avenue N/O 30th Street Major Arterial 4 40,000 22,918 0.573 A 28,163 0.704 B 0.131
40th Street E/O Waterman Avenue
Major Arterial 4 40,000 10,962 0.274 A 11,711 0.293 A 0.019
Harrison Street S/O 40th Street
Secondary Arterial
2 12,000 1,037 0.086 A 1,412 0.118 A 0.031
Sterling Avenue S/O Foothill Drive
Major Arterial 2 15,000 1,631 0.109 A 2,006 0.134 A 0.025
Valencia Avenue S/O 40th Street
Secondary Arterial
2 12,000 4,439 0.370 A 4,439 0.370 A 0.000
Valencia Avenue N/O 30th Street
Secondary Arterial
2 12,000 4,666 0.389 A 4,666 0.389 A 0.000
Note: A 2% per year traffic growth factor was assumed through year 2025 due to normal traffic growth in the area. The 2% yearly growth rate assumption was made per discussion with City staff. Bold typeface indicates CMP roadway.

5. Environmental Analysis
Page 5.14-34 • The Planning Center July 2005
This page intentionally left blank.

NOT TO SCALE
5. Environmental Analysis
San Bernardino General Plan Update and Associated Specific Plans EIR The Planning Center • Figure 5.14-2
Arrowhead Springs Trip Distribution
5. Environmental Analysis
Page 5.14-36 • The Planning Center July 2005
This page intentionally left blank.

5. Environmental Analysis
General Plan Update and Associated Specific Plans EIR City of San Bernardino • Page 5.14-37
Table 5.14-13 below shows the results of intersection LOS analysis with and without Phase one development by 2007.
Table 5.14-13 Intersection Level of Service Summary
(Future 2007 Conditions With and Without Project Phase I) 2007 Conditions Without Project 2007 Conditions With Phase I
Intersection Peak Hour LOS Delay V/C LOS Delay V/C AM C 26.8 0.670 C 26.5 0.677 Waterman Avenue at 40th Street PM C 25.2 0.528 C 26.0 0.599 AM B 11.2 0.641 B 11.0 0.693 Waterman Avenue at Parkdale Drive PM B 11.7 0.543 B 11.2 0.604 AM E 45.1 – F 64.9 – Waterman Avenue at 36th Street
(Unsignalized) PM D 26.9 – E 43.7 – AM F 81.1 – A 1.3 – Waterman Avenue at 34th Street
(Unsignalized) PM F 55.9 – F 73.6 – AM A 3.4 0.544 A 3.5 0.586 Waterman Avenue at Marshall
Boulevard PM A 4.2 0.486 A 4.1 0.547 AM C 29.0 0.843 C 30.7 0.885 Waterman Avenue at 30th Street PM C 24.2 0.693 C 24.8 0.725 AM – – – B 12.3 0.460 Valencia Avenue at 40th Street PM – – – C 19.0 0.653 AM NA – – C 21.5 0.335 Village Parkway at 40th Street PM NA – – C 20.2 0.493 AM B 12.8 – B 13.0 – Harrison Street at 40th Street
(Unsignalized) PM B 14.4 – B 14.7 – AM B 11.9 – B 12.1 – Del Rosa Avenue at Foothill Boulevard
(Unsignalized) PM B 12.3 – B 12.5 – AM A 7.9 0.176 A 7.9 0.179 Sterling Avenue at Foothill Boulevard PM A 8.0 0.149 A 8.1 0.154 AM – – – B 14.9 0.54
Valencia Avenue at 30th Street PM – – – B 15.0 0.280 AM B 15.1 0.308 B 15.1 0.310 Del Rosa Avenue at Lynwood Drive PM B 14.2 0.374 B- 14.1 0.377 AM B 14.1 0.509 B 14.0 0.545 Sterling Avenue at Lynwood Drive PM B 12.6 0.437 B 14.2 0.513 AM B 12.4 – B 12.4 – 30th Street at Lynwood Drive
(Unsignalized) PM A 7.5 – A 7.5 –
The following intersections are expected to be impacted by Phase I Project related traffic:
• Waterman Avenue and 36th Street • Waterman Avenue and 34th Street

5. Environmental Analysis
Page 5.14-38 • The Planning Center July 2005
Table 5.14-14 shows the results of roadway LOS analysis with and without Project build-out by 2030.
Table 5.14-14
2030 Average Daily Traffic (ADT) Volumes and LOS on Roadways in the Arrowhead Springs Study Area
2030 W/O Project Conditions
2030 With Project Conditions
Roadways Facility Type No. of Lanes
Capacity, Veh/Day
(C)
Volume, Veh/Day
(V) V/C
Ratio LOS
Volume, Veh/Day
(V) V/C
Ratio LOS
Diff. in V/C by Project
40th Street E/O Waterman Avenue
Major Arterial 4 40,000 17,908 0.448 A 19,129 0.478 A 0.031
Harrison Street S/O 40th Street
Secondary Arterial
2 12,000 0 0.000 A NA NA NA NA
Harrison Parkway (40th Street to 30th Street with improvements)
Major Arterial 4 40,000 NA NA NA 18,309 0.458 A 0.458
Highway 18 N/O Waterman Avenue
Major Arterial 4 40,000 24,062 0.602 A 25,283 0.632 B 0.031
Village Parkway Major Arterial 4 40,000 0 0.000 A 20,750 0.519 A 0.519 Sterling Avenue S/O Foothill Drive
Major Arterial 2 15,000 2,166 0.144 A 3,387 0.226 A 0.081
Waterman Avenue N/O 30th Street Major Arterial 4 40,000 24,062 0.602 A 24,062 0.602 A 0.000
Waterman Avenue S/O 40th Street Major Arterial 4 40,000 24,062 0.602 A 24,062 0.602 A 0.000
Valencia Avenue N/O 30th Street
Secondary Arterial
2 12,000 5,039 0.420 A 6,259 0.522 A 0.102
Valencia Avenue S/O 40th Street
Secondary Arterial
2 12,000 4,794 0.399 A 6,015 0.501 A 0.102
Notes: The 2030 condition assumes that Harrison Street improvements have been constructed between 30th Street with 40th Street. The new roadway is projected to attract approximately 70% of existing traffic from Highway 18, 40th Street and Waterman Avenue. CMP roadway segments are shown in bold typeface. The project generated traffic is assumed to be distributed as follows: 15% to and from Highway 18 north of the site, 5% to and from 40th Street west of Waterman Avenue, 70% to and from SR-30 using the new roadway connecting 30th Street with 40th Street, and 10% to and from 40th Street east of the new roadway connecting the site with 40th Street. Without new roadway, project traffic will be distributed 75% to the west on 40th Street and 10% to the east on 40th Street (using Harrison Street, Del Rosa Avenue or Sterling Avenue).

5. Environmental Analysis
General Plan Update and Associated Specific Plans EIR City of San Bernardino • Page 5.14-39
Table 5.14-15 shows the results of intersection LOS analysis with and without Project build-out by 2030.
Table 5.14-15
Intersection Level of Service Summary (Build-out 2030 Conditions With and Without Project)
2030 Base Conditions 2030 Base + Project Conditions Intersection
Peak Hour LOS Delay V/C LOS Delay V/C AM A 9.7 – D 25.8 – 30th Street at Lynwood Drive
(Unsignalized) PM B 11.5 – F 185.3 – AM NA – – C 22.4 0.784 Village Parkway at 40th Street PM NA – – F 143.5 1.271 AM B 14.8 – C 15.7 – Del Rosa Avenue at Foothill
Boulevard(Unsignalized) PM C 17.5 – C 20.2 – AM B 16.6 0.558 B 16.5 0.564 Del Rosa Avenue at Lynwood Drive PM B 12.7 0.612 B 12.6 0.623 AM D 26.6 – F Overflow – Harrison Street (Harrison Parkway) at
40th Street (Unsignalized) PM F Overflow – F Overflow – AM A 8.1 0.245 A 8.2 0.253 Sterling Avenue at Foothill Boulevard PM B 10.2 0.419 B 10.4 0.436 AM B 11.2 0.366 B 11.2 0.372 Sterling Avenue at Lynwood Drive PM C 20.0 0.775 C 20.5 0.781 AM F 138.9 1.215 F 115.6 1.222 Waterman Avenue at 30th Street PM F 96.5 1.180 F 88.8 1.200 AM D 26.7 – D 27.5 – Waterman Avenue at 34th Street
(Unsignalized) PM F 110.6 – F 125.2 – AM F 54.8 – F 58.4 – Waterman Avenue at 36th Street
(Unsignalized) PM F 87.5 – F 99.1 – AM C 28.5 0.820 C 30.8 0.856 Waterman Avenue at 40th Street PM D 42.9 0.982 D 51.5 1.033 AM A 4.6 0.626 A 4.6 0.633 Waterman Avenue at Marshall
Boulevard PM A 5.0 0.633 A 5.0 0.644 AM A 3.7 0.553 A 3.7 0.559 Waterman Avenue at Parkdale Drive PM A 5.3 0.651 A 5.3 0.662 AM C 15.0 0.667 C 17.3 0.731 Valencia Avenue at 40th Street PM F 72.4 1.129 F 107.1 1.260 AM A 1.0 0.137 A 1.4 0.251 Valencia Avenue at 30th Street PM B 12.7 0.304 A 8.5 0.496
The following intersections are expected to be impacted by the Project related traffic at build-out:
• Waterman Avenue and 40th Street • Waterman Avenue and 36th Street • Waterman Avenue and 34th Street • Waterman Avenue and 30th Street • Harrison Parkway and 40th Street • 30th Street and Lynwood Drive • Village Parkway and 40th Street • Valencia Avenue and 40th Street
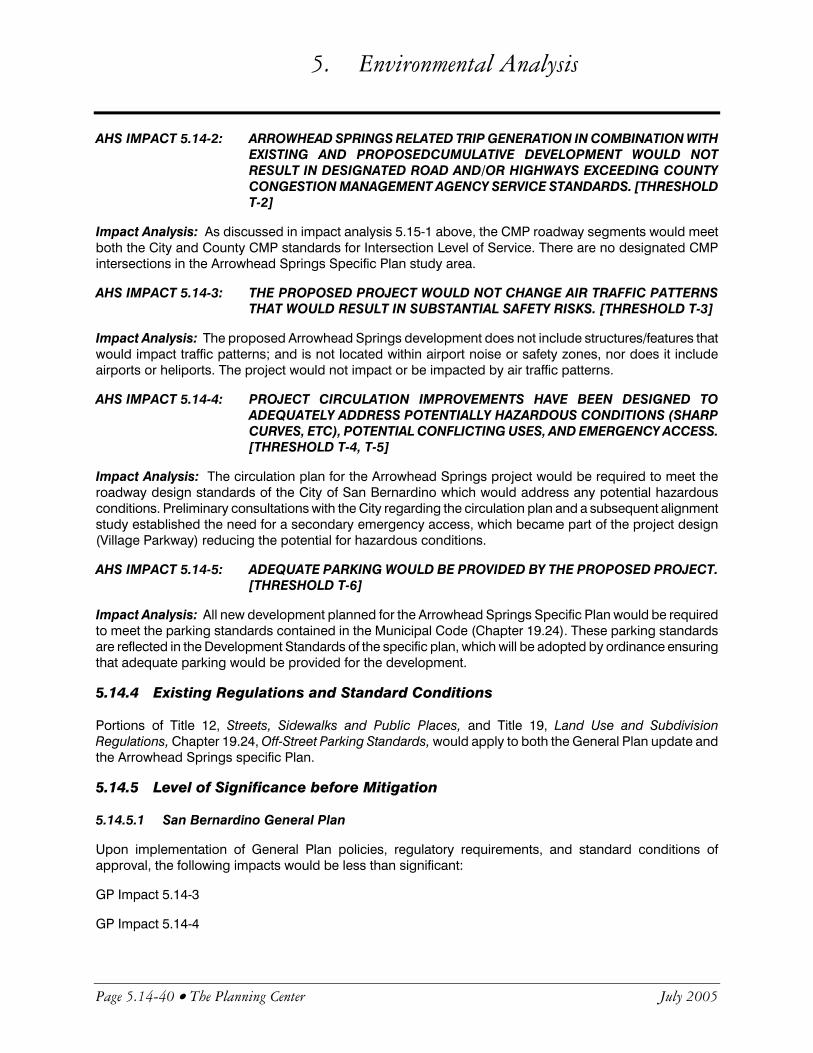
5. Environmental Analysis
Page 5.14-40 • The Planning Center July 2005
AHS IMPACT 5.14-2: ARROWHEAD SPRINGS RELATED TRIP GENERATION IN COMBINATION WITH EXISTING AND PROPOSEDCUMULATIVE DEVELOPMENT WOULD NOT RESULT IN DESIGNATED ROAD AND/OR HIGHWAYS EXCEEDING COUNTY CONGESTION MANAGEMENT AGENCY SERVICE STANDARDS. [THRESHOLD T-2]
Impact Analysis: As discussed in impact analysis 5.15-1 above, the CMP roadway segments would meet both the City and County CMP standards for Intersection Level of Service. There are no designated CMP intersections in the Arrowhead Springs Specific Plan study area.
AHS IMPACT 5.14-3: THE PROPOSED PROJECT WOULD NOT CHANGE AIR TRAFFIC PATTERNS THAT WOULD RESULT IN SUBSTANTIAL SAFETY RISKS. [THRESHOLD T-3]
Impact Analysis: The proposed Arrowhead Springs development does not include structures/features that would impact traffic patterns; and is not located within airport noise or safety zones, nor does it include airports or heliports. The project would not impact or be impacted by air traffic patterns.
AHS IMPACT 5.14-4: PROJECT CIRCULATION IMPROVEMENTS HAVE BEEN DESIGNED TO ADEQUATELY ADDRESS POTENTIALLY HAZARDOUS CONDITIONS (SHARP CURVES, ETC), POTENTIAL CONFLICTING USES, AND EMERGENCY ACCESS. [THRESHOLD T-4, T-5]
Impact Analysis: The circulation plan for the Arrowhead Springs project would be required to meet the roadway design standards of the City of San Bernardino which would address any potential hazardous conditions. Preliminary consultations with the City regarding the circulation plan and a subsequent alignment study established the need for a secondary emergency access, which became part of the project design (Village Parkway) reducing the potential for hazardous conditions.
AHS IMPACT 5.14-5: ADEQUATE PARKING WOULD BE PROVIDED BY THE PROPOSED PROJECT. [THRESHOLD T-6]
Impact Analysis: All new development planned for the Arrowhead Springs Specific Plan would be required to meet the parking standards contained in the Municipal Code (Chapter 19.24). These parking standards are reflected in the Development Standards of the specific plan, which will be adopted by ordinance ensuring that adequate parking would be provided for the development.
5.14.4 Existing Regulations and Standard Conditions
Portions of Title 12, Streets, Sidewalks and Public Places, and Title 19, Land Use and Subdivision Regulations, Chapter 19.24, Off-Street Parking Standards, would apply to both the General Plan update and the Arrowhead Springs specific Plan.
5.14.5 Level of Significance before Mitigation
5.14.5.1 San Bernardino General Plan
Upon implementation of General Plan policies, regulatory requirements, and standard conditions of approval, the following impacts would be less than significant:
GP Impact 5.14-3
GP Impact 5.14-4

5. Environmental Analysis
General Plan Update and Associated Specific Plans EIR City of San Bernardino • Page 5.14-41
GP Impact 5.14-5
Without mitigation, the following impacts would be significant:
GP Impact 5.14-1 Twelve intersections were determined to function at an unacceptable LOS of E or worse and 4 roadway segments were determined to function at an unacceptable LOS of D or worse at build-out of the General Plan. Numerous freeway segments would also function at and unacceptable LOS F.
GP Impact 5.14-2 One CMP intersection and one CMP roadway segment were determined to function at an unacceptable LOS of F as well as numerous freeway segments.
5.14.5.2 Arrowhead Springs Specific Plan
Upon implementation of regulatory requirements, and standard conditions of approval, the following impacts would be less than significant:
AHS Impact 5.14.2
AHS Impact 5.14.3
AHS Impact 5.14.4
AHS Impact 5.14.5
Without mitigation, the following impacts would be significant:
AHS Impact 5.14.1 Two intersections were determined to be impacted by Phase I traffic and 7 intersections would be impacted by full build-out of the project or by the year 2030. No roadway segments would be impacted after Phase I or full build-out of the project.
5.14.6 Mitigation Measures
5.14.6.1 San Bernardino General Plan
GP 5.14-1 Prior to adoption of the General Plan Update the City of San Bernardino shall add the following recommendations to the Circulation Element of the General Plan update:
• Signalize the intersection of Meridian Avenue @ Rialto Avenue. With signalization and permitted phasing the intersection will operate at LOS A during both peak hours.
• Signalize the intersection of Hunts Lane @ E Street. With signalization and protected phasing, and the addition of one NB left-turn lane the intersection will operate at LOS B and C during the AM and PM peak hours, respectively.
• Add an additional westbound right-turn lane at the intersection of Waterman Avenue @ 30th Street. With one additional WB right-turn lane the intersection will operate at LOS D and C during the AM and PM peak hours, respectively.

5. Environmental Analysis
Page 5.14-42 • The Planning Center July 2005
• Add an additional northbound right-turn lane at the intersection of Waterman Avenue @ SR-30 EB Ramps. With one additional NB right-turn lane and one additional EB left-turn lane the intersection will operate at LOS D during both peak hours.
• Signalize the intersection of SR-30 WB Off-ramp @ 30th Street. With signalization and protected phasing, the intersection will operate at LOS C during both peak hours.
• Signalize the intersection of Harrison Street @ 40th Street. With signalization and permitted phasing the intersection will operate at LOS A and C during the AM and PM peak hours, respectively.
• Signalize the intersection of Waterman Avenue @ 36th Street. With signalization and permitted phasing the intersection will operate at LOS A and B during the AM and PM peak hours, respectively.
• Signalize the intersection of Waterman Avenue @ 34th Street. With signalization and permitted phasing the intersection will operate at LOS A during both peak hours.
• Signalize the intersection of Valencia Avenue @ 40th Street. With signalization and permitted phasing the intersection will operate at LOS A during both peak periods.
• Add an additional westbound right-turn lane at the intersection of Del Rosa Avenue @ SR-30 WB Ramps. With one additional WB right-turn lane the intersection will operate at LOS B and C during AM and PM peak hours, respectively.
• Signalize the intersection of Tippecanoe Avenue @ Rialto Avenue. With signalization and permitted phasing the intersection will operate at LOS A and B during AM and PM peak hours, respectively.
• Signalize and add one northbound exclusive left-turn lane and one exclusive northbound right-turn lane at the intersection of Rancho Avenue @ 5th Street/Foothill Road. With signalization and E/W protective phasing, N/S split phasing, one NB exclusive left-turn lane and one NB exclusive right-turn lane the intersection will operate at C and D during AM and PM peak hours, respectively.
• Signalize and add one additional through lane in each direction at the intersection of Mount View Avenue @ San Bernardino Road. With signalization, protective phasing and one exclusive left, thru and right-turn lane in each direction, and EB right turn overlap phasing the intersection will operate at LOS C and D during AM and PM peak hours, respectively.
GP 5.14-2 The City of San Bernardino shall cooperate with regional transportation agencies toward mitigating impacts to regional transportation facilities by measures such as securing fair share contributions from future projects impacting mainline freeway
5. Environmental Analysis
General Plan Update and Associated Specific Plans EIR City of San Bernardino • Page 5.14-43
segments. Mitigation of impacts to regional transportation facilities would require the following freeway improvements:
• I-10 EB from Jct. I-21 to Waterman Avenue, add two lanes.
• I-10 WB from Jct. I-21 to Waterman Avenue, add one lane.
• I-10 EB and WB from Waterman Avenue to Tippecanoe Avenue, add two lanes each direction.
• I-10 EB and WB from Tippecanoe to Mountain View, add two lanes each direction.
• SR-30 EB from Highland Avenue to Jct. I-215, add two lanes.
• SR-30 WB from Highland Avenue to Jct. I-215, add one lane.
• SR-30 EB and WB from Jct. I-215 to H Street, add one lane each direction.
• SR-30 EB and WB from H Street to SR-259 add one lane each direction.
• SR-30 EB from SR-259 to Waterman Avenue, add one lane.
• I-215 NB and SB from Jct. 1-10 to Orange Show Road, add one lane.
• I-215 NB from Jct. SR 66 to Baseline Street, add three lanes.
• I-215 SB from Jct. SR 66 to Baseline Street, add two lanes.
• I-215 NB and SB from Jct. SR 66 to University Parkway, add one lane.
5.14.6.2 Arrowhead Springs Specific Plan
AHS 5.14-1A Prior to issuance of occupancy permits the project applicant shall be required to complete or bond for the costs of engineering and construction of the following project related traffic improvements or equivalent for Phase I (as detailed in the traffic study) impacts of 2007:
• Waterman Avenue @ 36th Street. Install signalization with permitted phasing.
• Waterman Avenue @ 34th Street. Install signalization with permitted phasing.
AHS 5.14-1B Prior to issuance of occupancy permits for Phase II (as detailed in the traffic study) and all phases thereafter the project applicant shall be required to complete or bond for the costs of engineering and construction of the following project related traffic improvements or equivalent for impacts due to full build-out of the project:
5. Environmental Analysis
Page 5.14-44 • The Planning Center July 2005
• Waterman Avenue @ 30th Street. Install protected phasing and one addi-tional WB right-turn lane, and one additional SB right-turn lane, both with overlap right-turn phasing.
• Harrison Parkway (new) @ 40th Street. Install signalization, permitted phasing and two NB left-turn lanes, one NB right-turn lane, an exclusive EB right-turn lane and an exclusive WB left-turn lane
• Waterman Avenue @ 36th Street. Install signalization and permitted phasing.
• 30th Street @ Lynwood Drive. Reconfigure intersection to align with new Harrison Parkway and install signal.
• Waterman Avenue @ 40th Street. Add an exclusive right-turn lane in each direction and westbound right-turn overlap phasing.
• Waterman Avenue @ 34th Street. Install signal and permitted phasing.
• Village Parkway @ 40th Street. Install signal with protected EW phasing and the intersection configuration of; two SB left-turn lanes, one SB right-turn lane, two EB thru-lanes, one EB left-turn lane, two WB thru-lanes and one WB right-turn lane.
5.14.7 Level of Significance After Mitigation
5.14.7.1 San Bernardino General Plan
Although the mitigation measures listed above would mitigate GP Impact 5.14-1, the following impact would remain significant:
• GP Impact 5.14-2
While potential impacts to the freeway mainline segments and ramps have been evaluated and mitigation measures suggested to reduce impacts, improvements to the freeway system are the responsibility of the existing regional transportation agencies and not the City of San Bernardino. Without the authority to implement the mitigation measures, the impact to freeway segments would remain significant and unavoidable requiring a statement of overriding considerations.
5.14.7.2 Arrowhead Springs Specific Plan
The mitigation measures identified above would reduce potential impacts associated with transportation and traffic to a level that is less than significant. Therefore, no significant unavoidable adverse impacts relating to transportation and traffic have been identified. Table 5.14-16 shows the results of intersection LOS analysis before and after mitigation measures for the year 2007.

5. Environmental Analysis
General Plan Update and Associated Specific Plans EIR City of San Bernardino • Page 5.14-45
Table 5.14-16
Before and After Mitigation Level of Service Summary 2007 Conditions
Conditions Before Mitigation Conditions After Mitigation Intersection
Peak Hour LOS Delay V/C LOS Delay V/C AM F 64.9 – A 3.8 0.572 Waterman Avenue at 36th Street PM E 43.7 – B 3.4 0.501 AM A 1.3 – A 3.3 0.569 Waterman Avenue at 34th Street PM F 73.6 – A 3.3 0.517
Note: Only those intersections operating at unacceptable LOS D, E or F were Mitigated per CMP guidelines.
Table 5.14-17 shows the results of intersection LOS analysis before and after above mitigation measures.
Table 5.14-17
Before and After Mitigation Level of Service Summary 2030 Conditions
Conditions Before Mitigation Conditions After Mitigation Intersection
Peak Hour LOS Delay V/C LOS Delay V/C AM C 30.8 0.856 C 27.1 0.764 Waterman Avenue at 40th Street PM D 51.5 1.033 C 32.1 0.881 AM F 58.4 – A 3.4 0.537 Waterman Avenue at 36th Street PM F 99.1 – B 11.4 0.782 AM D 27.5 – A 2.8 0.544 Waterman Avenue at 34th Street PM F 125.2 – A 3.5 0.610 AM F 115.6 1.222 D 51.7 0.928 Waterman Avenue at 30th Street PM F 88.8 1.200 D 38.9 0.912 AM C 22.4 0.784 B 15.5 0.503 Village Parkway at 40th Street PM F 143.5 1.271 C 21.7 0.747 AM F Overflow – B 14.8 0.607 Harrison Parkway at 40th Street PM F Overflow – C 28.7 0.907 AM D 25.8 – A 8.9 – 30th Street at Lynwood Drive
(Unsignalized) PM F 185.3 – C 19.0 – Note: Only those intersections operating at unacceptable LOS D, E or F were Mitigated per CMP guidelines.

5. Environmental Analysis
Page 5.14-46 • The Planning Center July 2005
This page intentionally left blank.