510(k) SUBSTANTIAL EQUIVALENCE DETERMINATION INSTRUMENT ... · 1 510(k) SUBSTANTIAL EQUIVALENCE...
40
1 510(k) SUBSTANTIAL EQUIVALENCE DETERMINATION INSTRUMENT AND ASSAY TEMPLATE A. 510(k) Number: k111188 B. Purpose for Submission: New Device C. Measurand: pH, pO2, pCO2, sodium, potassium, ionized calcium, Hct, tHb, O2Hb, HHb, COHb, MetHb, SO2, lactic acid, glucose D. Type of Test: Quantitative E. Applicant: Roche Diagnostics Corporation F. Proprietary and Established Names: Cobas® b 123 POC System, Cobas® b 123 AutoQC Pack Tri-Level, Cobas® b 123 AutoCVC Pack, Roche COMBITROL PLUS B G. Regulatory Information: Product Code Classification Regulation Section Panel CHL Class II 21 CFR § 862.1120 Blood gases (pCO2, pO2) and blood pH test system 75 JGS Class II 21 CFR § 862.1665 Sodium test system 75 CEM Class II 21 CFR § 862.1600 Potassium test system 75 JFP Class II 21 CFR § 862.1145 75
Transcript of 510(k) SUBSTANTIAL EQUIVALENCE DETERMINATION INSTRUMENT ... · 1 510(k) SUBSTANTIAL EQUIVALENCE...

1
510(k) SUBSTANTIAL EQUIVALENCE DETERMINATION INSTRUMENT AND ASSAY TEMPLATE
A. 510(k) Number:
k111188
B. Purpose for Submission:
New Device
C. Measurand:
pH, pO2, pCO2, sodium, potassium, ionized calcium, Hct, tHb, O2Hb, HHb, COHb, MetHb, SO2, lactic acid, glucose
D. Type of Test:
Quantitative
E. Applicant:
Roche Diagnostics Corporation
F. Proprietary and Established Names:
Cobas® b 123 POC System, Cobas® b 123 AutoQC Pack Tri-Level, Cobas® b 123 AutoCVC Pack, Roche COMBITROL PLUS B
G. Regulatory Information:
Product Code
Classification Regulation Section Panel
CHL Class II 21 CFR § 862.1120
Blood gases (pCO2, pO2) and blood pH test
system
75
JGS Class II 21 CFR § 862.1665
Sodium test system
75
CEM Class II 21 CFR § 862.1600
Potassium test system
75
JFP Class II 21 CFR § 862.1145 75

2
Calcium test system GKF ass II 21 CFR § 864.5600
Hematocrit automated instrument
81
CGA Class II 21 CFR § 862.1345
Glucose test system
75
KHP Class I, meets
limitations of
exemptions
per 21 CFR §
862.9 (c)(9)
21 CFR § 862.1450
Lactic acid test system
75
KHG Class II 21 CFR § 864.7500
Whole blood hemoglobin assays (tHb)
81
GGZ Class II 21 CFR § 864.7500
Whole blood hemoglobin assays
(Oxyhemoglobin)
81
GKA Class II 21 CFR § 864.7500
Deoxyhemoglobin
81
GHS Class II 21 CFR § 864.7425
Carboxyhemoglobin
81
KHG Class II 21 CFR § 864.5620
Methemoglobin
81
GLY Class II 870.1230 Oximeter
Oxygen Saturation
81
JJY Class I,
reserved
21 CFR § 862.1660
Quality control material (assayed and
unassayed)
75
H. Intended Use:
1. Intended use(s):
See indications for use statements below.
2. Indication(s) for use:
3
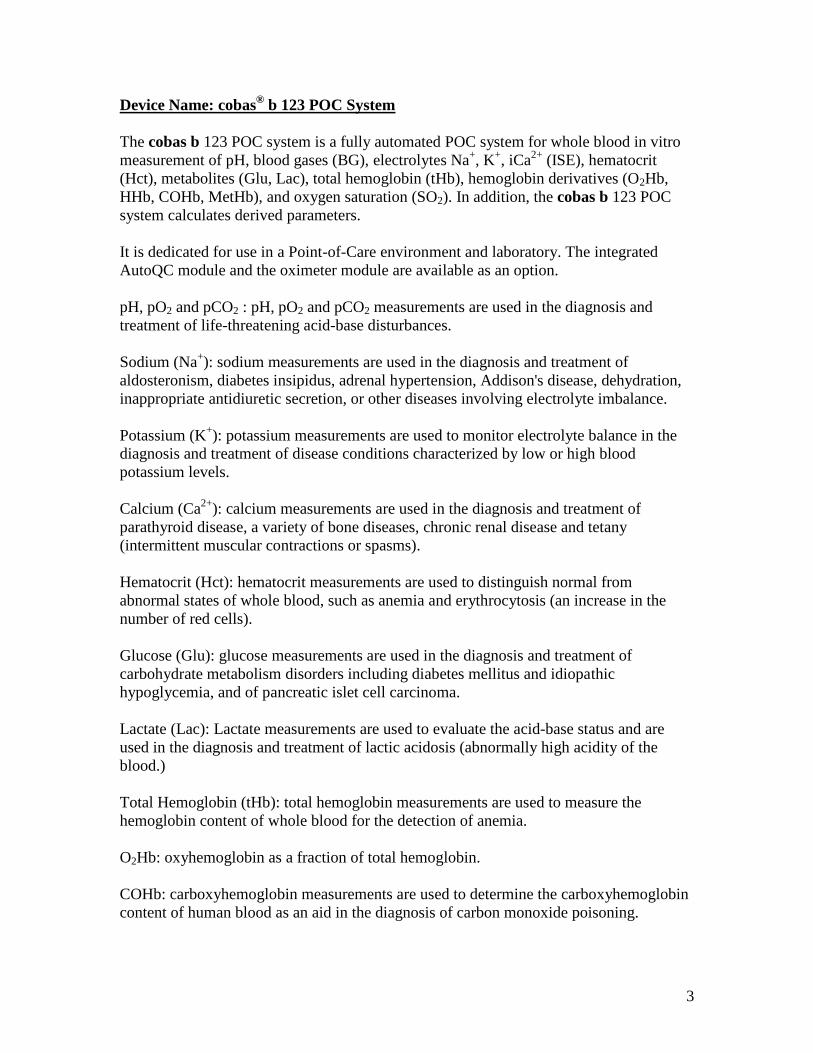
Device Name: cobas® b 123 POC System
The cobas b 123 POC system is a fully automated POC system for whole blood in vitro measurement of pH, blood gases (BG), electrolytes Na+, K+, iCa2+ (ISE), hematocrit (Hct), metabolites (Glu, Lac), total hemoglobin (tHb), hemoglobin derivatives (O2Hb, HHb, COHb, MetHb), and oxygen saturation (SO2). In addition, the cobas b 123 POC system calculates derived parameters.
It is dedicated for use in a Point-of-Care environment and laboratory. The integrated AutoQC module and the oximeter module are available as an option.
pH, pO2 and pCO2 : pH, pO2 and pCO2 measurements are used in the diagnosis and treatment of life-threatening acid-base disturbances.
Sodium (Na+): sodium measurements are used in the diagnosis and treatment of aldosteronism, diabetes insipidus, adrenal hypertension, Addison's disease, dehydration, inappropriate antidiuretic secretion, or other diseases involving electrolyte imbalance.
Potassium (K+): potassium measurements are used to monitor electrolyte balance in the diagnosis and treatment of disease conditions characterized by low or high blood potassium levels.
Calcium (Ca2+): calcium measurements are used in the diagnosis and treatment of parathyroid disease, a variety of bone diseases, chronic renal disease and tetany (intermittent muscular contractions or spasms).
Hematocrit (Hct): hematocrit measurements are used to distinguish normal from abnormal states of whole blood, such as anemia and erythrocytosis (an increase in the number of red cells).
Glucose (Glu): glucose measurements are used in the diagnosis and treatment of carbohydrate metabolism disorders including diabetes mellitus and idiopathic hypoglycemia, and of pancreatic islet cell carcinoma.
Lactate (Lac): Lactate measurements are used to evaluate the acid-base status and are used in the diagnosis and treatment of lactic acidosis (abnormally high acidity of the blood.)
Total Hemoglobin (tHb): total hemoglobin measurements are used to measure the hemoglobin content of whole blood for the detection of anemia.
O2Hb: oxyhemoglobin as a fraction of total hemoglobin.
COHb: carboxyhemoglobin measurements are used to determine the carboxyhemoglobin content of human blood as an aid in the diagnosis of carbon monoxide poisoning.

4
MetHb: methemoglobin as a fraction of total hemoglobin.
HHb: reduced hemoglobin as a fraction of total hemoglobin.
SO2: oxygen saturation, more specifically the ratio between the concentration of oxyhemoglobin and oxyhemoglobin plus reduced hemoglobin.
Device Name: cobas® b 123 AutoQC Pack Tri-Level
The cobas b 123 AutoQC pack Tri-Level is a multi-analyte control intended for use as control material to monitor the measurement of pH, PCO2, PO2, SO2, Na+, K+, iCa2+, Hct, tHb and Hb derivatives as well as glucose and lactate on cobas b 123 systems with an AutoQC module.
Device Name: cobas® b 123 AutoCVC Pack
The cobas b 123 AutoCVC Pack is a multi-analyte control, intended for use in calibration verification of the measuring range established by the cobas b 123 POC system for pH, PCO2, PO2, SO2, Na+, K+, iCa2+, Hct, tHb and Hb derivatives as well as glucose and lactate on cobas b 123 systems with an AutoQC module.
Device Name: Roche COMBITROL PLUS B
COMBITROL PLUS B is a multi-analyte control intended for use as control material to monitor the measurement of pH, PCO2, PO2, SO2, Na+, K+, iCa2+, Hct, tHb and Hb derivatives as well as glucose, lactate, urea/BUN and bilirubin on Roche OMNI S or cobas b 221 analyzers with an oximeter module, and cobas b 123 analyzers (except urea/BUN, and bilirubin). COMBITROL PLUS B control material is not intended for use with analyzers from other manufacturers.
3. Special conditions for use statement(s):
For prescription use.
For Point of Care
4. Special instrument requirements:
Cobas b 123 POC System
I. Device Description:
The cobas b 123 POC system consists of a modular system analyzer which contains the following components:

5
An electrochemical sensor system independent of the reagent delivery system for the following analytes:
· pCO2, pH, calcium, potassium, and sodium (potentiometric measurement) · pO2 (amperometric measurement) · Hct (conductivity measurement) · Glucose and Lactate enzyme (amperometric measurement)
An optionally integrated oximeter module consisting of a spectrometer, measurement and calibration light source, respectively, an ultrasonic hemolyzer and thermostatic components measure SO2, tHb, O2Hb, HHb, COHb, and MetHb
A disposable, self-contained sample and reagent delivery system containing liquid reagents, calibrators and waste container, built-in safety shielded sample port, built-in oximeter cuvette, two peristaltic pump fluidics systems, and built in air filter
The system also includes an optional integrated Auto QC module that uses a disposable cassette containing three levels of QC material.
A smart memory chip is incorporated into each biosensor, reagent pack (sample and reagent delivery system) and AutoQC cassette which tracks and monitors the sensor,reagent pack, AutoQC and AutoCVC cassette usage
Cobas b 123 AutoQC Pack Tri-Level:
· 24 single glass ampoules of multi-analyte controls in 3 levels
Cobas b 123 AutoCVC Pack:
· 24 single glass ampoules of multi-analyte controls in 6 levels
Roche COMBITROL PLUS B:
· Multi-analyte controls available in 3 levels
J. Substantial Equivalence Information:
The cobas b 123 POC System is equivalent to cobas b 221 (OMNI S Analyzer) k032311 for the following parameters:
· pH · pO2 · pCO2 · Na+ · K+

6
· Ca2+ · Hct · tHb · O2Hb · HHb · COHb · MetHb · SO2
The cobas b 123 POC system is equivalent to Roche Gluco-Quant Glucose/HK assay on the Hitachi 902 (k921661) and the Roche Glucose HK Assay on the cobas c 501 analyzer (k060373/A001) for the measurement of glucose.
The cobas b 123 POC system is equivalent to the Roche Lactate assay on the Hitachi 902 analyzer (k921661) and the Lactate Generation 2 (Gen.2) assay on the cobas c 501 analyzer (k060373) for the measurement of lactate.
The cobas b 123 AutoQC Pack Tri-Level, cobas b 123 AutoCVC Pack, and COMBITROL PLUS B materials are substantially equivalent to the Roche AUTOTROL PLUS B and Roche COMBITROL PLUS B materials – k032453.
Similarities between candidate and predicate devices:
Characteristic Candidate Device: cobas b 123 POC System
Predicate Device: cobas b 221 (k032311)
Intended Use The cobas b 123 POC system is a fully automated POC system to measure pH, blood gases (BG), electrolytes (ISE), hematocrit (Hct), metabolites (Glu, Lac), total hemoglobin (tHb), hemoglobin derivatives (O2Hb, HHb, COHb, MetHb), and oxygen saturation (SO2). In addition, the cobas b 123 POC system calculates derived parameters. It is dedicated for use in a Point-of-Care environment and laboratory. The integrated AutoQC module and the oximeter module are available as an option. Depending on the equipment configuration of the instrument, the Sensor Cartridge and the Fluid Pack used, the following parameters are measured in human whole blood and QC materials.
Same

7
Test Principle Enzymatic (Lactate) Enzymatic (Glucose)
Same
Blood Gas Measurement
pH and pCO2 by potentiometry
pO2 by amperometry
Same
Electrolyte Measurement
K+, Na+, and Ca2+ by potentiometry Same
Metabolite Measurement
Glucose and Lactate by amperometry Same
Hemoglobin Measurement
tHb, SO2, O2Hb, HHb, COHb, MetHb:Spectrophotometric
Same
Hematocrit Measurement
Conductivity Same
Sensor Technology Amperometric and potentiometric thick film microelectrode array technology for Glucose and Lactate
Same
Sample Introduction Syringe and capillary aspiration Same On-Board (In-Use) Reagent Stability
Up to 42 days Same
Reagent Tracking Memory chip technology for identification, lot specifications, usage tracking and traceability allowing pack to be moved from one system to another
Same
QC Material COMBITROL PLUS B (manual QC) and AUTOTROL PLUS B (automated QC)
Same
Calibration Two-point liquid calibration Same Graphical User Interface
Menu-driven touch screen Same
Additional Analyzer Hardware
Hard drive and printer Same
Operating System Software
Linux-based Same
System Operating Temperature
15-32°C Same

8
Characteristic Candidate Device cobas b 123 AutoQC Pack Tri-Level
Predicate Device Roche AUTOTROL PLUS B (k032453)
Intended use Intended for use as a quality control material
same
Number of Levels 3 Same Matrix Buffered, aqueous
electrolyte solution equilibrated with carbon dioxide and oxygen gas mixture
Same
Technological Characteristics
The material consists of buffered aqueous electrolyte solutions with clinically relevant concentrations of the targeted analytes, tonometered with precision gas mixtures of carbon dioxide and oxygen to achieve pH and blood gas values that span the range of values typical for such products with the same intended use. A mixture of dyes is used to simulate absorbance of hemoglobin derivatives. Hematocrit is simulated by conductivity.
Same
Characteristic Candidate Device Modified COMBITROL PLUS B
Predicate Device Roche AUTOTROL PLUS B (k032453)
Intended Use intended for use as a quality control material
same
Number of Levels 3 Same Fill Volume 1.7 mL Same Matrix Buffered, aqueous
electrolyte solution equilibrated with carbon dioxide and oxygen gas mixture
Same
Technological Characteristics
The material consists of buffered aqueous electrolyte solutions with clinically relevant concentrations of
Same

9
the targeted analytes, tonometered with precision gas mixtures of carbon dioxide and oxygen to achieve pH and blood gas values that span the range of values typical for such products with the same intended use. A mixture of dyes is used to simulate absorbance of hemoglobin derivatives. Hematocrit is simulated by conductivity.
Characteristic Candidate Device cobas b
123 AutoCVC Pack Predicate Device Roche AUTOTROL PLUS B (k032453)
Intended use Intended for use as a quality control material
same
Matrix Buffered, aqueous electrolyte solution equilibrated with carbon dioxide and oxygen gas mixture
Same
Technological Characteristics
The material consists of buffered aqueous electrolyte solutions with clinically relevant concentrations of the targeted analytes, tonometered with precision gas mixtures of carbon dioxide and oxygen to achieve pH and blood gas values that span the range of values typical for such products with the same intended use. A mixture of dyes is used to simulate absorbance of hemoglobin derivatives. Hematocrit is simulated by conductivity.
Same

10
Differences between candidate and predicate devices: Characteristic Candidate Device cobas b
123 POC System Predicate Device cobas b 221 (k032311)
Sample Volume 123 µl 210 µl
Electrochemical Sensors pH, PO2, PCO2, K+, Na+,
Ca2+, Glucose, Reference
microelectrode array
sensor with up to 28 days
in-use life
Note: Sensors with Lactate
are stable up to 21 days.
pH, PO2, PCO2, K+, Na+, Cl,
Ca2+ Reference electrodes
with 6 to 16 months in-use
life, depending on the
electrode type.
Electrochemical sensor
storage stability
Sensor: 2°C – 8°C for 4
months
Sensor: 25°C for 18 or 24
months, depending on
electrode type
Auto QC Module AutoQC Module holds one
AutoQC Pack, which is
comprised of 24
AUTOTROL PLUS B tri-
level ampoules.
QC module holds 120
AUTOTROL PLUS B tri-
level ampoules.
Characteristic Candidate Device cobas b 123 POC System
Predicate Device Roche Hitachi Glucose HK Assays: Hitachi 902 (k921661) and cobas c 501 (k060373)
Sample Type Whole Blood Serum, plasma, urine, CSF,
and hemolysate
Measurement Principle Amperometric
measurement of the
detectable product (H2O2)
under a polarization voltage
of 350 mV.
UV photometric
measurement of the
detectable product
(NADPH) at 340 nm.
Characteristic Candidate Device cobas b 123 POC System
Predicate Device Roche Hitachi Lactate Assays: Hitachi 902 (k921661) and cobas c 501 (k060373)
Measurement Principle Amperometric
measurement of the
detectable product (H2O2)
under a polarization voltage
of 350 mV.
UV photometric
measurement of the
detectable product
(chromogen) at 340 nm.

11
Characteristic Candidate Device cobas b 123 AutoQC Pack Tri-Level
Predicate Device Roche AUTOTROL PLUS B (k032453)
Auto QC Pack The AutoQC Pack is comprised of 24 AUTOTROL PLUS B tri-level ampoules. The AutoQC Pack also contains a smart memory chip for tracking and traceability, allowing the pack to be moved from one system to another.
The QC Pack holds 120 AUTOTROL PLUS B tri-level ampoules. The QC Pack does not contain a smart memory chip.
Fill Volume 1.0 mL 1.7 mL
K. Standard/Guidance Document Referenced (if applicable):
1. EP5-A2: Evaluation of Precision Performance of Quantitative Measurement Methods; Approved Guideline
2. EP6-A: Evaluation of the Linearity of Quantitative Measurement Procedures: A Statistical Approach; Approved Guideline
3. EP7-A2: Interference Testing in Clinical Testing; Approved Guideline – Second
Edition
4. EP9-A2: Method Comparison and Bias Estimation Using Patient Samples;
Approved Guideline – Second Edition
5. EP17-A: Protocols for Determination of Limits of Detection and Limits of
Quantitation; Approved Guideline
6. IEC 61326-1: Electrical Equipment for Measurement, Control and Lab Use-EMC
Requirements (Part 1: General Requirements)
7. IEC 61326-2: Electrical Equipment for Measurement, Control and Lab Use- EMC
Requirements (Part 2-6: IVD Equipment)
L. Test Principle:
The cobas b 123 POC system measures the analytes pH, K+, Ca2+, and Na+ use
potentiometric sensors which transmit direct signals that relate the content of the
sample to be measured. A reference electrode is used to provide a stable, fixed

12
potential against which other potential differences can be measured.
Amperometry is used to measure glucose, lactate, and pO2. For this method of measurement, the magnitude of an electrical flow of current proportional to the concentration of the substance being oxidized or reduced at an electrode results in a measurement of glucose, lactate, and pO2 in the blood.
Spectrophotometry is used to measure the analytes: tHb, SO2, O2Hb, HHb, COHb, MetHb. For this method, light passes through the blood samples; specific wavelengths are absorbed and their intensity generates an absorption spectrum used to calculate oximetry parameters.
M. Performance Characteristics (if/when applicable):
All performance studies were conducted on the cobas b 123 POC system.
1. Analytical performance:
a. Precision/Reproducibility:
A precision study was performed following CLSI EP5-A2 guidance. Within –
run and total precision were conducted using control materials and/or
tonometered whole blood samples in duplicate in two runs per day for 20 days
(N=80). Testing was conducted using the cobas b 123 POC syringe mode.
Results of the precision studies are as follows:
pH Precision Data
Sample Mean (pH Units)
N Within run SD
Within run % CV
Total imprecision SD
Total Imprecision %CV
Level 1 7.149 80 0.007 0.04 0.020 0.08
Level 2 7.393 80 0.007 0.02 0.020 0.06
Level 3 7.543 80 0.007 0.02 0.020 0.06
Level 4 6.883 80 0.012 0.02 0.028 0.12
Level 5 7.731 80 0.014 0.02 0.033 0.08
pO2 Precision Data
Sample Mean (mmHg)
N Within run SD
Within run % CV
Total imprecision SD
Total Imprecision %CV
Blood 1 145.4 80 1.629 0.51 3.039 2.23
Blood 2 40.5 80 1.974 1.70 3.306 6.09
Blood 3 352.2 80 6.614 0.59 12.553 2.49
Level 1 58.5 80 4.550 1.79 5.076 3.00

13
Level 2 98.7 80 4.775 1.69 5.358 3.57 Level 3 147.6 80 5.442 0.78 6.188 3.17 Level 4 28.9 80 6.595 6.32 7.643 8.31 Level 5 448.5 80 23.168 1.25 29.963 3.76
pCO2 Precision Data Sample Mean
(mmHg) N Within
run SD Within run % CV
Total imprecision SD
Total Imprecision %CV
Blood 1 23.5 80 1.150 0.50 1.725 2.21 Blood 2 72.7 80 1.570 0.51 2.180 3.18 Blood 3 128.6 80 5.047 1.39 6.868 2.61 Level 1 64.2 80 1.349 0.69 1.856 1.64 Level 2 41.9 80 1.151 0.64 1.656 1.44 Level 3 25.7 80 1.007 0.36 1.510 1.69 Level 4 123.5 80 4.729 0.60 6.412 2.70 Level 5 19.2 80 1.578 0.75 2.368 2.12
Na Precision Data Sample Mean
(mmHg) N Within
run SD Within run % CV
Total imprecision SD
Total Imprecision %CV
Level 1 117.4 80 1.337 0.34 1.957 0.44 Level 2 141.0 80 1.536 0.11 2.304 0.35 Level 3 153.7 80 1.740 0.29 2.610 0.52 Level 4 113.2 80 1.557 0.16 2.208 0.65 Level 5 177.5 80 2.336 0.11 3.373 0.69
K Precision Data Sample Mean
(mmHg) N Within
run SD Within run % CV
Total imprecision SD
Total Imprecision %CV
Level 1 2.98 80 0.051 0.37 0.102 0.57 Level 2 4.72 80 0.066 0.15 0.134 0.37 Level 3 7.01 80 0.088 0.32 0.177 0.74 Level 4 9.25 80 0.153 0.16 0.352 1.26 Level 5 2.02 80 0.088 0.30 0.198 1.44

14
iCa Precision Data Sample Mean
(mg/dL) N Within
run SD Within run % CV
Total imprecision SD
Total Imprecision %CV
Level 1 6.80 80 0.040 0.61 0.067 0.77 Level 2 4.80 80 0.030 0.24 0.050 0.37 Level 3 2.64 80 0.030 0.74 0.050 0.92 Level 4 8.63 80 0.062 0.25 0.103 0.78 Level 5 1.60 80 0.030 0.63 0.050 1.89
Hct Precision Data Sample Mean
(%) N Within
run SD Within run % CV
Total imprecision SD
Total Imprecision %CV
Level 1 58.9 80 0.978 0.24 1.467 0.80 Level 2 40.9 80 0.617 0.21 0.926 1.05 Level 3 32.5 80 0.451 0.22 0.676 1.06 Level 5 19.0 80 1.783 0.38 2.676 1.18 Level 6 63.6 80 1.718 0.09 2.576 0.75
Glucose Precision Data Sample Mean
(mg/dL) N Within
run SD Within run % CV
Total imprecision SD
Total Imprecision %CV
Level 1 111 80 0.126 0.59 0.304 1.67 Level 2 47.3 80 0.104 0.85 0.177 2.23 Level 3 454.5 80 0.302 0.37 1.253 2.29 Level 5 45.5 80 0.103 0.91 0.176 3.55 Level 6 510 80 0.329 0.77 1.307 2.77
Lactate Precision Data
Sample Mean (mg/dL)
N Within run SD
Within run % CV
Total imprecision SD
Total Imprecision %CV
Level 1 96 80 0.36 0.37 2.24 2.34
Level 2 29 80 0.07 0.24 0.58 2.03
Level 3 15 80 0.05 0.32 0.42 2.65
Level 5 57 80 0.59 1.04 1.34 2.37
Level 6 128 80 0.92 0.72 3.83 3.00

15
tHb Precision Data Sample Mean
(g/dL) N Within
run SD Within run % CV
Total imprecision SD
Total Imprecision %CV
Level 1 7.1 80 0.135 0.66 0.174 2.29 Level 2 11.5 80 0.172 0.72 0.222 1.12 Level 3 19.6 80 0.294 0.82 0.344 1.21 Level 5 6.1 80 0.131 0.60 0.166 2.12 Level 6 21.7 80 0.335 0.63 0.402 1.06
O2Hb Precision Data Sample Mean
(%) N Within
run SD Within run % CV
Total imprecision SD
Total Imprecision %CV
Level 1 48.3 80 1.000 0.25 1.500 0.54 Level 2 75.8 80 1.000 0.55 1.500 0.63 Level 3 92.0 80 1.000 0.40 1.500 0.42 Level 5 42.1 80 1.000 0.28 1.500 0.49 Level 6 94.3 80 1.000 0.40 1.500 0.39
HHb Precision Data Sample Mean
(%) N Within
run SD Within run % CV
Total imprecision SD
Total Imprecision %CV
Level 1 17.6 80 1.000 0.24 1.500 0.52 Level 2 8.2 80 1.000 1.78 1.500 2.02 Level 3 2.7 80 1.000 4.73 1.500 4.92 Level 5 19.7 80 1.000 0.21 1.500 0.37 Level 6 1.9 80 1.000 6.88 1.500 6.58
COHb Precision Data Sample Mean
(%) N Within
run SD Within run % CV
Total imprecision SD
Total Imprecision %CV
Level 1 22.4 80 0.350 0.24 0.510 0.52 Level 2 10.4 80 0.250 1.78 0.500 2.03 Level 3 3.5 80 0.250 4.63 0.500 4.82 Level 5 25.1 80 0.350 0.21 0.520 0.37 Level 6 2.5 80 0.250 6.65 0.500 6.36

16
MetHb Precision Data Sample Mean
(%) N Within
run SD Within run % CV
Total imprecision SD
Total Imprecision %CV
Level 1 11.7 80 0.286 0.21 0.545 0.46 Level 2 5.7 80 0.250 1.49 0.500 1.70 Level 3 2.0 80 0.250 3.98 0.500 4.13 Level 5 13.1 80 0.314 0.18 0.583 0.33 Level 6 1.4 80 0.250 5.67 0.500 5.41
SO2 Precision Data Sample Mean
(%) N Within
run SD Within run % CV
Total imprecision SD
Total Imprecision %CV
Level 1 73.4 80 1.500 0.13 2.000 0.28 Level 2 90.3 80 1.500 0.23 2.000 0.26 Level 3 97.1 80 1.500 0.15 2.000 0.15 Level 5 68.2 80 1.500 0.16 2.000 0.27 Level 6 98.0 80 1.500 0.15 2.000 0.14
An additional precision study was performed between the syringe mode and the capillary mode using whole blood samples. The syringe mode results provided by the sponsor demonstrated comparable results to the capillary mode. Within-run precision for all analytes (parameters) for the capillary mode are summarized below:
Analyte Unit of Measure
Sample Capillary
Mean SR CV (%) n
pH pH Units 1 7.18 0.003 0.04 24 2 7.36 0.002 0.02 32
pO2 mmHg 1 75.42 0.31 0.40 24 2 132.75 1.349 1.00 32
pCO2 mmHg 1 68.13 0.192 0.28 24 2 31.43 0.199 0.63 32
Na+ mEq/L
1 98.77 0.485 0.5 12 2 113.51 0.187 0.2 12 3 141.34 0.676 0.5 12 4 160.68 0.498 0.3 12 5 183.69 0.431 0.2 12
K+ mEq/L
1 2.08 0.020 1.0 12 2 4.88 0.048 1.0 12 3 3.93 0.019 0.5 12 4 12.48 0.041 0.3 12 5 19.40 0.042 0.2 12

17
iCa2+ mg/dL
1 2.20 0.020 0.9 12 2 4.88 0.036 0.8 12 3 11.69 0.108 0.9 12 4 7.13 0.024 0.3 12
Hct %
1 64.81 0.123 0.20 8 2 49.97 0.305 0.61 8 3 42.10 0.080 0.20 8 4 28.70 0.062 0.20 8 5 20.39 0.134 0.70 8
Glucose mg/dL
1 101.44 0.025 0.5 8 2 71.71 0.031 0.8 8 3 81.08 0.032 0.7 8 4 49.55 0.008 0.3 8 5 274.05 0.071 0.5 8
Lactate mg/dL
1 24.68 0.033 1.2 12 2 34.77 0.034 0.9 12 3 28.92 0.052 1.6 12 4 59.82 0.028 0.4 12 5 53.96 0.047 0.8 12
tHb g/dL 1 15.49 0.182 1.18 24 2 6.94 0.071 1.02 20 3 19.32 0.243 1.26 20
Whole blood precision study (capillary mode):
An additional precision study was conducted following guidance from CLSI EP5-A2. Whole blood was collected for use in an “in-house” precision study
and utilized twenty (20) cobas b 123 POC analyzers, two sensor lots, samples
tested in one run per day, in two replicates, and with samples at three
clinically significant concentrations. The following tables present a summary
of results:
Repeatability (Within-Run): Summary of Results for pH
Sample Mean
(pH Units) SD (pH Units)
CV (%)
n
Blood Sample 1 7.237 0.0029 0.04% 40 Blood Sample 2 7.441 0.0029 0.03% 40 Blood Sample 3 7.568 0.0054 0.07% 40
Repeatability (Within-Run): Summary of Results for pO2
Sample Mean
(mmHg) SD
(mmHg) CV (%) n
Blood 1 145.4 0.7404 0.51 80 Blood 2 40.5 0.6888 1.70 80 Blood 3 352.2 2.0866 0.59 80

18
Repeatability (Within-Run): Summary of Results for pCO2
Sample Mean (mmHg)
SD (mmHg) CV (%) n
Blood 1 23.5 0.1174 0.50 80 Blood 2 72.7 0.3728 0.51 80 Blood 3 128.6 1.7942 1.39 80
Repeatability (Within-Run): Summary of Results for Na+
Sample Mean (mEq/L)
SD(mEq/L)
CV (%)
n
Blood Sample 1 117.7 0.2845 0.24% 40 Blood Sample 2 138.6 0.2709 0.19% 40 Blood Sample 3 156.2 0.5890 0.37% 40
Repeatability (Within-Run): Summary of Results for K+
Sample Mean (mEq/L)
SD
(mEq/L) CV (%)
n
Blood Sample 1 3.05 0.0221 0.72% 40 Blood Sample 2 5.00 0.0148 0.29% 40 Blood Sample 3 6.10 0.0198 0.32% 40
Repeatability (Within-Run): Summary of Results for Ca2+
Sample Mean (mg/dL)
SD (mg/dL)
CV (%)
n
Blood Sample 1 2.90 0.03 1.065% 40 Blood Sample 2 4.74 0.04 0.79% 40 Blood Sample 3 5.60 0.07 1.25% 40
Repeatability (Within-Run): Summary of Results for Hct
Sample Mean (%)
SD
(%) CV (%)
n
Blood Sample 1 22.1 0.2461 1.11% 40 Blood Sample 2 38.5 0.1597 0.41% 40 Blood Sample 3 62.3 0.2370 0.38% 40

19
Repeatability (Within-Run): Summary of Results for Glucose
Sample Mean (mg/dL)
SD
(mg/dL) CV (%)
n
Blood Sample 1 47 1.1 2.28% 40 Blood Sample 2 90 1.1 1.27% 40 Blood Sample 3 488 2.8 0.56% 40
Repeatability (Within-Run): Summary of Results for Lactate
Sample Mean (mg/dL)
SD
(mg/dL) CV (%)
n
Blood Sample 1 8 0.10 1.18% 40 Blood Sample 2 13 0.09 0.69% 40 Blood Sample 3 32 0.51 1.56% 40
Repeatability (Within-Run): Summary of Results for tHb
Sample Mean (g/dL)
SD
(g/dL) CV (%)
n
Blood Sample 1 6.5 0.1058 1.62% 40 Blood Sample 2 12.9 0.0874 0.67% 40 Blood Sample 3 20.7 0.0703 0.33% 40
Repeatability (Within-Run): Summary of Results for O2Hb
Sample Mean (%)
SD
(%) CV (%)
n
Blood Sample 1 80.6 1.2296 1.52% 40 Blood Sample 2 94.5 0.5108 0.54% 40 Blood Sample 3 97.4 0.1342 0.13% 40
Repeatability (Within-Run): Summary of Results for HHb
Sample Mean (%)
SD
(%) CV (%)
n
Blood Sample 1 5.2 0.1828 3.51% 40 Blood Sample 2 9.5 0.2190 2.31% 40 Blood Sample 3 17.0 1.2248 7.20% 40
Repeatability (Within-Run): Summary of Results for COHb
Sample Mean (%)
SD
(%) CV (%)
n
Blood Sample 1 2.0 0.0946 4.73% 40 Blood Sample 2 5.4 0.0688 1.27% 40 Blood Sample 3 13.4 0.0894 0.66% 40

20
Repeatability (Within-Run): Summary of Results for MetHb
Sample Mean (%)
SD
(%) CV (%)
n
Blood Sample 1 1.3 0.0672 5.16% 40 Blood Sample 2 5.8 0.1125 1.93% 40 Blood Sample 3 30.7 0.3221 1.04% 40
Repeatability (Within-Run): Summary of Results for SO2
Sample Mean (%)
SD
(%) CV (%)
n
Blood Sample 1 82.6 1.2561 1.52% 40 Blood Sample 2 96.8 0.4976 0.51% 40 Blood Sample 3 99.7 0.1190 0.11% 40
A POC precision study was conducted at 6 external POC sites. The following table is a summary of precision studies conducted at the external POC sites using the cobas b 123 AutoQC Pack Tri-Level QC material:
QC
Level
Analyte Concentration
(Mean)
Within-Run (SD)
Within-Run
(% CV)
Total Precision
(SD)
Total Precision (% CV)
Ca
Level 1 6.85 mg/dL 0.01 mg/dL 0.17 0.04 mg/dL 0.37
Level 2 4.93 mg/dL 0.01 mg/dL 0.24 0.02 mg/dL 0.37
Level 3 2.69 mg/dL 0.02 mg/dL 0.57 0.04 mg/dL 0.81
K
Level 1 2.99 mEq/L 0.01 mEq/L 0.19 0.01
mEq/L 0.45
Level 2 4.71 mEq/L 0.01 mEq/L 0.2 0.01
mEq/L 0.26
Level 3 6.97 mEq/L 0.01 mEq/L 0.16 0.02
mEq/L 0.34
Na
Level 1 117.5 mEq/L 0.14 mEq/L 0.12 0.33
mEq/L 0.28
Level 2 140.4 mEq/L 0.24 mEq/L 0.17 0.34
mEq/L 0.24
Level 3 153.1 mEq/L 0.22 mEq/L 0.14 0.33
mEq/L 0.22
Glu
Level 1 110 mg/dL 0.72 mg/dL 0.66 1.4 mg/dL 1.29
Level 2 45 mg/dL 0.72 mg/dL 1.74 0.90 mg/dL 1.98
Level 3 443 mg/dL 2.3 mg/dL 0.55 6.3 mg/dL 1.49
Lac Level 1 94.6 mg/dL 0.54 mg/dL 0.56 1.4 mg/dL 1.51

21
Level 2 27.9 mg/dL 0.27 mg/dL 0.87 0.45 mg/dL 1.56
Level 3 15.3 mg/dL 0.18 mg/dL 1.21 0.36 mg/dL 2.43
Hct
Level 1 59.4% 0.10% 0.17 0.24% 0.4
Level 2 41.4 % 0.14% 0.33 0.19% 0.47
Level 3 33.0 % 0.12% 0.37 0.16% 0.49
PCO2
Level 1 64.6 mmHg 0.45 mmHg 0.7 0.76
mmHg 1.17
Level 2 42.2 mmHg 0.17 mmHg 0.4 0.37
mmHg 0.88
Level 3 25.9 mmHg 0.15 mmHg 0.57 0.42
mmHg 1.62
PO2
Level 1 60.0 mmHg 0.92 mmHg 1.57 1.89
mmHg 3.22
Level 2 100.0 mmHg 1.00 mmHg 1.01 2.00
mmHg 2.02
Level 3 148.0 mmHg 1.47 mmHg 1 2.44
mmHg 1.66
pH
Level 1 7.140 0.002 0.03 0.003 0.05
Level 2 7.385 0.001 0.02 0.002 0.03
Level 3 7.542 0.001 0.01 0.002 0.03
COHb
Level 1 22.5 % 0.12% 0.53 0.14% 0.64
Level 2 10.4 % 0.20% 1.96 0.22% 2.07
Level 3 3.5 % 0.25% 6.98 0.26% 7.32
HHb
Level 1 17.6% 0.10% 0.55 0.12% 0.67
Level 2 8.1 % 0.16% 1.98 0.17% 2.08
Level 3 2.9 % 0.19% 7.14 0.20% 7.45
MetHb
Level 1 11.8 % 0.06% 0.51 0.07% 0.61
Level 2 5.7 % 0.10% 1.69 0.10% 1.82
Level 3 1.9 % 0.12% 6.12 0.12% 6.3
O2Hb
Level 1 48.2 % 0.26% 0.55 0.32% 0.66
Level 2 76.0 % 0.45% 0.6 0.48% 0.63
Level 3 92.1 % 0.55% 0.6 0.57% 0.62
SO2
Level 1 73.2 % 0.20% 0.28 0.25% 0.34
Level 2 90.3 % 0.23% 0.25 0.24% 0.27
Level 3 96.9 % 0.21% 0.22 0.22% 0.23
tHb
Level 1 7.1 g/dL 0.10 g/dL 1.35 0.12 g/dL 1.64
Level 2 11.6 g/dL 0.11 g/dL 0.98 0.15 g/dL 1.28
Level 3 19.8 g/dL 0.17 g/dL 0.87 0.25 g/dL 1.25

22
b. Linearity/assay reportable range:
A linearity study was designed based on CLSI EP6 guidance for each analyte. Samples were prepared by spiking 10 different levels of analyte into whole blood for each of the analyte tested. Each sample concentration was tonometered to the expected concentrations prior to running samples on the candidate device. Samples were tested in a single run in replicates of 5 on a single instrument. The observed values were plotted against expected values. Results of this study are summarized in the following table:
Analyte Slope Intercept Correlation Coefficient (r2)
Linear Range Tested
Claimed Measuring Range
pO2 1.011 -2.993 0.9966 8.900 – 685.9
mmHg 10 – 685 mmHg
pCO2 0.976 1.812 0.9990 9.296 – 167.660
mmHg 10 – 150 mmHg
tHb 0.9895 0.0926 0.9972 3.132 – 27.013
g/dL 4 – 25 g/dL
O2Hb 0.9979 0.2813 0.9991 3.2 – 100 % 30 – 100 % HHb 1.017 -0.1198 0.9989 0.19 – 96.6 % 0.5 – 70 % COHb 0.9821 0.062 0.9999 1.0 – 78.9 % 1.1 – 70 % MetHb 0.9996 -0.0898 1.00 0.6 – 79.2 % 0.95 – 70 % SO2 1.0032 -0.3379 0.9990 30 – 100 % 30 – 100 %
An additional linearity study was performed using whole blood samples for the
following analytes: pH, Na+, K
+, Ca
2+, glucose, and lactate. The results are as
follows:
Analyte Slope Intercept (r2) Linear Range Tested
Claimed Measuring
Range
pH 1.007 -0.032 0.9996 6.499 – 8.319 pH
units 6.5 – 8.0 pH units
Na+ 1.006 -1.456 0.9993 88.16 – 212.3 mEq/L 100 – 200 mEq/L
K+ 1.018 0.010 0.9989 0.752 – 16.61 mEq/L 1.0 – 15 mEq/L
iCa2+
0.985 -0.162 0.9769 0.756 – 12.842
mg/dL 1.09 – 10.02 mg/dL
Glucose 1.009 -6.236 0.9942 11.1 – 543.4 mg/ dL 18 – 540mg/dL

23
Lactate 1.027 -3.993 0.9969 4.1 – 214.3 mg/dL 9 – 180mg/dL
Hct
1.097 -4.095 0.9934 8.3 – 81.0 % 10 – 75 %
c. Traceability, Stability, Expected values (controls, calibrators, or methods):
Traceability:
All the analytes in the control/calibrator solutions are traceable to a reference
method and the analyte targets are assigned based on the reference methods or
other commercially available methods. See table below for traceability for
calibrators and controls.
Analyte Traceability pH NIST SRM 2181 HEPES and
NIST SRM 2182 Na Salt
pO2 Fresh human blood tonometered with PRMs
(Primary Reference Materials):
• Linde O2 4.5 : purity =99.995% and
• N2 4.6 : purity = 99.996%
These standards are prepared gravimetrically by
National Standards Institutes
using guideline ISO6142 (2) as the primary
standard gas mixture. The gas
mixture is created by using a high precision gas
mixing system from LNI.
pCO2 Fresh human blood tonometered with PRMs
(Primary Reference Materials):
• Linde CO2 4.5: purity = 99.995%
This standard is prepared gravimetrically by
National Standards Institutes using
guideline ISO6142 (2) as the primary standard
gas mixture. The gas mixture is
created by using a high precision gas mixing
system from LNI.
Na+ • NIST SRM 2201: Sodium Chloride
• Merck Sodium Bicarbonate /Sodium Carbonate
1962 (traceable to
NIST SRM 191b: Sodium Bicarbonate and NIST

24
SRM 192a: Sodium Carbonate) • Merck Sodium Acetate Trihydrate (Extra Pure)
6268: purity = 99.5-100%
K+ NIST SRM 2202: Potassium Chloride Ca2+ Merck CertiPUR 119778 Calcium standard
solution (traceable to NIST SRM 3109a: Spectrometric Standard Solution Calcium)
Hct There is no standard reference material available. Fresh human blood samples were analyzed using the Hemafuge®
(microcentrifuge) according to CLSI H7-A3:
Procedure for Determining Packed Cell Volume by the Microhematocrit Method; Approved Standard—Third
Edition (Vol. 20, No. 18). Glucose NIST SRM 917b: D-Glucose (Dextrose) Lactate There is no reference material available.
The material used was Fluka 71718 Sodium Lactate: purity ≥ 99.0%.
tHb There is no reference material available. Oxygenated whole blood samples were analyzed with a Hellma spectrometer using the HiCN reference method in accordance with CLSI H15-A3: Reference and Selected Procedures for the Quantitative Determination of Hemoglobin in Blood; Approved Standard—Third Edition (Vol. 20, No. 28). The Hellma spectrometer was calibrated with NIST SRM 930e: Glass Filters for Spectrophotometry.
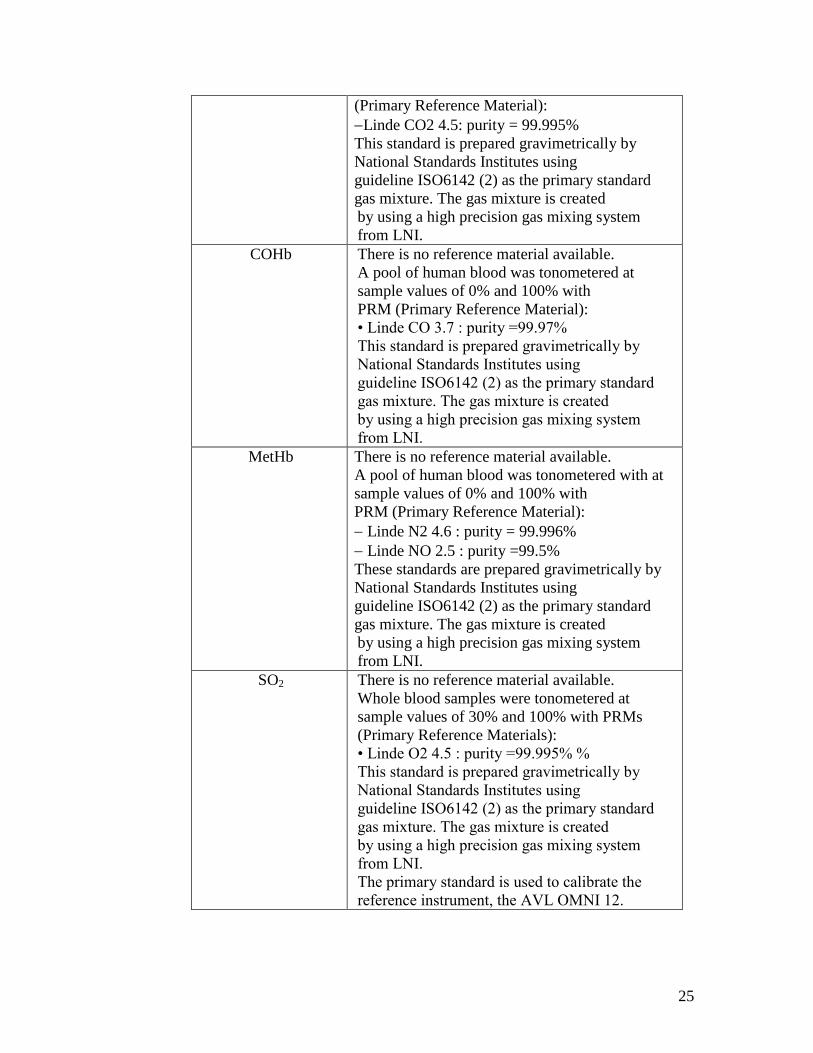
O2Hb There is no reference material available. A pool of human blood was tonometered at sample values of 0% and 100% with PRM (Primary Reference Material): - Linde O2 4.5 : purity =99.995% This standard is prepared gravimetrically by National Standards Institutes using guideline ISO6142 (2) as the primary standard gas mixture. The gas mixture is created by using a high precision gas mixing system from LNI.
HHb There is no reference material available. A pool of human blood was tonometered at sample values of 0% and 100% with PRM
25
(Primary Reference Material): -Linde CO2 4.5: purity = 99.995% This standard is prepared gravimetrically by National Standards Institutes using guideline ISO6142 (2) as the primary standard gas mixture. The gas mixture is created by using a high precision gas mixing system from LNI.
COHb There is no reference material available. A pool of human blood was tonometered at sample values of 0% and 100% with PRM (Primary Reference Material): • Linde CO 3.7 : purity =99.97%
This standard is prepared gravimetrically by
National Standards Institutes using
guideline ISO6142 (2) as the primary standard
gas mixture. The gas mixture is created
by using a high precision gas mixing system
from LNI.
MetHb There is no reference material available. A pool of human blood was tonometered with at sample values of 0% and 100% with PRM (Primary Reference Material): - Linde N2 4.6 : purity = 99.996% - Linde NO 2.5 : purity =99.5% These standards are prepared gravimetrically by National Standards Institutes using guideline ISO6142 (2) as the primary standard gas mixture. The gas mixture is created by using a high precision gas mixing system from LNI.
SO2 There is no reference material available. Whole blood samples were tonometered at sample values of 30% and 100% with PRMs (Primary Reference Materials): • Linde O2 4.5 : purity =99.995% %
This standard is prepared gravimetrically by
National Standards Institutes using
guideline ISO6142 (2) as the primary standard
gas mixture. The gas mixture is created
by using a high precision gas mixing system
from LNI.
The primary standard is used to calibrate the
reference instrument, the AVL OMNI 12.

26
Stability:
Shelf life Stability Study:
For this study, three lots of sensor cartridges (BG/ISE/Glu/Lac) were evaluated using five sensors from each lot. Each sensor lot was stored at 2 – 8
ºC and after 4 months the following materials were tested in singlet: Quality
Control (QC) material, Calibration Verification Control material, plasma, and
whole blood. The results of the study supports the shelf life stability claim of
up to 4 months based on real-time testing on three lots for the sensor
cartridges.
Shelf life Stability Study (Fluid pack):
For this study, the fluid pack was stored at 15 – 25ºC and tested at the
following time intervals: T= 0, 6, 9, and 13 months. Each result obtained at
each time point was compared back to baseline (t=0). The results of the study
support a shelf life of 9 months when stored unopened at 15 - 25ºC.
On-board stability study:
Six sensor (BG/ISE/Glu/Lac) cartridge lots were stored on-board the system at
37 ºC. Three quality control levels were tested at regular time intervals over a
total of 28 days.
The results of the study support an on-board stability of the following:
Stability of up to 28 days at 37ºC for BG (blood gas sensor cartridges)
Stability of up to 28 days at 30ºC for glucose (sensor cartridges) and ISE (ion
selective electrode sensor cartridges)
Stability of up to 21 days at 30ºC for lactate sensor cartridges.
On-board stability study (fluid pack):
A study was conducted evaluating the cobas b 123 fluid pack which contains
five components: calibration solution 1, calibration solution 2, standby
solution, reference solution, and sol-wet solution. The fluid pack’s stability
was carried out at 32ºC for 42 days. This study supports the on-board stability
claim of 42 days.
Value Assignment for Roche AUTOTROL 123:
For lot- specific value assignment, each autoQC pack (containing 8 ampoules
per level, 5 of the new lot and 3 of the reference lot) were tested in two runs

27
on at least three (3) cobas b 123 POC systems. The following table represents the target values for the Roche AUTOTROL 123 levels:
Target Value Level 1 Level 2 Level 3
Analyte Units Mean Mean Mean pH pH units 7.100 – 7.180 7.345 – 7.425 7.502 – 7.582
pO2 mmHg 48 - 72 88 – 112 136 – 160
pCO2 mmHg 60.6 – 68.6 38.7 – 45.7 22.4 – 29.4
Na mEq/L 113.0 – 122.0 135.4 – 145.4 147.6 – 158.6
K mEq/L 2.79 – 3.19 4.41 – 5.01 6.62 – 7.32
Ca mg/dL 6.252 – 7.455 4.529 – 5.331 2.285 – 3.086
Hct % 54.4 – 64.4 36.4 – 46.4 28.0 – 38.0
Glucose mg/dL 94 - 126 36 – 54 389 – 497
Lactate mg/dL 77 - 113 23 – 32 12 – 19
tHb g/dL 6.4 – 7.8 10.6 – 12.6 18.4 – 21.2
O2Hb % 44.2 – 52.2 72.0 – 80.0 88 .1 – 96.1
HHb % 14.6 – 20.6 5.1 – 11.1 0.0 – 5.7
COHb % 20.0 – 25.0 7.9 – 12.9 1.0 – 6.0
MetHb % 10.3 – 13.3 4.2 – 7.2 0.4 – 3.4
SO2 % 71.7 – 75.2 87.8 – 93.4 94.4 – 100.0
Value Assignment for Combitrol Plus B:
For lot- specific value assignment, each COMBITROL PLUS B (levels 1, 2,
3) were tested in duplicate using 8 ampoules per level (5 of the new lot, 3 of
the reference lot) with two (2) runs per system. At least three (3) cobas b 123
POC systems were used for the study. The following table represents the
target values for the Roche AUTOTROL 123 levels:
Target Value
Level 1 Level 2 Level 3
Analyte Units Target range Target range Target range
pH pH units 7.159 – 7.239 7.393 – 7.473 7.515 – 7.595
pO2 mmHg 40 – 64 82 – 106 131 – 155
pCO2 mmHg 61.1 – 69.1 39.1 – 46.1 19.4 – 26.4
Na mEq/L 120.1 – 129.1 137.8 – 147.8 156.0 – 167.0
K mEq/L 2.82 – 3.22 4.44 – 5.04 6.77 – 7.47
Ca mg/dL 6.373 – 7.575 4.569 – 5.371 1.884 – 2.685
Hct % 47.8 – 57.8 34.8 – 44.8 24.1 – 34.1
Glucose mg/dL 86 – 119 38.- 56 339 – 447
Lactate mg/dL 70 – 106 23 – 32 11 - 18
tHb g/dL 6.7 – 8.1 11.1 – 13.1 18.6 – 21.4
O2Hb % 43.2 – 51.2 71.0 – 79.0 87.6 – 95.6
HHb % 15.0 – 21.0 5.5 – 11.5 0.0 – 5.8

28
COHb % 20.4 – 25.4 8.3 – 13.3 1.2 – 6.2
MetHb % 10.5 – 13.5 4.4 – 7.4 0.5 – 3.5
SO2 % 67.3 – 77.3 86.1 – 93.5 93.8 – 100.0
Value Assignment for Calibration Verification Control (CVC):
The six levels of cobas b 123 CVC material are assigned based on the
measuring range established by the cobas b 123 POC system. The following
table represents the target values of each analyte (parameter):
Target Value
Level 1 Level 2 Level 3
Mean Mean Mean
pH pH Units 7.12 – 7.18 7.38 - 7.42 7.52 – 7.58
PO2 mmHg 55 – 75 92 – 107 135 – 160
PCO2 mmHg 60 – 70 38 – 46 21 – 27
Na mEq/L 110-122 133 – 143 150 – 160
K mEq/L 2.50 – 3.50 4.30 – 5.30 6.30 – 7.50
iCa mg/dL 6.012 – 6.81 4.329 – 5.13 2.00 – 3.20
Hct % 54 – 62 36 – 44 26 – 34
Glu mg/dL 99 – 117 41 – 49 351 – 451
Lac mg/dL 81 - 99 25 - 29 13 – 15
tHb g/dL 6.7 – 8.7 11.5 – 13.5 19.5 – 22.5
O2Hb % 40 – 54 68 – 82 88 – 98
HHb % 14 – 22 5 – 12 0 – 6
COHb % 19 – 27 7 – 15 0 – 6
MetHb % 8 - 16 2 – 10 0 – 6
SO2 % 65 – 79 85 – 94 94 – 100
d. Detection limit:
Refer to the linearity study data above in M.2.b. for the detection limits claim
for all analytes. In addition, the sponsor conducted a Limit of Blank (LoB),
Limit of Detection (LoD), and Limit of Quantitation (LoQ) study following
the CLSI EP – 17A guideline for the following analytes: Glucose, ICa, and
Lactate. To determine LoB, zero level samples were prepared and measured
on ten cobas b 123 POC instruments to obtain blank measurements (N=60).
To determine the LoD and LoQ, whole blood samples with low levels of
analyte (approximately 4 x LoB) were measured on ten instruments (N=200).
The LoQ was determined based on the inter-assay precision (%CV). Results
of the study are presented in the following table:

29
Analyte LoB LoD LoQ %CV for
LoQ Claimed
Measuring Range
Glucose 3.1 mg/dL 5.4 mg/dL 13.1 mg/dL 12.1% 18 – 540
iCa 0.000 mg/dL
0.1907 mg/dL
1.057 mg/dL 11.8% 1.09 – 10.02
Lactate 0.00 mg/dL 0.84 mg/dL 5.6 mg/dL 8.5% 9 – 180
e. Analytical specificity:
The interference study was performed according to the CLSI guideline EP7-A2. The
study used spiked and diluted human whole blood samples containing potential
interferents for pH, pO2, pCO2, sodium, potassium, calcium, Hct, tHb, O2Hb, HHb,
COHb, MetHb, SO2, lactic acid, and glucose. Each sample containing interferent was
evaluated against a reference whole blood sample without interferent. The following
table represents substances that were tested without significant effects on test results:
Interference substance test Highest
concentration tested
Analyte
3- beta - Hydroxybutyrate 20 mmol/L pH, ISE, Glu, Lac
Acetoacetate 2 mmol/L pH, ISE, Glu, Lac
Acetone 12.00 mmol/L BG, pH, ISE, Glu,
Lac
Acetylcysteine 10.2 mmol/L Na, K, , Hct
Albumin > 9.0% BG, pH, ISE, Glu,
Lac, Hct
Ammonium Chloride 0.107 mmol/L BG, pH, ISE Glu,
Lac
Ampicillin 0.15 mmol/L BG, pH, ISE, Glu,
Lac
Ascorbic Acid 0.34 mmol/L ISE, Glu, Lac
Aspirin (Acetylsalicylic acid) 3.62 mmol/L Na, K, , Glu, Lac
Benzalkonium chloride 0.028 mmol/L pH, K, Ca, , Glu,
Lac
Beta-Carotene 2.0 mg/L tHB, HHb, O2Hb,
COHb, MetHb,
SO2
Bilirubin 0.342 mmol/L BG, pH, ISE, Glu,
Lac
Calcium chloride 5.0 mmol/L ISE, Glu, Lac
Cefoxitin 1.546 mmol/L ISE, Glu, Lac

30
Chlorpromazine 0.0063 mmol/L BG, pH, ISE, Glu,
Lac
Cyclosporine 0.0043 mmol/L BG, pH, ISE, Glu,
Lac Creatinine 0.442 mmol/L BG, pH, ISE, Glu,
Lac Cyanide 0.1 mmol/L BG, pH, ISE, Glu,
Lac Dobesilate 0.880 mmol/L BG, ISE, Glu, Lac Dopamine 0.00587 mmol/L BG, pH, ISE, Glu,
Lac Dobutamine 0.66 mmol/L pH, K, Ca, , Glu,
Lac Doxycyline 0.068 mmol/L BG, pH, ISE, Glu,
Lac EDTA 0.0003 mmol/L ISE, Glu, Lac Ethanol 86.80 mmol/L BG, pH Ethylene glycol 2.425 mmol/L BG, pH, ISE, Glu,
Lac Evans blue 5 mg/L tHB, HHb, O2Hb,
COHb, MetHb, SO2
Gelfusine Dilution 1:1 tHB, HHb, O2Hb, COHb, MetHb, SO2
Gentamicin 0.021 mmol/L BG, pH, ISE, Glu, Lac
Gentisic Acid 0.117 mmol/L BG, pH, ISE, Glu,
Lac Glutathione, reduced 3.0 mmol/L ISE, Glu, Lac Glycolic Acid 13.05 mmol/L PO2, Na, K, , Glu
Guaiaco 0.4 mmol/L BG, pH, ISE, Glu,
Lac
HAES-sterile 10% Dilution 1:1 tHB, HHb, O2Hb,
COHb, MetHb, SO2
HAES (Hydroxyethylstarch) 50.0% BG, ISE, Glu, Lac Halothane 0.759 mmol/L PO2
Hemoglobin 2.00 g/L BG, pH, ISE, Glu,
Lac Hydroxycarbamide (Hydroxyurea)
2.50 mmol/L BG, pH,ISE
Hydroxocobalmin 0.25 mg/mL tHb, HHb, O2Hb, COHb, MetHb, SO2
Ibuprofen 2.425 mmol/L ISE, Glu, Lac

31
Indocyanine green 5 mg/mL tHb, HHb, O2Hb, COHb, MetHb, SO2
Isoflurane 3.00 % BG, pH, ISE, Glu, Lac
Isoniazid 0.29 mmol/L BG, pH, ISE, Glu,
Lac Intralipid 20% 10 mg/mL tHB, HHb, O2Hb,
COHb, MetHb, SO2
Lactate 6.6 mmol/L ISE, Glu
Levodopa (L-Dopa) 0.12 mmol/L BG, pH, ISE, Glu,
Lac Lipfundin 20% with MCT 10 mg/ mL tHB, HHb, O2Hb,
COHb, MetHb, SO2
Lipidem 10 mg/mL tHB, HHb, O2Hb, COHb, MetHb, SO2
Lithium acetate 3.20 mmol/L BG, pH, ISE, Glu, Lac
Maltose 13.62 mmol/L BG, pH, ISE, Glu, Lac
Methyldopa 0.071 mmol/L BG, pH, ISE, Glu, Lac
Methylene blue 2.5 mg/L tHB, HHb, O2Hb, COHb, MetHb, SO2
Metronidazole 0.701 mmol/L pH, ISE, Glu, Lac Monosodium phosphate 9.0 mmol/L ISE, Glu, Lac Norepinephrine 0.12 mmol/L BG, pH, ISE, Lac Nitrous Oxide 85% PO2 Omegaven 5 mg/mL tHB, HHb, O2Hb,
COHb, MetHb, SO2, tHB, HHb, O2Hb, COHb, MetHb, SO2,
Paracetamol(Acetaminophen) 1.320 mmol/L BG, pH, ISE, Glu, Lac
Patent blue 2.5 mg/L tHB, HHb, O2Hb, COHb, MetHb, SO2
Perphenazine 0.0.223 µmol/L BG, pH, ISE, Glu, Lac
pH low 7.1 tHB, HHb, O2Hb, COHb, MetHb,

32
SO2 pH high 7.9 tHB, HHb, O2Hb,
COHb, MetHb, SO2
Phenobarbital 0.431 mmol/L BG, pH, ISE, Glu, Lac
Phenylbutazone 1.3 mmol/L ISE, Glu, Lac Phenytoin 0.198 mmol/L BG, pH, ISE, Glu,
Lac Potassium Thiocyanate 6.88 mmol/L BG, pH, Na, Ca,
Lac Propofol 1.00 % BG Propofol 2% 0.11 mg/mL tHB, HHb, O2Hb,
COHb, MetHb, SO2
pCO2 0.00 mm Hg pO2, ISE, Glu, Lac pCO2 85.0 mmHg ISE, Glu, Lac pO2 600.0 mmHg BG, pH, ISE, Glu,
Lac pO2 <25 mmHg BG, pH, ISE, Glu,
Lac Rifampicin 0.078 mmol/L BG, pH, ISE, Glu,
Lac SMOF Lipid 20% 10 mg/mL tHB, HHb, O2Hb,
COHb, MetHb, SO2
Sodium Bicarbonate 35 mmol/L ISE, Glu, Lac Sodium Bromide 37.5 mmol/L pH, K, Ca, Lac Sodium Chloride 45 mmol/L BG, pH, ISE, Glu,
Lac Sodium Fluoride 0.105 mmol/L BG, pH, ISE, Glu,
Lac Sodium glutamate 0.86 mmol/L ISE, Glu, Lac Sodium heparin 3000 IU/L BG, ISE, Glu, Lac Sodium Pyruvate 0.309 mmol/L BG, pH, ISE, Glu,
Lac Albumin 12 g/dL tHB, HHb, O2Hb,
COHb, MetHb, SO2
Triglyceride 37.00 mmol/L BG, pH, ISE, Glu, Lac
Urea 49.20 mmol/L BG, pH, ISE, Glu, Lac
Uric Acid 1.40 mmol/L ISE, Glu Vancomycin 0.069 mmol/L BG, pH, ISE, Glu,

33
Lac Voluven 6% Dilution 1:1 tHB, HHb, O2Hb,
COHb, MetHb, SO2
Xylose 4.00 mmol/L BG, pH, ISE, Glu, Lac
Additional interference study testing the following analytes at two levels (low and high) against additional potential interferents was performed. The following is a summary of what was tested:
Na+, K+, and Ca2+: potential interference with benzalkonium, thiocyanate, salicylate, bromide, iodide
Glucose and Lactate: potential interference with uric acid, ascorbic acid, acetaminophen, dopamine, sodium fluoride, and oxalate
pO2: potential interference with nitrous oxide, halothane, and isoflurane
The results of this adjunctive study showed that there was interference with benzalkonium chloride at low and high sodium concentrations.
The following table represents substances which interfered:
Interference substance tested
Highest concentration of interfering substance (mmol/L)
Analyte (Na)/ concentration (mEq/L)
Effect of the interferent (mEq/L)
± Trueness
(mean bias)
mEq/L
Benzalkonium chloride
0.0280 116.47 2.81 ± 0.42 2.9
152.20 152.20 4.07 ± 0.83 3.6
Dobutamine 0.66 137.4 21.2 ± 2.3 3.1
Interference
substance tested
Highest
concentration of
interfering
substance
(mmol/L)
Analyte (Hct)/
concentration (%)
Effect of the
interferent
(%)
± Trueness
(mean bias)
(%)
Sodium
Chloride
45.0 43.3 -9.4 ± 0.2 3.000
Interference
substance tested
Highest
concentration
interfering
substance
(mmol/L)
Analyte (Glucose)/
concentration
(mg/dL))
Effect of the
interferent
(mg/dL)
± Trueness
(mean bias)
(mg/dL)
Acetylcysteine
4
10.2 73.88
-
25.2 ± 9.01 9.163

34
Hydroxycarbamide (Hydroxyurea)
2.50 72.08 21.6 ± 12.6 9.010
Norepinephrine 0.118 73.88 -9.01 ± 3.6 9.848
Potassium
Thiocyanate
6.88 72.08 21.6 ± 7.2 9.010
Sodium
Bromide
37.50
72.08 9.01 ± 5.4 9.010
Interference
substance tested
Highest
concentration of
interfering
substance
(mmol/L)
Analyte (Lactate)/
concentration
(mg/dL))
Effect of the
interferent
(mg/dL)
± Trueness
(mean bias)
(mg/dL)
Acetylcysteine 10.20 49.54 -12.6 ± 2.7 6.513
Glycolic acid 13.05 46.84 6.3±4.5 6.313
Hydroxycarbam
ide
(hydroxyurea)
2.50 43.24 -10.8±5.4 6.046
Uric Acid 1.4 54.05 -8.1±0.9 6.760
Interference
substance tested
Highest
concentration of
interfering
substance
Analyte (tHb)/
concentration
(g/dL)
Effect of the
interferent
(g/dL)
± Trueness
(mean bias)
(g/dL)
Methylene blue 40 mg/L 13.7 -1.1 0.5
Hydroxycobala
min
0.90 mg/mL 13.6 -0.5 0.5
Sulfhemoglobin 10% 17.41 “spectral
interference
detected”
0.5
Cyanomethemo
globin
10% 14.21 “spectral
interference
detected”
0.5
Fluorescein 0.4 mg/mL 14.53 “spectral
interference
detected”
0.5
Interference
substance tested
Highest
concentration of
interfering
substance
Analyte (O2Hb)/
concentration (%)
Effect of the
interferent
(%)
± Trueness
(mean bias)
(%)
Sulfhemoglobin 10% 94.22 “spectral
interference
detected”
3.00
Cyanomethemo
globin
10% 95.81 “spectral
interference
detected”
3.00

35
Fluorescein 0.4 mg/mL 96.91 “spectral
interference
detected”
3.00
Interference
substance tested
Highest
concentration of
interfering
substance
Analyte (HHb)/
concentration (%)
Effect of the
interferent
(%)
± Trueness
(mean bias)
(%)
Sulfhemoglobin 10% 3.53 “spectral
interference
detected”
2.00
Cyanomethemo
globin
10% 2.06 “spectral
interference
detected”
2.00
Fluorescein 0.4 mg/mL 1.34 “spectral
interference
detected”
2.00
Interference
substance tested
Highest
concentration of
interfering
substance
Analyte (COHb)/
concentration (%)
Effect of the
interferent
(%)
± Trueness
(mean bias)
(%)
Sulfhemoglobin 10% 1.68 “spectral
interference
detected”
1.17
Cyanomethemo
globin
10% 1.45 “spectral
interference
detected”
1.15
Fluorescein 0.4 mg/mL 1.31 “spectral
interference
detected”
1.13
Interference
substance tested
Highest
concentration of
interfering
substance
Analyte (MetHb)/
concentration (%)
Effect of the
interferent
(%)
± Trueness
(mean bias)
(%)
Sulfhemoglobin 10% 0.58 “spectral
interference
detected”
1.12
Cyanomethemo
globin
10% 0.68 “spectral
interference
detected”
1.14
Fluorescein 0.4 mg/mL 0.44 “spectral
interference
detected”
1.09
Interference
substance tested
Highest
concentration of
interfering
Analyte (SO2)/
concentration (%)
Effect of the
interferent
(%)
± Trueness
(mean bias)
(%)

36
substance Sulfhemoglobin 10% 96.39 “spectral
interference
detected”
2.00
Cyanomethemo
globin
10% 97.89 “spectral
interference
detected”
2.00
Fluorescein 0.4 mg/mL 98.64 “spectral
interference
detected”
2.00
f. Assay cut-off: Not applicable.
2. Comparison studies:
a. Method comparison with predicate device:
A multi-center clinic evaluation consisting of a total of six clinics ( 2
laboratory and 4 point-of-care sites) was conducted for the following analytes:
pO2, pCO2, pH, Na, K, Ca, Hct, Glucose, Lactate, tHb, O2Hb, HHb, COHb,
MetHb, and SO2. Method comparison studies were performed using Roche
cobas b 123 and other commercially available devices. In order to cover the
hard-to-find sample range, an internal method comparison study was
performed using some altered samples that span the entire claimed measuring
ranges for all the analytes. Singlet set of data was used for the linear
regression analysis. Results are summarized in the table below:
AnalyteUnit of
Measure n Range Slope Intercept r
pH pH Units 764 6.59 – 7.89 0.9930 0.0607 0.9940
pO2 mmHg 737 13.3 – 638.0 0.9685 -0.2771 0.9977
pCO2 mmHg 731 16.6 – 149.5 0.9698 1.100 0.9921
Na+ mEq/L 822 102.0 – 199.2 1.0367 -4.855 0.9793
K+ mEq/L 814 1.43 – 13.54 0.9638 0.1242 0.9982
iCa2+
mg/dL 817 1.180 – 9.535 0.9878 0.0199 0.9808
Hct % 747 12.5 – 68.7 0.9521 1.506 0.9881
Glucose mg/dL 719 18.9 – 539.0 1.000 -3.11 0.9880
Lactate mg/dL 622 9.0 – 171.8 1.0227 0.2406 0.9945
tHb g/dL 750 4.24 – 22.6 0.9643 -0.0035 0.9888
O2Hb % 734 31.5 – 98.3 0.9908 1.3011 0.9976
HHb % 608 0.5 – 69.5 1.0200 -0.7370 0.9948
COHb % 695 1.1 – 63.1 1.0000 0.0000 0.9997
MetHb % 87 1.0 – 59.3 0.9896 0.1093 0.9999
SO2 % 734 32.0 – 100.0 1.0106 -0.4291 0.9931

37
b. Matrix comparison:
Not applicable. Only heparinized whole blood samples are used with this device.
3. Clinical studies:
a. Clinical Sensitivity:
Not applicable.
b. Clinical specificity:
Not applicable.
c. Other clinical supportive data (when a. and b. are not applicable):
Not Applicable.
4. Clinical cut-off:
Not Applicable.
5. Expected values/Reference range: Analyte Population Reference range Cited from Sodium Adult 136- 145
mmol/L 136- 145 mEq/L
Tietz 20061
Adult> 90 years 132- 146 mmol/L 132- 146 mEq/L
Tietz 20062
Potassium (serum)
Adult 3.5 - 5.1 mmol/L 3.5- 5.1 mEq/L
Tietz 20063
Ionized Calcium
Adult, female & male 1.15 – 1.33 mmol/L
4.6 – 5.3 mg/dL
Tietz 20064
Methemoglobin -------------------- 0.06- 0.24 g/dL
9.3 - 37.2 µmol/L
0.04 - 1.52 % of total Hb
0.0004- 0.0152
mass fraction of total Hb
Tietz 20065
Glucose (whole Adult 65- 95 mg/dL Tietz 20066

38
blood, heparin) 3.5 - 5.3 mmol/L Lactate (whole blood)
-------------- venous (at bed rest) 5- 15 mg/dL 3-7 mg/dL
arterial (at bed rest) 0.56 - 1.39 mmol/L 0.36 - 0.75 mmol/L
Tietz 20067
Analyte Population Reference range Cited from pH Arterial whole blood:
Adult, children 7.35 - 7.45 Tietz 20068
PO2 Arterial whole blood: Adult, children (2 days-60 years)
83 - 108 mmHg Tietz 20068
PCO2 Adult (male) arterial whole blood
35 - 48 mmHg Tietz 20069
Adult (female) arterial whole blood
32 - 45 mmHg Tietz 20069
Hct Adult Male Adult Female
39 – 50 %
35 – 47 %
Tietz 198710
tHb (arterial
whole blood)
Adult Male
Adult Female
13.1 – 17.2 g/dL
11.7 – 16.0 g/dL
Tietz 198710
SO2 Newborn 40 – 90% Tietz 20068
Thereafter
(Arterial whole blood)
94 – 98%
Tietz 20068
O2Hb Whole Blood
(Nonsmoker)
94 – 98% American
Environmental
Laboratory11
HHb Whole Blood 1 – 5% American
Environmental
Laboratory11
COHb Whole Blood
(Nonsmoker)
0.5 - 1.5% Tietz 20069
Citations
1. Tietz Textbook of Clinical Chemistry and Molecular Diagnostics: 4th Edition 2006,
p. 2294
2. Tietz Textbook of Clinical Chemistry and Molecular Diagnostics: 4th Edition 2006,
p.2295
3. Tietz Textbook of Clinical Chemistry and Molecular Diagnostics: 4th Edition 2006,
p.2291
4. Tietz Textbook of Clinical Chemistry and Molecular Diagnostics: 4th Edition 2006,
p.2258

39
5. Tietz Textbook of Clinical Chemistry and Molecular Diagnostics: 4th Edition 2006, p.2317
6. Tietz Textbook of Clinical Chemistry and Molecular Diagnostics: 4th Edition 2006, p.2271
7. Tietz Textbook of Clinical Chemistry and Molecular Diagnostics: 4th Edition 2006, p.2282
8. Tietz Textbook of Clinical Chemistry and Molecular Diagnostics: 4th Edition 2006, p.2289
9. Tietz Textbook of Clinical Chemistry and Molecular Diagnostics: 4th Edition 2006, p.2259
10. Tietz Textbook of Clinical Chemistry and Molecular Diagnostics: 3rd Edition 1987, p.1817
11. American Environmental Laboratory: The Laboratory Assessment of Oxygenation: Robert F. Morgan 1993, 5(4), p. 147 - 153
N. Instrument Name:
Cobas® b 123 POC System
O. System Descriptions:
1. Modes of Operation:
Single sample
Does the applicant’s device transmit data to a computer, webserver, or mobile
device using wireless transmission?
Yes _______ or No ____X__
2. Software:
FDA has reviewed applicant’s Hazard Analysis and software development
processes for this line of product types:
Yes ___X_____ or No ________
3. Specimen Identification:
Single sample barcode reader
4. Specimen Sampling and Handling:
This device is intended to be used with whole blood samples.

40
5. Calibration:
Two point calibration of all parameters.
6. Quality Control:
QC consists of the following materials: AutoQC module with AutoQC pack for automated QC measurements
Combitrol Plus B – control material for manual QC measurements
P. Other Supportive Instrument Performance Characteristics Data Not Covered In The “Performance Characteristics” Section above:
None
Q. Proposed Labeling:
The labeling is sufficient and it satisfies the requirements of 21 CFR Part 809.10.
R. Conclusion:
The submitted information in this premarket notification is complete and supports a substantial equivalence decision.