5.1. Methods and Problems - Spoilheap Archaeology SECTION 5. Non-Metric Traits Non-metric,...
15
73 SECTION 5. Non-Metric Traits Non-metric, discontinuous, or discrete, traits are anomalies in the normal anatomy of the skeleton. They are not measurable and are simply recorded on a present or absent basis. In most cases they are thought to have a genetic origin, and for this reason a reasonable amount of attention has been devoted to them in the hope that relationships both within and between groups might be postulated. Although these features are usually fairly obvious to the observer of the skeletal remains (although some can be easily overlooked if a systematic approach to their study is not adopted), the original owner of the bones would not have been aware of the majority of such ‘abnormalities’. They are not generally considered to be pathological in origin, although in the case of some sutural variations, such as the presence of wormian bones, it has been thought possible that cultural practices may play some part in their appearance. The traits most commonly noted in most archaeological bone reports are those which are found on the skull. This is probably because more time and effort has been devoted to their study in the past, and consequently more documentation is available on them. However, a few traits have been recorded in the post cranial skeleton, and these, together with some cranial traits, are summarised by Brothwell (1981). 5.1. Methods and Problems The most notable work carried out in this field in recent years has been that by Berry and Berry (1967) on the various traits of the cranium. This paper brings together the most important and frequently occurring discrete cranial traits and describes them in detail. It also looks at the genetic inheritance of such traits as compared with a similar study carried out on the skeletons of mice. Traits were recorded in various populations from Egypt, America, the Far East and Palestine, and multivariate statistical analyses were carried out to establish distances between the groups. The Egyptians appeared to be stable through the ages, but were distinct from the Palestinians for example. Since the study gave good results as far as distinguishing between groups was concerned, and because no difference was found in sex and age (although juveniles were not considered), the authors suggest that the use of such traits is superior to the use of metrical data in the reflection of genetic differences. Since Berry and Berry made this statement, a number of other workers have looked at the inter-relationship between cranial metric and non-metric variation. Pietrusewsky (1978) studied some early metal age crania from Thailand, and found that there was a difference between the groupings based on each of the two methods, although some similarities also occurred. He suggests that this difference may be caused by the tendency for craniometric data to reflect size rather than genetic variation. Corruccini (1974, 1976) tested the relationship between non-metric and metric characters and found statistically significant associations between them. However, as he says, ‘It is impossible to infer causation from correlation statistics alone. Either variation may be the impetus for variation in the other, or they may be functionally independent but both dependent on another, unrecorded stimulus.’ (1976:291). He also found significant age and sex differences between traits studied in the Terry collection. In the white group, 19 out of 61 traits differed significantly by sex in a chi-square test, and the age differences were of a similar magnitude, although affecting different traits. Berry and Berry, as mentioned above, did not find any differences between the sexes. Corruccini attributes this to the fact that they combined their population groups to test sexual divergence, and states ‘if different sexes must be separated to test population differences, it is obligatory to separate different populations to test sex differences’ (1974:428). Although he says that discrete as well as metric traits seem to be determined genetically, he claims that at present this is untestable in man (although good results have been obtained from work on rodents, e.g. Berry, 1968). However, he does not mention the fact that the genetic component of metrical characteristics is also largely unknown, and although he suggests that there are age differences in the appearance of traits, this is also true of metric traits, and these are not separated into age groups in population studies. Rightmire (1976) studied metric and discrete traits in African skulls. He used multivariate statistics and found a better correlation between the expected group separations and metrical characters than with non-metric characters. He therefore disagreed with Berry and Berry’s conclusion that discrete traits were a better indicator of population divergence than measured characteristics. However, he does say that ‘for the most part, unfortunately, one has little grasp of the meaning of the results obtained; samples of widely divergent groups of man are shown to be different, and that is not unexpected’ (1976:385). Carpenter (1976), like Corruccini, carried out a study of metric and non-metric traits in the Terry collection, based on 317 crania. He claims that non-metric traits are actually more difficult to score than metric, which at variance with the Berrys’ statement to the opposite effect. He found that metric variables were significant sex and race
Transcript of 5.1. Methods and Problems - Spoilheap Archaeology SECTION 5. Non-Metric Traits Non-metric,...

73
SECTION 5. Non-Metric Traits Non-metric, discontinuous, or discrete, traits are anomalies in the normal anatomy of the skeleton. They are not measurable and are simply recorded on a present or absent basis. In most cases they are thought to have a genetic origin, and for this reason a reasonable amount of attention has been devoted to them in the hope that relationships both within and between groups might be postulated. Although these features are usually fairly obvious to the observer of the skeletal remains (although some can be easily overlooked if a systematic approach to their study is not adopted), the original owner of the bones would not have been aware of the majority of such ‘abnormalities’. They are not generally considered to be pathological in origin, although in the case of some sutural variations, such as the presence of wormian bones, it has been thought possible that cultural practices may play some part in their appearance. The traits most commonly noted in most archaeological bone reports are those which are found on the skull. This is probably because more time and effort has been devoted to their study in the past, and consequently more documentation is available on them. However, a few traits have been recorded in the post cranial skeleton, and these, together with some cranial traits, are summarised by Brothwell (1981). 5.1. Methods and Problems The most notable work carried out in this field in recent years has been that by Berry and Berry (1967) on the various traits of the cranium. This paper brings together the most important and frequently occurring discrete cranial traits and describes them in detail. It also looks at the genetic inheritance of such traits as compared with a similar study carried out on the skeletons of mice. Traits were recorded in various populations from Egypt, America, the Far East and Palestine, and multivariate statistical analyses were carried out to establish distances between the groups. The Egyptians appeared to be stable through the ages, but were distinct from the Palestinians for example. Since the study gave good results as far as distinguishing between groups was concerned, and because no difference was found in sex and age (although juveniles were not considered), the authors suggest that the use of such traits is superior to the use of metrical data in the reflection of genetic differences. Since Berry and Berry made this statement, a number of other workers have looked at the inter-relationship between cranial metric and non-metric variation. Pietrusewsky (1978) studied some early metal age crania from Thailand, and found that there was a difference between the groupings based on each of the two methods, although some similarities also occurred. He suggests that this difference may be caused by the tendency for craniometric data to reflect size rather than genetic variation. Corruccini (1974, 1976) tested the relationship between non-metric and metric characters and found statistically significant associations between them. However, as he says, ‘It is impossible to infer causation from correlation statistics alone. Either variation may be the impetus for variation in the other, or they may be functionally independent but both dependent on another, unrecorded stimulus.’ (1976:291). He also found significant age and sex differences between traits studied in the Terry collection. In the white group, 19 out of 61 traits differed significantly by sex in a chi-square test, and the age differences were of a similar magnitude, although affecting different traits. Berry and Berry, as mentioned above, did not find any differences between the sexes. Corruccini attributes this to the fact that they combined their population groups to test sexual divergence, and states ‘if different sexes must be separated to test population differences, it is obligatory to separate different populations to test sex differences’ (1974:428). Although he says that discrete as well as metric traits seem to be determined genetically, he claims that at present this is untestable in man (although good results have been obtained from work on rodents, e.g. Berry, 1968). However, he does not mention the fact that the genetic component of metrical characteristics is also largely unknown, and although he suggests that there are age differences in the appearance of traits, this is also true of metric traits, and these are not separated into age groups in population studies. Rightmire (1976) studied metric and discrete traits in African skulls. He used multivariate statistics and found a better correlation between the expected group separations and metrical characters than with non-metric characters. He therefore disagreed with Berry and Berry’s conclusion that discrete traits were a better indicator of population divergence than measured characteristics. However, he does say that ‘for the most part, unfortunately, one has little grasp of the meaning of the results obtained; samples of widely divergent groups of man are shown to be different, and that is not unexpected’ (1976:385). Carpenter (1976), like Corruccini, carried out a study of metric and non-metric traits in the Terry collection, based on 317 crania. He claims that non-metric traits are actually more difficult to score than metric, which at variance with the Berrys’ statement to the opposite effect. He found that metric variables were significant sex and race

74
discriminators, and non-metrics were slightly significant for age. Like Corruccini, he concludes that non-metric characters should be used as a supplement to other observations rather than alone. The study by Molto (1979) would seem to confirm Carpenter’s contention that non-metric features are difficult to score. He looked at intraobserver error by scoring the same skeletal group twice with a two-year interval. Although he found that 8 traits had unacceptable levels of recording error, 80% of his traits actually had a correlation of 0.9 or more between the two scoring sessions. However, if the 8 unacceptable traits are included when looking at mean measures of divergence, then groups expected to be biologically close are shown to be dissimilar, whereas if they are excluded the groups have ‘more meaningful and consistent relationships’ (1979:340). Berry (1979) admitted that ‘there is undoubtedly a fair amount of subjectivity in the scoring of some variants’ (1979:675), and that it would be useful to have agreed criteria for the classification of all variants. However, he does not seem to think that this is necessary with data collected and used by a single worker. Since Molto found that there was a greater divergence in results obtained over long periods of scoring various series, it is probably just as important for individuals to consider their scoring criteria before they begin an analysis. As Berry suggests, a workshop of active workers would be useful to establish a widely agreed scheme. Molto (1985) looked at Berry and Berry’s contention that non-metric traits are unrelated to each other and can therefore be used in distancing techniques. He concluded that ‘intercorrelations between discontinuous traits, while low, seem strong enough to influence biological distance coefficients and their significance levels’ (1985:64). He recommends that samples of more than 300 crania should be used to detect intertrait correlation, that this should be determined separately for males and females, and that if this is impossible due to small sample size, then the use of accessory ossicles should be avoided because of their high intercorrelation. However, he does not attempt to suggest causes for this intercorrelation, and it may be that if traits are intercorrelated it is because a fairly small gene pool exists within a population. If this is the case, these traits may actually be more useful for assessing population differences than Molto’s study implies. Other workers have considered the significance of sex, age, race, size and shape, and skeletal side in the study of non-metric traits. Cheverud et al (1979) suggest that size can have an effect on the presence or absence of a non-metric trait. They feel that the correlations between metric and non-metric characteristics ‘are largely determined by the growth and development of the soft tissue and functional spaces of the cranium’ (1979:196). Because of this, they suggest that there is no biological reason to favour either type of trait in population studies, and that both kinds of trait should be used whenever possible. Hertzog (1968) found associations between various non-metric variants in adjacent regions of the skull, although there was considerable racial variation in this. Such associations seem to suggest some correlation with the form, and possibly the size, of the skull. Benfer (1970) tested these associations by multivariate analysis, however, and found that three of the traits were largely independent of each other. Berry (1975) studied non-metric traits in 186 crania of known age, sex and date of birth from St. Brides, London, following Corruccini’s criticisms of Berry and Berry’s 1967 paper. She found few sex differences, and those that were present were different in various populations. Age dependency was only found in one trait (Hschke’s foramen), and other factors such as year of birth, presence of rickets, and spina bifida occulta showed little influence on the incidence of variants. Family studies unfortunately proved inconclusive due to the small number of related individuals who could be identified. Bilateral traits have been studied for correlation between sides of the skeleton by various authors. Trinkaus (1978) showed that asymmetry of bilateral non-metric traits is not rare. He concluded from this that environmental factors (nutrition, climate, biomechanical stress) are relatively important in controlling the appearance of such traits, since if the traits are strictly under genetic control both sides should be affected equally. However, Perizonius (1979b) claims that since Trinkaus only counted symmetrical positive scores as symmetry, and neglected bilateral symmetrical absence, his conclusion that asymmetry is common can be discounted. Green et al (1979) tested 16 traits for bilateral correlation in the crania of prehistoric Californian Indians. They found fairly good correlations between sides, although tests for differences between side frequencies showed significant difference in 5 out of the 16 traits. They consider three methods of recording bilateral traits: firstly to count the total number of times the trait occurs on either side and divide by the observable number of sides; secondly to record the trait as present if it occurs on one or both sides of the skull, even if the skull is damaged and only one side is available, and divide by the number of observable skulls rather than sides; thirdly to consider one side only. They recommend use of the first method since it will provide the most accurate estimate of trait frequency.

75
Korey (1980) considers that the second method suggested by Green et al is the best, although he recommends the exclusion of unpaired sides. To support this, he studied a single cranial trait, the supraorbital foramen, and reported on its bilateral and unilateral incidence. He found no difference between the sexes, but there was an increase of unilateralism with age. This, he felt, was in support of the use of cranial sampling rather than sampling by side, because age would introduce a bias into the latter. However, he also says that we are left with ‘a disagreeable choice between a sampling strategem which almost certainly introduces genetically extraneous information and one which risks excluding genetically salient information’ (1980:22). He advocates sampling by crania to mask these effects. Ossenberg (1981) looked at two bilateral traits, the absence of the third mandibular molar and the mylohyoid bridge, and concluded that ‘computing the frequency of a discrete trait on the basis of total left and right sides quantifies the genetic potential in the population better than does the individual count’ (1981:478). She admits that there is a problem with this method because of artificial inflation of sample size, and advocates calculating the frequency in total sides n but entering n/2 in the distance formula. Cosseddu et al (1979) looked at both sex and side differences in non-metric variants in a group of Sardinian skulls. Their results, using the mean measure of divergence, suggested almost no difference between the sides or the sexes, and any that did exist were always non-significant. Perizonius (1979a) looked at sex and age differences based on 49 discrete traits in 254 Amsterdam crania of known age and sex. Although sex difference occurred for some traits (16%), age difference was non-existent. Recalculation of Corruccini’s figures for the Europeans of the Terry collection, based on the suggestion that his chi-square values for bilateral traits were twice as high as they should be, resulted in a sex difference of only 8%, rather than the 31% of the original paper. Ossenberg (1976) points out that archaeological samples are unfortunately often small, and that ‘error in very small male and female subsamples may be greater than the distortion due to sex component in pooled samples’ (1976:705). She found high correlations between sex in three large samples, and states that pooled samples will probably not be greatly distorted by a component due to sex. Riggs and Perzigian (1977) found only 5 out of 27 traits significantly associated with sex in two American Indian groups, and only one trait was significantly associated by side. Saunders (1978) found that on a grouped-trait basis side differences are minimal for most traits, and, like Korey, that recording trait presence by side may tend to exaggerate age differences in unilaterality and bilaterality. He also found significant multivariate distances between age and sex, and that ‘excess’ bone traits are more common on the right side, more common in males and generally increase in frequency with age. Berry (1968) presented a statistic for the comparison of non-metric characteristics between populations. This has been modified by later authors (e.g. SjPvold, 1973; Green and Suchey, 1976; Finnegan and Cooprider, 1978), and is most useful for large population groups and high trait frequencies. Finnegan and Cooprider tested a number of variations on the original statistic and concluded that there was very little difference between them in terms of results obtained. Kaul et al (1979) used the mean measure of divergence suggested by Berry in a study of four populations from India. They found that the statistic yielded good results for the most racially divergent groups, but that related groups were arranged ‘in a curious pattern’. They state that this is ‘rather the opposite of the typical situation with non-metric skeletal analysis, where local demes are often well-separated while continental racial populations appear illogically related’ (1979:697). Strouhal and Jungwirth (1979) used a graphical method to determine the divergence of some late Roman-Early Byzantine cemeteries at Sayala in Egyptian Nubia. They obtained satisfactory results using non-metric traits to test biological difference, but state that the measure of divergence would have to be used to test significance of the results. A.C. Berry (1974) studied the population movements of Scandinavians by non-metric cranial traits. She found that estimates of divergence generally accord well with population movements accepted by history and language study. Schreiner’s calculations of the Coefficient of Racial Likeness in Norwegian skulls (based on metrical analysis) were little correlated with the estimates of divergence found by Berry, whereas work on blood groups has suggested a similar pattern to hers. She therefore concluded that the non-metric method is a useful aid in the study of population movements.

76
Most of the above studies have been based on cranial traits. A few workers (e.g. Anderson, 1968) have studied and described post-cranial traits, but there has been little or no attempt to use these in the same way as cranial traits. It seems that anthropologists are still suffering from overemphasis of cranial traits in this particular branch of the field. Despite the suggestions of Corruccini and a few others to the contrary, it seems that non-metric traits can yield useful results in terms of biological distancing studies. Whether they are better than metrical traits in this respect really depends on their genetic affinity, and more work needs to be carried out on this aspect before any conclusions can be reached. Until this is possible, it is probably best to consider both metric and non-metric features of the skeleton whenever possible, since both have obvious advantages and disadvantages in almost equal proportions. 5.2. Studies of Specific Traits There is a vast number of papers on the subject of particular non-metrical characteristics of the skeleton, many of which date to the last century or the early part of the present one. Many of these dealt with the more obvious traits, such as wormian bones, torus palatinus and tori mandibulares. A small selection of the available literature will be reviewed here in order to give a cross-section of the sort of work done. Perhaps the most well-known anatomical variant is the wormian bone. These small sutural ossicles are so common in many populations that they cannot really be called abnormalities, since more individuals are found with them than without. Early studies (e.g. Hess, 1946; Torgersen, 1951) suggested that the presence of these ossicles was highly correlated with the retention of the frontal suture (see below) and asymmetry of the skull. Hess quoted a number of pathological conditions in which the bones were found, such as hydrocephaly and chondrodysplasia. Since many of these diseases involve disorders of bone growth it is perhaps not surprising that wormian bones should be seen frequently in the skulls of affected individuals. Bennett (1965) disagrees with Hess and Torgersen concerning the association of wormian bones with metopism and cranial asymmetry. He suggests that they are caused by some form of physical stress in the late foetal and early perinatal periods, with genetics also playing some, unknown, role. El-Najjar and Dawson (1977) studied the effect of the cultural practice of cranial deformation on the wormian bones in the lambdoid suture. They found non-significant differences in the incidence of wormian bones between deformed and undeformed skulls, suggesting that stress is not a major factor in their formation. They also found that 11.3% of the foetal skulls studied had wormian bones, from which they postulated that artificial cranial deformation and stress have little effect on the presence or absence of ossicles, and that there is probably a high genetic component in their formation. However, they found that artificial deformation does appear to influence the number of bones present in the lambdoid suture, if not the actual predisposition to their formation. Gottlieb (1978) came to a similar conclusion in his study of artificial cranial deformation. He suggests that deformation has a direct effect of increasing the complexity of the pars lambdica of the lambdoid suture, and of increasing the number of wormian bones if they are present at all. From this he proposed a genetic cum environmental causation of wormian bones, with stress influencing their appearance, but with an underlying genetic predisposition. Johnson et al (1965) looked at the Mandibular torus, a bony exostosis on the lingual surface of the mandible. From a study on a living population, they found that there was a less than one in 100,000 chance that the trait is not familial. They also found a greater incidence in females, with a sex ratio of males to females of 70:100. From this study, there does not appear to be any doubt of the genetic association of this trait. Wells (1974d) studied over 100 skeletons from Iona, the great majority of which were female and probably a conventual population. Parts of 25 mandibles survived from this population, and all 25 had well-marked tori either unilaterally or bilaterally. A hundred-percent incidence of mandibular tori is completely unknown anywhere else in the world. The normal frequency for a European population is in the region of 1-5%. Wells suggests that the Iona group represents a closely inbred enclave, or a group drawing on a fairly restricted gene pool. The possible arrival of Eskimos (for which there is some literary evidence) and the introduction of a dominant gene for torus mandibularis is one theory which could be considered to explain this phenomenon. If this were the case, then the usefulness of this trait at least in the estimation of biological distance can be seen. Sellevold (1980) considered the mandibular torus in two populations from Greenland, a medieval Norse series and a group of 14th-17th century Eskimos. Both populations had high frequencies of the trait, but tori occurring in the Norse population were larger. This argues against masticatory stress causing the torus, since the Norsemen probably had a softer diet than the Eskimos, and no correlation has been found between dental attrition and the degree of torus development. He concludes that ‘while the role of the environment cannot be disregarded as a factor in determining

77
the presence of the trait, the present results indicate that genetic factors play a major role in determining the morphology of the mandibular torus’ (1980:572). Another type of torus, the torus auditivus, has been studied by Mann (1986). He states that two types of tori are found around the auditory meatus, one being a superficial, lobulated osteoma, and the other being a fairly large exostosis deep inside the meatus. This latter is explained as a consequence of swimming in cold water, but it is the former which is usually recorded as a non-metric trait. Mann claims that it is simply a benign tumour ‘with some hereditary factors in its formation’. It is possible that this feature cannot be regarded as a non-metric characteristic in the truest sense, since it is extremely rare in most European populations, suggesting that if it has any genetic component then this is fairly small. A few post-cranial traits have been identified (Brothwell, 1981), but there does not seem to have been a great deal of time devoted to their study. Saunders and Popovich (1978) looked at a vertebral trait, atlas bridging, and found good evidence for its heritability in Canadian families. Barkley (1978) considered vertebral arch defects in ancient Egyptians, including spondylolysis (separation of the vertebral arch from the body, which may be environmentally determined), which seemed to have a high incidence in one of the populations. The humerus has also attracted some attention. Benfer and McKern (1966) studied the correlation of the septal aperture with bone robusticity. They found a slight correlation between the minimum midshaft diameter of robust bones and the absence of septal aperture. The trait was found to be slightly more common in women. Cavicchi et al (1978) also studied the septal aperture and its relationship with humeral and ulnar measurements. Their work suggests a greater incidence of the trait in males than in females (exactly the opposite conclusion to Benfer and McKern), a difference between sides, and a negative correlation between humerus size and presence of the trait. They suggest a genetic association for the trait, since it does not seem to be dependent on robustness in their study. The above review does not claim to be comprehensive; it merely covers some of the major traits observed in the present study. Other cranial and post-cranial traits are listed in Berry and Berry (1967), and Brothwell (1981), where short descriptions and location diagrams can be found. 5.3. Traits recorded in the Study Populations Ossenberg (1976) states that c.200 variants have been identified on the human skull, some of which are of dubious value. Obviously it would be impossible to consider all of these in the analysis of a skeletal population, even if one could remember what they all are. The decision as to which ones to use is largely arbitrary. Many workers follow Berry and Berry’s (1967) 30 traits, but others opt for a shorter list based on these or Brothwell’s. Ossenberg suggests a new list, but these were chosen for use in a comparison study of American Indians, Eskimos and Negroes, and they are not necessarily the correct group of traits for consideration of a European population. A list, decided upon basically for ease of recording over large skeletal series, consisting of 19 non-metric traits was used in the study of most of the groups considered here. Occasionally other traits were recorded, and the list has grown through time to encompass 26 traits which are now scored during the analysis of a population. Unfortunately, since some of these were not scored in some of the first groups to be analysed, and since the list of traits chosen by Wells for the Jarrow and Monkwearmouth groups were very different, comparisons between the groups has been difficult. This only serves to emphasise the need for a workshop to decide upon a standard group of 20 or more traits which should be scored in every population, if only to allow realistic comparisons within and between workers. The 19 traits, with abbreviations for use in the following section, scored in all the groups in this study (except Jarrow and Norton) are as follows:
Persistence of the metopic suture (metopism) M Presence of parietal foramina PF Wormian bones: coronal suture CW sagittal suture SW lambdoid suture LW Epipteric bone(s) EB Parietal notch bone(s) PN Inca bone (may be bi- or tri-partite) IB Asterionic bones AB Torus palatinus TP Maxillary tori MT Mandibular tori TM

78
Torus auditivus TA Double hypoglossal canal DHC Post-condylar canal PCC Septal aperture of humerus SA Third trochanter of femur TT Atlas double condylar facet ADF Acetabular crease (innominate) AC
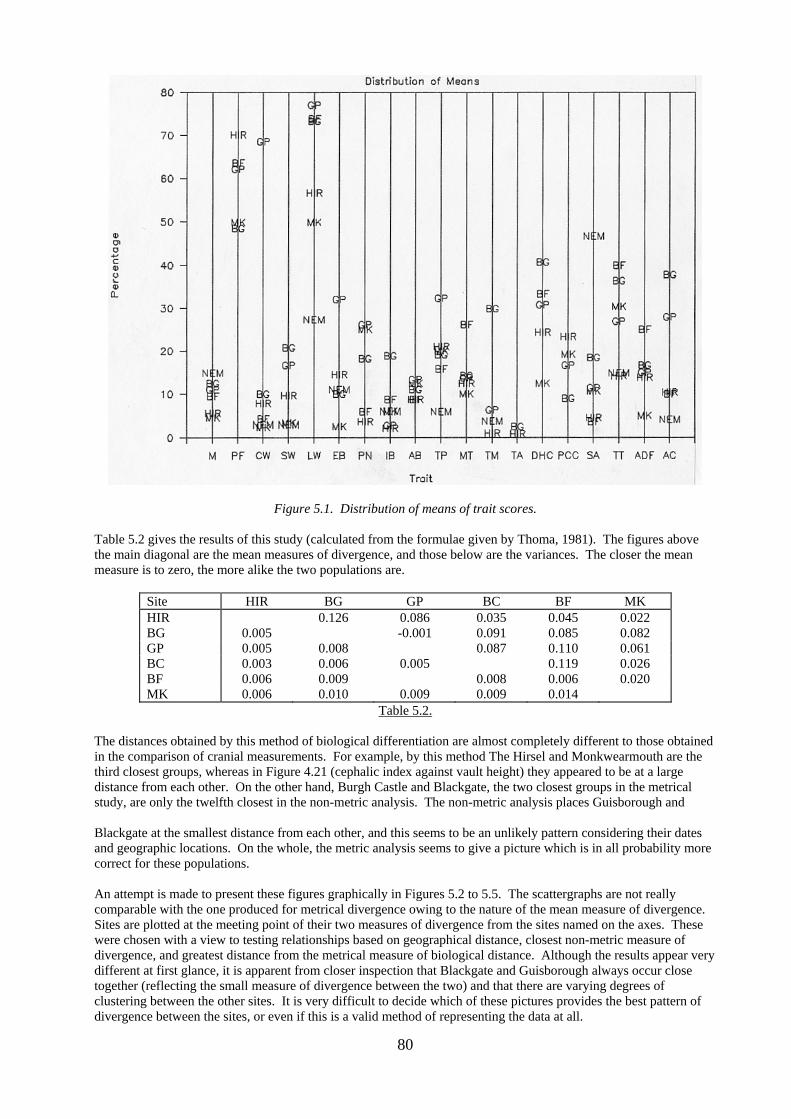
Other traits scored in some populations include: precondylar tubercle (PCT), double occipital condylar facet (DCF), six sacral segments (6S), sacralisation of the L5 vertebra (SL5), Poirier’s facet and/or plaque formation (PF1/2) at the head of the femur (not always easy to distinguish from each other), and multiple mental foramina of the mandible (MMF). Some traits were only seen (and therefore scored) in one population. For example, though not really a part of this study, the squameparietal ossicle was only observed in the Burgh Castle group. In general, foramina on the base of the skull were not scored because of the difficulty of locating them from drawings. 5.4. Non-Metric Traits in the Study Populations 5.4.1. Between-group Study Table 5.1 below gives the actual figures and percentages for all traits scored at each site for combined sexes. The abbreviations for traits are given in Section 5.3 above The figures given in Table 5.1 are not divided into sexes because, like Perizonius and others mentioned above, the present author has found no great difference in the incidence of traits between male and female skeletons. Frequencies of non-metric variants from The Hirsel, Blackgate and Guisborough were tested for significant difference between sexes using the chi-square statistic published by Perizonius (1979) and Green et al (1979). At The Hirsel only three of the 19 traits (15.8%) showed a significant difference at the 5% level, none being significantly different at the 1% level. At Blackgate only one (parietal foramen) of the 23 traits (4.3%) was significant, and at Guisborough 3 out of 27 (11.1%) were affected, all of which were post-cranial (atlas double condylar facet, septal aperture, plaque formation at the femoral head). Perizonius found a similar percentage difference to that calculated for The Hirsel (16%), and concluded that sex was not a major discriminator in non-metric features. The traits found to be different at The Hirsel were the parietal notch bone, the double hypoglossal canal and the septal aperture of the humerus. Neither of the first two were significant in Perizonius’ study, and he did not consider the third. This last has been found to be significant in other populations, however, and as mentioned previously (Section 5.2) it does seem to have some correlation with sex and robusticity. The trait does show a large difference in incidence in the populations studied here, though, ranging from 3.6% at Blackfriars to 46.7% at Norton. It is thus a more useful discriminator of population groups than of sex, and it is probably valid to use it in the combined sex incidence. Table 5.1 presents the actual data from each site, but it is limited in its usefulness since it does not allow for ease of comparison between traits and populations. Figure 5.1 shows the results graphically by plotting the mean percentages of each trait for each site (except Jarrow). It can be seen that for each trait the sites vary in their relative position and distance from each other. The Mean Measure of Divergence statistic used by Berry and Berry (1967) and subsequent workers solves this problem to some extent, and it was applied to five of the populations in this study plus Burgh Castle for this reason

79
.
Trait HIR MK JA BG NEM BF GP M + 7/126 2/44 4/104 5/40 7/47 2/21 4/36 % 5.6 4.5 3.8 12.5 14.9 9.5 11.1 PF + 89/127 29/58 72/108 16/33 14/22 23/37 % 70.1 50.0 66.7 48.5 63.6 62.2 CW + 9/116 1/42 3/72 3/30 1/33 1/23 24/35 % 7.8 2.4 4.2 10.0 3.0 4.3 68.6 SW + 11/115 1/29 1/50 6/29 1/33 0/23 6/36 % 9.6 3.4 2.0 20.7 3.0 - 16.7 LW + 68/120 18/36 26/85 22/30 9/33 17/23 27/35 % 56.7 50.0 30.6 73.3 27.3 73.9 77.1 EB + 11/76 1/40 0/41 1/10 1/9 0/17 8/25 % 14.5 2.5 - 10.0 11.1 - 32.0 PN + 3/84 1/4 2/11 1/17 6/23 % 3.6 25.0 18.2 5.9 26.1 IB + 4/119 2/33 2/62 7/37 2/33 2/23 1/36 % 2.1 6.1 3.2 18.9 6.1 8.7 2.8 AB + 8/91 3/24 4/38 1/9 2/23 4/30 % 8.8 12.5 10.5 11.1 8.7 13.3 TP + 21/100 2/10 4/21 1/17 3/19 10/31 % 21.0 20.0 19.1 5.9 15.8 32.3 MT + 13/105 1/10 4/28 6/23 4/29 % 12.4 10.0 14.3 26.1 13.8 TM + 1/115 0/32 14/47 2/53 0/24 2/32 % 0.9 - 29.8 3.8 - 6.3 TA + 1/127 0/33 1/40 0/? 0/17 0/35 % 0.8 - 2.5 - - - DHC + 18/74 3/24 15/111 11/27 7/21 8/26 % 24.3 12.5 13.5 40.7 33.3 30.8 PCC + 17/73 5/26 30/55 2/22 0/21 3/18 % 23.3 19.2 54.5 9.1 - 16.7 PCT + 1/25 4/100 4/29 1/21 2/24 % 4.0 4.0 13.8 4.8 8.3 DCF + 1/76 1/27 2/21 0/25 % 1.3 3.7 9.5 - MMF + 1/52 4/174 % 1.9 2.3 SA + 5/111 6/56 16/188 10/54 21/45 1/28 3/26 % 4.5 10.7 8.5 18.5 46.7 3.6 11.5 TT + 16/113 14/46 44/159 20/55 7/47 12/30 7/26 % 14.2 30.4 27.7 36.4 14.9 40.0 26.9 ADF + 10/72 2/39 5/30 5/20 3/20 % 13.9 5.1 16.7 25.0 15.0 AC + 10/96 20/95 14/37 1/24 1/25 7/25 % 10.4 21.1 37.8 4.2 4.0 28.0 6S + 3/18 5/11 1/10 3/11 % 16.7 45.5 10.0 27.3 SL5 + 3/29 1/22 % 10.3 4.5 PF1 + 2/28 0/30 % 7.1 - PF2 + 0/28 5/30 % - 16.7
Table 5.1. .
80
Figure 5.1. Distribution of means of trait scores. Table 5.2 gives the results of this study (calculated from the formulae given by Thoma, 1981). The figures above the main diagonal are the mean measures of divergence, and those below are the variances. The closer the mean measure is to zero, the more alike the two populations are.
Site HIR BG GP BC BF MK HIR 0.126 0.086 0.035 0.045 0.022 BG 0.005 -0.001 0.091 0.085 0.082 GP 0.005 0.008 0.087 0.110 0.061 BC 0.003 0.006 0.005 0.119 0.026 BF 0.006 0.009 0.008 0.006 0.020 MK 0.006 0.010 0.009 0.009 0.014
Table 5.2. The distances obtained by this method of biological differentiation are almost completely different to those obtained in the comparison of cranial measurements. For example, by this method The Hirsel and Monkwearmouth are the third closest groups, whereas in Figure 4.21 (cephalic index against vault height) they appeared to be at a large distance from each other. On the other hand, Burgh Castle and Blackgate, the two closest groups in the metrical study, are only the twelfth closest in the non-metric analysis. The non-metric analysis places Guisborough and Blackgate at the smallest distance from each other, and this seems to be an unlikely pattern considering their dates and geographic locations. On the whole, the metric analysis seems to give a picture which is in all probability more correct for these populations. An attempt is made to present these figures graphically in Figures 5.2 to 5.5. The scattergraphs are not really comparable with the one produced for metrical divergence owing to the nature of the mean measure of divergence. Sites are plotted at the meeting point of their two measures of divergence from the sites named on the axes. These were chosen with a view to testing relationships based on geographical distance, closest non-metric measure of divergence, and greatest distance from the metrical measure of biological distance. Although the results appear very different at first glance, it is apparent from closer inspection that Blackgate and Guisborough always occur close together (reflecting the small measure of divergence between the two) and that there are varying degrees of clustering between the other sites. It is very difficult to decide which of these pictures provides the best pattern of divergence between the sites, or even if this is a valid method of representing the data at all.

81
Figure 5.2. Biological distances: 1. greatest geographical distance.
Figure 5.3. Biological distances: 2. greatest metrical distance.

82
Figure 5.4. Biological distances: 3. least non-metrical distance.
Figure 5.5. Biological distances: 4. least geographical distance.

83
Table 5.3 shows the non-metric traits which were significantly different between the populations used in the measure of divergence. The pairs of sites are numbered in order from least to greatest divergence as follows:
1. GP-BG 9. BF-BG 2. MK-BF 10. GP-HIR 3. MK-HIR 11. BC-GP 4. MK-BC 12. BC-BG 5. BC-HIR 13. BF-GP 6. BF-HIR 14. BF-BC 7. MK-GP 15. BG-HIR 8. MK-BG
Site references (see above) Trait 1 2 3 4 5 6 7 8 9 10 11 12 13 14 15 Tot. PF * * * 3 CW * * * * * 5 SW * * * 3 LW * * * * * 5 EB * * * * * * 6 PN * * * * 4 IB * 1 TM * * * * * * 6 DHC * * * 3 PCC * * * * 4 SA * 1 TT * * * 4 ADF * * * * * 4 AC * * * * * * 6 Total 2 2 1 2 3 2 3 4 3 6 4 4 6 6 7 55
Table 5.3. The most divergent populations obviously have the greatest number of significantly different traits, although the trend is not completely linear. The most discriminatory traits, for these populations at least, appear to be the epipteric bone, the mandibular torus, the acetabular crease, the coronal wormian bone and, perhaps surprisingly given its prevalence in most groups, the lambdoid wormian bone. Five traits were not significant in any of the groupings. These were metopism, asterionic ossicle, torus palatinus, maxillary tori and torus auditivus. This is probably not surprising since the percentage frequencies of these traits at the sites concerned are not very different. 5.4.2. Within-group Study Having considered inter-population variation in the study groups, it is useful to look at one other aspect of the use of non-metric traits, that of intra-population study. This involves the assumption that the traits are heritable, and that they can therefore suggest family relationships between buried individuals. There are three main problems with this approach to population studies. Firstly, in a poorly preserved series the plotting of traits on a site plan does not highlight the missing evidence where skulls or other important parts of the skeleton are missing. Secondly, a large number of children, for whom non-metric traits usually cannot be scored, will have a similar effect on plotting of traits. Thirdly, married women are probably more likely to be buried with their husband’s family than with their own, and this may also provide anomalies in the plotted trait pattern. In practice, this last problem can be overcome if a large family group is thought to exist, since the females in a group will presumably pass on some of their features to their offspring. The problem comes when these offspring are buried elsewhere, or when a married couple are buried together but without the rest of their family. In these cases it is obviously impossible to show relationships. Bearing in mind these caveats, it is possible to consider two of the sites in this study in more detail. The Hirsel has been chosen for this type of analysis because it is a large population in fair condition, and all the traits have been scored by the present author. Guisborough Priory was selected for comparison because although it is a fairly small section of a population, it is an extremely well-preserved group on the whole, it contains few children or unassessable adults, and it covers a small area of a priory church, where family groups might be expected to occur. The results obtained from both these sites are presented in Figures 5.6 and 5.7. These show plans of the two sites with major trait groups plotted. Only the rarer traits were used in both cases, since characters such as wormian bones in the lambdoid suture occur in large sections of the adult burials at most sites, and cannot therefore be used

84
alone to distinguish familial relationships. In these two cases, however, they have been used in conjunction with other traits. Some interesting associations were seen at The Hirsel. For example, only two male individuals at this site were metopic (sks. 306 and 308), and these were buried at the middle of the south side of the church adjacent to each other and at similar levels. One female case of metopism was also buried to the south of the church (sk. 164), but at a greater distance than the two males. The burial was disturbed, which makes it even more difficult to suggest any association with the two males. Three other examples of metopism in females were located to the north side of the church, all at a fair distance from each other (sks. 62, 190 and 224). Three possible family groups were seen at The Hirsel on the basis of various traits. These are as follows:
Group 1: Sk. 94 - SW, TP, LW. Sk. 93 - CW, DHC, LW. Sk. 323 - SW, LW. Sk. 325 - SW, DHC, PCC. Sk. 96 - DHC, TP, PCC, LW. Sk. 327 - LW. ?Sk. 65 - CW, EB, PCC. ?Sk. 44 - CW, EB.
Skeletons which could not be assessed for traits but which may belong to this group are numbers 64, 66, 95 and 324. Most of these burials respect the others and lie on a fairly similar orientation. They are on the north side of the church with few other interments close to them.
Group 2: Sk. 321 - CW, DHC, LW. Sk. 225 - LW. Sk. 314 - LW. Sk. 240 - EB, DHC, PCC, LW. Sk. 239 - AB, DHC, PCC, LW. Sk. 232 - PCC. ?Sk. 336 - LW. ?Sk. 293 - SW, LW. ?Sk. 338 - TP, LW
The most likely individuals to be genetically related from this group are numbers 321, 240, 239 and 232. The others may belong, but it is noticeable that all those with LW only are from the lowest levels of the group. A few children may also belong: 179, 248 and 249. Sk. 104, buried a few metres north of the group, may have some affinity with it, having the following traits: DHC, PCC and TP. The group is located at the west end of the church, and shows little respect for graves. Perhaps this is tentative evidence for a less wealthy family using a smaller patch of land for their burials. Considering the large areas of space available in this churchyard (especially to the west and north of the church), there does not seem to be any other reason than family plots for burying individuals in such a tightly packed group.
Group 3: Sk. 199 - DHC, PCC, TP (cf. 104) Sk. 186 - IB, TP, LW. Sk. 200 - EB, TP, PCC. Sk. 209 - PCC, TP. Sk. 174 - PCC, TP, LW, PN.
There does seem to be a high concentration of torus palatinus in this small area of the churchyard, at the most south-easterly limit of the excavation. A few unassessable individuals may also belong: sks. 187, 261 and 201. The graves are all on the same orientation and only 187 cuts into one of the other graves (186), but at exactly the same orientation. Sk. 261 may have been disturbed by either 186 or 200 and may have nothing to do with the group.

85
Figure 5.6. Non-metric traits at The Hirsel.

86
At Guisborough, the plotting of traits seemed to indicate an affinity between virtually all the assessable adults in the burial area, and it is possible that the remains represent a small inbreeding community or perhaps one large extended family. It is noticeable that a high level of extra-sutural bones of all types was found in this population than is usual in a medieval group. Skeletons 3 and 4 (female and ?female) both had large pre-condylar tubercles with a canal running through the base. This is an unusual form of the trait, and it seems likely that the two women were related in some way, even though they were not buried particularly close together. This may be a case of burial separation due to marriage. Certain family groups were suggested before the skeletal analysis was carried out. The mixed and greatly disturbed burials of sks. 1/9, 2, 4, 7 and 8 was thought to be such a group. From the non-metric traits, it seems possible that at least 1, 2 and 4 were related. Other groups which may have been closely related, based on the evidence of combined cranial and post-cranial traits, were as follows: Group 1: Sk. 14 - CW, LW, PF1, 6S. Sk. 31 - CW, LW, PF1, 6S, AC. Sk. 32 - CW, LW, AB, MT Group 2: Sk. 3 - CW, SW, LW, DHC, PCT. Sk. 5 - CW, SW, LW, M, AB, ADF, PF1. Sub-Group I Sk. 27 - CW, SW, LW, DHC, PF1. Sk. 1 - CW, LW, DHC, TP, AC. Sk. 2 - CW, LW, TP. Sub-Group II Sk. 4 - CW, LW, PCT, TP, MT. Group 3: Sk. 34 - CW, AB, PN EB, TP. Sub-Group I Sk. 35 - CW, EB. Sk. 25 - CW, PN, TP. Sub-Group II Sk. 36 - CW, SW, PN, ADF, TT, AC. Sk. 42 - CW, LW, PN, AC. Sk. 26 - CW, LW, PN, TP, AC, TT. Sub-Group III Sk. 24 - CW, LW, DHC, PN, EB, TP, MT, ADF. Group 4: Sk. 43 - SA. Sk. 50 - LW, EB, SA, TT. Sub-Group I Sk. 49 - CW, LW, DHC, SA, TT. Sk. 28 - CW, LW, EB, TP, TM, 6S Sub-Group II Sk. 30 - LW, EB, TP These four groups may have a lesser relationship with each other, and skeletons 37 (CW, LW, DHC, TP, TT) and 39 (CW, LW, DHC, PCC, M, TT) may also belong somewhere in this possible extended family. However, as stated by the present writer in the report on the Guisborough Priory skeletons (Anderson, forthcoming), ‘it must be remembered...that any such “relationships” are entirely based on supposition - they cannot and must not be regarded as fact. They are merely shown here to suggest some evidence of possible interbreeding within this small population, which is also suggested by the high levels of certain of the rarer traits.’ The estimated time span of burial at Guisborough (340 years) suggests an average burial rate (for this group) of one interment every seven years. This makes the possibility of establishing relationships between skeletons even less likely. All of the evidence presented in this section should be treated with speculation and caution. Genetic affinity of all these traits is far from being proven, although in the majority it is very likely. At least some of the groupings noted at The Hirsel and Guisborough seem unlikely to have occurred by chance, but, as stated above, they must not regarded as factual relationships between what are after all only the last remains of once living people.

87
Figure 5.7. Non-metric traits at Guisborough.