5. Wool Measurement Principles & Sampling Techniques€¦ · & Sampling Techniques Peter...
20
5. Wool Measurement Principles & Sampling Techniques Peter Sommerville, Peter Baxter & Tim Steere Learning objectives By the end of this topic, you should have: an understanding of the essential technical requirements of wool measurement systems an understanding of the sources of variation within wool metrology systems knowledge of the procedures by which metrology standards are developed, including the role of IWTO, and knowledge of the procedures whereby the technical limitations of metrology systems is managed the meaning of common statistical terms used in wool metrology the development of standard test methods Describe the reason grab and core samples are taken from wool bales Describe the equipment used for grab and core sampling wool bales Understand the sampling factors that influence the precision of wool test results Key terms and concepts Mean Fibre Diameter, Wool Base, Vegetable Matter Base, Staple Length and Strength, Precision, Accuracy, Bias, Errors, Sensitivity, Selectivity, Equivalence, Retests, Maximum Retest Ranges, Confidence Intervals, Variance, Standard Deviation, Mean, IWTO, Mean, variance, standard deviation, coefficient of variation, standard error, Student's t test, confidence limits, correlation, regression, precision, bias, accuracy, components of variance, variance models, Grab sample, core sample, grab machine, grab jaw, core machine, pack slitter, grab schedule, core schedule, pack waste, 5.1 About wool metrology What is wool metrology? Put quite simply, metrology is the science of measurement. In broad terms metrologists are generally focussed upon developing (evaluating) technologies and systems for objectively measuring the quality attributes of raw materials and manufactured products. This general definition applies as much to wool as to any other material. Why measure wool? It is essential that raw materials and products meet the requirements of those who use them (Sommerville 1998). This fitness for use defines their quality. There are two general aspects of quality: quality of design and quality of conformance. Raw materials and products are generally available in various grades or levels of quality. These variations are often intentional, and consequently the appropriate technical term in such instances is quality of design. For example, all wool suits serve the same basic function, but they are available in a range of designs, fabrics and prices, aimed at specific market segments. On the other hand, quality of conformance is how well the product conforms to the specifications and tolerances required by the design. Quality of conformance is influenced by a number of factors. In the case of wool suits these may include the following: Variability of the greasy wool Choice of the manufacturing processes Operation of these processes Training and supervision of the work force Type of quality-assurance system (process controls, tests, inspection activities etc.)
Transcript of 5. Wool Measurement Principles & Sampling Techniques€¦ · & Sampling Techniques Peter...

5. Wool Measurement Principles & Sampling Techniques
Peter Sommerville, Peter Baxter & Tim Steere
Learning objectives By the end of this topic, you should have:
an understanding of the essential technical requirements of wool measurement systems an understanding of the sources of variation within wool metrology systems knowledge of the procedures by which metrology standards are developed, including
the role of IWTO, and knowledge of the procedures whereby the technical limitations of metrology systems is
managed the meaning of common statistical terms used in wool metrology the development of standard test methods Describe the reason grab and core samples are taken from wool bales Describe the equipment used for grab and core sampling wool bales Understand the sampling factors that influence the precision of wool test results
Key terms and concepts
Mean Fibre Diameter, Wool Base, Vegetable Matter Base, Staple Length and Strength, Precision, Accuracy, Bias, Errors, Sensitivity, Selectivity, Equivalence, Retests, Maximum Retest Ranges, Confidence Intervals, Variance, Standard Deviation, Mean, IWTO, Mean, variance, standard deviation, coefficient of variation, standard error, Student's t test, confidence limits, correlation, regression, precision, bias, accuracy, components of variance, variance models, Grab sample, core sample, grab machine, grab jaw, core machine, pack slitter, grab schedule, core schedule, pack waste,
5.1 About wool metrology What is wool metrology? Put quite simply, metrology is the science of measurement. In broad terms metrologists are generally focussed upon developing (evaluating) technologies and systems for objectively measuring the quality attributes of raw materials and manufactured products. This general definition applies as much to wool as to any other material.
Why measure wool? It is essential that raw materials and products meet the requirements of those who use them (Sommerville 1998). This fitness for use defines their quality. There are two general aspects of quality: quality of design and quality of conformance. Raw materials and products are generally available in various grades or levels of quality. These variations are often intentional, and consequently the appropriate technical term in such instances is quality of design. For example, all wool suits serve the same basic function, but they are available in a range of designs, fabrics and prices, aimed at specific market segments. On the other hand, quality of conformance is how well the product conforms to the specifications and tolerances required by the design. Quality of conformance is influenced by a number of factors. In the case of wool suits these may include the following:
Variability of the greasy wool
Choice of the manufacturing processes
Operation of these processes
Training and supervision of the work force
Type of quality-assurance system (process controls, tests, inspection activities etc.)

5-2 ________________________________ WOOL472/572 Wool Biology and Measurement
© 2014 The Australian Wool Education Trust licensee for educational activities University of New England
Extent to which these quality assurance systems are followed, and
Motivation of the workforce to achieve quality. Every product, including wool, possesses a number of elements that jointly describe its fitness for use. These elements are often called quality characteristics. Quality characteristics may be of several types, for example:
1. Physical: length, weight, fineness, yarn evenness 2. Sensory: handle, feel, appearance, colour 3. Time Orientation: reliability, durability, serviceability.
Subjective judgements are prone to error. In Figure 5.1, one table seems more elongated than the other - but their dimensions are in fact identical. The study of perception is a whole area of science by itself, and there is more than ample evidence of how easily human senses are fooled.
Figure 5.1 Fooling the eye. Source: Holmes (1998).
Quality characteristics can be estimated subjectively, or they can be assigned a numerical value using objective measurements. Traditionally, the hand and the eye were the major tools used to determine the value and processing attributes of wool, but the hand and the eye alone are prone to error (see Figure 5.1). Today, at all levels of the industry, technology providing objective measurements is increasingly replacing the senses of vision and touch. Generally it is difficult (and expensive) to provide customers with raw materials and products that have flawless quality characteristics. A major reason for this difficulty is variability. There is a certain amount of variability inherent in any raw material or product and consequently any two products can never be identical. Wool is an extremely variable material. It varies along the fibre, between fibres, between staples, between animals, between mobs, between bloodlines and between regions. If the wool industry wishes to improve quality and reduce overall cost it must find ways of restricting or controlling the impact of this inherent variability of the fibre on the quality of finished textile products. Wool metrologists have provided us with some of the means to do this.
What are the measurable quality characteristics of wool? Describing wool As wool progresses from the sheep's back to a product in a retailer's store it undergoes a number of transformations. These include scouring, carding, combing, spinning, weaving, dying and making up. Greasy and Scoured Wool is described generically as "Raw Wool". Carded wool is described as "Wool Sliver" and when combed, as "Wool Top". Both carded and combed wool are commonly

generically described as "Wool Sliver". Once the sliver is spun the generic description becomes "Wool Yarn" and once the yarn is woven it becomes "Wool Fabric". Raw Wool, Wool Sliver, Wool Yarn, and Wool Fabric have different "quality characteristics" and specific test methods have been and are being developed to objectively measure these characteristics. While the focus of this topic is on metrology directed at quantifying the quality characteristics of raw wool and sliver, many of the concepts are equally applicable to yarns and fabrics.
What can be measured? Greasy wool The important parameters that can now be measured for greasy wool are:
Wool Base
Vegetable Matter Base and Hardheads and Twigs
Mean Fibre Diameter, Standard Deviation and Coefficient of Variation of Diameter
Staple Length, Strength and Position of Break
Colour (Brightness and Yellowness), and
Bulk. A small proportion of the Australian clip is also certified for colour. Contrast this with the New Zealand clip where almost 100% is measured for colour. Similarly 70% of Australian Wool is measured for Staple Length and Strength whereas only a minor proportion is measured in New Zealand. Some of these parameters assume different importance depending upon the breed of sheep from which the wool is harvested and the commercial requirements in the country of origin. Other, non-certified information, such as Mean Fibre Curvature and Vegetable Matter broken down into Burrs and Seed and Shive (as well as Hard Heads and Twigs, and Along Fibre Profile, and Dark and Medullated Fibre is also available. Scoured Wool. Essentially the same parameters can be measured for scoured wool as can be measured for greasy wool. The major exception is Staple Length and Strength as once greasy wool is scoured the conformation of the merino wool staple is destroyed. Instead fibre length of scoured wool can be measured as "Length after Carding". Commonly, measurements are also made on the moisture content (expressed as regain), grease content and ash content. Occasionally the pH of the scoured wool is also measured.
Wool sliver The key parameters that can be measured on wool sliver are:
Hauteur
Barbe
Colour
Contamination by dark fibres and/or neps
Moisture Content expressed as regain
Grease content.

5-4 ________________________________ WOOL472/572 Wool Biology and Measurement
© 2014 The Australian Wool Education Trust licensee for educational activities University of New England
5.2 Technical requirements of wool metrology systems Basic concepts Table 5.1 Objective criteria for evaluating testing systems. Source: Sommerville (2001).
Criterion Numerical Measure
1. Precision Absolute Standard Deviation Relative Standard Deviation Coefficient of Variation Variance
2. Bias Absolute Systematic Error Relative Systematic Error
3. Sensitivity Calibration Sensitivity Analytical Sensitivity
4. Detection Limit Blank plus 3 times the standard deviation of the blank
5. Range Limit of quantitation (LOQ) to limit of linearity (LOL)
6. Selectivity Coefficient of Selectivity
Sampling - the number one issue Objective determination of defined characteristics of materials usually involves measurements based on a small proportion of the total material of interest. In materials that are homogeneous, obtaining a representative sub-sample of the whole is a relatively simple problem. Where there is heterogeneity, obtaining a sub-sample that is representative of the whole is a much more difficult task. Wool is clearly a heterogeneous material. Sampling is the first and most important step in any wool testing system.
Accuracy and precision Precision describes the reproducibility of results - that is, the agreement between numerical values of two or more replicate measurements, or measurements that have been made in exactly the same way. Generally, the precision of a testing system can be obtained simply by repeating the measurement, using the same technique, a number of times. Precision is often confused with accuracy. Accuracy simply describes the correctness of a result and must always be determined by reference to a primary system. Strictly speaking, the only type of measurement that can be described as completely accurate is one that involves counting objects. All other measurements contain errors and are really only approximations or estimates. Ideally, the accuracy and the precision of any measurement system will be identical, but frequently they are not. It is quite possible to have a very precise secondary measurement system (the answers are highly reproducible), which differs consistently from the “true” value. This does not limit its usefulness, provided it is used in all instances where comparisons must be made. However, without a primary system against which a secondary system can be calibrated, there is always a risk that the values provided by a secondary system will not be consistent when determined by different facilities or over a period of time. Three terms are widely used to describe the precision of a set of replicate data:
standard deviation
variance, and
coefficient of variation. These terms have statistical significance and are defined, together with some related terms, in Table 5.2. The main objective in standardising any testing system is to ensure a predictable and commercially acceptable precision of the measurements.

Table 5.2 Defining the precision of analytical methods. Source: Sommerville (2001).
Terms Definition
Absolute Standard Deviation
1
1
2
N
xx
s
N
i
i
Relative Standard Deviation
x
sRSD
Standard Deviation of the Mean,
N
ssm
Coefficient of Variation 100
x
sCV
Variance of the mean 2ms
Confidence Level (95%) 296.1 msCL
ix = numerical value of the ith measurement
x = the mean of N measurements = N
x
N
i
i1
Bias Analysts are concerned with two types of errors:
random or indeterminate errors, and
systematic or determinate errors. The error in the mean of a number of replicate measurements is equal to the sum of these two errors. Random or indeterminate errors impact upon precision. Bias may have little or no effect on precision, but it has a significant effect upon accuracy. Bias is a result of systematic or determinate errors. Systematic errors always act in one direction, resulting in a consistently larger or a consistently smaller result than that provided by the reference measurement. In general, bias can only be determined by reference to measurements provided by primary measurement systems (i.e. systems based on direct reference to primary metric standards such as length and weight). Bias can exist between measurements provided by secondary measurement systems (systems calibrated against primary systems), but unless the bias can be confirmed by reference to a primary measurement system, the analyst may never be sure whether one or both of the secondary measurement systems are responsible for the bias. Bias can result from several causes, and generally, these can be classified into one of six groups.
Sampling: Inadequate design of sampling systems can result in a sample that is biased. A biased sample may still be useful depending on the intended use of the measurements made on the sample. Samples taken from a defined location on sheep will almost certainly be a biased representation of their fleeces. If the purpose of these samples is to obtain information to assist in ranking sheep for breeding purposes, the bias can be acceptable, provided it is similar across all sheep to be ranked. However, if the purpose of the samples is to obtain information to predict characteristics in classed lines of wool produced from the sheep, then the bias may be unacceptable
Differences in fundamental assumptions: In the case of wool fibre fineness, different assumptions about the geometry of the fibre by different instrumental methods, may lead to bias
Personal errors: Bias can also be the result of blind prejudice. Most of us, however honest, have a natural tendency to estimate scale readings in a direction that improves the precision of a set of results, or causes the results to fall closer to a preconceived notion of the true value. When sampling wool this source of bias is particularly important. Measurement of

5-6 ________________________________ WOOL472/572 Wool Biology and Measurement
© 2014 The Australian Wool Education Trust licensee for educational activities University of New England
staple length and strength requires the selection of a representative set of wool staples. In the early stages of the development of the IWTO Test Method, it was observed that staff with wool knowledge generally selected a set of staples that were longer than those selected by staff with little or no wool knowledge
Instrumental errors: Bias can be caused by instrument drift, or by assumptions made by the technology used in the instrument. The OFDA 100 instrument, used for determining the mean fibre diameter distribution characteristics of wool has been shown to exhibit biases in either Mean Fibre Diameter or Standard Deviation of Diameter, depending upon how the calibration samples are prepared. The instrument must use separate calibration systems for unbiased estimates of either parameter
Method errors: An example of this type of bias is the failure to maintain rigid control over the environmental conditions that impact upon the measurement (for example temperature and humidity, or measuring fibre diameter without removing attached grease, wax and suint)
Interferences: Bias can also be caused by interferences that arise from the constituents of the sample. In fibre measurements, where most methods use physical measurement techniques, bias from this source is unlikely, provided the sample is prepared appropriately. In the case of fibre diameter, the presence of extraneous material such as a synthetic fibre, or very fine vegetable matter, is an example of this effect. Bias may be constant over the range of variation of the characteristic being measured, or it may vary over this range. One of the objectives of standardising wool testing systems is the elimination or at least the minimisation of bias. Where bias cannot be eliminated, provided it is not level dependent, the measurement technology may still be useful.
Figure 5.2 This illustration demonstrates the difference between ACCURACY, PRECISION and BIAS. The “true” result is defined as the point where the two lines intersect and the 4 dots represent the results of 4 separate measurements. Source: Douglas (2000).
Sensitivity Sensitivity of an instrument or a testing system refers to its ability to discriminate between small differences in the material being analysed. In wool testing three factors limit sensitivity:
the slope of an instrument’s calibration curve

the precision of the instrument, and
the error in the sampling system. If two instruments have equal precision the one having the steeper calibration curve will have the greater sensitivity. Conversely if two instruments have calibration curves with identical slope, the one having the greater precision will have the greater sensitivity. In testing wool, the errors arising from sample variation are generally so large that they mask any differences in sensitivity between measurement instruments.
Detection limit The detection limit is a minimum value of the characteristic being measured that can be detected at a known confidence level. This is not an important issue, for example, when measuring mean fibre diameter, because wool fibres never approach zero fineness, and most measurements are conducted within ranges that exceed the probable detection limit by factors greater than three. However, if attempts currently underway to produce ultra fine flocks succeed (see AWTA May 2001 Newsletter, downloadable from http://www.awta.com.au) then this may become an increasingly important factor. It is already a very important factor to be considered in developing instruments to measure dark fibre contamination in wool, because the minimum quantity of such fibres generally considered to be important is extremely low.
Range The useful range of an analytical method can be defined as the lowest point at which a measurement can be made (the detection limit or the LOQ), to the point at which the calibration departs from linearity (LOC). However, some measurement systems have non-linear calibration functions. The useful range in these instances is more difficult to define.
Selectivity Selectivity refers to the degree to which the analytical method is free from interferences by other species in the sample matrix. This is generally not a major issue when testing wool. However, as indicated previously, it may be an issue for measurement of fibre diameter if extraneous synthetic fibres or very fine vegetable matter is present in the sample.
5.3 The role of IWTO Background The International Wool Textile Organisation or IWTO (also known as the Federation Laniere Internationale) was established in 1928 as an arbitration body for the international trade of wool and wool products, and was born out of an arbitration agreement signed between the representative bodies of the British and French wool-textile industries in 1927. Its primary objectives are:
to maintain a permanent connection between the Wool Textile Organisations of member- countries
to represent the Wool Textile Trade and Industry in all branches of economic activity to promote, support or oppose measures or activities affecting the trade and industry to promote the study and solution of economic and commercial questions affecting the
trade and industry to ensure the functioning of the International Arbitration Agreement in the Wool Textile
Trade and Industry to collect and disseminate statistical and other information of interest to the Trade and
Industry to develop and maintain International Standards and Regulations for objectively
measuring the characteristics of raw wool, wool sliver, yarns and fabrics.
5.4. Technical limitations of wool metrology systems With the universal use of Test Certificates to define the specification of a wool trading contract, the accuracy and precision of the test results are sometimes questioned. This is particularly so

5-8 ________________________________ WOOL472/572 Wool Biology and Measurement
© 2014 The Australian Wool Education Trust licensee for educational activities University of New England
as new measurements are introduced and there is no relaxation of commercial specifications in contracts Questions that are frequently asked include:
Why aren’t repeat results identical?
Why do repeat results differ most of the time? Genetics, environment and nutrition, management and disease influence the properties of wool
as a natural fibre. Wool is a variable commodity and wool testing is used to provide an estimate of these properties based on a sample taken from the bulk. When this variable commodity is sampled and tested this, the components of that variation, and variation introduced by the adoption of the official IWTO Methods and Regulations, contribute to each result. For example, the Confidence Limits are calculated from components of variance, which include:
between-core or between-grab variation;
within-laboratory variation; and
between-laboratory variation.
Between-core/between-grab variation This source of variation is beyond the control of the Test House, and is largely beyond the control of the wool classer, since much of the variation occurs within individual fleeces. This variation differs for wools of different origins and extreme wool types. For example, core sampling schedules are based on taking sufficient number of cores to achieve a sampling precision of ± 0.7% Wool Base. More cores/bale must be taken from bales of South American wools than for Australian wools in order to obtain a similar precision, because the bales of South American wools are usually more variable for yield than Australian wools.
Within-laboratory variation Within a laboratory, minor equipment and operator differences can exist. Stringent quality control, equipment maintenance and supervision minimises this source of operator variation. The procedure of measuring subsamples/specimens on different instruments reduces the effects of variation between machines and operators. For example, the IWTO Airflow Test Method, OFDA Test Method and Laserscan Test Method requires 2 instruments to be used and the results averaged for certification. Similarly, staples sampled for ATLAS Staple Length and Strength certification must be prepared by at least 4 operators to minimise bias of any individual operator who might consistently draw longer or shorter staples.
Between-laboratory variation The subject of bias has already been discussed. Even with bias eliminated, a component of variation between laboratories exists. Each instrument will give some small difference in performance, and laboratory procedures may differ in their interpretation. In addition, the amount of testing conducted has a direct relationship with the precision of the answer - the greater the amount of testing the more repeatable is the test result. Testing multiple samples randomises some of the within laboratory effects and increases the chance of identifying an error before the result is issued. When developing test methods, the sources of variation are determined from international inter-laboratory trials. These data form the basis for the calculation of the precision limits of the new method. Precision of a test result is also dependent upon the amount of sampling and testing conducted. The greater the amount of sampling and testing, the better the precision of the test result. The precision of an individual test result is usually expressed as 95% Confidence Limits, i.e. the limits on either side of the “true” result within which you can expect 95 of 100 repeat measurements to lie. The 95% Confidence Limits for Wool Base, Vegetable Matter Base, Mean

Fibre Diameter, Colour, Staple Length and Strength measurements as defined in the IWTO Test Methods and Regulations are shown in Column A of Table 5.3. Table 5.3 Precision limits and maximum retest ranges.
TEST TYPE A
95% CONFIDENCE LIMIT (+/-)
B 95% CONFIDENCE LIMIT
(+/-)
WOOL BASE(%)
Up to 40 2.2 3.1
40.1 to 45.0 1.9 2.8
45.1 to 50.0 1.7 2.5
50.1 to 55.0 1.5 2.1
55.1 to 60.0 1.3 1.9
60.1 to 65.0 1.2 1.8
Above 65.0 1.1 1.6
VM BASE(%)
Up to 0.5 0.1 0.3
0.6 to 1.0 0.3 0.5
1.1 to 1.5 0.4 0.6
1.6 to 2.0 0.5 0.8
2.1 to 3.0 0.6 1.0
3.1 to 5.0 0.9 2.0
above 5.0 1.0 to 2.0
3.2
MEAN FIBRE DIAMETER
(µm)
Airflow OFDA LSN Airflow OFDA LSN
15.0 0.3 0.3 0.2 0.5 0.4 0.3
20.0 0.5 0.4 0.4 0.6 0.4 0.4
25.0 0.6 0.5 0.5 0.8 0.6 0.5
30.0 0.7 0.6 0.6 1.0 0.7 0.7
35.0 0.8 0.7 0.7 1.1 0.9 0.9
40.0 0.9 0.8 0.9 1.3 1.0 1.1
AVERAGE YELOWNESS
(units) 1.5 2.1
STAPLE LENGTH
(mm)
Fleece Non-Fleece Fleece Non-Fleece
4.8 5.4 7 8
STAPLE Strength
(N/kt)
Fleece Non-Fleece Fleece Non-Fleece
5.9 5.9 8 8
Check tests and retests When test results are questioned by the trade, the Test House usually has a policy to conduct check tests and retests. The procedures are well defined in the IWTO Regulations. Because of the inherent variation, a check test will normally give a slightly different answer to the original test even if no “error” exists. Provided it falls within a statistically based Maximum Retest Range, defined by IWTO, the original and check test data are combined and reissued. No error has occurred in this situation. When a check test or retest exceeds the Maximum Retest Range, an error is acknowledged. This may be obvious, or resolved with additional sampling and/or testing. A new result without the original data is issued. For information, the IWTO Maximum Retest Ranges for Wool Base, VM Base, Mean Fibre Diameter, Colour, Staple Length and Staple Strength are shown in Column B of Table 5.3.
5-10 ______________________________ WOOL472/572 Wool Biology and Measurement
© 2014 The Australian Wool Education Trust licensee for educational activities University of New England
The key rule for retests, check tests or record check tests is that if the extra data is compatible, i.e. the difference falls within the Maximum Retest Range, then the additional data are combined with the original data and becomes the new result. If the data exceeds the Maximum Retest Range, i.e. an error has deemed to have occurred, then the original result is withdrawn and the new data issued as the result. While attention often focuses on individual errors, only 0.2% of AWTA Ltd Certificate results are requested to be checked by the trade. Only 0.02% of all Certificate results are found to be in error.
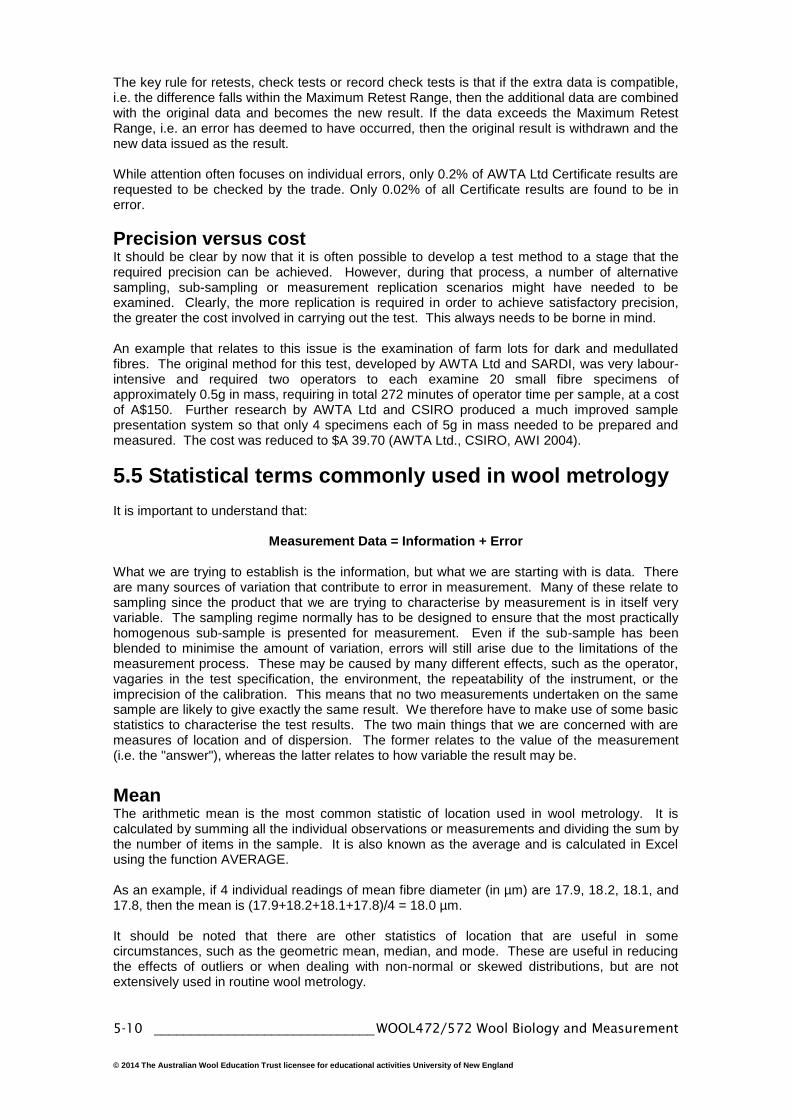
Precision versus cost It should be clear by now that it is often possible to develop a test method to a stage that the required precision can be achieved. However, during that process, a number of alternative sampling, sub-sampling or measurement replication scenarios might have needed to be examined. Clearly, the more replication is required in order to achieve satisfactory precision, the greater the cost involved in carrying out the test. This always needs to be borne in mind. An example that relates to this issue is the examination of farm lots for dark and medullated fibres. The original method for this test, developed by AWTA Ltd and SARDI, was very labour-intensive and required two operators to each examine 20 small fibre specimens of approximately 0.5g in mass, requiring in total 272 minutes of operator time per sample, at a cost of A$150. Further research by AWTA Ltd and CSIRO produced a much improved sample presentation system so that only 4 specimens each of 5g in mass needed to be prepared and measured. The cost was reduced to $A 39.70 (AWTA Ltd., CSIRO, AWI 2004).
5.5 Statistical terms commonly used in wool metrology It is important to understand that:
Measurement Data = Information + Error What we are trying to establish is the information, but what we are starting with is data. There are many sources of variation that contribute to error in measurement. Many of these relate to sampling since the product that we are trying to characterise by measurement is in itself very variable. The sampling regime normally has to be designed to ensure that the most practically homogenous sub-sample is presented for measurement. Even if the sub-sample has been blended to minimise the amount of variation, errors will still arise due to the limitations of the measurement process. These may be caused by many different effects, such as the operator, vagaries in the test specification, the environment, the repeatability of the instrument, or the imprecision of the calibration. This means that no two measurements undertaken on the same sample are likely to give exactly the same result. We therefore have to make use of some basic statistics to characterise the test results. The two main things that we are concerned with are measures of location and of dispersion. The former relates to the value of the measurement (i.e. the "answer"), whereas the latter relates to how variable the result may be.
Mean The arithmetic mean is the most common statistic of location used in wool metrology. It is calculated by summing all the individual observations or measurements and dividing the sum by the number of items in the sample. It is also known as the average and is calculated in Excel using the function AVERAGE. As an example, if 4 individual readings of mean fibre diameter (in µm) are 17.9, 18.2, 18.1, and 17.8, then the mean is (17.9+18.2+18.1+17.8)/4 = 18.0 µm. It should be noted that there are other statistics of location that are useful in some circumstances, such as the geometric mean, median, and mode. These are useful in reducing the effects of outliers or when dealing with non-normal or skewed distributions, but are not extensively used in routine wool metrology.

Variance The variance is the most fundamental statistic used to represent variability. Variability is represented by the differences of the individual observations from the mean, but it only takes a moment's thought to realize that the sum of the differences from the mean must always be zero, so variability must be measured in a manner that ignores the sign of the differences. The variance is the sum of the squares of the differences between the individual observations and the mean, divided by the number of degrees of freedom. The degrees of freedom concept can become complex, but in univariate statistics is usually the number of observations minus one (n-1). In the example above, the variance may be calculated as follows:
Mean observation difference square
18.0 17.9 -0.1 0.01
18.0 18.2 +0.2 0.04
18.0 18.1 +0.1 0.01
18.0 17.8 -0.2 0.04
Sum of squares 0.10
Divided by (n-1) = variance 0.033
The units of variance are the measurement unit squared, so in the example above, the units are µm². Variance can be calculated in Excel using the function VAR.
Standard deviation Whilst variance may represent the fundamental statistic of dispersion, it is not the easiest to work with since its units are squared. The standard deviation is the square root of the variance and is an easier statistic to visualise since the units are once again those of the original measurement. In Excel the appropriate function is STDEV. The standard deviation simply represents the amount of variation associated with a group of measurements or observations. In the example above, the standard deviation of these 4 measurements is the square root of 0.033 = 0.18 µm.
Coefficient of variation (CV) For some wool properties, the value of the standard deviation varies with the value of the mean. A common example is the standard deviation of fibre diameter, which on average increases as the mean fibre diameter increases. This sometimes makes it difficult to compare levels of variation. The coefficient of variation is a 'normalised' form of the variation and is calculated by dividing the standard deviation by the mean and is expressed as a percentage. It has been shown, for example, that the average coefficient of variation of fibre diameter is close to 19% for fleece samples across a very wide range of diameters, whereas the average standard deviation varies from 2 µm at 12 µm to 10 µm at 44 µm (Baxter & Cottle 1998). In the example we have been working with, the coefficient of variation of the 4 measurements is 100 * (0.16 / 18.0) = 8.9%.
Standard error and hypothesis testing There is often confusion amongst students about the difference between standard deviation and standard error. Standard error is associated with a statistic as opposed to standard deviation, which usually describes a group of measurements or observations. Standard error is a method of describing uncertainty or precision of a statistic such as the mean, regression coefficients, correlation coefficient, etc. Statistical texts describe how the standard error may be determined for most common statistics. However, it is important to understand the most common use of standard error – in estimating the precision of a mean. This is easily calculated as the standard deviation of the group of measurements, divided by the square root of the number of measurements. In the example above, the standard error of the mean value of 18.0 is 0.18 / sqrt (4) = 0.09 µm.

5-12 ______________________________ WOOL472/572 Wool Biology and Measurement
© 2014 The Australian Wool Education Trust licensee for educational activities University of New England
The standard error is used in judging whether two statistics are similar or likely to be significantly different. In statistics textbooks this subject is covered under "hypothesis testing". The most common application of hypothesis testing in wool metrology is to assess whether the average differences between the paired values of two groups of measurements is likely to be zero. For example, some slightly different treatment might be applied to a processing route, and the requirement is to establish whether the change has a significant effect or not. Whilst there is insufficient scope in this topic to cover this subject in the depth required, the student is referred to any standard text on Basic Statistics. We shall very briefly cover the Student's t test.
Student's T Test This test assumes that the distribution of observations is normal (see below). The Student's t statistic is used to test a hypothesis. To test whether the average paired differences between two sets of measurements is likely to be zero, the so-called "null hypothesis" is that the mean difference = 0.0. To test this, the actual mean difference is divided by the standard error of the mean, and the resulting t value compared with a standard table of critical values of the t-distribution. Such a table lists the limiting values as function of probability and number of degrees of freedom, and is usually displayed as 'two-tailed' values (in other words it doesn't matter whether the difference is greater or less than the null hypothesis value, whereas a 1-tailed test would be used, for example, if the hypothesis were that the difference was greater than a certain value). For a simple group of paired differences, the number of degrees of freedom is simply the total number of differences minus 1. In 'normal' practice the probability value chosen is 0.05. It should be noted that whilst this value is in common use, there is no theoretical or absolute reason for this choice, and whilst it very often used rigidly in applying the test, common sense should also be used. In a simple example, the differences between measurements carried out by A method and B method on the same 6 samples are: 0.5, 0.6, -0.2, 1.3, 0.8, and 0.7. The mean difference is therefore 0.62, standard deviation 0.49, and standard error 0.20. The t statistic is 0.62 / 0.20 = 3.1, and from the critical values of the t distribution table, with 5 degrees of freedom, the 0.05 probability value is 2.571 and the 0.01 probability value is 4.032. One could therefore conclude that at between the 0.01 and 0.05 probability levels, the null hypothesis (that the mean difference is zero) is unproven, i.e. it is reasonable unlikely that the mean difference is zero for this small sample set. The observant student will have noticed that as the number of observations increases, the standard error is likely to decrease, and therefore the power of the test will increase. Students are advised to study this issue, since it is important in the design of experiments – the smaller the average difference that one is examining, and the larger the variance in the measurement system, the greater the number of samples required to prove or disprove a specific hypothesis. Excel provides a useful function TDIST, which allows the calculation of probability from a given t-value, number of degrees of freedom, and for either the 1-tailed or 2-tailed situation. Whilst there is also a function TTEST, this compares two arrays and is not useful for examining paired differences, which is the most frequent type of test required in wool metrology.
95% Confidence limits In terms of a probability of a single measurement giving a value related to the "true" value, we use the concept of a probability distribution, which simply put, relates the probability that a single measurement will yield a result somewhere near the true value. Luckily, most wool measurements follow a "normal" probability distribution, which is one of the more common probability distributions in nature. (Whilst wool fibre diameter distributions technically tend to follow a lognormal distribution, the degree of non-normality is relatively small and is generally ignored.) Normal distributions are a family of distributions that have the same general shape. They are symmetric with scores more concentrated in the middle than in the tails. Normal distributions are sometimes described as bell shaped.

The height of a normal distribution can be specified mathematically in terms of two parameters: the mean and the standard deviation. This is very convenient, since if we have values for the mean and standard deviation, we can calculate the probability of values appearing within certain ranges, and these are tabulated in standard texts. For example, 68.3 % of observations fall within ± 1 standard deviation from the mean; 95.5% fall within ± 2 SDs, and 99.7% fall within ± 3 SDs.
Figure 5.3 Normal distribution curve. Source: Baxter (2006).
Once we have assumed that the measurements follow a normal distribution, and we have some information about the variability of that measurement, then we can start to express a level of confidence about an individual measurement representing the "true" value. The two levels of confidence that are normally used in wool metrology are 95% (±1.960 sd) and 99% (±2.576 sd), representing the probability that 95 times out of 100, or 99 times out of 100 respectively, that the measurement will lie within a specified distance of the "true" value (again, in the absence of bias). The precision of wool measurements is often expressed as the 95% confidence level (95%CL). This is determined by calculating the total variance associated with the sampling and measurement process and converting this to a standard deviation. We know, from the shape of the normal distribution, that 95% of all measurements in a normal distribution will lie within ± 1.96 standard deviations of the mean, so the 95%CL is simply obtained by multiplying the standard deviation by 1.96. So, for example, in Table D3 of IWTO-12, the test method for using the Sirolan-Laserscan, the total variance of the method for aqueous scoured cores of less than 26.0 µm mean fibre diameter is calculated to be 0.0364 µm². The 95%CL is therefore 1.96 * sqrt (0.0364) = 0.37 µm A confidence interval is a contiguous range of values within which the “true” value of the statistic will be found with some predetermined probability. So in the case of a Laserscan result of, say, 20.0 µm mean fibre diameter, the 95% confidence interval using these figures would be 19.63 to 20.37 µm. Confidence limits can be calculated in Excel using the function CONFIDENCE. For a detailed and relatively technical exposition on the practical application of confidence limits to measurement processes, refer to the 'Guide to the Expression of Uncertainty in Measurement'. This is regarded as the reference document by accreditation authorities.
Correlation Correlation measures the intensity of association between a pair of variables. It is mathematically related to regression, but is not the same thing. In correlation we are concerned about whether two variables might co-vary – that is, vary together; whereas in regression analysis we are trying to describe the dependence of one variable on another independent

5-14 ______________________________ WOOL472/572 Wool Biology and Measurement
© 2014 The Australian Wool Education Trust licensee for educational activities University of New England
variable. In the first case we are exploring possible associations, in the 2nd
, we are concerned with modelling a circumstance where one variable is known to have an effect on another, and might, therefore, be used to predict another. As a simple example, we might use correlation to discover that there is a degree of association between standard deviation and mean fibre diameter. We would be unlikely to use this association as a method to build a model to predict mean fibre diameter, but, we might, under some circumstances want to use regression to build a model to predict standard deviation from a mean fibre diameter measurement. We would, therefore, be using mean fibre diameter as the independent variable, and standard deviation as the dependent variable – in correlation there is no such distinction – all variables are "equal". It is also not uncommon to find that two variables might be associated (as with a high correlation coefficient), but only because a third variable affects both of them. In other words the correlation is not causative, and we should be careful to avoid such assumptions, although the temptation is always on hand. There are a number of correlation statistics in use, but we need not be concerned with them here. The most common is the Pearson product-moment correlation. The method of calculation is shown in all standard texts and a tool exists in Excel (CORREL or PEARSON). Correlation coefficients vary from -1 to +1, with -1 being a perfect negative association and +1 being a perfect positive association and 0 being no association. A point to be aware of is that correlation coefficients increase as the range of data increases even though the same degree of association may exist. Whilst correlation analysis is a useful preliminary data exploration tool, it should always be followed up by plotting any variables which you may think have a useful degree of association – one outlier can cause the correlation coefficient to be high even though the degree of association between two variables is poor. Finally, correlation coefficients are linear associations. If you have a perfect quadratic association between two variables it will come out of a correlation analysis poorly. To repeat: plot the variables.
Figure 5.4 Illustration of 6 scatterplots all with very similar correlation coefficients of approximately 0.7. Source: Dallal, G.E. (from website- www.StatisticalPractice.com).

Regression In general terms regression is used to allow one variable (the dependent variable) to be predicted from another (the independent variable). There may be more than one independent variable (for example the TEAM equations used to predict processing performance from core and staple test data). Usually the independent variable(s) is(are) deliberately varied (or samples selected) to give as wide a range of values as possible. The most common form of regression used in wool metrology is linear regression, where the dependence of Y on X is expected to follow the form:
Y = A + B * X Where A and B are the intercept (or constant) and slope coefficient respectively. In Excel these values may be calculated using the INTERCEPT, SLOPE, or LINEST functions. However, it is by no means the rule that variables must vary linearly with each other. For example, when examining the relationship between components of precision and the main variable, it may be found that a non-linear function may fit the data better (see, for example, Stubbs & Marler 1994) When calculating regressions, it commonly the practice to report the R² value. In common parlance this describes the proportion of the total variance explained by the regression. It is effectively the square of the correlation coefficient and therefore the same warnings apply to its use. When using regression to predict a variable, it always more helpful to quote the standard error of regression (SE) since this can be compared across different data sets with confidence. One further example of regression should be mentioned. Normally regression is used to predict one variable from another, but it is sometimes the case that two different measurement systems are to be compared on the same samples. In that case both X and Y variables contain measurement errors, (whereas the normal regression functions assume no error in X), and therefore more specialised techniques must be used in this instance. These are outlined in detail in IWTO-0.
5.6 Sampling Techniques
Samples are taken prior to wool being sold, generally using mechanical apparatus. Two types of samples are taken. Grab samples that are further sub sampled and tested to determine average staple length and strength and then go on to serve as samples for inspection by buyers. Core samples are taken and tested to determine yield and mean fibre diameter. Bale weights are recorded at the time of sampling. Sampling is conducted in accordance with methods determined by the International Wool Textile Organisation (IWTO). The use of standard sampling techniques allows test results to be certified which facilitates the international trade of Australian wool.
5.7 Grab sampling Grab samples are taken to create a representative sample of a sale lot, comprising of one or more bales of wool of greasy wool, which may be used for the following purposes: 1. Further sub-sampling for the determination of average staple length and staple strength 2. The subjective appraisal of unmeasured characteristics, and 3. As a display sample for perusal by prospective buyers. Grab samples are taken from sale lots using a mechanical grab apparatus. Grab samples are taken from each bale in a sale lot in such a way that every portion of wool in the sale lot has an equal chance of being selected and each bale within a sale lot is equally represented in the sample (Standards Australia 1984).

5-16 ______________________________ WOOL472/572 Wool Biology and Measurement
© 2014 The Australian Wool Education Trust licensee for educational activities University of New England
Equipment Pack Slitter Wool is generally packaged in bales made from synthetic material. Openings or slits are made from above through the surface of the bale to allow access for grab sampling. The openings are made using a pack slitter, which may be either: 1. A sharp knife or blade used to cut the pack material, or 2. A heated metal bar used to melt the synthetic pack material. Grab machine A set of hydraulically operated grab jaws that operate with a pincer action are mounted on a powerful hydraulic grab arm that moves vertically. The grab machine operates by driving the grab arm through the slit made in the pack material by the pack slitter and into the densely packed bale of wool. The grab jaws close, grasping a sample of wool, then the grab arm withdraws from the bale and the grab jaws open to release the sample. Grab machines may be automated or manually operated. They may have from one to nine grab arms.
Requirements Grab samples must be taken at random, be consistent and the final sample must be representative of the sale lot. For this to occur, the following requirements must be met (IWTO 2004): 1. Each bale in a sale lot shall be sampled 2. The same number of grab samples shall be taken from each bale in a sale lot 3. The minimum number of grab samples taken is 20, although exceptions exist for
particular types of small lots of three bales or less 4. All grab samples taken from the sale lot shall be of similar size 5. Not more than two grab samples shall be taken from any one slit 6. No grab sample of suitable size shall be excluded from the sample.
Procedure 1. Sampling positions are selected at random on the side of a bale in such a way that every
portion of wool in the bale has an equal chance of being sampled. A suggested pattern is illustrated below where the side of a bale is broken up into nine sites. Since grabs can be taken at two depths, one shallow and the other deep, this effectively creates 18 equally sized sample sites within each bale
2. Each bale is presented for grab sampling lying on its side; the surface to be sampled is facing upwards
3. If two grabs are to be taken from the same hole, the first will be shallow and the second deep
4. Individual grab samples are accumulated until the completion of sampling of the sale lot. The mass of each grab sample is approximately 250g and the final sample mass is approximately 5Kg
5. Upon completion, the grab sample is further sub-sampled for staple length and strength testing
6. The completed grab sample is presented on a show floor for appraisal of unmeasured characteristics and perusal by buyers.

Figure 5.5 Schematic of grab sampling sites on the side of a bale. Source: AWTA,
(2005).
5.8 Core sampling A Core Sample is a representative sample taken from a sale lot comprising of one or more bales of wool of greasy wool. Core sample material is tested to determine the yield and mean fibre diameter of the wool in the sale lot. Bales must be weighed at the same time that core samples are taken, and samples are sealed in airtight bags to prevent any change in the moisture content of the sample during the interval between sampling and testing. Core samples are usually taken using machines, although they can be taken using manual apparatus.
Equipment Core Machine A core machine has a coring chamber that encloses a bale during core sampling. The bale is presented in the chamber base uppermost. During core sampling a platen lifts the bale, compressing it against the top of the chamber. Hollow core tubes with removable sharpened tips or cutters are driven downwards through the base of the bale by hydraulic rams, penetrating almost the entire length of the bale. Flexible tubes connected to the core tubes evacuate the core sample material, depositing it in a plastic bag. A core machine may have multiple core tubes. The position of the core tubes can be varied.
Requirements 1. Each bale in a sale lot is core sampled 2. A minimum of 20 cores are taken from a sale lot although exceptions exist for particular types of small lots of three bales or less. The same number of core samples are taken from each bale in a sale lot. The number of core samples taken per bale is sufficient to produce a sampling precision of no worse than ± 1% IWTO Clean Wool Content at a probability level of 0.95. The minimum number of cores to be taken per bale to produce a sample having the required precision may be estimated from the following formula:
N
K w
296.1
Where: K = minimum number of cores to be taken from each bale in the lot (round up to next highest whole number). N = Number of bales in the lot.
w = Standard deviation of Clean Wool Content of cores within bales, which is 2.0 for
Australian Wool. A review of the value of σw for various wool properties is given by Russell and Cottle (1993). 1. A minimum of 750 grams of sample material is required for testing. Extra cores may be
taken if insufficient sample mass is obtained

5-18 ______________________________ WOOL472/572 Wool Biology and Measurement
© 2014 The Australian Wool Education Trust licensee for educational activities University of New England
2. The position that the core sample is taken through the base of the bale is varied and no more than one core is taken from any one position
3. The core tube enters the bale in the direction of bale compression and parallel to the sides of the bale
4. The same depth of penetration is maintained for each bale within a lot and shall be at least 93% of the length of the bale
5. Following the initial penetration of the bale, the pack material is removed or ejected from the core sample to avoid contamination of the sample and wool within the bale.
Readings
The following readings are available on web learning management systems 1. Australian Wool Testing Authority Ltd. (AWTA), 2002a, Testing the Wool Clip. 2. Australian Wool Testing Authority Ltd. (AWTA), 2002b, Testing the Wool Clip, Glossary of
Terms. 3. Australian Wool Testing Authority Ltd. (AWTA), 2005, Newsletter, April 2005. 4. Douglas, S.A.S., 2000, Wool Trading Requirements and Technical Limitations of IWTO Test
Methods, AWTA Ltd, Melbourne. 5. Sommerville, P.J., 2001, Fundamental Principles of Fibre Fineness Measurement Part 1:
The Technical and Commercial Requirements of Wool Testing Systems, AWTA Ltd. 6. Sommerville, P.J., 2002, Fundamental Principles of Fibre Fineness Measurement Part 2:
Understanding Fibre Diameter Measurement, AWTA Ltd. 7. Whan, R.B. 1973, Potential saving from the sale of wool by measurement, in: 1973,
Objective Measurement of Wool in Australia, Australian Wool Corporation. 8. Mandel, J. 1984, The Precision and Accuracy of Measurements, in the Statistical Analysis of
Experimental Data, Dover Publications Inc, Mineola, N.Y., U.S.A. chapter 6, part 1, pp 102-117 and part 2, pp 118-130.
9. Baxter, P., 2001, Precision of measurement of diameter and diameter-length profile, of greasy wool staples on-farm, using the OFDA2000 instrument, Wool Technology and Sheep Breeding, vol 49 (1), pp. 42-52. Reprinted from the 10th International Wool Textile Conference, Germany, Nov, 2000.
10. Marler, J.W. and Baxter, P. 2004. The 2003 Australian Wool Innovation On-farm fibre measurement instrument evaluation trial. Part 1: Accuracy and Precision Trials, IWTO CTF 01 May 2004, Evian.
11. IWTO, IWTO-0 (2003), Procedures for the development, review, progression or relegation of IWTO test methods and draft test methods. Appendix B, Presentation of supporting technical data. Appendix D, Statistical methods IWTO-0
12. Russell B.C. and Cottle D.J. 1993, Sampling variance in sale lots and its influence on test precision, Wool Technology and Sheep Breeding, vol. 41(2), pp. 127.
References Australian Wool Testing Authority Ltd. (AWTA), 2005, Newsletter, April 2005.
Baxter, B. P. and M. Houghton (1990). Components of variance in airflow testing of raw wool - hierarchical blending effects. IWTO, Cavtat, Yugoslavia
Baxter, B. P. and D. J. Cottle (1998). The use of midside fleece fibre diameter distribution measurements in sheep selection. Wool Technology and Sheep Breeding 46(2): 154-171
Baxter, P. (1999). The effects of calibration errors on between-laboratory and between-instrument diameter comparisons. IWTO, Nice
Baxter, P. (2001). Precision of measurement of diameter and diameter-length profile, of greasy wool staples on-farm, using the OFDA2000 instrument. Wool Technology and Sheep Breeding 49 (1): 42-52
Dallal, G.E., (undated). The little handbook of statistical practice. Statistics online tutorials available from http://www.StatisticalPractice.com
Holmes, B. 1998, ‘Irresistible Illusions,’ New Scientist, No. 2150, pp. 37.
International Wool Textile Organisation (IWTO), various Test Method Specifications, www.iwto.org.

International Wool Textile Organisation (IWTO), Regulations, www.iwto.org.
IWTO-0-1 Appendix A, International Wool Textile Organisation Test Method, The Woolmark Company, Valley Drive, Ilkley, West Yorkshire, LS29 8PB United Kingdom
Douglas S.A.S. 2000, Wool Trading Requirements and Technical Limitations of IWTO Test Methods, AWTA Ltd, Melbourne
Newton-Turner H, Hayman R.H., Riches J.H., Roberts N.F. and Wilson L.T. 1953, Divisional Report No. 4 (Series S.W.-2), Division of Animal Health and Production, CSIRO, Melbourne
Sommerville, P.J. 1998, Objective Measurements – More than Pretty Numbers, AWTA Ltd., Melbourne.
Sommerville, P.J. 1999, Technology and Standards Committee, Raw Wool Group, Report RWG03S, IWTO, Florence.
Sommerville, P.J. 2001 Technical and Commercial Requirements of Wool Testing Systems, AWTA Ltd Newsletter, September 2001.
Glossary of terms Check Test A Check Test is verification of documentation and calculations forming the
basis of the Certificate on which a doubt has been raised and, if possible, a set of additional measurements made, in accordance with the same standard IWTO Test Method as was adopted for the original test, on that portion of the sample material remaining after that original test. Where no sample material remains, a Recore Check Test may be carried out as part of the check testing procedures. Check testing is restricted to tests carried out by the Test House, which conducted the original test.
Recore Check Test
This is a set of measurements made, in accordance with the relevant IWTO Test Methods and Regulations, on a further sample of raw wool drawn from the delivery as part of the check testing procedures. A Recore check test may only be conducted where a Certificate has not been delivered in relation to a contract. Where staple measurements are involved this definition applies to a fresh grab sample taken from the lot rather than a core sample.
Retest This is a set of measurements made, in accordance with the relevant IWTO Test Methods, on a further sample of raw wool drawn from a delivery for which the original Certificate is in doubt. This differs from a Recore Check Test in that duplicate core (grab) samples are drawn for possible testing by two separate Test Houses to resolve a disputed result. Such sample material must be obtained by recoring (regrabbing) and reweighing all bales, in accordance with the current IWTO Core (Staple) Test Regulations.
Testing Error A Testing Error is deemed to have occurred if the Maximum Retest Range is exceeded.
Maximum Retest Range
The Maximum Retest Range (i.e. the difference between the values of a retest and the original Test Certificate or an earlier retest) is a statistically (and scientifically) determined upper and lower limit which, provided the test procedure has been rigorously adhered to, will very rarely be exceeded purely by chance.
The Maximum Retest Range defines the maximum allowable difference between two test results.
Accuracy A measure of the closeness of a test result to the true value
Bias A systematic difference between test results and their corresponding true values
Coefficient of variation
A measure of variability exhibited within a group of values. It expresses the standard deviation as a percentage of the mean.
Component of variance
In a variance model, one of the discrete portions of the total variance associated with a specific sampling or measurement aspect.
Confidence interval
The absolute range within which the true result is expected to lie within the stated probability. The 95% confidence interval is equal to the mean minus 95% CL to mean plus 95%CL
Confidence limits An expression of the precision of a test result or the mean of a group of results.

5-20 ______________________________ WOOL472/572 Wool Biology and Measurement
© 2014 The Australian Wool Education Trust licensee for educational activities University of New England
It is usually associated with a stated probability, normally 95%. The 95% confidence limits are the range of values within which the true value is expected to occur 95 times out of 100.
Correlation coefficient
A measure of the degree of association between two variables. It is normally calculated as the product-moment correlation coefficient, and varies between -1 and +1, with -1 being a perfect correlation with a negative slope, 0 being no correlation, and +1 being a perfect correlation with appositive slope.
Error Error is the difference between an individual measurement results and the true value. Errors may be divided into systematic errors (which give rise to bias), and random errors (which are the main contributors to imprecision)
Mean Arithmetic average. The mean is calculated by summing the individual measurements and dividing by the number of measurements
Normal distribution curve
A continuous curve which is symmetrical about the mean and for which the height is a function of the mean and standard deviation only. The mean ± 1, 2 and 3 standard deviations contains 68.27%, 95.45% and 99.73% of the observations respectively.
Precision An indicator of the repeatability of measurement. It is often expressed in terms of the confidence limits.
Regression A series of techniques for establishing mathematical relationships between one variable and another
Sample In the case of wool, the portion drawn by appropriate methods from a lot, consignment or delivery
Standard deviation
A measure of dispersion of individual results. Standard deviation is expressed in the units of measurement
Standard error A measure of the uncertainty in a mean value. It is equal to the standard deviation of the individual measurements divided by the square root of the number of measurements
Sub-sample A randomly-drawn portion, representative of the sample, used for a specific test measurement
True value The absolute value of a characteristic for a bulk of material is almost always unknown. Measurements of the characteristic are, in the absence of bias, normally distributed about the true value with a variance this is also unknown in a particular case. The mean of a set of un-biased measurements is the best estimate of the true value.
Variance The variance is a measure of the dispersion of values about a mean. It is calculated from the sum of the squares of the deviations from the mean and is expressed in units of measurement squared
Variance model A mathematical model which expresses the total variance of measurement system or part of a measurement system in terms of the components of variance of identifiable contributors of error