5. Side Scan5... · 2016-06-13 · 1/05 Side Scan • 5-1 5. Side Scan I. Side Scan Hardware The...
33
1/05 Side Scan • 5-1 5. Side Scan I. Side Scan Hardware The SIDE SCAN HARDWARE program is used to install those devices that are specific to side scan surveys. HYPACK® MAX collects analog and digital side scan data through the SIDE SCAN SURVEY program, which is run together with HYPACK® SURVEY. Position and heading data is provided by SURVEY through the shared memory. Most analog devices are supported by the Analog Side Scan option and an A/D card (PCI or PCMCIA) connection in your data collection computer. Note: Side scan devices are supported by HYSWEEP® SURVEY. Therefore, if you are logging both side scan and multibeam data, you should load your side scan devices through HYSWEEP® SURVEY. 1. Open SIDE SCAN HARDWARE by selecting PREPARATIONS- HARDWARE-SIDE SCAN HARDWARE. 2. Select your devices. 3. Specify the driver and communication settings. 4. Test the communication between the serial devices and your survey computer. 5. Enter your offsets. 6. Click [Close] to exit SIDE SCAN HARDWARE. Exiting SCANWARE saves the current configuration to the Sidescan.ini file in your project directory. These settings will automatically be loaded with this project. A. Specifying Devices in Side Scan Hardware Adding (and removing) devices is easy in the Manufacturer/Model tab. To add a device, go the Equipment Tab. Select the device in the left-side list (Manufacturer / Model) then click [Add]. To remove a device, select the device name in the Installed list then click [Remove].
Transcript of 5. Side Scan5... · 2016-06-13 · 1/05 Side Scan • 5-1 5. Side Scan I. Side Scan Hardware The...
1/05 Side Scan • 5-1
5. Side Scan
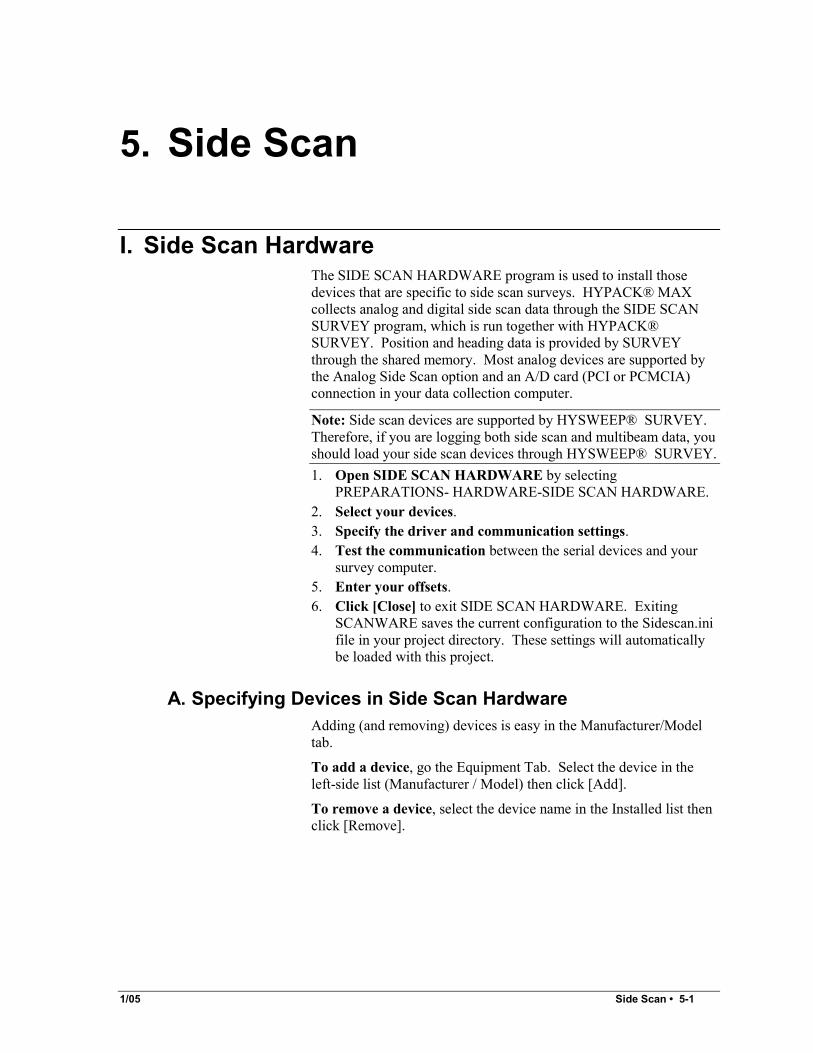
I. Side Scan Hardware The SIDE SCAN HARDWARE program is used to install those devices that are specific to side scan surveys. HYPACK® MAX collects analog and digital side scan data through the SIDE SCAN SURVEY program, which is run together with HYPACK® SURVEY. Position and heading data is provided by SURVEY through the shared memory. Most analog devices are supported by the Analog Side Scan option and an A/D card (PCI or PCMCIA) connection in your data collection computer.
Note: Side scan devices are supported by HYSWEEP® SURVEY. Therefore, if you are logging both side scan and multibeam data, you should load your side scan devices through HYSWEEP® SURVEY. 1. Open SIDE SCAN HARDWARE by selecting
PREPARATIONS- HARDWARE-SIDE SCAN HARDWARE. 2. Select your devices. 3. Specify the driver and communication settings. 4. Test the communication between the serial devices and your
survey computer. 5. Enter your offsets. 6. Click [Close] to exit SIDE SCAN HARDWARE. Exiting
SCANWARE saves the current configuration to the Sidescan.ini file in your project directory. These settings will automatically be loaded with this project.
A. Specifying Devices in Side Scan Hardware Adding (and removing) devices is easy in the Manufacturer/Model tab.
To add a device, go the Equipment Tab. Select the device in the left-side list (Manufacturer / Model) then click [Add].
To remove a device, select the device name in the Installed list then click [Remove].
5-2 • Side Scan 1/05
The Manufacturer/ Model Tab
B. Driver Setup in Side Scan Hardware Some device drivers may require settings specific to the device. In these cases, [Setup] is enabled. Click it and the Driver Setup dialog appears.
At the time of the HYPACK® MAX 4.3 release, there were no devices in SIDE SCAN HARDWARE with setup requirements.
C. Connection Information in Side Scan Hardware Click the Connect tab to access device communication settings. Some settings are required for each device. • Enabled in the upper left corner. This selection allows devices
to be temporarily removed from the configuration without losing the device settings.
• Ignore Checksum is not recommended, but there are situations (normally testing) where the checksum is wrong but the data is good.
• The Timeout Interval determines how long after the last data received from the device that the device alarm turns from green to red.
• Record Raw Messages saves the original data string as it is read from the device into the raw data file. (Binary data is output in hexadecimal format.)
• The Read from File checkbox enables you to simulate data input from this device by reading a file. Many times, when you are having a problem with a device in the field, we will ask you to log some of the output from the device to a file and upload it to us. We can then replay the information using the File setting to see what is going on.
1/05 Side Scan • 5-3
Serial or Network connection options are included in this dialog according to your device.
Some devices receive data from other places and no connection settings are necessary. Examples include: • Hypack Navigation receives data from shared memory. • Hypack Mobile receives data from shared memory. It uses the
first mobile in your hardware setup associated with the Towcable device driver.
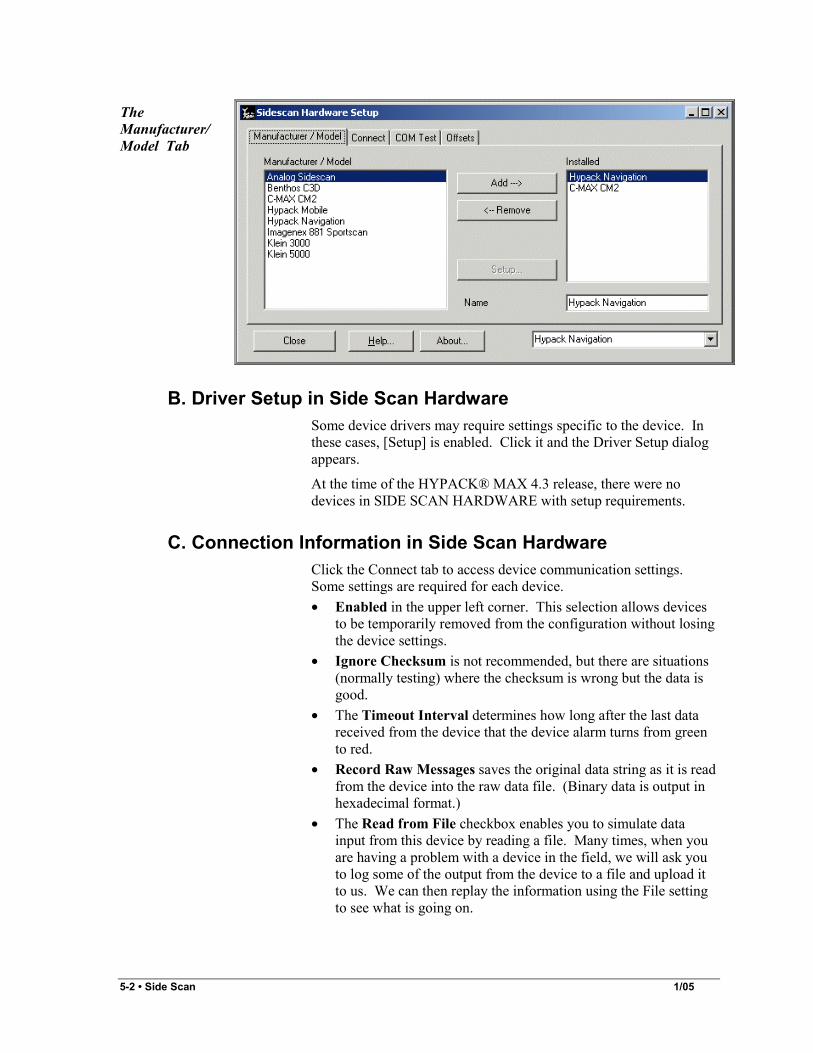
• Analog Side Scan data is read by an Analog to Digital converter card. When this driver is loaded, the Analog Side Scan program is automatically launched with SURVEY and the Analog Side Scan Monitor appears. This dialog enables you to monitor and control the device activity.
Analog Side Scan Monitor
Input: Select a -5 to +5 volt or 0 to 10 volt range depending on the device.
Gain: Multiplies signal by this amount. A value of 1.0 is usually the best choice.
Ping Number displays the sequential ping numbers.
Trigger: Enter the change in the strength of the return when it hits the bottom (the threshold) in A/D count. The value must be within the 0-4096 range.
The graphs allow you to monitor device activity.
Test: Check the "Simulate Data" box for simulated side scan data.
1) Serial Device Connections in SIDE SCAN HARDWARE Serial devices will show the dialog below. Select the COM port, baud rate, parity, data bits and stop bits from the list.

5-4 • Side Scan 1/05
SIDE SCAN HARDWARE Setup—Connect Tab
2) Network Device Connections in Side Scan Hardware Configuring Network Device Connections
3) Testing Serial Communication in Side Scan Hardware The COM test shows status of serial communication ports 1 through 16. Ports shown as available are those that SIDE SCAN HARDWARE can open for reading, although this can be misleading. Modems, for example, show up as available but are seldom used for device connection. Ports shown as not available are truly that.
Ports connected to working SIDE SCAN HARDWARE devices show the latest messages. ASCII devices send easy to read messages. Binary devices, which include all side scan devices, show garbled messages even when the data is good.
The COM Test Tab
1/05 Side Scan • 5-5
D. Offsets in Side Scan Hardware Offsets are determined by whether the side scan is towed or hull-mounted.
1) Setting Offsets for Towed Side Scan Devices Most side scan devices are mounted on towfish. The offsets for the device on the towfish should be measured from the cable anchoring point and the reference point of the towfish. Check the "Installed on Towfish" checkbox and use the towcable (or cablecnt) driver to calculate the towfish position. Details on this driver can be found under "Towfish with Simple Layback" section in the Preparation chapter.
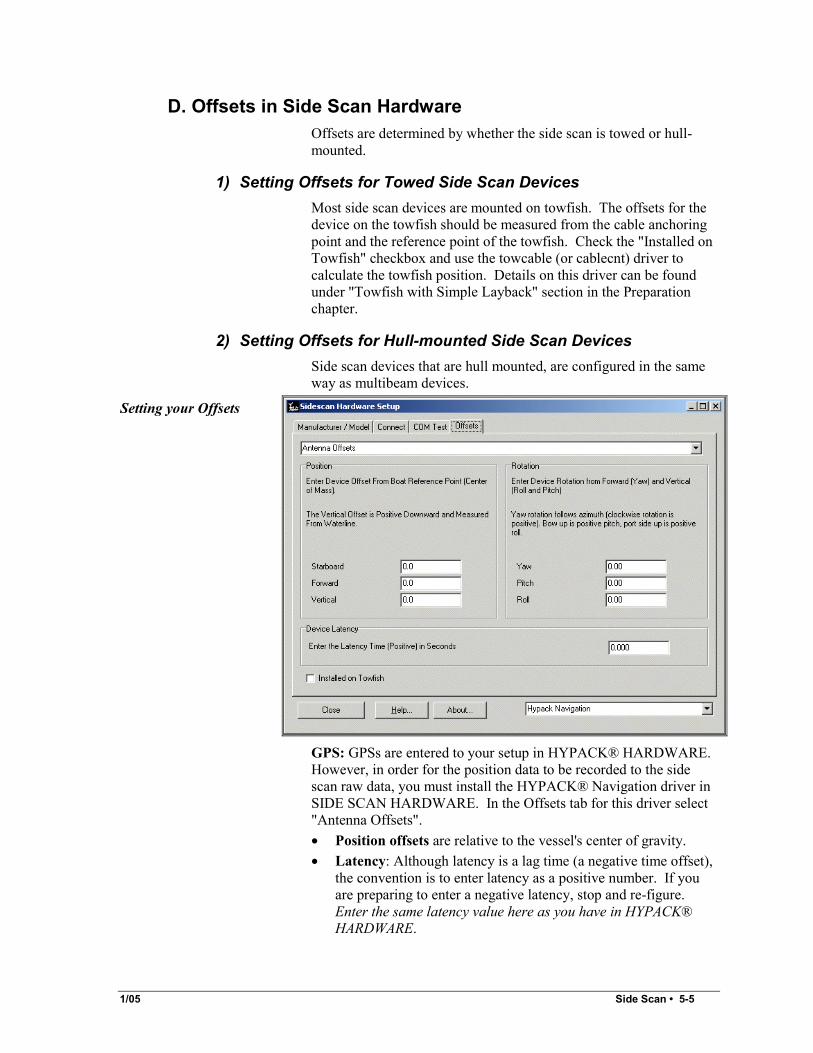
2) Setting Offsets for Hull-mounted Side Scan Devices Side scan devices that are hull mounted, are configured in the same way as multibeam devices.
Setting your Offsets
GPS: GPSs are entered to your setup in HYPACK® HARDWARE. However, in order for the position data to be recorded to the side scan raw data, you must install the HYPACK® Navigation driver in SIDE SCAN HARDWARE. In the Offsets tab for this driver select "Antenna Offsets". • Position offsets are relative to the vessel's center of gravity. • Latency: Although latency is a lag time (a negative time offset),
the convention is to enter latency as a positive number. If you are preparing to enter a negative latency, stop and re-figure. Enter the same latency value here as you have in HYPACK® HARDWARE.
5-6 • Side Scan 1/05
Note: HYPACK® and SIDE SCAN offsets do not affect each other. HYPACK® HARDWARE offsets will be applied to single beam data, while SIDE SCAN HARDWARE offsets will be applied to side scan data.
Sonar: • Position offsets are relative to the vessel's center of gravity. • Use rotation offsets of 0, 0, 0 initially, then find the true
rotations with the Patch Test.
E. Editing Device Settings in Side Scan Hardware You can easily modify SIDE SCAN HARDWARE settings by selecting the device name in the Installed List and changing the entries in associated dialogs. The new settings will be saved to the Sidescan.ini file when you exit SIDE SCAN HARDWARE.
II. Side Scan Survey SIDE SCAN SURVEY is a side scan data collection and logging program. The displays give real-time information on your survey area.
Digital or analog side scan data is logged to the HYPACK® HSX format. This data can then be imported by the HYSCAN program for viewing and targeting. HSX-formatted side scan data can also be used to create a mosaic. This mosaic may then be saved as a geo-referenced TIF file, which can be displayed in your project as a background file.
The playback mode replays the raw HSX files giving the same view seen on the selected survey vessel.
The HYPACK® SURVEY and SIDE SCAN SURVEY programs run simultaneously. HYPACK® SURVEY provides navigation and single beam data collection while SIDE SCAN SURVEY provides the side scan data. The logging status of SIDE SCAN SURVEY is controlled by SURVEY. Each time SURVEY begins or stops logging, it stores the logging status to shared memory. SIDE SCAN SURVEY monitors shared memory and matches its logging with SURVEY.
Note: If you are collecting multibeam data with your side scan data, you may only need HYSWEEP SURVEY program, instead of SIDE SCAN SURVEY, which supports side scan devices.
SIDE SCAN SURVEY provides a scrolling display of its data. You can create targets here in real-time or in the post-processing HYSCAN program. You can also capture a TIF file of areas of interest as you progress.

1/05 Side Scan • 5-7
A. Side Scan Survey Windows SIDE SCAN SURVEY includes a main window from which you can customize the tools and views of the program, and view alarm status and other information regarding your side scan survey.
Additional windows can be accessed to view your data in real time from different perspectives. Use the View menu in the main window to select those that you want to include in your display.
Most SIDE SCAN SURVEY windows have a tool bar at the top, providing shortcuts to window configuration. Pass the mouse pointer over a tool to see a hint as to what the tool does. Tool bars are toggled on / off with the F10 key.
All of SIDE SCAN SURVEY’s windows can be resized and moved around the screen, retaining their size and position until changed. VIEW-TILE WINDOWS will arrange the currently open windows in a manner that attempts to optimize your viewing in each window.
1) Main Window in Side Scan Survey The main window of SIDE SCAN SURVEY consists of a menu, some indicators and some measurements. It can be resized to show only items of interest and will retain the size on subsequent program runs.
The title bar gives logging and playback status. "Offline" is shown when neither logging nor playback is active. The current data file is shown when logging or playback is active.
Side Scan Survey – Main Window
(a) Alarms in Side Scan Survey SIDE SCAN SURVEY can be configured to continuously check for and notify you of data errors or loss of data input. They show green (OK), yellow (careful) or red (look out) depending on status. Click the indicator to show status history.
The Nav and Sidescan alarms turn red when no data has been received from the corresponding device for 10 seconds.
The Devices alarm turns red when no data has been received for a period longer than the Time Out Interval that you set for each device in the hardware setup.
5-8 • Side Scan 1/05
(b) Side Scan Survey Measurements Updated about once a second. You can choose to display data relative to the boat or to the towfish by selecting the option at the bottom of the dialog. • Altitude: Height of the fish from the bottom. • Time (Ping): Latest sounding time and ping number. Time will
not update if no soundings are being received. • Range: The side scan range setting. • Heading: Latest ship heading. • Easting / Northing: Latest grid position from HYPACK®
SURVEY.
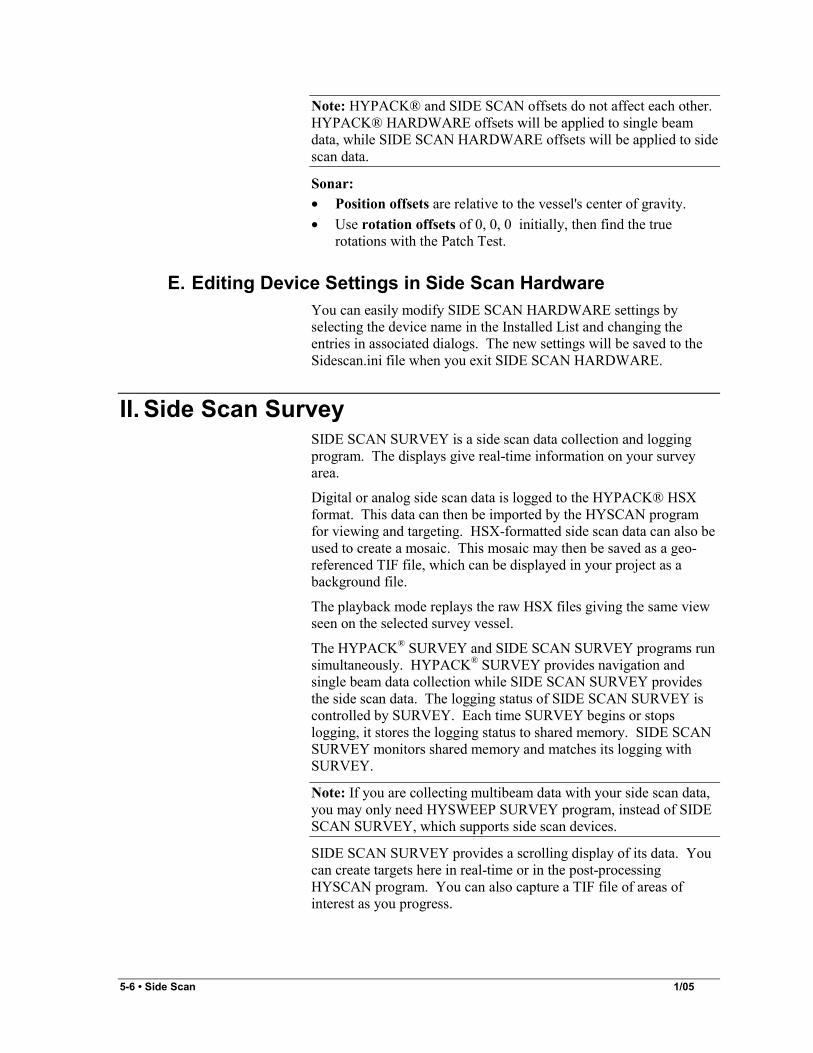
2) Side Scan Waterfall Window Side Scan Waterfall Window
This is the traditional side scan display (forward looking and without slant range corrections) to which most hydrographers are accustomed. Reflection brightness and contrast are adjustable through the side scan controls and cursor position is shown in the status bar.
To access the Side Scan Waterfall window, select VIEW-SIDE SCAN WATERFALL from the main menu. Set display settings by clicking the icon in the status bar.
(a) Measuring Object Height The Height Measurement feature enables you to measure the towfish altitude, the range from the towfish to the object, and the height of the object above the bottom.
1. Click the Height Measurement icon, then click on the object you want to measure. The Height Measurement window will appear with a capture of the section of the scan containing the cursor location, the corresponding Side Scan signal profile and three vertical markers.

1/05 Side Scan • 5-9
Height Measurement Window
2. Select and drag the three measuring rods into place using the
waterfall and signal capture as your guides: ▪ The first rod to the bottom of the water column. ▪ The second rod to the top of the object. ▪ The third rod to the outer edge of the shadow.
SIDE SCAN SURVEY calculates: ▪ The height of the towfish above the bottom ▪ The range from the towfish to the top of the object ▪ The height of the object above the bottom
[Target] enables you to mark a target at the position of the object you are measuring. Click [Target] and the Target Properties dialog will appear with the coordinates corresponding to your click location.
(b) Measuring Horizontal Distance Click and drag your cursor across the distance to be measured. The status bar displays the distance and azimuth of the cursor's track.
(c) Saving Side Scan Waterfall Screen Captures You can also save screen captures from the Side Scan Waterfall window. The TIF will not be exactly spatially correct, but it will be a clear representation of the area.
1. Click the Capture Image icon, then click and drag the area that you wish to capture. The described area will appear in a pop-up dialog for you to preview.
2. Save the capture to *.TIF or *.JPG format by clicking the File Save icon and naming your picture.
3) Side Scan Signal Window The signal window graphs amplitude vs. time for each sonar ping. Reflection amplitude is in units of A/D converter count.

5-10 • Side Scan 1/05
Side Scan Signal Window
While this window has no particular value for bottom imaging, it is quite useful for verifying sonar operation.
You can choose to draw: • A Single Ping where only the most recent ping is shown. • Multiple Pings where a ping history is shown with scrolling. • Raw Signal as received directly from the sonar. • Processed Signal: The Raw Signal with HYPACK® scaling and
gains applied. The range is always 0 to 4096.
Access the Side Scan Signal window using VIEW-SIDE SCAN SIGNAL.
4) Side Scan Coverage Map The Side Scan Coverage Map is an overhead view of your vessel and the area covered by your side scan sonar.
Side Scan Survey— Coverage Map
In this window you can: • Target contacts by double clicking the object of interest. • Monitor coverage using a Hysweep type matrix file. To do this:
a. Enable a matrix file in your project b. Set the matrix to draw in SIDE SCAN SURVEY
through the matrix options dialog.
Note: This means that you will not be saving depths to your matrix. c. Select Show Matrix in the View Options dialog.

1/05 Side Scan • 5-11
• Display grid position by moving the cursor across the window.
B. View Options in Side Scan Survey
1) Side Scan Coverage Map View Options The Coverage Map View Options allow you to define which objects are displayed in your coverage map.
To access the Coverage Map View Options dialog: • Select VIEW-OPTIONS from the main menu • Click the View Options icon in the Coverage Map window • Hit F9
Coverage Map View Options
Show Scale Bar displays the distance scale bar.
Show Matrix displays the matrix enabled in your project. This option will be disabled if you are drawing your matrix to HYPACK® SURVEY. (See the discussion on Matrix Files in SIDE SCAN SURVEY.)
Follow Boat re-centers map when the boat leaves the screen.
Black Window Background displays the data on black. The alternative is a white background with black display.
Boat Shape shows a generic boat shape vs the circle boat symbol.
Show Sidescan Coverage displays lines extending outward from the transducer to indicate the coverage area.
Show Planned Lines displays the survey lines.
[Clear Matrix] empties the matrix file.
[Matrix Options] accesses the Matrix Options dialog. (See "Matrix Files in Side Scan Survey".)
[Clear History] removes side scan coverage lines that have drawn to that point.

5-12 • Side Scan 1/05
2) Side Scan Waterfall Controls The Side Scan Controls enable you to adjust the display settings for the Side Scan Waterfall window.
The Side Scan Controls dialog can be accessed by: • Selecting VIEW-SIDE SCAN CONTROLS from the main
menu • Clicking the Side Scan Controls icon in the Side Scan
Waterfall window • Hitting Shift+F9
(a) Side Scan Color Controls The Color tab allows you to adjust all of the color properties of the scrolling data in the display
Side Scan Controls Dialog—Colors Tab
There are several preset color options for which you can adjust the brightness and contrast using the corresponding sliders. In each case, low amplitude is light and high amplitude is dark. This is the traditional method of displaying side scan. You can also reverse amplitudes that are represented by the dark and light color by checking the Invert checkbox. This is a more natural display because it emulates light and shadows.
You may also create a custom color scale by selecting Custom and moving the Custom Hue slider until your favorite color appears in the sample window of the dialog. The brightness and contrast can be adjusted on your custom color scale as well.
[Default] returns the setting to the Gold setting with 50% brightness and contrast.
[Reset] resets the average amplitude value. The color schemes are all based on this value so, if your display looks light or dark and the Brightness control doesn't help, try this button to correct it.
1/05 Side Scan • 5-13
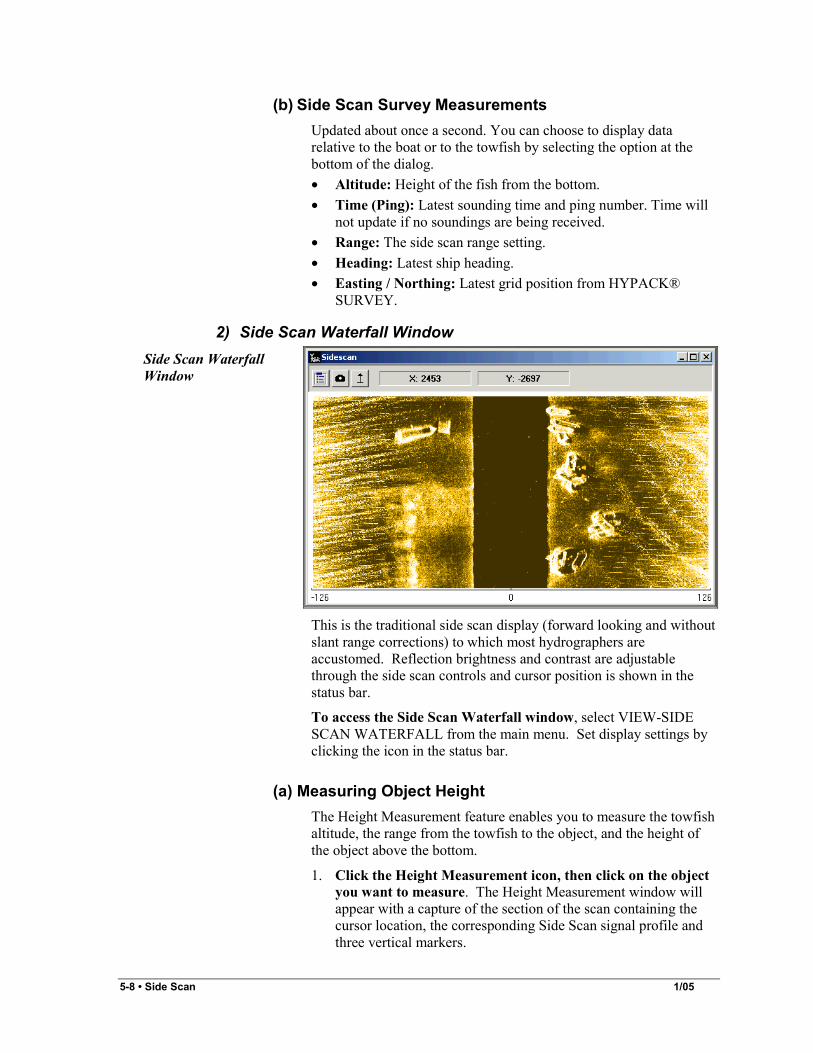
(b) Side Scan Gain Controls The Gain controls are available separately for port and starboard transducers.
Side Scan Controls Dialog—Display Tab
Gain adjusts the signal level uniformly up or down.
TVG compensates for signal loss due to absorption. It is a linear increase with time.
Starboard Gain =Port Gain keeps the two settings in sync.
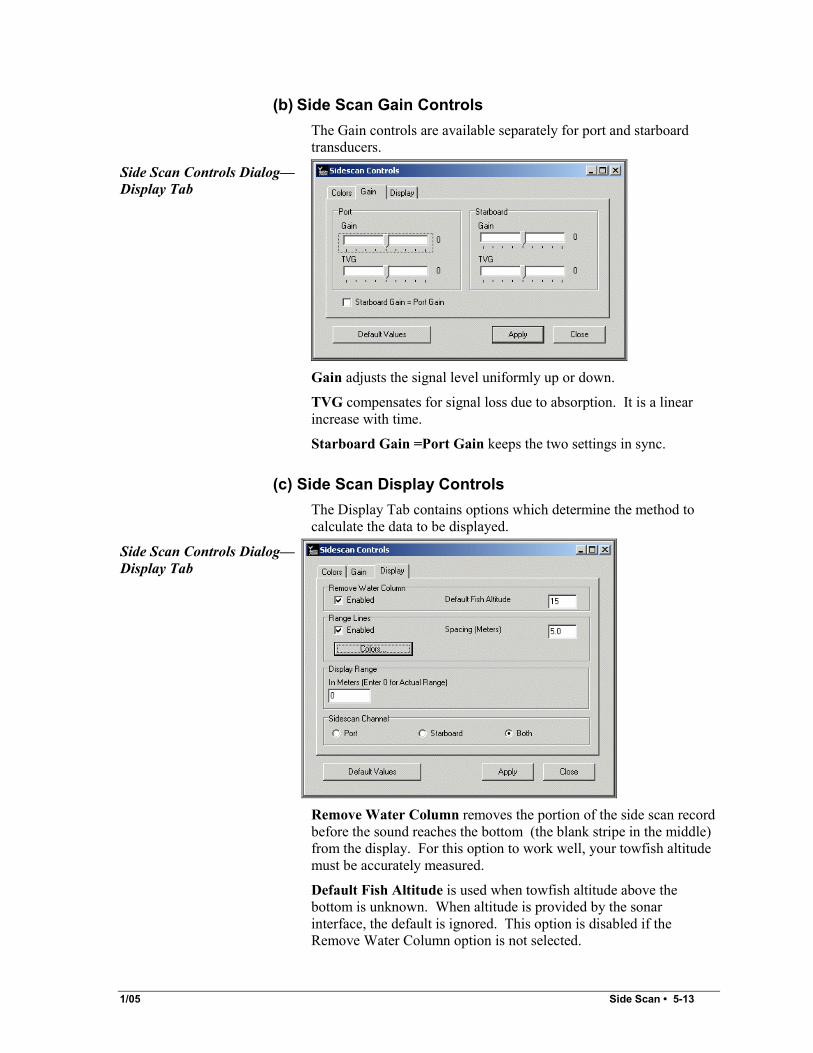
(c) Side Scan Display Controls The Display Tab contains options which determine the method to calculate the data to be displayed.
Side Scan Controls Dialog—Display Tab
Remove Water Column removes the portion of the side scan record before the sound reaches the bottom (the blank stripe in the middle) from the display. For this option to work well, your towfish altitude must be accurately measured.
Default Fish Altitude is used when towfish altitude above the bottom is unknown. When altitude is provided by the sonar interface, the default is ignored. This option is disabled if the Remove Water Column option is not selected.
5-14 • Side Scan 1/05
Range Lines draws lines at the user-defined Spacing Interval and color from the water column outward.
Display Range sets a constant width of the side scan to be displayed. Set this value to 0 and the window will autoscale according to the full extent of the data.
The Channel options enable you to view the Port or Starboard channel alone or both of them together.
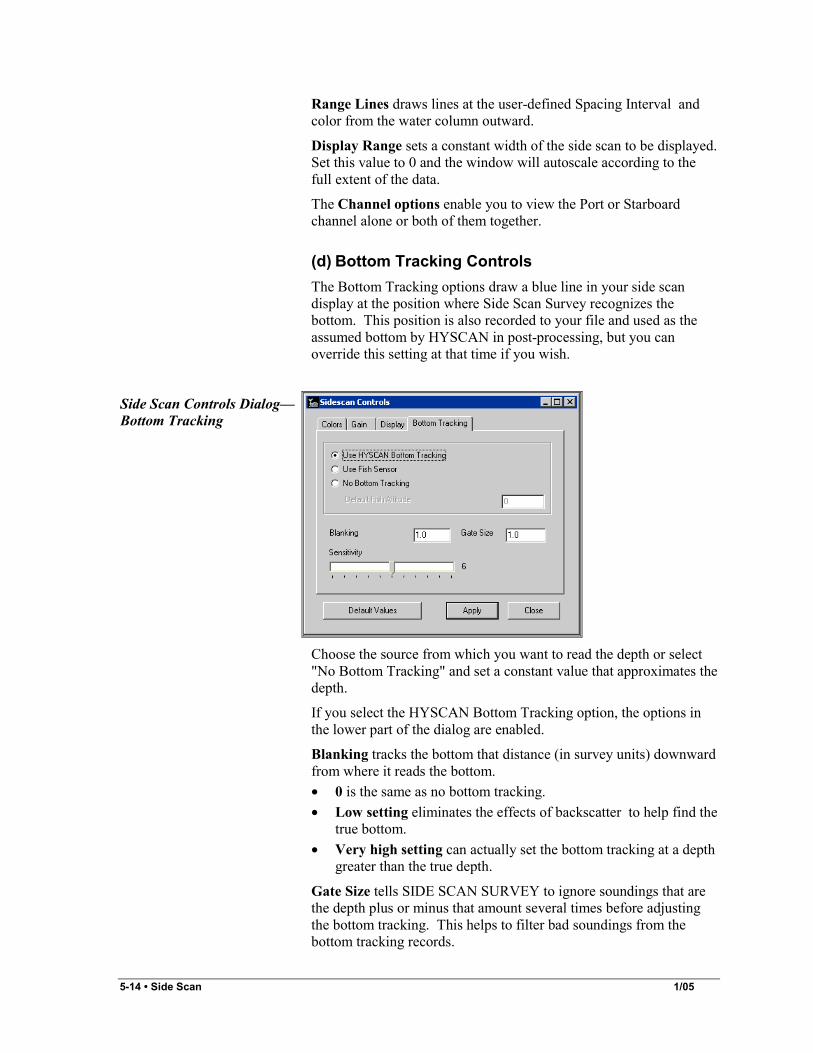
(d) Bottom Tracking Controls The Bottom Tracking options draw a blue line in your side scan display at the position where Side Scan Survey recognizes the bottom. This position is also recorded to your file and used as the assumed bottom by HYSCAN in post-processing, but you can override this setting at that time if you wish.
Side Scan Controls Dialog—Bottom Tracking
Choose the source from which you want to read the depth or select "No Bottom Tracking" and set a constant value that approximates the depth.
If you select the HYSCAN Bottom Tracking option, the options in the lower part of the dialog are enabled.
Blanking tracks the bottom that distance (in survey units) downward from where it reads the bottom. • 0 is the same as no bottom tracking. • Low setting eliminates the effects of backscatter to help find the
true bottom. • Very high setting can actually set the bottom tracking at a depth
greater than the true depth.
Gate Size tells SIDE SCAN SURVEY to ignore soundings that are the depth plus or minus that amount several times before adjusting the bottom tracking. This helps to filter bad soundings from the bottom tracking records.
1/05 Side Scan • 5-15
Sensitivity affects how receptive the tracking is to changes in the water column. A low value is less likely to adjust the bottom tracking for minor distortions in the water column, but more likely to miss real bottom changes. Conversely, a high value will adjust for everything, even things that it probably shouldn't.
C. Logging Data in Side Scan Survey Data logging may be controlled by HYPACK® SURVEY or SIDE SCAN SURVEY. Logging commands are passed between the two programs to keep them in the same mode. You may control logging in SIDE SCAN SURVEY using: • The menu commands or • The same keyboard shortcuts as HYPACK® SURVEY. • The DATA LOGGER and use the control buttons in that dialog,
though there is no real benefit to this option.
Note: Data can not be logged for three seconds before and after midnight. During this time SIDE SCAN SURVEY will close the current data files and open new ones named according to the new date and time.
FILE-HYPACK® Commands-…
DATA LOGGER Buttons
Keyboard Shortcuts
START LOGGING [Start Logging] Ctrl + S END LOGGING [End Logging] Ctrl + E INCREMENT LINE [Increment Line] Ctrl + I DECREMENT LINE [Decrement Line] Ctrl + D SWAP LINE [Swap Line] Ctrl + W
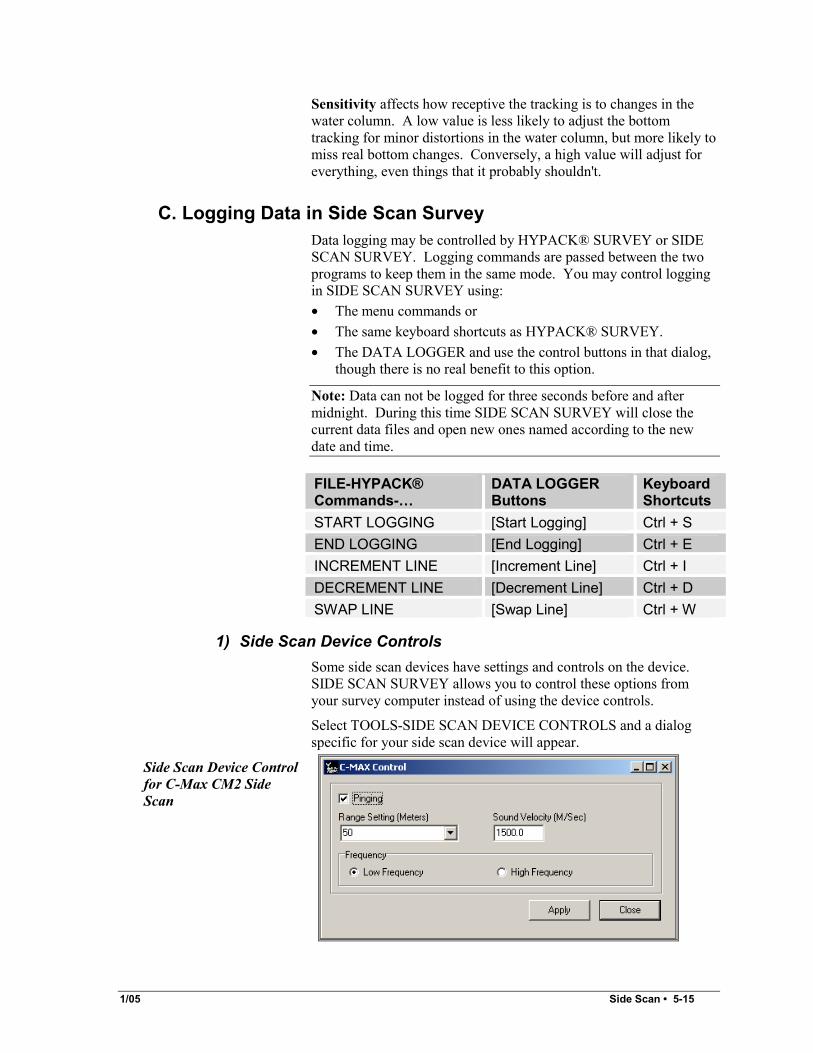
1) Side Scan Device Controls Some side scan devices have settings and controls on the device. SIDE SCAN SURVEY allows you to control these options from your survey computer instead of using the device controls.
Select TOOLS-SIDE SCAN DEVICE CONTROLS and a dialog specific for your side scan device will appear.
Side Scan Device Control for C-Max CM2 Side Scan

5-16 • Side Scan 1/05
2) Data Logger Select FILE-DATA LOGGER (or hit F7). Set your options for logging survey data to files before you begin logging.
Logging Options Window
• Record Method: SIDE SCAN SURVEY can save your data to
HYPACK'S HSX format or to XTF format.
Note: HYSWEEP® SURVEY can not log side scan data to XTF format.
The Control buttons effect all data logging in all of the currently active Survey programs.
3) Matrix Files in Side Scan Survey Matrix files are areas divided into cells. A matrix file enabled in your project is automatically loaded into SIDE SCAN SURVEY.
Note: SIDE SCAN SURVEY does not support multiple matrix files. Only one Hysweep type matrix file should be enabled in your project when you launch SIDE SCAN SURVEY.
In SIDE SCAN SURVEY, your matrix file appears in the Coverage Map and can be used to track your side scan coverage in your survey area. It does not save depth data.
The Matrix menu is used to clear accumulated cell data and select matrix options. Files are automatically updated and saved at program close.
(a) Matrix View Options Matrix Options
The Draw Matrix option determines in which window the matrix will be displayed. The HYPACK® SURVEY option will draw the matrix in the area map of SURVEY only, while the SIDE SCAN
1/05 Side Scan • 5-17
SURVEY option will draw the matrix to the Coverage Map. If you choose to change this option, you must restart the survey programs for it to take effect.
Note: You must also have the Show Matrix option checked in the View Options.
(b) Matrix Types in Side Scan Surveys It is important to check the matrix type as the matrix type and the survey program that is drawing the matrix, together, determine which data is being saved to the matrix.
To check the matrix type, open the Matrix file in the MATRIX EDITOR and check the Type field. To monitor side scan coverage, you must use a Hysweep type matrix.
Note: Side Scan collection is also supported directly by HYSWEEP SURVEY. You should not run SIDE SCAN SURVEY with HYSWEEP SURVEY.
4) Targeting and Target Files in Side Scan Survey SIDE SCAN SURVEY provides complete targeting support.
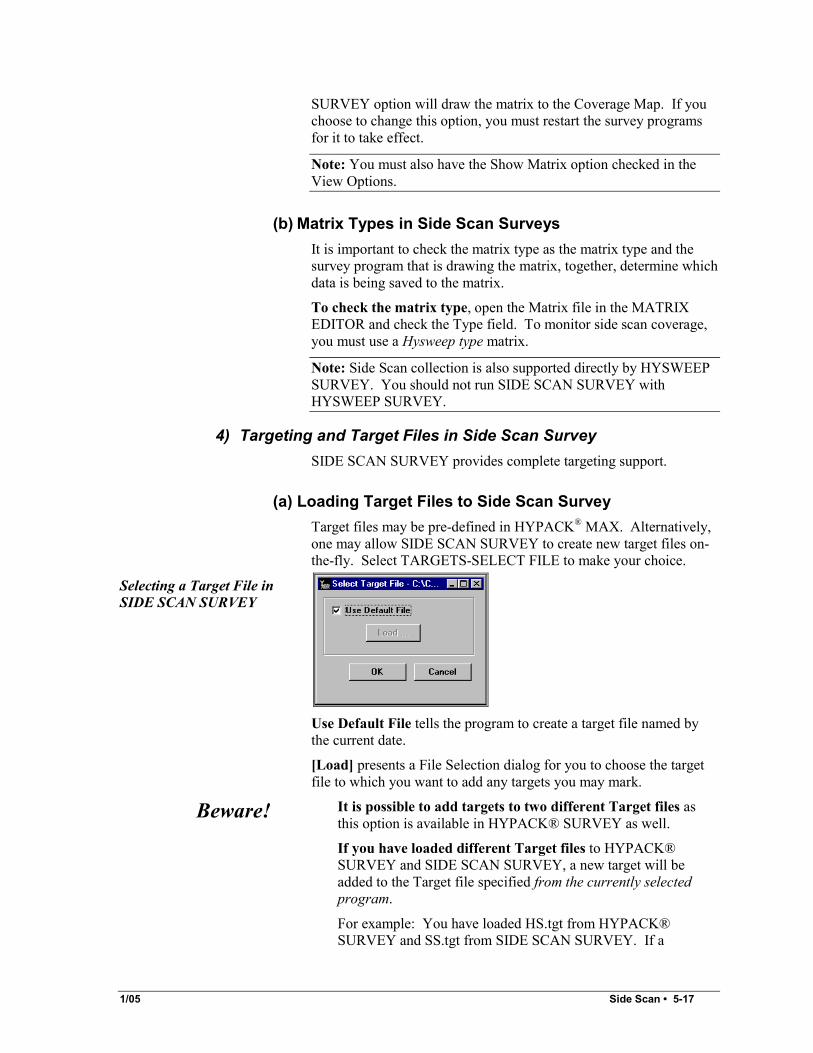
(a) Loading Target Files to Side Scan Survey Target files may be pre-defined in HYPACK® MAX. Alternatively, one may allow SIDE SCAN SURVEY to create new target files on-the-fly. Select TARGETS-SELECT FILE to make your choice.
Selecting a Target File in SIDE SCAN SURVEY
Use Default File tells the program to create a target file named by the current date.
[Load] presents a File Selection dialog for you to choose the target file to which you want to add any targets you may mark.
Beware! It is possible to add targets to two different Target files as this option is available in HYPACK® SURVEY as well.
If you have loaded different Target files to HYPACK® SURVEY and SIDE SCAN SURVEY, a new target will be added to the Target file specified from the currently selected program.
For example: You have loaded HS.tgt from HYPACK® SURVEY and SS.tgt from SIDE SCAN SURVEY. If a
5-18 • Side Scan 1/05
HYPACK® SURVEY is selected and you hit F5, the target will be added to HS.tgt. Likewise, if a SIDE SCAN SURVEY window is selected and you hit F5, the target will be added to the SS.tgt.
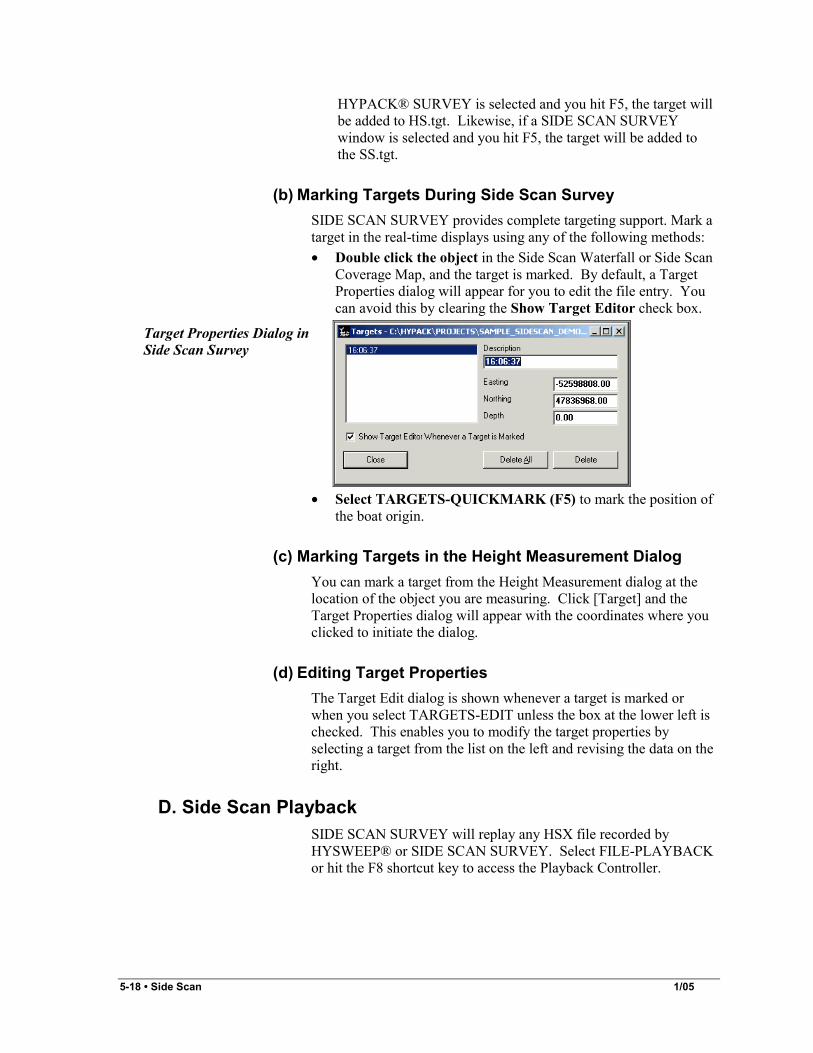
(b) Marking Targets During Side Scan Survey SIDE SCAN SURVEY provides complete targeting support. Mark a target in the real-time displays using any of the following methods: • Double click the object in the Side Scan Waterfall or Side Scan
Coverage Map, and the target is marked. By default, a Target Properties dialog will appear for you to edit the file entry. You can avoid this by clearing the Show Target Editor check box.
Target Properties Dialog in Side Scan Survey
• Select TARGETS-QUICKMARK (F5) to mark the position of
the boat origin.
(c) Marking Targets in the Height Measurement Dialog You can mark a target from the Height Measurement dialog at the location of the object you are measuring. Click [Target] and the Target Properties dialog will appear with the coordinates where you clicked to initiate the dialog.
(d) Editing Target Properties The Target Edit dialog is shown whenever a target is marked or when you select TARGETS-EDIT unless the box at the lower left is checked. This enables you to modify the target properties by selecting a target from the list on the left and revising the data on the right.
D. Side Scan Playback SIDE SCAN SURVEY will replay any HSX file recorded by HYSWEEP® or SIDE SCAN SURVEY. Select FILE-PLAYBACK or hit the F8 shortcut key to access the Playback Controller.

1/05 Side Scan • 5-19
Playback Controller
Controls:
• [Browse]: Pick a file for playback. • [Pause]: Temporarily pause playback. • [Play>]: Playback in real time. • [Fwd>>]: Forward at 20 x real time. • [Search]: Activates search dialog. You can go directly to a
specific event, to the next event from your current position in the playback, or to a specific time. Select choice and define the event or time you are looking for then click [Start Search].
• [End]: End playback.
Playback Search Parameters
III. Side Scan Processing HYSCAN is the side scan processing program. It reads HSX, XTF and MST format side scan data and draws it to the Scan View window in 3-dimensional view. (QMIPS format capabilities are under development.) There you can visually inspect the data and mark targets at any points of interest.

5-20 • Side Scan 1/05
The Scan View Window
HYSCAN's Mosaic window enables you to convert HSX formatted side scan data to a mosaic. A mosaic is a blending of the side scan from one or more data files. It is not a file type in itself; HYSCAN does not save mosaic files. Rather, it is the preview of your geo-referenced TIF, which can be exported from HYSCAN and displayed in your project as a background file.
The Mosaic View Window
A. Running Hyscan Launch HYSCAN by selecting PROCESSING-SIDE SCAN MOSAIC. An empty Scan View window will appear.
HYSCAN is a two-part program.

1/05 Side Scan • 5-21
In Scan View: 1. Load your data. 2. Set your view options 3. Set your fish altitude. This value is important in order to
accurately remove the water column from your display and make your mosaic.
4. Visually inspect your files. 5. Mark any targets. (optional) 6. Print data. (optional) 7. If you have loaded HSX data, you can proceed to the Mosaic
View to export a TIF file.
In Mosaic View: 1. Select the files to be included in the mosaic. 2. Define the mosaic construction settings. 3. Build the mosaic. 4. Edit out small white areas if desired. 5. Save your TIF file to be used as a background file.
B. Loading Data to Hyscan File Open Icon
HYSCAN can draw HSX, XTF or MST files, though only HXF files can be mosaicked and exported to a TIF file. Select FILE-OPEN (or the File Open icon) to open individual files or catalog files (*.LOG) of any of these file types.
Note: If you collected your data with HYPACK's SIDE SCAN SURVEY, catalog files have been automatically be created in your Raw directory. If you have collected your data using another system, you will have to create catalog files. (See "Creating a New Catalog File" in the Introduction chapter for further information.)
If your hardware configuration includes more than one position device, you will be asked to select which position device data will be used for your HYSCAN display. If your side scan is hull-mounted, choose your GPS. If it is towed, select the towcable (or cablecnt) driver.
If you have chosen an individual file, it will be listed in the drop-down box on the icon bar.
Loaded File Name in HYSCAN
If you have chosen a LOG file, the number of files loaded will be displayed in the drop down box.
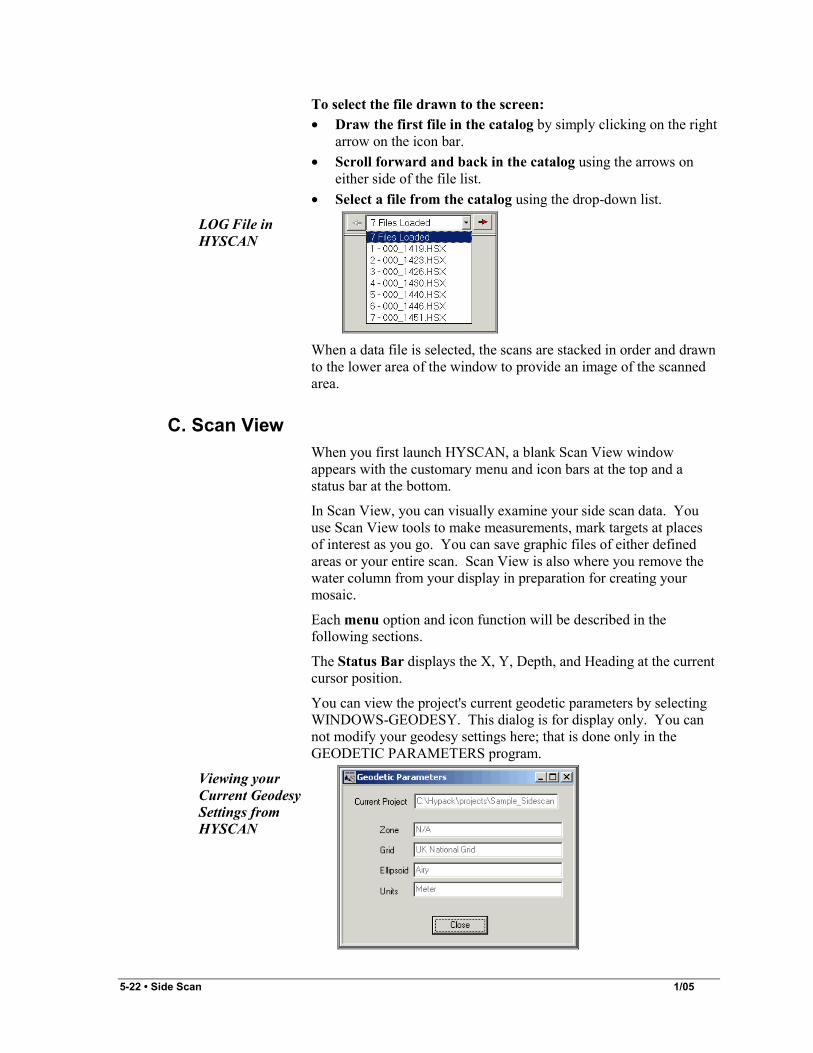
LOG File in HYSCAN
5-22 • Side Scan 1/05
To select the file drawn to the screen: • Draw the first file in the catalog by simply clicking on the right
arrow on the icon bar. • Scroll forward and back in the catalog using the arrows on
either side of the file list. • Select a file from the catalog using the drop-down list.
LOG File in HYSCAN
When a data file is selected, the scans are stacked in order and drawn to the lower area of the window to provide an image of the scanned area.
C. Scan View When you first launch HYSCAN, a blank Scan View window appears with the customary menu and icon bars at the top and a status bar at the bottom.
In Scan View, you can visually examine your side scan data. You use Scan View tools to make measurements, mark targets at places of interest as you go. You can save graphic files of either defined areas or your entire scan. Scan View is also where you remove the water column from your display in preparation for creating your mosaic.
Each menu option and icon function will be described in the following sections.
The Status Bar displays the X, Y, Depth, and Heading at the current cursor position.
You can view the project's current geodetic parameters by selecting WINDOWS-GEODESY. This dialog is for display only. You can not modify your geodesy settings here; that is done only in the GEODETIC PARAMETERS program.
Viewing your Current Geodesy Settings from HYSCAN

1/05 Side Scan • 5-23
WINDOWS-INFORMATION displays a record of HYSCAN activity. It is used primarily as a debugging tool.
Sample Information Report
You can save this report to an ASCII text file by clicking [Save Text File] and naming your file.
1) Viewing Data in Scan View When you have selected a data file in Scan View, it will be drawn in the display area of Scan View. Use the sliders on the right to scroll through your data file for an overview.
Side Scan Data in Scan View
Zoom Window Icon
For closer inspection, you can capture an isolated area from your data using the Zoom Window function. Just click the Zoom Window icon then click and drag the cursor to define an area in your data display. The defined area will be captured to the Image View Window.
5-24 • Side Scan 1/05
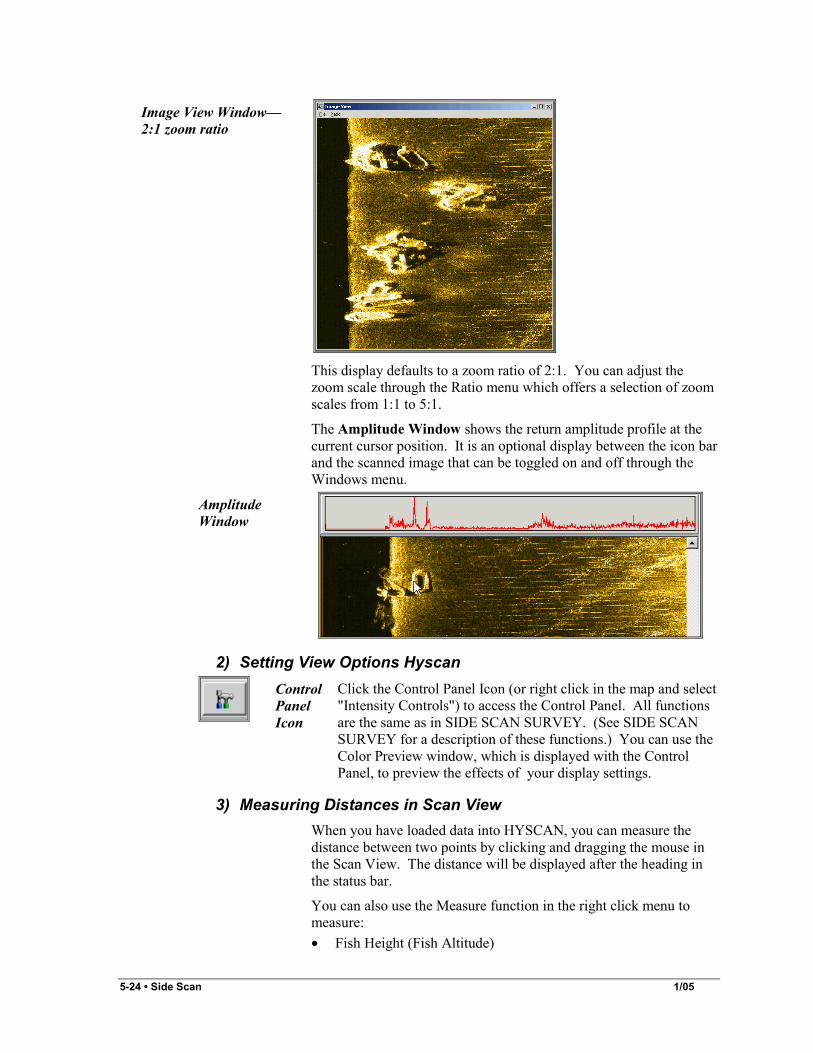
Image View Window— 2:1 zoom ratio
This display defaults to a zoom ratio of 2:1. You can adjust the zoom scale through the Ratio menu which offers a selection of zoom scales from 1:1 to 5:1.
The Amplitude Window shows the return amplitude profile at the current cursor position. It is an optional display between the icon bar and the scanned image that can be toggled on and off through the Windows menu.
Amplitude Window
2) Setting View Options Hyscan
Control Panel Icon
Click the Control Panel Icon (or right click in the map and select "Intensity Controls") to access the Control Panel. All functions are the same as in SIDE SCAN SURVEY. (See SIDE SCAN SURVEY for a description of these functions.) You can use the Color Preview window, which is displayed with the Control Panel, to preview the effects of your display settings.
3) Measuring Distances in Scan View When you have loaded data into HYSCAN, you can measure the distance between two points by clicking and dragging the mouse in the Scan View. The distance will be displayed after the heading in the status bar.
You can also use the Measure function in the right click menu to measure: • Fish Height (Fish Altitude)

1/05 Side Scan • 5-25
• Height of the Object (Range to Object) • Height of the Object off the Bottom (Object Height) 1. Right click on the object in the Scan View that you would
like to measure and select Measure. The Measurement dialog will appear with a section of your scan that includes the object you are measuring.
In the following figure, the Fish Altitude label is red indicating it is the current measurement. Each measuring bar can be selected by clicking on either the bar or its label.
Measurement Dialog
2. Click in the scan segment at the top of the water column.
The water column typically appears as a black stripe (in the center if you are viewing both port and starboard scans, otherwise on one side or the other) in your Scan View and Measurement displays. A red line labeled "1" will appear and the measurement will appear in the corresponding space at the bottom of the dialog. (You can adjust the positioning of the measuring bar by dragging it with your mouse or just clicking in a new location.)
3. Select the Range to Object measurement by clicking the label. (The label will turn red.)
4. Click at the top of the object in the scan segment. A red line labeled "2" will appear and the measurement will show in the corresponding space in the area below.
5. Select the Object Height measurement by clicking its label. 6. Click at the end of the shadow in the scan segment. A red
line labeled "3" will appear and the measurement will show in the corresponding space in the area below.
Measurement Dialog
Note: You can adjust the position of any of the measurement markers by reselecting the corresponding label and clicking in a new location in the scan segment.
5-26 • Side Scan 1/05
4) Marking Targets in Scan View You can create targets to mark points of interest as you inspect your side scan data. The Target file can then be saved and loaded to the HYPACK® MAX window with your data files or the TIF file from HYSCAN to see them in the context of your survey area. 1. Mark your targets by: • Double clicking on them in the Scan View. • Clicking the Targets icon and clicking in each target location in
the Scan View.
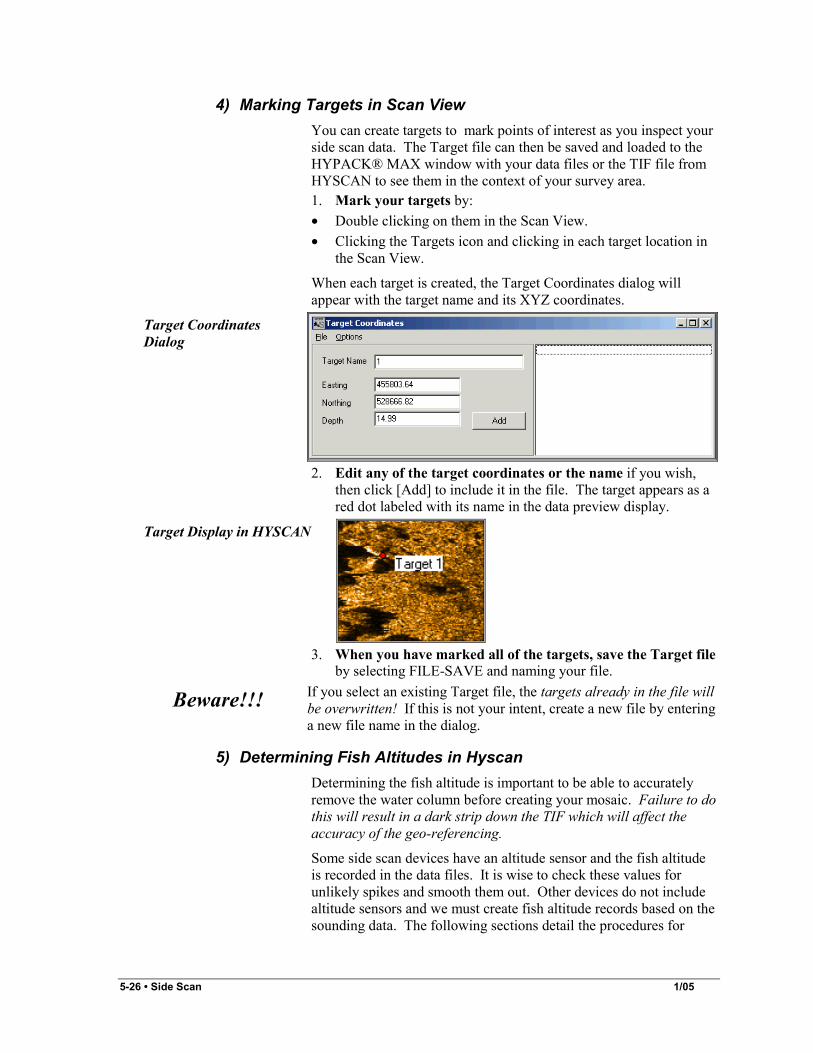
When each target is created, the Target Coordinates dialog will appear with the target name and its XYZ coordinates.
Target Coordinates Dialog
2. Edit any of the target coordinates or the name if you wish,
then click [Add] to include it in the file. The target appears as a red dot labeled with its name in the data preview display.
Target Display in HYSCAN
3. When you have marked all of the targets, save the Target file
by selecting FILE-SAVE and naming your file.
Beware!!! If you select an existing Target file, the targets already in the file will be overwritten! If this is not your intent, create a new file by entering a new file name in the dialog.
5) Determining Fish Altitudes in Hyscan Determining the fish altitude is important to be able to accurately remove the water column before creating your mosaic. Failure to do this will result in a dark strip down the TIF which will affect the accuracy of the geo-referencing.
Some side scan devices have an altitude sensor and the fish altitude is recorded in the data files. It is wise to check these values for unlikely spikes and smooth them out. Other devices do not include altitude sensors and we must create fish altitude records based on the sounding data. The following sections detail the procedures for
1/05 Side Scan • 5-27
removing the water column from side scan data, with or without altitude information.
(a) Smoothing Towfish Altitudes in Hyscan The Altitude window can be used to visually examine the heading and sensor altitude readings from the loaded data file and to smooth them. 1. Access the Altitude window by selecting WINDOWS-
ALTITUDE. 2. Remove any spikes from your altitude readings by selecting
FILE-SMOOTH ALTITUDE (or right click and select Smooth Altitude). HYSCAN will remove large spikes in the value and replace them with interpolated the values. The vertical range of the Sensor Altitude graph automatically adjusts to match the amplitude range in the data.
3. Remove the water column by selecting FILE-CLOSE. HYSCAN redraws the data to scan view without the water column.
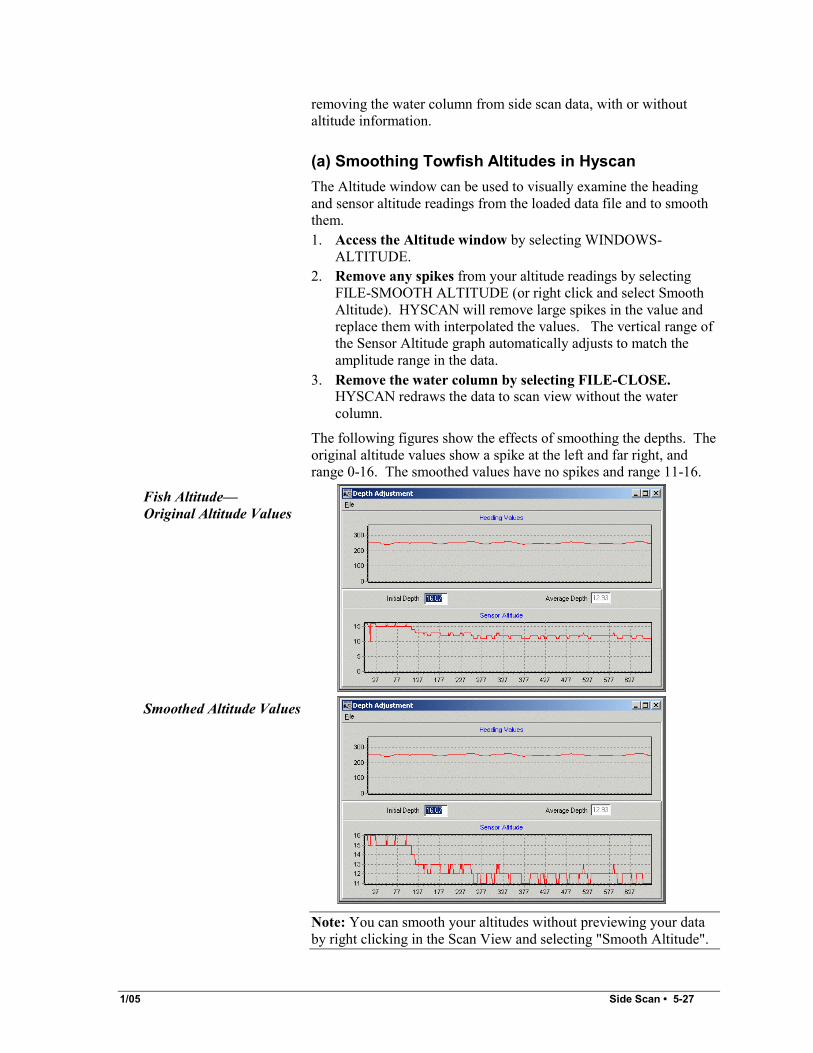
The following figures show the effects of smoothing the depths. The original altitude values show a spike at the left and far right, and range 0-16. The smoothed values have no spikes and range 11-16.
Fish Altitude— Original Altitude Values
Smoothed Altitude Values
Note: You can smooth your altitudes without previewing your data by right clicking in the Scan View and selecting "Smooth Altitude".

5-28 • Side Scan 1/05
(b) Creating Towfish Altitude Records in Hyscan Altitude information can be manually created for side scan data where it is not already recorded. (This is probably the case if you see a straight line in the Sensor Altitude graph of the Altitude window.) 1. Select WINDOWS-MANUAL ALTITUDE to access the
Manual Altitude Determination dialog.
Manual Altitude Dialog
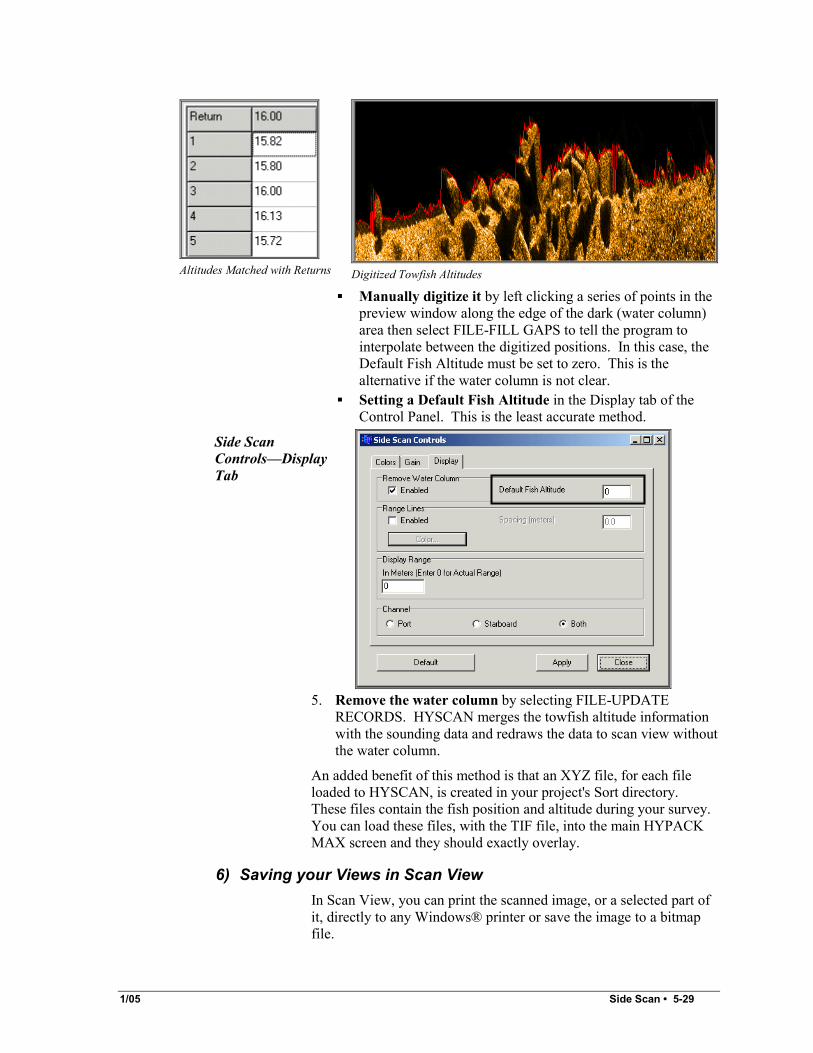
A table with the number of returns and the Altitude value for each displays at the left. When there is no data, all of the Altitude values will be 0. 2. Calculate the data threshold. The threshold is the change in
the strength of the return when the ping hits the bottom. a. In the scan preview, hold the cursor in the water column and
note the return value displayed in the status bar. b. Move the cursor to the bottom scan data and note the new
return value. c. Calculate the threshold by computing the difference between
the two return values. 3. Set the optimal threshold in HYSCAN by selecting OPTIONS-
THRESHOLD and select the greatest value from the menu that is still less than the calculated threshold.
4. Define the towfish altitude. There are three methods to do this. They are listed here in order of preference. ▪ Selecting OPTIONS-AUTODETECT. HYSCAN will
automatically digitize the edge of your data set. This works well where your water is clear so the water column is well defined.
1/05 Side Scan • 5-29
Altitudes Matched with Returns
Digitized Towfish Altitudes
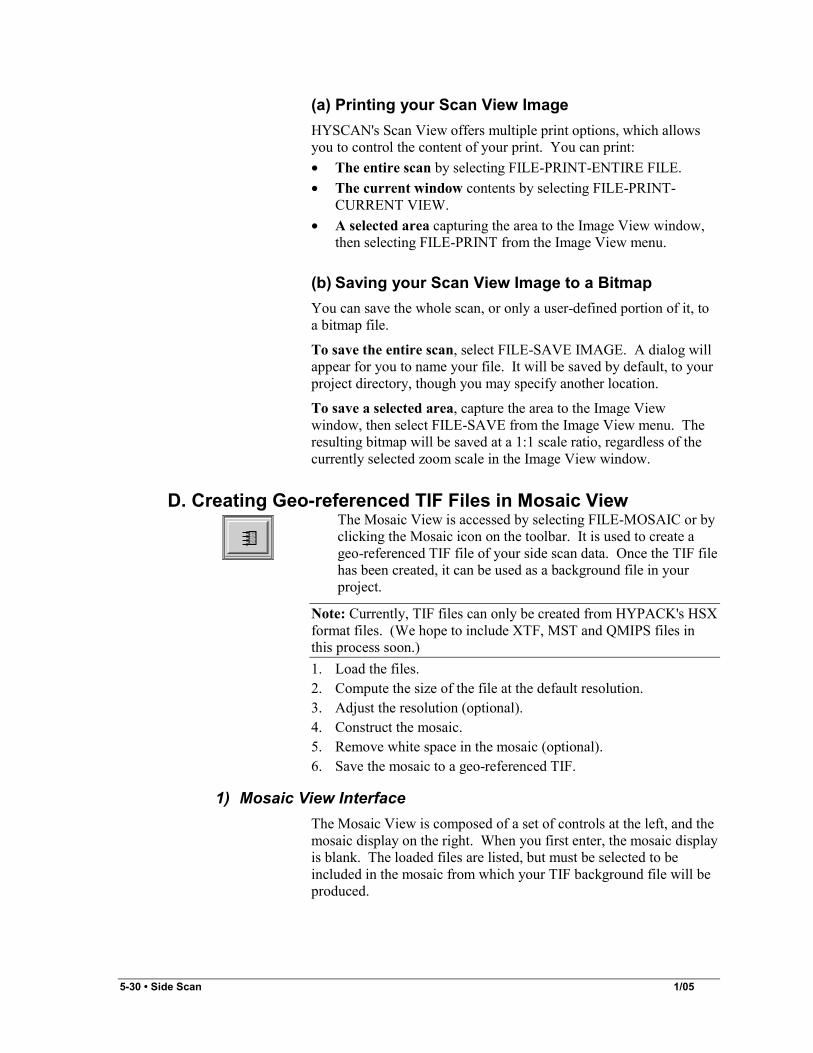
▪ Manually digitize it by left clicking a series of points in the preview window along the edge of the dark (water column) area then select FILE-FILL GAPS to tell the program to interpolate between the digitized positions. In this case, the Default Fish Altitude must be set to zero. This is the alternative if the water column is not clear.
▪ Setting a Default Fish Altitude in the Display tab of the Control Panel. This is the least accurate method.
Side Scan Controls—Display Tab
5. Remove the water column by selecting FILE-UPDATE
RECORDS. HYSCAN merges the towfish altitude information with the sounding data and redraws the data to scan view without the water column.
An added benefit of this method is that an XYZ file, for each file loaded to HYSCAN, is created in your project's Sort directory. These files contain the fish position and altitude during your survey. You can load these files, with the TIF file, into the main HYPACK MAX screen and they should exactly overlay.
6) Saving your Views in Scan View In Scan View, you can print the scanned image, or a selected part of it, directly to any Windows® printer or save the image to a bitmap file.
5-30 • Side Scan 1/05
(a) Printing your Scan View Image HYSCAN's Scan View offers multiple print options, which allows you to control the content of your print. You can print: • The entire scan by selecting FILE-PRINT-ENTIRE FILE. • The current window contents by selecting FILE-PRINT-
CURRENT VIEW. • A selected area capturing the area to the Image View window,
then selecting FILE-PRINT from the Image View menu.
(b) Saving your Scan View Image to a Bitmap You can save the whole scan, or only a user-defined portion of it, to a bitmap file.
To save the entire scan, select FILE-SAVE IMAGE. A dialog will appear for you to name your file. It will be saved by default, to your project directory, though you may specify another location.
To save a selected area, capture the area to the Image View window, then select FILE-SAVE from the Image View menu. The resulting bitmap will be saved at a 1:1 scale ratio, regardless of the currently selected zoom scale in the Image View window.
D. Creating Geo-referenced TIF Files in Mosaic View
The Mosaic View is accessed by selecting FILE-MOSAIC or by clicking the Mosaic icon on the toolbar. It is used to create a geo-referenced TIF file of your side scan data. Once the TIF file has been created, it can be used as a background file in your project.
Note: Currently, TIF files can only be created from HYPACK's HSX format files. (We hope to include XTF, MST and QMIPS files in this process soon.) 1. Load the files. 2. Compute the size of the file at the default resolution. 3. Adjust the resolution (optional). 4. Construct the mosaic. 5. Remove white space in the mosaic (optional). 6. Save the mosaic to a geo-referenced TIF.
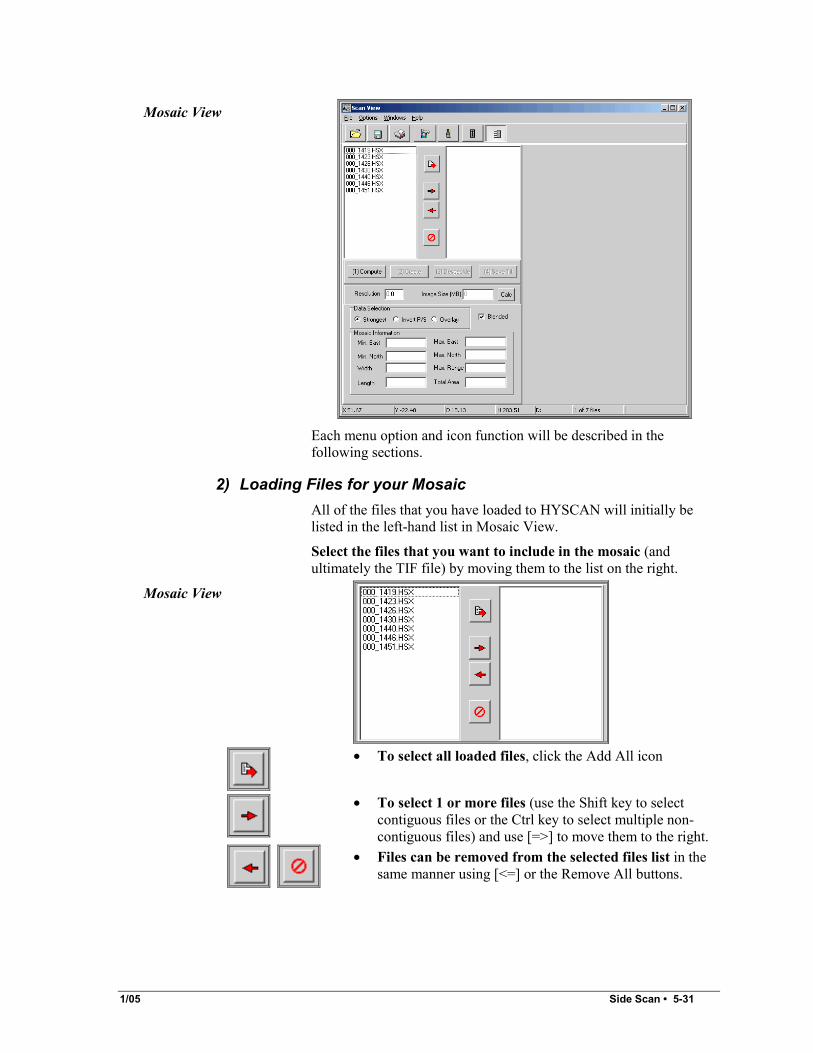
1) Mosaic View Interface The Mosaic View is composed of a set of controls at the left, and the mosaic display on the right. When you first enter, the mosaic display is blank. The loaded files are listed, but must be selected to be included in the mosaic from which your TIF background file will be produced.
1/05 Side Scan • 5-31
Mosaic View
Each menu option and icon function will be described in the following sections.
2) Loading Files for your Mosaic All of the files that you have loaded to HYSCAN will initially be listed in the left-hand list in Mosaic View.
Select the files that you want to include in the mosaic (and ultimately the TIF file) by moving them to the list on the right.
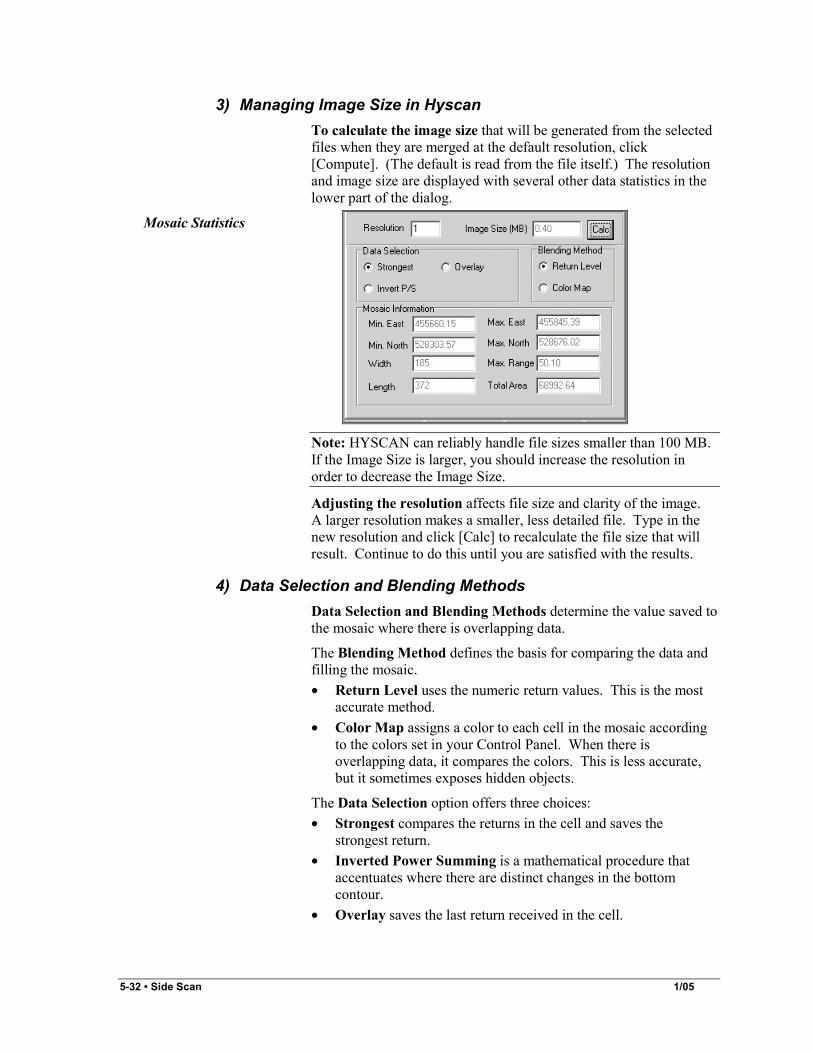
Mosaic View
• To select all loaded files, click the Add All icon
• To select 1 or more files (use the Shift key to select contiguous files or the Ctrl key to select multiple non-contiguous files) and use [=>] to move them to the right.
• Files can be removed from the selected files list in the same manner using [<=] or the Remove All buttons.
5-32 • Side Scan 1/05
3) Managing Image Size in Hyscan To calculate the image size that will be generated from the selected files when they are merged at the default resolution, click [Compute]. (The default is read from the file itself.) The resolution and image size are displayed with several other data statistics in the lower part of the dialog.
Mosaic Statistics
Note: HYSCAN can reliably handle file sizes smaller than 100 MB. If the Image Size is larger, you should increase the resolution in order to decrease the Image Size.
Adjusting the resolution affects file size and clarity of the image. A larger resolution makes a smaller, less detailed file. Type in the new resolution and click [Calc] to recalculate the file size that will result. Continue to do this until you are satisfied with the results.
4) Data Selection and Blending Methods Data Selection and Blending Methods determine the value saved to the mosaic where there is overlapping data.
The Blending Method defines the basis for comparing the data and filling the mosaic. • Return Level uses the numeric return values. This is the most
accurate method. • Color Map assigns a color to each cell in the mosaic according
to the colors set in your Control Panel. When there is overlapping data, it compares the colors. This is less accurate, but it sometimes exposes hidden objects.
The Data Selection option offers three choices: • Strongest compares the returns in the cell and saves the
strongest return. • Inverted Power Summing is a mathematical procedure that
accentuates where there are distinct changes in the bottom contour.
• Overlay saves the last return received in the cell.
1/05 Side Scan • 5-33
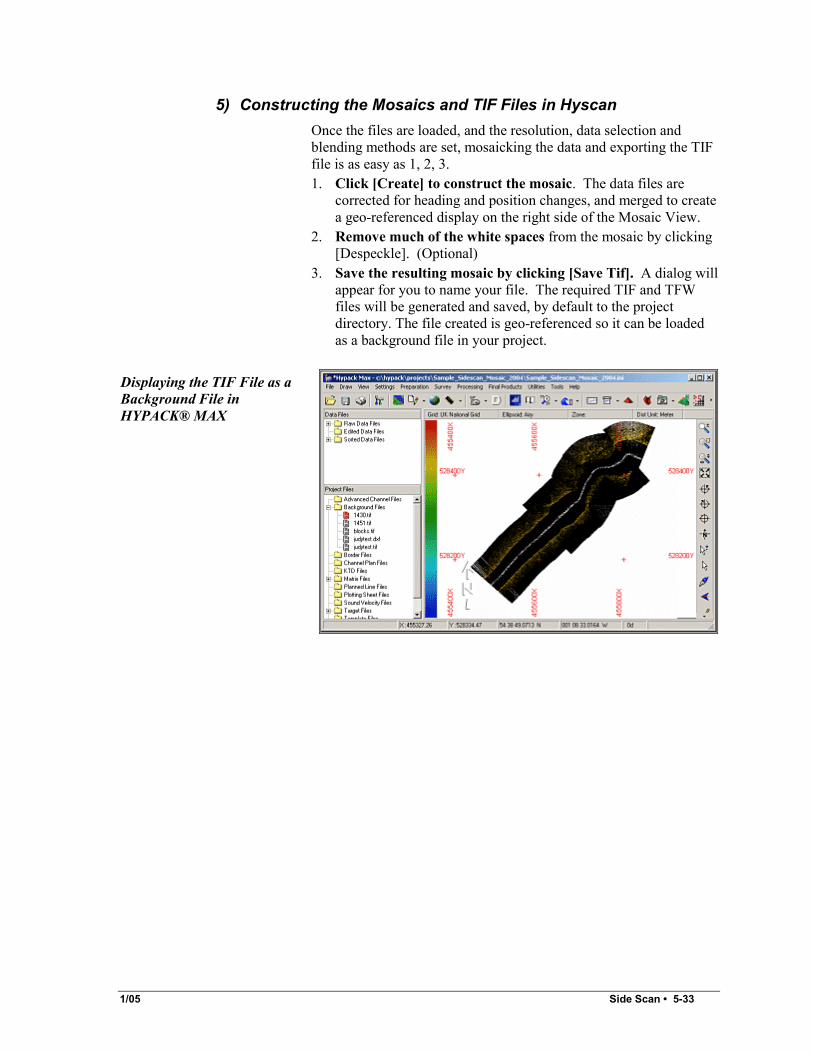
5) Constructing the Mosaics and TIF Files in Hyscan Once the files are loaded, and the resolution, data selection and blending methods are set, mosaicking the data and exporting the TIF file is as easy as 1, 2, 3. 1. Click [Create] to construct the mosaic. The data files are
corrected for heading and position changes, and merged to create a geo-referenced display on the right side of the Mosaic View.
2. Remove much of the white spaces from the mosaic by clicking [Despeckle]. (Optional)
3. Save the resulting mosaic by clicking [Save Tif]. A dialog will appear for you to name your file. The required TIF and TFW files will be generated and saved, by default to the project directory. The file created is geo-referenced so it can be loaded as a background file in your project.
Displaying the TIF File as a Background File in HYPACK® MAX