Checking theory: features, functional heads, and checking ...
55 %% SSAAMMPPLLEE CCHHEECCKKIINNGG OOFF DDIISSEE DDAATTAA OOFF 22000099--1100 IINN OORRIISSSSAA
Sponsored by
OOrriissssaa PPrriimmaarryy EEdduuccaattiioonn PPrrooggrraammmmee AAuutthhoorriittyy
Siksha Soudha, Unit-V, Bhubaneswar
Prepared by
AAMMCC RREESSEEAARRCCHH GGRROOUUPP
103-A, Friends Colony (East), New Delhi - 110065 (Ph: 011-26310480, Fax: 011-26312089)
Email – [email protected], Website – www.amcresearchgroup.com
Free and compulsory education to all children up to the age of fourteen years is our
constitutional commitment. The Government of India has initiated a number of programmes to
achieve the goal of Universalisation of Elementary Education (UEE). Among the several
programmes launched, Sarva Shiksha Abhiyan (SSA) is the most recent one in this regard. The
Sarva Shiksha Abhiyan (SSA) is a historic stride towards achieving the long cherished goal of
Universalisation of Elementary Education (UEE) through a time bound integrated approach, in
partnership with States. SSA, which promises to change the face of the elementary education
sector of the country, aims to provide useful and quality elementary education to all children in
the 6-14 age group by 2010. Unlike the previous programmes of this nature, SSA is quite distinct
in terms of implementation through mission as well as partnership mode.
The information/ data collected through DISE play a key role for preparation of
Annual Work Plan and Budget for the Districts and State. Filling the Data Capturing Format is a
crucial activity for each school that provides DISE data. The reliability of the data depends on
the type of training imparted to all the functionaries involved in the process of data collection.
The present study “5% Random Sample Checking of DISE Data of 2009-10” seeks to know the
strengths and weaknesses in the process of DISE data collection and the deviation level through
various indicators.
We are thankful to OPEPA, Govt. of Orissa for assigning AMC Research Group,
New Delhi to undertake the study and for providing the financial assistance.
The present report is an outcome of dedicated commitment to the field survey by
research investigators and cooperation received from Teachers, Headmasters, BRCCs and
CRCCs concerned along with officials of District and Orissa Primary Education Programme
Authority (OPEPA). The author duly thanks them for their fullest cooperation and facilities
provided to successfully completing the Post Enumeration Survey.
Our thanks are due to Shri Sanjeeven Kumar Librarian for his assistance during
literature survey. We are equally thankful to Shri Sashi Mohan Chaturvedi Administrative
Officer, Shri Naval Kishore Sharma, and Shri Sailesh Kumar Singh of our office for extending all
support for conducting the study.
Acknowledgement

We are also thankful to Md. Javed Masud and Shri Neeraj Kumar Singh for
taking up all the responsibility for data entry and typing work. Our thanks are due to Shri Data
Ram for xeroxing the report.
We hope the findings of this report will be useful to the teachers, schools, SSA
functionaries, OPEPA, academicians, researchers and those having interest in spreading quality
education in the State. It will help both the planners and the policy makers in designing
appropriate policy interventions to improve the quality of elementary education in the State and
country in general and to improve the quality DISE data collection in particular.
Maj. Gen A M Chaturvedi (Retd.)
Director
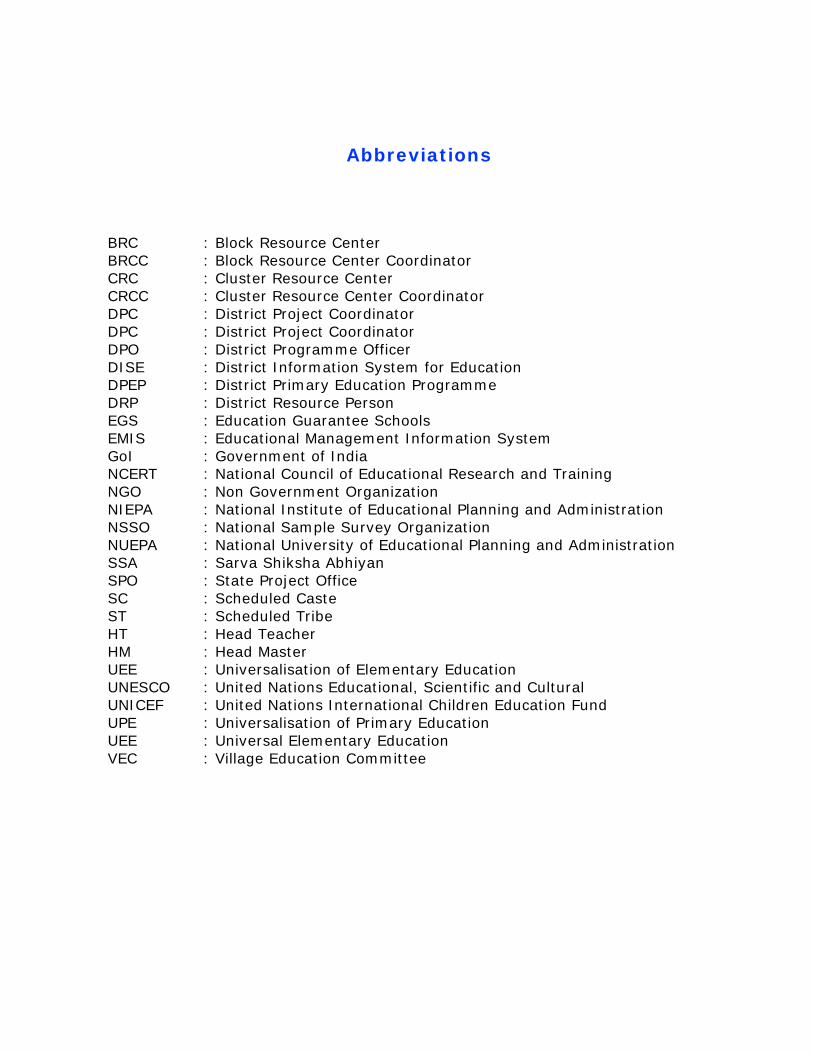
Abbreviations
BRC : Block Resource Center BRCC : Block Resource Center Coordinator CRC : Cluster Resource Center CRCC : Cluster Resource Center Coordinator DPC : District Project Coordinator DPC : District Project Coordinator DPO : District Programme Officer DISE : District Information System for Education DPEP : District Primary Education Programme DRP : District Resource Person EGS : Education Guarantee Schools EMIS : Educational Management Information System GoI : Government of India NCERT : National Council of Educational Research and Training NGO : Non Government Organization NIEPA : National Institute of Educational Planning and Administration NSSO : National Sample Survey Organization NUEPA : National University of Educational Planning and Administration SSA : Sarva Shiksha Abhiyan SPO : State Project Office SC : Scheduled Caste ST : Scheduled Tribe HT : Head Teacher HM : Head Master UEE : Universalisation of Elementary Education UNESCO : United Nations Educational, Scientific and Cultural UNICEF : United Nations International Children Education Fund UPE : Universalisation of Primary Education UEE : Universal Elementary Education VEC : Village Education Committee

Contents
Page No.
Map i List of Tables ii – iii List of Annexure iV Executive Summary v - x Chapter – 1. Introduction 1 - 5
Chapter – 2. Objectives and Methodology 6 - 13 Chapter – 3. Comparative Analysis on DISE Data and PES Data 14 - 35 Chapter – 4. Findings on Field Observation 36 - 50 Chapter – 5. Conclusions and Recommendation 51 - 52
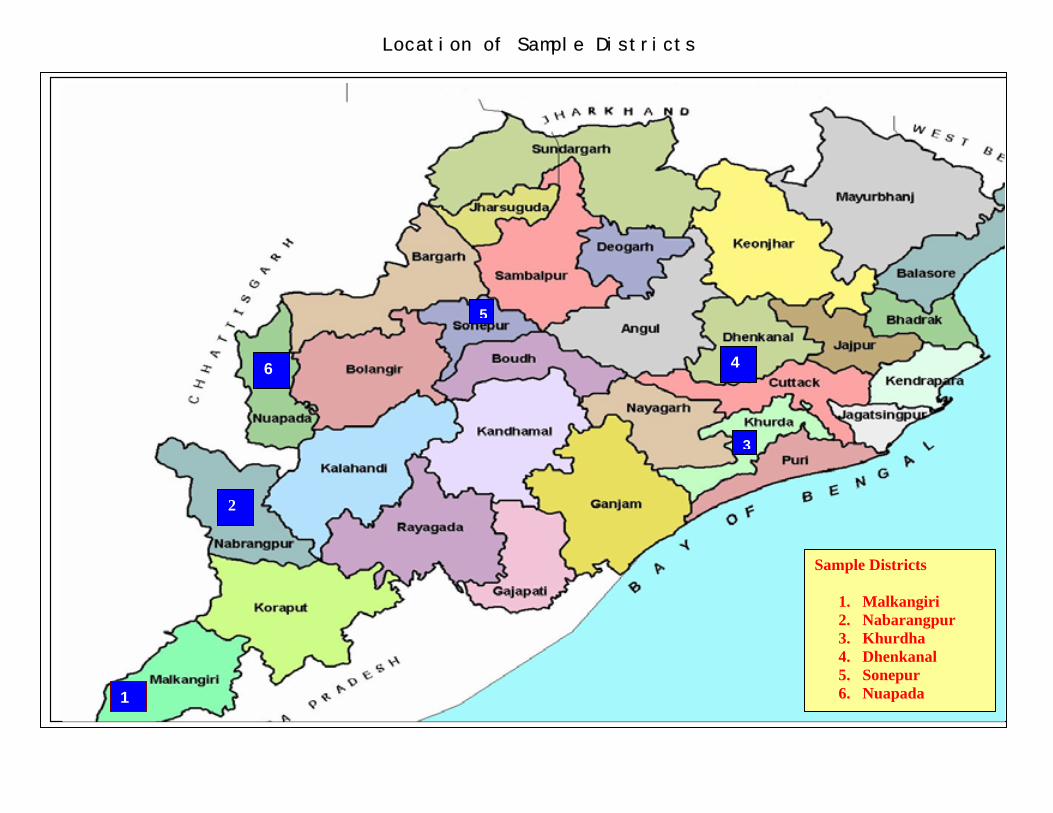
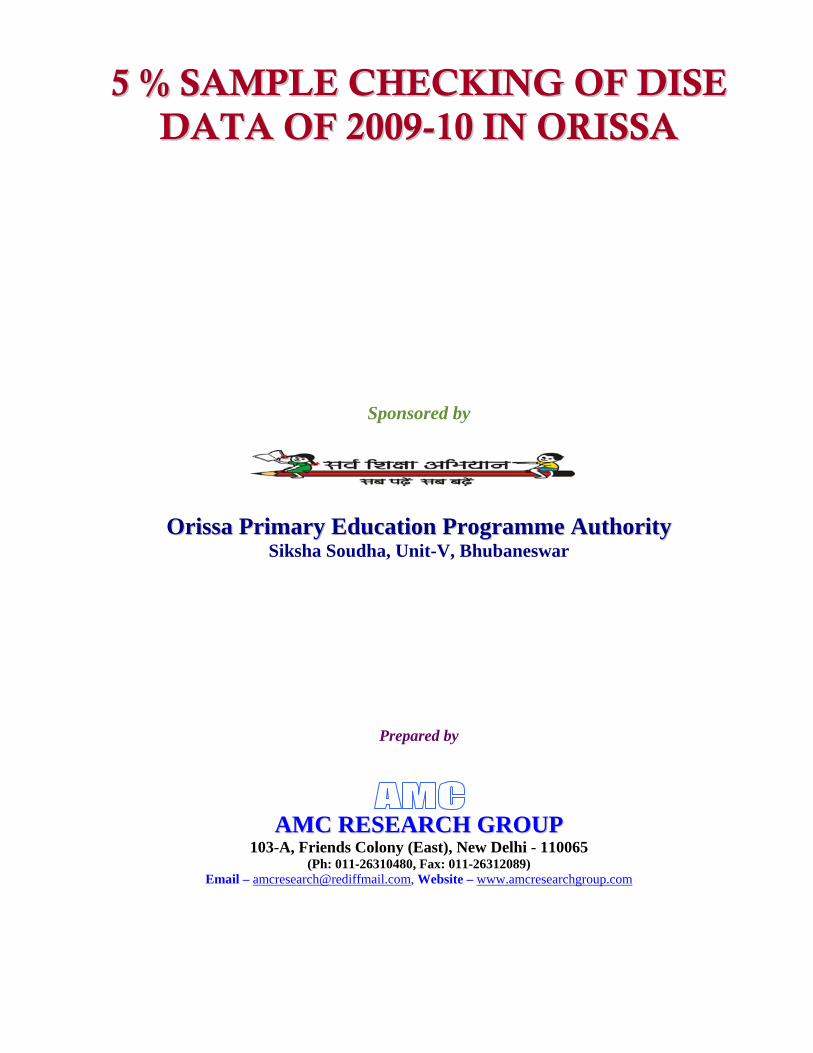
Location of Sample Districts
1
2
3
4
5
6
Sample Districts
1. Malkangiri 2. Nabarangpur 3. Khurdha 4. Dhenkanal 5. Sonepur 6. Nuapada
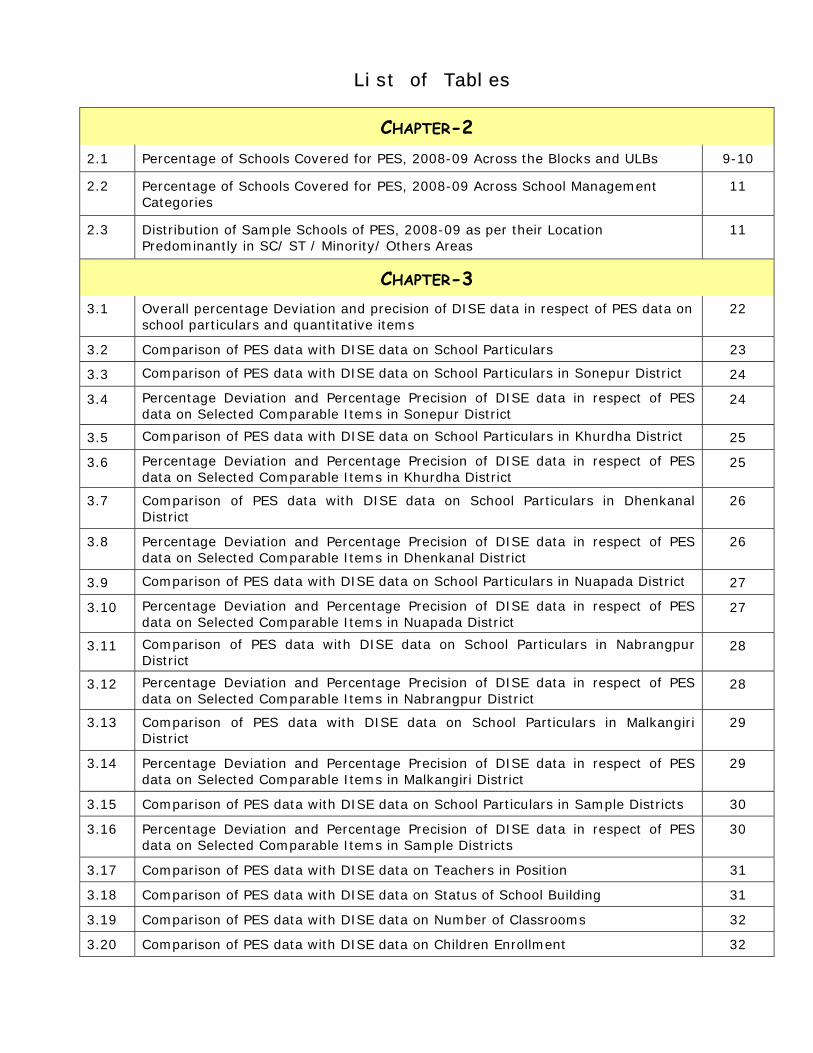
List of Tables
CHAPTER-2 2.1 Percentage of Schools Covered for PES, 2008-09 Across the Blocks and ULBs 9-10
2.2 Percentage of Schools Covered for PES, 2008-09 Across School Management Categories
11
2.3 Distribution of Sample Schools of PES, 2008-09 as per their Location Predominantly in SC/ ST / Minority/ Others Areas
11
CHAPTER-3 3.1 Overall percentage Deviation and precision of DISE data in respect of PES data on
school particulars and quantitative items 22
3.2 Comparison of PES data with DISE data on School Particulars 23
3.3 Comparison of PES data with DISE data on School Particulars in Sonepur District 24
3.4 Percentage Deviation and Percentage Precision of DISE data in respect of PES data on Selected Comparable Items in Sonepur District
24
3.5 Comparison of PES data with DISE data on School Particulars in Khurdha District 25
3.6 Percentage Deviation and Percentage Precision of DISE data in respect of PES data on Selected Comparable Items in Khurdha District
25
3.7 Comparison of PES data with DISE data on School Particulars in Dhenkanal District
26
3.8 Percentage Deviation and Percentage Precision of DISE data in respect of PES data on Selected Comparable Items in Dhenkanal District
26
3.9 Comparison of PES data with DISE data on School Particulars in Nuapada District 27
3.10 Percentage Deviation and Percentage Precision of DISE data in respect of PES data on Selected Comparable Items in Nuapada District
27
3.11 Comparison of PES data with DISE data on School Particulars in Nabrangpur District
28
3.12 Percentage Deviation and Percentage Precision of DISE data in respect of PES data on Selected Comparable Items in Nabrangpur District
28
3.13 Comparison of PES data with DISE data on School Particulars in Malkangiri District
29
3.14 Percentage Deviation and Percentage Precision of DISE data in respect of PES data on Selected Comparable Items in Malkangiri District
29
3.15 Comparison of PES data with DISE data on School Particulars in Sample Districts 30
3.16 Percentage Deviation and Percentage Precision of DISE data in respect of PES data on Selected Comparable Items in Sample Districts
30
3.17 Comparison of PES data with DISE data on Teachers in Position 31
3.18 Comparison of PES data with DISE data on Status of School Building 31
3.19 Comparison of PES data with DISE data on Number of Classrooms 32
3.20 Comparison of PES data with DISE data on Children Enrollment 32
3.21 Comparison of PES data with DISE data on SC Children Enrollment 33
3.22 Comparison of PES data with DISE data on ST Children Enrollment 33
3.23 Comparison of PES data with DISE data on Number of Repeaters 34
3.24 Comparison of PES data with DISE data on Enrollment of Children with Disabilities 34
3.25 Comparison of PES data with DISE data on Annual Examination Results in Grade V & VII of the year 2008-09
35
3.26 Comparison of PES data with DISE data on Source of drinking water 35
CHAPTER-4
4.1 Quality of Initial Response of P/HT to the Investigators During PES, 2009-10 37
4.2 Quality of Initial Response of P/HT to Provide Information During PES, 2009-10 38
4.3 Extent of Availability of Records at Schools on the Day of PES, 2009-10 40
4.4 Quality of Conditions of Records Maintained at Schools on the Day of PES, 2009-10
40
4.5 Quality of Updation of Records Maintained at Schools on the Day of PES, 2009-10 40
4.6 Extent of Principal / Head Teacher Received Training on DISE in 2009-10 43
4.7 Level of Organization of DISE Training in 2009-10 43
4.8 Duration of DISE Training in 2009-10 43
4.9 Category of Trainers giving Training on DISE in 2009-10 44
4.10 Extent of Explanation of DCF during DISE Training in 2009-10 44
4.11 Extent of Doubts Removed During DISE Training in 2009-10 44
4.12 Extent of Schools Where the DISE DCF had been filled up by the Same Teacher Who had got DISE Training in 2009-10
45
4.13 Extent of Schools Received School Summary Report (SSR) of 2009-10 47
4.14 Extent of Schools Having DISE Format with Filled in Data of 2009-10 48
4.15 Extent of Schools Having School Display Board 50
4.16 Extent of Schools Mentioned DISE Data in School Display Board (SDB) on the Day of Visit of PES Study Team in 2009-10
50
List of Annexure Annexure ‘A’ : References Annexure ‘B’ : List of Sample Schools covered for PES, 2009-10 in Sonepur, Khurdha, Dhenkanal, Nuapada, Nabarangpur and Malkangiri Annexure ‘C’ : District Information System for Education Special DCF for Post Enumeration Survey
Investigator’s Feedback Schedule
School Observation Schedule

Executive Summary
Free and compulsory education to all children up to the age of fourteen years is our
constitutional commitment. The Government of India has initiated a number of programmes
to achieve the goal of Universalisation of Elementary Education (UEE). Among the several
programmes launched, Sarva Shiksha Abhiyan (SSA) is the most recent one in this regard.
The Sarva Shiksha Abhiyan (SSA) is a historic stride towards achieving the long cherished
goal of Universalisation of Elementary Education (UEE) through a time bound integrated
approach, in partnership with States. SSA, which promises to change the face of the
elementary education sector of the country, aims to provide useful and quality elementary
education to all children in the 6-14 age group by 2010. Unlike the previous programmes of
this nature, SSA is quite distinct in terms of implementation through mission as well as
partnership mode.
In the context of implementation of Sarva Siksha Abhiyan (SSA), a massive programme
undertaken in the realm of education sector, what assumes greater significance is proper
implementation of the programme itself to derive appropriate results. For effective
implementation of such large-scale programme, collecting information, analyzing the results,
identifying the corrective course, deriving instructions based on the actual situation, the
Sarva Shiksha Abhiyan (SSA) is implemented throughout the country with the help of project
authorities of state government concerned. An elaborate MIS mechanism has been laid to
monitor the implementation of the programme, gauge the results and identify course of
action from time to time. At the project authority level i.e. State level, the District
Information System for Education (DISE) collects data pertaining to various aspects of
education system through a structured schedule consisting of information on school
education. At district level regular monitoring reports are being prepared and submitted to
Ministry of HRD, Govt. of India at periodical intervals. In addition, with a view to establishing
the veracity of information provided by the project authorities concerned, an external
institution conducts similar survey i.e. DISE, based on a five per cent sample survey. Thus,
appropriate MIS in essence properly guards the SSA.
As per the desire of the MHRD, GoI the5% sample check of the DISE data by an external
research agency has been asked by the State Project Director, OPEPA, AMC Research Group,
New Delhi has taken up the study in 06 Districts of Orissa namely Sonepur, Khurdha,
Dhenkanal, Nuapada, Nabrangpur and Malkangiri. The report is aimed at verification of data
collected through DISE and verifies data similarities as well as fluctuations, if any. In
essence, thus report is solely aimed at verification of actual data collected and submitted and
thus leading to refining and also to maintain internal consistency of data to facilitate decision-
making process in educational management.
Three prescribed data collection formats provided by SPO were used for data collection.
Besides, a few CRCCs and BRCCs were interviewed to elicit their views on their role in DISE
activity and on the difficulties faced by the Head Teachers during training, data collection and
data entry. Their suggestions were also taken on how to overcome these difficulties so as to
make the DISE data more authentic in the subsequent years. In the next stage the DCFs
filled in with DISE data of sample schools covered under PES were collected from the DPOs of
Sonepur, Khurdha, Dhenkanal, Nuapada, Nabrangpur and Malkangiri Districts and then
processed in computers. Comparison between DISE and PES data was made to identify the
number of schools showing variations on selected items. The percentage deviation and
percentage precision were calculated and the reasons for such deviations were identified so
as to suggest corrective measures to improve the qualitative aspects of the DISE activity in
future.
The Five per cent sample check of DISE data was based on data collected in six districts viz.
Sonepur, Khurdha, Dhenkanal, Nuapada, Nabrangpur and Malkangiri representing Central,
Northern and Southern regions of the state. Data for the study was collected from 510
schools spread over six districts selected for the study. However, comparison between DISE
and PSE data could be established only in 510 schools. Further, in reference to certain
variables there was no commonality between formats canvassed for DISE and PSE data.
Hence, the report has not only the limitation of comparison among 510 schools but also in
reference to certain common variables. However, the data on independent variables, for
which there was a provision in PSE data format, description on findings was presented
separately. The specific objectives of the Post Enumeration Survey (PES) are as follows:
1. To cross check the DISE data with the PES data and to find out the deviation as well
as the precision levels.
2. To make field level observation on:
a) Cooperation of Principal/ Head Teacher in providing data
b) Status of records of schools
c) Training of Principal/ Head Teachers in filling up of DISE data
d) Availability of infrastructure and computer professional in the District MIS
unit

e) Data feeding arrangement made at District level
f) Feedback to schools in terms of School Report Cards
g) Availability of DISE data at all levels
h) Evidence of sharing workshops at all levels for dissemination and
awareness about DISE data
i) Display of key information on the School Display/Information Board
j) Use of DISE data in planning
3. To identify the major lacunae in conducting the DISE activities and in the formats
used for both DISE and PES
4. To suggest measure to reduce the extent of deviation between DISE data and PES
data.
5. To recommend the changes to be made in improving the DISE and PES operations as
well as formats especially to make them more effective for cross checking and for
making the DISE data more relevant for preparing Annual Work Plan and Budget by
improving its quality.
Findings of the study:
The overall deviation of DISE data from PES data, in respect of all comparable items, is
1.57%, which is within the range of permissible percentage of deviation i.e. 10%, and
there by giving a precision level of 98.43% for DISE data in relation to PES
The comparison of DISE and PES data 2009-10 has reflects that the DISE data differ
from PES data in 4.12 percent schools in case of year of establishment, 2.54 percent
schools in case of school category, 3.33 percent in type of school, 1.18 percent on
lowest class, 5.09 percent on highest class, 3.72 percent on ‘school management’ and
0.98 percent on medium of transaction.
Further, it reveals that the percentage deviation of DISE data from PES data is 4.33
percent on Teachers in position, 3.14 percent on status of school building, 4.08 percent
on number of classrooms, 0.59 percent on children enrollment, 1.31 percent on SC
children enrollment, 0.86 percent on ST children enrollment, 2.77 percent on number of
repeaters, 16.03 percent on enrollment of children with disabilities, 3.12 percent on last
year annual examination results and 1.57 percent on Source of drinking water.
In many cases, due care has not been taken by the Head Teacher in filling up the DISE
data and proper verification of DISE data has not been made by the CRCCs and BRCCs.
The high level mismatch on items like number of repeaters and enrollment of children
with disabilities have occurred due to wrong or no entry of data in DISE format and
improper cross-checking of DISE data by the concerned CRCC, BRCC and other
supervising personnel.
A positive mindset of Principal / Head Teacher is required for accurate and timely DISE
data collection. At aggregate level, 44.31 percent of sample Head Teachers/ Principals
have shown very good initial response to the PES study team. Again, 43.52 percent of
sample schools showed a very good status on maintaining the records of the schools
With regard to training aspect of Principal / Head Teacher in filling up of DISE data,
78.62 percent of Head Teachers have received the training either at Cluster level. All of
the sample Districts have the requisite softwares for DISE data entry and these
softwares have been provided by State MIS Unit. The prescribed arrangements have
been made in the sample Districts to provide computerized School Report Card.
All the sample schools in six sample district did not have their own copy of DISE DCF. It
was made available at the concerned DPO. The PES team further found that the
compiled DISE data of 2008-09 were not available at any of the CRC and BRC of
Sonepur, Khurdha, Dhenkanal, Nuapada, Nabrangpur and Malkangiri Districts. However,
DPOs have planned to provide Block level and Cluster level compiled DISE data to BRCs
and CRCs respectively later on.
In Sonepur, Khurdha, Dhenkanal, Nuapada and Malkangiri Districts, DPOs had
conducted District level sharing workshop with BRCCs and CRCCs but in Nabaranpur
District it was not conducted still. VEC and MTA members had not been invited at CRC
level to make an effort to disseminate and create awareness on DISE data.
The field observation of the PES study team highlights that till the visit of the PES study
team, no school of Sonepur, Khurdha, Dhenkanal, Nuapada, Nabarangpur and
Malkangiri Districts had got the School Report Card for 2009-10.
Further, it is revealed that 79.80 percent of the sample schools have School Display
Board/ Information Board. The data on students’ enrollment, students’ attendance,
teachers in position and grants received have been displayed in 86.73 percent, 79.85
percent, 83.78 percent and 25.79 percent respectively of sample schools respectively
even though all schools are required to display such information.

Despite organization of DISE training and sufficient consciousness of Principals/ Head
Teachers on the DISE activity, mismatch between DISE and PES data has been found
on almost all items of comparable data.
Discussion on DCF guideline was partially done in Sonepur, Khurdha, Dhenkanal,
Nuapada, Nabrangpur and Malkangiri Districts during the DISE training. Detailed
explanation and doubt clarification of the DCF guidelines and concepts were not done
during the training. Owing to short duration of time for data filling and cross-checking,
some BRCCs and CRCCs could not properly rectify the mistakes done by the Head
Teachers in the DCFs of some schools.
Recommendations:
It has been observed during the field work that teachers consider the DISE information
as a routine one and hence do not pay desired attention while filling the DISE DCFs. In
such a situation the quality of DISE data is always at stake. It is, therefore, suggested
that Head Master/Teacher concerned should be made personally responsible for
providing correct and accurate data.
Teachers don't take seriously the training imparted by the CRCCs. Alternatively, the
DIETs can also be given the responsibility of training at the district, block and CRC
levels. The DISE format is lengthy and hence it should be re-designed to keep it short and
simple keeping in view the abilities and time available among teachers concerned.
More emphasis should be laid on issues like enrolment, retention, and dropout and
attendance rate in the data capture format resulting in effective enumeration of vital
statistics.
Collection of data through DISE format may be ensured by October of each academic
year so that the Five Percent Sample Check can be attempted by December of the same
academic year so that the results can be appropriately utilized for planning the activities
for next academic year.
The formats canvassed for Post Enumeration Survey (DCF) and the District Information
System of Education (DISE) were quite different in terms of certain variables/aspects.
This has been resulting in difficulty in establishing similarities or confirmation of data
through Five Percent Check.
The School Head Masters, Block Educational Officers, Officers of District project SSA and
DIET faculty should be given training on collection and utilization of DISE data and its
all related soft ware applications for proper planning and implementation of Educational
activities.
All the teachers must be given proper orientation and awareness that based on this data
the budgetary provisions of schools were made hence, it is mandatory to know all these
by the concerned personnel of the schools.
Though this year scrutiny was under taken by the CRCCs, in most of the places it was
quite casual. Hence this has to be relooked and Effective supervision and monitoring
should be ensured at Block and District level.
In order to improve the quality of data across the district it is further suggested that
optimal utilization of DISE data should be made at all levels. As such it is essential that
data at each level, right from the School to district level, be shared and discussed in
details.
Districts should maintain the time line for DISE data collection. The DISE data should be
collected in the month of October and completed before December and PES survey
should be done in the month of December.
School Summary Reports should be distributed to each school by 15th December so that
in December the VEC can conduct sharing meeting.
The school copy of DISE DCF should be returned to schools immediately after
completion of CRC level data compilation work to facilitate sharing of DISE data in VEC
meeting.

Chapter – 1 Introduction
1.1 Context In the contemporary world economy, no country has achieved constant economic
development without considerable investment in human capital. Previous studies have shown
handsome returns to various forms of human capital accumulation: basic education,
research, training, learning-by-doing and aptitude building. The distribution of education also
matters in this regard. Unequal education tends to have a negative impact on per capita
income in most countries. Moreover, controlling for human capital distribution and the use of
appropriate functional form specifications consistent with the asset allocation model make a
difference for the effects of average education on per capita income, while failure to do so
leads to insignificant and even negative effects of average education. Investment in human
capital can have little impact on growth unless people can use education in competitive and
open markets. The larger and more competitive these markets are, the greater are the
prospects for using education and skills.
In the earlier neoclassical models, education was not considered a major input for production
and hence was not included in growth models (Harberger, 1998: 1-2). In the 1960s
mounting empirical evidence stimulated the “human investment revolution in economic
thought” (Bowman, 1960). The seminal works of (Schultz, 1961) and (Denison, 1962) led to
a series of growth accounting studies pointing to education’s contribution to the unexplained
residuals in the economic growth of western economies. Other studies looked at the impact
of education on earnings or estimated private rate of returns (Becker 1964, Mincer 1974). A
1984 survey of growth accounting studies covering 29 developing countries found estimates
of education’s contribution to economic growth ranging from less than 1 percent in Mexico to
as high as 23 percent in Ghana (Psacharopoulos, 1984).
Prior to the nineteenth century, systematic investment in human capital was not considered
especially important in any country. Expenditures on schooling, on-the-job training, and
other similar forms of investment were quite small. This began to change radically during this
century with the application of science to the development of new goods and more efficient
methods of production, first in Great Britain, and then gradually in other countries.
During the twentieth century, education, skills, and the acquisition of knowledge have
become crucial determinants of a person’s and a nation’s productivity. One can even call the
twentieth century the “Age of Human Capital” in the sense that the primary determinant of a
country’s standard of living is how well it succeeds in developing and utilizing the skills and
knowledge, and furthering the health and educating the majority of its population.
1.2 Education: the Scenario Though India has the rich tradition of having one of the oldest education system i.e. Gurukul,
yet the present scenario is quite tardy in terms of spread of education among all sections of
people as well as level of education. Whatever the historical reasons may be the
backwardness in terms of spread of education was taken up as a great challenge by the time
of Independence. Constitutional measures taken up to provide compulsory education among
all sections of population. However, given the population growth on one side and the physical
constraints like difficult terrain, habitations in remote areas, tribal dialect etc on the other
hampered the progress in terms of spread of education. Given the tardy progress in
education new programmes have been taking shape to further education across the country
from time to time.
Free and compulsory education to all children up to the age of fourteen years is our
constitutional commitment. The Government of India has initiated a number of programmes
to achieve the goal of Universalisation of Elementary Education (UEE). Among the several
programmes launched, Sarva Shiksha Abhiyan (SSA) is the most recent one in this regard.
The Sarva Shiksha Abhiyan (SSA) is a historic stride towards achieving the long cherished
goal of Universalisation of Elementary Education (UEE) through a time bound integrated
approach, in partnership with States. SSA, which promises to change the face of the
elementary education sector of the country, aims to provide useful and quality elementary
education to all children in the 6-14 age group by 2010. Unlike the previous programmes of
this nature, SSA is quite distinct in terms of implementation through mission as well as
partnership mode.
1.3 Education: pattern in Orissa School education in India is organized in four stages, namely, Primary, Upper Primary,
Secondary and Higher Secondary. Primary and Upper Primary together constitute the
elementary stage. While the minimum number of years required for completing general
school education is 10-year through out the country, the decision of the 10-year general

school education into Primary, Upper Primary and Secondary continues to be different in
some of the states and Union Territories. Eighteen States and Union Territories have adopted
the national pattern of 5+3+2 pattern of general school education. In twelve other States
and Union Territories, the pattern of school education is 4+2+3 and three States and Union
Territories follow a 5+2+3 pattern. One State follows a general school education system of
4+4+2. In Orissa, the pattern of school education has been 5+2+3 i.e. 5-year Primary, 2-
year Upper Primary (that means of 7-year of elementary education) and 3-year Secondary
education. Unlike the national pattern, Class – VIII is attached to secondary stage of
schooling. But in HSC examination (i.e. the Secondary School Graduation Examination) is
based on the curriculum prescribed for Classes – IX & X. in reality, Class – VIII remains as a
buffer class between elementary and secondary stage of schooling. At present situation,
there are at least two compelling reasons to upscale the elementary stage to include Class –
VIII.
1.4 Effective implementation of Programme: Role of MIS
In the context of implementation of Sarva Siksha Abhiyan (SSA), a massive programme
undertaken in the realm of education sector, what assumes greater significance is proper
implementation of the programme itself to derive appropriate results. For effective
implementation of such large-scale programme, collecting information, analyzing the results,
identifying the corrective course, deriving instructions based on the actual situation assume
much of significance.
Further, recent trends in programme implementation demand make the availability of timely
and accurate information of the utmost importance to organizations engaged in education
activities. Information is a critical resource in the operation and management of
organizations. Timely availability of relevant information is vital for effective performance of
managerial functions such as planning, organizing, leading, and control. An information
system in an organization is like the nervous system in the human body: it is the link that
connects all the organization's components together and provides for better operation and
survival in a competitive environment. Indeed, today's organizations run on information.
In a programme of the magnitude of Sarva Shiksha Abhiyan (SSA), MIS thus plays a vital
role in ensuring proper implementation of the programmes, assess corrective course of
action, realign strategies and activities, measure the results and so on.

1.5 Sarva Siksha Abhiyan (SSA) and the MIS in vogue
Sarva Shiksha Abhiyan (SSA) is implemented throughout the country with the help of project
authorities of state government concerned. An elaborate MIS mechanism has been laid to
monitor the implementation of the programme, gauge the results and identify course of
action from time to time. At the project authority level i.e. state level, through District
Information System for Education (DISE) data pertaining to various aspects of education
system is collected through a structured schedule consisting of information on school
education at district level. Regular monitoring reports are being prepared and submitted to
Ministry of HRD, Govt. of India at periodical intervals. In addition, in order to establish the
veracity of information provided by the project authorities concerned, an external institution
conducts similar survey i.e. DISE, based on a five per cent sample survey. Thus, appropriate
MIS in essence properly guards the SSA.
1.6 District Information System for Education and Sample Check As cited, effective implementation of programmes heavily depends on information system
inbuilt in the programme implementation. This in view, District Information System for
Education provision was made for strengthening of Educational Management. A number of
Government and Quasi Government Institutions were involved in collection of information on
important educational variables from the schools concerned to provide inputs for formulation
of district elementary education plans under Sarva Shiksha Abhiyan. Further this intervention
will also be useful to decentralize framework programme implementation. In order to
facilitate the preparation of the Annual Work Plan and Budget, certain data are required
especially relating to child population, schooling facilities, infrastructure availability at
schools, different categories and extents of enrollment, examination performances etc. These
data are gathered by 02 methods, namely child census/ child tracking system and DISE data
collection. Like the Annual Work Plan and Budget, the DISE data are collected every year and
utilized for Annual Work Plan preparation. These data give a picture of the infrastructure and
learning achievement and thus help in prioritizing the activities of Sarva Shiksha Abhiyan.
The DISE data are also very useful in monitoring the implementation of activities of Sarva
Shiksha Abhiyan. To the researchers, these data are helpful to make a comparative analysis
of different aspects of elementary education across both Districts and States and find out the
reasons for differential degrees of progress of these aspects. Further, these data are sound
source to analyze the efficacy of the Sarva Shiksha Abhiyan programme at various spatial
levels.
Success of Sarva Shiksha Abhiyan programme greatly depends upon the credibility of Annual
Work Plan and Budget which in turn largely depends on the authenticity of the DISE data.
Thus one of the prime objectives of the Sarva Shiksha Abhiyan is to collect true and
dependable DISE data. This certainly would become possible when the Data Capture Formats
would be properly filled in with correct data. In order to make it possible, every DISE Data
Capture Format has been structurally designed as far as possible with closed questions and
each concept has been explained in an attached guidelines. Further, the data entry
personnels at different levels, such as the Head Teachers, CRCCs and BRCCs are given
training on DISE data entry. Besides, after the completion of the DISE data entry at school
level, the CRCCs, BRCCs and DIs of schools supervise and certify the correctness of the data.
Despite all precautionary measures taken at different levels, it had been pointed out by
different studies that some of the DISE data were not authentic and hence were
questionable. The Government of India then decided to take up a Post Enumeration Survey of
some selected school level data from 5% sample schools with a purpose to cross-check these
data that have already been collected in the school level DISE DCF. It is now mandatory for
all states and UTs to check the DISE data on sample basis.
Post Enumeration Survey is not just concerned with the cross-checking of the DISE data for
unraveling the areas of defective data entry. It also aims at identifying the main reasons that
caused for defective data entry in DISE DCFs and to find out the possible measures that can
reduce the extent of such defective data entry in future. Like the DISE data collection, the
Post Enumeration Survey has now become an activity of every year undertaken not by the
agency that implements Sarva Shiksha Abhiyan in different States/ UTs but by an external
agency not involved in implementation of SSA.
Since DISE data provides the basic information provided by the project authority concerned,
it is also quite essential to verify the data based on a sample check. The present report is
thus is based on data collected through five per cent sample of the actual DISE data in
sample districts of Orissa. The report is aimed at verification of data collected through DISE
and verifies data similarities as well as fluctuations, if any. In essence, the report is solely
aimed at verification of actual data collected and submitted and thus leading to refining and
also to maintain internal consistency of data to facilitate decision-making process in
educational management.
Chapter – 2
Objectives and Methodology
Keeping in view the broad goal of the sample checking of DISE data, the methodology of the
study needs to be precision oriented. Hence, careful sampling method and appropriate care
for other aspect related to methodology were taken into account. The brief description of
various components of the methodology followed in the study is provided in this chapter.
2.1 Objectives of the study The objectives of the Post Enumeration Survey (PES) will be as follows:
1. To cross check the DISE data with the PES data and to find out the deviation as well
as the precision levels.
2. To make field level observation on:
a. Cooperation of Principal/ Head Teacher in providing data
b. Status of records of schools
c. Training of Principal/ Head Teachers in filling up of DISE data
d. Availability of infrastructure and computer professional in the District MIS unit
e. Data feeding arrangement made at District level
f. Feedback to schools in terms of School Report Cards
g. Availability of DISE data at all levels
h. Evidence of sharing workshops at all levels for dissemination and awareness
about DISE data
i. Display of key information on the School Display/Information Board
j. Use of DISE data in planning
3. To identify the major lacunae in conducting the DISE activities and in the formats
used for both DISE and PES
4. To suggest measure to reduce the extent of deviation between DISE data and PES
data.
5. To recommend the changes to be made in improving the DISE and PES operations as
well as formats especially to make them more effective for cross checking and for
making the DISE data more relevant for preparing Annual Work Plan and Budget by
improving its quality.

2.2 Process of undertaking PES
The whole process of PES involved 03 stages. In the stage 1, preparatory activities were
conducted. The first activity of this stage was a discussion between the PES team with the
SPO authorities, especially those concerned with the DISE activity, on the strategy, concepts,
sampling, data collection, data analysis, report design, draft report presentation and
submission of the final report. It was a much difficult task especially because in 2009-10 in
the State, the DISE data collection at school level took place in October 2009 and data
compilation process at District level was not over when PES was started. Despite such
situation, the PES team conducted its second preparatory activity, i.e. training to the PES
team members on the data collection strategy and concepts used in the PES formats for 02
days. At the same time, letters were communicated to the DPOs of the Districts, namely
Khurdha, Dhenkanal, Sonepur, Nuapada, Malkangiri, and Nabrangpur, for making
necessary arrangements to facilitate smooth operation of PES and for providing the Block/
ULB wise and management wise school list. During this time, the printing work of the PES
formats and guidelines as provided by the SPO was made over.
The stage 2 of PES involved data collection at different levels. Three prescribed formats
(Annexure) provided by the SPO were used for collection of data at school level. Besides,
from a few CRCCs and BRCCs data were collected especially relating to their role in PES,
capacity building for PES, difficulties faced by Head Teachers in data collection, problems
faced while training the Head Teachers on DISE data entry and finally relating to their
suggestions to overcome these difficulties so as to make the DISE data more authentic in the
subsequent years. The District Programmers as well as the District Project Coordinators of
the sample Districts also interacted to know about the DISE data collection process, about
availability of adequate staffs, softwares and hardwares for conducting DISE activity etc.
During the stage 3 of PES, the DCFs filled in with DISE data of the sample schools covered
under PES were brought from the DPOs of Khurdha, Dhenkanal, Sonepur, Nuapada,
Malkangiri, and Nabrangpur. The data collected through PES and by DISE activities were
entered into computers and then compared to identify the number of schools showing
variations for the comparable items of PES. The percentage deviation and the percentage
precision for each comparable item were then calculated and the nature of such deviation
was then explained. The major reasons of such deviation were then identified and the
opinions of various levels of personnel concerned with DISE activity were gathered to know

the major weakness in the DCFs and the process of DISE operation. Finally, some measures
were identified basing upon the opinion of DISE activity operating personnel as well as our
own observation and analysis and then suggested to improve the qualitative aspects of the
DISE activity in future.
2.3 Sample Area and the sample size The DISE data collection has been done all over the State covering all management
categories of schools and in view of this, all schools imparting elementary level of education
covering Class I to Class VIII students have been covered in 2009-10. But to cross-check the
correctness of the DISE data collected at schools, all schools are not required to be visited.
As already decided by the Government of India, only a sample of the total schools is to be
covered for PES and the sample schools need not be covered from all Districts of the State.
As a matter of fact, the Government of India has delineated since 2006-07 onwards to cover
only 10% of the total Districts of the State and only 5% schools of each sample Districts for
PES. But the District sample should include 5% schools of total schools of each Block / ULB.
Further, at District level, the sample schools should include all types of schools across school
management. In the context of Orissa, three districts should have been selected for the 5%
sample check of DISE data. However, keeping the importance of DISE data, 06 Districts
(Dhankenal, Khordha, Malkangiri, Nabrangpur, Nuapada and Sonepur) were selected
by the SPO (i.e. OPEPA) for cross checking the DISE data 2009-10 since the State has 30
Districts. The selection of these districts was in accordance with the criteria of selection of
districts prescribed by NUPEA.
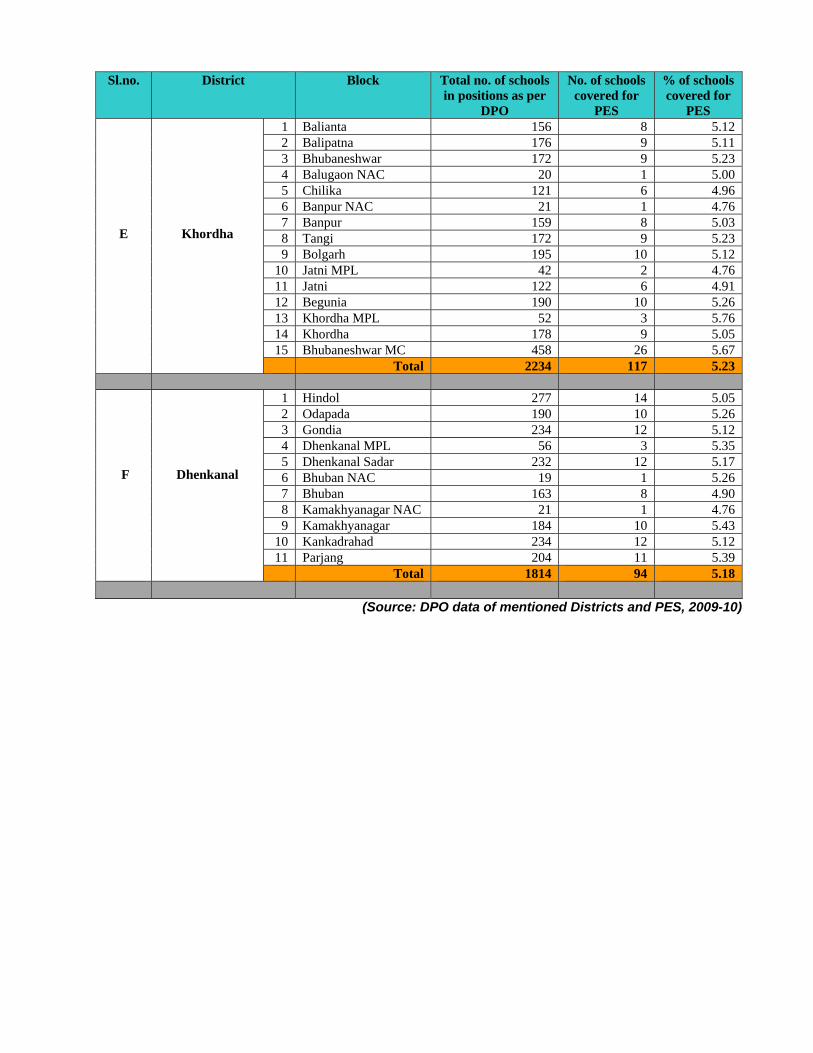
For the purpose of PES, in all, total of 510 (5.22%) schools were covered selecting them out
of 9723 schools by purposive random sampling method after classifying them into different
Blocks / ULBs. Random sampling was operated in such a way that the total sample schools in
each District represented about 05% of schools belonging to each Block and ULB and also to
each category of school management. The details of sample schools are reflected in the
Tables 1.1 and 1.2. Further, care has been taken to take sample schools from both rural and
urban areas. While selecting the schools, due consideration has also been given to schools
predominantly located in SC, ST and minority areas. The sample includes 169 schools (33.14
%) from these areas out of the total 510 sample schools (Table 1.3).
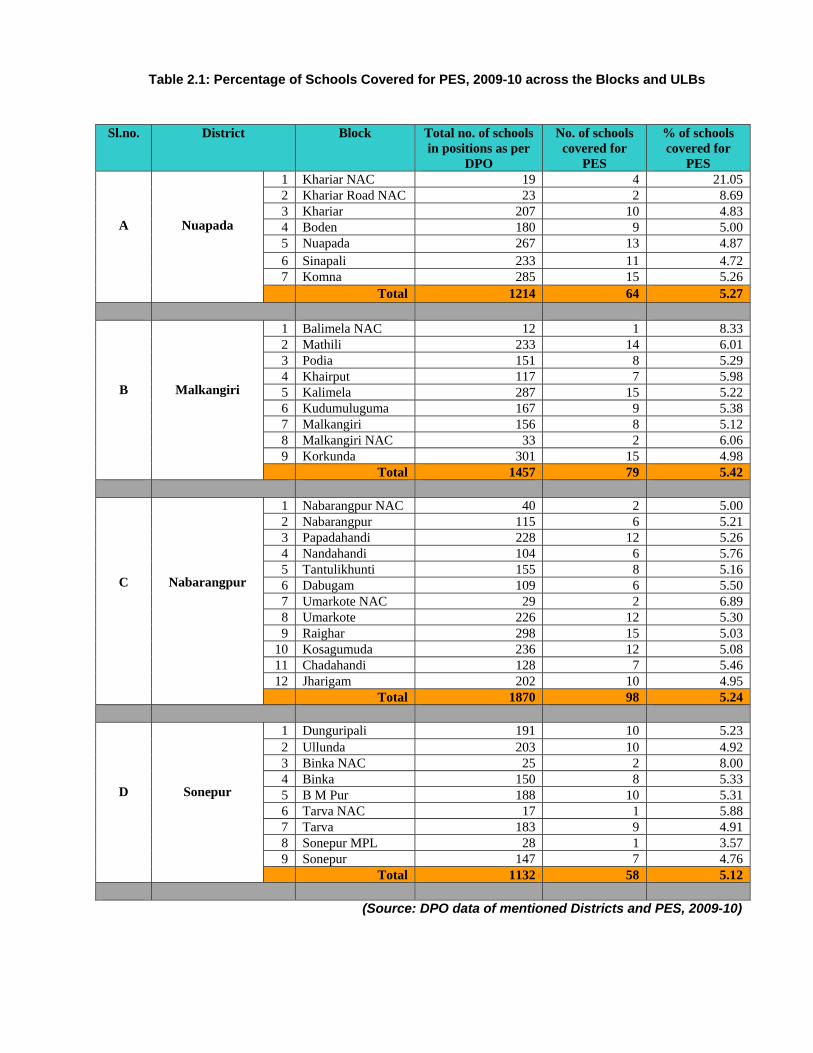
Table 2.1: Percentage of Schools Covered for PES, 2009-10 across the Blocks and ULBs
Sl.no. District Block Total no. of schools in positions as per
DPO
No. of schools covered for
PES
% of schools covered for
PES
A
Nuapada
1 Khariar NAC 19 4 21.05 2 Khariar Road NAC 23 2 8.69 3 Khariar 207 10 4.83 4 Boden 180 9 5.00 5 Nuapada 267 13 4.87 6 Sinapali 233 11 4.72 7 Komna 285 15 5.26 Total 1214 64 5.27
B
Malkangiri
1 Balimela NAC 12 1 8.33 2 Mathili 233 14 6.01 3 Podia 151 8 5.29 4 Khairput 117 7 5.98 5 Kalimela 287 15 5.22 6 Kudumuluguma 167 9 5.38 7 Malkangiri 156 8 5.12 8 Malkangiri NAC 33 2 6.06 9 Korkunda 301 15 4.98 Total 1457 79 5.42
C
Nabarangpur
1 Nabarangpur NAC 40 2 5.00 2 Nabarangpur 115 6 5.21 3 Papadahandi 228 12 5.26 4 Nandahandi 104 6 5.76 5 Tantulikhunti 155 8 5.16 6 Dabugam 109 6 5.50 7 Umarkote NAC 29 2 6.89 8 Umarkote 226 12 5.30 9 Raighar 298 15 5.03
10 Kosagumuda 236 12 5.08 11 Chadahandi 128 7 5.46 12 Jharigam 202 10 4.95 Total 1870 98 5.24
D
Sonepur
1 Dunguripali 191 10 5.23 2 Ullunda 203 10 4.92 3 Binka NAC 25 2 8.00 4 Binka 150 8 5.33 5 B M Pur 188 10 5.31 6 Tarva NAC 17 1 5.88 7 Tarva 183 9 4.91 8 Sonepur MPL 28 1 3.57 9 Sonepur 147 7 4.76 Total 1132 58 5.12
(Source: DPO data of mentioned Districts and PES, 2009-10)
Sl.no. District Block Total no. of schools in positions as per
DPO
No. of schools covered for
PES
% of schools covered for
PES
E
Khordha
1 Balianta 156 8 5.12 2 Balipatna 176 9 5.11 3 Bhubaneshwar 172 9 5.23 4 Balugaon NAC 20 1 5.00 5 Chilika 121 6 4.96 6 Banpur NAC 21 1 4.76 7 Banpur 159 8 5.03 8 Tangi 172 9 5.23 9 Bolgarh 195 10 5.12
10 Jatni MPL 42 2 4.76 11 Jatni 122 6 4.91 12 Begunia 190 10 5.26 13 Khordha MPL 52 3 5.76 14 Khordha 178 9 5.05 15 Bhubaneshwar MC 458 26 5.67
Total 2234 117 5.23
F
Dhenkanal
1 Hindol 277 14 5.05 2 Odapada 190 10 5.26 3 Gondia 234 12 5.12 4 Dhenkanal MPL 56 3 5.35 5 Dhenkanal Sadar 232 12 5.17 6 Bhuban NAC 19 1 5.26 7 Bhuban 163 8 4.90 8 Kamakhyanagar NAC 21 1 4.76 9 Kamakhyanagar 184 10 5.43
10 Kankadrahad 234 12 5.12 11 Parjang 204 11 5.39
Total 1814 94 5.18
(Source: DPO data of mentioned Districts and PES, 2009-10)
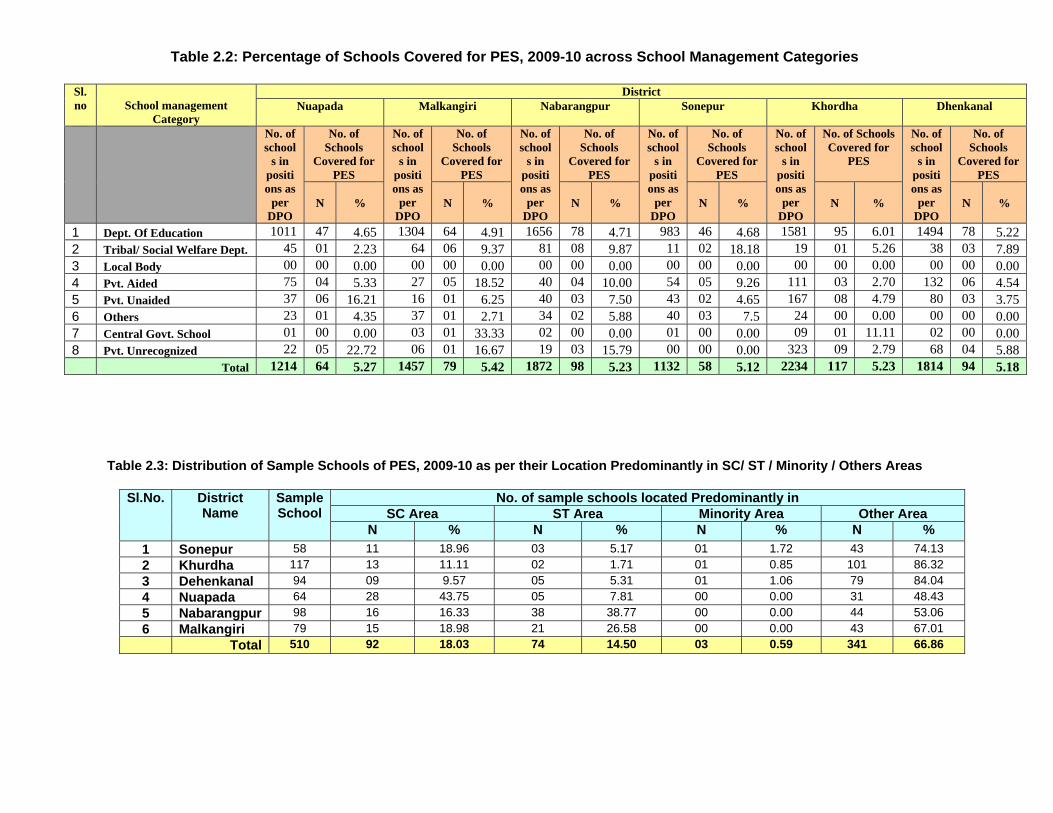
Table 2.2: Percentage of Schools Covered for PES, 2009-10 across School Management Categories
Table 2.3: Distribution of Sample Schools of PES, 2009-10 as per their Location Predominantly in SC/ ST / Minority / Others Areas
Sl.No. District Name
Sample School
No. of sample schools located Predominantly in SC Area ST Area Minority Area Other Area
N % N % N % N % 1 Sonepur 58 11 18.96 03 5.17 01 1.72 43 74.13 2 Khurdha 117 13 11.11 02 1.71 01 0.85 101 86.32 3 Dehenkanal 94 09 9.57 05 5.31 01 1.06 79 84.04 4 Nuapada 64 28 43.75 05 7.81 00 0.00 31 48.43 5 Nabarangpur 98 16 16.33 38 38.77 00 0.00 44 53.06 6 Malkangiri 79 15 18.98 21 26.58 00 0.00 43 67.01 Total 510 92 18.03 74 14.50 03 0.59 341 66.86
Sl.no
School management
Category
District Nuapada Malkangiri Nabarangpur Sonepur Khordha Dhenkanal
No. of school
s in positions as
per DPO
No. of Schools
Covered for PES
No. of school
s in positions as
per DPO
No. of Schools
Covered for PES
No. of school
s in positions as
per DPO
No. of Schools
Covered for PES
No. of school
s in positions as
per DPO
No. of Schools
Covered for PES
No. of school
s in positions as
per DPO
No. of Schools Covered for
PES
No. of school
s in positions as
per DPO
No. of Schools
Covered for PES
N
%
N
%
N
%
N
%
N
%
N
%
1 Dept. Of Education 1011 47 4.65 1304 64 4.91 1656 78 4.71 983 46 4.68 1581 95 6.01 1494 78 5.22 2 Tribal/ Social Welfare Dept. 45 01 2.23 64 06 9.37 81 08 9.87 11 02 18.18 19 01 5.26 38 03 7.89 3 Local Body 00 00 0.00 00 00 0.00 00 00 0.00 00 00 0.00 00 00 0.00 00 00 0.00 4 Pvt. Aided 75 04 5.33 27 05 18.52 40 04 10.00 54 05 9.26 111 03 2.70 132 06 4.54 5 Pvt. Unaided 37 06 16.21 16 01 6.25 40 03 7.50 43 02 4.65 167 08 4.79 80 03 3.75 6 Others 23 01 4.35 37 01 2.71 34 02 5.88 40 03 7.5 24 00 0.00 00 00 0.00 7 Central Govt. School 01 00 0.00 03 01 33.33 02 00 0.00 01 00 0.00 09 01 11.11 02 00 0.00 8 Pvt. Unrecognized 22 05 22.72 06 01 16.67 19 03 15.79 00 00 0.00 323 09 2.79 68 04 5.88 Total 1214 64 5.27 1457 79 5.42 1872 98 5.23 1132 58 5.12 2234 117 5.23 1814 94 5.18

2.4 Data Analysis and Presentation
A comparative analysis of DISE and PES were done on specific comparable indicators.
After data collection, scrutiny of both the sets of formats, already filled up DISE formats
and special DCF, were subjected to comparison by using simple deviation method. The
school-wise and category-wise data were analyzed by using the simple deviation analysis
tools in reference to all the comparable items of the survey. The overall deviation of data
has been calculated as per following formula.
d1+d2+d3+d4+d5+d6+………………. +dx ---------------------------------------------------- X 100 a+b+c+d+e+………………+X
Where d1, d2, d3, ….. stands for deviation of items of DISE data from
Post Enumeration Survey data ignoring + or – signs and a, b, c, …. denote
items of Post Enumeration Survey data.
Based on the above cited formula, information pertaining to 510 schools, where
commonality of data exists, is presented variable wise providing actual data obtained
through PES and DISE and deviation observed there of.
2.5 Limitation of the Study
Though the study is carefully drawn keeping in view all the parameters of the study yet
the study confronted the following limitations.
• Difference in Formats for post enumeration survey and DISE Data.
• Coverage of all types of school Managements
• Unfilled columns in prescribed formats of DISE data.
National University of Educational Planning and Administration, Government of India
designed the format of DCF and is used for collecting the DISE data. The format is too
lengthy and most of the items were self-explanatory. It is noticed that there is no point
of collecting data on certain items again and again which were already available with
concerned department. Some of the information is not available in the school instantly,
for which they have to search the old records. Difference in formats for post enumeration
survey with additions and with expanded items was made difficult as a result comparison

could not be under taken. Some of the DISE formats were not filled properly, particularly
important items like type of management, number of blocks, class rooms, computer
facility etc. Consequently, these aspects were kept outside the purview of this survey
report presentation.
2.6 Chapterisation
Report is formatted in five chapters. Chapter I consists of general introduction pertaining
to the importance of education, role of MIS for effective discharge of programme
activities and the mandate of the report etc. Chapter II consists of methodology followed
for the study with the description of study area. This chapter also depicts the limitations
the study experienced and the reasons there of. Chapter III consists of comparative data
between the outcome of PES and DISE data in reference to various variables where
commonality exists. Chapter IV contains information on data analysed pertaining to
additional data collected through PES survey format and information on which data is not
available through DISE format. The final chapter, Chapter V, consists of summary of
report and suggestive measures/recommendations derived through the survey for
effective course of action in future for improvement of DISE under SSA.

Chapter – 3
Comparative Analysis on DISE Data and PES Data
As cited elsewhere in the report, the principal mandate of the report is to establish the
accuracy of DISE survey in respect of various components of SSA in Orissa. However, the
Data Collection Formats (DCF) used for PES survey consists of additional information
than the Data Collection Formats (DCF) through which data were collected for DISE
survey. However, given the mandate of the study and the methodology followed, each
and every category of schools was covered under PES survey. As a result, 510 schools
were selected randomly for the study and survey was carried out through trained and
qualified research investigators. The data of 510 schools were compared with PES data
and conclusions were arrived. Further, as the PES data format has additional information
than DISE survey data, the additional components were also presented separately and
for the purpose of comparison only common variables were taken up.
During the Post Enumeration Survey (PES) in 2009-10, data relating to the preparedness
to DISE activity, to the use of DISE data and to some aspects of schools have been
collected in the data capturing schedules/formats prescribed especially for the PES. This
chapter contains a comparative analysis of common variables existing between PES and
DISE survey data among the common schools covered and verifiable data generated
through these tools.
As the report aimed at comparing the data collects through DISE DCF the common
variables where deviations were established is furnished below:
School Management
Year of Establishment
Location of Schools
Type of Schools
Category of Schools
Lowest Class in Schools
Highest Class in Schools
Management of Schools
Medium of Transaction

Students Participation
Children’s Enrolment in 2009-10
Enrolment of SC children
Enrolment of ST children
Enrolment of disabled children
Status of Repeaters
Examination Results 2008-09
School Infrastructure
Status of Teachers In-position
Type of school building
Status of number of Classrooms
Source of Drinking Water in Schools
The inadequacy, up-to-date, reliable and comprehensive data about the state of school
education, especially the primary education, render it difficult for the Planners, Policy and
Decision Makers to identify appropriate measures and action on how to improve the
quality of education and make it more accessible and available to the people. The Post
Enumeration Survey envisioned assessing the quality check, verifying the accuracy,
consistency of data and actual coverage of schools.
The deviation on School code, District code, Village name /Ward number and Block name
between the PES data and DISE data are not compared because these are made fixed for
each school as communicated by OPEPA. Similarly the Block, MPL/ NAC name, School
name, Rural/ Urban parameters are fixed as per School Master List. Thus no further
investigation is required to find out any deviation during DISE survey and PES survey.
The item viz. type of school building in PES has no corresponding similarity in the DISE
format. So, the data obtained on this item are not comparable. For each indicator of
comparable variables as cited above, the item wise and sub-item-wise comparison of PES
data with DISE data along with calculation of deviation ignoring positive and negative
signs is presented. Further the precision level for each indicator and overall precision is
calculated and presented in tables 3.1 to 3.26.
The overall deviation of DISE data from PES data, in respect of all comparable items, is
1.57%, which is within the range of permissible percentage of deviation i.e. 10%, and
there by giving a precision level of 98.43% for DISE data in relation to PES data (Table
3.1).

The comparison of DISE and PES data 2009-10 in school particulars reflects, that the
DISE data differ from PES data in
4.12 percent schools in case of year of establishment,
2.54 percent schools in case of school category,
3.33 percent in type of school,
1.18 percent on lowest class,
5.09 percent on highest class,
3.72 percent on ‘school management’ and
0.98 percent on medium of transaction
The percentage deviation of DISE data from PES data in respect of quantitative item is
4.33 percent on Teachers in position,
3.14 percent on status of school building,
4.08 percent on number of classrooms,
0.59 percent on children enrollment,
1.31 percent on SC children enrollment,
0.86 percent on ST children enrollment,
2.77 percent on number of repeaters,
16.03 percent on enrollment of children with disabilities,
3.12 percent on last year annual examination results and
1.57 percent on Source of drinking water.
3.1 Percentage Deviation and Percentage Precision of DISE data vis-à-vis PES data on
Comparable items It is highly required to identify the items of DISE DCF in which more number of Head
Teachers make mistakes in data filling. Accordingly, policy measures should be taken, on
priority, to check the repetition of such mistakes next year. In this section the findings of
the extent of deviation of DISE data from PES data on comparable items have been
delineated. The comparable items include: (1) year of establishment, (2) school
category, (3) type of school (4) lowest class, (5) highest class, (6) managed by, (7)
medium of transaction (8) teachers in position, (9) status of school building , (10)
number of class rooms, (11) children enrollment, (12) SC children enrollment, (13) ST
children enrollment, (14) repeater children enrollment (15) enrollment of children with
disabilities (16) examination results and (17) Source of drinking water and the analysis
has been made in two ways. The first way of analysis has been made on the percentage
of schools showing variation between DISE data and PES data. This analysis has been
made on 07 school particulars (from 1 to 7 above mentioned items) for each District and

at the aggregate level. The second way of analysis has been made on the percentage of
deviation of DISE data from PES data. This analysis has been made on 10 selected
comparable items (from 8 to 17 above mentioned items).
The findings of comparison between DISE and PES data in Sonepur District reflects that
the percentage of school showing difference is 3.69 percent at aggregate level (Table
3.3). It varies from 0.00 to 6.89 percent on 07 school characteristics. Analysis made on
10 comparable items shows that the deviation is in the range of 0.47 to 5.44 percent
excepting the enrollment of children with disabilities (10.84%). The percentage precision
between PES and DISE survey at aggregate level is found to be 1.79 percent with 98.21
percent of precision. (Table 3.4)
In Khurdha District, the comparison of DISE data with PES data on 07 school
characteristics indicates that the percentage of school showing difference varies from
0.00 to 6.83 per cent with 2.93 percent at aggregate level (Table 3.5). Analysis made on
percentage deviation on 10 selected comparable items indicates that the percentage
deviation ranges from 0.72 to 6.08 percent except in case of enrollment of children with
disabilities (16.07 %). At aggregate level, the percentage deviation is found to be 1.28
percent with 98.72 per cent of precision. (Table 3.6)
In Dhenkanal District, it is revealed from the Table 3.7 that the percentage of school
showing difference between PES and DISE data varies from 0.00 to 6.38 percent in case
of 07 school characteristics. With regard to 10 selected comparable items, it is reflects
that the percentage deviation between DISE and PES data ranges from 0.00 to 4.26
percent except in case of enrollment of children with disabilities (26.41%). At the
aggregate level, the percentage deviation is found to be 0.96 percent with 99.04 percent
precision. (Table 3.8)
In case of Nuapada District, the comparison of DISE data with PES data on 07 school
characteristics indicates that the percentage of school showing difference varies from
1.56 to 7.81 percent with 4.46 percent at aggregate level (Table 3.9). Analysis made on
percentage deviation on 10 selected comparable items indicates that the percentage
deviation ranges from 0.37 to 7.94 percent except in case of enrollment of children with
disabilities (11.22 %). At aggregate level, the percentage deviation is found to be 2.19
percent with 97.81 percent of precision (Table 3.10).
In Nabrangpur District, it is revealed from the Table 3.11 that the percentage of school
showing difference between PES and DISE data varies from 0.00 to 4.08 percent with
1.60 percent at aggregate level in case of 07 school characteristics. With regard to 10
selected comparable items, it is seen that the percentage deviation between DISE and
PES data ranges from 0.37 to 4.81 percent except in case of enrollment of children with

disabilities (7.93%). At the aggregate level, the percentage deviation is found to be 1.45
percent with 98.55 percent precision (Table 3.12).
In Malkangiri District, the comparison of DISE data with PES data on 07 school
characteristics indicates that the percentage of school showing difference varies from
1.26 to 5.06 percent with 3.43 percent at aggregate level (Table 3.13). Analysis made on
percentage deviation on 10 selected comparable items indicates that the percentage
deviation ranges from 0.37 to 6.01 percent except in case of enrollment of children with
disabilities (21.12 %). At aggregate level, the percentage deviation is found to be 2.07
percent with 97.93 percent of precision (Table 3.14).
Analysis made on 07 school characteristics between the DISE and PES data taking all the
06 sample Districts together shows (Table 3.15) that the percentage of school showing
difference varies from 0.98 to 5.09 percent with 2.99 percent at aggregate level. The
analysis made on 10 comparable items indicates that the percentage deviation of DISE
data from PES data ranges from 0.59 to 4.33 percent except in case of enrollment of
children with disabilities (16.03%). The overall deviation on these selected comparable
items is limited to 1.54 per cent with 98.46 per cent precision (Table 3.16).
3.1.1 Year of Establishment: The Head Teachers have in 21 (4.12%) out of 510 schools made wrong/ no entry of the
data relating to year of establishment of school in the DISE format. This has happened
especially in some very old schools that do not have any authentic evidence regarding
the year of establishment. In some UGME schools the Head Teacher has mentioned the
year when the school got UGME status but not the year when the school was first
established. The District wise disaggregated data (Table 3.2) reflects that the wrong / no
entry of the year of establishment in the DISE format has occurred more in Nuapada
District (7.81 % schools) than in Sonepur District (5.17% schools), Khurdha District
(5.12% schools), Dhenkanal District (3.19% schools), Nabarangpur District (2.04%
schools), and Malkangiri District (2.53% schools).
3.1.2 School Category: As regard the data entry in the item of School Category is concerned, in 13 (2.54 %) out
of 510 schools, there is mismatch between DISE data and PES data (Table 3.2). In
Nabrangpur and Dhenkanal District, this mismatch has been very less, limited to only
1.02 percent and 1.06 percent schools. In Sonepur, Khurdha, Nuapada and Malkangiri
Districts, this mismatch has been marked in a little higher percentages viz. 3.4 percent,
2.56 percent, 4.69 percent and 3.79 percent respectively. This has occurred primarily

because of careless/ no data entry in DISE formats by the Head Teacher and
irresponsible cross-checking of the DISE formats by the concerned CRCCs and BRCCs.
3.1.3 Type of School: The data entry relating to type of school has been correctly done in both the PES and
DISE formats in all sample schools of Sonepur District. However, in Khurdha, Dhenkanal,
Nuapada, Nabranpur and Malkangiri Districts, the mismatch has been reported in 02
(1.71%) out of 117 schools, 04 (4.26%) out of 94 schools, 04 (6.25%) out of 64 schools,
03 (3.06%) out of 98 schools and 04 (5.06%) out of 79 schools respectively. This has
occurred again due to wrong entry of data in DISE format and improper cross-checking
of DISE data by the concerned CRCC, BRCC and the DI of schools.
3.1.4 Lowest Class: The mismatch between DISE data and PES data relating to the item ‘lowest class’ is
limited to only 06 (1.18%) out of 510 schools (Table 3.2). 0ut of the 06 sample Districts,
03 Districts namely Khurdha, Dhenkanal and Nabrangpur has been correctly done in both
the PES and DISE formats in all sample schools. From rest 03 Districts namely Sonepur,
Nuapada and Malkangiri, this mismatch has been reported from 02 schools. Again,
primarily due to careless data entry and superficial cross checking of the DISE format
such mismatch has occurred.
3.1.5 Highest Class: The Head Teachers have made more mistakes in entering data on highest class than the
lowest class taught in their schools while filling up of the DISE formats. Therefore, the
mismatch between DISE data and PES data on this item has been noticed in 26 (5.09 %)
out of the 510 schools covered under PES (Table 3.2). The District wise disaggregated
data indicate that in Khurdha District this mismatch is restricted to less (3.42 %) schools
than in Sonepur District (6.89% schools), Dhenkanal District (6.38% schools), Nuapada
District (4.69% schools), Nabarangpur District (4.08% schools), and Malkangiri District
(6.32% schools). The mismatch has occurred again because of careless data entry made
by the Head Teacher and improper cross-checking by CRCC, BRCC and DI of schools.
3.1.6 Managed by: The item ‘managed by’ indicates the category of management of school. In respect of
this item, the mismatch between DISE data and PES data has occurred in 19 (3.72%) out
of 510 schools (Table 3.2). In Sonepur and Khurdha Districts, this mismatch has been

reported from 03 (5.17 %) out of 58 schools and 08 (6.83%) out of 117 schools. This is
a little higher amongst that of Dhenkanal, Nuapada, Nabrangpur and Malkangiri Districts,
where the mismatch has been noticed only in 4.26 percent (04 out of 94 schools), 1.56
percent (01 out of 64 schools), 1.02 percent (01 out of 98 schools) and 2.53 percent (02
out of 79 schools) of schools respectively (Table 3.2). The main reasons of such
mismatch are: (i) no data entry against the item, (2) wrong data entry against the item
due to wrong understanding about different categories of management, and (3) careless
data entry.
3.1.7 Medium of Interaction: The mismatch between DISE data and PES data relating to the item ‘lowest class’ is
limited to only 05 (0.98%) out of 510 schools (Table 3.2). 0ut of the 06 sample Districts,
only 02 Districts namely Dhenkanal and Nabrangpur has been correctly done in both the
PES and DISE formats in all sample schools. From 03 Districts namely Sonepur, Khurdha,
and Malkangiri, this mismatch has been reported from 01 schools and it has been
reported in 02 schools from Nuapada District. Again, primarily due to careless data entry
and superficial cross checking of the DISE format such mismatch has occurred.
3.1.8 Teachers in Position: Table 3.17 points out that the deviation of DISE data in this item is only 4.33 per cent
from PES data. The District wise disaggregated data (Table 3.17) reflects that the wrong/
no entry of the year of establishment in the DISE format has occurred more in Khurdha
District (6.08% schools) than in Sonepur District (4.17% schools), Dhenkanal District
(3.88% schools), Nuapada District (2.65% schools), Nabarangpur District (3.89%
schools), and Malkangiri District (3.79% schools). This happened because of the incorrect
reporting of data by the Head Teacher of the concerned school.
3.1.9 Status of School Building: In this item, the deviation of DISE data from PES data has been 21, i.e. 3.14 percent
deviation (Table 3.18). The extent of deviation has been reported comparatively higher in
Nuapada District (7.81%) than in Sonepur District (3.45% schools), Khurdha District
(2.56% schools), Dhenkanal District (4.26% schools), Nabarangpur District (1.02%
schools), and Malkangiri District (1.27% schools).
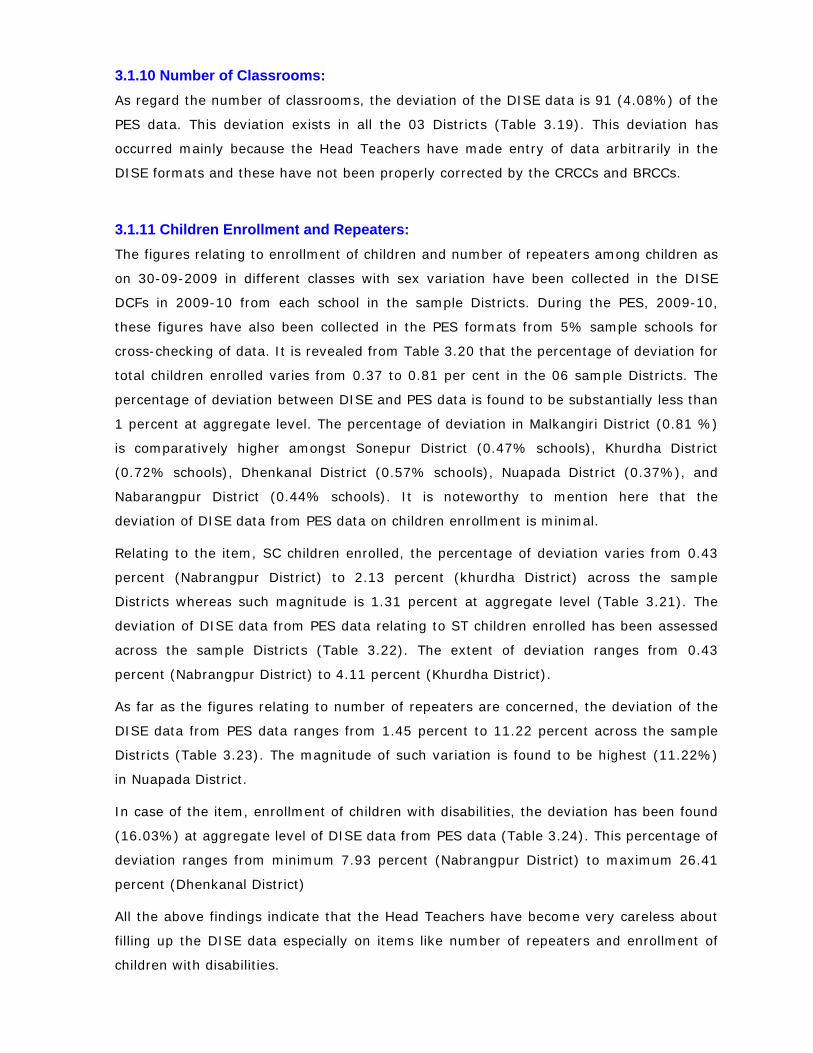
3.1.10 Number of Classrooms: As regard the number of classrooms, the deviation of the DISE data is 91 (4.08%) of the
PES data. This deviation exists in all the 03 Districts (Table 3.19). This deviation has
occurred mainly because the Head Teachers have made entry of data arbitrarily in the
DISE formats and these have not been properly corrected by the CRCCs and BRCCs.
3.1.11 Children Enrollment and Repeaters: The figures relating to enrollment of children and number of repeaters among children as
on 30-09-2009 in different classes with sex variation have been collected in the DISE
DCFs in 2009-10 from each school in the sample Districts. During the PES, 2009-10,
these figures have also been collected in the PES formats from 5% sample schools for
cross-checking of data. It is revealed from Table 3.20 that the percentage of deviation for
total children enrolled varies from 0.37 to 0.81 per cent in the 06 sample Districts. The
percentage of deviation between DISE and PES data is found to be substantially less than
1 percent at aggregate level. The percentage of deviation in Malkangiri District (0.81 %)
is comparatively higher amongst Sonepur District (0.47% schools), Khurdha District
(0.72% schools), Dhenkanal District (0.57% schools), Nuapada District (0.37%), and
Nabarangpur District (0.44% schools). It is noteworthy to mention here that the
deviation of DISE data from PES data on children enrollment is minimal.
Relating to the item, SC children enrolled, the percentage of deviation varies from 0.43
percent (Nabrangpur District) to 2.13 percent (khurdha District) across the sample
Districts whereas such magnitude is 1.31 percent at aggregate level (Table 3.21). The
deviation of DISE data from PES data relating to ST children enrolled has been assessed
across the sample Districts (Table 3.22). The extent of deviation ranges from 0.43
percent (Nabrangpur District) to 4.11 percent (Khurdha District).
As far as the figures relating to number of repeaters are concerned, the deviation of the
DISE data from PES data ranges from 1.45 percent to 11.22 percent across the sample
Districts (Table 3.23). The magnitude of such variation is found to be highest (11.22%)
in Nuapada District.
In case of the item, enrollment of children with disabilities, the deviation has been found
(16.03%) at aggregate level of DISE data from PES data (Table 3.24). This percentage of
deviation ranges from minimum 7.93 percent (Nabrangpur District) to maximum 26.41
percent (Dhenkanal District)
All the above findings indicate that the Head Teachers have become very careless about
filling up the DISE data especially on items like number of repeaters and enrollment of
children with disabilities.

3.1.12 Examination Results: During the PES 2009-10, data have been gathered relating to the 2008-09 Annual
Examination for different classes especially on 03 items, namely:(1) total enrollment at
the time of examination, (2) total children appeared ln the examination and (3) total
children passed in the examination. In the present study, these data have been
compared with the corresponding DISE data only to the children of Class V and Class VII
because in DISE format only these data have been collected. The findings have been
presented in Table (Table 3.25) which reveals that there exists deviation to the extent of
3.21, 2.93 and 2.93 per cent on children enrolled, appeared and passed respectively at
aggregate level between the DISE and PES data.
The District wise disaggregated data reveal that there exists deviation between DISE and
PES data in all the 06 sample Districts. Such deviations on children enrolled, appeared
and passed are found to be highest (6.01%) in Malkangiri District. Incorrect reporting of
data by the Head Teachers has contributed to such deviation.
Table 3.1: Overall percentage Deviation and precision of DISE data in respect of PES data on school particulars and quantitative items
Sl. No.
Description of Comparable items
Quantitative Value under Percentage
PES
DISE Deviation
ignoring ± with sub items
Deviation
Precision
1 Year of Establishment 510 510 21 4.12 95.88
2 School Category 510 510 13 2.54 97.46
3 Type of School 510 510 17 3.33 96.67
4 Lowest Class 510 510 06 1.18 98.83
5 Highest Class 510 510 26 5.09 94.91
6 Managed by 510 510 19 3.72 96.28
7 Medium of Transaction 510 510 05 0.98 99.02
8 Teachers in Position 2214 2166 96 4.33 95.67
9 Status of School Building 510 494 16 3.14 96.86
10 No. of Classrooms 2228 2319 91 4.08 95.92
11 Children Enrollment 82367 82163 488 0.59 99.41
12 SC Children Enrollment 20489 20516 269 1.31 98.69
13 ST Children Enrollment 19249 19414 165 0.86 99.14
14 No. of Repeaters 4178 4222 116 2.77 97.23
15 Enrollment of Children with Disabilities 424 418 68 16.03 83.97
16 Examination Results 2008-09 45615 45341 1416 3.12 96.88
17 Source of Drinking water 510 502 8 1.57 98.43
Total 181354 181125 2840 1.57 98.43

Table 3.2: Comparison of PES data with DISE data on School Particulars
Item of Comparison
Name of Districts
No. of sample schools
No. of Schools in which DISE data differed from
PES data
Percentage of School showing
difference
Year of Establishment
Sonepur 58 03 5.17 Khurdha 117 06 5.12 Dehenkanal 94 03 3.19 Nuapada 64 05 7.81 Nabarangpur 98 02 2.04 Malkangiri 79 02 2.53
Total 510 21 4.12
School Category
Sonepur 58 02 3.44 Khurdha 117 03 2.56 Dehenkanal 94 01 1.06 Nuapada 64 03 4.69 Nabarangpur 98 01 1.02 Malkangiri 79 03 3.79
Total 510 13 2.54
Type of School
Sonepur 58 00 0.00 Khurdha 117 02 1.71 Dehenkanal 94 04 4.26 Nuapada 64 04 6.25 Nabarangpur 98 03 3.06 Malkangiri 79 04 5.06
Total 510 17 3.33
Lowest class
Sonepur 58 02 3.44 Khurdha 117 00 0.00 Dehenkanal 94 00 0.00 Nuapada 64 02 3.12 Nabarangpur 98 00 0.00 Malkangiri 79 02 2.53
Total 510 06 1.18
Highest class
Sonepur 58 04 6.89 Khurdha 117 04 3.42 Dehenkanal 94 06 6.38 Nuapada 64 03 4.69 Nabarangpur 98 04 4.08 Malkangiri 79 05 6.32
Total 510 26 5.09
Managed by
Sonepur 58 03 5.17 Khurdha 117 08 6.83 Dehenkanal 94 04 4.26 Nuapada 64 01 1.56 Nabarangpur 98 01 1.02 Malkangiri 79 02 2.53
Total 510 19 3.72
Medium of Transaction
Sonepur 58 01 1.72 Khurdha 117 01 0.85 Dehenkanal 94 00 0.00 Nuapada 64 02 3.12 Nabarangpur 98 00 0.00 Malkangiri 79 01 1.26
Total 510 05 0.98
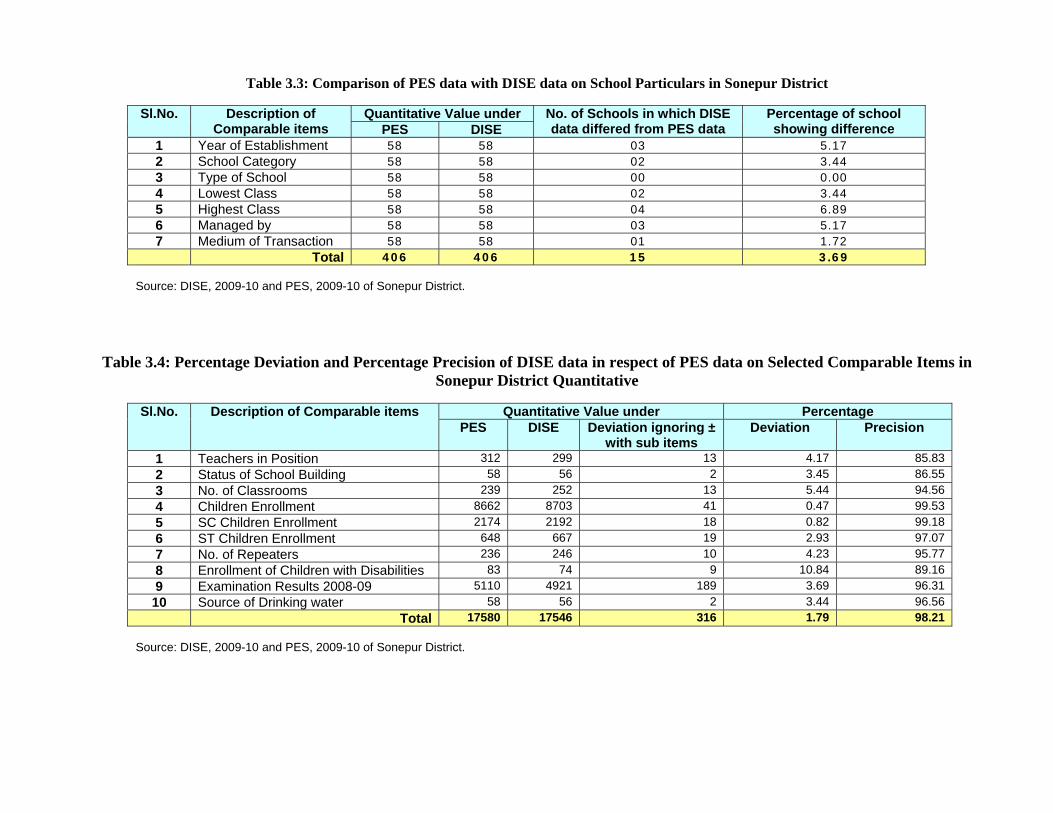
Table 3.3: Comparison of PES data with DISE data on School Particulars in Sonepur District
Sl.No. Description of Comparable items
Quantitative Value under No. of Schools in which DISE data differed from PES data
Percentage of school showing difference PES DISE
1 Year of Establishment 58 58 03 5.17 2 School Category 58 58 02 3.44 3 Type of School 58 58 00 0.00 4 Lowest Class 58 58 02 3.44 5 Highest Class 58 58 04 6.89 6 Managed by 58 58 03 5.17 7 Medium of Transaction 58 58 01 1.72 Total 406 406 15 3.69
Source: DISE, 2009-10 and PES, 2009-10 of Sonepur District.
Table 3.4: Percentage Deviation and Percentage Precision of DISE data in respect of PES data on Selected Comparable Items in
Sonepur District Quantitative
Sl.No. Description of Comparable items Quantitative Value under Percentage PES DISE Deviation ignoring ±
with sub items Deviation
Precision
1 Teachers in Position 312 299 13 4.17 85.83 2 Status of School Building 58 56 2 3.45 86.55 3 No. of Classrooms 239 252 13 5.44 94.56 4 Children Enrollment 8662 8703 41 0.47 99.53 5 SC Children Enrollment 2174 2192 18 0.82 99.18 6 ST Children Enrollment 648 667 19 2.93 97.07 7 No. of Repeaters 236 246 10 4.23 95.77 8 Enrollment of Children with Disabilities 83 74 9 10.84 89.16 9 Examination Results 2008-09 5110 4921 189 3.69 96.31 10 Source of Drinking water 58 56 2 3.44 96.56
Total 17580 17546 316 1.79 98.21 Source: DISE, 2009-10 and PES, 2009-10 of Sonepur District.
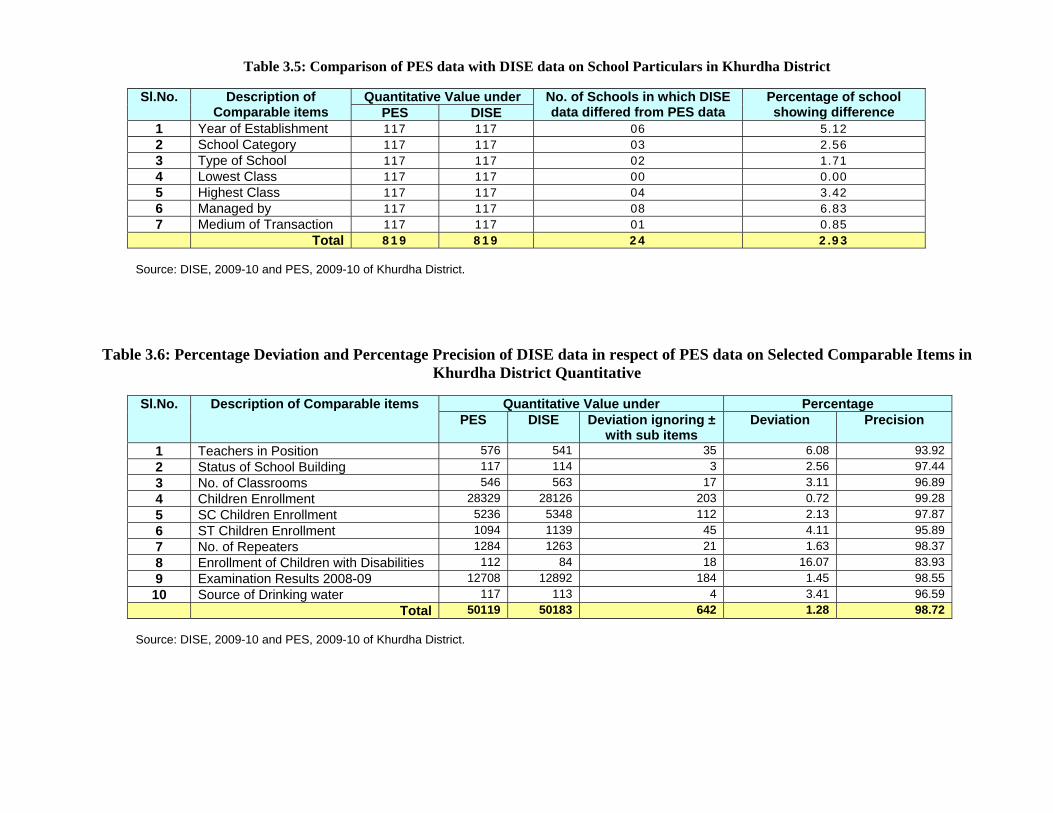
Table 3.5: Comparison of PES data with DISE data on School Particulars in Khurdha District
Sl.No. Description of Comparable items
Quantitative Value under No. of Schools in which DISE data differed from PES data
Percentage of school showing difference PES DISE
1 Year of Establishment 117 117 06 5.12 2 School Category 117 117 03 2.56 3 Type of School 117 117 02 1.71 4 Lowest Class 117 117 00 0.00 5 Highest Class 117 117 04 3.42 6 Managed by 117 117 08 6.83 7 Medium of Transaction 117 117 01 0.85 Total 819 819 24 2.93
Source: DISE, 2009-10 and PES, 2009-10 of Khurdha District.
Table 3.6: Percentage Deviation and Percentage Precision of DISE data in respect of PES data on Selected Comparable Items in Khurdha District Quantitative
Sl.No. Description of Comparable items Quantitative Value under Percentage
PES DISE Deviation ignoring ± with sub items
Deviation
Precision
1 Teachers in Position 576 541 35 6.08 93.92 2 Status of School Building 117 114 3 2.56 97.44 3 No. of Classrooms 546 563 17 3.11 96.89 4 Children Enrollment 28329 28126 203 0.72 99.28 5 SC Children Enrollment 5236 5348 112 2.13 97.87 6 ST Children Enrollment 1094 1139 45 4.11 95.89 7 No. of Repeaters 1284 1263 21 1.63 98.37 8 Enrollment of Children with Disabilities 112 84 18 16.07 83.93 9 Examination Results 2008-09 12708 12892 184 1.45 98.55 10 Source of Drinking water 117 113 4 3.41 96.59
Total 50119 50183 642 1.28 98.72 Source: DISE, 2009-10 and PES, 2009-10 of Khurdha District.

Table 3.7: Comparison of PES data with DISE data on School Particulars in Dhenkanal District
Sl.No. Description of Comparable items
Quantitative Value under No. of Schools in which DISE data differed from PES data
Percentage of school showing difference PES DISE
1 Year of Establishment 94 94 03 3.19 2 School Category 94 94 01 1.06 3 Type of School 94 94 04 4.26 4 Lowest Class 94 94 00 0.00 5 Highest Class 94 94 06 6.38 6 Managed by 94 94 04 4.26 7 Medium of Transaction 94 94 00 0.00 Total 658 658 18 2.73
Source: DISE, 2009-10 and PES, 2009-10 of Dhenkanal District.
Table 3.8: Percentage Deviation and Percentage Precision of DISE data in respect of PES data on Selected Comparable Items in
Dhenkanal District Quantitative
Sl.No. Description of Comparable items Quantitative Value under Percentage PES DISE Deviation ignoring ±
with sub items Deviation
Precision
1 Teachers in Position 309 297 12 3.88 96.12 2 Status of School Building 94 90 4 4.26 95.74 3 No. of Classrooms 382 393 11 2.88 97.12 4 Children Enrollment 12877 12803 74 0.57 99.43 5 SC Children Enrollment 2631 2602 29 1.10 98.90 6 ST Children Enrollment 2631 2662 31 1.17 98.83 7 No. of Repeaters 804 826 22 2.73 97.27 8 Enrollment of Children with Disabilities 53 67 14 26.41 73.59 9 Examination Results 2008-09 8299 8224 75 0.91 99.09 10 Source of Drinking water 94 94 0 0.00 100.00
Total 28174 28058 272 0.96 99.04 Source: DISE, 2009-10 and PES, 2009-10 of Dhenkanal District.
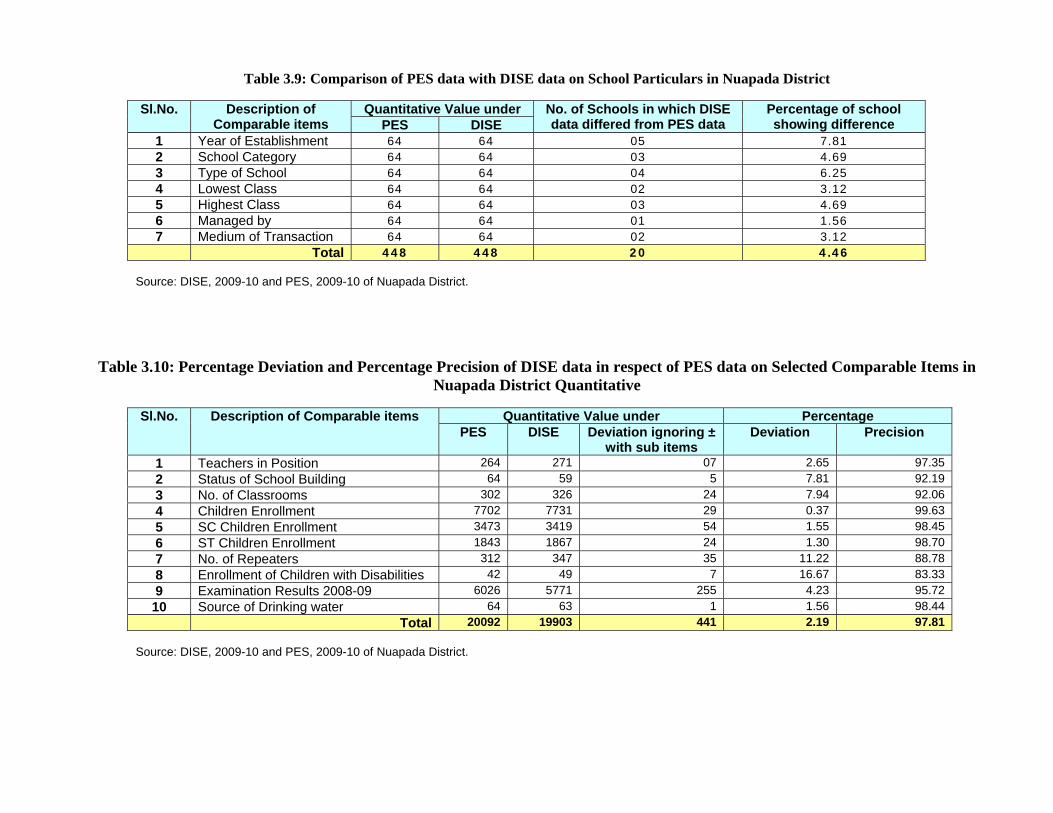
Table 3.9: Comparison of PES data with DISE data on School Particulars in Nuapada District
Sl.No. Description of Comparable items
Quantitative Value under No. of Schools in which DISE data differed from PES data
Percentage of school showing difference PES DISE
1 Year of Establishment 64 64 05 7.81 2 School Category 64 64 03 4.69 3 Type of School 64 64 04 6.25 4 Lowest Class 64 64 02 3.12 5 Highest Class 64 64 03 4.69 6 Managed by 64 64 01 1.56 7 Medium of Transaction 64 64 02 3.12 Total 448 448 20 4.46
Source: DISE, 2009-10 and PES, 2009-10 of Nuapada District.
Table 3.10: Percentage Deviation and Percentage Precision of DISE data in respect of PES data on Selected Comparable Items in Nuapada District Quantitative
Sl.No. Description of Comparable items Quantitative Value under Percentage
PES DISE Deviation ignoring ± with sub items
Deviation
Precision
1 Teachers in Position 264 271 07 2.65 97.35 2 Status of School Building 64 59 5 7.81 92.19 3 No. of Classrooms 302 326 24 7.94 92.06 4 Children Enrollment 7702 7731 29 0.37 99.63 5 SC Children Enrollment 3473 3419 54 1.55 98.45 6 ST Children Enrollment 1843 1867 24 1.30 98.70 7 No. of Repeaters 312 347 35 11.22 88.78 8 Enrollment of Children with Disabilities 42 49 7 16.67 83.33 9 Examination Results 2008-09 6026 5771 255 4.23 95.72 10 Source of Drinking water 64 63 1 1.56 98.44
Total 20092 19903 441 2.19 97.81 Source: DISE, 2009-10 and PES, 2009-10 of Nuapada District.

Table 3.11: Comparison of PES data with DISE data on School Particulars in Nabarangpur District
Sl.No. Description of
Comparable items Quantitative Value under No. of Schools in which DISE
data differed from PES data Percentage of school showing difference PES DISE
1 Year of Establishment 98 98 02 2.04 2 School Category 98 98 01 1.02 3 Type of School 98 98 03 3.06 4 Lowest Class 98 98 00 0.00 5 Highest Class 98 98 04 4.08 6 Managed by 98 98 01 1.02 7 Medium of Transaction 98 98 00 0.00 Total 686 686 11 1.60
Source: DISE, 2009-10 and PES, 2009-10 of Nabrangpur District.
Table 3.12: Percentage Deviation and Percentage Precision of DISE data in respect of PES data on Selected Comparable Items in Nabrangpur District Quantitative
Sl.No. Description of Comparable items Quantitative Value under Percentage
PES DISE Deviation ignoring ± with sub items
Deviation
Precision
1 Teachers in Position 437 454 17 3.89 96.11 2 Status of School Building 98 97 1 1.02 98.98 3 No. of Classrooms 423 437 14 3.31 96.69 4 Children Enrollment 16374 16446 72 0.44 99.56 5 SC Children Enrollment 4139 4157 18 0.43 99.57 6 ST Children Enrollment 8139 8167 28 0.34 99.66 7 No. of Repeaters 643 628 15 2.33 97.67 8 Enrollment of Children with Disabilities 63 58 5 7.93 92.07 9 Examination Results 2008-09 8046 8433 387 4.81 95.19 10 Source of Drinking water 98 98 0 0.00 100.00
Total 38460 38975 557 1.45 98.55 Source: DISE, 2009-10 and PES, 2009-10 of Nabrangpur District.

Table 3.13: Comparison of PES data with DISE data on School Particulars in Malkangiri District
Sl.No. Description of
Comparable items Quantitative Value under No. of Schools in which DISE
data differed from PES data Percentage of school showing difference PES DISE
1 Year of Establishment 79 79 02 2.53 2 School Category 79 79 03 3.79 3 Type of School 79 79 04 5.06 4 Lowest Class 79 79 02 2.53 5 Highest Class 79 79 05 6.32 6 Managed by 79 79 02 2.53 7 Medium of Transaction 79 79 01 1.26 Total 553 553 19 3.43
Source: DISE, 2009-10 and PES, 2009-10 of Malkangiri District.
Table 3.14: Percentage Deviation and Percentage Precision of DISE data in respect of PES data on Selected Comparable Items in
Malkangiri District Quantitative
Sl.No. Description of Comparable items Quantitative Value under Percentage PES DISE Deviation ignoring ±
with sub items Deviation
Precision
1 Teachers in Position 316 304 12 3.79 96.21 2 Status of School Building 79 78 1 1.27 98.73 3 No. of Classrooms 336 348 12 3.57 96.43 4 Children Enrollment 8423 8354 69 0.81 99.19 5 SC Children Enrollment 3836 3798 38 0.98 99.02 6 ST Children Enrollment 4894 4912 18 0.37 99.63 7 No. of Repeaters 899 912 13 1.45 98.55 8 Enrollment of Children with Disabilities 71 86 15 21.12 78.88 9 Examination Results 2008-09 5426 5100 326 6.01 93.99 10 Source of Drinking water 79 78 1 1.26 98.74
Total 24359 23970 505 2.07 97.93 Source: DISE, 2009-10 and PES, 2009-10 of Malkangiri District.
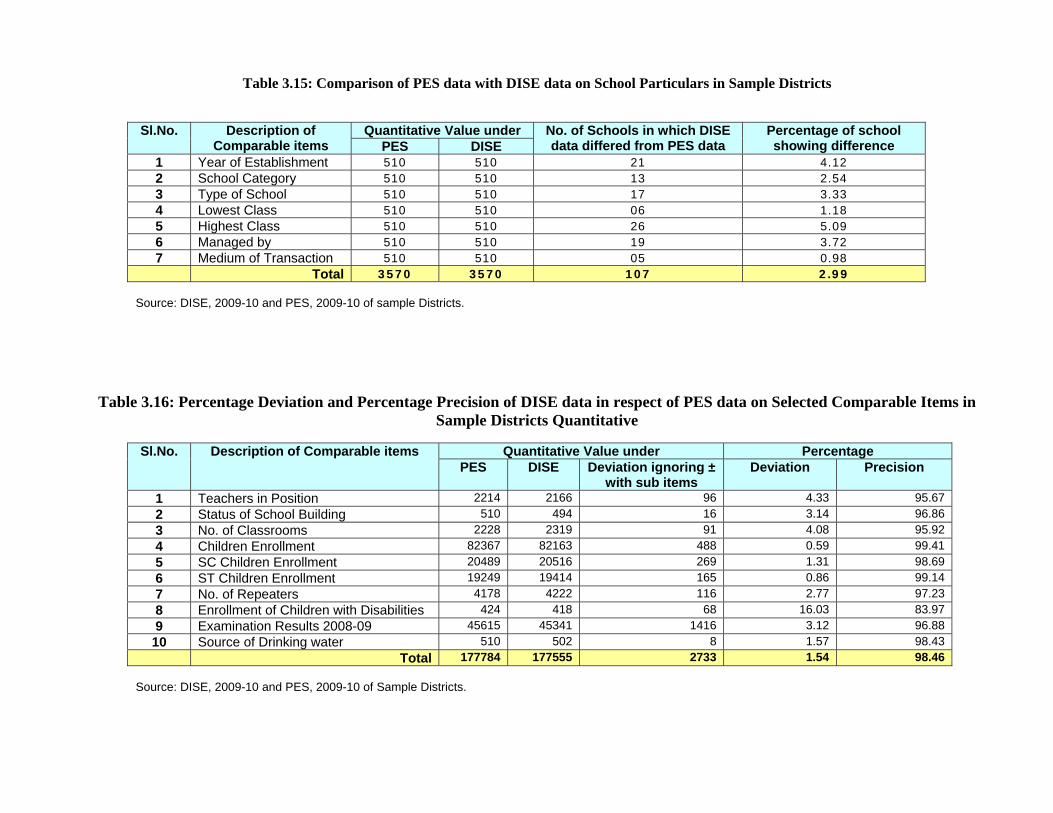
Table 3.15: Comparison of PES data with DISE data on School Particulars in Sample Districts
Sl.No. Description of
Comparable items Quantitative Value under No. of Schools in which DISE
data differed from PES data Percentage of school showing difference PES DISE
1 Year of Establishment 510 510 21 4.12 2 School Category 510 510 13 2.54 3 Type of School 510 510 17 3.33 4 Lowest Class 510 510 06 1.18 5 Highest Class 510 510 26 5.09 6 Managed by 510 510 19 3.72 7 Medium of Transaction 510 510 05 0.98 Total 3570 3570 107 2.99
Source: DISE, 2009-10 and PES, 2009-10 of sample Districts.
Table 3.16: Percentage Deviation and Percentage Precision of DISE data in respect of PES data on Selected Comparable Items in Sample Districts Quantitative
Sl.No. Description of Comparable items Quantitative Value under Percentage
PES DISE Deviation ignoring ± with sub items
Deviation
Precision
1 Teachers in Position 2214 2166 96 4.33 95.67 2 Status of School Building 510 494 16 3.14 96.86 3 No. of Classrooms 2228 2319 91 4.08 95.92 4 Children Enrollment 82367 82163 488 0.59 99.41 5 SC Children Enrollment 20489 20516 269 1.31 98.69 6 ST Children Enrollment 19249 19414 165 0.86 99.14 7 No. of Repeaters 4178 4222 116 2.77 97.23 8 Enrollment of Children with Disabilities 424 418 68 16.03 83.97 9 Examination Results 2008-09 45615 45341 1416 3.12 96.88 10 Source of Drinking water 510 502 8 1.57 98.43
Total 177784 177555 2733 1.54 98.46 Source: DISE, 2009-10 and PES, 2009-10 of Sample Districts.

Table 3.17: Comparison of PES data with DISE data on Teachers in Position
Sl.No. District Name Sample School
Teacher in position Male Female Total
PES DISE Deviation % PES DISE Deviation % PES DISE Deviation % 1 Sonepur 58 196 189 07 3.57 116 110 06 5.17 312 299 13 4.17 2 Khurdha 117 318 302 16 5.03 258 239 19 7.36 576 541 35 6.08 3 Dehenkanal 94 188 172 16 8.51 121 125 05 4.13 309 297 12 3.88 4 Nuapada 64 152 164 12 7.89 112 107 05 4.46 264 271 07 2.65 5 Nabarangpur 98 231 246 15 6.49 206 208 02 0.97 437 454 17 3.89 6 Malkangiri 79 217 201 16 7.37 99 103 04 4.04 316 304 12 3.79 Total 510 1302 1274 28 2.15 912 892 20 2.19 2214 2166 96 4.33
Source: DISE, 2009-10 and PES, 2009-10 of Dhenkanal, Khordha, Malkangiri, Nuapada, Nabarangapur, and Sonepur Districts. Note: i) Quantitative value of items as per DISE data = 2166
ii) Quantitative value of items as per PES data = 2214 iii) Quantitative value of deviations ignoring ± signs = 96 iv) %age deviation of DISE data from PES data = 4.33% v) Precision level of DISE data with relation to PES data = 95.67%
Table 3.18: Comparison of PES data with DISE data on Status of School Building
Sl.No. District Name Sample School
Status of School Building Private Rented Government Total
PES
DIS
E
Dev
iatio
n
%
PES
DIS
E
Dev
iatio
n
%
PES
DIS
E
Dev
iatio
n
%
PES
DIS
E
Dev
iatio
n
%
1 Sonepur 58 8 5 3 37.50 3 2 1 33.33 47 49 2 4.25 58 56 2 3.45 2 Khurdha 117 13 12 1 7.69 9 10 1 11.11 95 92 3 3.15 117 114 3 2.56 3 Dehenkanal 94 10 9 1 10.00 2 1 1 50.00 82 80 2 2.44 94 90 4 4.26 4 Nuapada 64 12 10 2 16.67 3 1 2 66.67 49 48 1 2.04 64 59 5 7.81 5 Nabarangpur 98 8 7 1 12.50 2 4 2 100 88 86 2 2.27 98 97 1 1.02 6 Malkangiri 79 1 2 1 100 2 1 1 50.00 76 72 4 5.26 79 78 1 1.27 Total 510 52 45 7 13.46 21 19 2 9.52 437 427 10 2.29 510 494 16 3.14
Source: DISE, 2009-10 and PES, 2009-10 of Dhenkanal, Khurdha, Malkangiri, Nuapada, Nabarangpur, and Sonepur Districts. Note: i) Quantitative value of items as per DISE data = 494
ii) Quantitative value of items as per PES data = 510 iii) Quantitative value of deviations ignoring ± signs = 16 iv) %age deviation of DISE data from PES data = 3.14% v) Precision level of DISE data with relation to PES data = 96.86%

Table 3.19: Comparison of PES data with DISE data on Number of Classrooms
Sl.No. District Name Sample School No. of Classrooms PES DISE Deviation %
1 Sonepur 58 239 252 13 5.44
2 Khurdha 117 546 563 17 3.11
3 Dehenkanal 94 382 393 11 2.88
4 Nuapada 64 302 326 24 7.94
5 Nabarangpur 98 423 437 14 3.31
6 Malkangiri 79 336 348 12 3.57
Total 510 2228 2319 91 4.08
Source: DISE, 2009-10 and PES, 2009-10 of Dhenkanal, Khurdha, Malkangiri, Nuapada, Nabarangpur, and Sonepur Districts. Note: i) Quantitative value of items as per DISE data = 2319
ii) Quantitative value of items as per PES data = 2228 iii) Quantitative value of deviations ignoring ± signs = 91 iv) %age deviation of DISE data from PES data = 4.08% v) Precision level of DISE data with relation to PES data = 95.92%
Table 3.20: Comparison of PES data with DISE data on Children Enrollment
Sl.No. District Name Sample School Total Enrollment
PES DISE Deviation % 1 Sonepur 58 8662 8703 41 0.47
2 Khurdha 117 28329 28126 203 0.72
3 Dehenkanal 94 12877 12803 74 0.57
4 Nuapada 64 7702 7731 29 0.37
5 Nabarangpur 98 16374 16446 72 0.44
6 Malkangiri 79 8423 8354 69 0.81
Total 510 82367 82163 488 0.59
Source: DISE, 2009-10 and PES, 2009-10 of Dhenkanal, Khurdha, Malkangiri, Nuapada, Nabarangpur, and Sonepur Districts. Note: i) Quantitative value of items as per DISE data = 82163
ii) Quantitative value of items as per PES data = 82367 iii) Quantitative value of deviations ignoring ± signs = 488 iv) %age deviation of DISE data from PES data = 0.59% v) Precision level of DISE data with relation to PES data = 99.41%

Table 3.21: Comparison of PES data with DISE data on SC Children Enrollment
Sl.No. District Name Sample School SC Enrollment PES DISE Deviation %
1 Sonepur 58 2174 2192 18 0.82
2 Khurdha 117 5236 5348 112 2.13
3 Dehenkanal 94 2631 2602 29 1.10
4 Nuapada 64 3473 3419 54 1.55
5 Nabarangpur 98 4139 4157 18 0.43
6 Malkangiri 79 3836 3798 38 0.98
Total 510 20489 20516 269 1.31
Source: DISE, 2009-10 and PES, 2009-10 of Dhenkanal, Khurdha, Malkangiri, Nuapada, Nabarangpur, and Sonepur Districts. Note: i) Quantitative value of items as per DISE data = 20518
ii) Quantitative value of items as per PES data = 20489 iii) Quantitative value of deviations ignoring ± signs = 269 iv) %age deviation of DISE data from PES data = 1.31% v) Precision level of DISE data with relation to PES data = 98.69%
Table 3.22: Comparison of PES data with DISE data on ST Children Enrollment
Sl.No. District Name Sample School ST Enrollment PES DISE Deviation %
1 Sonepur 58 648 667 19 2.93
2 Khurdha 117 1094 1139 45 4.11
3 Dehenkanal 94 2631 2662 31 1.17
4 Nuapada 64 1843 1867 24 1.30
5 Nabarangpur 98 8139 8167 28 0.34
6 Malkangiri 79 4894 4912 18 0.37
Total 510 19249 19414 165 0.86
Source: DISE, 2009-10 and PES, 2009-10 of Dhenkanal, Khurdha, Malkangiri, Nuapada, Nabarangpur, and Sonepur Districts.
Note: i) Quantitative value of items as per DISE data = 19414 ii) Quantitative value of items as per PES data = 19249 iii) Quantitative value of deviations ignoring ± signs = 165 iv) %age deviation of DISE data from PES data = 0.86% v) Precision level of DISE data with relation to PES data =99.14%
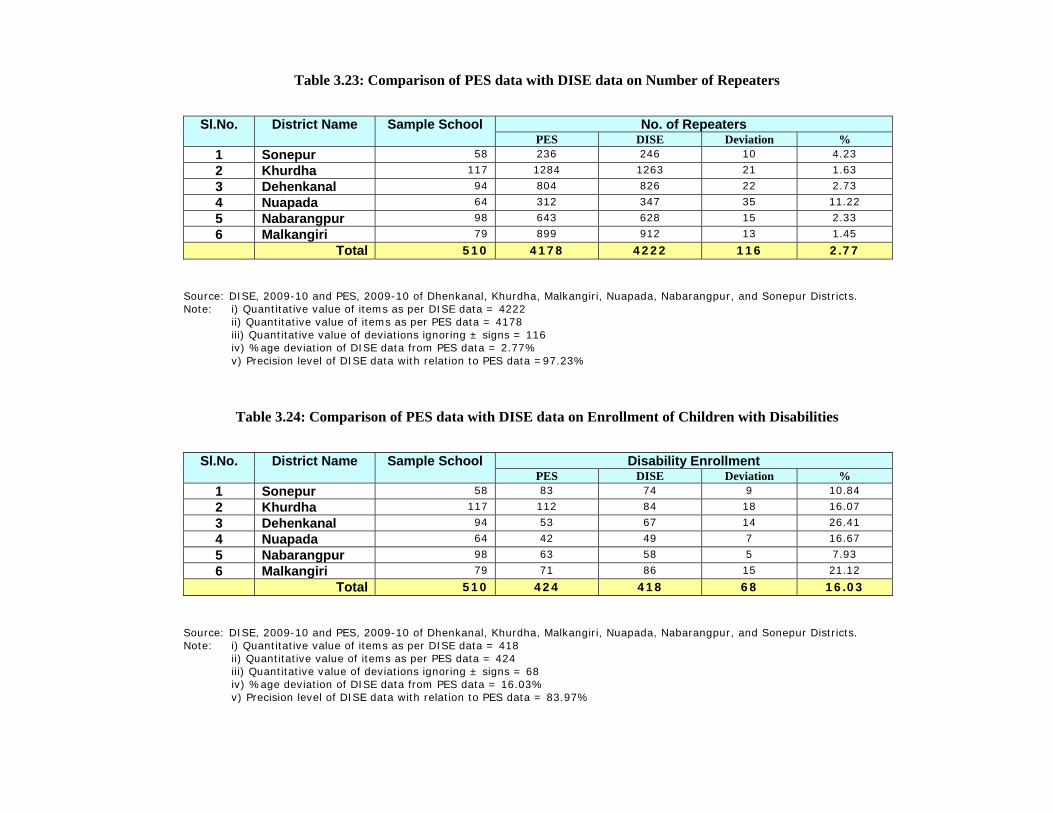
Table 3.23: Comparison of PES data with DISE data on Number of Repeaters
Sl.No. District Name Sample School No. of Repeaters PES DISE Deviation %
1 Sonepur 58 236 246 10 4.23
2 Khurdha 117 1284 1263 21 1.63
3 Dehenkanal 94 804 826 22 2.73
4 Nuapada 64 312 347 35 11.22
5 Nabarangpur 98 643 628 15 2.33
6 Malkangiri 79 899 912 13 1.45
Total 510 4178 4222 116 2.77
Source: DISE, 2009-10 and PES, 2009-10 of Dhenkanal, Khurdha, Malkangiri, Nuapada, Nabarangpur, and Sonepur Districts. Note: i) Quantitative value of items as per DISE data = 4222
ii) Quantitative value of items as per PES data = 4178 iii) Quantitative value of deviations ignoring ± signs = 116 iv) %age deviation of DISE data from PES data = 2.77% v) Precision level of DISE data with relation to PES data =97.23%
Table 3.24: Comparison of PES data with DISE data on Enrollment of Children with Disabilities
Sl.No. District Name Sample School Disability Enrollment PES DISE Deviation %
1 Sonepur 58 83 74 9 10.84
2 Khurdha 117 112 84 18 16.07
3 Dehenkanal 94 53 67 14 26.41
4 Nuapada 64 42 49 7 16.67
5 Nabarangpur 98 63 58 5 7.93
6 Malkangiri 79 71 86 15 21.12
Total 510 424 418 68 16.03
Source: DISE, 2009-10 and PES, 2009-10 of Dhenkanal, Khurdha, Malkangiri, Nuapada, Nabarangpur, and Sonepur Districts. Note: i) Quantitative value of items as per DISE data = 418
ii) Quantitative value of items as per PES data = 424 iii) Quantitative value of deviations ignoring ± signs = 68 iv) %age deviation of DISE data from PES data = 16.03% v) Precision level of DISE data with relation to PES data = 83.97%
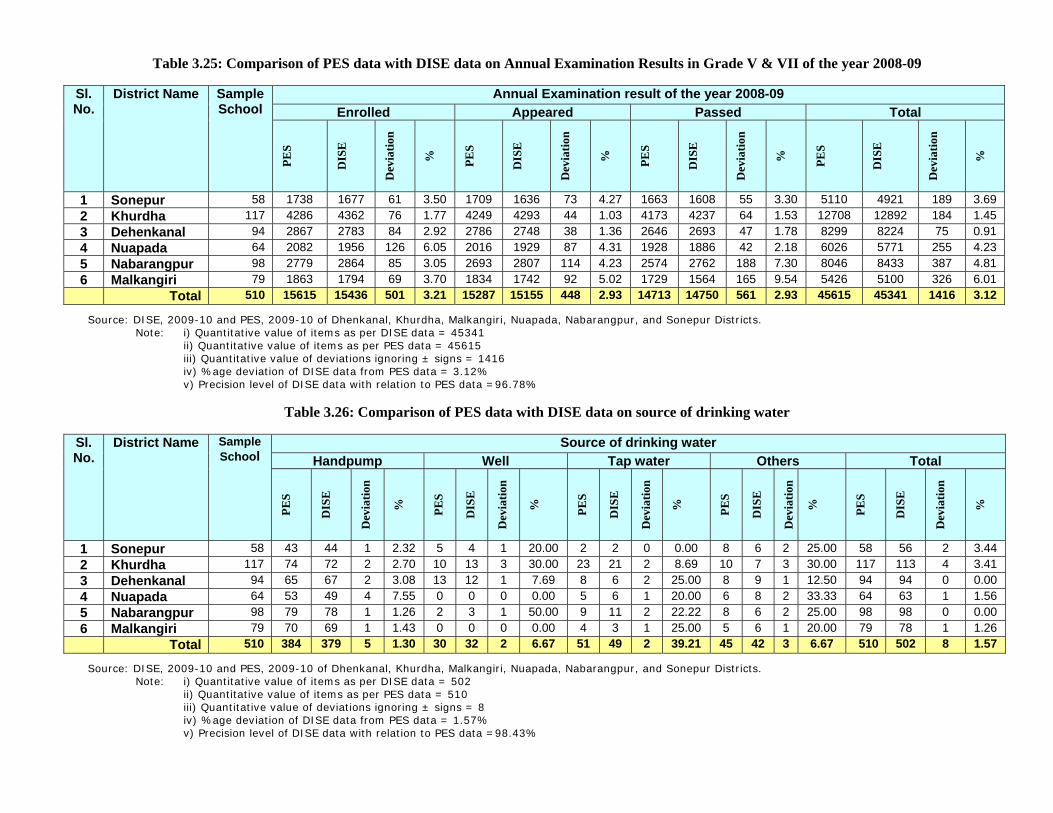
Table 3.25: Comparison of PES data with DISE data on Annual Examination Results in Grade V & VII of the year 2008-09
Sl.No.
District Name Sample School
Annual Examination result of the year 2008-09 Enrolled Appeared Passed Total
PES
DIS
E
Dev
iatio
n
%
PES
DIS
E
Dev
iatio
n
%
PES
DIS
E
Dev
iatio
n
%
PES
DIS
E
Dev
iatio
n
%
1 Sonepur 58 1738 1677 61 3.50 1709 1636 73 4.27 1663 1608 55 3.30 5110 4921 189 3.69 2 Khurdha 117 4286 4362 76 1.77 4249 4293 44 1.03 4173 4237 64 1.53 12708 12892 184 1.45 3 Dehenkanal 94 2867 2783 84 2.92 2786 2748 38 1.36 2646 2693 47 1.78 8299 8224 75 0.91 4 Nuapada 64 2082 1956 126 6.05 2016 1929 87 4.31 1928 1886 42 2.18 6026 5771 255 4.23 5 Nabarangpur 98 2779 2864 85 3.05 2693 2807 114 4.23 2574 2762 188 7.30 8046 8433 387 4.81 6 Malkangiri 79 1863 1794 69 3.70 1834 1742 92 5.02 1729 1564 165 9.54 5426 5100 326 6.01 Total 510 15615 15436 501 3.21 15287 15155 448 2.93 14713 14750 561 2.93 45615 45341 1416 3.12
Source: DISE, 2009-10 and PES, 2009-10 of Dhenkanal, Khurdha, Malkangiri, Nuapada, Nabarangpur, and Sonepur Districts. Note: i) Quantitative value of items as per DISE data = 45341
ii) Quantitative value of items as per PES data = 45615 iii) Quantitative value of deviations ignoring ± signs = 1416 iv) %age deviation of DISE data from PES data = 3.12% v) Precision level of DISE data with relation to PES data =96.78%
Table 3.26: Comparison of PES data with DISE data on source of drinking water
Sl.No.
District Name Sample School
Source of drinking water Handpump Well Tap water Others Total
PES
DIS
E
Dev
iatio
n
%
PES
DIS
E
Dev
iatio
n
%
PES
DIS
E
Dev
iatio
n
%
PES
DIS
E
Dev
iatio
n
%
PES
DIS
E
Dev
iatio
n
%
1 Sonepur 58 43 44 1 2.32 5 4 1 20.00 2 2 0 0.00 8 6 2 25.00 58 56 2 3.44 2 Khurdha 117 74 72 2 2.70 10 13 3 30.00 23 21 2 8.69 10 7 3 30.00 117 113 4 3.41 3 Dehenkanal 94 65 67 2 3.08 13 12 1 7.69 8 6 2 25.00 8 9 1 12.50 94 94 0 0.00 4 Nuapada 64 53 49 4 7.55 0 0 0 0.00 5 6 1 20.00 6 8 2 33.33 64 63 1 1.56 5 Nabarangpur 98 79 78 1 1.26 2 3 1 50.00 9 11 2 22.22 8 6 2 25.00 98 98 0 0.00 6 Malkangiri 79 70 69 1 1.43 0 0 0 0.00 4 3 1 25.00 5 6 1 20.00 79 78 1 1.26 Total 510 384 379 5 1.30 30 32 2 6.67 51 49 2 39.21 45 42 3 6.67 510 502 8 1.57
Source: DISE, 2009-10 and PES, 2009-10 of Dhenkanal, Khurdha, Malkangiri, Nuapada, Nabarangpur, and Sonepur Districts. Note: i) Quantitative value of items as per DISE data = 502
ii) Quantitative value of items as per PES data = 510 iii) Quantitative value of deviations ignoring ± signs = 8 iv) %age deviation of DISE data from PES data = 1.57% v) Precision level of DISE data with relation to PES data =98.43%

Chapter – 4 Findings on Field Observation
In order to make the DISE data collection more effective in terms of both time of operation
and quality of data collection, each District should have adequate availability of
infrastructure and computer professionals. Besides, the Head Teachers should be trained
adequately on filling up of DISE data and on cooperating with the PES team. They should
also keep all records relating to both DISE and PES activities properly updated and stored
for immediate use as and when required for both DISE and PES activities. In the post DISE
operation period, each school should have a School Report Card on DISE data and its own
copy of the School DCF. The compiled data of Cluster, Block and District levels should be
available at CRC, BRC and DPO levels especially for reference and use in the preparation of
the Annual Work Plan and Budget every year. The DISE data for this purpose should also be
shared at all levels for awareness of the people involved in plan preparation as well as
implementation. Some of the DISE data are also to be mentioned in the School Information
/ Display Board for public awareness and for making SSA a transparent programme. In this
chapter, a detailed deliberation has been made on these issues basing upon the field level
observations made by the PES study teams. The findings have been reflected in different
tables. The main items discussed are as follows:
4.1 Cooperation of Principal/ Head Teacher in Providing Data:
Cooperation of Principal/ Head Teacher is a bare necessity in getting correct data for filling
up of the DISE DCFs. A positive mindset of Principal / Head Teacher to provide the DISE
data is also required to complete the DISE data collection activity in time. It has been
reported by some CRCCs and BRCCs that Principals/ Head Teachers especially of the private
unaided schools and unrecognized schools have shown less/ no cooperation in some cases
to provide the DISE data and owing to this reason, they have failed to collect DISE data
from some schools. However an assessment on the extent of cooperation of Principal / Head
Teacher to the PES study team had been made during the PES, 2009-10 and the findings
have been classified into 05 qualitative categories, such as (i) very good (where initial
response is completely positive and immediately cooperative after getting identity of the
PES study team), (2) good (where the initial response is positive and cooperative after the
Principal/ Head Teacher completes his/ her own work), (3) average (where the initial
response is positive and cooperative only after the Principal / Head Teacher confirms the
identity of the PES study team), (4) poor (where the initial response is not positive and
cooperative but data are given under compulsion) and (5) very poor (where the initial
response is completely negative and non-cooperative to give data). The findings as
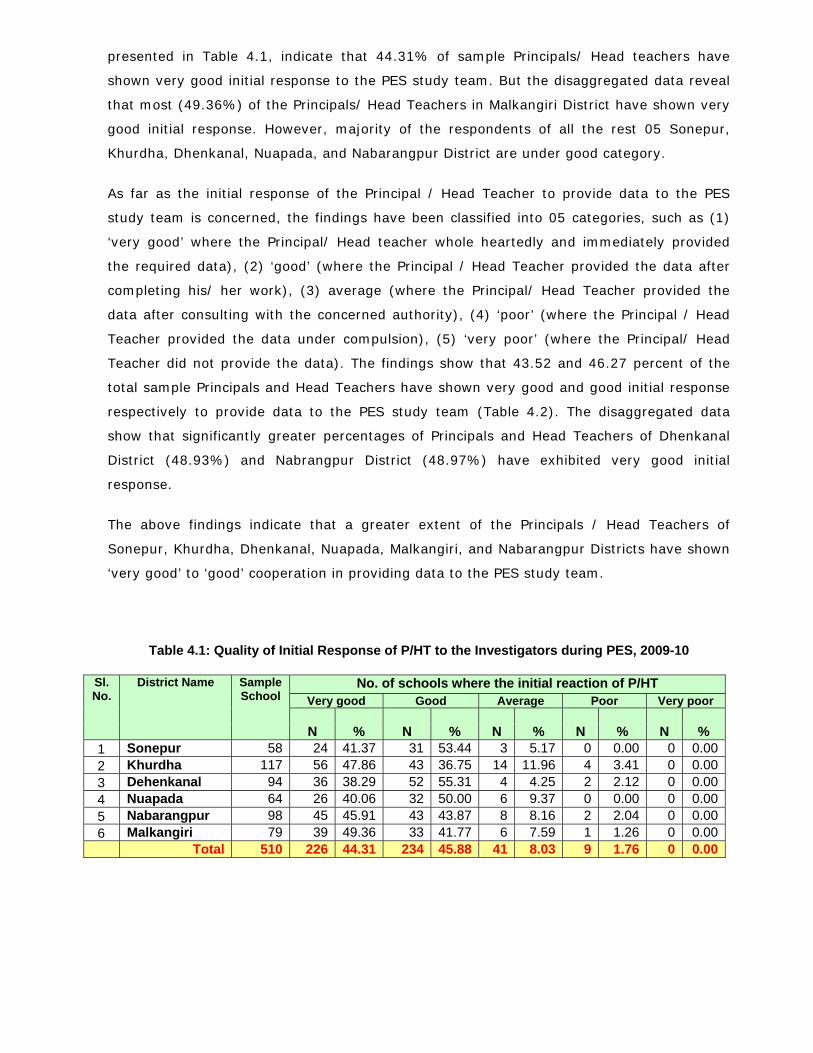
presented in Table 4.1, indicate that 44.31% of sample Principals/ Head teachers have
shown very good initial response to the PES study team. But the disaggregated data reveal
that most (49.36%) of the Principals/ Head Teachers in Malkangiri District have shown very
good initial response. However, majority of the respondents of all the rest 05 Sonepur,
Khurdha, Dhenkanal, Nuapada, and Nabarangpur District are under good category.
As far as the initial response of the Principal / Head Teacher to provide data to the PES
study team is concerned, the findings have been classified into 05 categories, such as (1)
‘very good’ where the Principal/ Head teacher whole heartedly and immediately provided
the required data), (2) ‘good’ (where the Principal / Head Teacher provided the data after
completing his/ her work), (3) average (where the Principal/ Head Teacher provided the
data after consulting with the concerned authority), (4) ‘poor’ (where the Principal / Head
Teacher provided the data under compulsion), (5) ‘very poor’ (where the Principal/ Head
Teacher did not provide the data). The findings show that 43.52 and 46.27 percent of the
total sample Principals and Head Teachers have shown very good and good initial response
respectively to provide data to the PES study team (Table 4.2). The disaggregated data
show that significantly greater percentages of Principals and Head Teachers of Dhenkanal
District (48.93%) and Nabrangpur District (48.97%) have exhibited very good initial
response.
The above findings indicate that a greater extent of the Principals / Head Teachers of
Sonepur, Khurdha, Dhenkanal, Nuapada, Malkangiri, and Nabarangpur Districts have shown
‘very good’ to ‘good’ cooperation in providing data to the PES study team.
Table 4.1: Quality of Initial Response of P/HT to the Investigators during PES, 2009-10
Sl.No.
District Name Sample School
No. of schools where the initial reaction of P/HT Very good Good Average Poor Very poor
N
%
N
%
N
%
N
%
N
% 1 Sonepur 58 24 41.37 31 53.44 3 5.17 0 0.00 0 0.002 Khurdha 117 56 47.86 43 36.75 14 11.96 4 3.41 0 0.003 Dehenkanal 94 36 38.29 52 55.31 4 4.25 2 2.12 0 0.004 Nuapada 64 26 40.06 32 50.00 6 9.37 0 0.00 0 0.005 Nabarangpur 98 45 45.91 43 43.87 8 8.16 2 2.04 0 0.006 Malkangiri 79 39 49.36 33 41.77 6 7.59 1 1.26 0 0.00 Total 510 226 44.31 234 45.88 41 8.03 9 1.76 0 0.00

Table 4. 2: Quality of Initial Response of P/HT to Provide Information during PES, 2009-10
Sl.No.
District Name Sample School
No. of schools where the initial reaction of P/HT Very good Good Average Poor Very poor
N
%
N
%
N
%
N
%
N
% 1 Sonepur 58 26 44.82 24 41.37 8 13.79 0 0.00 0 0.002 Khurdha 117 49 41.88 48 41.02 17 14.52 3 2.56 0 0.003 Dehenkanal 94 46 48.93 44 46.80 3 3.19 1 1.06 0 0.004 Nuapada 64 21 32.81 35 54.68 7 10.93 1 1.56 0 0.005 Nabarangpur 98 48 48.97 44 44,89 4 4.08 2 2.04 0 0.006 Malkangiri 79 32 40.51 41 51.89 5 6.32 1 1.26 0 0.00 Total 510 222 43.52 236 46.27 44 8.62 8 1.57 0 0.00
4.2. Status of Records of Schools:
Availability of proper records in the schools is very important as it enables the exercise like
DISE more reliable and fruitful. A precondition to get correct DISE data is the availability of
the official records in proper condition and timely updated. In the absence of such official
records, the Principal/ Head Teacher is likely to provide incorrect data. Obviously, one can
hypothesize that in a District where more percentage of schools have fully updated, un-torn
official records with legible recording of data, there would be less percentage of mismatch
between DISE data and PES data. During the PES, 2009-10, an assessment has been made
in this regard taking some indicators, such as (1) availability of records on the day of visit of
PES study team to school, (2) untorn and legibly written records, and (3) fully updated
records that contain DISE data and the records verified are: (1) log book, (2) admission
register of students, (3) students’ attendance register, (4) teachers’ attendance register, (5)
annual examination register, (6) VEC register, (7) free textbook register, (8) visit register
for CRCC and BRCC, (9) summary report card and (10) CWSN status report.
In order to measure the status of school as regard availability of record, 01 mark has been
given for availability of each report in school on the day of visit of the PES study team.
Similarly, 01 mark has been given if the available report is found untorn and legibly written
and 01 mark has again been given if the report is found fully updated with relevant data.
And in this way basing on the availability of records, the schools have been classified into 05
categories such as:

1. Very good (where 9 or 10 number of records out of the selected 10 records are
physically available),
2. Good (where 7 or 8 number of records are available),
3. Average (where 5 or 6 number of records are available),
4. Poor (where 3 or 6 number of records are available), and
5. Very poor (where < 3 number of records are available).
Following the same classification model, the schools have been classified into these 05
categories relating to the quality of conditions of records and the updation of records. The
findings in this regard have been presented in Table 4.3, 4.4 and 4.5.
It is evident from Table 4.3 that only 130 (25.49%) out of 510 schools belong to the very
good status as far as the availability of records is concerned. The school summary report of
DISE data for 2009-10 had not been given to the schools by the DPO till the visit of the PES,
study team. Furthermore, these schools had also not kept either the CWSN status report or
visit register for CRCC and BRCC. However, in a majority (50.98%) of the schools who
belong to good category, 7 or 8 out of the 10 records are available. The District wise
disaggregated data show that the extent of availability of records is the best in Dhenkanal
District amongst all the 06 (Sonepur, Khurdha, Dhenkanal, Nuapada, Nabarangpur and
Malkangiri) Districts.
Table 4.4 reveals that only 161 (31.56 %) out of the 510 schools belong to very good
category because 9 or 10 out of 10 records are untorn and legibly written. A majority
(42.54 %) of the schools however belong to ‘good’ category because 7 to 8 out of the 10
records are untorn and legibly written. Similarly, Table 4.5 indicates that only 121 (23.72%)
out of the 510 schools fall under ‘very good’ category whereas a majority (48.82%) belong
to ‘good’ category so far as the updation of records is concerned.
The above findings point out that nearly 90 per cent schools do not have all records that are
relevant for DISE data collection in perfect condition and updation. Hence there is a chance
of Principal/ Head Teacher making no/wrong entry of data in the DISE DCF.

Table 4.3: Extent of Availability of Records at Schools on the Day of PES, 2009-10
Sl.No.
District Name Sample School
No. of schools where the initial reaction of P/HT Very good Good Average Poor Very poor
N
%
N
%
N
%
N
%
N
% 1 Sonepur 58 17 29.31 30 51.72 10 17.24 1 1.72 0 0.002 Khurdha 117 28 23.93 59 50.42 27 23.07 3 2.56 0 0.003 Dehenkanal 94 24 25.53 52 55.31 16 17.02 2 2.12 0 0.004 Nuapada 64 16 25.00 34 53.12 13 20.31 1 1.56 0 0.005 Nabarangpur 98 31 31.63 47 47.96 18 18.36 2 2.04 0 0.006 Malkangiri 79 14 17.72 38 48.10 26 32.91 1 1.27 0 0.00 Total 510 130 25.49 260 50.98 110 21.57 10 1.96 0 0.00
Table 4.4: Quality of Conditions of Records Maintained at Schools on the Day of PES, 2009-10
Sl.No.
District Name Sample School
No. of schools where the initial reaction of P/HT Very good Good Average Poor Very poor
N
%
N
%
N
%
N
%
N
% 1 Sonepur 58 24 41.37 15 25.86 18 31.03 1 1.72 0 0.002 Khurdha 117 32 27.35 60 51.28 21 17.94 4 3.42 0 0.003 Dehenkanal 94 29 30.85 38 40.42 24 25.53 3 3.19 0 0.004 Nuapada 64 21 32.81 25 39.06 17 26.56 1 1.56 0 0.005 Nabarangpur 98 36 36.73 37 37.75 23 23.46 2 2.04 0 0.006 Malkangiri 79 19 24.05 42 53.16 16 20.25 2 2.53 0 0.00 Total 510 161 31.56 217 42.54 119 23.34 13 2.54 0 0.00
Table 4.5: Quality of Updation of Records Maintained at Schools on the Day of PES, 2009-10
Sl.No.
District Name Sample School
No. of schools where the initial reaction of P/HT Very good Good Average Poor Very poor
N
%
N
%
N
%
N
%
N
% 1 Sonepur 58 17 29.31 16 27.59 23 39.65 2 3.44 0 0.002 Khurdha 117 23 19.65 64 54.70 26 22.22 4 3.41 0 0.003 Dehenkanal 94 27 28.72 46 48.93 18 19.14 3 3.19 0 0.004 Nuapada 64 18 28.12 26 40.62 19 29.68 1 1.56 0 0.005 Nabarangpur 98 22 22.44 47 47.95 27 27.55 2 2.04 0 0.006 Malkangiri 79 14 17.72 50 63.29 14 17.72 1 1.26 0 0.00 Total 510 121 23.72 249 48.82 127 24.90 13 2.54 0 0.00
4.3 Training of Principal/ Head Teacher in Filling up of DISE Data
A set of guidelines has been attached with each DISE DCF and it describes the procedure to
be followed for filling up of the DCFs and it explains the meaning of the terms used in the
DCFs. The purpose is to enable the Principal/ Head Teacher to properly fill up the DCFs.
Furthermore, it is mandatory under the DISE activities to give training to the Principals /
Head Teachers adequately, clarifying all their doubts so that they would fill up the data
correctly. It is hypothesized that the District, where imperfect and inadequate DISE training
has been conducted, would have greater extent of mismatch between DISE data and PES
data. An assessment in this regard has been made during the PES, 2009-10 especially
analyzing the aspects, such as (1) extent of Principal / Head Teacher received DISE training,
(2) level of organization of DISE training, (3) duration of DISE training, (4) category of
trainers giving DISE training, (5) extent of explanation of DCF during DISE training, and (6)
extent of doubts removed during DISE training.
The findings regarding the extent of Principal/ Head Teacher received training on DISE in
2009-10 have been presented in Table 4.6. The table reveals that 401 (78.62%) out of 510
Principals / Head Teachers have got DISE training in 2009-10. The District wise
disaggregated data indicate that lowest percentage of Principal/ Head Teachers have got
DISE training in Khurdha District (70.08%) than in Sonepur District (81.03%), Dhanekanal
District (77.65%), Nuapada District (81.25%), Nabarangpur District (79.59%) and
Malkangiri District (87.34%).
From the report given by the Programmers of the all sample Districts, it is noticed that DISE
training programmes had been organized for the Principals/ Head Teachers by CRCC at
cluster level. However, during the PES it has been found that Principals / Head Teachers of
some schools especially belonging to ‘private aided’, ‘private unaided’ ‘unrecognized’ and
‘others’ categories have not been invited for the training.
Efficacy of DISE training partly depends upon the level of its organization. It is obvious that
if the training is organized at Cluster level instead of the Block / District level, the quality of
trainer and trainee interaction will be better leading to greater efficacy of training and hence
less mismatch between DISE data and PES data. The findings on the level at which the
Principal/Head Teachers have got DISE training in 2009-10 have shown that in all the 06
Districts all Principals / Head Teachers have got DISE training at Cluster level. (Table 4.7)
Duration of training (i.e. number of days covered for DISE training) is another significant
factor that contributes to the efficacy of DISE training. It is hypothesized that a greater
duration of training in terms of number of days covered would lead to more efficacy of DISE
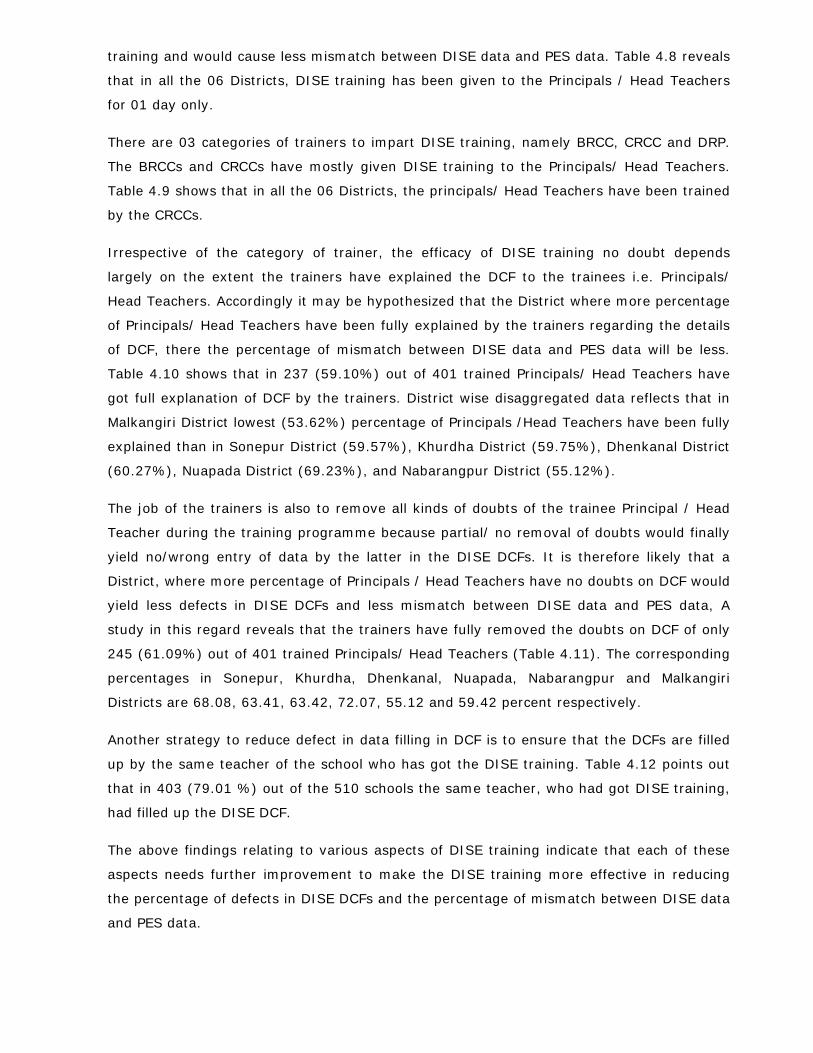
training and would cause less mismatch between DISE data and PES data. Table 4.8 reveals
that in all the 06 Districts, DISE training has been given to the Principals / Head Teachers
for 01 day only.
There are 03 categories of trainers to impart DISE training, namely BRCC, CRCC and DRP.
The BRCCs and CRCCs have mostly given DISE training to the Principals/ Head Teachers.
Table 4.9 shows that in all the 06 Districts, the principals/ Head Teachers have been trained
by the CRCCs.
Irrespective of the category of trainer, the efficacy of DISE training no doubt depends
largely on the extent the trainers have explained the DCF to the trainees i.e. Principals/
Head Teachers. Accordingly it may be hypothesized that the District where more percentage
of Principals/ Head Teachers have been fully explained by the trainers regarding the details
of DCF, there the percentage of mismatch between DISE data and PES data will be less.
Table 4.10 shows that in 237 (59.10%) out of 401 trained Principals/ Head Teachers have
got full explanation of DCF by the trainers. District wise disaggregated data reflects that in
Malkangiri District lowest (53.62%) percentage of Principals /Head Teachers have been fully
explained than in Sonepur District (59.57%), Khurdha District (59.75%), Dhenkanal District
(60.27%), Nuapada District (69.23%), and Nabarangpur District (55.12%).
The job of the trainers is also to remove all kinds of doubts of the trainee Principal / Head
Teacher during the training programme because partial/ no removal of doubts would finally
yield no/wrong entry of data by the latter in the DISE DCFs. It is therefore likely that a
District, where more percentage of Principals / Head Teachers have no doubts on DCF would
yield less defects in DISE DCFs and less mismatch between DISE data and PES data, A
study in this regard reveals that the trainers have fully removed the doubts on DCF of only
245 (61.09%) out of 401 trained Principals/ Head Teachers (Table 4.11). The corresponding
percentages in Sonepur, Khurdha, Dhenkanal, Nuapada, Nabarangpur and Malkangiri
Districts are 68.08, 63.41, 63.42, 72.07, 55.12 and 59.42 percent respectively.
Another strategy to reduce defect in data filling in DCF is to ensure that the DCFs are filled
up by the same teacher of the school who has got the DISE training. Table 4.12 points out
that in 403 (79.01 %) out of the 510 schools the same teacher, who had got DISE training,
had filled up the DISE DCF.
The above findings relating to various aspects of DISE training indicate that each of these
aspects needs further improvement to make the DISE training more effective in reducing
the percentage of defects in DISE DCFs and the percentage of mismatch between DISE data
and PES data.
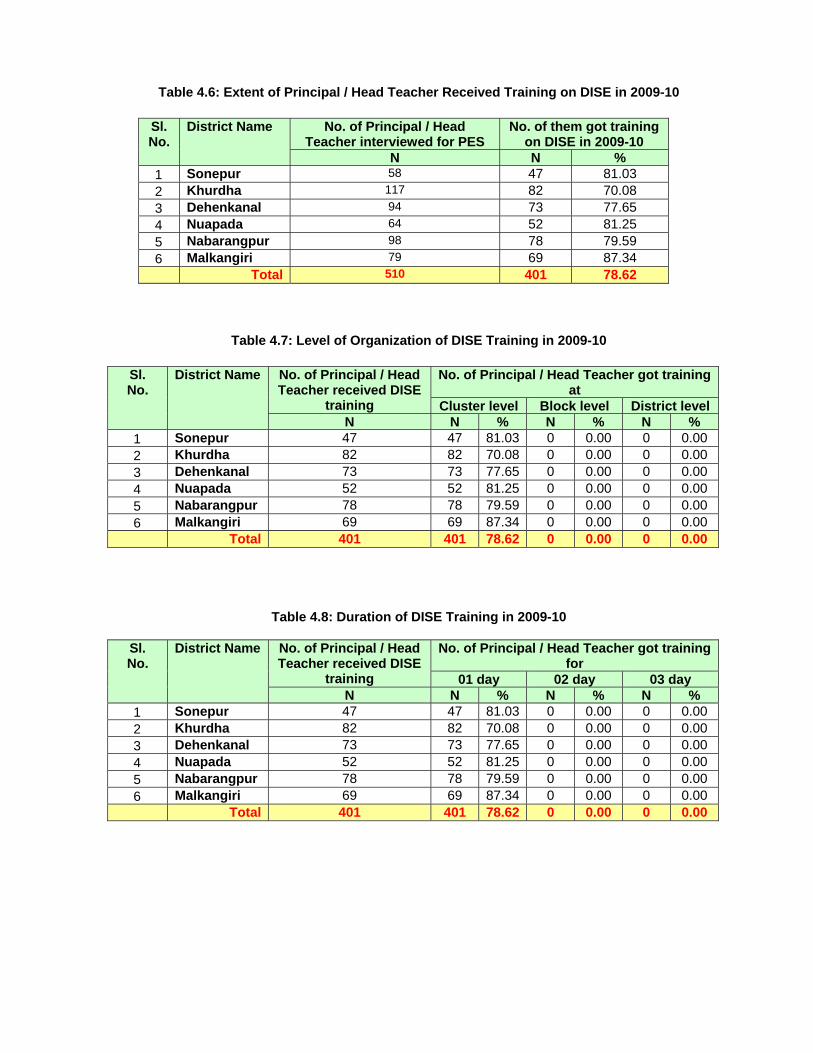
Table 4.6: Extent of Principal / Head Teacher Received Training on DISE in 2009-10
Sl. No.
District Name No. of Principal / Head Teacher interviewed for PES
No. of them got training on DISE in 2009-10
N N % 1 Sonepur 58 47 81.03 2 Khurdha 117 82 70.08 3 Dehenkanal 94 73 77.65 4 Nuapada 64 52 81.25 5 Nabarangpur 98 78 79.59 6 Malkangiri 79 69 87.34 Total 510 401 78.62
Table 4.7: Level of Organization of DISE Training in 2009-10
Sl. No.
District Name No. of Principal / Head Teacher received DISE
training
No. of Principal / Head Teacher got training at
Cluster level Block level District level N N % N % N %
1 Sonepur 47 47 81.03 0 0.00 0 0.00 2 Khurdha 82 82 70.08 0 0.00 0 0.00 3 Dehenkanal 73 73 77.65 0 0.00 0 0.00 4 Nuapada 52 52 81.25 0 0.00 0 0.00 5 Nabarangpur 78 78 79.59 0 0.00 0 0.00 6 Malkangiri 69 69 87.34 0 0.00 0 0.00 Total 401 401 78.62 0 0.00 0 0.00
Table 4.8: Duration of DISE Training in 2009-10
Sl. No.
District Name No. of Principal / Head Teacher received DISE
training
No. of Principal / Head Teacher got training for
01 day 02 day 03 day N N % N % N %
1 Sonepur 47 47 81.03 0 0.00 0 0.00 2 Khurdha 82 82 70.08 0 0.00 0 0.00 3 Dehenkanal 73 73 77.65 0 0.00 0 0.00 4 Nuapada 52 52 81.25 0 0.00 0 0.00 5 Nabarangpur 78 78 79.59 0 0.00 0 0.00 6 Malkangiri 69 69 87.34 0 0.00 0 0.00 Total 401 401 78.62 0 0.00 0 0.00
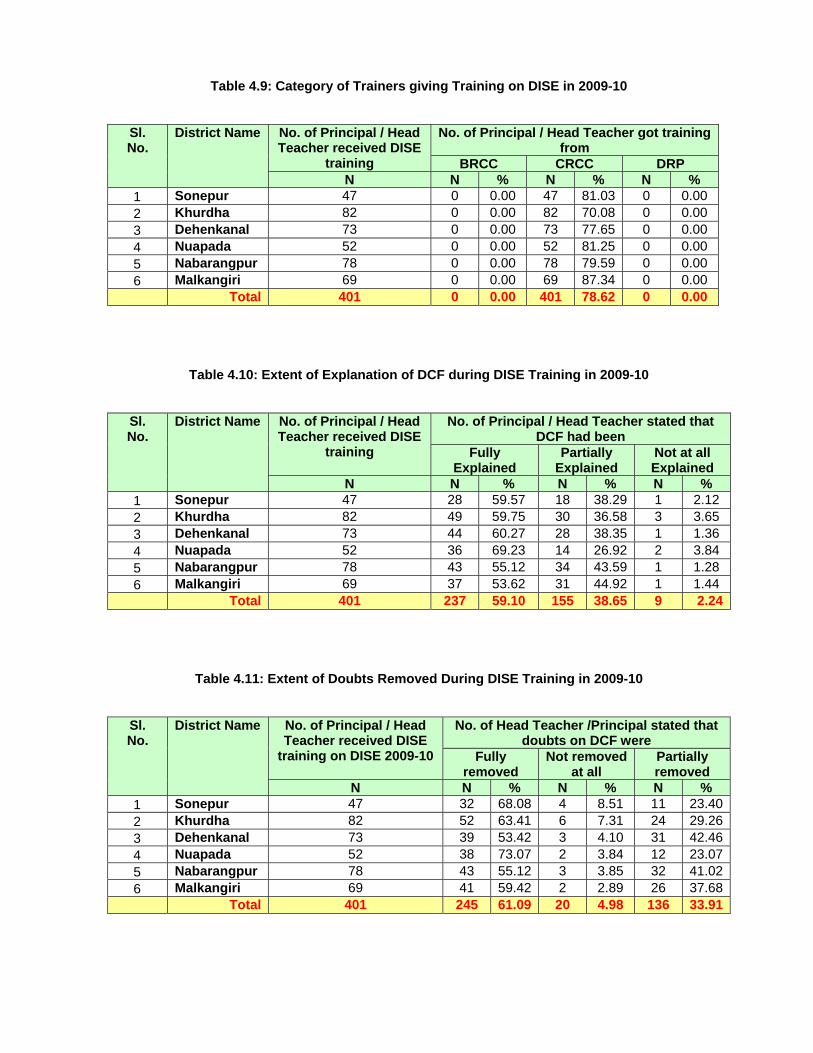
Table 4.9: Category of Trainers giving Training on DISE in 2009-10
Sl. No.
District Name No. of Principal / Head Teacher received DISE
training
No. of Principal / Head Teacher got training from
BRCC CRCC DRP N N % N % N %
1 Sonepur 47 0 0.00 47 81.03 0 0.00 2 Khurdha 82 0 0.00 82 70.08 0 0.00 3 Dehenkanal 73 0 0.00 73 77.65 0 0.00 4 Nuapada 52 0 0.00 52 81.25 0 0.00 5 Nabarangpur 78 0 0.00 78 79.59 0 0.00 6 Malkangiri 69 0 0.00 69 87.34 0 0.00 Total 401 0 0.00 401 78.62 0 0.00
Table 4.10: Extent of Explanation of DCF during DISE Training in 2009-10
Sl. No.
District Name No. of Principal / Head Teacher received DISE
training
No. of Principal / Head Teacher stated that DCF had been
Fully Explained
Partially Explained
Not at all Explained
N N % N % N % 1 Sonepur 47 28 59.57 18 38.29 1 2.12 2 Khurdha 82 49 59.75 30 36.58 3 3.65 3 Dehenkanal 73 44 60.27 28 38.35 1 1.36 4 Nuapada 52 36 69.23 14 26.92 2 3.84 5 Nabarangpur 78 43 55.12 34 43.59 1 1.28 6 Malkangiri 69 37 53.62 31 44.92 1 1.44 Total 401 237 59.10 155 38.65 9 2.24
Table 4.11: Extent of Doubts Removed During DISE Training in 2009-10
Sl. No.
District Name No. of Principal / Head Teacher received DISE
training on DISE 2009-10
No. of Head Teacher /Principal stated that doubts on DCF were
Fully removed
Not removed at all
Partially removed
N N % N % N % 1 Sonepur 47 32 68.08 4 8.51 11 23.402 Khurdha 82 52 63.41 6 7.31 24 29.263 Dehenkanal 73 39 53.42 3 4.10 31 42.464 Nuapada 52 38 73.07 2 3.84 12 23.075 Nabarangpur 78 43 55.12 3 3.85 32 41.026 Malkangiri 69 41 59.42 2 2.89 26 37.68 Total 401 245 61.09 20 4.98 136 33.91

Table 4.12: Extent of Schools Where the DISE DCF had been filled up by the Same Teacher who
had got DISE Training in 2009-10
Sl. No.
District Name Sample School
No. of schools where the same trained teacher had filled up the DISE DCF
N N % 1 Sonepur 58 46 79.31 2 Khurdha 117 83 70.94 3 Dehenkanal 94 76 80.85 4 Nuapada 64 52 81.25 5 Nabarangpur 98 82 83.67 6 Malkangiri 79 64 81.01 Total 510 403 79.01
4.4 Availability of Infrastructure and Computer Professionals in the District MIS Unit:
After completion of the data filling activities at school level, the data entry activity is to be
taken up. This involves entering the data obtained in the DCFs into the computers. The data
entry activity depends, largely upon the availability of requisite infrastructure and computer
professionals in the District MIS Unit for smooth and timely operation.
It has been noticed during the PES that in Dhenkanal District, the MIS Unit of DPO had
adequate space and furniture for conducting data entry activity. But it had 03 computers
with 01 server and 02 numbers of printers. Since these were not adequate to complete the
data entry activity in time; it had borrowed 02 numbers of computers from other Units of
DPO. Similarly, there are 02 numbers of Data Entry Operators and 01 Programmer in the
District MIS Unit but for the purpose of timely entry of DISE data, 02 numbers of Data Entry
Operators were borrowed from the office of DI of schools. Besides, the MIS Unit also has 01
telephone, internet facility, 01 server, air conditioner and 01 LCD projector.
In the District MIS Unit of Nuapada District there were 01 Programmer and 01 Data Entry
Operator. Besides, it had 03 computers with 01 server, 01 LCD projector, internet facility,
01 telephone, 01 scanner, 02 printers and the necessary furniture. However, the air-
conditioner available at the MIS Unit is not functioning due to mechanical problem. In order
to complete the DISE data entry activity in time, the DPO had hired only 01 Data Entry
Operator for 01 month.
In the District MIS Unit of Khurdha District, there were 04 computers, 01 heavy duty laser
printer, 01 air conditioner, 01 telephone, internet facility, 01 server and the requisite
furniture. Besides, it had 01 Programmer and 01 Data Entry Operators. But these facilities

were not enough for data entry activity of the entire District that has 15 Blocks (Rural and
ULB). Hence, the DPO had hired 02 Data Entry Operators for one month.
In the District MIS Unit of Sonepur District there were 01 Programmer and 02 Data Entry
Operator. Besides, it had 04 computers with 01 server, 01 LCD projector, internet facility,
01 telephone, 01 scanner, 02 heavy duty laser printers, o1 air-conditioner and the
necessary furniture. In order to complete the DISE data entry activity in time, the DPO had
hired only 01 Data Entry Operator for 01 month.
In the District MIS Unit of Malkangiri District, there were 05 computers with o1 server, 02
printers, 01 air conditioner, 01 telephone, internet facility, and the requisite furniture.
Besides, it had 01 Programmer and 01 Data Entry Operators. But these facilities were not
enough for data entry activity of the entire District. Hence, the DPO had hired 04 Data Entry
Operators for one month.
In the District MIS Unit of Nabarangpur District, there were 03 computers with 01 server, 02
printers (one is not functioning), 01 air conditioner, 01 telephone, internet facility, and the
requisite furniture. Besides, it had 01 Programmer and 01 Data Entry Operators. But these
facilities were not enough for data entry activity of the entire District. Hence, the DPO had
hired 02 Data Entry Operators for one month.
In the District MIS Unit of all the 06 Districts, there were the requisite softwares for DISE
data entry and these softwares had been provided by the State MIS Unit.
4.5 Data Entry / Feeding Arrangement at District Level:
In Malkangir and Nabarangpur District, for the purpose of effective data entry in computers
at District level, the data were first fed into the computers and the print outs were given to
the BRCCs to cross-check at BRC level and return to the District MIS Unit pointing out the
defects. The defects were then rectified in the computes at the DPO.
In Sonepur, Nuapada and Dhenkanal Districts, during the time of data entry in computers of
DPO, the DI of schools and the District Coordinators of DPO had cross-checked the DISE
data at some schools and had reported the defects in the DCFs. Accordingly, the
computerized data were then rectified.
Khurdha being a very large District the data entry activity was first done at Educational
District level and then at District level. At both levels, some selected BRCCs and CRCCs had
been engaged to cross-check the data.
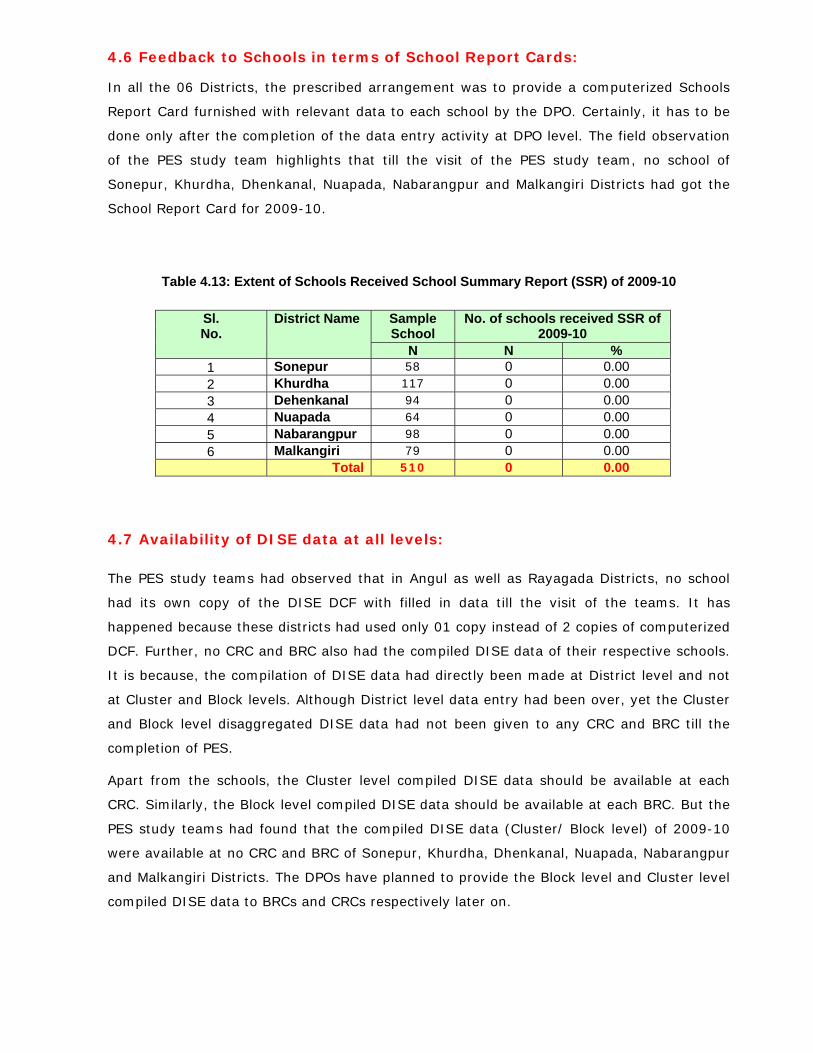
4.6 Feedback to Schools in terms of School Report Cards:
In all the 06 Districts, the prescribed arrangement was to provide a computerized Schools
Report Card furnished with relevant data to each school by the DPO. Certainly, it has to be
done only after the completion of the data entry activity at DPO level. The field observation
of the PES study team highlights that till the visit of the PES study team, no school of
Sonepur, Khurdha, Dhenkanal, Nuapada, Nabarangpur and Malkangiri Districts had got the
School Report Card for 2009-10.
Table 4.13: Extent of Schools Received School Summary Report (SSR) of 2009-10
Sl. No.
District Name Sample School
No. of schools received SSR of 2009-10
N N % 1 Sonepur 58 0 0.00 2 Khurdha 117 0 0.00 3 Dehenkanal 94 0 0.00 4 Nuapada 64 0 0.00 5 Nabarangpur 98 0 0.00 6 Malkangiri 79 0 0.00 Total 510 0 0.00
4.7 Availability of DISE data at all levels:
The PES study teams had observed that in Angul as well as Rayagada Districts, no school
had its own copy of the DISE DCF with filled in data till the visit of the teams. It has
happened because these districts had used only 01 copy instead of 2 copies of computerized
DCF. Further, no CRC and BRC also had the compiled DISE data of their respective schools.
It is because, the compilation of DISE data had directly been made at District level and not
at Cluster and Block levels. Although District level data entry had been over, yet the Cluster
and Block level disaggregated DISE data had not been given to any CRC and BRC till the
completion of PES.
Apart from the schools, the Cluster level compiled DISE data should be available at each
CRC. Similarly, the Block level compiled DISE data should be available at each BRC. But the
PES study teams had found that the compiled DISE data (Cluster/ Block level) of 2009-10
were available at no CRC and BRC of Sonepur, Khurdha, Dhenkanal, Nuapada, Nabarangpur
and Malkangiri Districts. The DPOs have planned to provide the Block level and Cluster level
compiled DISE data to BRCs and CRCs respectively later on.
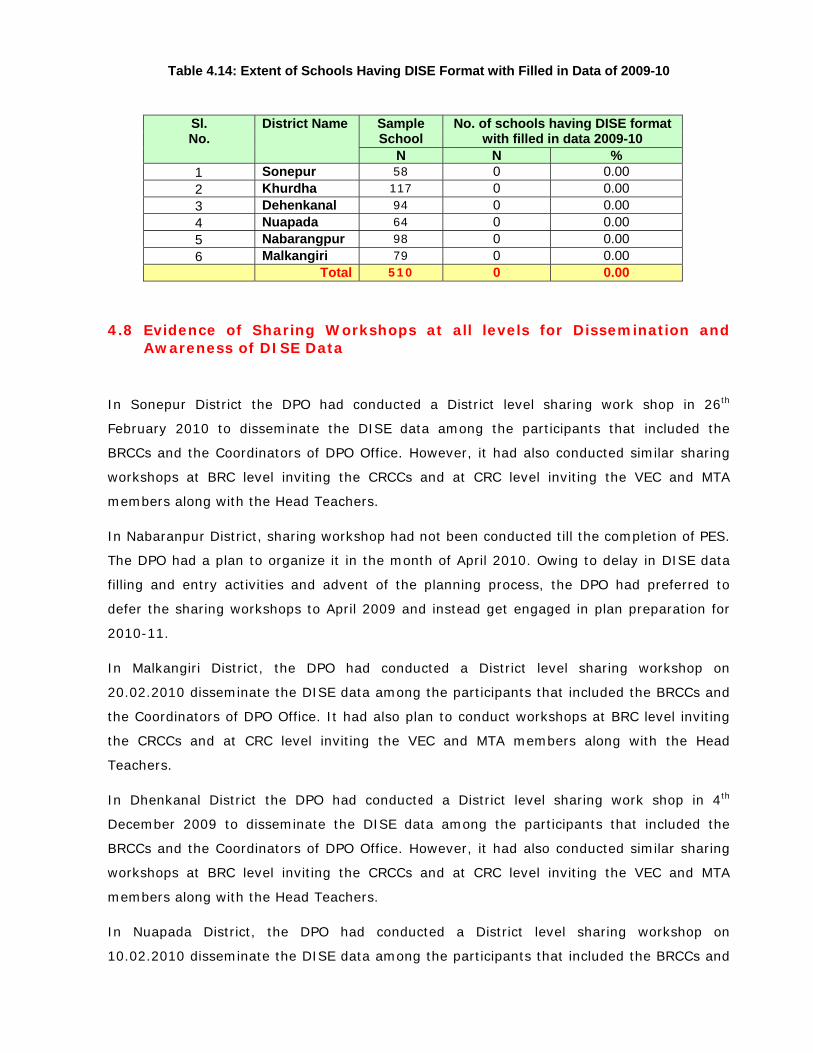
Table 4.14: Extent of Schools Having DISE Format with Filled in Data of 2009-10
Sl. No.
District Name Sample School
No. of schools having DISE format with filled in data 2009-10
N N % 1 Sonepur 58 0 0.00 2 Khurdha 117 0 0.00 3 Dehenkanal 94 0 0.00 4 Nuapada 64 0 0.00 5 Nabarangpur 98 0 0.00 6 Malkangiri 79 0 0.00 Total 510 0 0.00
4.8 Evidence of Sharing Workshops at all levels for Dissemination and Awareness of DISE Data
In Sonepur District the DPO had conducted a District level sharing work shop in 26th
February 2010 to disseminate the DISE data among the participants that included the
BRCCs and the Coordinators of DPO Office. However, it had also conducted similar sharing
workshops at BRC level inviting the CRCCs and at CRC level inviting the VEC and MTA
members along with the Head Teachers.
In Nabaranpur District, sharing workshop had not been conducted till the completion of PES.
The DPO had a plan to organize it in the month of April 2010. Owing to delay in DISE data
filling and entry activities and advent of the planning process, the DPO had preferred to
defer the sharing workshops to April 2009 and instead get engaged in plan preparation for
2010-11.
In Malkangiri District, the DPO had conducted a District level sharing workshop on
20.02.2010 disseminate the DISE data among the participants that included the BRCCs and
the Coordinators of DPO Office. It had also plan to conduct workshops at BRC level inviting
the CRCCs and at CRC level inviting the VEC and MTA members along with the Head
Teachers.
In Dhenkanal District the DPO had conducted a District level sharing work shop in 4th
December 2009 to disseminate the DISE data among the participants that included the
BRCCs and the Coordinators of DPO Office. However, it had also conducted similar sharing
workshops at BRC level inviting the CRCCs and at CRC level inviting the VEC and MTA
members along with the Head Teachers.
In Nuapada District, the DPO had conducted a District level sharing workshop on
10.02.2010 disseminate the DISE data among the participants that included the BRCCs and
the Coordinators of DPO Office. It had also plan to conduct workshops at BRC level inviting
the CRCCs and at CRC level inviting the VEC and MTA members along with the Head
Teachers.
In Khurdha District the DPO had conducted a District level sharing work shop in 18th January
2010 to disseminate the DISE data among the participants that included the BRCCs and the
Coordinators of DPO Office. However, it had also conducted similar sharing workshops at
BRC level inviting the CRCCs and at CRC level inviting the VEC and MTA members along
with the Head Teachers.
4.9 Display of Key Information on the School Display/ Information Board
In all the 06 Districts, i.e. Sonepur, Khurdha, Dhenkanal, Nuapada, Nabarangpur and
Malkangiri, the DPO had given instruction to the Head Teacher of each school covered under
the SSA programme to prepare a School Display/ Information Board in a visible place and
display some key DISE data like (1) students’ enrollment, (2) students’ daily attendance,
(3) teachers in position, and (4) grants received. During the PES, it had been observed that
only 407 (79.80%) out of the 510 schools had a School Display/ Information Board (Table
4.15). In Sonepur and Khurdha District, 81.03 and 75.21 per cent schools had this Board
whereas in Dhenkanal and Nuapada Districts 78.72 and 82.81 per cent schools have this
Board respectively. It was 83.67 and 79.74 percent in Nabaranpur and Malkangiri Districts.
This indicates that the concerned DPOs of 06 Districts had failed to ensure the formation of
such a Board in all schools even after completion of 07 years of SSA activities.
It can be observed that in Table 4.16, all the prescribed 04 kinds of DISE data had not been
displayed in the School Display / Information Board of all schools. Out of the total 407
schools that had the School Display / Information Board, students’ enrollment data had
been displayed in 353 (86.73%) schools; students’ daily attendance data had been
displayed in 325 (79.85%) schools; teachers in position data had been reflected in 341
(83.78%) schools; and grants received data had been displayed in 105 (25.79%) schools.
This indicates that all these 04 key data had not been displayed in all of those schools that
had the School Display / Information Board.

Table 4.15: Extent of Schools Having School Display Board
Sl. No.
District Name Sample School
No. of schools having School Display Board
N N % 1 Sonepur 58 47 81.03 2 Khurdha 117 88 75.21 3 Dehenkanal 94 74 78.72 4 Nuapada 64 53 82.81 5 Nabarangpur 98 82 83.67 6 Malkangiri 79 63 79.74 Total 510 407 79.80
Table 4.16: Extent of Schools Mentioned DISE Data in School Display Board (SDB) on the Day of Visit of PES Study Team in 2009-10
Sl. No.
District Name No. of schools
having SDB
Extent of schools mentioned DISE Data on Student
enrollment Student daily attendance
Teachers in position
Grant received
N N % N % N % N % 1 Sonepur 47 41 87.23 38 80.85 40 85.10 16 34.042 Khurdha 88 79 89.77 76 86.36 79 89.77 23 26.133 Dehenkanal 74 62 83.78 53 71.62 58 78.37 18 24.324 Nuapada 53 45 84.90 42 79.24 43 81.13 14 26.415 Nabarangpur 82 74 90.24 69 84.14 72 87.80 21 25.606 Malkangiri 63 52 82.53 47 74.60 49 77.78 13 20.63 Total 407 353 86.73 325 79.85 341 83.78 105 25.79
4.10 Use of DISE Data in Planning:
The DPOs of all the 06 Districts, Sonepur, Khurdha, Dhenkanal, Nuapada, Nabarangpur and
Malkangiri had developed 25 number of tables out of the DISE data of 2009-10 and had
utilized them in preparation of the Annual Work Plan and Budget of 2010-11. Due to delay
in starting as well as completion of the DISE activity, the DPOs had not been able to ensure
preparation of the Annual Work Plan at BRC, CRC or habitation level and hence had not
used DISE data for plan preparation at these levels.
Chapter – 5 Conclusions and Recommendations
The principal objective of the survey was to measure deviations of DISE data from Post
Enumeration Survey (PES) data and to suggest appropriate remedial measures for
strengthening the DISE system in Orissa. So the Sample Checking of DISE data deals with a
few relevant issues concerning DISE format and mechanism made for implementation of
DISE in Orissa. Overall 510 schools were covered from 6 sampled districts for comparison of
DISE data with PES data. State Level Office of Orissa Primary Education Programme
Authority (OPEPA), provided tools (NUEPA) for survey. Major recommendations for
strengthening the DISE system in Orissa are as follows:
It has been observed during the field work that teachers consider the DISE
information as a routine one and hence do not pay desired attention while filling the
DISE DCFs. In such a situation the quality of DISE data is always at stake. It is,
therefore, suggested that Head Master/Teacher concerned should be made
personally responsible for providing correct and accurate data.
Teachers don't take seriously the training imparted by the CRCCs. Alternatively, the
DIETs can also be given the responsibility of training at the district, block and CRC
levels.
The DISE format is lengthy and hence it should be re-designed to keep it short and
simple keeping in view the abilities and time available among teachers concerned.
More emphasis should be laid on issues like enrolment, retention, and dropout
and attendance rate in the data capture format resulting in effective enumeration
of vital statistics.
Collection of data through DISE format may be ensured by October of each academic
year so that the Five Percent Sample Check can be attempted by December of the
same academic year so that the results can be appropriately utilized for planning the
activities for next academic year.
The formats canvassed for Post Enumeration Survey (DCF) and the District
Information System of Education (DISE) were quite different in terms of certain
variables/aspects. This has been resulting difficulty in establishing similarities or
confirmation of data through Five Percent Check.
The School complex Head Masters, Block Educational Officers, Officers of District
project SSA and DIET faculty should be given training on collection and utilization of
DISE data and its all related soft ware applications for proper planning and
implementation of Educational activities.
All the teachers must be given proper orientation and awareness that based on this
data the budgetary provisions of schools were made hence, it is mandatory to know
all these by the concerned personnel of the schools.
Though this year scrutiny was under taken by the CRCCs, in most of the places it
was quite casual. Hence this has to be relooked and Effective supervision and
monitoring should be ensured at Block and District level.
In order to improve the quality of data across the district it is further suggested that
optimal utilization of DISE data should be made at all levels. As such it is essential
that data at each level right from the School to district level be shared and discussed
in details.
Districts should maintain the time line for DISE data collection. The DISE data should
be collected in the month of October and completed before December and PES
survey should be done in the month of December.
School Summary Reports should be distributed to each school by 15th December so
that in December the VEC can conduct sharing meeting.
The school copy of DISE DCF should be returned to schools immediately after
completion of CRC level data compilation work to facilitate sharing of DISE data in
VEC meeting.
(Annexure –A)
Reference
GoI and NUEPA (2008), ‘Elementary Education in India: Progress towards
UEE’, New Delhi.
Government of India (2002), ‘Sarva Shiksha Abhiyan’: A Programme for Universal Elementary Education, New Delhi: Ministry of Human Resource Development, Department of Elementary Education and Literacy.
Overview of Quality Related Interventions under SSA, (www.ssa.nic.in)
World Bank (1997), ‘Primary Education in India’, Washington DC: the World Bank.
Access and Retention, The Impact of DPEP: The National Overview, Department of Education, Government of India, MHRD, New Delhi.
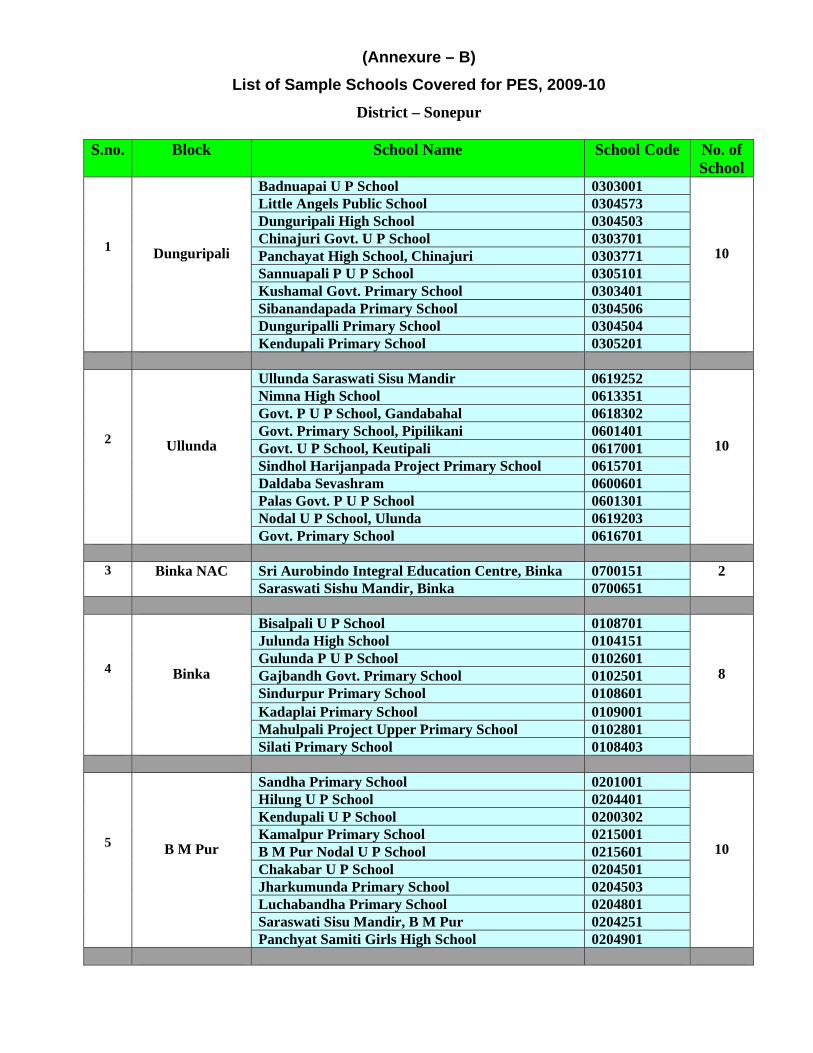
(Annexure – B) List of Sample Schools Covered for PES, 2009-10
District – Sonepur
S.no. Block School Name School Code No. of School
1
Dunguripali
Badnuapai U P School 0303001
10
Little Angels Public School 0304573 Dunguripali High School 0304503 Chinajuri Govt. U P School 0303701 Panchayat High School, Chinajuri 0303771 Sannuapali P U P School 0305101 Kushamal Govt. Primary School 0303401 Sibanandapada Primary School 0304506 Dunguripalli Primary School 0304504 Kendupali Primary School 0305201
2
Ullunda
Ullunda Saraswati Sisu Mandir 0619252
10
Nimna High School 0613351 Govt. P U P School, Gandabahal 0618302 Govt. Primary School, Pipilikani 0601401 Govt. U P School, Keutipali 0617001 Sindhol Harijanpada Project Primary School 0615701 Daldaba Sevashram 0600601 Palas Govt. P U P School 0601301 Nodal U P School, Ulunda 0619203 Govt. Primary School 0616701
3 Binka NAC Sri Aurobindo Integral Education Centre, Binka 0700151 2
Saraswati Sishu Mandir, Binka 0700651 4
Binka
Bisalpali U P School 0108701
8
Julunda High School 0104151 Gulunda P U P School 0102601 Gajbandh Govt. Primary School 0102501 Sindurpur Primary School 0108601 Kadaplai Primary School 0109001 Mahulpali Project Upper Primary School 0102801 Silati Primary School 0108403
5
B M Pur
Sandha Primary School 0201001
10
Hilung U P School 0204401 Kendupali U P School 0200302 Kamalpur Primary School 0215001 B M Pur Nodal U P School 0215601 Chakabar U P School 0204501 Jharkumunda Primary School 0204503 Luchabandha Primary School 0204801 Saraswati Sisu Mandir, B M Pur 0204251 Panchyat Samiti Girls High School 0204901

S.no. Block School Name School Code No. of School
6 Tarva NAC Tarva Nuapara Primary School 0900101 1
7
Tarva
S N Govt. High School, Sibatula 0516702
9
Govt. Primary School, Sibatula 0516703 Garja Project U P school 0508001 Sargijharia Primary School 0501101 Jhartarbha U P School 0508302 Sargoj G T O U P School 0515501 Khairbhadi Sebashram 0505101 Narda Harijan Para Primary School 0507201 Dubula U P School 0506601
8 Sonepur MPL Sureswari Primary School 0801103 1
9
Sonepur
Briganjuri Primary School 0404901
7 Bhoipali New Primary School 0407501 Saradhapali Govt. U P School 0407502 Kolapathar Primary School 0406501 Babupali U P School 0404701 Kabattali Primary School 0406401 Sardhapali High School 0407551
(Total number of sampled school = 58)
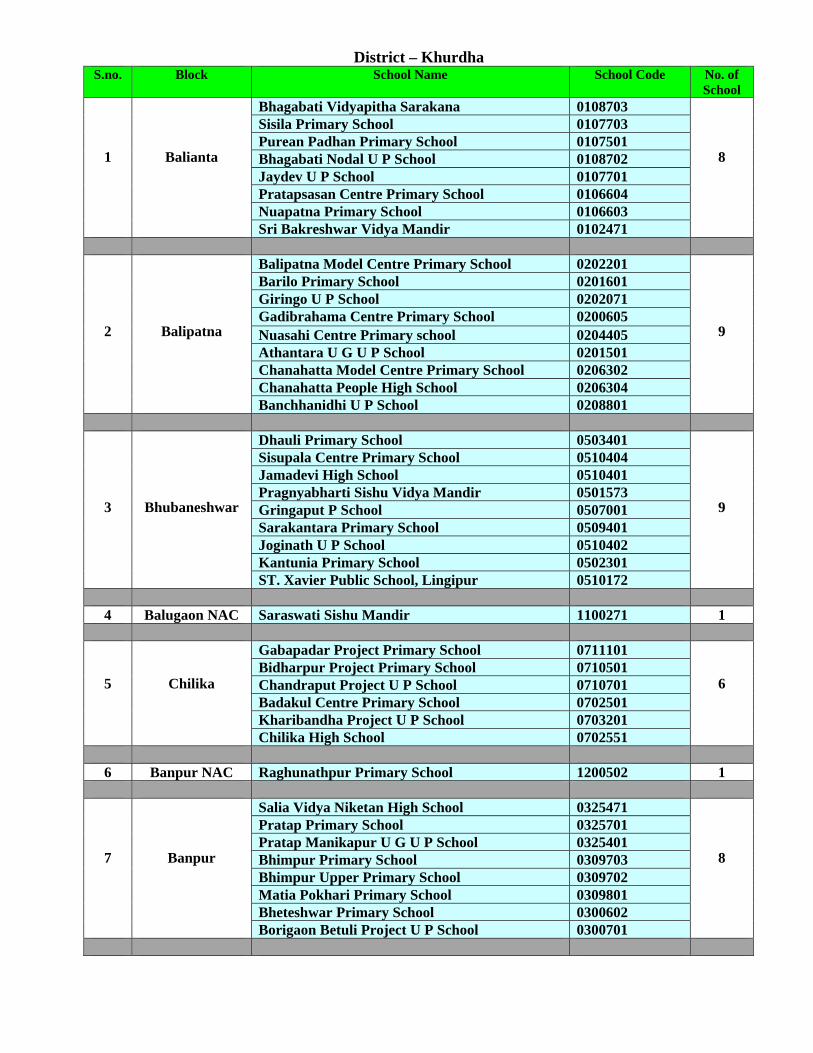
District – Khurdha S.no. Block School Name School Code No. of
School
1
Balianta
Bhagabati Vidyapitha Sarakana 0108703
8
Sisila Primary School 0107703 Purean Padhan Primary School 0107501 Bhagabati Nodal U P School 0108702 Jaydev U P School 0107701 Pratapsasan Centre Primary School 0106604 Nuapatna Primary School 0106603 Sri Bakreshwar Vidya Mandir 0102471
2
Balipatna
Balipatna Model Centre Primary School 0202201
9
Barilo Primary School 0201601 Giringo U P School 0202071 Gadibrahama Centre Primary School 0200605 Nuasahi Centre Primary school 0204405 Athantara U G U P School 0201501 Chanahatta Model Centre Primary School 0206302 Chanahatta People High School 0206304 Banchhanidhi U P School 0208801
3
Bhubaneshwar
Dhauli Primary School 0503401
9
Sisupala Centre Primary School 0510404 Jamadevi High School 0510401 Pragnyabharti Sishu Vidya Mandir 0501573 Gringaput P School 0507001 Sarakantara Primary School 0509401 Joginath U P School 0510402 Kantunia Primary School 0502301 ST. Xavier Public School, Lingipur 0510172
4 Balugaon NAC Saraswati Sishu Mandir 1100271 1
5
Chilika
Gabapadar Project Primary School 0711101
6 Bidharpur Project Primary School 0710501 Chandraput Project U P School 0710701 Badakul Centre Primary School 0702501 Kharibandha Project U P School 0703201 Chilika High School 0702551
6 Banpur NAC Raghunathpur Primary School 1200502 1
7
Banpur
Salia Vidya Niketan High School 0325471
8
Pratap Primary School 0325701 Pratap Manikapur U G U P School 0325401 Bhimpur Primary School 0309703 Bhimpur Upper Primary School 0309702 Matia Pokhari Primary School 0309801 Bheteshwar Primary School 0300602 Borigaon Betuli Project U P School 0300701
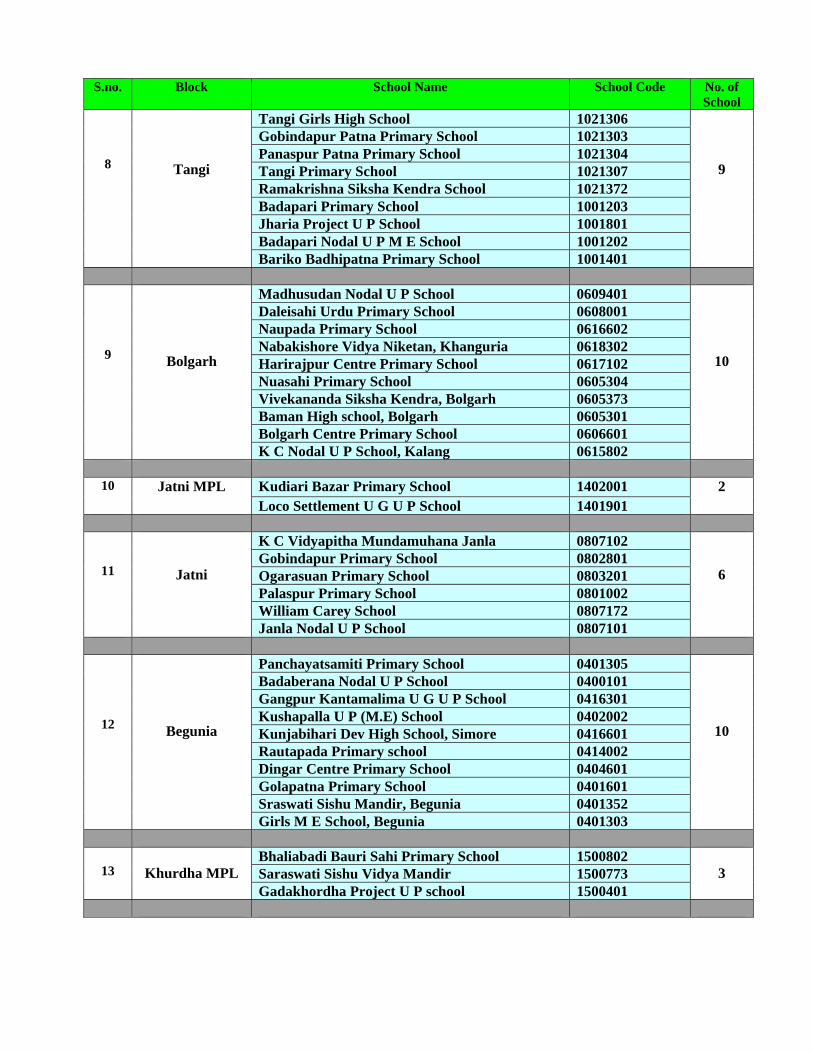
S.no. Block School Name School Code No. of School
8
Tangi
Tangi Girls High School 1021306
9
Gobindapur Patna Primary School 1021303 Panaspur Patna Primary School 1021304 Tangi Primary School 1021307 Ramakrishna Siksha Kendra School 1021372 Badapari Primary School 1001203 Jharia Project U P School 1001801 Badapari Nodal U P M E School 1001202 Bariko Badhipatna Primary School 1001401
9
Bolgarh
Madhusudan Nodal U P School 0609401
10
Daleisahi Urdu Primary School 0608001 Naupada Primary School 0616602 Nabakishore Vidya Niketan, Khanguria 0618302 Harirajpur Centre Primary School 0617102 Nuasahi Primary School 0605304 Vivekananda Siksha Kendra, Bolgarh 0605373 Baman High school, Bolgarh 0605301 Bolgarh Centre Primary School 0606601 K C Nodal U P School, Kalang 0615802
10 Jatni MPL Kudiari Bazar Primary School 1402001 2
Loco Settlement U G U P School 1401901
11
Jatni
K C Vidyapitha Mundamuhana Janla 0807102
6 Gobindapur Primary School 0802801 Ogarasuan Primary School 0803201 Palaspur Primary School 0801002 William Carey School 0807172 Janla Nodal U P School 0807101
12
Begunia
Panchayatsamiti Primary School 0401305
10
Badaberana Nodal U P School 0400101 Gangpur Kantamalima U G U P School 0416301 Kushapalla U P (M.E) School 0402002 Kunjabihari Dev High School, Simore 0416601 Rautapada Primary school 0414002 Dingar Centre Primary School 0404601 Golapatna Primary School 0401601 Sraswati Sishu Mandir, Begunia 0401352 Girls M E School, Begunia 0401303
13
Khurdha MPL Bhaliabadi Bauri Sahi Primary School 1500802
3 Saraswati Sishu Vidya Mandir 1500773 Gadakhordha Project U P school 1500401

S.no. Block School Name School Code
No. of School
14
Khurdha
Gopapuria Patapur Primary School 0908301
9
Jagulipatna Centre Primary School 0909001 Pubusahi High School 0912501 Godipada Primary School 0903301 Taratua U P U G School 0909003 Sardhapur Primary School 0908901 Residential ST Primary School 0902252 Chandapur Primary School 0912101 Jayamangala Nodal U P School 0912201
15
Bhubaneshwar MC
Delta Colony Centre Primary School 1302901
26
Saraswati Sishu Mandir Kharvel Nagar Unit-3 1303752 Rasugarh Govt. Sevashram School 1300705 Bapuji Nagar U G U P School 1303601 Govt. Primary School Unit-3 1303704 Kendrapaliy Primary School 1303606 Sahid Nagar (B) Primary school 1302003 Rajbhaban Project U P School 1302905 Govt. Girls High School Unit-8 1301701 Saraswati Sishu Vidya Mandir Unit-8 1303051 Govt. High school, Sahid Nagar 1302001 Sri Aurbindo Integral Education 1302276 Sitanath U P School 1300255 Chandrasekharpur Housing Board Colony P School 1300201 Chandrasekharpur Phase II U G U P School 1300101 Rasulgarh U G U P School 1300706 Govt. High School, Chandrasekharpur 1300303 S S Mandir Nuasahi, Rasulgarh 1300786 Lingraj Primary School 1304002 Gautam Nagra Primary school 1301403 D A V Public School, Chandrasekharpur 1300256 Raghunathpur Primary school 1303204 Khandagiri U P School 1303102 Kendriya Vidyalaya No.-3 1300408 Gopabandhu Vidya Mandir, Nayapalli 1301672 Harihara Vidyapitha U G U P school 1304107
(Total number of sampled school = 117)
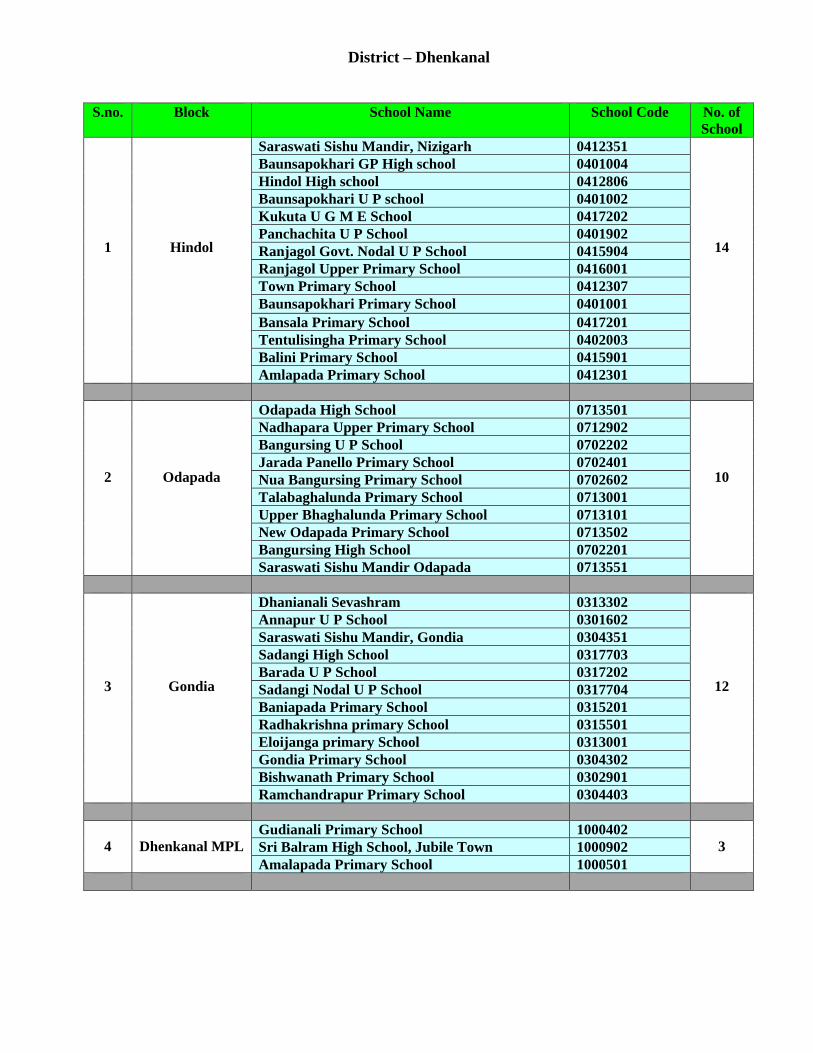
District – Dhenkanal
S.no. Block School Name School Code No. of School
1
Hindol
Saraswati Sishu Mandir, Nizigarh 0412351
14
Baunsapokhari GP High school 0401004 Hindol High school 0412806 Baunsapokhari U P school 0401002 Kukuta U G M E School 0417202 Panchachita U P School 0401902 Ranjagol Govt. Nodal U P School 0415904 Ranjagol Upper Primary School 0416001 Town Primary School 0412307 Baunsapokhari Primary School 0401001 Bansala Primary School 0417201 Tentulisingha Primary School 0402003 Balini Primary School 0415901 Amlapada Primary School 0412301
2
Odapada
Odapada High School 0713501
10
Nadhapara Upper Primary School 0712902 Bangursing U P School 0702202 Jarada Panello Primary School 0702401 Nua Bangursing Primary School 0702602 Talabaghalunda Primary School 0713001 Upper Bhaghalunda Primary School 0713101 New Odapada Primary School 0713502 Bangursing High School 0702201 Saraswati Sishu Mandir Odapada 0713551
3
Gondia
Dhanianali Sevashram 0313302
12
Annapur U P School 0301602 Saraswati Sishu Mandir, Gondia 0304351 Sadangi High School 0317703 Barada U P School 0317202 Sadangi Nodal U P School 0317704 Baniapada Primary School 0315201 Radhakrishna primary School 0315501 Eloijanga primary School 0313001 Gondia Primary School 0304302 Bishwanath Primary School 0302901 Ramchandrapur Primary School 0304403
4
Dhenkanal MPLGudianali Primary School 1000402
3 Sri Balram High School, Jubile Town 1000902 Amalapada Primary School 1000501
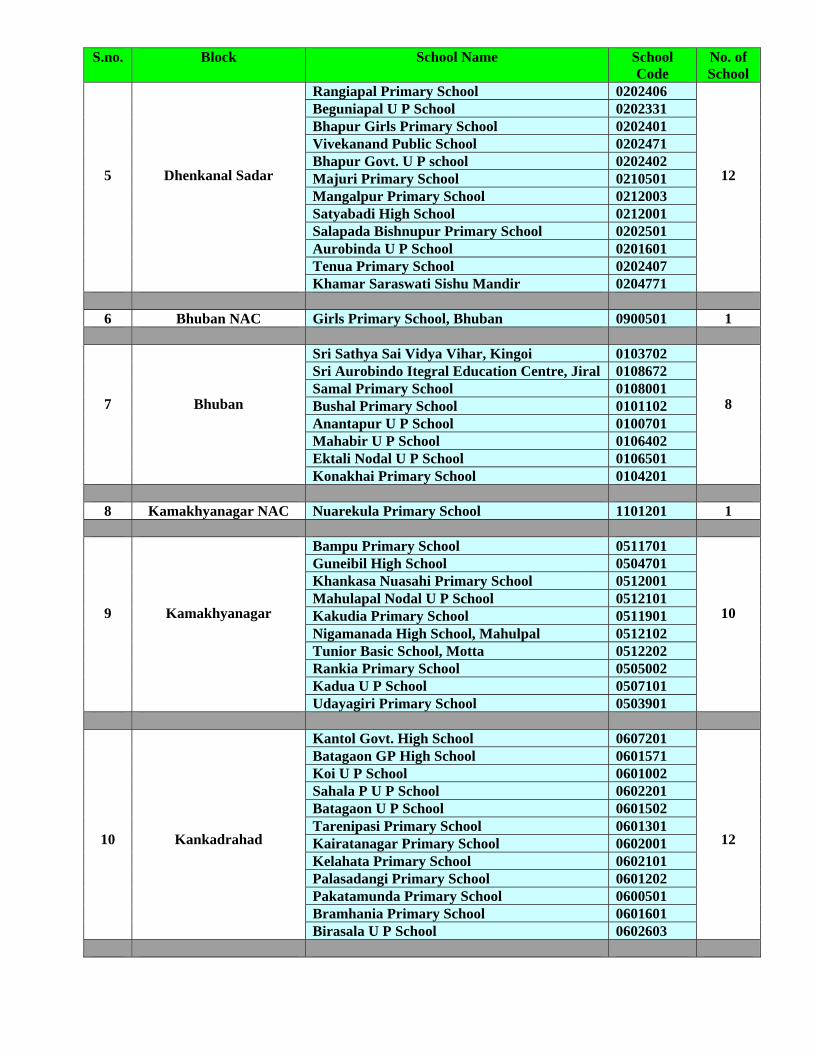
S.no. Block School Name School Code
No. of School
5
Dhenkanal Sadar
Rangiapal Primary School 0202406
12
Beguniapal U P School 0202331 Bhapur Girls Primary School 0202401 Vivekanand Public School 0202471 Bhapur Govt. U P school 0202402 Majuri Primary School 0210501 Mangalpur Primary School 0212003 Satyabadi High School 0212001 Salapada Bishnupur Primary School 0202501 Aurobinda U P School 0201601 Tenua Primary School 0202407 Khamar Saraswati Sishu Mandir 0204771
6 Bhuban NAC Girls Primary School, Bhuban 0900501 1
7
Bhuban
Sri Sathya Sai Vidya Vihar, Kingoi 0103702
8
Sri Aurobindo Itegral Education Centre, Jiral 0108672 Samal Primary School 0108001 Bushal Primary School 0101102 Anantapur U P School 0100701 Mahabir U P School 0106402 Ektali Nodal U P School 0106501 Konakhai Primary School 0104201
8 Kamakhyanagar NAC Nuarekula Primary School 1101201 1
9
Kamakhyanagar
Bampu Primary School 0511701
10
Guneibil High School 0504701 Khankasa Nuasahi Primary School 0512001 Mahulapal Nodal U P School 0512101 Kakudia Primary School 0511901 Nigamanada High School, Mahulpal 0512102 Tunior Basic School, Motta 0512202 Rankia Primary School 0505002 Kadua U P School 0507101 Udayagiri Primary School 0503901
10
Kankadrahad
Kantol Govt. High School 0607201
12
Batagaon GP High School 0601571 Koi U P School 0601002 Sahala P U P School 0602201 Batagaon U P School 0601502 Tarenipasi Primary School 0601301 Kairatanagar Primary School 0602001 Kelahata Primary School 0602101 Palasadangi Primary School 0601202 Pakatamunda Primary School 0600501 Bramhania Primary School 0601601 Birasala U P School 0602603

S.no. Block School Name School Code
No. of School
11
Parjang
Pitiri U P School 0807602
11
Jahnpada Primary School 0802301 Dihadol Primary School 0802101 Sarang Nodal U P School 0808804 Garh Parjang Primary School 0802205 Govt. U P School, Parjang 0802204 Sraswati Sishu Mandir, Sarang 0808852 Khandualmunda Primary School 0802401 IGIT Campus Primary School 0808802 IGIT Campus High School 0808851 Raghunathpur Sevashram 0800601
(Total number of sampled school = 94)
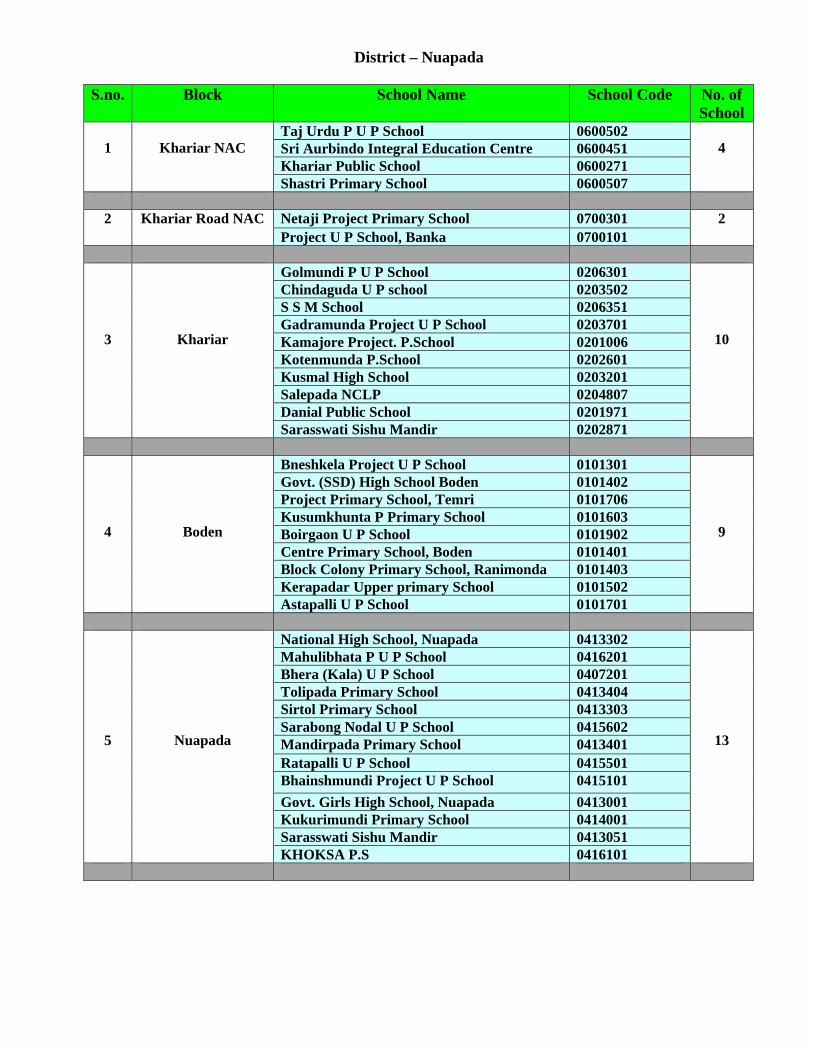
District – Nuapada
S.no. Block School Name School Code No. of School
1
Khariar NAC
Taj Urdu P U P School 0600502 4 Sri Aurbindo Integral Education Centre 0600451
Khariar Public School 0600271 Shastri Primary School 0600507
2 Khariar Road NAC Netaji Project Primary School 0700301 2
Project U P School, Banka 0700101
3
Khariar
Golmundi P U P School 0206301
10
Chindaguda U P school 0203502 S S M School 0206351 Gadramunda Project U P School 0203701 Kamajore Project. P.School 0201006 Kotenmunda P.School 0202601 Kusmal High School 0203201 Salepada NCLP 0204807 Danial Public School 0201971 Sarasswati Sishu Mandir 0202871
4
Boden
Bneshkela Project U P School 0101301
9
Govt. (SSD) High School Boden 0101402 Project Primary School, Temri 0101706 Kusumkhunta P Primary School 0101603 Boirgaon U P School 0101902 Centre Primary School, Boden 0101401 Block Colony Primary School, Ranimonda 0101403 Kerapadar Upper primary School 0101502 Astapalli U P School 0101701
5
Nuapada
National High School, Nuapada 0413302
13
Mahulibhata P U P School 0416201 Bhera (Kala) U P School 0407201 Tolipada Primary School 0413404 Sirtol Primary School 0413303 Sarabong Nodal U P School 0415602 Mandirpada Primary School 0413401 Ratapalli U P School 0415501 Bhainshmundi Project U P School 0415101 Govt. Girls High School, Nuapada 0413001 Kukurimundi Primary School 0414001 Sarasswati Sishu Mandir 0413051 KHOKSA P.S 0416101

S.no. Block School Name School Code No. of
School
6
Sinapali
Rajshree Public School 0511171
11
Jamgaon Primary School 0500105 Saraswati Sishu Mandir 0511152 Sinapalli Nodal U P School 0511105 Kapsi U P School 0511001 Sardhapur P U P School 0501801 Kapsi Primary School 0511002 Palsapala P U P School 0503201 Padarbhatta Project Primary school 0511003 Sinapali High School 0511104 Bahalpada Project primary School 0511101
7
Komna
Bagalapada Project Primary School 0304501
15
Sri Airbindo Integral Centre, Bhela 0300871 Girls Project U P School 0304506 High School, Kureshwar 0305801 Kureshwar U P School 0305802 Rang U P School 0305901 Chahakapada Project Primary School 0305501 Panchayat Primary School 0304507 Jethupali Project U P School 0315501 Sri Aurbindo Integral Centre, Komna 0304551 Sraswati Sishu Vidya Mandir 0304552 Tikrapada Primary School 0315802 S S M School 0305871 Komna Boys Primary School 0304504 Mahulbhata P U P School 0315601
(Total number of sampled school = 64)

District – Nabarangpur
S.no. Block School Name School Code No. of School
1 Nabrangpur NAC Saura St. Primary School 1100702 2 Ex Board P U P School 1100801
2
Nabrangpur
Ekalabya Model School 0500503
6 Rajib Gandhi H S Jambaguda 0502204 Sindhigam NCLP 0505103 Rathamijhiguda P S 0500403 L.D. Pur Sasan, U G U P School 0500701 Bhatiguda P S 0501703
3
Papadahandi
Patraguda Primary School 0701601
12
Tandaguda Primary School 0705912 Chatrabara primary School 0701301 Sarishpadar Primary School 0707501 Miriguda Primary School 0705907 Kangumanjhiguda P U P School 0701501 Papadahandi U G U P School 0705911 T O M E School 0705910 Shatguda U P School 0701302 Kanyashram Girls High School 0704303 Doleiguda Sevashram Primary School 0705903 Manigam S S 0704202
4
Nandahandi
Mernas Primary School 0601601
6 Soruguda P U P School 0600802 Nuaguda Primary School 0604602 Dangarbheja Govt. M E School 0600602 Dahana Primary School 0601405 Beloguda Primary School 0601402
5
Tantulikhunti
Gaudaguda Primary School 0907001
8
Siraguda Primary School 0906005 Udayapur Primary school 0907002 J E L C Primary School 0906902 Primary School Khandiaguda 0906201 Charamala U G U P School 0900801 U G M E School Tentulikhunti 0906904 Primary School Kurmakote 0905901
6
Dabugam
Nuaguda Primary School 0202903
6 Majhiguda (A) Primary School 0205201 Chachanaguda Primary School 0204002 Kenouguda Primary School 0205501 Block Colony Primary School 0203002 Kusumabandh U G U P School 0202402
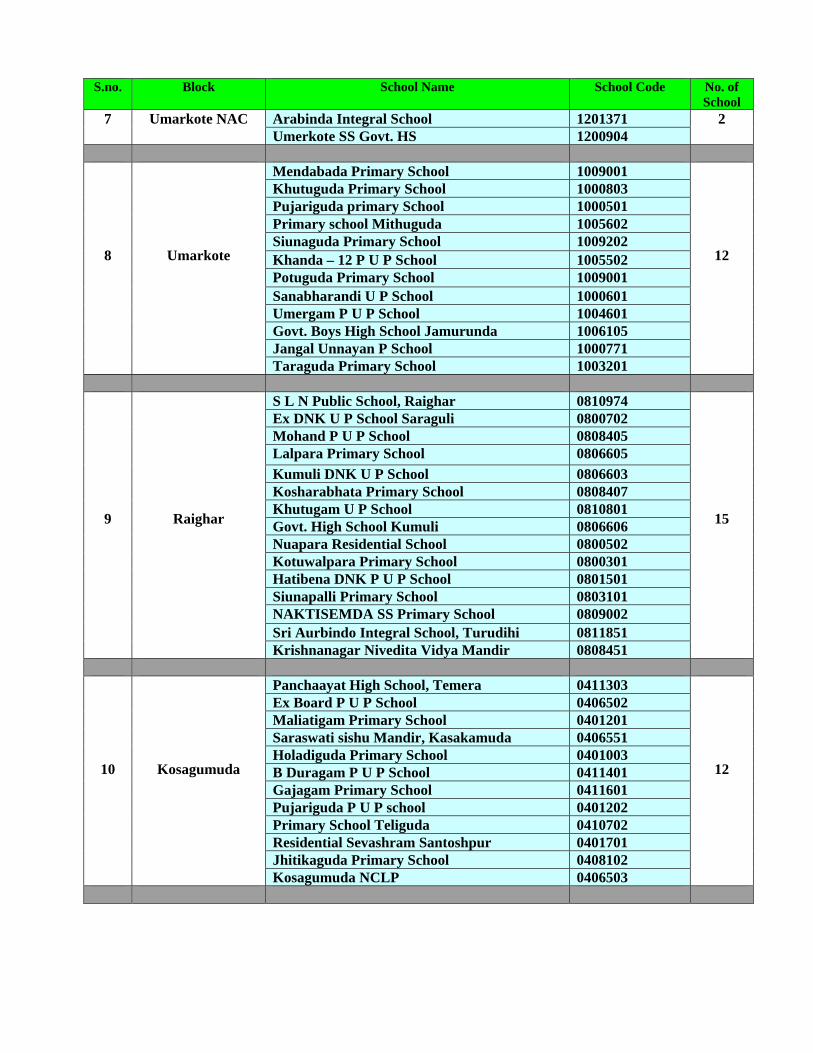
S.no. Block School Name School Code No. of School
7 Umarkote NAC Arabinda Integral School 1201371 2 Umerkote SS Govt. HS 1200904
8
Umarkote
Mendabada Primary School 1009001
12
Khutuguda Primary School 1000803 Pujariguda primary School 1000501 Primary school Mithuguda 1005602 Siunaguda Primary School 1009202 Khanda – 12 P U P School 1005502 Potuguda Primary School 1009001 Sanabharandi U P School 1000601 Umergam P U P School 1004601 Govt. Boys High School Jamurunda 1006105 Jangal Unnayan P School 1000771 Taraguda Primary School 1003201
9
Raighar
S L N Public School, Raighar 0810974
15
Ex DNK U P School Saraguli 0800702 Mohand P U P School 0808405 Lalpara Primary School 0806605 Kumuli DNK U P School 0806603 Kosharabhata Primary School 0808407 Khutugam U P School 0810801 Govt. High School Kumuli 0806606 Nuapara Residential School 0800502 Kotuwalpara Primary School 0800301 Hatibena DNK P U P School 0801501 Siunapalli Primary School 0803101 NAKTISEMDA SS Primary School 0809002 Sri Aurbindo Integral School, Turudihi 0811851 Krishnanagar Nivedita Vidya Mandir 0808451
10
Kosagumuda
Panchaayat High School, Temera 0411303
12
Ex Board P U P School 0406502 Maliatigam Primary School 0401201 Saraswati sishu Mandir, Kasakamuda 0406551 Holadiguda Primary School 0401003 B Duragam P U P School 0411401 Gajagam Primary School 0411601 Pujariguda P U P school 0401202 Primary School Teliguda 0410702 Residential Sevashram Santoshpur 0401701 Jhitikaguda Primary School 0408102 Kosagumuda NCLP 0406503
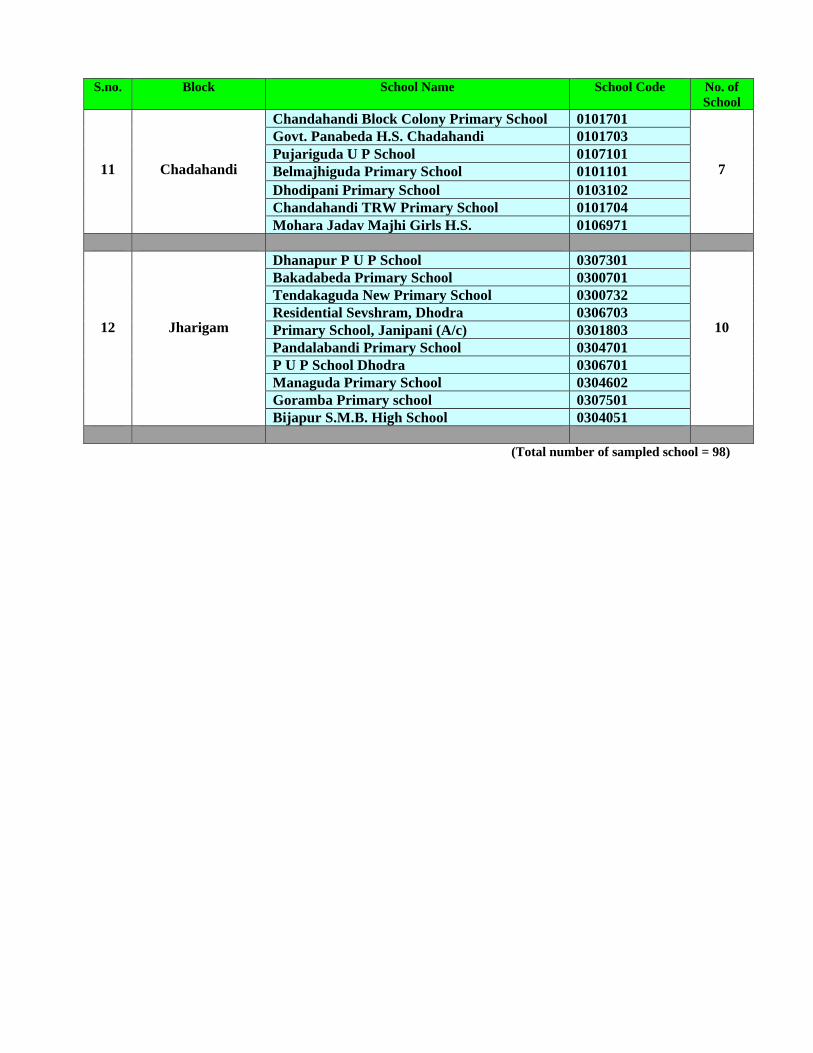
S.no. Block School Name School Code No. of School
11
Chadahandi
Chandahandi Block Colony Primary School 0101701
7
Govt. Panabeda H.S. Chadahandi 0101703 Pujariguda U P School 0107101 Belmajhiguda Primary School 0101101 Dhodipani Primary School 0103102 Chandahandi TRW Primary School 0101704 Mohara Jadav Majhi Girls H.S. 0106971
12
Jharigam
Dhanapur P U P School 0307301
10
Bakadabeda Primary School 0300701 Tendakaguda New Primary School 0300732 Residential Sevshram, Dhodra 0306703 Primary School, Janipani (A/c) 0301803 Pandalabandi Primary School 0304701 P U P School Dhodra 0306701 Managuda Primary School 0304602 Goramba Primary school 0307501 Bijapur S.M.B. High School 0304051
(Total number of sampled school = 98)

District – Malkangiri S.no. Block School Name School Code No. of
School 1 Balimela NAC Durg Line Upper Primary School 0800751 1
2
Mathili
Nuaguda Block Colony Primary School 0607806
14
Guruguda Primary School 0602201 P.U.P. Dalapatiguda 0603601 Sarada put U P School 0602101 Hatiram Guru Vidya Mandir, Pangam 0609651 Primary School Ramaguda 0603201 Primary school, Burutiguda 0600301 Sindhaguda U G M E School 0602203 Nuaguda NCLP 0602202 Nayakguda N P school 0602102 T O M E School Mathili 0607807 Primary Sevashram School, Madakamiguda 0600501 U G M E School, Talasahi 0607808 Ex Board Primary School 0607802
3
Podia
MV 59 Project U P S 0701302
8
Motumguda U P S 0703603 Nabin Ch. High School, Gathanpalli 0700204 Itaguada N P School 0700202 MPV 67 Primary School 0700103 Block Colony Primary School 0703601 MV 58 Primary School 0700203 Govt. High School 0703606
4
Khairput
Lamtaguda Projrct U P School 0204701
7
Kumarput Primary School 0203602 Govt. High School, Khirput 0203501 Dantipada Primary School 0205101 Residential Sevashram, Khairput 0203502 Sargiguda New Primary school 0204001 Upperput Primary School 0204001
5
Kalimela
MV 66 N U P School 0103203
15
Potakhal Primary School 0103602 Ambaguda Primary School 0104201 Potakhal Colony Primary School 0103603 MV 23 P U P School 0103601 MV 31 P U P School 0104202 MV 69 P U P School 0104310 Block Colony P U P School 0104302 Pusuguda Nodal Primary School 0104312 Primary Sevashram, Kalimela 0104306 MV 90 Projrct U P School 0104211 MV 35 New Primary School 0104309 Hatapadasahi N P S 0104305 Kalimela Colony P S 0104307 Firm Colony New Primary School 0104304
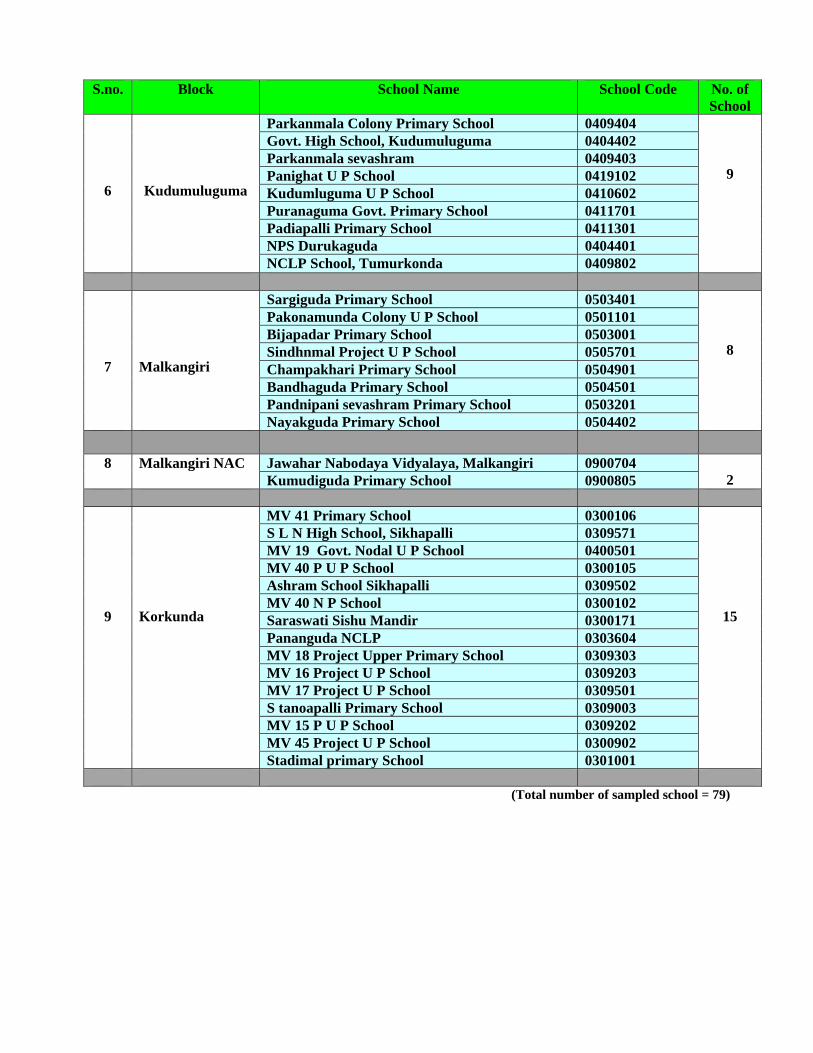
S.no. Block School Name School Code No. of School
6
Kudumuluguma
Parkanmala Colony Primary School 0409404
9
Govt. High School, Kudumuluguma 0404402 Parkanmala sevashram 0409403 Panighat U P School 0419102 Kudumluguma U P School 0410602 Puranaguma Govt. Primary School 0411701 Padiapalli Primary School 0411301 NPS Durukaguda 0404401 NCLP School, Tumurkonda 0409802
7
Malkangiri
Sargiguda Primary School 0503401
8
Pakonamunda Colony U P School 0501101 Bijapadar Primary School 0503001 Sindhnmal Project U P School 0505701 Champakhari Primary School 0504901 Bandhaguda Primary School 0504501 Pandnipani sevashram Primary School 0503201 Nayakguda Primary School 0504402
8 Malkangiri NAC Jawahar Nabodaya Vidyalaya, Malkangiri 0900704
2 Kumudiguda Primary School 0900805
9
Korkunda
MV 41 Primary School 0300106
15
S L N High School, Sikhapalli 0309571 MV 19 Govt. Nodal U P School 0400501 MV 40 P U P School 0300105 Ashram School Sikhapalli 0309502 MV 40 N P School 0300102 Saraswati Sishu Mandir 0300171 Pananguda NCLP 0303604 MV 18 Project Upper Primary School 0309303 MV 16 Project U P School 0309203 MV 17 Project U P School 0309501 S tanoapalli Primary School 0309003 MV 15 P U P School 0309202 MV 45 Project U P School 0300902 Stadimal primary School 0301001
(Total number of sampled school = 79)

(Annexure – C.1)
Orissa Primary Education Programme Authority District Information System for Education Special DCF for Post Enumeration Survey
Academic Year School Code District Code A. School Location Particulars
1. Village Name / Ward No. _____________________________________________ 2. Block /Municipality/ NAC Name _______________________________________
3. Rural / Urban (1/2)
4. School pre dominantly located in SC (1) / ST (2) / Minority (3)/ Others area (4)
B. School Particulars 1. School Name ____________________________________________________
2. Year of Establishment of School
3. School Category Primary (1)/ Primary with upper primary (2)/ Upgraded to class VIII/IX under SSA (2.1)/ Primary with Upper Primary and Secondary or Higher Secondary (3)/ Upper Primary Only (4) /Upper Primary with Secondary or Higher Secondary (5)/ Secondary only (6)/ Secondary with Higher Secondary (7)/ Sri Aurobinda institute of integral education (8)/ Others(9)
4. Type of School School for Boys only (1) /School for Girls only (2)/ Co-educational (3)
5. Lowest class in the school
6. Highest class in the school Primary Upper primary Secondary 7. Total Student 8. Total SC Students in Classes 9. Total ST Students in Classes 10. Total Students with disabilities
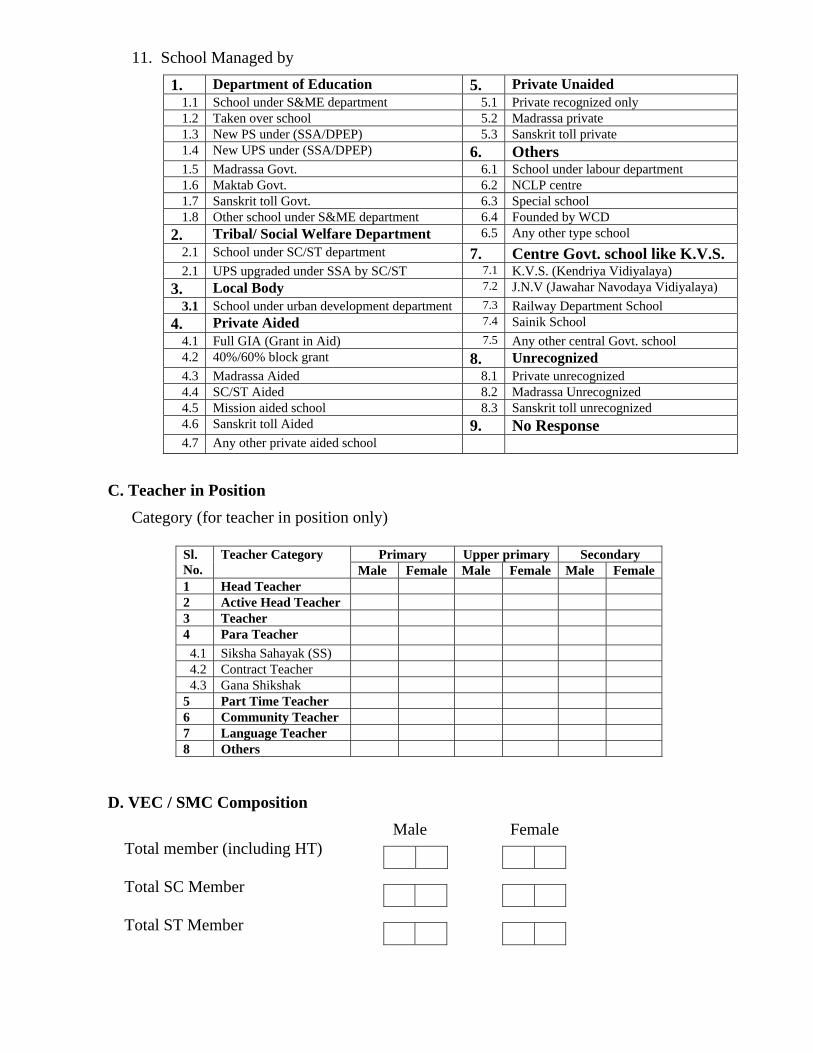
11. School Managed by
1. Department of Education 5. Private Unaided 1.1 School under S&ME department 5.1 Private recognized only 1.2 Taken over school 5.2 Madrassa private 1.3 New PS under (SSA/DPEP) 5.3 Sanskrit toll private 1.4 New UPS under (SSA/DPEP) 6. Others 1.5 Madrassa Govt. 6.1 School under labour department 1.6 Maktab Govt. 6.2 NCLP centre 1.7 Sanskrit toll Govt. 6.3 Special school 1.8 Other school under S&ME department 6.4 Founded by WCD
2. Tribal/ Social Welfare Department 6.5 Any other type school 2.1 School under SC/ST department 7. Centre Govt. school like K.V.S. 2.1 UPS upgraded under SSA by SC/ST 7.1 K.V.S. (Kendriya Vidiyalaya)
3. Local Body 7.2 J.N.V (Jawahar Navodaya Vidiyalaya) 3.1 School under urban development department 7.3 Railway Department School
4. Private Aided 7.4 Sainik School 4.1 Full GIA (Grant in Aid) 7.5 Any other central Govt. school 4.2 40%/60% block grant 8. Unrecognized 4.3 Madrassa Aided 8.1 Private unrecognized 4.4 SC/ST Aided 8.2 Madrassa Unrecognized 4.5 Mission aided school 8.3 Sanskrit toll unrecognized 4.6 Sanskrit toll Aided 9. No Response 4.7 Any other private aided school
C. Teacher in Position Category (for teacher in position only)
D. VEC / SMC Composition Male Female Total member (including HT) Total SC Member Total ST Member
Sl. No.
Teacher Category Primary Upper primary Secondary Male Female Male Female Male Female
1 Head Teacher 2 Active Head Teacher 3 Teacher 4 Para Teacher
4.1 Siksha Sahayak (SS) 4.2 Contract Teacher 4.3 Gana Shikshak
5 Part Time Teacher 6 Community Teacher 7 Language Teacher 8 Others
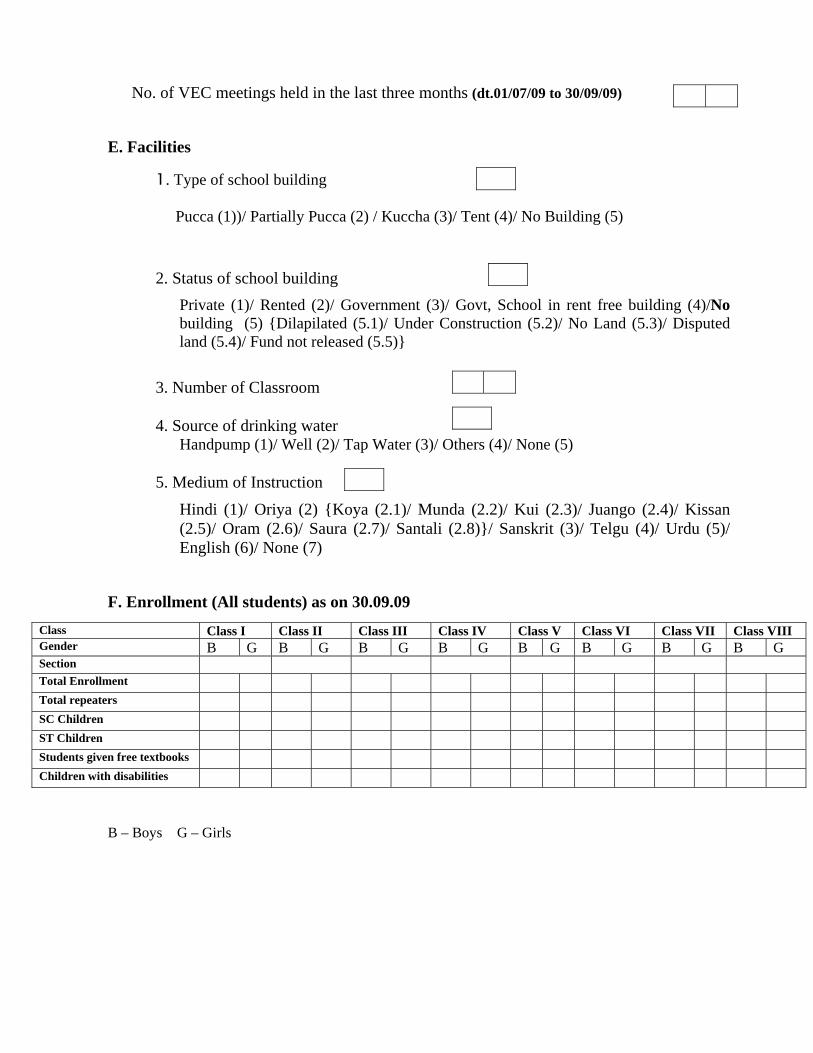
No. of VEC meetings held in the last three months (dt.01/07/09 to 30/09/09)
E. Facilities
1. Type of school building Pucca (1))/ Partially Pucca (2) / Kuccha (3)/ Tent (4)/ No Building (5)
2. Status of school building Private (1)/ Rented (2)/ Government (3)/ Govt, School in rent free building (4)/No
building (5) {Dilapilated (5.1)/ Under Construction (5.2)/ No Land (5.3)/ Disputed land (5.4)/ Fund not released (5.5)}
3. Number of Classroom 4. Source of drinking water Handpump (1)/ Well (2)/ Tap Water (3)/ Others (4)/ None (5) 5. Medium of Instruction
Hindi (1)/ Oriya (2) {Koya (2.1)/ Munda (2.2)/ Kui (2.3)/ Juango (2.4)/ Kissan (2.5)/ Oram (2.6)/ Saura (2.7)/ Santali (2.8)}/ Sanskrit (3)/ Telgu (4)/ Urdu (5)/ English (6)/ None (7)
F. Enrollment (All students) as on 30.09.09
B – Boys G – Girls
Class Class I Class II Class III Class IV Class V Class VI Class VII Class VIII Gender B G B G B G B G B G B G B G B G Section Total Enrollment Total repeaters SC Children ST Children Students given free textbooks Children with disabilities

(Annexure – C.2)
Investigator’s Feedback Schedule
School Code
1. Date of visit to the school: ______________________ 2. Was the school open on the day of the visit? Yes No 3. If no when was the school visited second time (Date) ________________
4. Was the school open on the second visit? Yes No (In case the school was closed on both the days, contact the supervisor for replacement of the school to be surveyed. Replacement should be resorted only in exceptional cases.) 5. Attribute/s pertaining to the Principal (P) Head Teacher (HT) and the investigator:
Attribute Responses from the school Very good Good Average Poor Very poor
Initial reaction of the P/HT Response of the P/HT to provide information Availability of records Condition of records maintained Updation of records maintained
6. Children enrolled/ attending School on the day of the Survey (Date. __________)
Class Enrollment Attendance Attendance (MDM) Total SC ST Total SC ST Total SC ST
B G B G B G B G B G B G B G B G B G Class I Class II Class III Class IV Class V Class VI Class VII Class VIII
B: Boys G: Girls
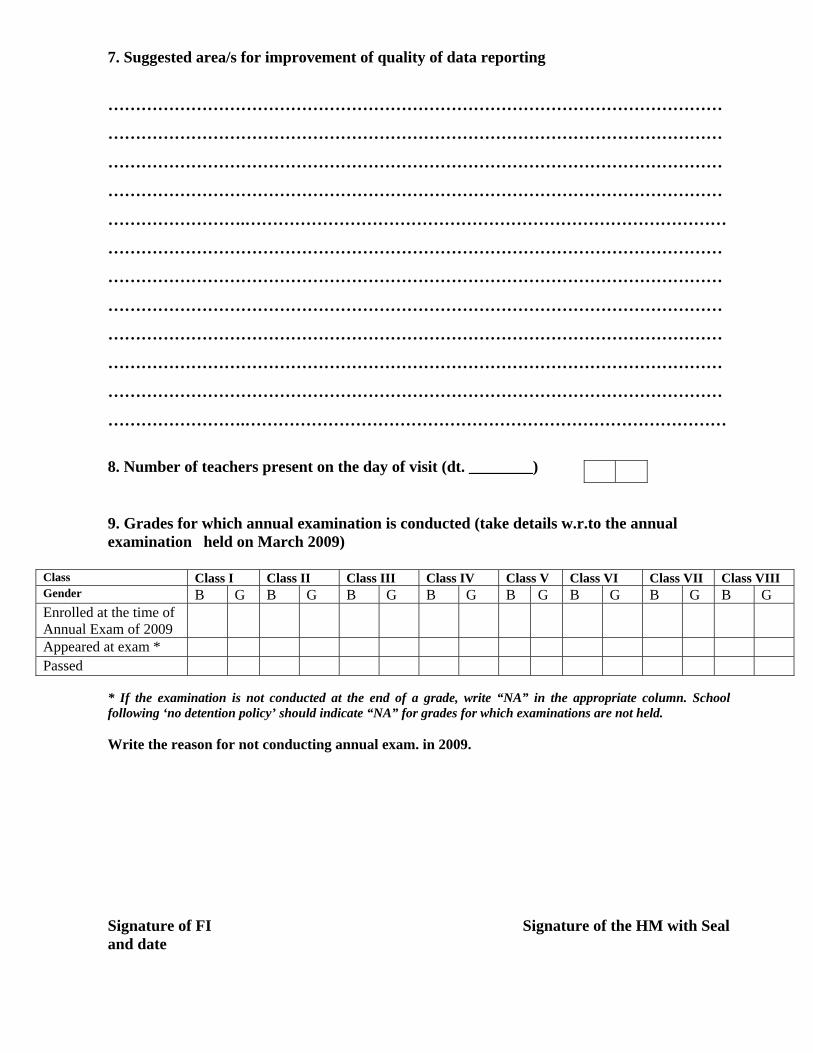
7. Suggested area/s for improvement of quality of data reporting
…………………………………………………………………………………………………
…………………………………………………………………………………………………
…………………………………………………………………………………………………
…………………………………………………………………………………………………
…………………….……………………………………………………………………………
…………………………………………………………………………………………………
…………………………………………………………………………………………………
…………………………………………………………………………………………………
…………………………………………………………………………………………………
…………………………………………………………………………………………………
…………………………………………………………………………………………………
…………………….……………………………………………………………………………
8. Number of teachers present on the day of visit (dt. ________) 9. Grades for which annual examination is conducted (take details w.r.to the annual examination held on March 2009)
Class Class I Class II Class III Class IV Class V Class VI Class VII Class VIII Gender B G B G B G B G B G B G B G B G Enrolled at the time of Annual Exam of 2009
Appeared at exam * Passed
* If the examination is not conducted at the end of a grade, write “NA” in the appropriate column. School following ‘no detention policy’ should indicate “NA” for grades for which examinations are not held. Write the reason for not conducting annual exam. in 2009. Signature of FI Signature of the HM with Seal and date
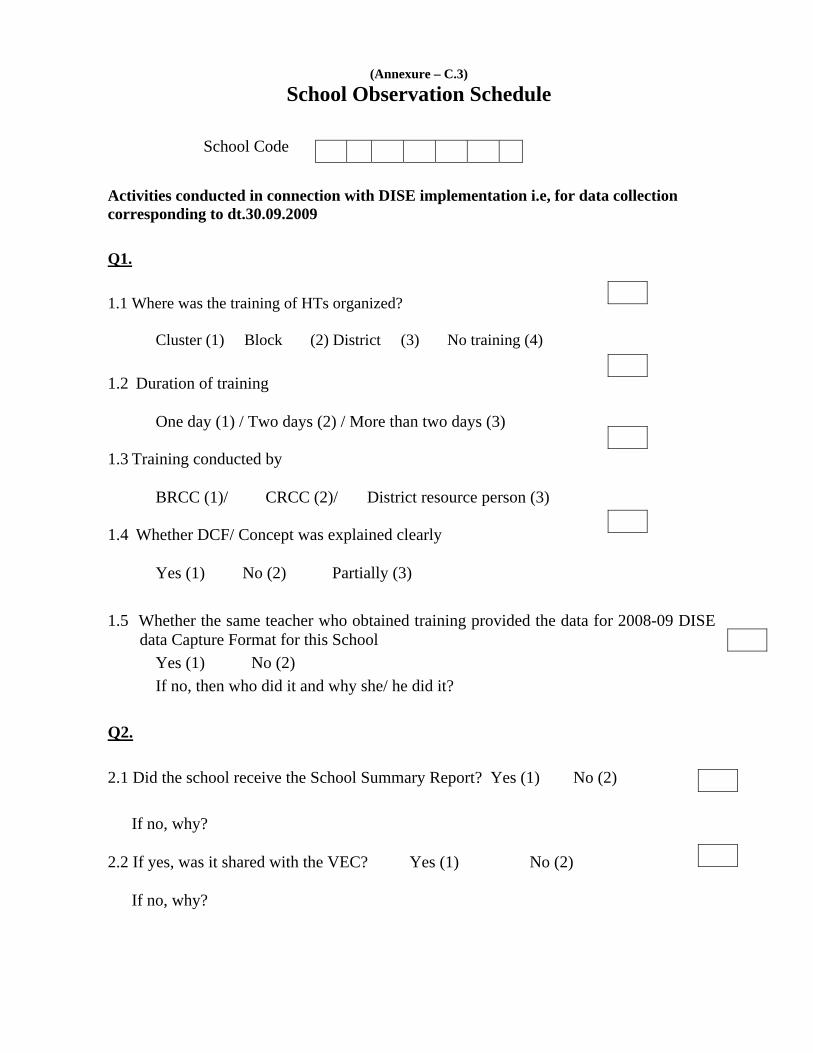
(Annexure – C.3)
School Observation Schedule School Code Activities conducted in connection with DISE implementation i.e, for data collection corresponding to dt.30.09.2009
Q1. 1.1 Where was the training of HTs organized?
Cluster (1) Block (2) District (3) No training (4) 1.2 Duration of training
One day (1) / Two days (2) / More than two days (3) 1.3 Training conducted by BRCC (1)/ CRCC (2)/ District resource person (3) 1.4 Whether DCF/ Concept was explained clearly Yes (1) No (2) Partially (3) 1.5 Whether the same teacher who obtained training provided the data for 2008-09 DISE data Capture Format for this School Yes (1) No (2) If no, then who did it and why she/ he did it? Q2. 2.1 Did the school receive the School Summary Report? Yes (1) No (2) If no, why? 2.2 If yes, was it shared with the VEC? Yes (1) No (2) If no, why?

2.3 Did the school summary report reflect the real situation in the school? Yes (1) No (2) If no, which items are not properly / correctly reflected in the report? Find out the reason for not reflecting correctly. Q3. 3.1 No. of visits by CRC coordinator to the school in the last three months July 09 August 09 September 09 Total 3.2 No. of teachers who received in-service training under SSA and DPEP in 2008-09. Q4. Did the school have the DISE format with filled in data of 2009-10?
Yes (1) No (2) If no, why? Q5. 5.1 Does the school have a school display board? Yes (1) No (2) If yes, does the school display board have data on Yes (1) No (2) Students’ enrollment
Students’ daily attendance
Teachers’ in position Grants received