5 Liver Fibrosis Assessment Dr. V.G. Mohanprasad
61
DR. V.G.MOHAN PRASAD, M.D., D.M., (GASTRO) PAST PRESIDENT OF INDIAN SOCIETY OF GASTROENTEROLOGY PAST PRESIDENT, SGEI ADJUNCT PROFESSOR TAMIL NADU DR.MGR MEDICAL UNIVERSITY CHAIRMAN VGM HOSPITAL - INSTITUTE OF GASTROENTEROLOGY COIMBATORE
-
Upload
rrsolution -
Category
Health & Medicine
-
view
93 -
download
0
Transcript of 5 Liver Fibrosis Assessment Dr. V.G. Mohanprasad
DR. V.G.MOHAN PRASAD, M.D., D.M., (GASTRO)
PAST PRESIDENT OF INDIAN SOCIETY OF GASTROENTEROLOGY
PAST PRESIDENT, SGEI
ADJUNCT PROFESSOR TAMIL NADU DR.MGR MEDICAL UNIVERSITY
CHAIRMAN
VGM HOSPITAL - INSTITUTE OF GASTROENTEROLOGY
COIMBATORE
Why do we need to assess fibrosis?
Prognosis becomes worse
F1-------F4
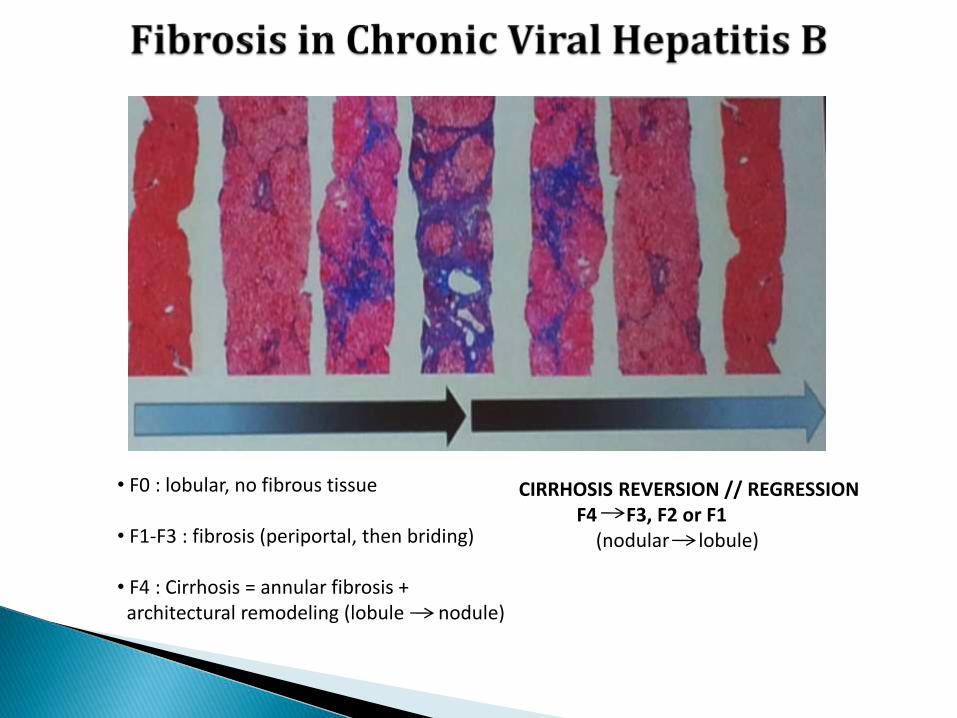
• F0 : lobular, no fibrous tissue
• F1-F3 : fibrosis (periportal, then briding)
• F4 : Cirrhosis = annular fibrosis + architectural remodeling (lobule nodule)
CIRRHOSIS REVERSION // REGRESSIONF4 F3, F2 or F1
(nodular lobule)

Liver biopsy- gold standard
Not always easy
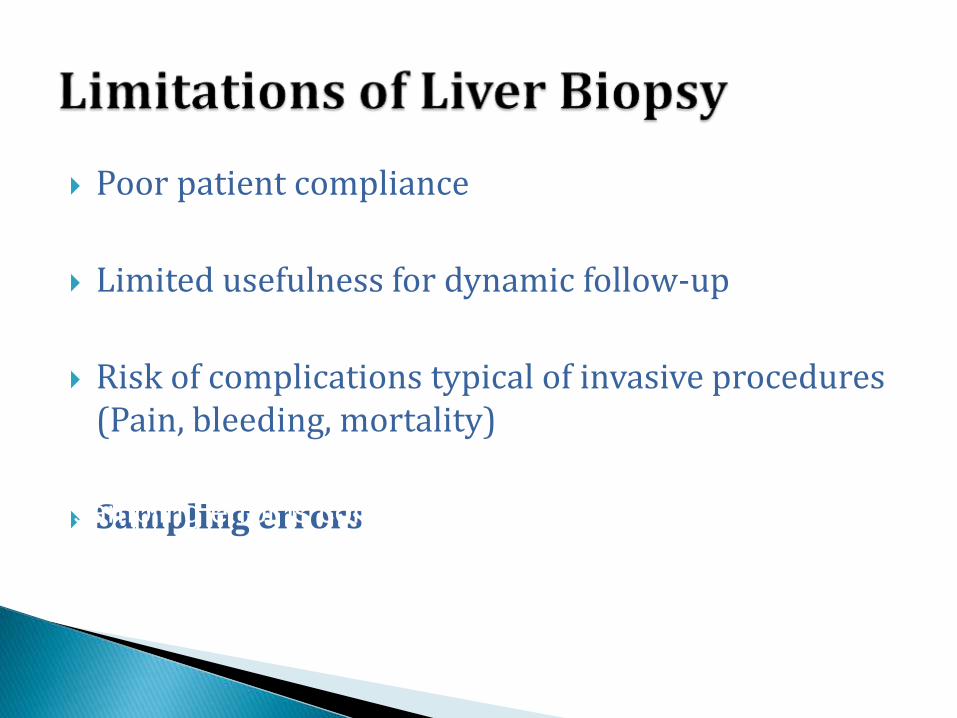
Poor patient compliance
Limited usefulness for dynamic follow-up
Risk of complications typical of invasive procedures (Pain, bleeding, mortality)
Sampling errorssampling error is common because only 1/50,000 of the
organ is analyzed
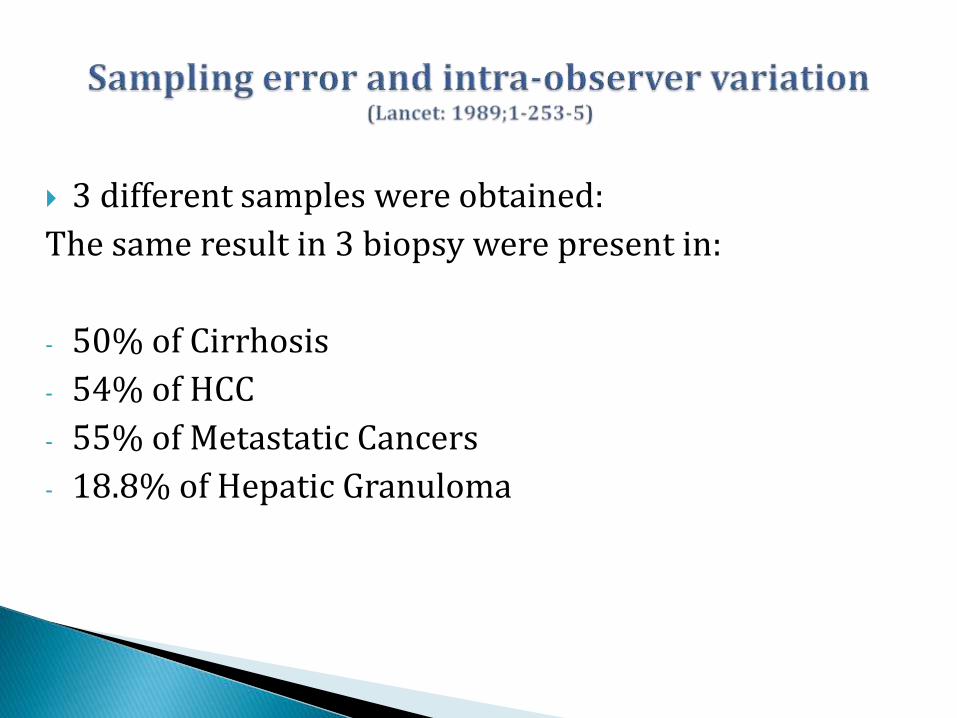
3 different samples were obtained:
The same result in 3 biopsy were present in:
- 50% of Cirrhosis
- 54% of HCC
- 55% of Metastatic Cancers
- 18.8% of Hepatic Granuloma
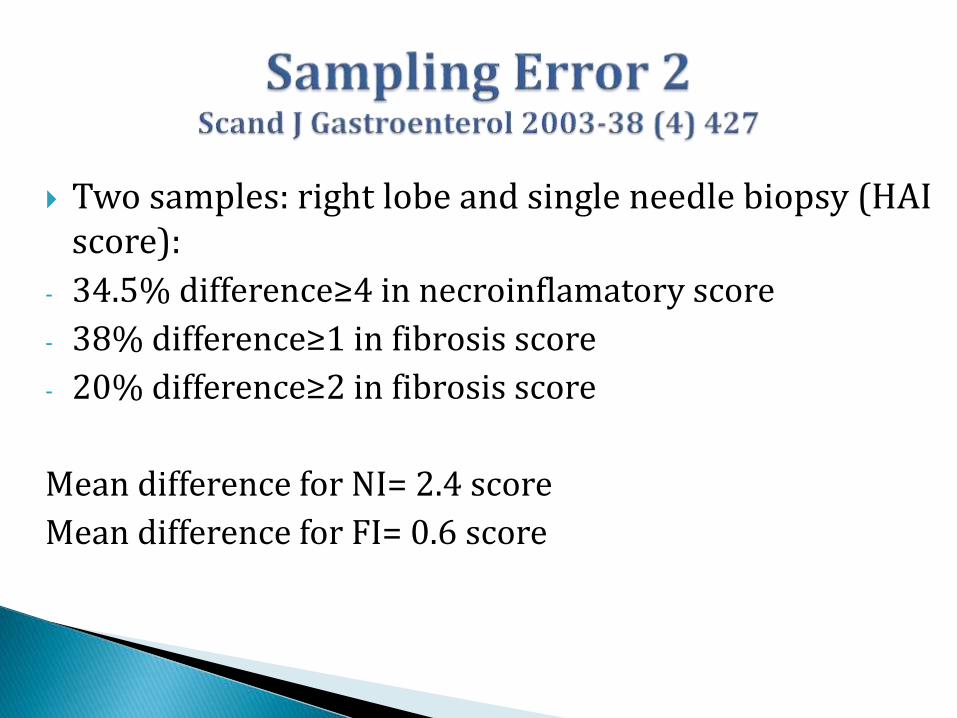
Two samples: right lobe and single needle biopsy (HAI score):
- 34.5% difference≥4 in necroinflamatory score
- 38% difference≥1 in fibrosis score
- 20% difference≥2 in fibrosis score
Mean difference for NI= 2.4 score
Mean difference for FI= 0.6 score
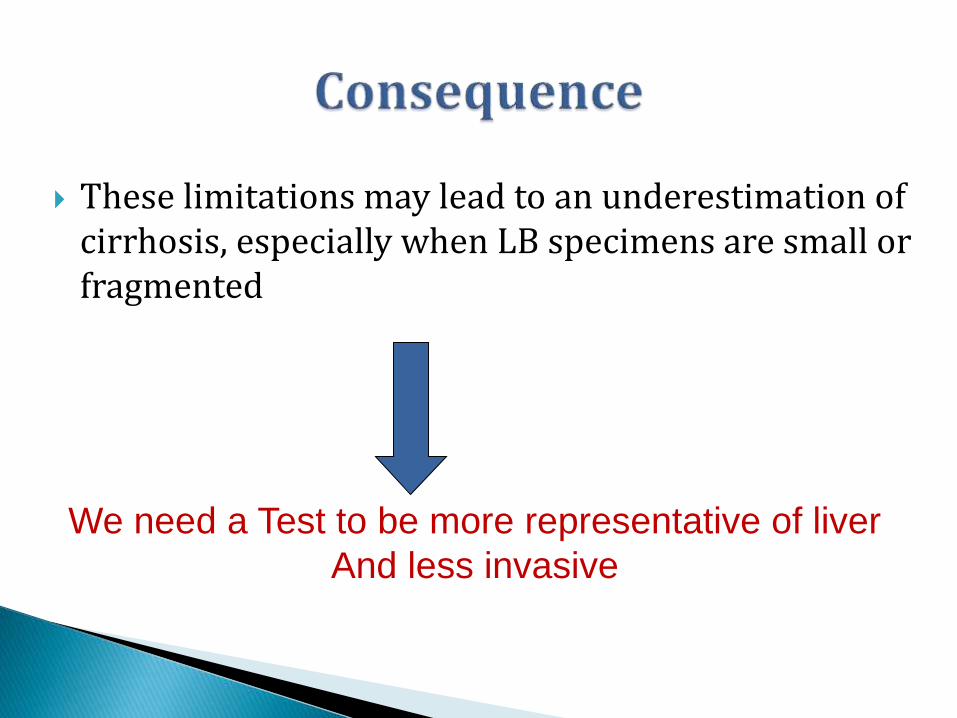
These limitations may lead to an underestimation of cirrhosis, especially when LB specimens are small or fragmented
We need a Test to be more representative of liver
And less invasive

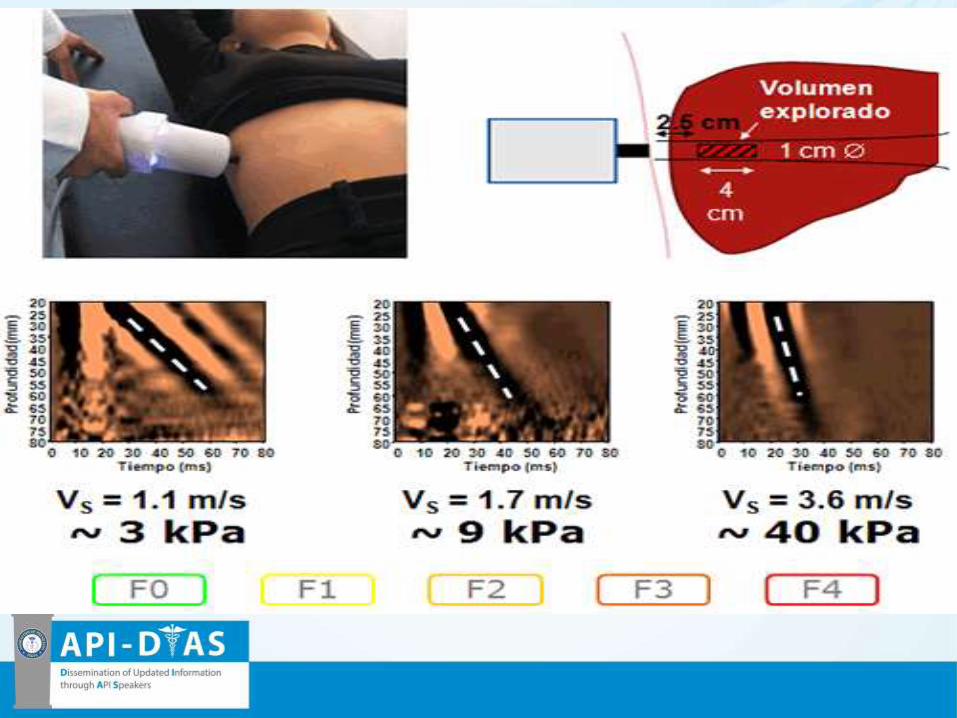
•3.5 MHz ultrasound transmitted from the vibrator toward the tissues •pulse-echo ultrasound acquisitions are performed which is directly related to tissue stiffness. •The harder the tissue, the faster the shear wave propagates•The operator, assisted by ultrasound time-motion images•liver portion at least 6 cm thick and free of large vascular structures•The measurement depth is between 25 and 65 mm below the skin surface
100 times larger than liver biopsy
Sono-elastography that evaluates liver elasticity
Utilizes acoustic waves to interrogate themechanical stiffness of liver
Can be used during standard US examination of liver
Excellent tool
Requires an expensive software
Not available in most centres
Expensive
Excellent in obese
Safe Fast screening Acceptability by patients Longitudinal follow-up Efficacy of therapeutic treatments Prognostic evaluation Excellent Intera and inter observation Accurate
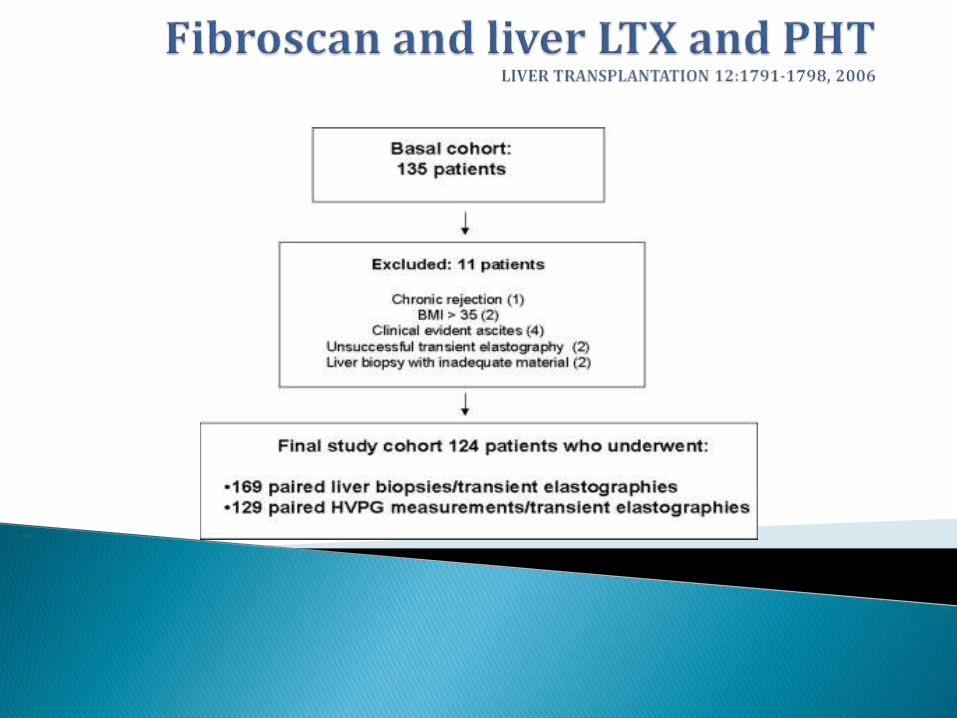
Hepatitis C recurrence is the first cause of graft loss in liver transplantprograms Frequent liver biopsies= Routine follow-up of HCV-infectedpatients after LT
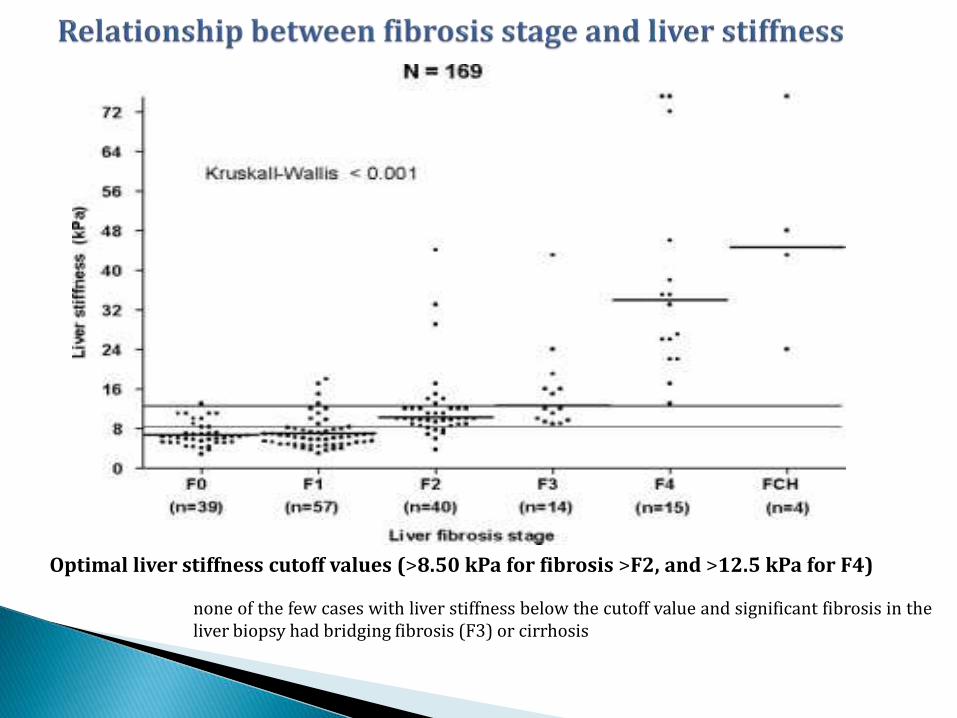
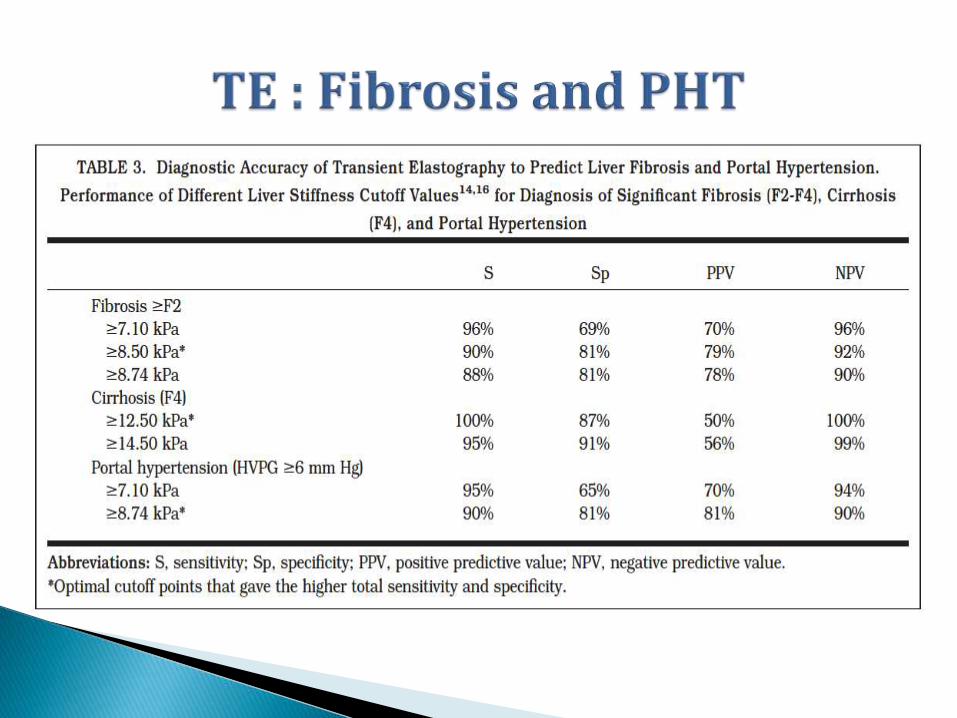
Optimal liver stiffness cutoff values (>8.50 kPa for fibrosis >F2, and >12.5 kPa for F4)
none of the few cases with liver stiffness below the cutoff value and significant fibrosis in theliver biopsy had bridging fibrosis (F3) or cirrhosis
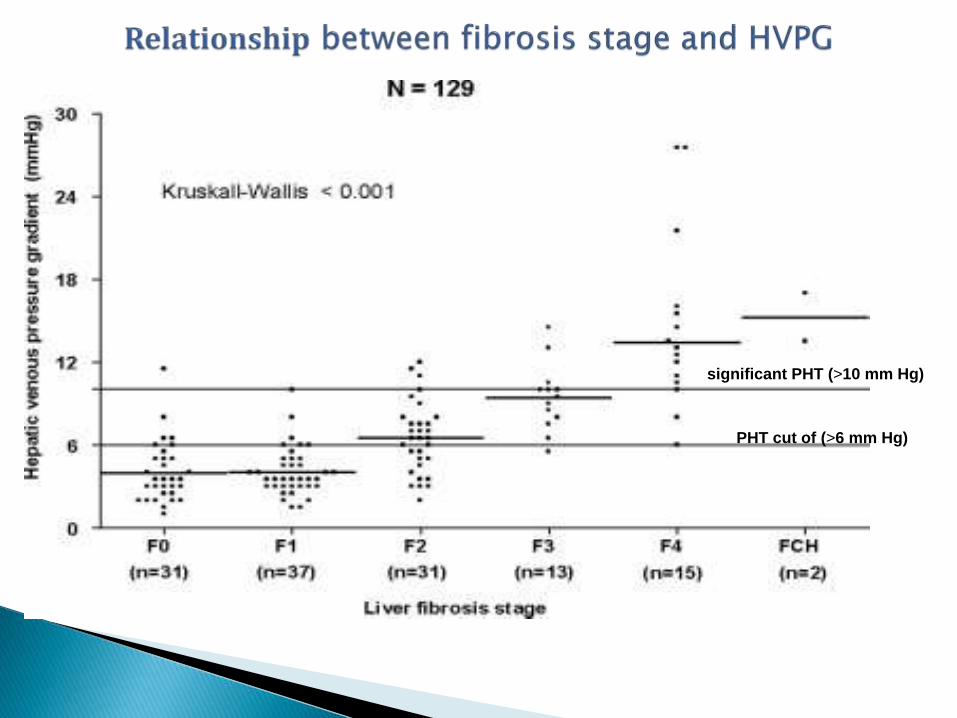
PHT cut of (>6 mm Hg)
significant PHT (>10 mm Hg)
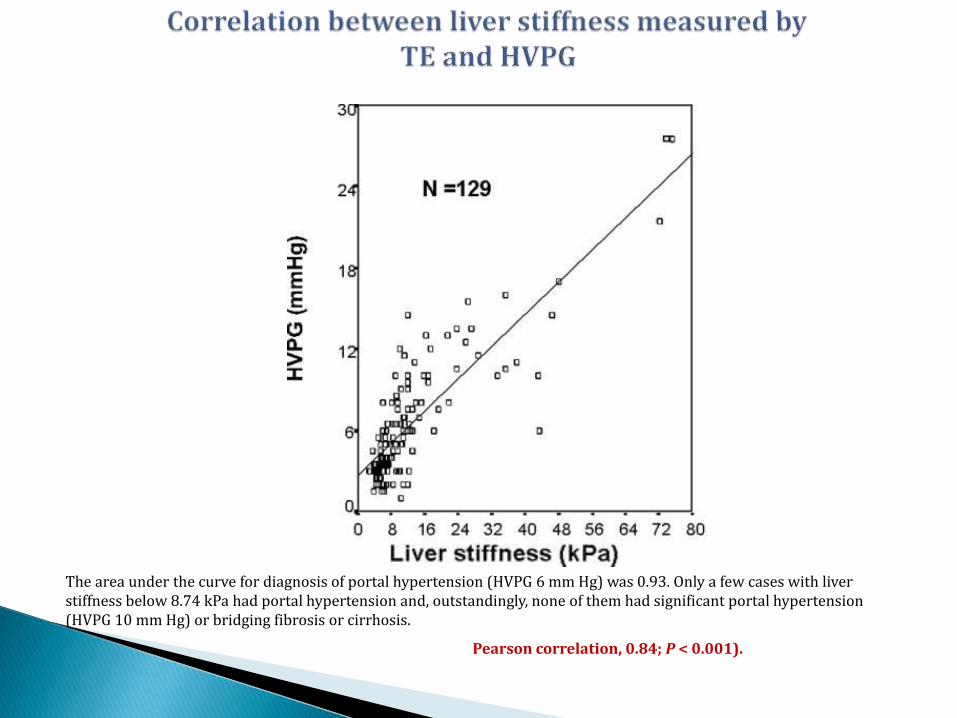
Pearson correlation, 0.84; P < 0.001).
The area under the curve for diagnosis of portal hypertension (HVPG 6 mm Hg) was 0.93. Only a few cases with liverstiffness below 8.74 kPa had portal hypertension and, outstandingly, none of them had significant portal hypertension(HVPG 10 mm Hg) or bridging fibrosis or cirrhosis.
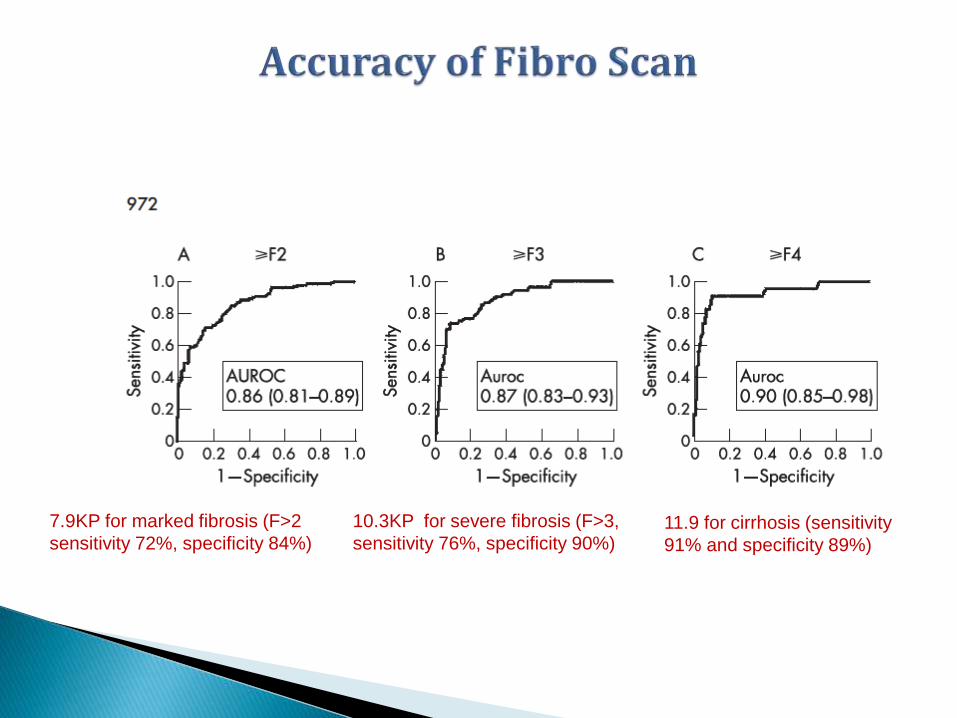
7.9KP for marked fibrosis (F>2
sensitivity 72%, specificity 84%)
10.3KP for severe fibrosis (F>3,
sensitivity 76%, specificity 90%)11.9 for cirrhosis (sensitivity
91% and specificity 89%)
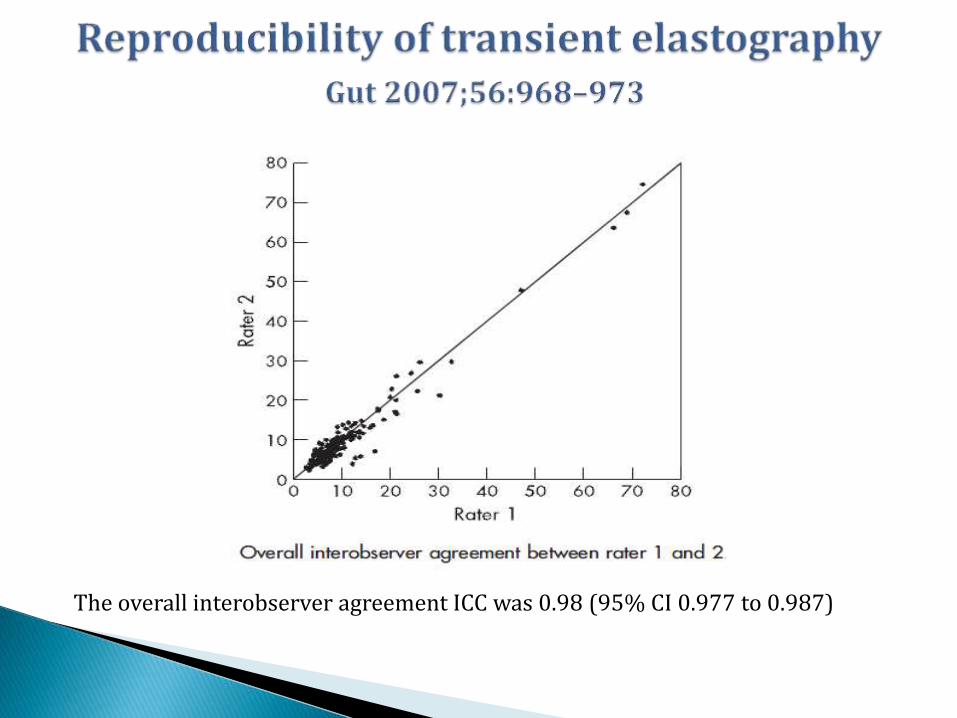
The overall interobserver agreement ICC was 0.98 (95% CI 0.977 to 0.987)
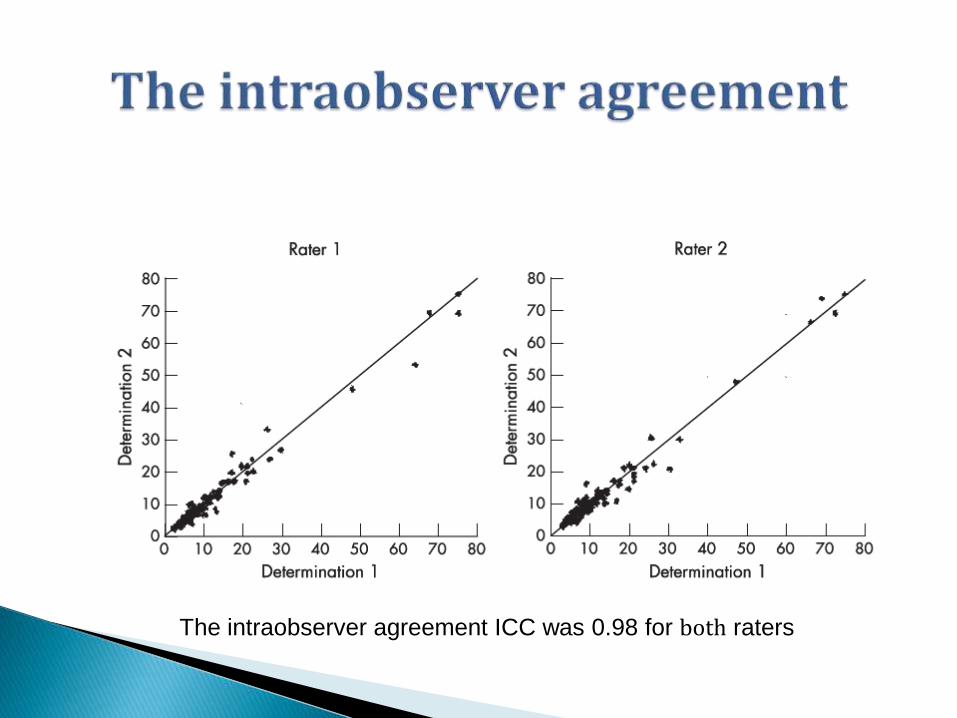
The intraobserver agreement ICC was 0.98 for both raters
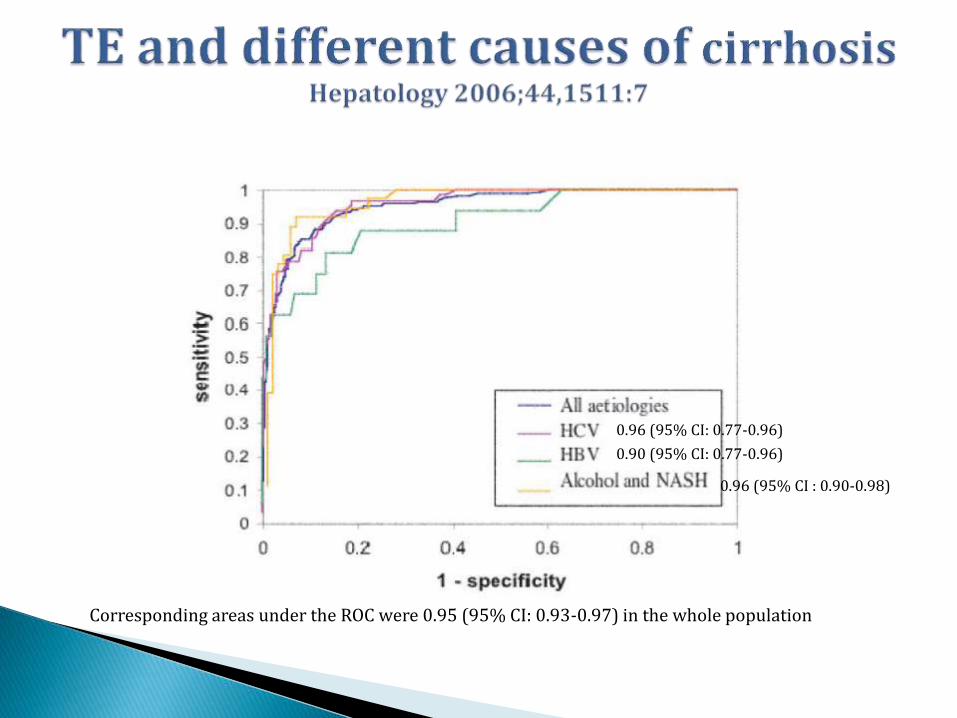
Corresponding areas under the ROC were 0.95 (95% CI: 0.93-0.97) in the whole population
0.96 (95% CI: 0.77-0.96)
0.90 (95% CI: 0.77-0.96)
0.96 (95% CI : 0.90-0.98)
Markedly overweight or obese patients
LS measurement can be influenced by hepatic inflammation (Inacute HAV)
Extra Hepatic cholestasis influences liver stiffness score
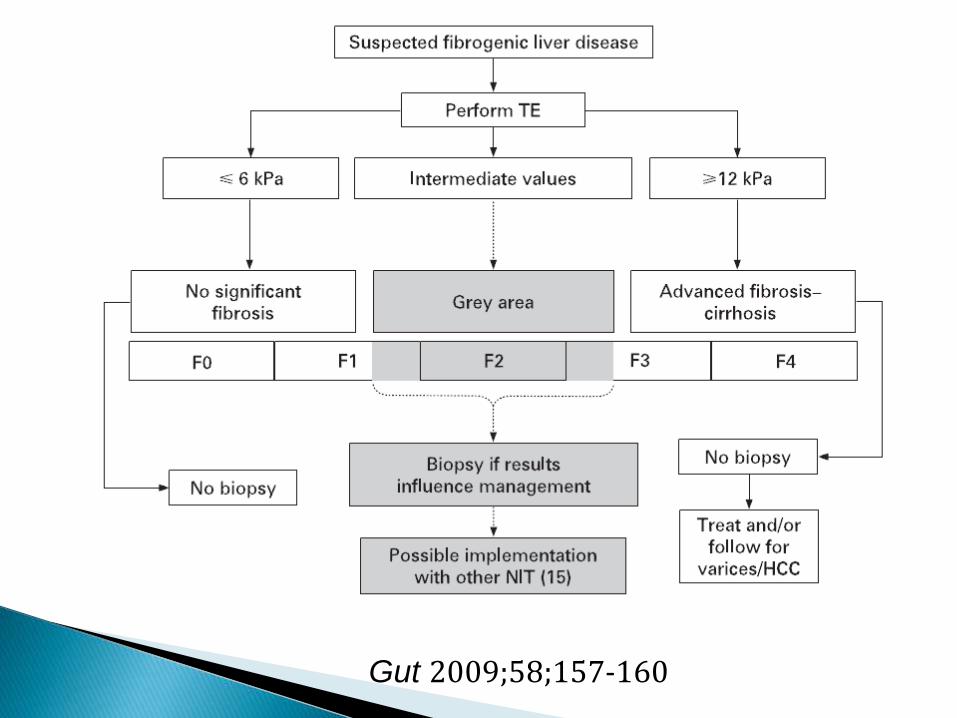
Gut 2009;58;157-160

No Liver biopsy
No Fibroscan
How are they related ?
How do they measure ?
Current status ?
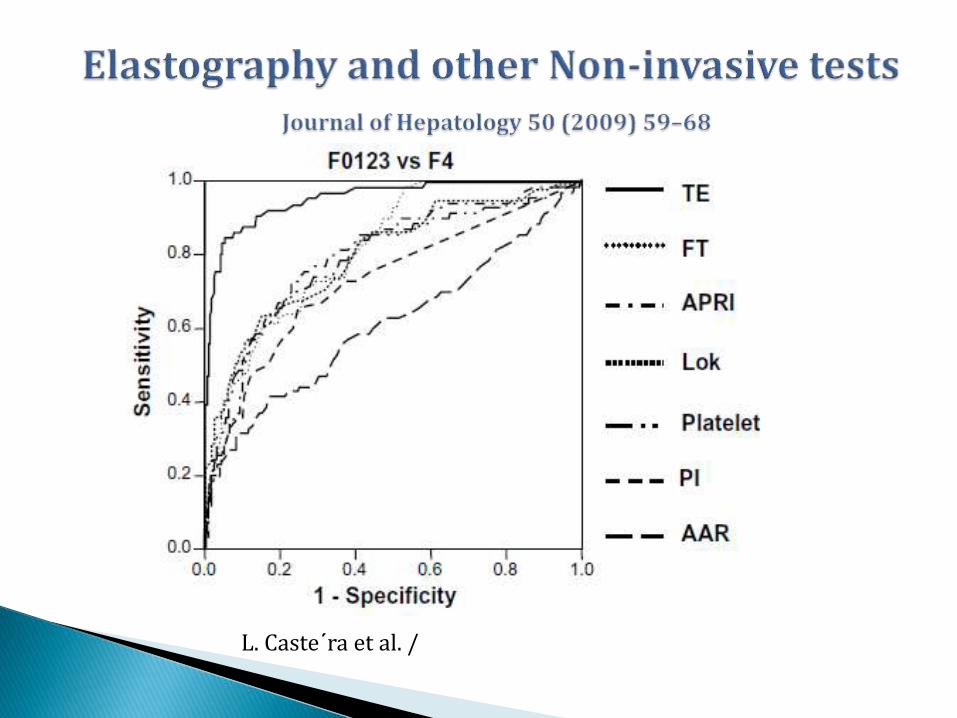
L. Caste´ra et al. /
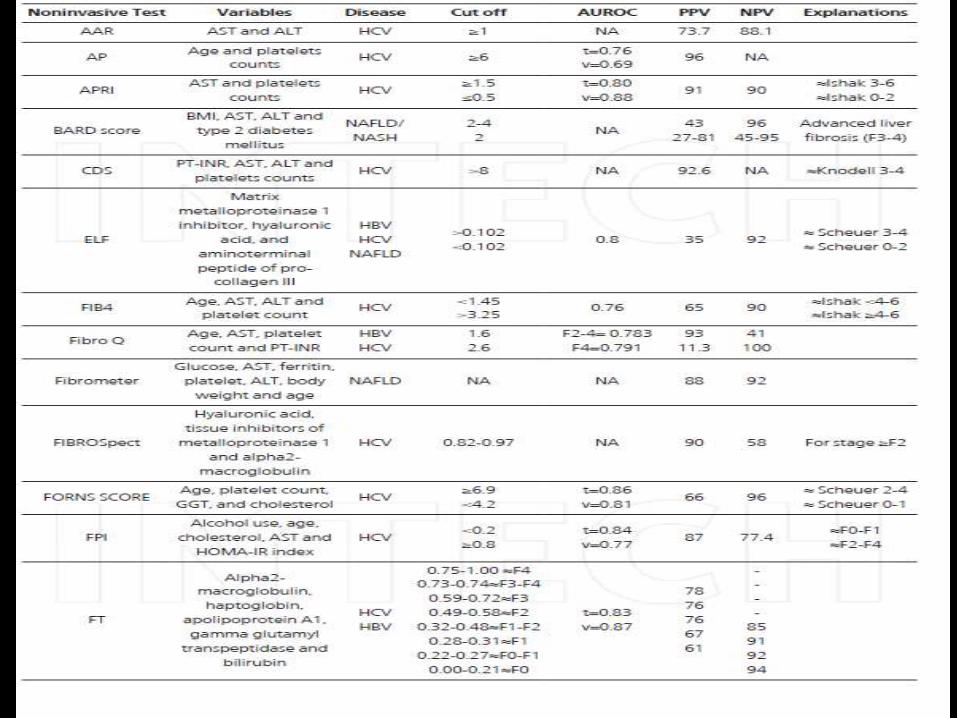
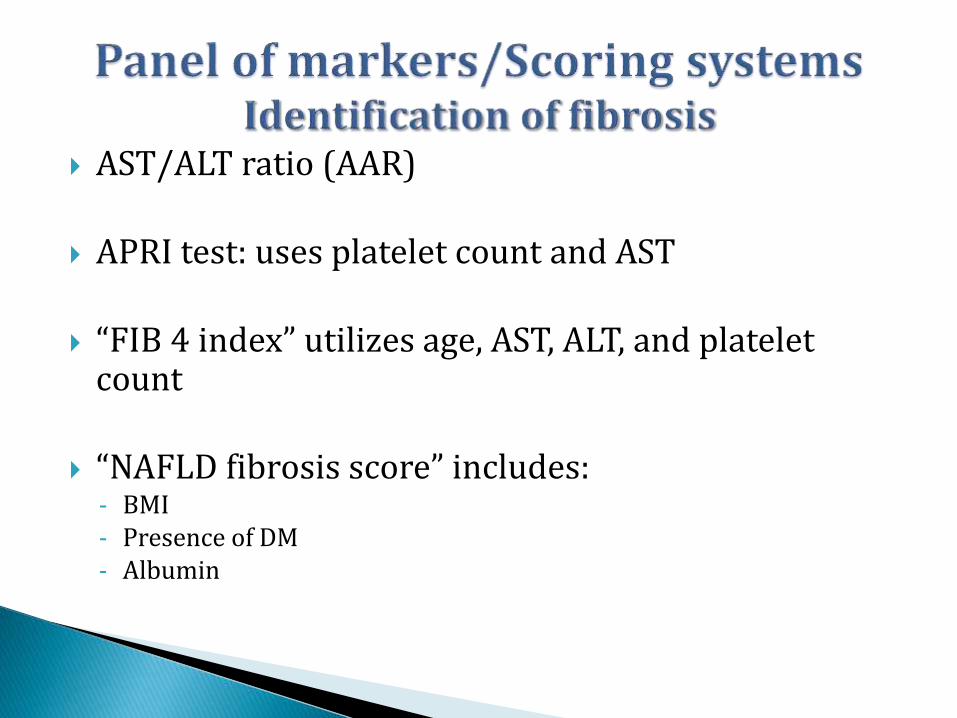
AST/ALT ratio (AAR)
APRI test: uses platelet count and AST
“FIB 4 index” utilizes age, AST, ALT, and platelet count
“NAFLD fibrosis score” includes:- BMI- Presence of DM- Albumin
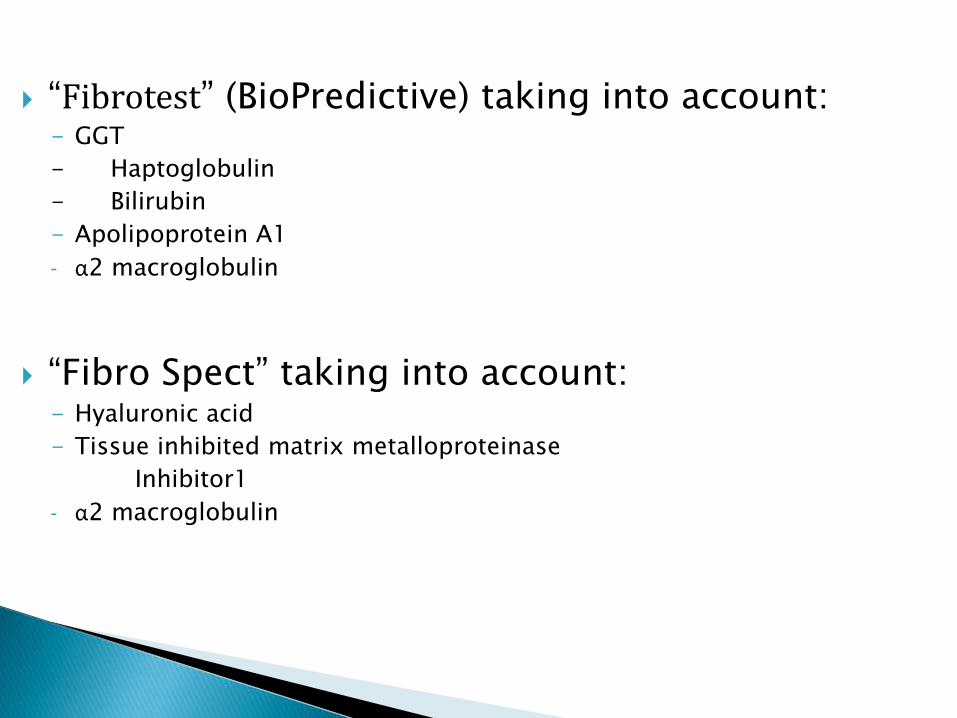
“Fibrotest” (BioPredictive) taking into account:- GGT
- Haptoglobulin
- Bilirubin
- Apolipoprotein A1
- α2 macroglobulin
“Fibro Spect” taking into account:- Hyaluronic acid
- Tissue inhibited matrix metalloproteinase
Inhibitor1
- α2 macroglobulin
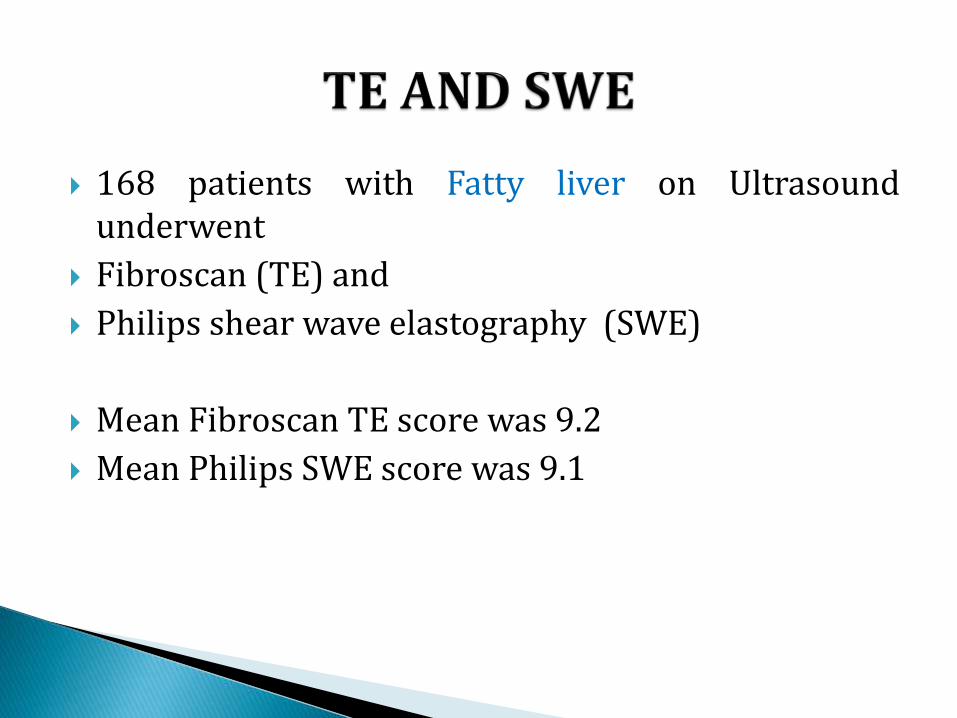
168 patients with Fatty liver on Ultrasoundunderwent
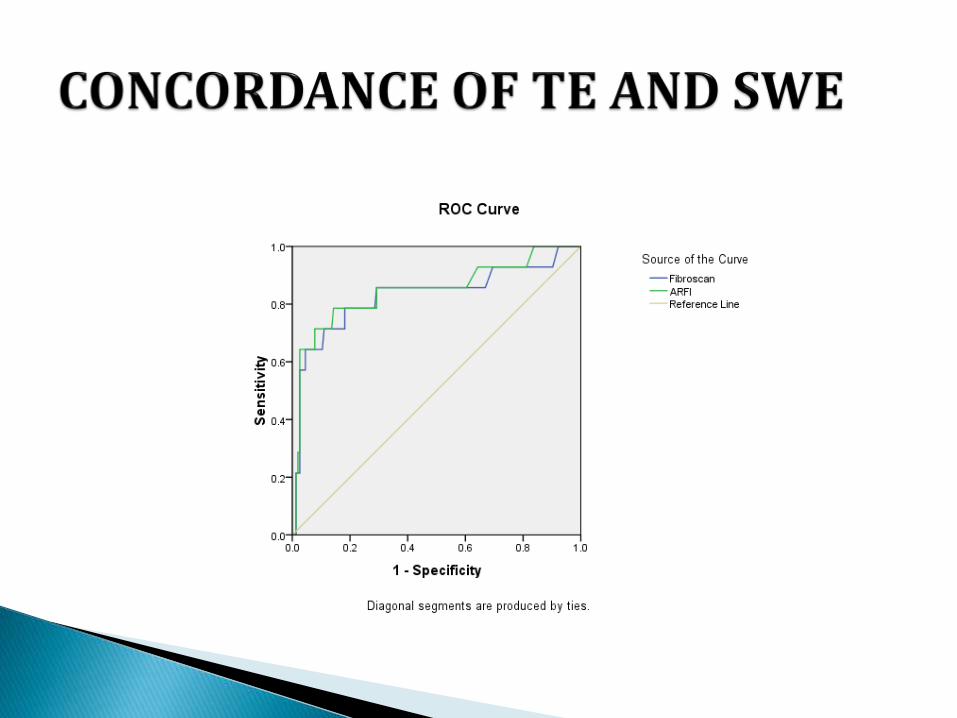
Fibroscan (TE) and
Philips shear wave elastography (SWE)
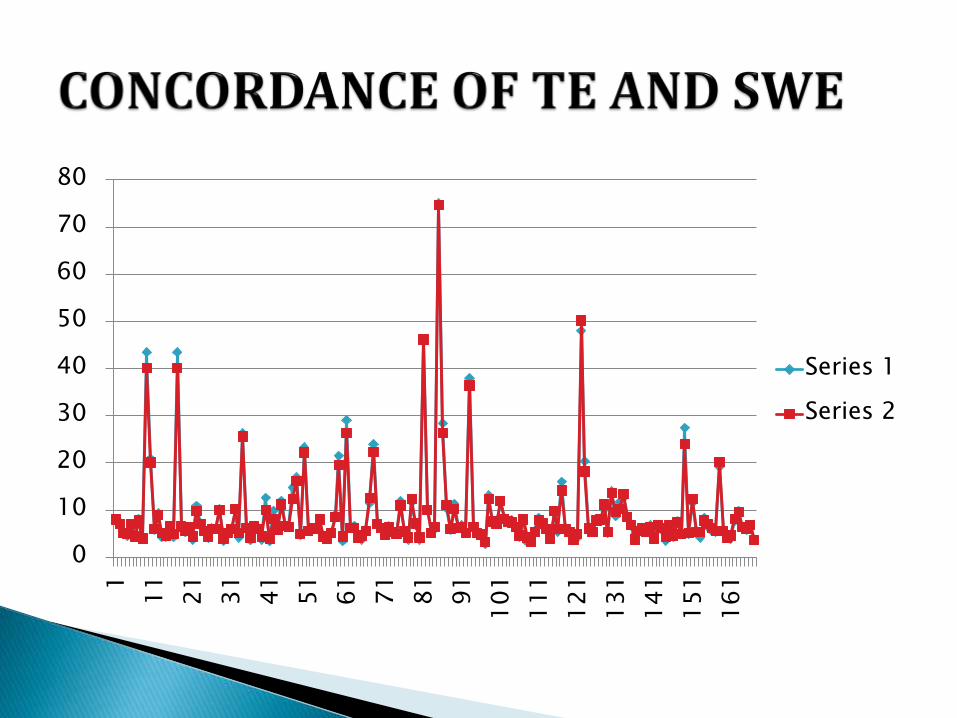
Mean Fibroscan TE score was 9.2
Mean Philips SWE score was 9.1
By paired t test, the correlation of TE and SWEvalues was highly significant (p-0.000).
0
10
20
30
40
50
60
70
80
1
11
21
31
41
51
61
71
81
91
10
1
11
1
12
1
13
1
14
1
15
1
16
1
Series 1
Series 2

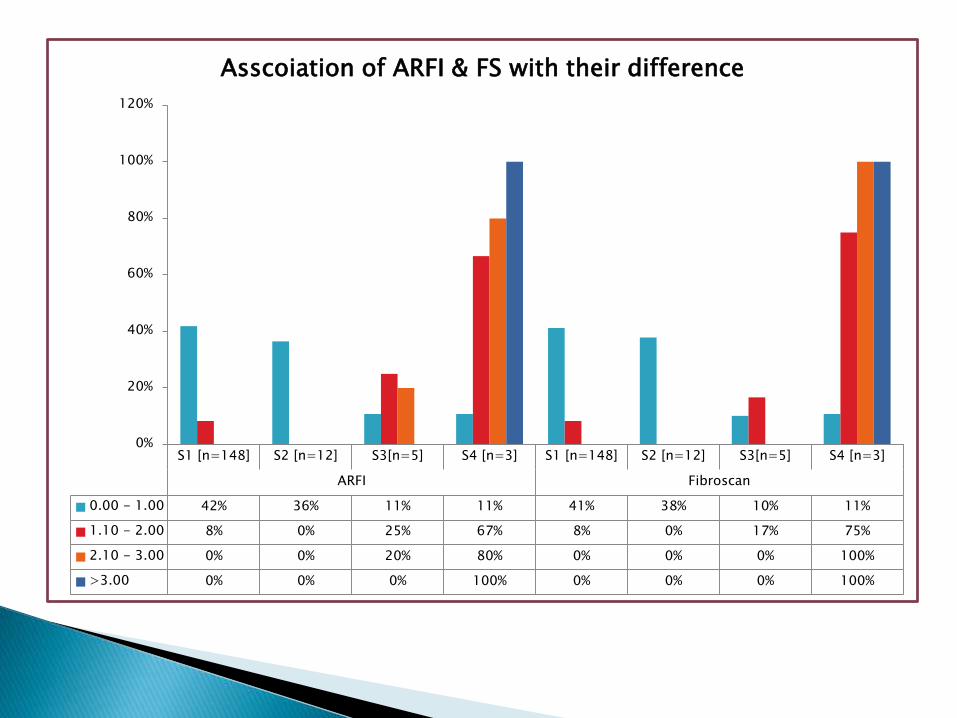
S1 [n=148] S2 [n=12] S3[n=5] S4 [n=3] S1 [n=148] S2 [n=12] S3[n=5] S4 [n=3]
ARFI Fibroscan
0.00 - 1.00 42% 36% 11% 11% 41% 38% 10% 11%
1.10 - 2.00 8% 0% 25% 67% 8% 0% 17% 75%
2.10 - 3.00 0% 0% 20% 80% 0% 0% 0% 100%
>3.00 0% 0% 0% 100% 0% 0% 0% 100%
0%
20%
40%
60%
80%
100%
120%
Asscoiation of ARFI & FS with their difference
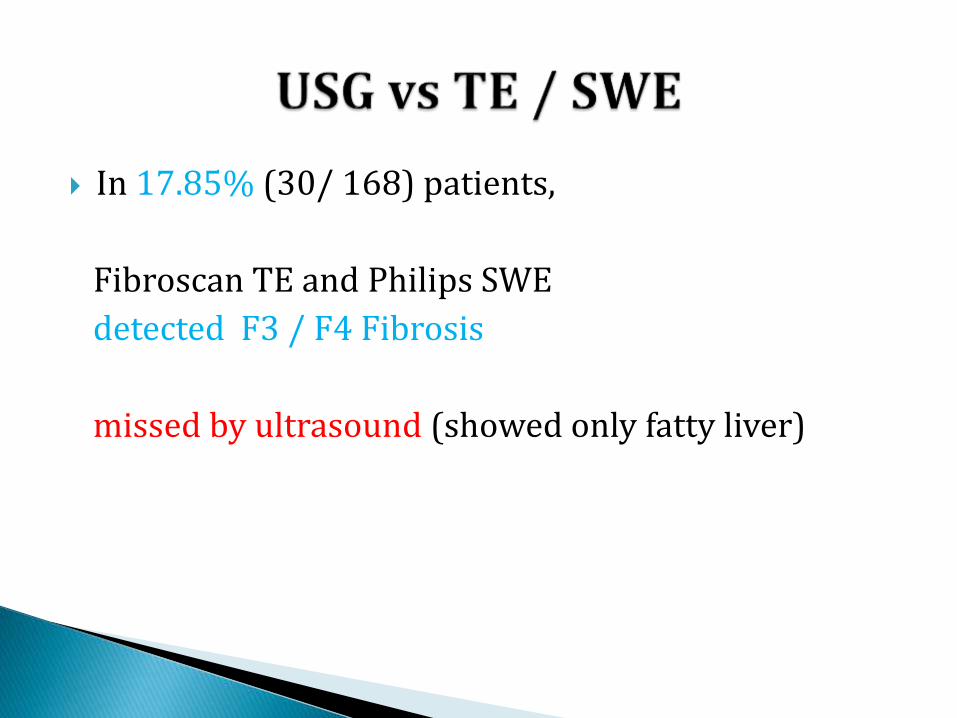
In 17.85% (30/ 168) patients,
Fibroscan TE and Philips SWE
detected F3 / F4 Fibrosis
missed by ultrasound (showed only fatty liver)
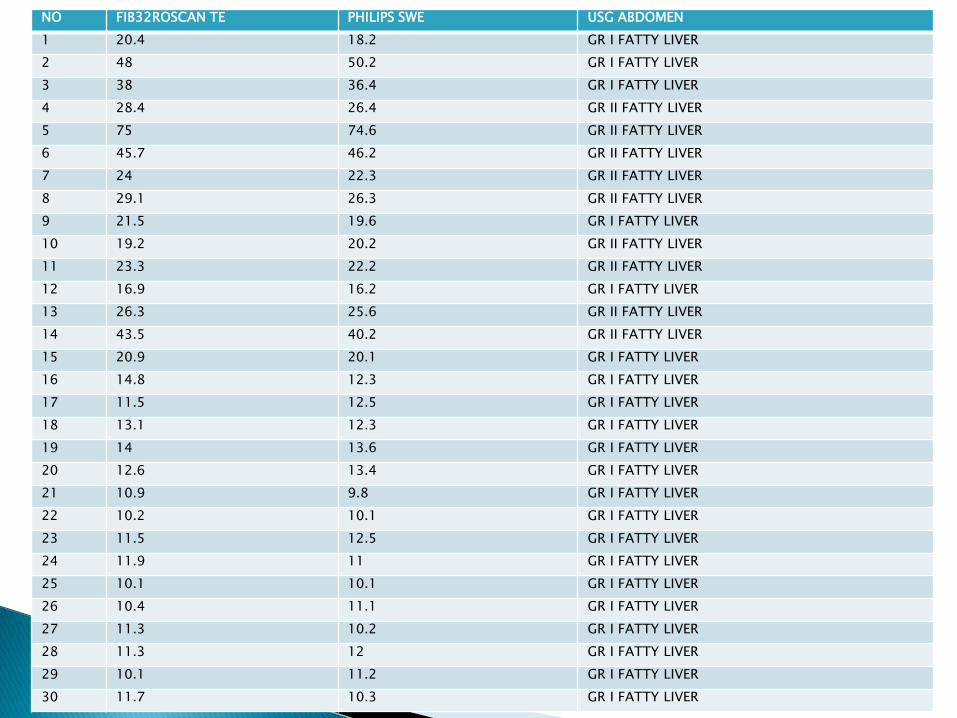
NO FIB32ROSCAN TE PHILIPS SWE USG ABDOMEN
1 20.4 18.2 GR I FATTY LIVER
2 48 50.2 GR I FATTY LIVER
3 38 36.4 GR I FATTY LIVER
4 28.4 26.4 GR II FATTY LIVER
5 75 74.6 GR II FATTY LIVER
6 45.7 46.2 GR II FATTY LIVER
7 24 22.3 GR II FATTY LIVER
8 29.1 26.3 GR II FATTY LIVER
9 21.5 19.6 GR I FATTY LIVER
10 19.2 20.2 GR II FATTY LIVER
11 23.3 22.2 GR II FATTY LIVER
12 16.9 16.2 GR I FATTY LIVER
13 26.3 25.6 GR II FATTY LIVER
14 43.5 40.2 GR II FATTY LIVER
15 20.9 20.1 GR I FATTY LIVER
16 14.8 12.3 GR I FATTY LIVER
17 11.5 12.5 GR I FATTY LIVER
18 13.1 12.3 GR I FATTY LIVER
19 14 13.6 GR I FATTY LIVER
20 12.6 13.4 GR I FATTY LIVER
21 10.9 9.8 GR I FATTY LIVER
22 10.2 10.1 GR I FATTY LIVER
23 11.5 12.5 GR I FATTY LIVER
24 11.9 11 GR I FATTY LIVER
25 10.1 10.1 GR I FATTY LIVER
26 10.4 11.1 GR I FATTY LIVER
27 11.3 10.2 GR I FATTY LIVER
28 11.3 12 GR I FATTY LIVER
29 10.1 11.2 GR I FATTY LIVER
30 11.7 10.3 GR I FATTY LIVER
Fibroscan and SWE, are thus able to detect patientswith significant fibrosis in many cases, whereultrasound showed only Gr I-II fatty liver.
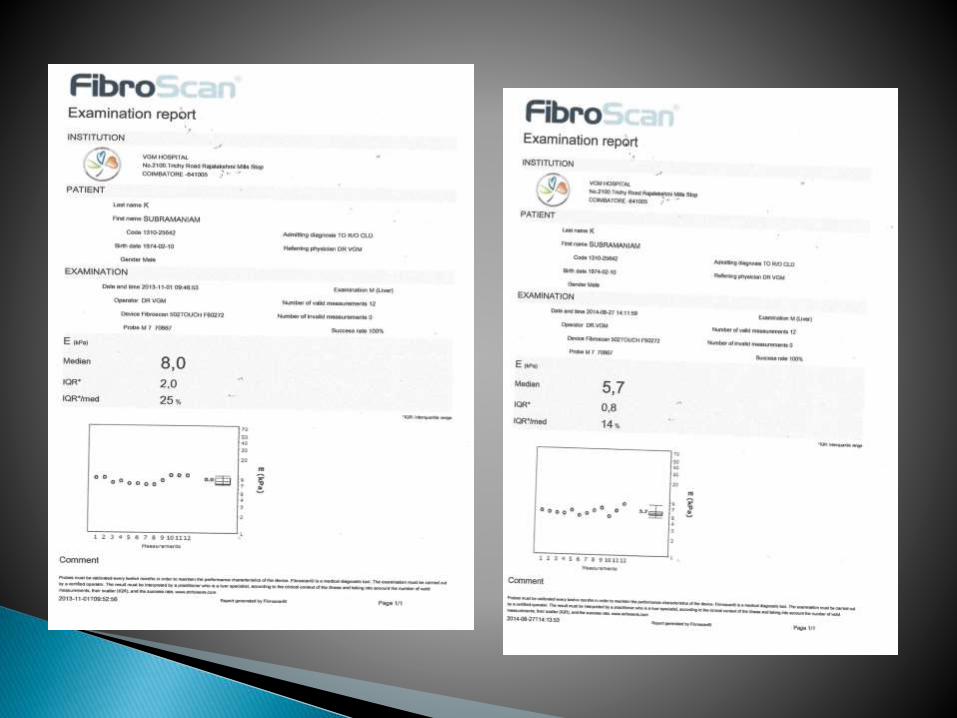
Case1- Treatment of NAFLD which included
hepatoprotectives
Caused a reduction of fibroscan score from
8 to 5.7 after 10 months.
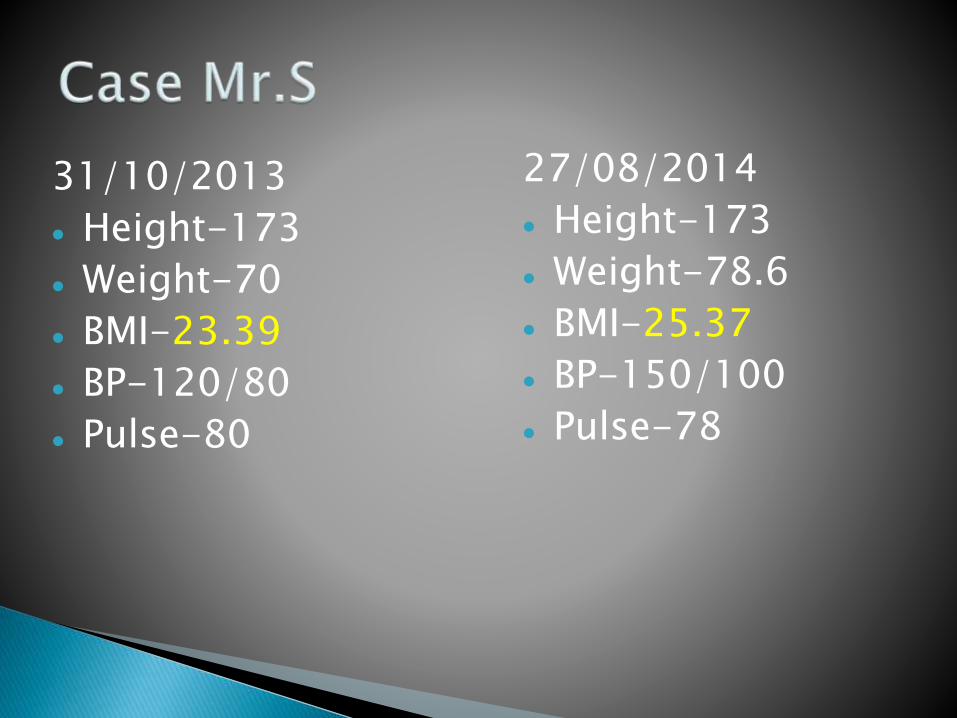
31/10/2013
Height-173
Weight-70
BMI-23.39
BP-120/80
Pulse-80
27/08/2014
Height-173
Weight-78.6
BMI-25.37
BP-150/100
Pulse-78
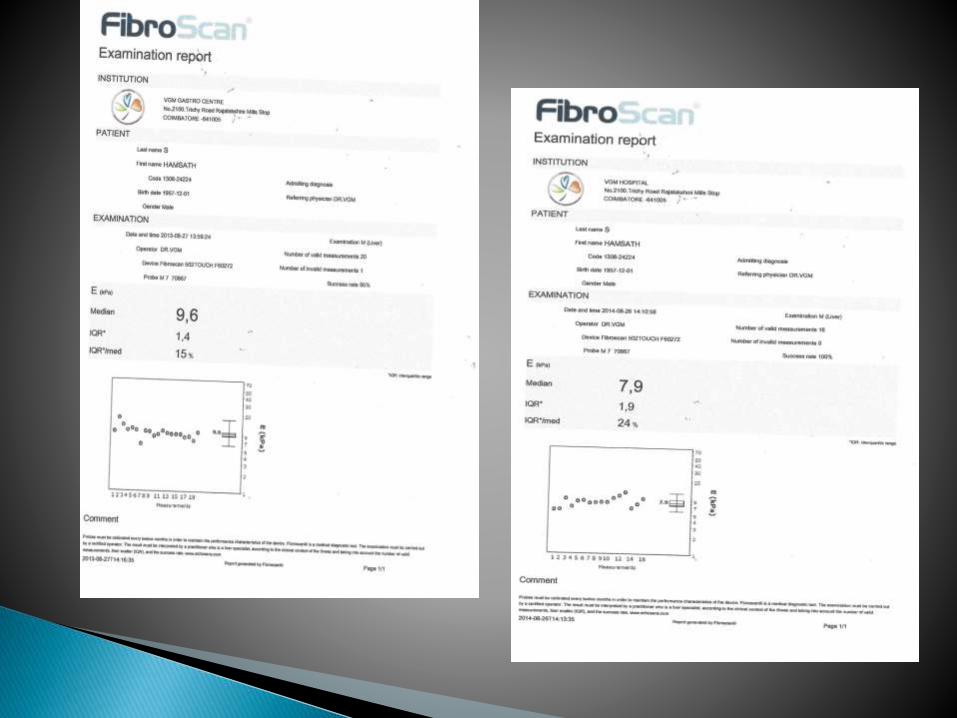
Case 2- Treatment of NAFLD caused reduction in fibroscan score from
9.6 to 7.9 after 12 months.

12/15/14
Baseline
•Mrs.K-48yrs/F
•CLD-HCV-Genotype-3
•Rxed with PEGIFN for 24wks
•Baseline HCV Viral load-1.2million/ml
•ETVR: HCVNot Detected6Mo Post Rx
12/15/14
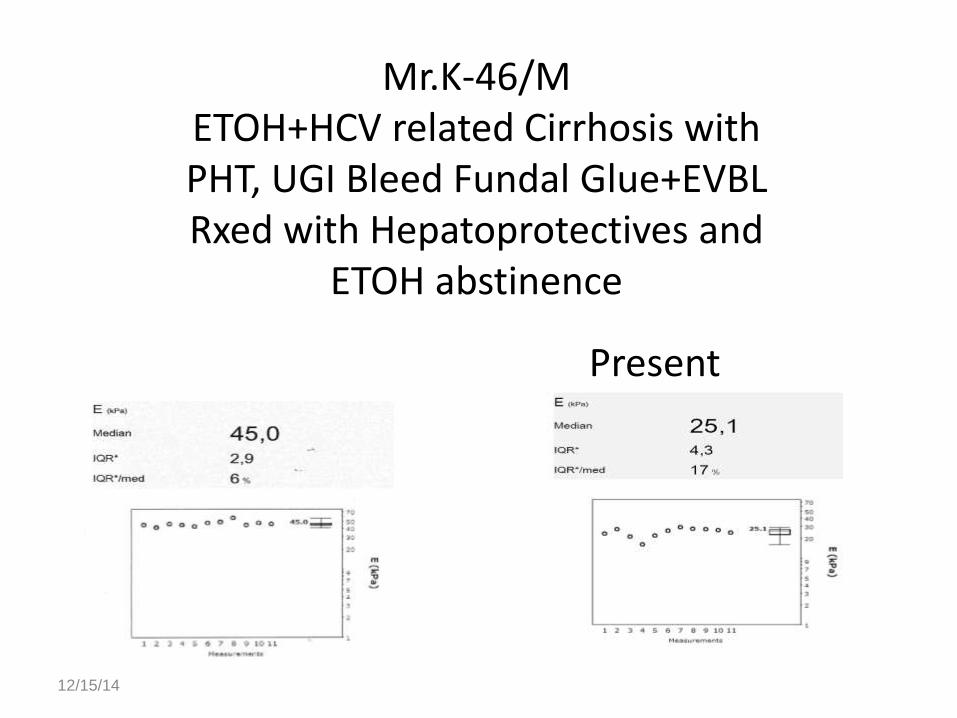
Mr.K-46/METOH+HCV related Cirrhosis with PHT, UGI Bleed Fundal Glue+EVBLRxed with Hepatoprotectives and
ETOH abstinence
PresentBaseline
Liver Biopsy is still the gold standard for assessing fibrosis
HOWEVER
TE will suffice in the vast majority , avoiding furtherinvasive investigations (ie, hepatic hemodynamics orbiopsy).
TE is a useful tool for initial screening and on-treatment follow-up of NAFLD ,AFLD, HBV and HCV subjects and has been validated in several trials.
See you in Ooty in August 2015 for Mid Term Rural CME….
See you in Coimbatore for Endoscopy Workshop in October 2015….!

![[2016] pathogenesis of liver fibrosis](https://static.fdocuments.us/doc/165x107/5884dbd71a28ab4b778b5143/2016-pathogenesis-of-liver-fibrosis.jpg)