5 ElEctricity transmission - Australian Energy Regulator | 5... · of a power system failure....
30
5 ElEctricity transmission
-
Upload
truongnhan -
Category
Documents
-
view
218 -
download
5
Transcript of 5 ElEctricity transmission - Australian Energy Regulator | 5... · of a power system failure....

5ElEctricity transmission

Electricity generators are usually located close to fuel sources such as natural gas pipelines, coal mines and hydroelectric water reservoirs. Most electricity customers, however, are located a long distance from these generators in cities, towns and regional communities. The electricity supply chain, therefore, requires networks to transport power from generators to customers. The networks also enhance the reliability of electricity supply by allowing a diverse range of generators to supply electricity to end markets. In effect, the networks provide a mix of capacity that can be drawn on to help manage the risk of a power system failure.
Rob
ert L
lew
elly
n (C
orbi
s)

5.1 Roleofelectricitytransmissionnetworks
Transmission networks transport electricity from generators to distribution networks, which in turn transport electricity to customers. In a few cases, large businesses such as aluminium smelters are directly
connected to the transmission network. A transmission network consists of towers and the wires that run between them, underground cables, transformers, switching equipment, reactive power devices, and monitoring and telecommunications equipment.
5ElEctricity transmissionThis chapter considers:> the role of the electricity transmission network sector> the structure of the sector, including industry participants and ownership changes over time> the economic regulation of the transmission network sector by the Australian
Energy Regulator> revenues and rates of return in the transmission network sector> new investment in transmission networks> the operating and maintenance costs of running transmission networks> quality of service, including transmission reliability and the market impacts of congestion.
Some of the matters canvassed in this chapter are addressed in more detail in the Australian Energy Regulator’s annual report on the transmission sector.1
124 statE oF tHE EnErGy marKEt 2009
1 AER, Transmission network service providers: electricity performance report for 2007 – 08, Melbourne, 2009.

Electricity must be converted to high voltages for efficient transport over long distances. This minimises the loss of electrical energy that naturally occurs.2 In Australia, transmission networks consist of equipment that transmits electricity at or above 220 kilovolts (kV), along with assets that operate at 66 – 220 kV that are parallel to, and provide support to, the higher voltage transmission network.
The high voltage transmission network strengthens the performance of the electricity industry in three ways:> Fırst, it gives customers access to large, efficient
generators that may be located hundreds of kilometres away. Without transmission infrastructure, customers would have to rely on generators in their local area, which may be more expensive than remote generators.
> Second, allowing many generators to compete in the electricity market helps reduce the risk of market power.
> Third, allowing electricity to move instantaneously over long distances reduces the amount of spare generation capacity that must be provided at each town or city to ensure a reliable electrical supply. This reduces inefficient investment in generation.
5.2 Australia’selectricitytransmissionnetworks
In Australia, there are transmission networks in each state and territory, with cross‑border interconnectors that link some networks. The National Electricity Market (NEM) in eastern and southern Australia provides a fully interconnected transmission network from Queensland through to New South Wales, the Australian Capital Territory (ACT), Victoria, South Australia and Tasmania (figure 5.1). The transmission networks in Western Australia and the Northern Territory do not interconnect with the NEM or each other (see chapter 4).
The NEM transmission network is unique in the developed world in terms of its long distances, low density and long, thin structure. It reflects the often long distances between demand centres and fuel sources for generation. The 290 kilometre link between Victoria and Tasmania, for example, is one of the longest submarine power cable in the world. By contrast, transmission networks in the United States and many European countries tend to be meshed and of a higher density. These differences result in transmission charges being a more significant contributor to end prices in Australia than they are in many other countries — for example, transmission charges comprise about 10 per cent of retail prices in the NEM3 compared with 4 per cent in the United Kingdom.4
Electricity can be transported over alternating current (AC) or direct current (DC) networks. Most of Australia’s transmission network is AC, whereby the power flow over individual elements of the network cannot be directly controlled. Instead, electrical power (which is injected at one point and withdrawn at another) flows over all possible paths between the two points. As a result, decisions on how much electricity is produced or consumed at one point on the network can affect power flows in other parts of the network. Australia also has three DC networks, of which all are cross‑border interconnectors.
5.2.1 Ownership
Table 5.1 lists Australia’s transmission networks and their current ownership arrangements. Historically, government utilities ran the entire electricity supply chain in all states and territories. In the 1990s governments began to separate the generation, transmission, distribution and retail segments into stand‑alone businesses. Generation and retail were opened up to competition, but this approach was not appropriate for the transmission and distribution networks, which became regulated monopolies.
125
CHAPTER5ElEc
tric
ity tr
ansm
ission
2 While transportation of electricity over long distances is efficient at high voltages, there are risks, such as flashovers. A flashover is a brief (seconds or less) instance of conduction between an energised object and the ground (or another energised object). The conduction consists of a momentary flow of electricity between the objects, and is usually accompanied by a show of light and possibly a cracking or loud exploding noise. High towers, insulation and wide spacing between the conductors help to manage this risk.
3 The contribution of transmission to final retail prices varies across jurisdictions, customer types and locations.4 Ofgem, Factsheet 66, London, January 2008 (available at www.ofgem.gov.uk).

Figure5.1TransmissionnetworksintheNationalElectricityMarket
QNI, Queensland – New South Wales Interconnector.
126 statE oF tHE EnErGy marKEt 2009

Table5.1 ElectricitytransmissionnetworksinAustralia
NETWORK LOCATION
LINELENGTH
(KM)
ELECTRICITY
TRANSMITTED
(GWh),2007 –
08
MAXIMUMDEMAND
(MW),2007
–08
ASSETBASE
(2008$MILLION)1
INVESTMENT—
CURRENTPERIOD
(2008$MILLION)2
CURRENT
REGULATORY
PERIOD
OWNER
NEMREGIONNETWORKS
Powerlink Qld 12 671 48 576 8 082 3 922 2 528 1 July 2007 – 30 June 2012
Queensland Government
TransGrid NSW 12 486 76 359 12 954 4 064 2 405 1 July 2009 – 30 June 2014
New South Wales Government
EnergyAustralia3 NSW 885 32 007 5 683 1 013 1 182 1 July 2009 – 30 June 2014
New South Wales Government
SP AusNet Vic 6 553 51 927 9 850 2 232 9904 1 Apr 2008 – 30 Mar 2014
Publicly listed company (Singapore Power International 51%)
ElectraNet SA 5 620 13 734 3 172 1 284 650 1 July 2008 – 30 June 2013
Powerlink (Queensland Government), YTL Power Investment, Hastings Utilities Trust
Transend Tas 3 650 11 298 2 332 936 606 1 July 2009 – 30 June 2014
Tasmanian Government
NEM total 41 865 233 901 42 073 13 451 8 292
INTERCONNECTORS5
Directlink Qld – NSW
63 180 130 1 July 2005 – 30 June 2015
Energy Infrastructure Investments (Marubeni 50%, Osaka Gas 30%, APA Group 20%)
Murraylink Vic – SA
180 220 119 1 Oct 2003 – 30 June 2013
Energy Infrastructure Investments (Marubeni 50%, Osaka Gas 30%, APA Group 20%)
Basslink Vic – Tas
375 8456 Unregulated Publicly listed CitySpring Infrastructure Trust (Temesek Holdings (Singapore) 28%)
NON-NEMREGIONNETWORKS
Western Power WA 6 792 14 500 3 420 21357 15287 1 July 2009 – 30 June 20128
Western Australian Government
Power and Water NT 730 1 July 2009 – 30 June 2014
Northern Territory Government
1. The regulated asset bases are as set at the beginning of the current regulatory period for each network, converted to June 2008 dollars.2. Investment data are forecast capital expenditure over the current regulatory period, converted to June 2008 dollars.3. EnergyAustralia’s transmission assets, at 1 July 2009, are treated as distribution assets for the purpose of economic regulation. Future performance of the network
will be assessed under the framework applicable to distribution network service providers.4. SP AusNet’s investment data include forecast augmentation investment by AEMO (formerly VENCorp).5. Not all interconnectors are listed. The unlisted interconnectors, which form part of the state based networks, are Heywood (Victoria – South Australia),
QNI (Queensland – New South Wales), Snowy – New South Wales and Snowy –Victoria.6. Given Basslink is not regulated, there is no regulated asset base. The asset value listed is the estimated construction cost.7. Data from the ERA’s draft decision on proposed revisions to Western Power’s access arrangement for the period 2009 – 10 to 2011 – 12.8. At July 2009 Western Power’s access arrangement for the period 2009 – 10 to 2011 – 12 was not finalised.
Principal sources: AER, Transmission network service providers: electricity performance report for 2007 – 08, Melbourne, 2008, and previous years; AER/ACCC revenue cap decisions; ERA (Western Australia), Draft decision on proposed revisions to the access arrangement for the South West Interconnected Network, Perth, July 2009; company websites and media releases.
127
CHAPTER5ElEc
tric
ity tr
ansm
ission

also buys bulk network services from SP AusNet for sale to customers.
Private investors have constructed three interconnectors — Murraylink, Directlink and Basslink — since the commencement of the NEM. All have since changed ownership. As of December 2008 Energy Infrastructure Investments has owned Murraylink and Directlink. The APA Group has a 20 per cent stake in the business and manages, maintains and operates the assets. A trust with links to Singapore Power International acquired Basslink in 2007.
5.2.2 Interconnection
Aside from the Snowy Mountains Hydro‑Electric Scheme, which has supplied electricity to New South Wales and Victoria since 1959, transmission lines that cross state and territory boundaries are relatively new. In 1990, more than 30 years after the inception of the Snowy scheme, the Heywood interconnector between Victoria and South Australia commenced operation.
Figure5.2Electricitytransmissionnetworkownership
1994 1995 1996 1997 1998 1999 2000 2001 2002 2003 2004 2005 2006 2007 2008 2009
QLD Powerlink Queensland Government
NSW TransGrid New South Wales Government
Energy Australia
New South Wales Government
VIC SP AusNet Powernet Victoria GPU Powernet SPI PowerNet (Singapore Power)
SP AusNet (51% Singapore Power)
SA ElectraNet South Australian Government Powerlink (Qld Government), YTL Power
Powerlink (Queensland Government), YTL Power, Hastings
TAS Transend Tasmanian Government
INTE
RC
ON
NEC
TOR
S
Directlink Hydro-Quebec Group, NorthPower APA Group APA, Marubeni, Osaka Gas
Murraylink Hydro-Quebec Group, SNC-Lavalin
APA Group APA, Marubeni, Osaka Gas
BassLink NGT CitySpring Infrastructure Trust
WA Powerlink Western Australian Government
NGT, National Grid Transco.
Note: Some corporate names have been abbreviated or shortened.
Fıgure 5.2 illustrates network ownership changes since 1994. Victoria and South Australia privatised their transmission networks, but other jurisdictions retained government ownership:> Singapore Power International acquired Victoria’s
state transmission network in 2000 following the network’s original sale to GPU Powernet in 1997. Singapore Power International floated SP AusNet in 2005, but retained a 51 per cent stake.
> South Australia sold the state transmission network (ElectraNet) in 2000 to a consortium of interests led by Powerlink, which the Queensland Government owns. YTL Power Investments, part of a Malaysian conglomerate, is a minority owner. Hastings Fund Management acquired a stake in ElectraNet in 2003.
Victoria has a unique transmission network structure in which asset ownership is separated from planning and investment decision making. SP AusNet owns the state’s transmission assets, but the Australian Energy Market Operator (AEMO, formerly VENCorp) plans and directs network augmentation. AEMO
128 statE oF tHE EnErGy marKEt 2009

5.2.3 Scale of the networks
Fıgure 5.3 compares asset values and capital expenditure in the current regulatory period for the transmission networks. It reflects asset values as measured by the regulated asset base (RAB) for each network. The RAB is the asset valuation that regulators use, in conjunction with rates of return, to set returns on capital to infrastructure owners. In general, it is set by estimating the replacement cost of an asset at the time it was first regulated, plus subsequent new investment, less depreciation. More generally, it indicates relative scale.
The construction of new interconnectors gathered pace with the commencement of the NEM in 1998. Two interconnectors between Queensland and New South Wales (Directlink5 and the Queensland – New South Wales Interconnector) commenced operation in 2000, followed by a second interconnector between Victoria and South Australia (Murraylink) in 2002. Murraylink is the world’s longest underground power cable. The construction of a submarine transmission cable (Basslink) from Victoria to Tasmania in 2006 completed the interconnection of all transmission networks in eastern and southern Australia. Fıgure 5.1 shows the interconnectors in the NEM.
Figure5.3Electricitytransmissionnetworkassetsandinvestment
Notes:
Regulated asset bases are as at the beginning of the current regulatory period. The regulated asset base value for Basslink is the estimated construction cost.
Investment data are forecast capital expenditure for the current regulatory period (typically, five years). See table 5.1 for the timing of current regulatory periods.
EnergyAustralia’s transmission assets, at 1 July 2009, are treated as distribution assets for the purpose of economic regulation.
SP AusNet includes augmentation investment by AEMO (formerly VENCorp).
Data for Western Power are from the ERA’s draft decision on proposed revisions to Western Power’s access arrangement for the period 2009 – 10 to 2011 – 12.
All values are converted to June 2008 dollars.
Sources: AER/ACCC revenue cap decisions; ERA (Western Australia), Draft decision on proposed revisions to the access arrangement for the South West Interconnected Network, Perth, July 2009.
129
CHAPTER5ElEc
tric
ity tr
ansm
ission
5 Directlink is also known as the Terranora interconnector.

The regulatory process usually commences with a transmission business submitting a revenue proposal to the AER. Once a proposal is submitted, the determination process takes 13 months, including time to consult with stakeholders. The transmission business must also submit a proposed pricing methodology and negotiating framework for approval by the AER. The pricing methodology is a formula or process for a business to allocate its revenue allowance and determine the structure of prices it may charge for its prescribed services. The negotiating framework details guidelines for the provision of services to third parties.
Within six months of a revenue proposal being lodged, the AER must release a draft determination. As part of the determination, the AER must decide whether a service target performance incentive scheme (service standards scheme) and/or efficiency benefit sharing scheme will apply to the transmission business. It must also approve or reject the pricing methodology and negotiating criteria.7
Once a draft determination is published, the transmission business may submit a revised revenue proposal within 30 business days. The AER must also hold a conference to allow stakeholders to comment on the draft determination. After the conference, stakeholders have a further 45 business days to make written submissions. The AER’s final decision, which accounts for any revised proposal and stakeholder comments, is released at least two months before the new regulatory period begins.
Fıgure 5.4 shows the regulatory timelines for each transmission network. The most recent determinations were for the New South Wales and Tasmanian networks (box 5.1)
Powerlink (Queensland) and TransGrid (New South Wales) have significantly higher RABs than those of other networks. Many factors can affect the size of the RAB, including the basis of original valuation, network investment, the age of a network, geographic scale, the distances required to transport electricity from generators to demand centres, population dispersion and forecast demand profiles. The combined RAB of all transmission networks is around $15.6 billion. This amount will continue to rise over time, with investment in the current regulatory periods forecast at almost $10 billion (see section 5.4).
5.3 Economicregulationofelectricitytransmissionservices
Electricity transmission networks are capital intensive and incur declining marginal costs as output increases. This gives rise to a natural monopoly industry structure. In Australia, the networks are regulated to manage the risk of monopoly pricing.6 The Australian Competition and Consumer Commission (ACCC) was the industry regulator of transmission networks in the NEM until this role transferred to the Australian Energy Regulator (AER) in 2005. The Economic Regulation Authority and Utilities Commission are the regulators for the Western Australian and Northern Territory networks respectively.
5.3.1 Regulatory process
Chapter 6A of the National Electricity Rules (Electricity Rules) sets out the timelines and processes for the regulation of transmission businesses in the NEM. Regulated transmission businesses must periodically apply for the AER to assess their revenue (typically, every five years). These applications, or revenue proposals, must be consistent with the submission guidelines that the AER developed under the Electricity Rules.
130 statE oF tHE EnErGy marKEt 2009
6 The Murraylink, Directlink and Basslink interconnectors were constructed as unregulated infrastructure that aimed to earn revenue through arbitrage. That is, they profited by purchasing electricity in low price NEM regions and selling it into higher price regions. Murraylink and Directlink converted to regulated networks in 2003 and 2006 respectively. Basslink is the only unregulated transmission network in the NEM.
7 If the AER does not accept the pricing method and negotiating framework proposed by the transmission business, it must detail how those documents can be changed to make them compliant with the Electricity Rules.

Figure5.4Determinationprocessforelectricitytransmissionnetworks
Box5.1 NewSouthWalesandTasmaniantransmissiondeterminations
In April 2009 the AER released its revenue determination for TransGrid and EnergyAustralia8 (the transmission service providers in New South Wales) and Transend (the provider in Tasmania). These determinations provide for $3.6 billion of capital expenditure for the New South Wales networks and $0.6 billion for the Tasmanian network between 2009 – 10 and 2013 – 14.
The determinations provide for a significant increase in investment — 140 per cent higher than for the previous five years (in real terms) — and will allow the networks to comply with more stringent network performance, reliability and security requirements, replace aging assets and meet growing peak demand. Projects include constructing a 500 kV network around
the Newcastle – Sydney – Wollongong area to meet future load growth, reinforcing the inner Sydney transmission system and constructing a Waddamana – Lindisfarne transmission line in Tasmania.
The AER also approved significant increases in operating and maintenance expenditure allowances.
The overall revenue allowance for the regulatory period is $3.6 billion for TransGrid and around $0.9 billion for EnergyAustralia and Transend. The decisions reflect revised economic forecasts (factoring in the effect of the global financial crisis) of weaker demand growth.
These revenue allowances will increase annual nominal transmission charges by about 4.8 per cent for TransGrid and 6 per cent for Transend.
Sources: AER, TransGrid transmission determination 2009 – 10 to 2013 – 14, final decision, Melbourne, April 2009; AER, Transend transmission determination 2009 – 10 to 2013 – 14, final decision, Melbourne, April 2009; AER, New South Wales distribution determination 2009 – 10 to 2013 – 14, final decision, Melbourne, April 2009.
131
CHAPTER5ElEc
tric
ity tr
ansm
ission
8 EnergyAustralia’s revenue allowance was set under the framework for distribution network businesses. See chapter 6 for more details of this process.

5.3.2 Regulatory approach
The AER’s regulatory approach, as set out in the Electricity Rules, is to determine a revenue cap for each transmission business, setting the maximum revenue that a network can earn during a regulatory period (typically, five years). Unlike the distribution sector, all transmission businesses must be subject to a revenue cap (as opposed to other control mechanisms — for example, a price cap). In setting the revenue cap, the AER applies a building block model to determine the revenue that a transmission business needs to cover its efficient costs while providing for a commercial return to the business. The component building blocks cover:> operating and maintenance expenditure> capital expenditure> asset depreciation costs> taxation liabilities> a commercial return on capital.
To illustrate, figure 5.5 shows the components of the revenue cap for TransGrid (New South Wales) for the period 2009 – 10 to 2013 – 14. For most networks, over 60 per cent of the revenue cap consists of returns on capital.
The AER has developed incentive schemes as part of the regulatory process:> An efficiency benefit sharing scheme provides incentives
for transmission businesses to achieve efficient operating and maintenance expenditure in running their networks. The scheme shares efficiency gains between a business and its customers (through lower prices). The scheme applies to all transmission businesses except EnergyAustralia, which is subject to an equivalent distribution business scheme.9
> A service target performance incentive scheme encourages businesses to maintain or improve network service performance. It acts as a counterbalance to the efficiency benefit sharing scheme so businesses do not reduce costs at the expense of service quality.
Figure5.5CompositionofTransGridrevenuecap,2009–10to2013–14
Source: AER, TransGrid transmission determination 2009 – 10 to 2013 – 14, final decision, Melbourne, April 2009.
The scheme focuses on network availability and reliability (the frequency and duration of network outages). It also includes a component based on the market impact of transmission congestion (see section 5.7.2). If service performance is above target, the business earns rewards; if performance falls below target, a business may be penalised. The service standards scheme applies to all transmission businesses (although only TransGrid is subject to the congestion component).10
As part of its role as economic regulator of transmission networks, the AER has developed guidelines to assist stakeholders and to provide regulatory certainty to transmission businesses developing revenue proposals.
132 statE oF tHE EnErGy marKEt 2009
9 From 1 July 2009 EnergyAustralia has been subject to the incentive schemes applicable to distribution businesses. For more details on these schemes, see chapter 6.
10 The market impact of transmission congestion component of the scheme will apply to other transmission businesses from the beginning of their next regulatory period. On 30 April 2009, however, Grid Australia submitted a Rule change proposal that would allow a transmission business to elect to be covered by the scheme from an earlier date.

5.4 ElectricitytransmissioninvestmentNew investment in transmission infrastructure is needed to maintain or improve network performance over time. Investment covers network augmentations (expansions) to meet rising demand and the replacement of ageing assets. Some investment is driven by technological innovations that can improve network performance.
The regulatory process aims to create incentives for efficient investment. At the start of a regulatory period, the AER approves an investment (capital expenditure) forecast for each network. It can also approve contingent projects — large investment projects that are foreseen at the time of the revenue determination, but that involve significant uncertainty about timing and/or costs.
While the regulatory process approves a pool of funds for capital expenditure, individual projects must undergo a regulatory test of economic efficiency. Under the test, a network business must determine that a proposed augmentation passes a cost – benefit analysis, or provides a least cost solution for meeting network reliability standards.12 The AER is developing a regulatory investment test for transmission (RIT‑T) to replace the current regulatory test. The new test will be published by 1 July 2010 (see section 5.8.2).
In determinations since 2005 the AER has allowed network businesses discretion over how and when to spend their investment allowances, without the risk of future review. To encourage efficient spending, network businesses retain a share of any savings (including the depreciation that would have accrued) against their investment allowance. A service standards incentive scheme ensures cost savings are not achieved at the expense of network performance (see section 5.3.2).
These guidelines include:> transmission guidelines, which set out the process that
businesses must follow in structuring and submitting their revenue proposals for assessment by the AER
> a decision on the parameters of the weighted average cost of capital (WACC) model, which determines the return on capital that a regulated network may recover.11 The WACC model sets an efficient benchmark for elements including equity raising and debt costs faced by a business when seeking finance. The WACC model applies to all network businesses that submit regulatory proposals after 1 May 2009.
> cost allocation and pricing methodology guidelines, which set out the general principles for allocating costs to, and charges for, services provided by the business
> a post‑tax revenue model, which determines the annual revenue requirement needed in each year of the regulatory period to cover a network’s cost estimates (or building blocks)
> a roll‑forward model, which determines a network’s opening RAB, accounting for capital expenditure, asset disposal and depreciation over the previous regulatory period. The model also establishes annual RAB forecasts for the coming regulatory period.
The AER has also provided guidance on other aspects of the regulatory framework, including:> guidelines on the operation of the regulatory test,
which is an analysis tool used by network businesses to assess the efficiency of planned investment (see section 5.8.2)
> a statement of approach detailing the priorities and objectives of annual performance reports on transmission businesses
> ring‑fencing guidelines, which set out how transmission businesses that own or operate other network businesses (for example, distribution businesses) are to maintain and separate their accounts.
133
CHAPTER5ElEc
tric
ity tr
ansm
ission
11 AER, Electricity transmission and distribution network service providers, Review of the weighted average cost of capital (WACC) parameters, final decision, Melbourne, May 2009.
12 The test comprises a reliability limb (a least cost test for reliability projects) and a market benefits limb (a cost – benefit test for all other projects). See AER, Regulatory test for network augmentation, version 3, Melbourne, November 2007.

There has been significant investment in transmission infrastructure in the NEM since the shift to national regulation (figures 5.6 and 5.7).13 Investment levels have been highest for TransGrid and Powerlink. The other networks typically have relatively lower investment levels, reflecting the scale of the networks and differences in investment drivers such as infrastructure age and demand projections.
Care must be taken in interpreting year‑to‑year changes in investment data. Timing differences between the commissioning of some projects and their completion creates volatility. In addition, transmission investment can be ‘lumpy’ given the one‑off nature of very large capital programs. More generally, because regulated revenues are typically set for five year periods, the network businesses have flexibility to manage and reprioritise their capital expenditure during this time.
Figure5.7Totaltransmissioninvestment
Notes:
Actual data (unbroken lines) are used where available; forecast data (broken lines) are used for other years.
Excludes private interconnectors.
All values are converted to June 2008 dollars.
Sources: AER/ACCC annual regulatory reports and revenue cap decisions; ERA performance reports and access arrangement decisions.
Figure5.6Electricitytransmissioninvestmentbynetwork
Notes:
Actual data (unbroken lines) are used where available; forecast data (broken lines) are used for other years.
Forecast capital investment is as approved by the regulator through revenue cap determinations (averaged over the regulatory period), except for Western Power where data are from the ERA’s draft decision on proposed revisions to Western Power’s access arrangement for the period 2009 – 10 to 2011 – 12.
For SP AusNet, actual expenditure is replacement expenditure only; forecast expenditure includes network augmentation by AEMO (formerly VENCorp).
All values are converted to June 2008 dollars.
Sources: AER/ACCC annual regulatory reports and revenue cap decisions; ERA performance reports and access arrangement decisions.
134 statE oF tHE EnErGy marKEt 2009
13 Fıgure 5.6 includes Western Power for comparative purposes.

Figure5.8Electricitytransmissionrevenue
Notes:
Actual data (unbroken lines) are used where available; forecast data (broken lines) are used for other years.
All values are converted to June 2008 dollars.
Sources: AER/ACCC annual regulatory reports and revenue cap decisions; ERA performance reports and access arrangement decisions.
Transmission investment in the major NEM networks totalled around $1.4 billion in 2007 – 08, equal to around 10 per cent of the combined RABs. Investment was forecast to rise to over $1.6 billion in 2008 – 9. Investment over the 10 years to 2011 – 12 (including the Basslink interconnector) is forecast at around $12.4 billion. In Western Australia, investment in 2007 – 08 reached around $260 million. The Economic Regulation Authority’s draft decision for Western Power provides an investment allowance of around $1.5 billion for the three year period starting 1 July 2009.
Recent AER revenue cap decisions project significantly higher investment into the next decade. Forecasts indicate that a step‑change rise in investment levels is taking place across the NEM. This reflects substantial real investment in new infrastructure as well as rising resource costs in the energy construction sector.
The Transend, TransGrid and EnergyAustralia revenue determinations in 2009 took account of the changing economic environment. Various input costs (including
labour and materials) have recorded slowing growth trends, given the economic downturn. While labour and material costs are still forecast to rise over the regulatory period, the rate of increase is expected to be lower than previously forecast. This expectation contrasts with the revenue determinations for SP AusNet and ElectraNet in 2008, for which input costs were forecast to grow rapidly over the regulatory period.
5.5 FinancialperformanceThe AER publishes an annual performance report on the electricity transmission network sector.14 In addition, new regulatory determinations include both historical performance data for the preceding regulatory period and forecasts of future outcomes.
5.5.1 Revenues
Fıgure 5.8 charts revenue outcomes for the major transmission businesses, as well as forecast revenues provided through the regulatory process. The year
135
CHAPTER5ElEc
tric
ity tr
ansm
ission
14 AER, Transmission network service providers: electricity performance report for 2007 – 08, Melbourne, 2009.

Figure5.9Returnonassetsforelectricitytransmissionbusinesses
Sources: AER/ACCC annual performance reports for transmission network service providers.
A variety of factors can affect performance in this area, including differences in the demand and cost environments faced by each business, the rate of return allowed by the regulator, and demand and cost outcomes that differ from those forecast in the regulatory process.
5.5.3 Operating and maintenance expenditure
In setting a revenue cap, the AER allows for efficient operating and maintenance costs. In 2007 – 08 transmission businesses spent about $420 million on operating and maintenance costs, which was about $50 million below regulatory forecasts. Overall, real expenditure allowances are rising over time in line with rising demand and costs. Three of the six NEM networks, however, incurred lower costs in 2007 – 08 than in the previous year (figure 5.10). Spending is highest for TransGrid (New South Wales) and Powerlink (Queensland), partly reflecting the scale of those networks. Several factors affect the cost structures
in which the data commence varies across networks, reflecting the staged transfer to national regulation. Different outcomes across the networks reflect differences in scale and market conditions. The revenues of all networks, however, are increasing to meet rising demand. The combined revenue of the NEM’s transmission businesses was forecast to exceed $2 billion in 2008 – 09, representing a real increase of about 30 per cent over five years. Revenue for Western Power was forecast at over $200 million in 2008 – 09.
Some networks experienced a significant rise in revenues in their first revenue determination under national regulation — for example, in 2003 – 04 the ACCC allowed revenues for Transend (Tasmania) that were 28 per cent higher than those provided in its previous regulatory period. In addition, the start of a new regulatory period sometimes provides a sharp increase in revenues, reflecting a step‑change in capital expenditure — for example, SP AusNet’s forecast revenue for 2008 – 09 (the first year of the current regulatory period) represented a 40 per cent real increase over the previous year’s.
5.5.2 Return on assets
The AER’s annual regulatory report contains a range of profitability and efficiency indicators for transmission businesses in the NEM.15 Of these, the return on assets is a widely used indicator of performance. The return on assets is based on operating profits (net profit before interest and taxation) as a percentage of the RAB.16 Fıgure 5.9 shows the return on assets for transmission businesses over the six years to 2007 – 08. In this period, government owned network businesses typically achieved annual returns on assets of 5 – 8 per cent. The privately owned networks in Victoria and South Australia (SP AusNet and ElectraNet respectively) yielded returns of 7 – 10 per cent. Outcomes diverged in 2007 – 08, following convergence over the previous two years.
136 statE oF tHE EnErGy marKEt 2009
15 AER, Transmission network service providers: electricity performance report for 2007 – 08, Melbourne, 2009, and previous years.16 The RAB is recalculated annually (with new investment rolled in) for the purposes of this measure.
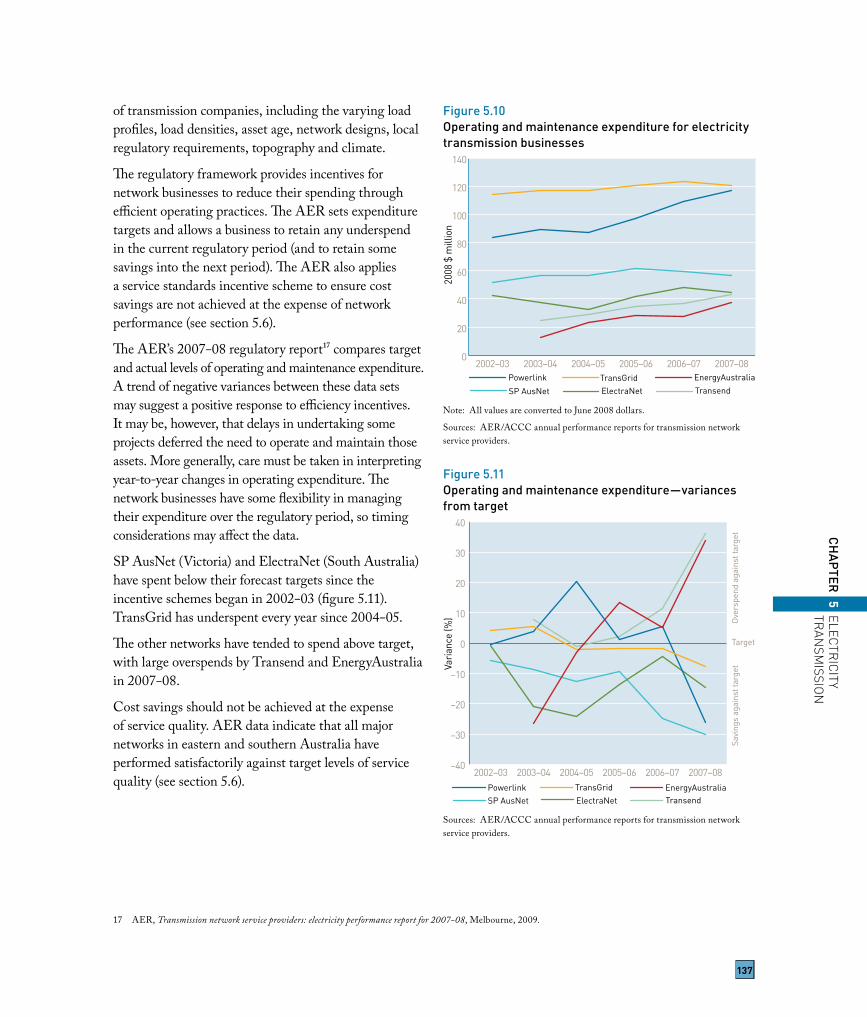
of transmission companies, including the varying load profiles, load densities, asset age, network designs, local regulatory requirements, topography and climate.
The regulatory framework provides incentives for network businesses to reduce their spending through efficient operating practices. The AER sets expenditure targets and allows a business to retain any underspend in the current regulatory period (and to retain some savings into the next period). The AER also applies a service standards incentive scheme to ensure cost savings are not achieved at the expense of network performance (see section 5.6).
The AER’s 2007 – 08 regulatory report17 compares target and actual levels of operating and maintenance expenditure. A trend of negative variances between these data sets may suggest a positive response to efficiency incentives. It may be, however, that delays in undertaking some projects deferred the need to operate and maintain those assets. More generally, care must be taken in interpreting year‑to‑year changes in operating expenditure. The network businesses have some flexibility in managing their expenditure over the regulatory period, so timing considerations may affect the data.
SP AusNet (Victoria) and ElectraNet (South Australia) have spent below their forecast targets since the incentive schemes began in 2002 – 03 (figure 5.11). TransGrid has underspent every year since 2004 – 05.
The other networks have tended to spend above target, with large overspends by Transend and EnergyAustralia in 2007 – 08.
Cost savings should not be achieved at the expense of service quality. AER data indicate that all major networks in eastern and southern Australia have performed satisfactorily against target levels of service quality (see section 5.6).
Figure5.10Operatingandmaintenanceexpenditureforelectricitytransmissionbusinesses
Note: All values are converted to June 2008 dollars.
Sources: AER/ACCC annual performance reports for transmission network service providers.
Figure5.11Operatingandmaintenanceexpenditure—variancesfromtarget
Sources: AER/ACCC annual performance reports for transmission network service providers.
137
CHAPTER5ElEc
tric
ity tr
ansm
ission
17 AER, Transmission network service providers: electricity performance report for 2007 – 08, Melbourne, 2009.

Investment decisions are also guided by planning requirements set by state governments, in conjunction with standards set by AEMO. The state governments vary considerably in their approaches to planning, and in the standards they apply. The Australian Energy Market Commission (AEMC) completed a review of national reliability standards in 2008, to develop a nationally consistent framework (see section 5.8.2).
5.6.1 Transmission reliability data
The Energy Supply Association of Australia (ESAA) and the AER report on the reliability of Australia’s transmission networks.
Energy Supply Association of Australia data
The ESAA collects survey data from transmission businesses on reliability, based on system minutes of unsupplied energy to customers. The data are normalised in relation to maximum regional demand to allow comparability.18
The data indicate the NEM jurisdictions have generally achieved high rates of transmission reliability (figure 5.12). In 2007 – 08 total unsupplied energy in all jurisdictions was lower than in the previous year. Unsupplied energy across New South Wales, Victoria and South Australia totalled only 2.1 minutes. New South Wales and Victoria generally experience the least minutes off supply, while Western Australia and Tasmania historically experience the most minutes off supply.
Australian Energy Regulator data
The AER has developed incentive schemes to encourage efficient transmission service quality. The schemes provide financial bonuses (and penalties) to network businesses that meet (or fail to meet) performance targets, which include reliability targets. Specifically, the targets relate to:> transmission circuit availability> the average duration of transmission outages> the frequency of ‘off supply’ events.
5.6 Servicereliabilityofelectricitytransmissionnetworks
Reliability refers to the continuity of electricity supply to customers. Many factors can interrupt the flow of electricity on a transmission network. Interruptions may be planned (for example, due to the scheduled maintenance of equipment) or unplanned (for example, due to equipment failure, bushfires, lightning strikes or the impact of hot weather raising air‑conditioning loads above the capability of a network). A serious network failure might require the power system operator to disconnect some customers (known as load shedding).
As in other segments of the power system, there is a trade‑off between the price and reliability of transmission services. While the jurisdictions apply different reliability standards, all transmission networks are designed to deliver high rates of reliability. The networks are engineered and operated with sufficient capacity to act as a buffer against planned and unplanned interruptions in the power system. More generally, they enhance the reliability of the power supply as a whole by allowing a diversity of generators to supply electricity to end markets. In effect, the networks provide a mix of capacity that can be drawn on to help manage the risk of a power system failure.
Regulatory and planning frameworks aim to ensure, in the longer term, efficient investment in transmission infrastructure to avoid potential reliability issues. In regulating the networks, the AER approves capital and operating expenditure allowances that network businesses can spend at their discretion. To encourage efficient investment, the AER uses incentive schemes that permit network businesses to retain the returns on any underspend against their allowances. As a counterbalance, a service quality incentive scheme rewards network businesses for maintaining or improving service quality. In combination, capital and operating expenditure allowances and incentive schemes encourage transmission businesses to maintain network reliability over time.
138 statE oF tHE EnErGy marKEt 2009
18 System minutes unsupplied are calculated as megawatt hours of unsupplied energy divided by maximum regional demand.

Rather than impose a common benchmark target for all transmission networks, the AER sets separate standards that reflect the circumstances of each network based on its past performance. Under the scheme, the over‑ or underperformance of a network against its targets results in a gain (or loss) of up to 1 per cent of its regulated revenue. A further bonus of up to 2 per cent is available through the transmission congestion component of the scheme (see section 5.7.2).
The revenue at risk may be increased to a maximum of 5 per cent in future regulatory decisions.
The results are standardised for each network to derive an ‘s‑factor’ that can range between – 1 and +1. An s‑factor of – 1 represents the maximum penalty, while +1 represents the maximum bonus. Zero represents a revenue neutral outcome. Table 5.2 sets out the s‑factors for each network for the past five years.
Figure5.12Electricitytransmissionoutages—systemminutesunsupplied
Note: Data not available for Queensland in 2006 – 07 and 2007 – 08.
Source: ESAA, Electricity gas Australia 2009, Melbourne, August 2009.
Table5.2 S-factorvalues
TRANSMISSIONBUSINESSES 2004 2005 2006 2007 2008
Powerlink (Qld) 0.82 0.53
TransGrid (NSW) 0.93 0.70 0.63 – 0.12 0.31
EnergyAustralia (NSW) 1.00 0.67 0.39 – 0.14 0.72
SP AusNet (Vic) 0.22 0.09 – 0.17 0.06 0.15 0.82
ElectraNet (SA) 0.63 0.71 0.59 0.28 0.29 – 0.40
Transend (Tas) 0.55 0.19 0.06 0.56 0.85
Directlink (Qld — NSW) – 0.54 – 0.62 – 1.00
Murraylink (Vic — SA) 0.21 – 0.32 0.69
Notes:
SP AusNet reported separately for the first quarter of 2008 and the remainder of the year.
ElectraNet reported separately for the first and second halves of 2008.
In 2008 SP AusNet transitioned to a new regulatory control period with the financial incentive capped at +1 per cent. Its financial incentive in previous regulatory control periods was capped at +0.5 per cent of its maximum allowable revenue.
Source: AER, Transmission network service providers: electricity performance report for 2007 – 08, Melbourne, August 2009.
139
CHAPTER5ElEc
tric
ity tr
ansm
ission

The major networks in eastern and southern Australia have generally outperformed their s‑factor targets. The only businesses to receive a financial penalty in 2008 were ElectraNet (South Australia), for the second half of the year, and Directlink. Transend received the highest financial reward for 2008 service (0.85 per cent of revenue).
Table 5.3 shows the transmission businesses’ performance against their individual targets. While caution must be taken in drawing conclusions from short data series, the major networks appear to have generally performed well against their targets.
Fıgure 5.13 illustrates the net financial reward or penalty from the scheme for each major network. While the scheme encourages network businesses to improve their performance over time, the financial outcomes relate to individual targets for each network and are not a comprehensive indicator of service quality.
Figure5.13Serviceperformanceincentivescheme—reward/penaltyoutcome
Note: In 2008 SP AusNet transitioned to a new regulatory control period with the financial incentive capped at +1 per cent. Its financial incentive in previous regulatory control periods was capped at +0.5 per cent of its maximum allowable revenue.
Sources: AER, Transmission network service providers: electricity performance report for 2007 – 08, Melbourne, August 2009, and previous years.
5.7 ElectricitytransmissioncongestionTransmission networks do not have unlimited capacity to carry electricity from one location to another. Rather, there are physical limits on the amount of power that can flow over any one part or region of the network. These physical limits arise from the need to prevent damage to the network and ensure stability in the face of small disturbances.
A transmission line can become congested or constrained due to events and conditions on a particular day. Some congestion is caused by factors within the control of a service provider — for example, its scheduling of outages, its maintenance and operating procedures, its standards for network capability (such as thermal, voltage and stability limits), changes in its network monitoring procedures and its decisions on equipment upgrades. Factors beyond the control of the service provider include extreme weather — for example, hot weather can result in high air‑conditioning loads that push a network towards its pre‑determined limits. To protect system security, AEMO may invoke network constraints. Similarly, line maintenance may limit available capacity. The potential for network congestion is magnified if these events occur simultaneously.
If a major transmission outage occurs in combination with other generation or demand events, it can cause the load shedding of some customers. This is rare in the NEM, however. Rather, the main impact of congestion is on the cost of electricity. In particular, transmission congestion increases the total cost of electricity by displacing low cost generation with more expensive generation. If, for example, a particular transmission line is congested, it can prevent a low cost generator that uses the line from being dispatched to satisfy demand; instead, generators that do not require the constrained line will be used. If higher cost generators are used, then the cost of producing electricity ultimately increases.
140 statE oF tHE EnErGy marKEt 2009

Table5.3 Electricitytransmissionbusinesses’performanceagainsttargets
POWERLINK(QLD) TARGET 2004 2005 2006 2007 2008
Transmission line availability — critical elements (%) 99.07 99.44 98.99
Transmission circuit availability — non-critical elements (%) 98.40 98.70 98.51
Transmission circuit availability — peak hours (%) 98.16 98.60 98.48
Frequency of lost supply events greater than 0.2 system minutes 5 1 2
Frequency of lost supply events greater than 1 system minute 1 0 0
Average outage duration (minutes) 1033 612 1046
TRANSGRID(NSW) TARGET 2004 2005 2006 2007 2008
Transmission line availability (%) 99.50 99.72 99.57 99.57 99.38 98.54
Transformer availability (%) 99.00 99.30 98.90 98.84 97.46 98.53
Reactive plant availability (%) 98.50 99.47 99.64 98.92 99.23 99.01
Frequency of lost supply events greater than 0.05 system minutes 5 0 1 2 4 2
Frequency of lost supply events greater than 0.40 system minutes 1 0 0 0 1 0
Average outage duration (minutes) 1500 937 717 812 788 869
ENERGYAUSTRALIA(NSW) TARGET 2004 2005 2006 2007 2008
Transmission feeder availability (%) 96.96 98.57 98.30 97.74 96.62 98.41
SPAUSNET(VIC) TARGET 2004 2005 2006 2007 2008
Total circuit availability (%) 98.73 99.27 99.34 99.25 99.11 99.44 99.12
Peak critical circuit availability (%) 99.39 99.97 99.94 99.88 99.75 99.49 99.80
Peak non-critical circuit availability (%) 99.40 99.57 99.86 99.79 99.86 99.94 99.93
Intermediate critical circuit availability (%) 98.67 99.80 99.75 99.54 99.32 99.42
Intermediate non-critical circuit availability (%) 98.73 99.39 98.21 98.97 95.78 99.53
Frequency of lost supply events greater than 0.05 system minutes 5 2 5 1
Frequency of lost supply events greater than 0.3 system minutes 1 0 2 1
Average outage duration — lines (minutes) 382 164 452 1856 96 172 226
Average outage duration — transformers (minutes) 412 292 398 431 326 656 263
ELECTRANET(SA) TARGET 2004 2005 2006 2007 2008
Transmission line availability (%) 99.25 99.38 99.57 99.42 99.38 99.39
Total transmission circuit availability (%) 99.47 99.05
Peak critical circuit availability (%) 99.24 97.26
Frequency of lost supply events greater than 0.05 system minutes 4 3
Frequency of lost supply events greater than 0.2 system minutes 2 7 0 4 1 0 1
Frequency of lost supply events greater than 1 system minute 2 0 0 0 0 0
Average outage duration (minutes) 78 49 114 88 270 203 195
TRANSEND(TAS) TARGET 2004 2005 2006 2007 2008
Transmission line availability (%) 99.10–99.20
99.34 98.67 99.21 98.99 99.40
Transformer circuit availability (%) 99–99.10 99.31 99.20 98.80 99.55 99.06
Frequency of lost supply events greater than 0.1 system minutes 13–16 18 13 16 10 6
Frequency of lost supply events greater than 2 system minutes 2–3 0 0 1 0 0
n Met target n Below target
Notes:
Performance targets vary across years. The listed target is for 2008. Performance in previous years is measured against the targets for the relevant year.
SP AusNet reported separately for the first quarter of 2008 and the remainder of the year.
ElectraNet reported separately for the first and second halves of 2008.
Sources: AER, Transmission network service providers: electricity performance report for 2007 – 08, Melbourne, August 2009, and previous years.
141
CHAPTER5ElEc
tric
ity tr
ansm
ission

Congestion can also create opportunities for the exercise of market power. If a network constraint prevents low cost generators from moving electricity to customers, then there is less competition in the market. Subsequently, the remaining generators can adjust their bidding to capitalise on their position, which is likely to result in increased electricity prices.
Not all constraints have the same market impact. Most do not force more expensive generation to be dispatched — for example, congestion that ‘constrains off’19 a coal fired plant and requires the dispatch of another coal fired plant may have little net impact. But the costs may be substantial if cheap coal fired generation needs to be replaced by a high cost peaking plant such as a gas fired generator.
Table5.4 Marketimpactofelectricitytransmissionconstraints—AustralianEnergyRegulatormeasures
MEASURE DEFINITION EXAMPLE
Total cost of constraints (TCC)
The total increase in the cost of producing electricity due to transmission congestion (includes outages and network design limits)> Measures the total savings if all constraints
were eliminated.
Hot weather in New South Wales causes a surge in demand for electricity, raising the price. The line between Victoria and the Snowy region reaches capacity, preventing the flow of lower cost electricity into New South Wales to meet the demand. Higher cost generators in New South Wales must be used instead.> TCC measures the increase in the cost of electricity caused
by the blocked transmission line.
Outage cost of constraints (OCC)
The total increase in the cost of producing electricity due to outages on transmission networks> Looks at only congestion caused
by network outages.> Outages may be planned (e.g. scheduled
maintenance) or unplanned (e.g. equipment failure).
> Excludes other causes, such as network design limits.
Maintenance on a transmission line prevents the dispatch of a coal fired generator that requires the use of the line. A higher cost gas fired peaking generator (that uses a different transmission line) has to be dispatched instead.> OCC measures the increase in the cost of electricity caused
by line maintenance.
Marginal cost of constraints (MCC)
The saving in the cost of producing electricity if the capacity on a congested transmission line is increased by 1 megawatt, added over a year> Identifies which constraints have
a significant impact on prices.> Does not measure the actual impact.
See above TCC example.> MCC measures the saving in the cost of producing electricity
in New South Wales if one additional megawatt of capacity was available on the congested line. At any time several lines may be congested. The MCC identifies each network element while the TCC and OCC measure the impact of all congestion (and do not discriminate between individual elements).
With the assistance of the National Electricity Market Management Company (NEMMCO, now AEMO), the AER completed a project in 2006 to measure the impact of transmission congestion in the NEM. The AER measures the cost of transmission congestion by comparing dispatch costs with and without congestion. It has developed three measures of the impact of congestion on the cost of electricity (table 5.4). Two measures (the total cost of constraints, TCC, and the outage cost of constraints, OCC) focus on the overall impact of constraints on electricity costs, while the third measure (the marginal cost of constraints, MCC) identifies which constraints have the greatest impact.20
142 statE oF tHE EnErGy marKEt 2009
19 Under the Electricity Rules, ‘constrained off ’ means ‘in respect of a generating unit, the state where, due to a constraint on a network, the output of that generating unit is limited below the level to which it would otherwise have been dispatched by AEMO on the basis of its dispatch offer’.
20 A more detailed discussion appears in: AER, Indicators of the market impact of transmission congestion — decision, Melbourne, 9 June 2006; AER, annual congestion reports for 2003 – 04, 2004 – 05, 2005 – 06 and 2006 – 07, Melbourne.
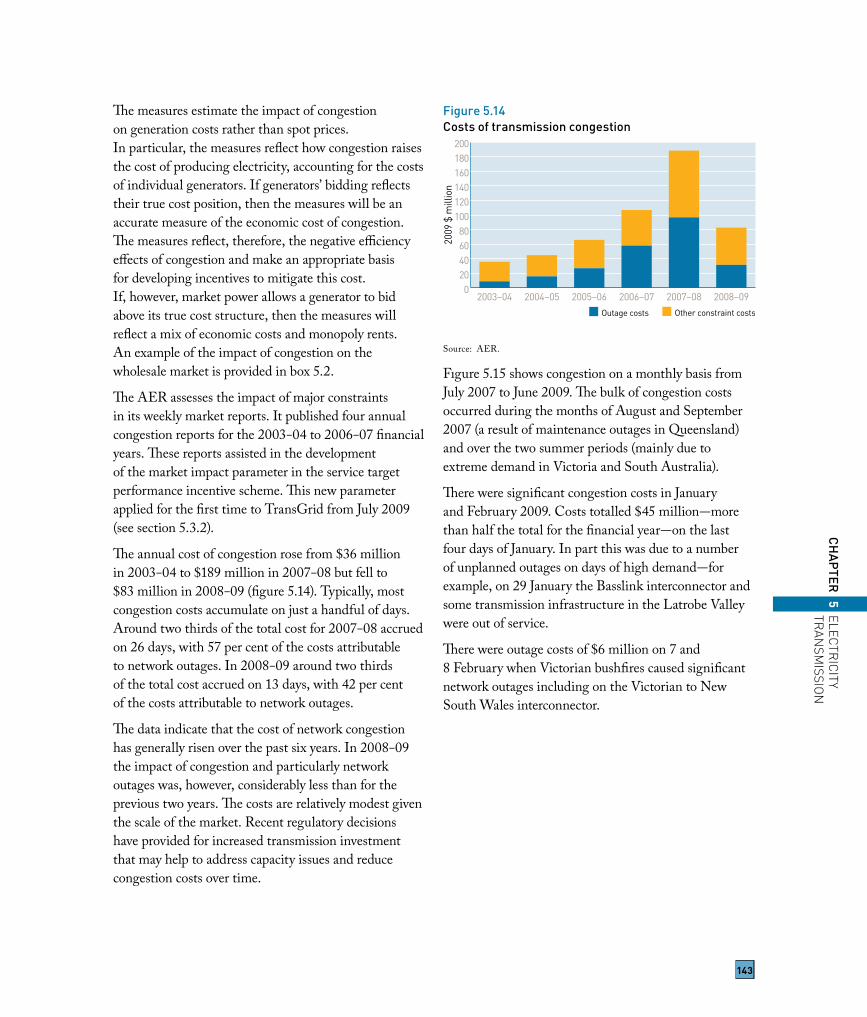
Figure5.14Costsoftransmissioncongestion
Source: AER.
Fıgure 5.15 shows congestion on a monthly basis from July 2007 to June 2009. The bulk of congestion costs occurred during the months of August and September 2007 (a result of maintenance outages in Queensland) and over the two summer periods (mainly due to extreme demand in Victoria and South Australia).
There were significant congestion costs in January and February 2009. Costs totalled $45 million — more than half the total for the financial year — on the last four days of January. In part this was due to a number of unplanned outages on days of high demand — for example, on 29 January the Basslink interconnector and some transmission infrastructure in the Latrobe Valley were out of service.
There were outage costs of $6 million on 7 and 8 February when Victorian bushfires caused significant network outages including on the Victorian to New South Wales interconnector.
The measures estimate the impact of congestion on generation costs rather than spot prices. In particular, the measures reflect how congestion raises the cost of producing electricity, accounting for the costs of individual generators. If generators’ bidding reflects their true cost position, then the measures will be an accurate measure of the economic cost of congestion. The measures reflect, therefore, the negative efficiency effects of congestion and make an appropriate basis for developing incentives to mitigate this cost. If, however, market power allows a generator to bid above its true cost structure, then the measures will reflect a mix of economic costs and monopoly rents. An example of the impact of congestion on the wholesale market is provided in box 5.2.
The AER assesses the impact of major constraints in its weekly market reports. It published four annual congestion reports for the 2003 – 04 to 2006 – 07 financial years. These reports assisted in the development of the market impact parameter in the service target performance incentive scheme. This new parameter applied for the first time to TransGrid from July 2009 (see section 5.3.2).
The annual cost of congestion rose from $36 million in 2003 – 04 to $189 million in 2007 – 08 but fell to $83 million in 2008 – 09 (figure 5.14). Typically, most congestion costs accumulate on just a handful of days. Around two thirds of the total cost for 2007 – 08 accrued on 26 days, with 57 per cent of the costs attributable to network outages. In 2008 – 09 around two thirds of the total cost accrued on 13 days, with 42 per cent of the costs attributable to network outages.
The data indicate that the cost of network congestion has generally risen over the past six years. In 2008 – 09 the impact of congestion and particularly network outages was, however, considerably less than for the previous two years. The costs are relatively modest given the scale of the market. Recent regulatory decisions have provided for increased transmission investment that may help to address capacity issues and reduce congestion costs over time.
143
CHAPTER5ElEc
tric
ity tr
ansm
ission
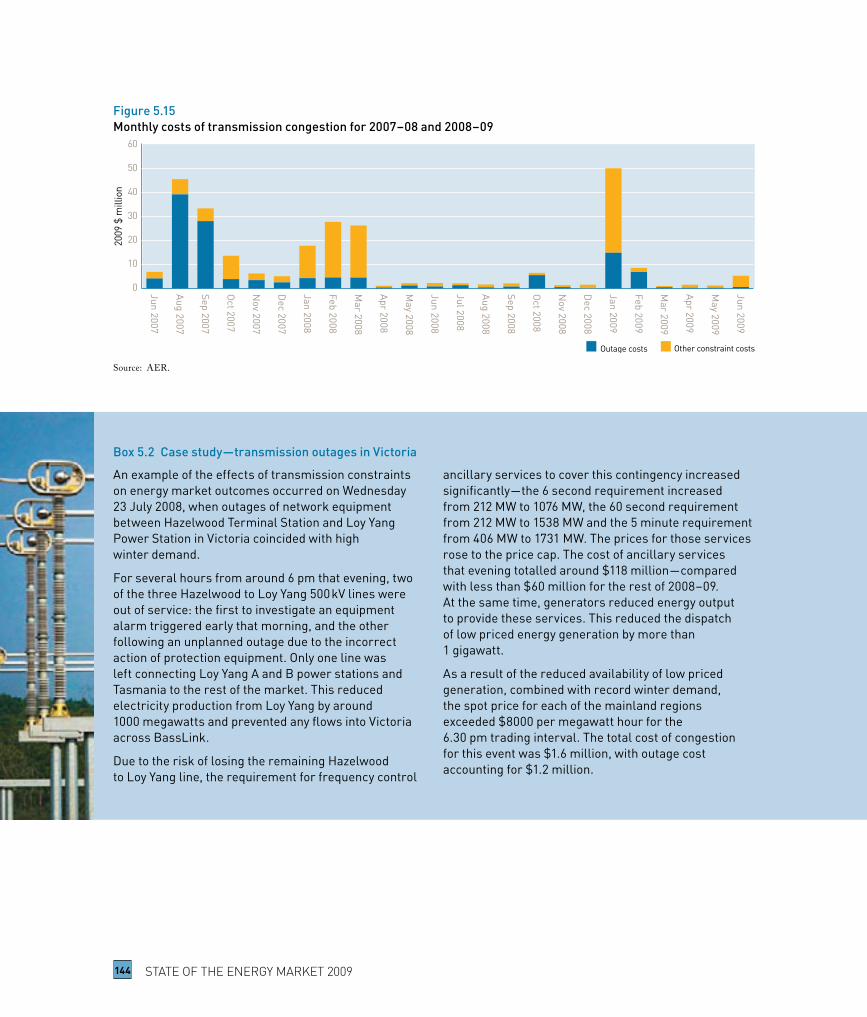
Figure5.15Monthlycostsoftransmissioncongestionfor2007–08and2008–09
Source: AER.
Box5.2 Casestudy—transmissionoutagesinVictoria
An example of the effects of transmission constraints on energy market outcomes occurred on Wednesday 23 July 2008, when outages of network equipment between Hazelwood Terminal Station and Loy Yang Power Station in Victoria coincided with high winter demand.
For several hours from around 6 pm that evening, two of the three Hazelwood to Loy Yang 500 kV lines were out of service: the first to investigate an equipment alarm triggered early that morning, and the other following an unplanned outage due to the incorrect action of protection equipment. Only one line was left connecting Loy Yang A and B power stations and Tasmania to the rest of the market. This reduced electricity production from Loy Yang by around 1000 megawatts and prevented any flows into Victoria across BassLink.
Due to the risk of losing the remaining Hazelwood to Loy Yang line, the requirement for frequency control
ancillary services to cover this contingency increased significantly — the 6 second requirement increased from 212 MW to 1076 MW, the 60 second requirement from 212 MW to 1538 MW and the 5 minute requirement from 406 MW to 1731 MW. The prices for those services rose to the price cap. The cost of ancillary services that evening totalled around $118 million — compared with less than $60 million for the rest of 2008 – 09. At the same time, generators reduced energy output to provide these services. This reduced the dispatch of low priced energy generation by more than 1 gigawatt.
As a result of the reduced availability of low priced generation, combined with record winter demand, the spot price for each of the mainland regions exceeded $8000 per megawatt hour for the 6.30 pm trading interval. The total cost of congestion for this event was $1.6 million, with outage cost accounting for $1.2 million.
144 statE oF tHE EnErGy marKEt 2009

5.7.1 Geography of transmission congestion
Around 1200 network constraints affected the market at least once in 2007 – 08 and 2008 – 09. At any one time, between 550 and 650 constraints were typically in place. Congestion may be significant in a particular area for only a few days a year, but this is sometimes sufficient to have a significant impact on congestion costs.
Fıgure 5.16 shows the locations of significant congestion over the past six years. Locations of congestion may change from year to year due to conditions such as drought, weather events and unscheduled line outages. In 2007 – 08 and 2008 – 09, there was congestion in northern Tasmania; in Victoria’s Latrobe Valley around Hazelwood; in South Australia (mainly in the south east and around Mintaro); and Queensland. Congestion between central Queensland and the load centre in Brisbane has affected the market every year. There was also congestion in northern and central Queensland and on the Middle Ridge to Tangkam transmission line.
There was also congestion on interconnectors between regions, including on the Heywood interconnector (Victoria to South Australia), across QNI (Queensland to New South Wales) and across the Snowy interconnector (Victoria to New South Wales).
5.7.2 Measures to reduce congestion costs
The AER recognises the significance of congestion costs and has responded to the issue by:> developing measures of the market impact of
transmission constraints and publishing data against these measures (as outlined)
> implementing an incentive scheme to reduce transmission constraints
> providing for rising transmission investment in regulatory decisions.
Other responses include the AEMC congestion management review, which aimed to enhance mechanisms to manage congestion in the NEM. The review considered options such as congestion pricing,
changes to regional pricing structures and deeper connection charges (see section 5.8.4). In addition, the Ministerial Council on Energy (MCE) has implemented national transmission planning arrangements which are expected to reduce congestion through enhanced whole‑of‑NEM network planning (see section 5.8.1).
Further, the AEMC congestion management review recommended that AEMO develop a Congestion Information Resource to provide cost‑effective information to participants, to enable them to understand patterns of network congestion and project market outcomes. The review recommended that the resource provide the most recent information on network outages and other planned network events. This would provide participants with a better understanding of how potential changes in system conditions are likely to affect their market risks, allowing for more informed decision making. The AEMC published its decision on changes to the Electricity Rules in August 2009. AEMO is required to publish an interim by March 2010, guidelines by September 2010 and its first final resource by September 2011.
Congestion management incentive scheme
The AER introduced a new incentive mechanism in 2008 to reduce the effects of transmission congestion. The mechanism forms part of the service performance incentive scheme and is designed to encourage network owners to account for the impact of their behaviour on the market.21 The mechanism operates as a bonus‑only scheme. It aims to reward network owners for improving operating practices in areas such as outage timing, outage notification, live line work and equipment monitoring. In some cases, these improvements may be more cost‑efficient measures to reduce congestion than solutions that require investment in infrastructure.
The mechanism permits a transmission business to earn an annual bonus of up to 2 per cent of its revenue if it can eliminate all outage events with a market impact of over $10 per megawatt hour.22
145
CHAPTER5ElEc
tric
ity tr
ansm
ission
21 AER, Electricity transmission network service providers: service target performance incentive scheme, Melbourne, March 2008.22 The level of performance improvement required to receive the full 2 per cent bonus is probably an unrealistic aim. It may be difficult to determine a realistic level
of performance, however, until the scheme has been in place for a period of time.
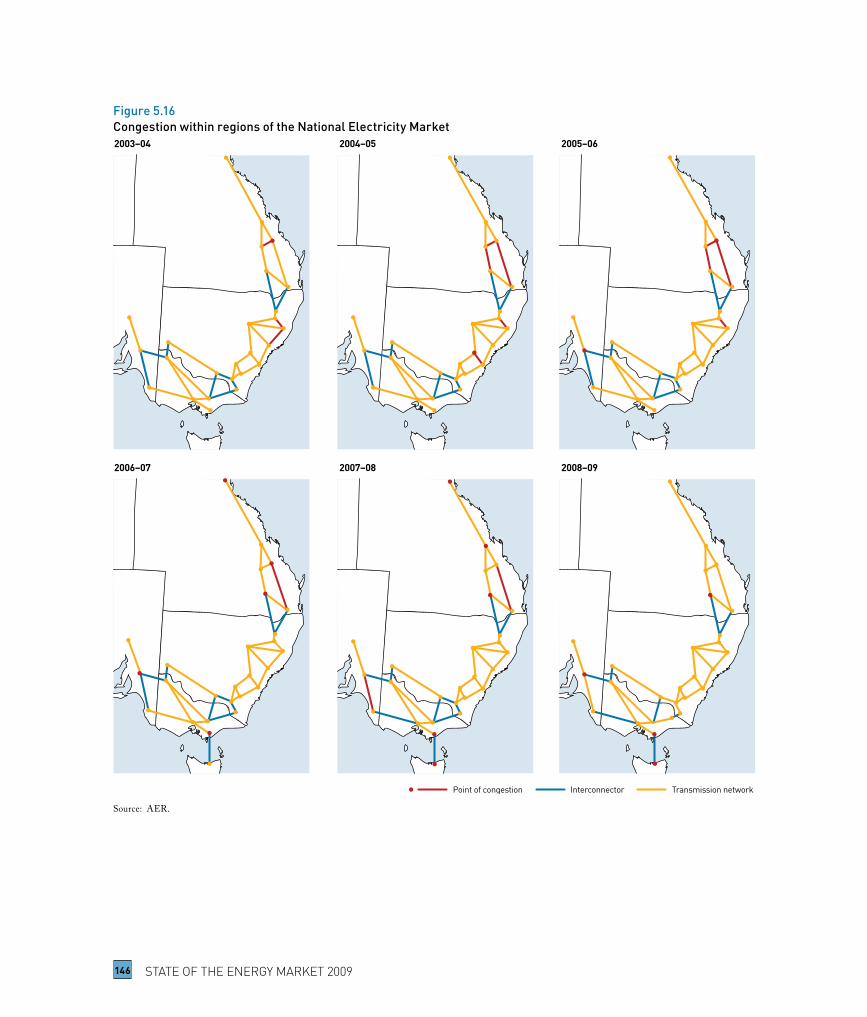
Figure5.16CongestionwithinregionsoftheNationalElectricityMarket
Source: AER.
146 statE oF tHE EnErGy marKEt 2009

Figure5.17Interregionalhedging—auctionproceedsandsettlementresidues
Source: AEMO.
Market participants tend to discount the value of settlement residues because they are not a firm hedging instrument. In particular, a reduction in the capability of an interconnector — for example, due to an outage — reduces the cover that the hedge provides. This makes it difficult for parties to assess the amount of hedging for which they are bidding at the residue auctions. The auction units are, therefore, a less reliable risk management tool than some other financial risk instruments, such as those traded in over‑the‑counter and futures markets (see chapter 3).
5.8 Policydevelopmentsinelectricitytransmission
Recent policy activity in the transmission sector has focused on network planning and operation and the approach to economic regulation. This section summarises policy developments in these areas. Appendix A describes the institutional bodies and organisations with responsibility for developing and implementing energy policy.
5.7.3 Settlement residue auctions
Congestion in transmission interconnectors can cause wholesale electricity prices to differ across the regions of the NEM (see section 2.4). In particular, prices may spike in a region that is constrained in its ability to import electricity. To the extent that trade remains possible, electricity will flow from lower to higher price regions. Consistent with the regional design of the NEM, the exporting generators are paid at their local regional spot price, while importing retailers must pay the higher spot price in their region. The difference between the price paid in the importing region and the price received in the generating region, multiplied by the amount of flow, is called a settlement residue. Fıgure 2.8 (chapter 2) charts the annual accumulation of settlement residues in each region of the NEM.
Price separation creates risks for the parties that contract across regions. AEMO offers a risk management instrument by holding quarterly auctions to sell the rights to future residues up to one year in advance.23 Retailers, generators and other market participants may bid for a share of the residues — for example, a Queensland generator, trading in New South Wales, may bid for residues between those regions if it expects New South Wales prices to settle above Queensland prices. New South Wales is a significant importer of electricity, so it can be vulnerable to price separation and often accrues high settlement residue balances.
Fıgure 5.17 charts the amount of settlement residues that accrued each year against the proceeds of residue auctions from 2000 to 2008. The total value of residues represents the net difference between the prices paid by retailers and the prices received by generators across the NEM. It approximates, therefore, the risk faced by market participants from interregional trade. The figure illustrates that the residues are frequently auctioned for less than their ultimate value. On average, the actual residues have been around 55 per cent higher than the auction proceeds.
147
CHAPTER5ElEc
tric
ity tr
ansm
ission
23 In September 2009 AEMO began consultation on a proposal to extend auctions from one to three years.
Mar
k W
ilson
148 statE oF tHE EnErGy marKEt 2009

In July 2009 the AEMC completed a rule change to replace the regulatory test with the Regulatory Investment Test for Transmission (RIT‑T).24 The new test removes the distinction between reliability driven projects and those driven by the delivery of market benefits. All projects will now be assessed through a single consultation and assessment framework, which aims to identify investments that promote efficiency and, where applicable, meet reliability standards.
The revised assessment process is more comprehensive than the previous process set out in the Electricity Rules, and applies to a wider range of investment projects. It involves greater prescription in the Electricity Rules of the market benefits and costs that the analysis can consider, and a new market benefit category covering an asset’s option value. The AER will develop and publish the RIT‑T and associated guidelines by July 2010.
5.8.3 Climate change (review of energy market frameworks)
The AEMC has reviewed the likely impacts of climate change policies — particularly the carbon pollution reduction scheme and expanded renewable energy target — on energy market frameworks. It released the final report in October 2009.
The AEMC identified the connection process for new generators as a weakness in the Electricity Rules.25 The current process is unlikely to cope with a large increase in connection applications that may result from the introduction of climate change policies — particularly for new investment in renewable generation that may be clustered in certain geographic locations and remote from customers and the transmission network. In particular:> the current bilateral negotiation framework is unlikely
to lead to the development of appropriately by sized connection assets to cater for expected future demand for network access
5.8.1 Australian Energy Market Operator and the National Transmission Planner
In July 2009 AEMO began operating as a single, industry funded national energy market operator for both electricity and gas. It merges the roles of the national electricity market operator (previously undertaken by NEMMCO) with the gas market operators in New South Wales, the ACT, Queensland, Victoria and South Australia. It also assumes the state based electricity planning functions of VENcorp (in Victoria) and the Electricity Industry Supply Planning Council (in South Australia).
AEMO also undertakes new functions, including:> the planning and coordination of development of the
national transmission network> the preparation of a gas statement of opportunities
(see chapter 8).
The National Transmission Planner (NTP) role aims to strengthen transmission planning arrangements in the NEM. In particular, it will attempt to move the planning focus away from priorities within individual jurisdictions, onto the national grid as a whole.
An annual national transmission network development plan will outline the efficient development of the power system. It will provide a long term strategic outlook (minimum 20 years), focusing on national transmission flow paths. It will not replace local planning and will not be binding on transmission businesses or the AER. Rather, the plan will complement shorter term investment planning by transmission businesses.
5.8.2 Regulatory test for investment
The regulatory test is an analysis tool that network businesses use to assess the efficiency of planned investment. It identifies the most effective network augmentation or non‑network option for meeting an identified investment need.
149
CHAPTER5ElEc
tric
ity tr
ansm
ission
24 AEMC, National Electricity Amendment (Regulatory Investment Test for Transmission) Rule 2009 No. 15, Sydney25 AEMC, Review of energy market frameworks in light of climate change policies, final report, Sydney, October 2009.

5.8.4 Congestion management
While the reliability of transmission networks in the NEM is consistently high, network congestion sometimes impedes the dispatch of the most cost‑efficient generation to satisfy demand. The AEMC finalised a congestion management review in 2008 that considered the scope for enhanced market based solutions to manage trading risks.26
Following the review, the MCE initiated a rule change to implement the main recommendations. These included:> formalising in the Electricity Rules AEMO’s current
process for determining which generators to dispatch in the market
> amending the Electricity Rules to reduce financial uncertainty for holders of settlement residue units, including new arrangements to manage and fund negative settlement residues
> publishing a congestion information resource by AEMO to consolidate and enhance information on network congestion.
In 2008 the AER launched a scheme that provides incentives for network businesses to better manage factors within their control that can lead to transmission congestion — for example, the scheduling of outages (see section 5.7.2).27
5.8.5 Jurisdictional reliability standards
The Energy Reform Implementation Group reported in 2007 that the current transmission reliability standards set by the jurisdictions need greater clarity and transparency. In particular, it formed a view that clause 5.1 of the Electricity Rules and the majority of jurisdictional reliability obligations require significant interpretation.28
> confidentiality provisions limit the opportunity to coordinate multiple connection applications, leading to delays and additional costs in the connection process.
To take advantage of economies of scale in network assets, the AEMC has recommended a new framework for developing network extensions for remote generation. The framework will coordinate connection applications, with the extension assets sized to allow for expected growth in demand for network access. Customers will bear the risk of oversized connection assets.
In May 2009 the AEMC published a draft rule determination to amend the confidentiality provisions for network connection applications. The change is designed to allow for greater coordination of connection applications.
The AEMC also considered that climate change policies may result in higher levels of network congestion within and across regions. It suggested stronger signals for generator entry location and generator exit could help resolve this issue. The signals could be provided through a combination of generator transmission charges (revenue neutral within each region) and constraint pricing at points in the network experiencing ongoing congestion.
The AEMC also proposed a model for interregional transmission charging. Under current arrangements, customers in an importing region of the NEM do not pay transmission businesses in the exporting region the costs incurred to serve their load. The AEMC supports the introduction of a load export charge that would treat the transmission business of the importing region as a customer of the transmission business of the exporting region. All charges to the network would ultimately be recovered from the network’s customers.
150 statE oF tHE EnErGy marKEt 2009
26 AEMC, Congestion management review, final report, Sydney, June 200827 AER, Service target performance incentive scheme version 2, Melbourne, March 2008.28 ERIG, Energy reform — the way forward for Australia, Report to the Council of Australian Governments, Canberra, January 2007.

In response, the AEMC Reliability Panel undertook a review of jurisdictional transmission reliability standards. In August 2008 the AEMC released a final report endorsing the findings of the panel and setting out its preferred option for a nationally consistent framework.29 Key features of the framework include:> economically derived and deterministically expressed
standards set on a jurisdictional basis by independent jurisdictional authorities
> the introduction of a national reference standard to compare reliability standards across jurisdictions
> a clear and transparent standard setting process.
5.8.6 Jurisdictional technical standards
In April 2009 the AEMC Reliability Panel completed an initial review of jurisdictional transmission technical standards.30 The final report set out guiding principles on which to base a detailed review of the technical standards in the NEM, and it suggested minor changes to allow more efficient compliance.
The panel recommended deferring a detailed review until sufficient new connections have taken place under the current technical standards to better assess their effectiveness.
151
CHAPTER5ElEc
tric
ity tr
ansm
ission
29 AEMC, Towards a nationally consistent framework for transmission reliability standards, final report, Sydney, September 2008.30 AEMC Reliability Panel, Technical standards review, final report, Sydney, April 2009.