5-3 Slope and Rates of Change Warm Up Warm Up Lesson Presentation Lesson Presentation Problem of the...
33
5-3 Slope and Rates of Change Warm Up Warm Up Lesson Presentation Lesson Presentation Problem of the Day Problem of the Day Lesson Quizzes Lesson Quizzes
-
Upload
holly-garrison -
Category
Documents
-
view
214 -
download
1
Transcript of 5-3 Slope and Rates of Change Warm Up Warm Up Lesson Presentation Lesson Presentation Problem of the...

5-3 Slope and Rates of Change
Warm UpWarm Up
Lesson PresentationLesson Presentation
Problem of the DayProblem of the Day
Lesson QuizzesLesson Quizzes

5-3 Slope and Rates of Change
Warm UpGraph the linear function.
y = 2x + 4
5-3 Slope and Rates of Change
Problem of the Day
What two 3-digit numbers have a product of 19,019?
133 and 143

5-3 Slope and Rates of Change
Learn to determine the slope of a line and to recognize constant and variable rates of change.

5-3 Slope and Rates of Change
Vocabulary
slope
rate of change

5-3 Slope and Rates of Change
The slope of a line is a measure of its steepness and is the ratio of rise to run:
y
If a line rises from left to right, its slope is positive. If a line falls from left to right, its slope negative.
x
Run
Rise

5-3 Slope and Rates of Change
Tell whether the slope is positive or negative. Then find the slope.
Additional Example 1A: Identifying the Slope of the Line
The line rises from left to right.
The slope is positive.

5-3 Slope and Rates of Change
Tell whether the slope is positive or negative. Then find the slope.
Additional Example 1A Continued
The rise is 3. The run is 3.
slope = riserun
= 33
= 1
3
3

5-3 Slope and Rates of Change
Tell whether the slope is positive or negative. Then find the slope.
Additional Example 1B: Identifying the Slope of the Line
The line falls from right to left.
The slope is negative.
0 2
2
–2–2
y
x

5-3 Slope and Rates of Change
Tell whether the slope is positive or negative. Then find the slope.
Additional Example 1B Continued
The rise is 2. The run is -3.
slope = riserun
= 2 -3
2
-3
0 2
2
–2–2
y
x

5-3 Slope and Rates of Change
Check It Out: Example 1A
The line does not point upward or downward so it is not positive or negative.
Tell whether the slope is positive or negative. Then find the slope.

5-3 Slope and Rates of Change
Check It Out: Example 1A Continued
The rise is 0. The run is 2.
slope = riserun
= 02
= 0
M(1, –1) N(3, –1)
2
Tell whether the slope is positive or negative. Then find the slope.

5-3 Slope and Rates of Change
Check It Out: Example 1B
(0, –4)
(–2, 4)
8
–2
The rise is 8. The run is –2.
slope = riserun
= 8–2 = –4
Tell whether the slope is positive or negative. Then find the slope.
The line falls from left to right.
The slope is negative.

5-3 Slope and Rates of Change
You can graph a line if you know its slope and one of its points.

5-3 Slope and Rates of Change
Use the slope and the point (1, –1) to graph the line.
Additional Example 2A: Using Slope and a Point to Graph a Line
2 1
From point (1, 1) move 2units down and 1 unitright, or move 2 units up and 1 unit left. Mark the point where you end up, and draw a line through the two points.
y
x–4
–4
4
4
0 2
2
–2–2
= orriserun
-2 1
2-1
●
●

5-3 Slope and Rates of Change
You can write an integer as a fraction by putting the integer in the numerator of the fraction and a 1 in the denominator.
Remember!

5-3 Slope and Rates of Change
Use the slope and the point (–1, –1) to graph the line.
Additional Example 2B: Using Slope and a Point to Graph a Line
1 2
From point (–1, –1) move 1unit up and 2 units right. Mark the point where you end up, and draw a line through the two points.
y
x–4
–4
4
4
0 2
2
–2–2
=riserun
1 2
●
5-3 Slope and Rates of Change
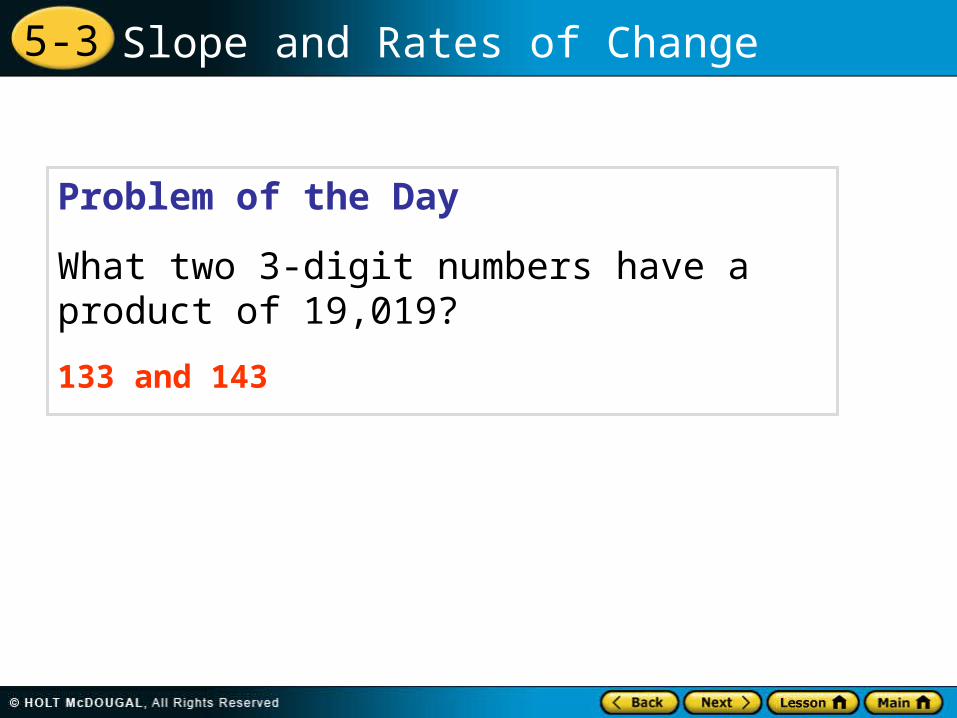
Use the slope – and the point (2, 0) to graph the line.
Check It Out: Example 2A
2 3
From point (2, 0) move 2units down and 3 unitsright, or move 2 units up and 3 unit left. Mark the point where you end up, and draw a line through the two points.
y
x–4
–4
4
4
0 2
2
–2–2
= orriserun
-2 3
2-3
●
●

5-3 Slope and Rates of Change
Use the slope and the point (–2, 0) to graph the line.
Check It Out: Example 2B
1 4
From point (–2, 0) move 1unit up and 4 units right. Mark the point where you end up, and draw a line through the two points.
y
x–4
–4
4
4
0 2
2
–2–2
=riserun
1 4
●

5-3 Slope and Rates of Change
The ratio of two quantities that change, such as slope, is a rate of change.
A constant rate of change describes changes of the same amount during equal intervals.
A variable rate of change describes changes of a different amount during equal intervals.
The graph of a constant rate of change is a line, and the graph of a variable rate of change is not a line.

5-3 Slope and Rates of Change
Tell whether each graph shows a constant or variable rate of change.
A. B.
Additional Example 3: Identifying Rates of Change in Graphs
The graph is nonlinear,so the rate of change is variable.
The graph is linear, so the rate of change isconstant.

5-3 Slope and Rates of Change
Check It Out: Example 3
Tell whether each graph shows a constant or variable rate of change.
A. B.
The graph is nonlinear,so the rate of change is variable.
The graph is linear, so the rate of change isconstant.
y
x–4
–4
4
4
0 2
2
–2–2
y
x–4
–4
4
4
0 2
2
–2–2

5-3 Slope and Rates of Change
The graph shows the distance a monarch butterfly travels overtime. Tell whether the graph shows a constant or variable rate of change. Then find how fast the butterfly is traveling.
Additional Example 4: Using Rate of Change to Solve Problems

5-3 Slope and Rates of Change
Additional Example 4 Continued
The graph is a line, so the butterfly is traveling at a constant rate of speed.
The amount of distance is the rise, and the amount of time is the run. You can find the speed by finding the slope.
slope (speed) = rise (distance)run (time) = 20 miles
1 hour
The butterfly travels at a rate of 20 miles per hour.
5-3 Slope and Rates of Change
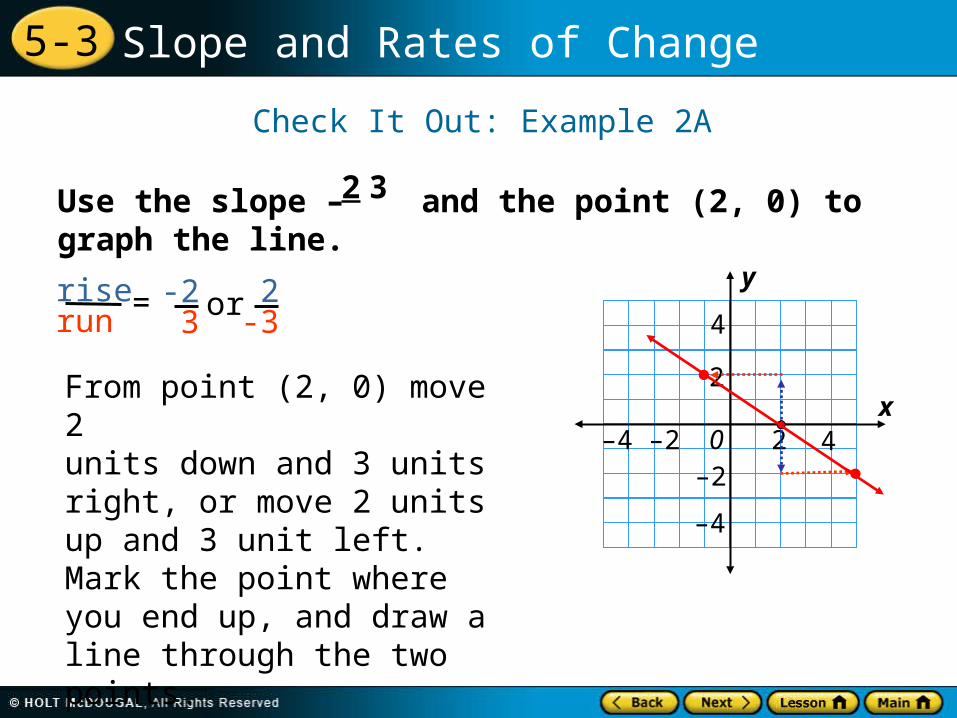
Check It Out: Example 4The graph shows the distance a jogger travels over time. Is he traveling at a constant or variable rate. How fast is he traveling?
7 14 21 28 35Time (min)
1
2
3
4
5
6
Dis
tan
ce (
mi)
7 14 21 28 35Time (min)
1
2
3
4
5
6
Dis
tan
ce (
mi)
1
7
7
1

5-3 Slope and Rates of Change
Check It Out: Example 4 Continued
The graph is a line, so the jogger is traveling at a constant rate of speed.
slope (speed) = rise (distance)run (time) = 1 mi
7 min
The jogger travels at a rate of 1 mile every 7minutes.
The amount of distance is the rise, and the amount of time is the run. You can find the speed by finding the slope.
5-3 Slope and Rates of Change
Standard Lesson Quiz
Lesson Quizzes
Lesson Quiz for Student Response Systems

5-3 Slope and Rates of Change
Lesson Quiz: Part I
1. Tell whether the slope is positive or negative. Then find the slope.
Negative; -1
5-3 Slope and Rates of Change
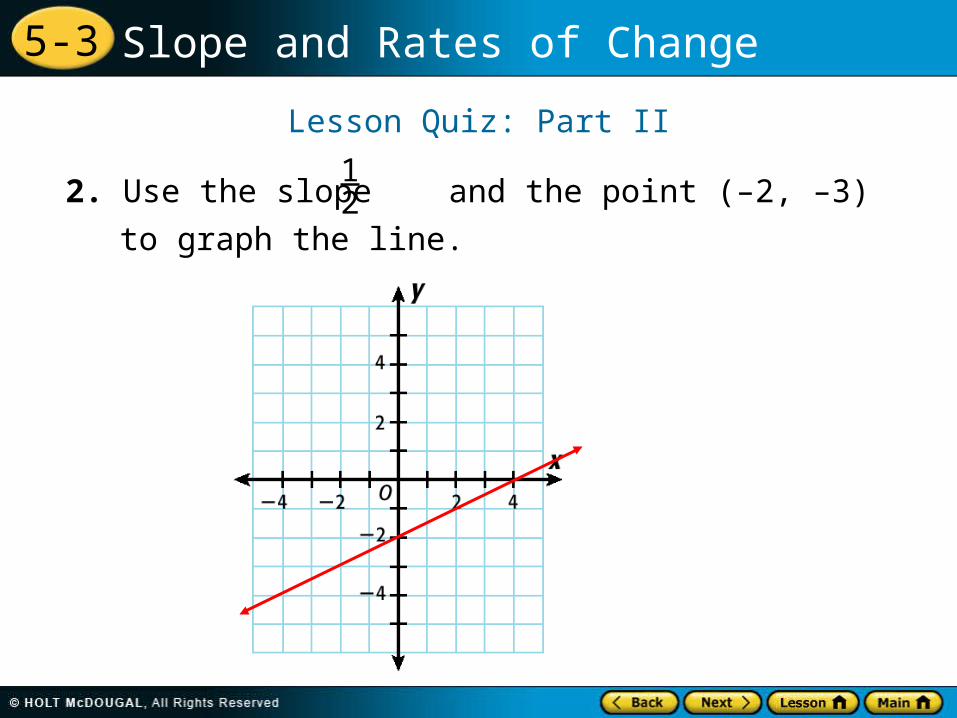
Lesson Quiz: Part II
2. Use the slope and the point (–2, –3) to graph
the line.
12

5-3 Slope and Rates of Change
Lesson Quiz: Part III
3. Tell whether the graph shows a constant or
variable rate of change.
variable

5-3 Slope and Rates of Change
1. Tell whether the slope is positive or negative. Then identify the slope.
A. positive; 1
B. positive; 2
C. negative; –1
D. negative; –2
Lesson Quiz for Student Response Systems

5-3 Slope and Rates of Change
2. Use the slope and the point (–2, –3) to
identify the graph of the line.
A. B.
Lesson Quiz for Student Response Systems
1 4

5-3 Slope and Rates of Change
3. Which of the following graphs represents a variable rate of change?
A. B.
Lesson Quiz for Student Response Systems