4th Quarter Interim Financial Report 2016
25
b 2016 4th Quarter Interim Financial Report
Transcript of 4th Quarter Interim Financial Report 2016
b
2016
4th Quarter Interim Financial Report

VV Holding AS | Q4 Report 2016 | Page 2
TABLE OF CONTENT
DISCLAIMER ................................................................................................................................................................................ 3
PRESENTATION OF THE GROUP.................................................................................................................................................. 4
COMMENTS BY THE CEO ............................................................................................................................................................ 6
KEY FINANCIAL FIGURES ............................................................................................................................................................. 7
RESULTS OF OPERATIONS........................................................................................................................................................... 7
FINANCIAL POSITION .................................................................................................................................................................. 9
OPERATING AND FINANCIAL REVIEW ....................................................................................................................................... 10
UPDATE OF MATERIAL RISK FACTORS AND EVENTS AFTER REPORTING PERIOD ..................................................................... 14
CONDENSED INTERIM FINANCIAL STATEMENTS ...................................................................................................................... 15
NOTES TO THE CONDENSED INTERIM CONSOLIDATED FINANCIAL STATEMENTS ................................................................... 21
RESPONSIBILITY STATEMENT ................................................................................................................................................... 24
CONTACTS ................................................................................................................................................................................ 25

VV Holding AS | Q4 Report 2016 | Page 3
DISCLAIMER
VV Holding AS is providing the following interim financial statements for Q4 2016 to holders of its NOK 2,235,000,000 Senior Secured Floating Rate Notes due 2019.
This report is for information purposes only and does not constitute an offer to sell or the solicitation of an offer to buy the notes or any other security.
This report includes forward-looking statements that are based on our current expectations and projections about future events. All statements other than statements of historical facts included in this notice, including statements regarding our future financial position, risks and uncertainties related to our business, strategy, capital expenditures, projected costs and our plans and objectives for future operations, including our plans for future costs savings and synergies may be deemed to be forward-looking statements.
Words such as “believe,” “expect,” “anticipate,” “may,” “assume,” “plan,” “intend,” “will,” “should,” “estimate,” “risk” and similar expressions or the negatives of these expressions are intended to identify forward-looking statements. By their nature, forward-looking statements involve known and unknown risks and uncertainties because they relate to events and depend on circumstances that may or may not occur in the future. Forward-looking statements are not guarantees of future performance.
You should not place undue reliance on these forward-looking statements. In addition, any forward-looking statements are made only as of the date of this notice, and we do not intend and do not assume any obligation to update any statements set forth in this notice.

VV Holding AS | Q4 Report 2016 | Page 4
PRESENTATION OF THE GROUP
The Norsk Gjenvinning Group is Norway’s leading recycling company offering a wide range of sustainable waste management services and providing secondary raw materials.
Norsk Gjenvinning is present in two markets; upstream and downstream;
In the upstream market, Norsk Gjenvinning provides waste management services to local businesses, the municipal sector and private households in Norway, Sweden, Denmark and the United Kingdom
The downstream markets consist of production/pre-treatment and sales of (i) secondary raw materials, such as recovered paper, plastic and metals to commodity producers in Scandinavia, Europe and Asia and (ii) fuels to waste-to-energy customers in Norway and Sweden
The Group’s vision is to turn waste into the solution for tomorrow’s resource problems. The Group’s mission is to work tirelessly to become the industry’s most customer-oriented, efficient and profitable player, with the goal of being perceived as the most important recycling company in the Nordic region. The Group’s operations are based on our four core values; salesmanship, proactivity, responsibility and team spirit.
The Group has approximately 1,400 employees, 44,000 customers and handles 1.8 million tonnes of waste per year – 39% of which goes to material recycling, 44% to energy recycling and 17% to landfill and other.
The following illustrates the Group Structure:
The Group’s businesses consist of the following divisions:
Division Recycling: Operations include collection, sorting and treatment/recycling of mixed industrial waste, collection and treatment of hazardous waste, paper, plastics, wood chips and other non-hazardous waste fractions, and operation of municipal recycling stations
Division Metal: Operations include collection, sorting and treatment/recycling of all kinds of ferrous and non-ferrous metals, including vehicles, cables, and electrical waste
Division Industry & Offshore: Operations include (i) Industrial services, including tank cleaning, plant maintenance stops, cleaning of sand traps and oil separators, pipe inspection and high-pressure suction, and (ii) Emergency services (oil spills, etc.)
Division Household Collection: Operations consist of collection of household waste on behalf of Norwegian and Swedish municipalities.
Other Business areas: Operations include (i) Downstream sales of processed waste and trading, (ii) Secure handling and destruction of documents, (iii) Development and operation of Landfill projects for low level contaminated soil, (iv) Demolition and restoration of buildings and (v) all other businesses
Norsk Gjenvinning Norge AS is owned by VV Holding AS, and POS Holding AS as the ultimate parent. POS Holding AS is controlled by Altor Fund III.

VV Holding AS | Q4 Report 2016 | Page 5
Consolidated companies:
VV Holding AS (Issuer) Norsk Gjenvinning Norge AS 100% Norsk Gjenvinning AS 100% Norsk Gjenvinning Downstream AS 100% Norsk Gjenvinning Industri AS 100% Norsk Gjenvinning Metall AS 100% Norsk Gjenvinning Miljøeiendommer AS 100% Norsk Gjenvinning Offshore AS 100% Norsk Gjenvinning Renovasjon AS 100% Norsk Makulering AS 100% Nordisk Genanvendelse aps (DK) 100% Nordisk Återvinning Trading AB (SE) 100% Nordisk Återvinning Service AB (SE) 100% Norsk Gjenvinning Renovasjon Service AS 100% NG Fellestjenester AS 100% NG Vekst AS 100% Eivind Koch Rørinspeksjon AS 100% Humlekjær og Ødegaard AS 100% IBKA A/S (DK) 100% IBKA AB (SE) 100% IBKA UK Ltd (UK) 100% Løvås Transportfirma AS 100% Tomwil Miljø AS 100% Metall & Gjenvinning AS 100% Rivningsspesialisten AS 100% Wilhelmsen Containerservice AS 100% Ødegaard Gjenvinning AS 100%
Sortera Norge AS 100% Bingsa AS 100% Hegstadmoen 7 AS 100% Taranrødveien 85 AS 100% Opphaugveien 6 AS 100% Øra Eiendom Utvikling AS 100 % Norsk Gjenvinning M3 AS 100% Asak Massemottak AS 100% Løvenskiold Massemottak AS 100% Kopstad Massemottak AS 100% Borge Massemottak AS 100% Skjørten Massemottak AS 100% Solli Massemottak AS 100% Norsk Gjenvinning Renovasjon Ressurs AS 100% Norsk Gjenvinning Renovasjon Stab AS 100% Adact AS 100% NG Startup X AS 100% NG Startup XI AS 100% Ownership <100% R3 Entreprenør Holding AS 81.25% R3 Entreprenør AS 81.25% Østfold Gjenvinning AS 66% iSekk AS 55%
If not explicitly mentioned otherwise, the financial information contained in this report relates to the unaudited financial information on a consolidated basis at the Issuer level for the three and twelve months ended December 31, 2016 and December 31, 2015 respectively.
VV Holding AS | Q4 Report 2016 | Page 6
COMMENTS BY THE CEO
Markets continued to be challenging in Q4, however our focus on cost reductions and price increases was able to offset the negative market pressures in the quarter. Thus our gross margins and EBITDA increased year over year in Q4. We will continue our efforts to increase upstream prices to normalize margins, and our cost initiatives will continue unabated. The NG group has now been repositioned and as market conditions stabilize, we expect a positive development for the group in 2017.
HIGHLIGHTS Q4 2016 Core business decrease in operating revenue of 0.6 % compared to Q4 2015 0.8% reduction in waste volumes compared to Q4 2015 1.1% increase in gross margins Adjusted EBITDA of NOK 63.1 million, up by NOK 6.0 million compared to Q4 2015 NG200 cost and productivity initiatives being implemented according to plan. Operating
costs reduced by NOK 45.7 million YTD in NG core divisions. Total costs YTD increased by NOK 9.1 million due to the growth and insourcing of activities in other businesses.
During the quarter, we continued to experience challenging markets. We did however see some positive developments. Metal prices increased during Q4 and were significantly higher than a year earlier. Deterioration of RDF gate fees has stopped and gate fees were at the same level as in Q4 2015. However, and as expected, the downstream deterioration of the woodchips market continued due to low demand from incineration plants based on high inventories due to mild winters.
Volumes in Q4 were down 0.8% compared to the same quarter of last year, from 378,246 tons in 2015 to 375,408 tons in 2016. Both recycling and metals fractions were down, while we saw an increase in ferrous volumes of 19.1%, following increased imports. Activity from our industrial customers in south-east of Norway increased during the quarter.
Scrap ferrous prices (CELSA index) improved in Q4 ending the quarter at NOK 1,165 per ton. Non-ferrous metal prices increased for aluminum and copper, while we saw a decline for nickel. As mentioned in previous reports, scrap ferrous prices have a direct effect on gross profit in the Recycling division, since these metals are sorted out from the processing of waste. Price increases in Q4 were thus positive for gross margins in the Recycling division. In the metals division, the price increase, coming late in the quarter, only had a limited effect on results in Q4. Furthermore, we have seen a continuation of decreased content of metals in ferrous scrap, putting additional pressure on margins in the metals division. We are continuously trying to adjust upstream prices to reflect the lower quality of ferrous volumes, but this has until now proven difficult to implement due to fierce competition in the upstream markets.
RDF markets were stable in Q4 compared to Q3. Furthermore, incineration gate fees are now at the same level as a year earlier. Inventories at incineration plants are still high, but the situation has improved further during Q4. To mitigate increased downstream gate fees, we increased upstream prices in Q3, without losing our competitive edge as competitors are acting correspondingly to pass on their increased downstream costs. We will continue to increase upstream prices and focus on increased quality of finished products, more efficient freight solutions to downstream customers and increased sales of ancillary services to outweigh the negative gross profit effects from increased gate fees.
Overall, our adjusted EBITDA increased by NOK 6.0 million year over year, in spite of us booking approximately NOK 16 million in NG200 related costs during the quarter. We are therefore relatively satisfied with the results development in Q4, especially since 2016 results as a whole were disappointing. In 2017 we will continue to see the effects of our cost cutting and a range of other measures to increase productivity along the full value chain, combined with efforts to further improve gross margins through increased upstream prices. We therefore expect improved results in 2017.
Erik Osmundsen CEO
VV Holding AS | Q4 Report 2016 | Page 7
KEY FINANCIAL FIGURES
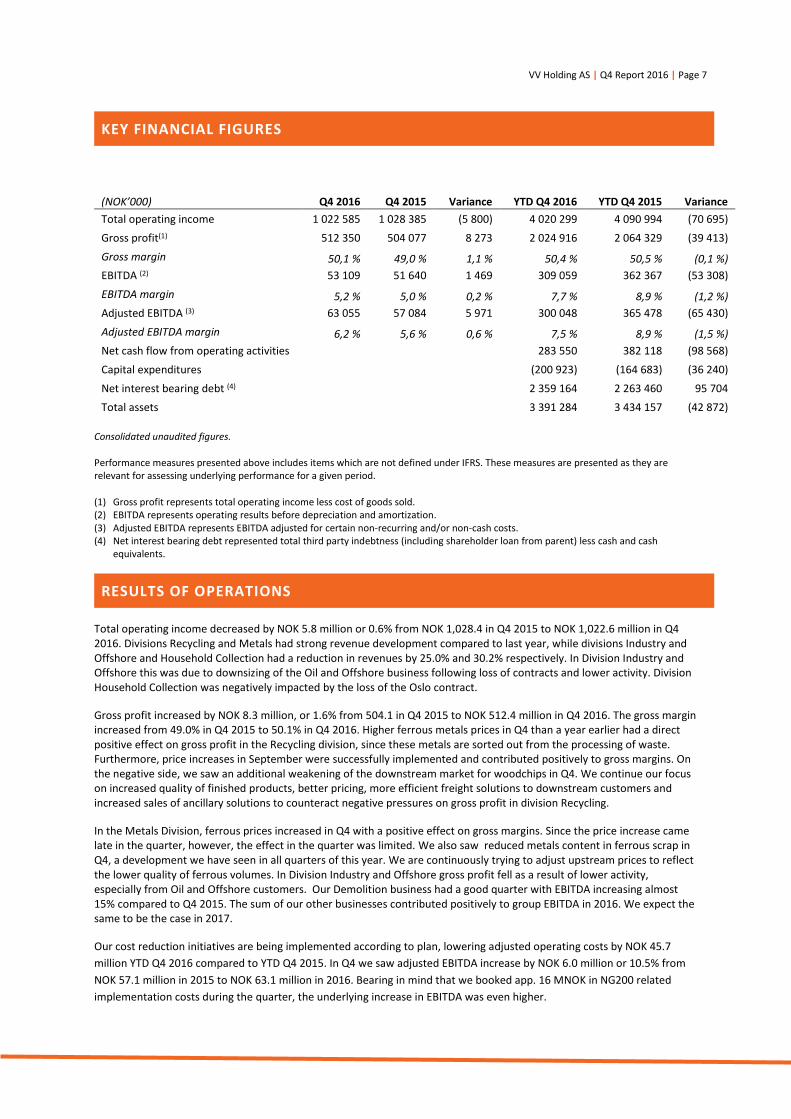
(NOK’000) Q4 2016 Q4 2015 Variance YTD Q4 2016 YTD Q4 2015 Variance Total operating income 1 022 585 1 028 385 (5 800) 4 020 299 4 090 994 (70 695) Gross profit(1) 512 350 504 077 8 273 2 024 916 2 064 329 (39 413) Gross margin 50,1 % 49,0 % 1,1 % 50,4 % 50,5 % (0,1 %) EBITDA (2) 53 109 51 640 1 469 309 059 362 367 (53 308) EBITDA margin 5,2 % 5,0 % 0,2 % 7,7 % 8,9 % (1,2 %) Adjusted EBITDA (3) 63 055 57 084 5 971 300 048 365 478 (65 430) Adjusted EBITDA margin 6,2 % 5,6 % 0,6 % 7,5 % 8,9 % (1,5 %) Net cash flow from operating activities 283 550 382 118 (98 568) Capital expenditures (200 923) (164 683) (36 240) Net interest bearing debt (4) 2 359 164 2 263 460 95 704 Total assets 3 391 284 3 434 157 (42 872)
Consolidated unaudited figures.
Performance measures presented above includes items which are not defined under IFRS. These measures are presented as they are relevant for assessing underlying performance for a given period.
(1) Gross profit represents total operating income less cost of goods sold. (2) EBITDA represents operating results before depreciation and amortization. (3) Adjusted EBITDA represents EBITDA adjusted for certain non-recurring and/or non-cash costs. (4) Net interest bearing debt represented total third party indebtness (including shareholder loan from parent) less cash and cash
equivalents.
RESULTS OF OPERATIONS
Total operating income decreased by NOK 5.8 million or 0.6% from NOK 1,028.4 in Q4 2015 to NOK 1,022.6 million in Q4 2016. Divisions Recycling and Metals had strong revenue development compared to last year, while divisions Industry and Offshore and Household Collection had a reduction in revenues by 25.0% and 30.2% respectively. In Division Industry and Offshore this was due to downsizing of the Oil and Offshore business following loss of contracts and lower activity. Division Household Collection was negatively impacted by the loss of the Oslo contract.
Gross profit increased by NOK 8.3 million, or 1.6% from 504.1 in Q4 2015 to NOK 512.4 million in Q4 2016. The gross margin increased from 49.0% in Q4 2015 to 50.1% in Q4 2016. Higher ferrous metals prices in Q4 than a year earlier had a direct positive effect on gross profit in the Recycling division, since these metals are sorted out from the processing of waste. Furthermore, price increases in September were successfully implemented and contributed positively to gross margins. On the negative side, we saw an additional weakening of the downstream market for woodchips in Q4. We continue our focus on increased quality of finished products, better pricing, more efficient freight solutions to downstream customers and increased sales of ancillary solutions to counteract negative pressures on gross profit in division Recycling.
In the Metals Division, ferrous prices increased in Q4 with a positive effect on gross margins. Since the price increase came late in the quarter, however, the effect in the quarter was limited. We also saw reduced metals content in ferrous scrap in Q4, a development we have seen in all quarters of this year. We are continuously trying to adjust upstream prices to reflect the lower quality of ferrous volumes. In Division Industry and Offshore gross profit fell as a result of lower activity, especially from Oil and Offshore customers. Our Demolition business had a good quarter with EBITDA increasing almost 15% compared to Q4 2015. The sum of our other businesses contributed positively to group EBITDA in 2016. We expect the same to be the case in 2017.
Our cost reduction initiatives are being implemented according to plan, lowering adjusted operating costs by NOK 45.7 million YTD Q4 2016 compared to YTD Q4 2015. In Q4 we saw adjusted EBITDA increase by NOK 6.0 million or 10.5% from NOK 57.1 million in 2015 to NOK 63.1 million in 2016. Bearing in mind that we booked app. 16 MNOK in NG200 related implementation costs during the quarter, the underlying increase in EBITDA was even higher.

VV Holding AS | Q4 Report 2016 | Page 8
The following table reconciles EBITDA to adjusted EBITDA for the periods indicated:
YTD Q4 2016 YTD Q4 2015 Consolidated Consolidated
(NOK’000) unaudited unaudited
EBITDA 309 059 362 367
Change in provision for onerous contract (1) (3 066) 9 200 Gains on sale of real estate (2) (17 310) - Close down of landfill project(3) 7 101 - Costs related to dispute with Scomi(4) 1 115 1 426 Provision for tax case(5) 2 430 - Lawsuits(6) - (9 561) Gains on sale of subsidiary(7) - (2 333) Other non-recurring costs (8) 719 4 379 Adjusted EBITDA 300 048 365 478
(1) During the fourth quarter 2015, an onerous contract was identified in the Household collection division. A provision of NOK 9.2 million was recognized as other operating expenses in the three and twelve-month periods ending December 31, 2015. The contract in question runs until August 2019, with a two year option for the counterpart. An assumption of total duration of contract of five years and eight months has been used in the calculation of the estimated loss.
(2) Three properties where sold in Q3 2016 for a total gain on sale of NOK 17.3 million. (3) One of the landfills operated by the group is currently closed and there is high uncertainty as to whether and when the affected landfill
will reopen, thus all unamortized expenses have been taken to profit or loss in Q4. (4) Incurred costs related to arbitral proceedings in dispute between Norsk Gjenvinning Offshore AS (NGO) and Scomi Oiltools Europe Ltd
(Scomi). NGO and Scomi were parties to a contract which was terminated in February 2012. Following the termination of that contract, NGO raised arbitration proceedings against Scomi in June 2012. In March 2014, the arbitral tribunal found in favor of NGO and ordered Scomi to pay to NGO the sum of NOK 56.6 million plus legal costs and the tribunal’s costs. NGO is contesting potentially challengeable transactions conducted by Scomi in the period from May 2012 to June 2014 in an attempt to recover as much as possible of the claim. NOK 9.4 million of the claim is recognized per December 31, 2016.
(5) VV Holding AS has received a notice from Norwegian Tax authorities, in which they are considering a recalculation of deductible VAT. A total of NOK 2.4 million has been recognized as a provision in Q4 2016. See note 5 to the interim financial statements.
(6) The net effect of reversal in 2015 of the non-recurring charge from 2014 (KLP case) and incurred legal cost. (7) Gain on sale of former subsidiary Tomwil Transport AS in 2015. (8) In 2016 the charges relates to legal fees in division household collection from proceedings against Karmøy municipality for loss of
contract. Charges in 2015 relates to a fine and cost incurred in the restructuring process of the real estate portfolio.
The adjustments reconciling EBITDA and adjusted EBITDA represent an illustration of how underlying operational EBITDA has been affected by, what the company perceives to be one-time items.
CAPITAL EXPENDITURES
Capital expenditures increased by NOK 36.2 million, or 22.0%, from NOK 164.7 million in the twelve months of 2015 to NOK 200.9 million in the twelve months of 2016. Growth capital investments in 2016 were NOK 42.2 million related to new collection vehicles in Division Household collection. Capital expenditures are according to plan.
CASH FLOW
YTD Q4 2016 YTD Q4 2015
(NOK’000) Consolidated, unaudited Consolidated, unaudited
Net cash flow from operating activities 283 550 382 118 Net cash flow from investing activities (170 638) (136 244) Net cash flow from financing activities (163 073) (188 071) Net change in cash and cash equivalents for the period (50 161) 57 803 Effect of exchange rate changes (1 934) 948 Cash and cash equivalents at the beginning of the period 219 819 161 068 Cash and cash equivalents at the end of the period 167 724 219 819

VV Holding AS | Q4 Report 2016 | Page 9
Net cash flow from operating activities in the twelve months of 2016 showed a net inflow of NOK 283.6 million, which was NOK 98.6 million lower than previous year. The reduction compared to previous year is driven by weaker earnings and a positive working capital effect in 2015 resulting from significant reductions in inventory.
Net cash outflow from investing activities in the twelve months of 2016 was NOK 170.6 million compared to NOK 136.2 million in previous year. The net change in cash outflow was driven by higher capital expenditures paired with higher proceeds from sale of non-current assets and a purchase of shares in Sortera Norge AS in Q2 2016. Furthermore, proceeds from the sale of subsidiaries and associated companies in 2015 further explain the change in net cash outflow.
Net cash outflow from financing activities was NOK 163.1 million in the twelve months of 2016 compared to NOK 188.1 million previous year. The primary reason for the variation in cash flow from financing activities was a net increase in the credit facility in 2016, driven by investments in new collection vehicles in Division Household collection.
Cash and cash equivalents fell by NOK 52.1 million year to date 2016 from NOK 219.8 million per December 31, 2015 to NOK 167.7 million as of December 31, 2016.
FINANCIAL POSITION
NET INTEREST BEARING LIABILITIES
Net interest bearing debt of the Issuer and its subsidiaries, on a consolidated basis was NOK 2,359.1 million as of December 31, 2016, compared to NOK 2,263.5 as of December 31, 2015. Net interest bearing debt has increased due to the decrease in cash and cash equivalents, combined with an increased drawdown on the leasing facility during 2016.
As of December 31, 2016 NOK 1,400 million of the interest bearing debt is swapped from floating to fixed interest rate and will remain at this level until maturity of the bond.
CAPITALISATION
The following table sets forth the cash and cash equivalents and capitalization of the Issuer and its subsidiaries, on a consolidated basis.
(NOK ‘000) As of December 31, 2016 As of December 31, 2015
Cash and cash equivalents 167 724 219 819 Indebtedness:
Revolving credit facility (1) 459 529
Leasing facility (2) 101 344 68 558
NOK Senior secured notes (3) 2 273 707 2 272 737
Senior bank debt 4 223 5 228
Total third-party indebtedness 2 379 734 2 347 052 Shareholder loan (4) 147 154 136 226
Total equity 93 077 166 086
Total capitalization 2 619 965 2 649 364 (1) The Issuer has entered into a Revolving Credit Facility Agreement on July 10, 2014 to provide for a Revolving Credit Facility in the
amount of NOK 200.0 million to finance or refinance the general corporate and ongoing working capital needs of the Group. As of December 31, 2016, the Revolving Credit Facility is undrawn. Accrued, unpaid interest amounted to NOK 0.5 million.
(2) The Issuer has entered into a Leasing Facility Agreement on July 10, 2014 in the amount of NOK 270.0 million to finance the needs of the Group and for investments in collection vehicles in Division Household collection. As of December 31, 2016, the Leasing facility is drawn by NOK 101.3 million.
(3) On July 10, 2014 the Issuer conducted a successful placement of a senior secured floating rate note in the amount of NOK 2,235.0 million. As of December 31, 2016 the total amount outstanding, including accrued unpaid interest and unpaid amounts on interest rate swaps are NOK 2,273.7 million. The issuer may, provided that an incurrence test is met, at one or more occasions issue additional bonds under the existing bond agreement up to the amount of NOK 500 million.
(4) The shareholder loan is subordinated to all secured senior obligations. As of December 31, 2016 the total amount outstanding, including accrued unpaid interest is NOK 147 million.

VV Holding AS | Q4 Report 2016 | Page 10
OPERATING AND FINANCIAL REVIEW
Adjusted EBITDA in the operating and financial review of the main divisions represents EBITDA as adjusted for certain non-recurring and/or non-cash costs and before allocation of overhead HQ costs. From 2016 all internal rent charges are allocated to the divisions. Furthermore, and as part of the NG200 program, hazardous waste and municipal technical services have been relocated from Division Industry & Offshore to Division Recycling. In order to be able to compare 2016 with 2015, Q4 2015 figures have been pro forma adjusted to reflect these changes.
DIVISION RECYCLING
Total revenues in Division Recycling increased by NOK 10.0 million, or 1.7%, from NOK 575.1 million in Q4 2015 pro forma to NOK 585.1 million in Q4 2016. The increase in revenue is due to new contracts implemented during Q3 and Q4. Year to date total operating revenues declined by NOK 5.3 million or 0.2% from NOK 2 220.2 million in 2015 to NOK 2 214.9 million in 2016. The decline in revenue is due to a 4.1% pro forma decline in waste volumes, that are partly offset by a 1.0% pro forma increase in collection assignments. The decline in waste volumes is due to loss of a few major contracts that were waste-only contracts (customer delivering waste directly to our facilities), while the new contracts from Q3 have a mix of collection and waste. The decline in revenue is also due to lower average scrap metal price in 2016 compared to 2015.
Adjusted EBITDA before internal charges increased with NOK 25.0 million, from NOK 45.9 million in Q4 2015 pro forma to NOK 70.9 million in Q4 2016. YTD EBITDA decreased with NOK 4.8 million from NOK 216.1 million in 2015 to 211.3 million in 2016. Full year EBITDA is impacted negatively by pressure on gross profit from lower scrap metal ferrous prices and increased incineration gate fees. From Q2 the downstream cost of wood chips has increased significantly compared to 2015, while a significant share of upstream volume is tied in fixed price contracts. These effects are partly offset by the increase in EBITDA in Q4, due to significant upstream price increases from September, new contracts in Q3 and Q4 and cost cutting through the NG200 program.
DIVISION METAL
Total revenues in Division Metal increased by NOK 28.4 million, or 15.8%, from NOK 180.2 million in Q4 2015 pro forma to NOK 208.7 million in Q4 2016. This is mainly due to a 19 % increase in ferrous volumes in Q4 2016 compared to Q4 2015, while non-ferrous volumes were down by 12 %. Year-to-date total revenues ended down NOK 55.9 million, or 6.9%, driven by a shortage of ferrous volumes in Q1, reduced volumes in the non-ferrous market, as well as generally lower prices compared to 2015, especially scrap ferrous prices in Q1-Q3. On the non-ferrous side, changes in product mix, with less high value cable, constitute a significant negative effect on the top line, in addition to the reduction in volumes. Revenues have also suffered from high volatility in global metal prices and currency exchange rates.
(NOK’000) Q4 2016
Q4 2015 Reported
Q4 2015 pro forma Variance
YTD Q4 2016
YTD Q4 2015
Reported
YTD Q4 2015
pro forma Variance Total revenue 585 073 495 946 575 056 10 017 2 214 892 1 965 182 2 220 232 (5 340) Adjusted EBITDA 70 945 34 946 45 901 25 044 211 250 176 973 216 089 (4 839) Adjusted EBITDA margin 12,1 % 7,0 % 8,0 % 4,1 % 9,5 % 9,0 % 9,7 % (0,2 %)
YTD Q4
2016 YTD Q4
2015 Variance Collection assignments 3 399 286 3 365 745 1,0 % Total waste treated (tons) 1 186 363 1 237 353 -4,1 %
(NOK’000) Q4 2016
Q4 2015 Reported
Q4 2015 pro forma Variance
YTD Q4 2016
YTD Q4 2015
Reported
YTD Q4 2015
pro forma Variance Total revenue 208 652 180 213 180 213 28 438 749 882 805 737 805 737 (55 855) Adjusted EBITDA (7 442) 15 571 7 930 (15 373) 1 245 104 345 73 782 (72 537) Adjusted EBITDA margin (3,6 %) 8,6 % 4,4 % (8,0 %) 0,2 % 13,0 % 9,2 % (9,0 %)
YTD Q4
2016 YTD Q4
2015 Variance Ferrous volumes (tons) 210 931 201 499 4,7 % Non-ferrous volumes (tons) 30 679 33 837 -9,3 %

VV Holding AS | Q4 Report 2016 | Page 11
Adjusted EBITDA before internal charges fell by NOK 15.3 million, from NOK 7.9 million in Q4 2015 pro forma to negative NOK 7.4 million in Q4 2016. The decline is driven by lower gross profit on both ferrous and non-ferrous metals, especially the latter. This is due to the worsening of the product mix, lower prices and increased cost of logistics. Important external contributors are market volatility and reduced activity in the industry sector, resulting in lower volumes and increased competition in the Norwegian scrap market. In addition, a reduction in bottom ash production and restructuring costs of NOK 9-10 million have had a negative impact. The decline in both volumes and margins has resulted in a full year adjusted EBITDA before internal charges which is NOK 72.5 million lower than in 2015.
DIVISION INDUSTRY & OFFSHORE
Total revenue in Division Industry & Offshore decreased by NOK 23.1 million, or 25.0%, from NOK 92.1 in Q4 2015 pro forma to NOK 69.1 million in Q4 2016. The decrease was mainly due to close down of the offshore activity at Mongstad, and reduced activity in the offshore sector located in midwest Norway. On a year to date basis these events are the primary reason for the decrease in total operating revenue of NOK 76.0 million, or 19.8%.
Adjusted EBITDA before internal charges increased by NOK 7.1 million from negative NOK 6.6 million in Q4 2015 pro forma to NOK 0.5 million in Q4 2016. Adjusted EBITDA increased due to a lower cost base, which is driven by reductions in personnel and operating expenses, together with effects of the closedown of Mongstad. Year to date adjusted EBITDA fell from 17.7 million to 6.9 million. The slow start in some markets had a strong negative impact on the EBITDA. The reduction of personnel and other operating costs compared to last year was not enough to compensate for the lost revenue and gross margin on a year to date basis.
DIVISION HOUSEHOLD COLLECTION
Total operating revenue decreased by NOK 28.9 million, or 8,2%, from NOK 352.7 million YTD Q4 2015 to NOK 323.8 million YTD Q4 2016, and NOK 26.7 million or 30.2% comparing Q4 2015 and Q4 2016. Development in revenues is influenced negatively by the loss of the Oslo contract, offset by increased revenues due to higher activity on existing contracts, startup of new contracts and index adjustments. Adjusted EBITDA margin increased both YOY both Q4 and YTD.
In Q1 2016, Gothenburg municipality announced its intent to award Division Household Collection the contract for collection of municipal waste for the region defined as Northeast Gothenburg. The award was cancelled in Q4 2016 and the contract was retendered. On February 20th 2017 Gothenburg municipality announced Division Household Collection again had the winning bid. The contract will be awarded if no complaints are received before March 6th. In Q3, Division Household Collection was awarded the contract for collection of municipal waste in Asker municipality and Sarpsborg municipality. In Q4, Division Household Collection signed the contract for collection of municipal waste in parts of Blekinge municipality.
(NOK’000) Q4 2016
Q4 2015 Reported
Q4 2015 pro forma Variance
YTD Q4 2016
YTD Q4 2015
Reported
YTD Q4 2015
pro forma Variance Total revenue 69 094 150 571 92 184 (23 090) 307 586 591 292 383 595 (76 009) Adjusted EBITDA 512 5 380 (6 570) 7 082 6 942 60 483 17 721 (10 779) Adjusted EBITDA margin 0,7 % 3,6 % (7,1 %) 7,9 % 2,3 % 10,2 % 4,6 % (2,4 %)
(NOK’000) Q4 2016
Q4 2015 Reported
Q4 2015 pro forma Variance
YTD Q4 2016
YTD Q4 2015
Reported
YTD Q4 2015
pro forma Variance Total revenue 61 577 88 233 88 233 (26 656) 323 839 352 720 352 720 (28 881) Adjusted EBITDA 5 796 7 105 7 105 (1 308) 42 534 43 654 43 654 (1 120) Adjusted EBITDA margin 9,4 % 8,1 % 8,1 % 1,4 % 13,1 % 12,4 % 12,4 % 0,8 %

VV Holding AS | Q4 Report 2016 | Page 12
MARKET CONDITIONS
The inventory price risk is related to paper and metals that are discovered in the sorting process of waste (it is not possible to predict these volumes) and the estimation of throughput timing. Inventory positions on Aluminum, Copper and Nickel are being hedged.
DEVELOPMENT IN METAL PRICES
ALUMINUM Aluminum went from $1550 by mid-September to over $1750 in December in line with the increase in other metals. The fundamental environment stayed unchanged and higher prices raise the possibility of further supply increases. Financial investors continued their engagement in Aluminum, giving additional support to prices.
LME Aluminium – 2015 and 2016
COPPER Copper went from $4600 at the beginning of the quarter up to slightly over $6000 in one sharp increase. It increased with over $900 in the week starting with November 7th, just to fall with over $500 the week after. China’s new 5-year plan with further infrastructure investments, and the plans of the new US government both contribute to strengthen the investor driven rally.
LME Copper – 2015 and 2016

VV Holding AS | Q4 Report 2016 | Page 13
NICKEL Nickel has been volatile during Q4. The market had a yearly peak in November of $11,730 and then fell back to $10,000. The market was negatively influenced by the discussions of easing the export ban on raw material, including nickel ore, from Indonesia. On the other hand, the government of Philippines announced the cancellation of more mining permits, which could lead to a stronger market. Nickel ore supply is expected to remain tight in China during first quarter. Inventories in Chinese ports are low.
LME Nickel – 2015 and 2016
IRON ORE & STEEL Iron ore prices picked up in Q4 and are trading around $75 per ton. Prices for finished steel products have increased during Q4 as well as the demand. Prices and demand are expected to have a steady and sustainable increase during 2017 rather than the sharp spikes seen in 2016. Some regional variations are expected. DEVELOPMENT IN PAPER PRICES As expected, recovered paper prices decreased in Q4 in Europe. However, the decrease was not as big as expected and the Asian market is still very strong. We have seen a healthy demand for all our main grades. We expect prices to stay relatively stable in Q1 2017.
DEVELOPMENT WASTE-TO-ENERGY
WOODCHIPS Years of warm winters have influenced the woodchips market. Low demand combined with high inventories continued to put pressure on prices through Q4. We expect further price deterioration in H1 2017. REFUSE DERIVED FUEL (RDF) The RDF market in Scandinavia was characterized by high supply and limited free incineration capacity during Q4. The high levels of inventories at the incineration plants where maintained.
-10 €
0 €
10 €
20 €
30 €
40 €
Jan 15 Mar 15May 15 Jul 15 Sep 15 Nov 15 Jan 16 Mar 16May 16 Jul 16 Sep 16 Nov 16
Acc Change, OCC (1.04) Acc Change, deink (1.11)

VV Holding AS | Q4 Report 2016 | Page 14
UPDATE OF MATERIAL RISK FACTORS AND EVENTS AFTER REPORTING PERIOD
No significant changes in risk factors have been identified. For additional explanations regarding risks and uncertainties, please refer to the Board of Directors Report section Risk and Risk Management and Note 23 Financial Risk Management in the 2015 Annual Report.
MATERIAL CHANGES IN LIQUIDITY AND CAPITAL RESOURCES
The Group continually analyses its liquidity and capital resources position. The Group has assessed its currently available capital resources and its current liquidity position as satisfactory and not noted any material changes in the current period.
EVENTS AFTER REPORTING PERIOD
No significant events.

VV Holding AS | Q4 Report 2016 | Page 15
CONDENSED INTERIM FINANCIAL STATEMENTS
INTERIM CONSOLIDATED STATEMENT OF PROFIT OR LOSS
(NOK’000) Q4 2016 Q4 2015 YTD Q4 2016 YTD Q4 2015
Revenue 1 019 857 1 026 926 3 996 934 4 084 582
Other income 2 728 1 459 23 365 6 412
Total operating income 1 022 585 1 028 385 4 020 299 4 090 994
Cost of goods sold 510 235 524 308 1 995 383 2 026 665
Employee benefits expense 260 629 263 432 982 850 978 833
Depreciation and amortization expense 62 977 71 116 233 115 255 815
Other operating expenses 199 695 187 932 731 427 726 370
Other (gains)/losses - net (1 083) 1 073 1 580 (3 242)
Operating profit (9 868) (19 476) 75 944 106 552
Finance income (8 574) 484 15 770 2 190
Finance costs 52 601 53 743 207 250 221 302
Net income from associated companies 1 563 7 579 4 378 9 599
Profit / (loss) before income tax (69 480) (65 156) (111 158) (102 962)
Income tax expense (8 845) (17 515) (25 003) (36 081)
Profit / (loss) for the period from continuing operations (60 636) (47 642) (86 156) (66 881)
Profit / (loss) attributable to:
Owners of the parent (62 332) (48 476) (92 100) (70 476)
Non-controlling interests 1 696 834 5 944 3 596
The interim financial information has not been subject to audit.

VV Holding AS | Q4 Report 2016 | Page 16
INTERIM CONSOLIDATED STATEMENT OF COMPREHENSIVE INCOME
(NOK’000) Q4 2016 Q4 2015 YTD Q4 2016 YTD Q4 2015
Profit / (loss) for the period (60 636) (47 642) (86 156) (66 881)
Items that will not be reclassified to profit or loss Actuarial gain / (loss) on post-employment benefit obligations - 50 - 50
Items that may be subsequently reclassified to profit or loss
Currency translation differences 901 1 086 (5 106) 4 420
Interest rate swaps - cash flow hedges (after tax) 8 209 2 632 25 813 9 904
Net other comprehensive income / (loss) for the period 9 110 3 768 20 707 14 374
Comprehensive income / (loss) for the period (51 524) (43 874) (65 448) (52 507)
Comprehensive income attributable to:
Owners of the parent (53 220) (44 708) (71 392) (56 102)
Non-controlling interests 1 696 834 5 944 3 596
The interim financial information has not been subject to audit.

VV Holding AS | Q4 Report 2016 | Page 17
INTERIM CONSOLIDATED STATEMENT OF FINANCIAL POSITION
ASSETS
(NOK’000) 31.12.2016
31.12.2015 Non-current assets
Property, plant & equipment 1 015 748 1 031 968 Intangible assets 124 649 152 007 Goodwill 1 235 986 1 229 559 Deferred tax assets 96 262 76 226 Investments in associated companies 15 119 12 393 Other non-current receivables 39 487 28 338 Total non-current assets 2 527 251 2 530 492 Current assets Inventories 85 065 87 536 Trade and other receivables 607 663 596 309
Derivative financial instruments 3 581 - Cash and cash equivalents 167 724 219 819 Total current assets 864 034 903 664 Total assets 3 391 284 3 434 157
The interim financial information has not been subject to audit.

VV Holding AS | Q4 Report 2016 | Page 18
INTERIM CONSOLIDATED STATEMENT OF FINANCIAL POSITION
EQUITY AND LIABILITIES
(NOK’000) 31.12.2016
31.12.2015 Equity attributable to owners of the parent
Ordinary shares 45 348 45 348 Share premium 330 011 330 011 Additional paid in capital 9 314 7 970 Retained earnings (309 548) (232 009) Total equity attributable to owners of the parent 75 125 151 321 Non-controlling interest 17 952 14 765 Total equity 93 077 166 086 Non-current liabilities Loans and borrowings 2 431 168 2 380 419 Derivative financial instruments 24 885 59 635 Deferred income tax liabilities 31 794 41 174 Post-employment benefits 7 919 7 265 Provisions for other liabilities and charges 93 531 102 312 Total non-current liabilities 2 589 298 2 590 804 Current liabilities Trade and other payables 608 619 602 335 Current income tax 11 972 1 960 Loans and borrowings 65 432 60 519
Derivative financial instruments - 3 999 Provisions for other liabilities and charges 22 886 8 454
Total current liabilities 708 909 677 267 Total liabilities 3 298 207 3 268 071 Total equity and liabilities 3 391 284 3 434 157
The interim financial information has not been subject to audit.

VV Holding AS | Q4 Report 2016 | Page 19
INTERIM CONSOLIDATED STATEMENT OF CASH FLOWS
(NOK’000) YTD Q4 2016 YTD Q4 2015
Profit / (Loss) before income tax (111 158) (102 962) Adjustments for: Income tax paid (1 579) (10 101) Depreciation and amortization charges 233 115 255 815 Items reclassified to investing and financing activities 181 003 171 475 Other P&L items without cash effect (11 202) 16 360 Changes in other short term items (6 629) 51 531 Net cash flow from operating activities 283 550 382 118
Payments for purchases of shares and businesses (12 600) - Proceeds from sale of share in associates 2 002 10 008 Payments for purchases of non-current assets (200 923) (164 683) Proceeds from sale of non-current assets 40 883 10 982 Proceeds from sale of subsidiaries - 7 449 Net cash flow from investing activities (170 638) (136 244) Repayment of borrowings (1 111) (3 250) Net change in credit facility 23 705 (2 808) Dividend paid to non-controlling interest (2 757) (1 575) Net group contributions received/(paid) (2 347) 2 458 Net interest paid (180 563) (182 896) Net cash flow from financing activities (163 073) (188 071) Net increase in cash and cash equivalents (50 161) 57 803
Effect of exchange rate changes (1 934) 948 Cash and cash equivalents at beginning of period 219 819 161 068 Cash and cash equivalents at end of period 167 724 219 819
The interim financial information has not been subject to audit.
VV Holding AS | Q4 Report 2016 | Page 20
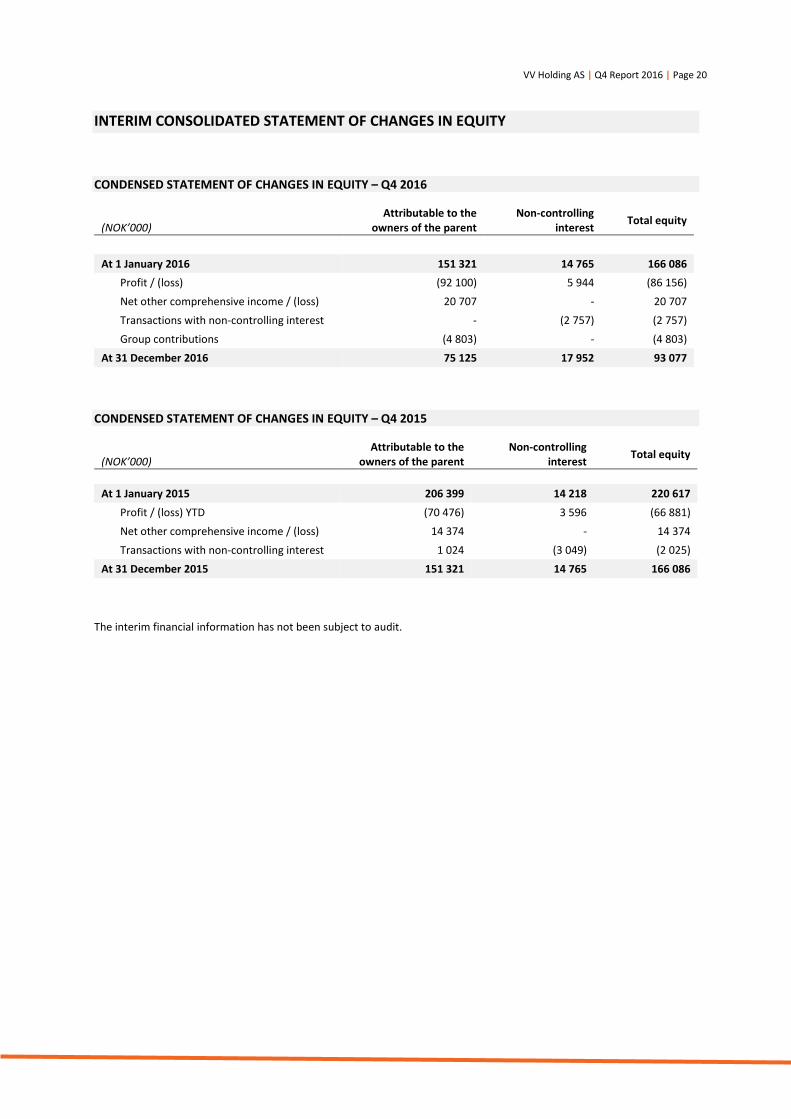
INTERIM CONSOLIDATED STATEMENT OF CHANGES IN EQUITY
CONDENSED STATEMENT OF CHANGES IN EQUITY – Q4 2016
(NOK’000)
Attributable to the owners of the parent
Non-controlling interest Total equity
At 1 January 2016 151 321 14 765 166 086 Profit / (loss) (92 100) 5 944 (86 156) Net other comprehensive income / (loss) 20 707 - 20 707 Transactions with non-controlling interest - (2 757) (2 757) Group contributions (4 803) - (4 803) At 31 December 2016 75 125 17 952 93 077
CONDENSED STATEMENT OF CHANGES IN EQUITY – Q4 2015
(NOK’000)
Attributable to the owners of the parent
Non-controlling interest Total equity
At 1 January 2015 206 399 14 218 220 617 Profit / (loss) YTD (70 476) 3 596 (66 881) Net other comprehensive income / (loss) 14 374 - 14 374 Transactions with non-controlling interest 1 024 (3 049) (2 025) At 31 December 2015 151 321 14 765 166 086
The interim financial information has not been subject to audit.
VV Holding AS | Q4 Report 2016 | Page 21
NOTES TO THE CONDENSED INTERIM CONSOLIDATED FINANCIAL STATEMENTS
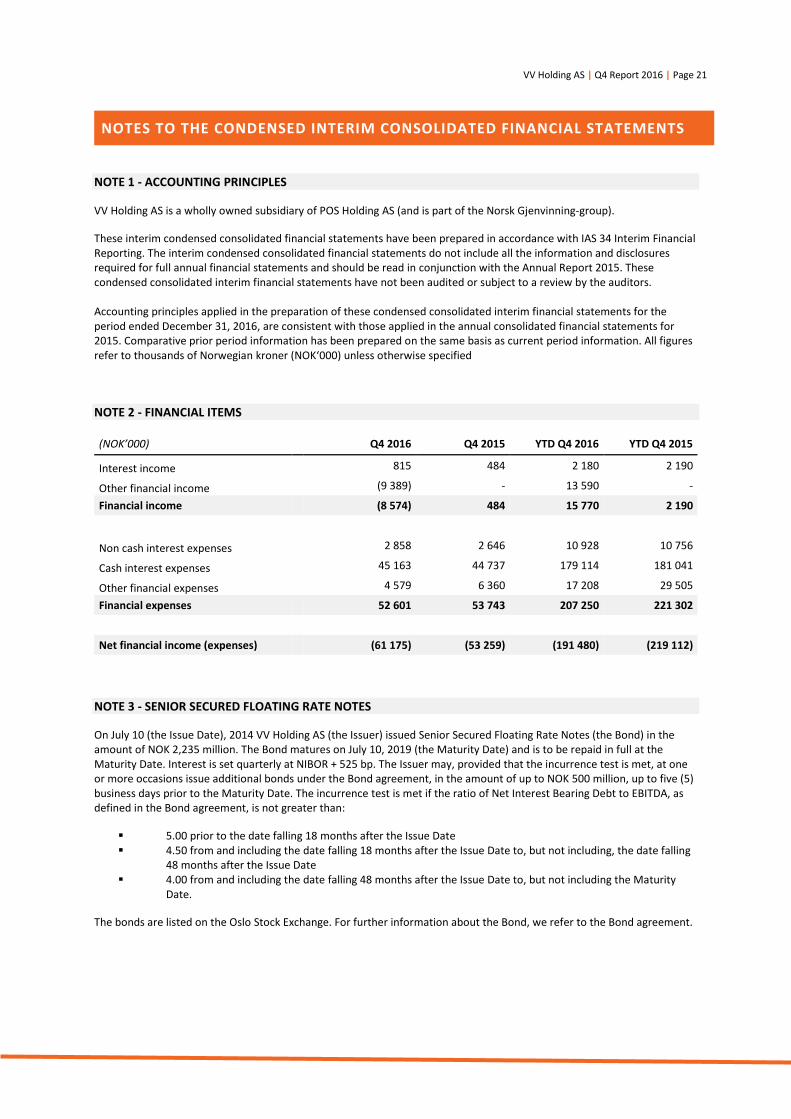
NOTE 1 - ACCOUNTING PRINCIPLES
VV Holding AS is a wholly owned subsidiary of POS Holding AS (and is part of the Norsk Gjenvinning-group).
These interim condensed consolidated financial statements have been prepared in accordance with IAS 34 Interim Financial Reporting. The interim condensed consolidated financial statements do not include all the information and disclosures required for full annual financial statements and should be read in conjunction with the Annual Report 2015. These condensed consolidated interim financial statements have not been audited or subject to a review by the auditors. Accounting principles applied in the preparation of these condensed consolidated interim financial statements for the period ended December 31, 2016, are consistent with those applied in the annual consolidated financial statements for 2015. Comparative prior period information has been prepared on the same basis as current period information. All figures refer to thousands of Norwegian kroner (NOK‘000) unless otherwise specified
NOTE 2 - FINANCIAL ITEMS
(NOK’000) Q4 2016 Q4 2015 YTD Q4 2016 YTD Q4 2015
Interest income 815 484 2 180 2 190
Other financial income (9 389) - 13 590 -
Financial income (8 574) 484 15 770 2 190
Non cash interest expenses 2 858 2 646 10 928 10 756
Cash interest expenses 45 163 44 737 179 114 181 041
Other financial expenses 4 579 6 360 17 208 29 505
Financial expenses 52 601 53 743 207 250 221 302
Net financial income (expenses) (61 175) (53 259) (191 480) (219 112)
NOTE 3 - SENIOR SECURED FLOATING RATE NOTES
On July 10 (the Issue Date), 2014 VV Holding AS (the Issuer) issued Senior Secured Floating Rate Notes (the Bond) in the amount of NOK 2,235 million. The Bond matures on July 10, 2019 (the Maturity Date) and is to be repaid in full at the Maturity Date. Interest is set quarterly at NIBOR + 525 bp. The Issuer may, provided that the incurrence test is met, at one or more occasions issue additional bonds under the Bond agreement, in the amount of up to NOK 500 million, up to five (5) business days prior to the Maturity Date. The incurrence test is met if the ratio of Net Interest Bearing Debt to EBITDA, as defined in the Bond agreement, is not greater than:
5.00 prior to the date falling 18 months after the Issue Date 4.50 from and including the date falling 18 months after the Issue Date to, but not including, the date falling
48 months after the Issue Date 4.00 from and including the date falling 48 months after the Issue Date to, but not including the Maturity
Date.
The bonds are listed on the Oslo Stock Exchange. For further information about the Bond, we refer to the Bond agreement.

VV Holding AS | Q4 Report 2016 | Page 22
NOTE 4 - SEGMENT NOTE
REVENUE 2016 (NOK’000)
Revenue from external customers Inter segment revenue Total segment revenues
Q4 2016 YTD Q4 2016 Q4 2016 YTD Q4 2016 Q4 2016 YTD Q4 2016 Recycling 487 358 1 836 348 97 716 378 544 585 073 2 214 892 Metal 207 775 746 817 877 3 066 208 652 749 882 Household collection 60 378 319 599 1 199 4 240 61 577 323 839 Industry & Offshore 67 377 299 963 918 5 110 68 295 305 073 Other businesses 193 633 784 964 12 270 38 385 205 903 823 348 HQ and eliminations 3 336 9 244 (112 978) (429 345) (109 642) (420 100) Total 1 019 857 3 996 934 - - 1 019 857 3 996 934
REVENUE 2015 (NOK’000)
Revenue from external customers Inter segment revenue Total segment revenues Q4 2015 YTD Q4 2015 Q4 2015 YTD Q4 2015 Q4 2015 YTD Q4 2015
Recycling 415 870 1 613 534 80 076 351 649 495 946 1 965 182 Metal 178 896 797 654 1 318 8 083 180 213 805 737 Household collection 87 468 351 614 765 1 106 88 233 352 720 Industry & Offshore 144 800 573 927 5 771 17 366 150 571 591 292 Other businesses 197 994 740 962 76 074 291 294 274 068 1 032 257 HQ and eliminations 1 899 6 891 (164 005) (669 497) (162 106) (662 606) Total 1 026 926 4 084 582 - - 1 026 926 4 084 582
EBITDA BEFORE INTERNAL CHARGES
(NOK’000) Q4 2016 Q4 2015 YTD Q4 2016 YTD Q4 2015
Recycling 70 945 32 946 211 250 174 973 Metal (7 442) 15 571 1 245 104 345 Household collection 6 496 (2 095) 44 882 34 454 Industry & Offshore (603) 3 954 5 827 59 057 Other businesses (5 105) 4 857 65 602 41 080 HQ and eliminations (11 182) (3 593) (19 748) (51 541) Total 53 109 51 640 309 059 362 367 Depreciation and amortization expense (62 977) (71 116) (233 115) (255 815) Finance income (8 574) 484 15 770 2 190 Finance costs (52 601) (53 743) (207 250) (221 302) Net income from associated companies 1 563 7 579 4 378 9 599 Profit before tax (69 480) (65 156) (111 158) (102 962)

VV Holding AS | Q4 Report 2016 | Page 23
NOTE 5 - EVENTS AFTER THE REPORTING PERIOD
VV Holding AS has received a notice from Norwegian Tax authorities, in which they are considering a recalculation of deductible VAT and are notifying that they will increase taxable income for the years 2011 and 2012. As of December 31, 2016 the Group has recognised provisions for VAT and income tax in the total amounts of NOK 2.4 million and NOK 3.3 million respectively.
NOTE 6 - EVENTS AFTER THE REPORTING PERIOD
Events after the reporting period have been described on page 14 under the heading “Update of material risk factors and events after the reporting period”.

VV Holding AS | Q4 Report 2016 | Page 24
NOTES TO THE CONDENSED FINANCIAL STATEMENTS
RESPONSIBILITY STATEMENT
NOTES TO THE CONDENSED FINANCIAL STATEMENTS
We confirm that, to the best of our knowledge, the condensed interim financial statements for the twelve months of 2016 which have been prepared in accordance with IAS 34 Interim Financial Reporting give a true and fair view of the Group’s consolidated assets, liabilities, financial position and results of operations, and that the interim report includes a fair review of the information under the Norwegian Securities Trading Act section 5–6 fourth paragraph.
Lysaker, February 27, 2017
Ole Enger Chairman of the Board
(sign.)
Per-Anders Hjort Deputy Chairman of the Board
(sign.)
Erik Osmundsen Chief Executive Officer
(sign.)
Hugo Lund Maurstad Director (sign.)
Maria Tallaksen Director (sign.)
Pål Stampe Director (sign.)
Yngve Longva Moland Director (sign.)
Lasse Stenskrog Director (sign.)
Cecilie Skauge Director (sign.)

VV Holding AS | Q4 Report 2016 | Page 25
CONTACTS
Dean Zuzic CFO
Phone: +47 414 33 560 [email protected]
Published by VV Holding AS 27th February 2017