
4Q18 Financial Results - jpmorganchase.com · 3 Last twelve months (“LTM”). Net of stock issued...
14
January 15, 2019 4Q18 Financial Results
Transcript of 4Q18 Financial Results - jpmorganchase.com · 3 Last twelve months (“LTM”). Net of stock issued...
January 15, 2019
4Q18 Financial Results

4Q18 Financial highlights
ROTCE1
14%
Net payout LTM3
92%
Common equity Tier 12
12.0%
1 See note 2 on slide 112 Represents the estimated common equity Tier 1 (“CET1”) capital and ratio under the Basel III Fully Phased-In capital rules to which the Firm became subject to on January 1, 2019. See note 6 on slide 113 Last twelve months (“LTM”). Net of stock issued to employees4 See note 1 on slide 115 See note 7 on slide 116 Net of stock issued to employees
4Q18 net income of $7.1B and EPS of $1.98
Managed revenue of $26.8B4
Expense of $15.7B and managed overhead ratio of 59%4
Fortress balance sheet
Average core loans5 ex-CIB up 6% YoY and 1% QoQ
Basel III Fully Phased-In CET1 capital of $184B2 and Standardized CET1 ratio of 12.0%2
Delivered strong capital return
$8.3B6 distributed to shareholders in 4Q18, including $5.7B of net repurchases
Common dividend of $0.80 per share
1

4Q18 Financial results1
$B, excluding EPS
Note: Totals may not sum due to rounding1 See note 1 on slide 112 Actual numbers for all periods, not over/(under)3 See note 2 on slide 114 See note 3 on slide 115 Reflects fully taxable-equivalent (“FTE”) adjustments of $695mm in 4Q18, compared to $1.3B in 4Q17
Firmwide total credit reserves of $14.5B
Consumer reserves of $9.4B – net build of $151mm, driven by Card
Wholesale reserves of $5.1B – net build of $161mm, largely select C&I downgrades
4Q18 3Q18 4Q17
Net interest income $14.5 $0.4 $1.2
Noninterest revenue 12.3 (1.5) (0.1)
Managed revenue1 26.8 (1.0) 1.1
Expense 15.7 0.1 0.8
Credit costs 1.5 0.6 0.2
Reported net income $7.1 ($1.3) $2.8
Net income applicable to common stockholders $6.6 ($1.3) $2.9
Reported EPS $1.98 ($0.36) $0.91
ROE2 12% 14% 7%
ROTCE2,3 14 17 8
Overhead ratio – managed1,2 59 56 58
Memo: Adjusted expense4
$15.7 $0.1 $0.6
Memo: Adjusted overhead ratio1,2,4 59% 56% 59%
$ O/(U)
4Q18 Tax rate
Effective rate: 20.1%
Managed rate: 25.9%1,5
2
$B 4Q18 3Q18 4Q17
Net charge-offs $1.2 $1.0 $1.3
Reserve build/(release) 0.3 (0.1) –
Credit costs $1.5 $0.9 $1.3
4Q18 ROE O/H ratio
CCB 30% 52%
CIB 10% 65%
CB 20% 37%
AWM 26% 76%

FY18 Financial results1
$B, excluding EPS
Note: Totals may not sum due to rounding1 See note 1 on slide 112 Actual numbers for all periods, not over/(under)3 See note 2 on slide 114 See note 3 on slide 115 Reflects fully taxable-equivalent (“FTE”) adjustments of $2.5B in 2018, compared to $4.0B in 20176 Net of stock issued to employees7 See note 7 on slide 11
$ O/(U)
FY2018 FY2017 FY2017
Net interest income $55.7 $51.4 $4.3
Noninterest revenue 55.8 53.3 2.5
Managed revenue1 111.5 104.7 6.8
Expense 63.4 59.5 3.9
Credit costs 4.9 5.3 (0.4)
Reported net income $32.5 $24.4 $8.0
Net income applicable to common stockholders $30.7 $22.6 $8.1
Reported EPS $9.00 $6.31 $2.69
ROE2 13% 10%
ROTCE2,3 17 12
Overhead ratio – managed1,2 57 57
Memo: Adjusted expense4
$63.3 $59.6 $3.8
Memo: Adjusted overhead ratio1,2,4 57% 57%
Net capital distribution to shareholders of $28.5B6 including common dividends of $9.2B, or $2.72 per share, and net repurchases
of $19.3B6
Average core loan growth of 7%7
Firmwide net reserve build of $15mm – net build in Consumer of $54mm and net release in Wholesale of $39mm
FY18 Tax rate
Effective rate: 20.3%
Managed rate: 24.9%1,5
$B FY18 FY17
Net charge-offs $4.9 $5.4
Reserve build/(release) – (0.1)
Credit costs $4.9 $5.3
FY2018 ROE OH ratio
CCB 28% 53%
CIB 16% 57%
CB 20% 37%
AWM 31% 74%
3
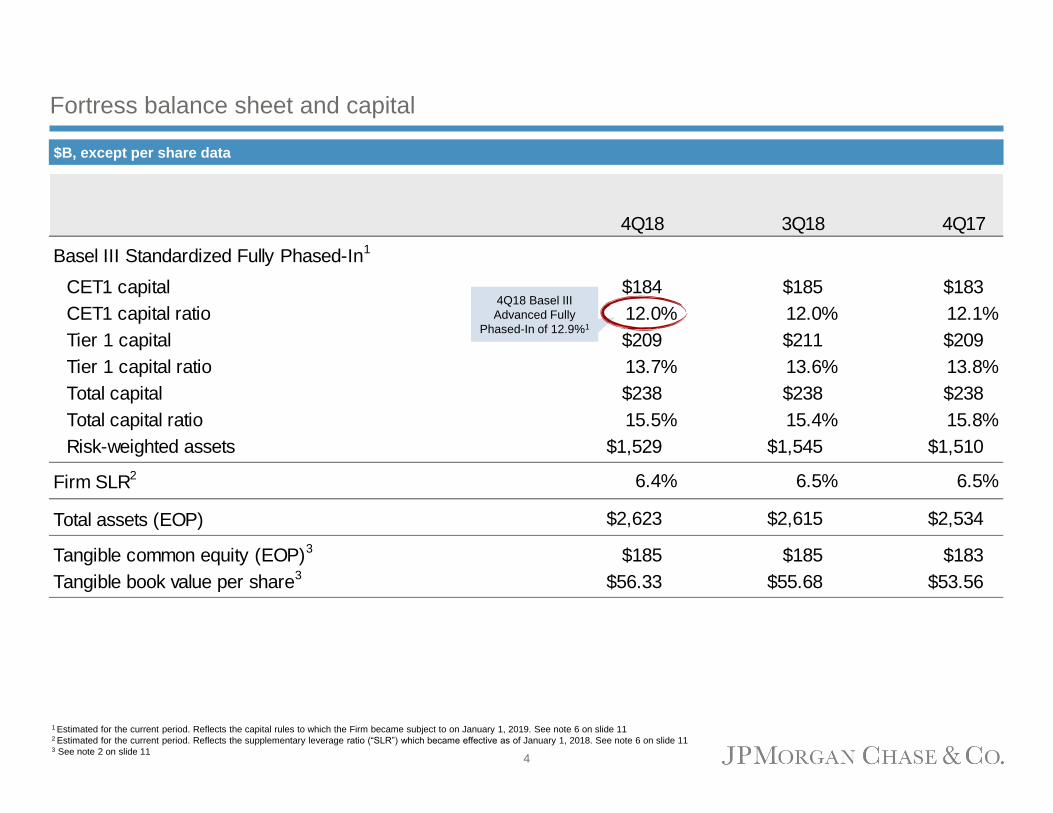
Fortress balance sheet and capital
1 Estimated for the current period. Reflects the capital rules to which the Firm became subject to on January 1, 2019. See note 6 on slide 112 Estimated for the current period. Reflects the supplementary leverage ratio (“SLR”) which became effective as of January 1, 2018. See note 6 on slide 113 See note 2 on slide 11
$B, except per share data
4Q18 3Q18 4Q17
Basel III Standardized Fully Phased-In1
CET1 capital $184 $185 $183
CET1 capital ratio 12.0% 12.0% 12.1%
Tier 1 capital $209 $211 $209
Tier 1 capital ratio 13.7% 13.6% 13.8%
Total capital $238 $238 $238
Total capital ratio 15.5% 15.4% 15.8%
Risk-weighted assets $1,529 $1,545 $1,510
Firm SLR2 6.4% 6.5% 6.5%
Total assets (EOP) $2,623 $2,615 $2,534
Tangible common equity (EOP)3
$185 $185 $183
Tangible book value per share3
$56.33 $55.68 $53.56
4Q18 Basel III
Advanced Fully
Phased-In of 12.9%1
4

Consumer & Community Banking1
$mm Financial performance
Average loans up 2% and core loans up 5% YoY
Average deposits up 3% YoY
Active mobile customers up 11% YoY
Client investment assets up 3% YoY
Credit card sales up 10% YoY; merchant processing volume up
17% YoY
1 See note 1 on slide 11
For additional footnotes see slide 12
Net income of $4.0B
Revenue of $13.7B, up 13% YoY, driven by higher NII on higher
deposit and card margins and balance growth
Expense of $7.1B, up 6% YoY, driven by investments in the business
and higher auto lease depreciation, partially offset by lower FDIC
charges and expense efficiencies
Credit costs of $1.3B, up $117mm YoY
4Q18 includes a $150mm reserve build in Card
Net charge-offs down YoY; lower NCOs in Auto and Home
Lending, predominantly offset by higher NCOs in Card
$ O/(U)
4Q18 3Q18 4Q17
Revenue $13,695 $405 $1,625
Consumer & Business Banking 6,567 182 1,010
Home Lending 1,322 16 (120)
Card, Merchant Services & Auto 5,806 207 735
Expense 7,065 83 393
Credit costs 1,348 368 117
Net charge-offs 1,198 118 (18)
Change in allowance 150 250 135
Net income $4,028 ($58) $1,397
Key drivers/statistics ($B)2
Equity $51.0 $51.0 $51.0
ROE 30% 31% 19%
Overhead ratio 52 53 55
Average loans $482.7 $479.6 $475.0
Average deposits 673.8 674.2 652.0
Active mobile customers (mm) 33.3 32.5 30.1
Debit & credit card sales volume $270.5 $259.0 $245.1
Key drivers/statistics ($B) – detail by business
4Q18 3Q18 4Q17
Consumer & Business Banking
Average Business Banking loans $24.3 $24.1 $23.3
Business Banking loan originations 1.5 1.6 1.8
Client investment assets (EOP) 282.5 298.4 273.3
Deposit margin 2.55% 2.43% 2.06%
Home Lending
Average loans $242.2 $242.9 $240.7
Loan originations3
17.2 22.5 24.4
EOP total loans serviced 789.8 798.6 816.1
Net charge-off/(recovery) rate4
(0.07)% (0.21)% (0.03)%
Card, Merchant Services & Auto
Card average loans $150.6 $146.3 $143.5
Auto average loans and leased assets 83.5 83.2 82.2
Auto loan and lease originations 7.0 8.1 8.2
Card net charge-off rate 2.93% 2.91% 2.97%
Card Services net revenue rate 11.57 11.50 10.64
Credit Card sales volume5
$185.3 $176.0 $168.0
Merchant processing volume 375.2 343.8 321.4
5

Corporate & Investment Bank1
1 See note 1 on slide 11
For additional footnotes see slide 12
Net income of $2.0B on revenue of $7.2B
Banking revenue
IB revenue of $1.7B, up 3% YoY
– Ranked #1 in Global IB fees for FY 2018
Treasury Services revenue of $1.2B, up 13% YoY, driven by
growth in operating deposits and higher interest rates, as well
as higher fees on increased payments volume
Markets & Investor Services revenue
Markets revenue of $3.2B, down 6% YoY, or down 11%5,6
YoY adjusted for the impact of tax reform and a loss on a
margin loan in the prior year
– Adjusted, Fixed Income Markets revenue was down 18%5
YoY, and Equity Markets revenue was up 2%6 YoY driven
by strength in Prime
Securities Services revenue of $1.0B, up 1% YoY on business
growth, predominantly offset by lower market levels and a
business exit
Credit Adjustments & Other, a loss of $243mm reflecting
higher funding spreads on derivatives
Expense of $4.7B, up 3% YoY
Investments in the business and higher volume-related
transaction costs were largely offset by lower FDIC charges
and lower performance-based compensation
$mm Financial performance
$ O/(U)
4Q18 3Q18 4Q17
Revenue $7,237 ($1,568) ($281)
Investment banking revenue 1,720 (11) 43
Treasury Services 1,217 34 139
Lending 344 13 8
Total Banking 3,281 36 190
Fixed Income Markets 1,856 (988) (361)
Equity Markets 1,317 (278) 169
Securities Services 1,026 (31) 14
Credit Adjustments & Other (243) (307) (293)
Total Markets & Investor Services 3,956 (1,604) (471)
Expense 4,681 (494) 128
Credit costs 82 124 (48)
Net income $1,975 ($651) ($341)
Key drivers/statistics ($B)2
Equity $70.0 $70.0 $70.0
ROE 10% 14% 12%
Overhead ratio 65 59 61
Comp/revenue 28 27 27
IB fees ($mm) $1,815 $1,823 $1,798
Average loans 125.7 122.7 111.5
Average client deposits3 445.6 434.8 417.0
Assets under custody ($T) 23.2 24.4 23.5
ALL/EOP loans ex-conduits and trade4 1.24% 1.27% 1.92%
Net charge-off/(recovery) rate4 – (0.14) 0.08
Average VaR ($mm) $49 $33 $32
6
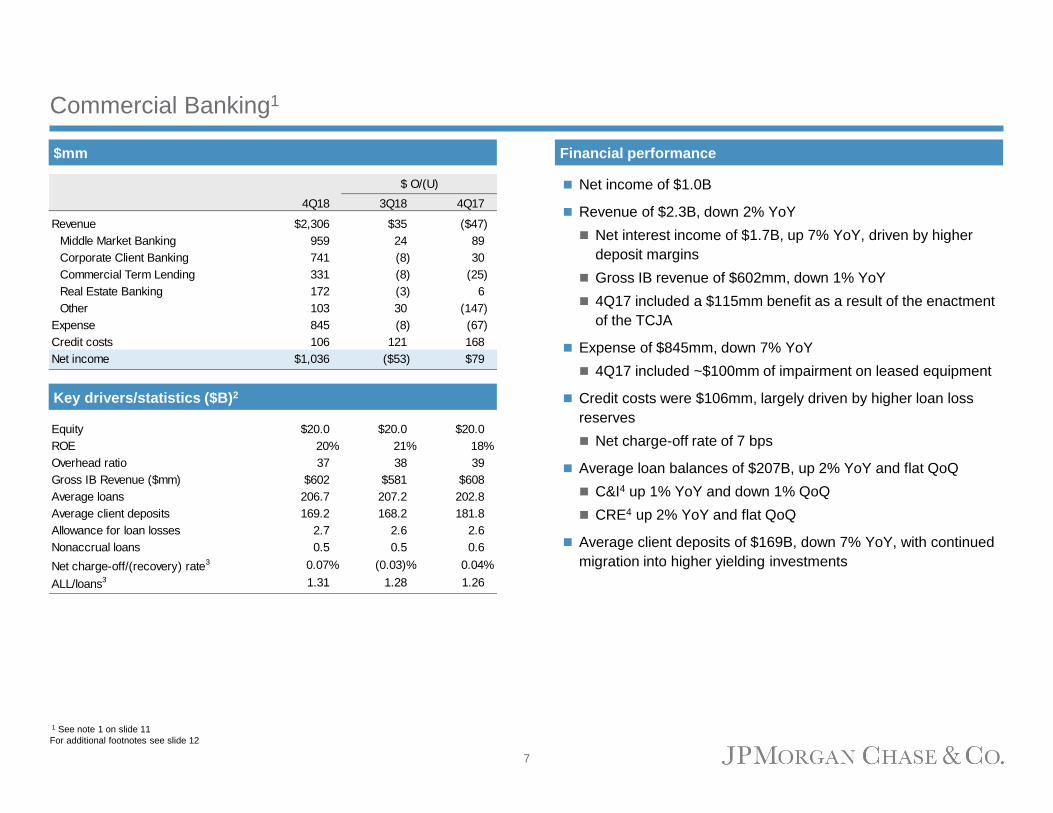
Commercial Banking1
1 See note 1 on slide 11
For additional footnotes see slide 12
Net income of $1.0B
Revenue of $2.3B, down 2% YoY
Net interest income of $1.7B, up 7% YoY, driven by higher
deposit margins
Gross IB revenue of $602mm, down 1% YoY
4Q17 included a $115mm benefit as a result of the enactment
of the TCJA
Expense of $845mm, down 7% YoY
4Q17 included ~$100mm of impairment on leased equipment
Credit costs were $106mm, largely driven by higher loan loss
reserves
Net charge-off rate of 7 bps
Average loan balances of $207B, up 2% YoY and flat QoQ
C&I4 up 1% YoY and down 1% QoQ
CRE4 up 2% YoY and flat QoQ
Average client deposits of $169B, down 7% YoY, with continued
migration into higher yielding investments
$mm Financial performance
4Q18 3Q18 4Q17
Revenue $2,306 $35 ($47)
Middle Market Banking 959 24 89
Corporate Client Banking 741 (8) 30
Commercial Term Lending 331 (8) (25)
Real Estate Banking 172 (3) 6
Other 103 30 (147)
Expense 845 (8) (67)
Credit costs 106 121 168
Net income $1,036 ($53) $79
$ O/(U)
Equity $20.0 $20.0 $20.0
ROE 20% 21% 18%
Overhead ratio 37 38 39
Gross IB Revenue ($mm) $602 $581 $608
Average loans 206.7 207.2 202.8
Average client deposits 169.2 168.2 181.8
Allowance for loan losses 2.7 2.6 2.6
Nonaccrual loans 0.5 0.5 0.6
Net charge-off/(recovery) rate3 0.07% (0.03)% 0.04%
ALL/loans3 1.31 1.28 1.26
Key drivers/statistics ($B)2
7

Net income of $604mm
Revenue of $3.4B, down 5% YoY, driven by lower market levels,
partially offset by strong banking results and the impact of
cumulative net long-term inflows
Expense of $2.6B, flat YoY, with investments in the business
offset by lower performance-based compensation and revenue-
driven external fees
AUM of $2.0T and client assets of $2.7T, both down 2% YoY,
driven by the impact of lower market levels
Net outflows QoQ of $3B from long-term products and inflows of
$21B into liquidity products
Average loan balances of $144B, up 13% YoY
Average deposit balances of $132B, down 7% YoY driven by
migration to higher yielding investments
Asset & Wealth Management1
1 See note 1 on slide 112 Actual numbers for all periods, not over/(under)
$mm Financial performance
4Q18 3Q18 4Q17
Revenue $3,439 ($120) ($199)
Asset Management 1,723 (104) (246)
Wealth Management 1,716 (16) 47
Expense 2,621 36 9
Credit costs 13 (10) 4
Net income $604 ($120) ($50)
$ O/(U)
Equity $9.0 $9.0 $9.0
ROE 26% 31% 28%
Pretax margin 23 27 28
Assets under management (AUM) $1,987 $2,077 $2,034
Client assets 2,733 2,867 2,789
Average loans 144.4 140.6 127.8
Average deposits 132.5 133.0 142.1
Key drivers/statistics ($B)2
8

Corporate1
Treasury and CIO
Net income of $175mm, up $109mm YoY, primarily driven by
higher rates
Other Corporate
Net loss of $752mm included a $200mm contribution to the
JPMorgan Chase Foundation, ~$150mm of markdowns on
certain legacy private equity investments (both on a pre-tax
basis), as well as ~$300mm of tax-related items
4Q17 included a $2.7B increase to income tax expense related
to the impact of the TCJA
$mm Financial performance
4Q18 3Q18 4Q17
Treasury and CIO $175 $79 $109
Other Corporate (752) (511) 1,640
Net income ($577) ($432) $1,749
$ O/(U)
1 See note 1 on slide 11
9

Outlook for 1Q191
Firmwide
Expect 1Q19 NII to be approximately flat QoQ, market dependent
Expect 1Q19 expense to be up mid-single digits YoY
1 See note 1 on slide 11
10

Notes
Notes on non-GAAP financial measures
1. In addition to analyzing the Firm’s results on a reported basis, management reviews Firmwide results, including the overhead ratio, on a “managed” basis; these Firmwide managed basis results are non-GAAP financial measures. The Firm also reviews the results of the lines of business on a managed basis. The Firm’s definition of managed basis starts, in each case, with the reported U.S. GAAP results and includes certain reclassifications to present total net revenue for the Firm and each of the reportable business segments on a fully taxable-equivalent (“FTE”) basis. Accordingly, revenue from investments that receive tax credits and tax-exempt securities is presented in the managed results on a basis comparable to taxable investments and securities. These financial measures allow management to assess the comparability of revenue arising from both taxable and tax-exempt sources. The corresponding income tax impact related to tax-exempt items is recorded within income tax expense. These adjustments have no impact on net income as reported by the Firm as a whole or by the lines of business. For a reconciliation of the Firm’s results from a reported to managed basis, see page 7 of the Earnings Release Financial Supplement.
2. Tangible common equity (“TCE”), return on tangible common equity (“ROTCE”) and tangible book value per share (“TBVPS”), are each non-GAAP financial measures. TCE represents the Firm’s common stockholders’ equity (i.e., total stockholders’ equity less preferred stock) less goodwill and identifiable intangible assets (other than MSRs), net of related deferred tax liabilities. For a reconciliation from common stockholders’ equity to TCE, see page 9 of the Earnings Release Financial Supplement. ROTCE measures the Firm’s net income applicable to common equity as a percentage of average TCE. TBVPS represents the Firm’s TCE at period-end divided by common shares at period-end. Book value per share was $70.35, $69.52, and $67.04 at December 31, 2018, September 30, 2018 and December 31, 2017, respectively. TCE, ROTCE and TBVPS are utilized by the Firm, as well as investors and analysts, in assessing the Firm’s use of equity.
3. Adjusted expense and adjusted overhead ratio are each non-GAAP financial measures. Adjusted expense excluded Firmwide legal expense/(benefit) of $(18) million, $20 million and $(207) million for the three months ended December 31, 2018, September 30, 2018 and December 31, 2017, respectively. The adjusted overhead ratio measures the Firm’s adjusted expense as a percentage of adjusted managed net revenue. Management believes this information helps investors understand the effect of these items on reported results and provides an alternate presentation of the Firm’s performance.
4. Net charge-offs and net charge-off rates exclude the impact of purchased credit-impaired (“PCI”) loans.
5. CIB calculates the ratio of the allowance for loan losses to end-of-period loans (“ALL/EOP”) excluding the impact of consolidated Firm-administered multi-seller conduits and trade finance loans, to provide a more meaningful assessment of CIB’s allowance coverage ratio.
Notes on key performance measures
6. The Basel III regulatory capital, risk-weighted assets and capital ratios (which became fully phased-in effective January 1, 2019), and the Basel III supplementary leverage ratio (“SLR”) (which was fully-phased in effective January 1, 2018), are all considered key regulatory capital measures. The capital adequacy of the Firm is evaluated against the Basel III approach (Standardized or Advanced) which, for each quarter, results in the lower ratio. These measures are used by management, bank regulators, investors and analysts to assess and monitor the Firm’s capital position. For additional information on these measures, see Capital Risk Management on pages 82-91 of the Firm’s Annual Report on Form 10-K for the year ended December 31, 2017, and pages 44-48 of the Firm’s Quarterly Report on Form 10-Q for the quarterly period ended September 30, 2018.
7. Core loans represent loans considered central to the Firm’s ongoing businesses; core loans exclude loans classified as trading assets, runoff portfolios, discontinued portfolios and portfolios the Firm has an intent to exit.
11
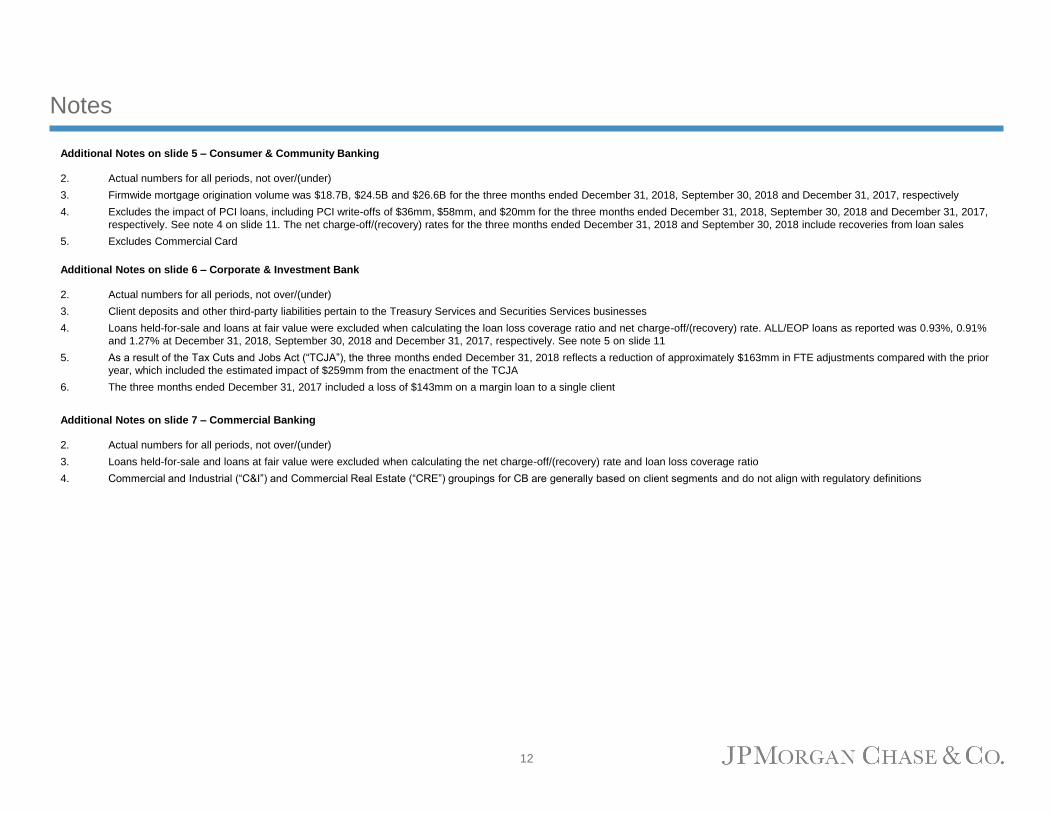
Notes
Additional Notes on slide 5 – Consumer & Community Banking
2. Actual numbers for all periods, not over/(under)
3. Firmwide mortgage origination volume was $18.7B, $24.5B and $26.6B for the three months ended December 31, 2018, September 30, 2018 and December 31, 2017, respectively
4. Excludes the impact of PCI loans, including PCI write-offs of $36mm, $58mm, and $20mm for the three months ended December 31, 2018, September 30, 2018 and December 31, 2017,
respectively. See note 4 on slide 11. The net charge-off/(recovery) rates for the three months ended December 31, 2018 and September 30, 2018 include recoveries from loan sales
5. Excludes Commercial Card
Additional Notes on slide 6 – Corporate & Investment Bank
2. Actual numbers for all periods, not over/(under)
3. Client deposits and other third-party liabilities pertain to the Treasury Services and Securities Services businesses
4. Loans held-for-sale and loans at fair value were excluded when calculating the loan loss coverage ratio and net charge-off/(recovery) rate. ALL/EOP loans as reported was 0.93%, 0.91%
and 1.27% at December 31, 2018, September 30, 2018 and December 31, 2017, respectively. See note 5 on slide 11
5. As a result of the Tax Cuts and Jobs Act (“TCJA”), the three months ended December 31, 2018 reflects a reduction of approximately $163mm in FTE adjustments compared with the prior
year, which included the estimated impact of $259mm from the enactment of the TCJA
6. The three months ended December 31, 2017 included a loss of $143mm on a margin loan to a single client
Additional Notes on slide 7 – Commercial Banking
2. Actual numbers for all periods, not over/(under)
3. Loans held-for-sale and loans at fair value were excluded when calculating the net charge-off/(recovery) rate and loan loss coverage ratio
4. Commercial and Industrial (“C&I”) and Commercial Real Estate (“CRE”) groupings for CB are generally based on client segments and do not align with regulatory definitions
12

Forward-looking statements
This presentation contains forward-looking statements within the meaning of the Private Securities Litigation
Reform Act of 1995. These statements are based on the current beliefs and expectations of JPMorgan Chase &
Co.’s management and are subject to significant risks and uncertainties. Actual results may differ from those set
forth in the forward-looking statements. Factors that could cause JPMorgan Chase & Co.’s actual results to differ
materially from those described in the forward-looking statements can be found in JPMorgan Chase & Co.’s
Annual Report on Form 10-K for the year ended December 31, 2017, and Quarterly Reports on Form 10-Q for the
quarterly periods ended September 30, 2018, June 30, 2018 and March 31, 2018, which have been filed with the
Securities and Exchange Commission and are available on JPMorgan Chase & Co.’s website
(https://jpmorganchaseco.gcs-web.com/financial-information/sec-filings), and on the Securities and Exchange
Commission’s website (www.sec.gov). JPMorgan Chase & Co. does not undertake to update any forward-looking
statements.
13


