4Q 2014 Exhibit 99€¦ · Title: 4Q 2014 Exhibit 99.1 Created Date: 1/27/2015 1:53:00 PM

Freeport-McMoRan 1
Freeport-McMoRan Reports Fourth-Quarter and Year Ended 2019 Results
Net income attributable to common stock totaled $9 million, less than $0.01 per share, in fourth-quarter 2019. After adjusting for net charges of $22 million, $0.02 per share, fourth-quarter 2019 adjusted net income attributable to common stock totaled $31 million, or $0.02 per share.
Consolidated sales totaled 906 million pounds of copper, 317 thousand ounces of gold and 22 million pounds of molybdenum in fourth-quarter 2019, and 3.3 billion pounds of copper, 991 thousand ounces of gold and 90 million pounds of molybdenum for the year 2019.
Consolidated sales for the year 2020 are expected to approximate 3.5 billion pounds of copper, 0.8 million ounces of gold and 88 million pounds of molybdenum, including 725 million pounds of copper, 105 thousand ounces of gold and 22 million pounds of molybdenum in first-quarter 2020. Sales are expected to increase to 4.3 billion pounds of copper and 1.4 million ounces of gold in 2021.
Average realized prices in fourth-quarter 2019 were $2.74 per pound for copper, $1,491 per ounce for gold and $11.65 per pound for molybdenum.
Average unit net cash costs in fourth-quarter 2019 were $1.67 per pound of copper and $1.74 per pound of copper for the year 2019. Unit net cash costs are expected to average $1.75 per pound of copper for the year 2020.
Operating cash flows totaled $170 million in fourth-quarter 2019 and $1.5 billion (including $349 million of working capital and other sources) for the year 2019. Based on current sales volume and cost estimates, and assuming average prices of $2.85 per pound for copper, $1,500 per ounce for gold and $10.00 per pound for molybdenum, operating cash flows are expected to approximate $2.4 billion (including $0.2 billion of working capital and other sources) for the year 2020.
Capital expenditures totaled $0.7 billion (including approximately $0.4 billion for major projects) in fourth-quarter 2019 and $2.65 billion (including approximately $1.5 billion for major projects) for the year 2019. Capital expenditures for the year 2020 are expected to approximate $2.8 billion, including $1.8 billion for major projects primarily associated with underground development activities in the Grasberg minerals district in Indonesia and completion of the Lone Star copper leach project in Arizona, and exclude estimates associated with the new smelter in Indonesia. FCX expects capital expenditures for the development of the new smelter in Indonesia to approximate $0.5 billion in 2020, of which approximately 49 percent will be attributable to FCX's equity interest.
During fourth-quarter 2019, FCX generated $452 million in proceeds from asset sales associated with the previously announced sales of a portion of its Freeport Cobalt business and its interest in the lower zone of the Timok exploration project.
At December 31, 2019, consolidated debt totaled $9.8 billion and consolidated cash totaled $2.0 billion. FCX had no borrowings and $3.5 billion available under its revolving credit facility at December 31, 2019.
On December 18, 2019, FCX declared a quarterly cash dividend of $0.05 per share on its common stock, which will be paid on February 3, 2020.

Freeport-McMoRan 2
PHOENIX, AZ, January 23, 2020 - Freeport-McMoRan Inc. (NYSE: FCX) reported net income (loss) attributable to common stock of $9 million (less than $0.01 per share) in fourth-quarter 2019 and $(239) million ($(0.17) per share) for the year 2019. After adjusting for net charges of $22 million ($0.02 per share), primarily reflecting net charges at PT-FI (mostly for historical contested tax audits) and metals inventory adjustments, partly offset by gains on sales of assets, adjusted net income attributable to common stock totaled $31 million ($0.02 per share) in fourth-quarter 2019. For additional information, refer to the supplemental schedule, "Adjusted Net Income," on page VII, which is available on FCX's website, "fcx.com."
Richard C. Adkerson, President and Chief Executive Officer, said, "During 2019, we progressed three major initiatives to enhance future cash flows and value for our shareholders. We are on schedule to establish large-scale production from our high-grade, low-cost and long-lived underground ore bodies at Grasberg; the Lone Star project in Arizona is nearing completion; and early results from our innovation initiatives to enhance productivity at our operations in the Americas are positive. Combined, these initiatives are expected to strengthen our cost position, future cash flows and long-term value for our shareholders, further advancing Freeport as foremost in the global copper industry. We are laser focused on execution of these plans designed to increase copper and gold sales by more than 30 percent, reduce unit net cash costs by approximately 25 percent and more than double operating cash flows in 2021 from 2019 levels.”
SUMMARY FINANCIAL DATA
Three Months EndedDecember 31,
Years EndedDecember 31,
2019 2018 2019 2018(in millions, except per share amounts)
Revenuesa,b $ 3,911 $ 3,684 $ 14,402 $ 18,628Operating incomea $ 775 $ 316 $ 1,091 $ 4,754Net income (loss) from continuing operations $ 42 $ 374 $ (192) $ 2,909Net income (loss) attributable to common stockc,d $ 9 $ 485 $ (239) $ 2,602Diluted net income (loss) per share of common stock:
Continuing operations $ — $ 0.33 $ (0.17) $ 1.79Discontinued operations — — — (0.01)
$ — $ 0.33 $ (0.17) $ 1.78
Diluted weighted-average common shares outstanding 1,457 1,457 1,451 1,458Operating cash flowse $ 170 $ (62) $ 1,482 $ 3,863Capital expenditures $ 735 $ 580 $ 2,652 $ 1,971At December 31:
Cash and cash equivalents $ 2,020 $ 4,217 $ 2,020 $ 4,217Total debt, including current portion $ 9,826 $ 11,141 $ 9,826 $ 11,141
a. For segment financial results, refer to the supplemental schedules, "Business Segments," beginning on page X, which are available on FCX's website, "fcx.com."
b. Includes favorable (unfavorable) adjustments to prior period provisionally priced concentrate and cathode copper sales totaling $33 million ($14 million to net income attributable to common stock or $0.01 per share) in fourth-quarter 2019, $(32) million ($(15) million to net income attributable to common stock or $(0.01) per share) in fourth-quarter 2018, $58 million ($24 million to net loss attributable to common stock or $0.02 per share) for the year 2019 and $(70) million ($(31) million to net income attributable to common stock or $(0.02) per share) for the year 2018. For further discussion, refer to the supplemental schedule, "Derivative Instruments," beginning on page IX, which is available on FCX's website, "fcx.com."
c. Includes net (charges) gains of $(22) million ($(0.02) per share) in fourth-quarter 2019, $324 million ($0.22 per share) in fourth-quarter 2018, $(275) million ($(0.19) per share) for the year 2019 and $379 million ($0.24 per share) for the year 2018 that are described in the supplemental schedule, "Adjusted Net Income," on page VII, which is available on FCX's website, "fcx.com."
d. FCX defers recognizing profits on intercompany sales until final sales to third parties occur. For a summary of net impacts from changes in these deferrals, refer to the supplemental schedule, "Deferred Profits," on page X, which is available on FCX's website, "fcx.com."

Freeport-McMoRan 3
e. Working capital and other sources (uses) totaled $75 million in fourth-quarter 2019, $(556) million in fourth-quarter 2018, $349 million for the year 2019 and $(656) million for the year 2018.
SUMMARY OPERATING DATA
Three Months EndedDecember 31,
Years EndedDecember 31,
2019 2018 2019 2018Copper (millions of recoverable pounds)
Production 827 841 3,247 3,813Sales, excluding purchases 906 785 3,292 3,811Average realized price per pound $ 2.74 $ 2.75 $ 2.73 $ 2.91Site production and delivery costs per pounda $ 2.12 $ 1.98 $ 2.15 $ 1.76Unit net cash costs per pounda $ 1.67 $ 1.54 $ 1.74 $ 1.07
Gold (thousands of recoverable ounces)Production 223 334 882 2,439Sales, excluding purchases 317 266 991 2,389Average realized price per ounce $ 1,491 $ 1,255 $ 1,415 $ 1,254
Molybdenum (millions of recoverable pounds)Production 21 26 90 95Sales, excluding purchases 22 24 90 94Average realized price per pound $ 11.65 $ 12.75 $ 12.61 $ 12.50
a. Reflects per pound weighted-average production and delivery costs and unit net cash costs (net of by-product credits) for all copper mines, before net noncash and other costs. For reconciliations of per pound unit costs by operating division to production and delivery costs applicable to sales reported in FCX's consolidated financial statements, refer to the supplemental schedules, "Product Revenues and Production Costs," beginning on page XIII, which are available on FCX's website, "fcx.com."
Consolidated Sales Volumes
Fourth-quarter 2019 copper sales of 906 million pounds were 4 percent higher than the October 2019 estimate of 870 million pounds, and 15 percent higher than fourth-quarter 2018 sales of 785 million pounds, mostly reflecting higher sales from Indonesia, primarily associated with an extension of mining from the Grasberg open pit, which was completed in the fourth quarter, and the timing of shipments.
Fourth-quarter 2019 gold sales of 317 thousand ounces were 117 thousand ounces higher than the October 2019 estimate of 200 thousand ounces and approximately 20 percent higher than fourth-quarter 2018 sales of 266 thousand ounces, primarily reflecting an extension of mining from the Grasberg open pit and the timing of shipments.
Fourth-quarter 2019 molybdenum sales of 22 million pounds were slightly lower than both the October 2019 estimate and fourth-quarter 2018 sales of 24 million pounds.
Consolidated sales volumes for the year 2020 are expected to approximate 3.5 billion pounds of copper, 0.8 million ounces of gold and 88 million pounds of molybdenum, including 725 million pounds of copper, 105 thousand ounces of gold and 22 million pounds of molybdenum in first-quarter 2020. As PT-FI continues to ramp-up production from its significant underground ore bodies, metal production is expected to improve significantly by 2021.
Consolidated Unit Net Cash Costs
Consolidated average unit net cash costs (net of by-product credits) for FCX's copper mines of $1.67 per pound of copper in fourth-quarter 2019, were lower than the October 2019 estimate of $1.76 per pound, primarily reflecting higher copper and gold sales volumes. As anticipated, consolidated average unit net cash costs were higher than the fourth-quarter 2018 average of $1.54 per pound, primarily reflecting lower production volumes as PT-FI continues to ramp-up production from its significant underground ore bodies, and lower molybdenum by-product credits.
Freeport-McMoRan 4
Assuming average prices of $1,500 per ounce of gold and $10.00 per pound of molybdenum for 2020 and achievement of current sales volume and cost estimates, consolidated unit net cash costs (net of by-product credits) for copper mines are expected to average $1.75 per pound of copper for the year 2020. The impact of price changes on 2020 consolidated unit net cash costs would approximate $0.01 per pound for each $50 per ounce change in the average price of gold and $0.03 per pound for each $2 per pound change in the average price of molybdenum. Quarterly unit net cash costs vary with fluctuations in sales volumes and realized prices, primarily for gold and molybdenum. FCX expects consolidated unit net cash costs to decline by 2021, following a ramp-up period at PT-FI.
MINING OPERATIONS Productivity and Innovation Initiatives. During 2019, FCX advanced initiatives in its North America and South America mining operations to enhance productivity, expand margins and reduce the capital intensity of the business through the utilization of new technology applications in combination with a more interactive operating structure. The pilot program initiated at the Bagdad mine in northwest Arizona in late 2018 was highly successful in utilizing data science, machine learning and integrated functional teams to address bottlenecks, provide cost benefits and drive improved overall performance. The program is now being implemented across the North America and South America operations.
A series of action items have been identified, prioritized and are being implemented. Based on the opportunities identified to date, FCX has incorporated higher mining and milling rates in its future plans, resulting in estimated incremental production of approximately 100 million pounds of copper in 2021 and approximately 200 million pounds in 2022.
Capital expenditures associated with these initiatives are expected to be attractive in relation to developing new copper supply. FCX currently estimates capital costs of these initiatives, principally for mining equipment and ongoing development of data science and machine learning programs, will approximate $200 million.
North America Copper Mines. FCX operates seven open-pit copper mines in North America - Morenci, Bagdad, Safford, Sierrita and Miami in Arizona, and Chino and Tyrone in New Mexico. In addition to copper, certain of FCX's North America copper mines produce molybdenum concentrate, gold and silver. All of the North America mining operations are wholly owned, except for Morenci. FCX records its 72 percent undivided joint venture interest in Morenci using the proportionate consolidation method.
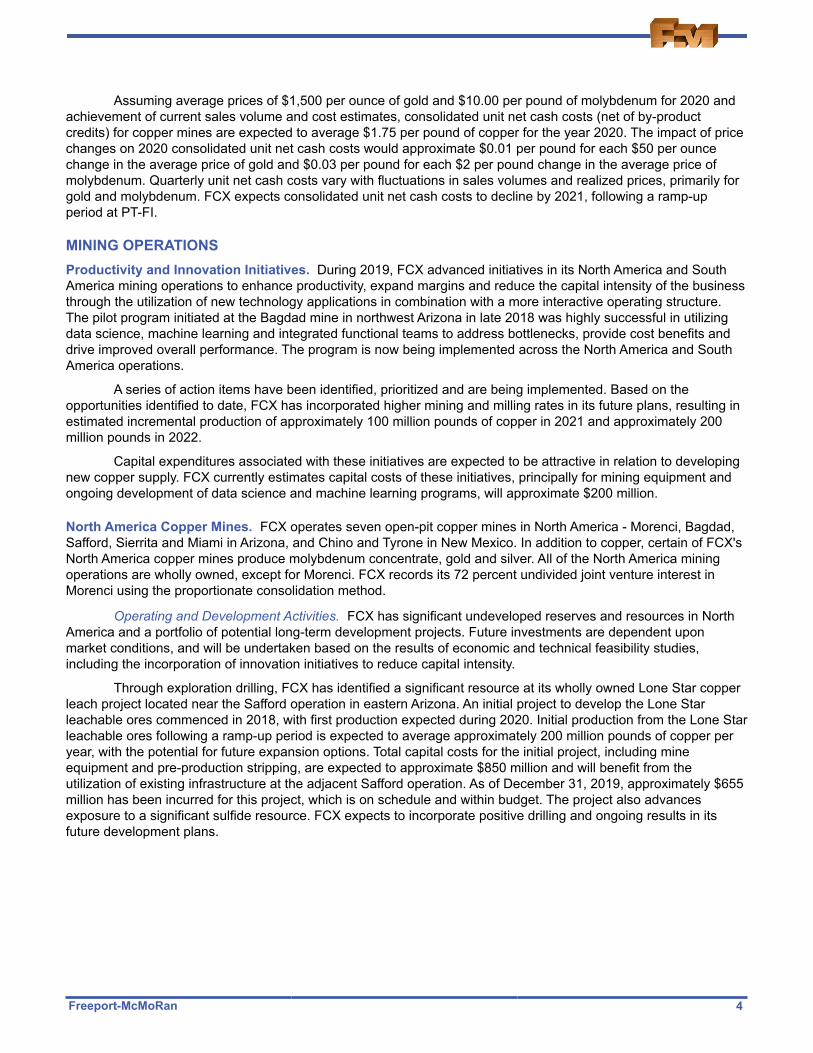
Operating and Development Activities. FCX has significant undeveloped reserves and resources in North America and a portfolio of potential long-term development projects. Future investments are dependent upon market conditions, and will be undertaken based on the results of economic and technical feasibility studies, including the incorporation of innovation initiatives to reduce capital intensity.
Through exploration drilling, FCX has identified a significant resource at its wholly owned Lone Star copper leach project located near the Safford operation in eastern Arizona. An initial project to develop the Lone Star leachable ores commenced in 2018, with first production expected during 2020. Initial production from the Lone Star leachable ores following a ramp-up period is expected to average approximately 200 million pounds of copper per year, with the potential for future expansion options. Total capital costs for the initial project, including mine equipment and pre-production stripping, are expected to approximate $850 million and will benefit from the utilization of existing infrastructure at the adjacent Safford operation. As of December 31, 2019, approximately $655 million has been incurred for this project, which is on schedule and within budget. The project also advances exposure to a significant sulfide resource. FCX expects to incorporate positive drilling and ongoing results in its future development plans.

Freeport-McMoRan 5
Operating Data. Following is summary consolidated operating data for the North America copper mines:
Three Months EndedDecember 31,
Years EndedDecember 31,
2019 2018 2019 2018Copper (millions of recoverable pounds)
Production 361 353 1,457 1,404Sales, excluding purchases 358 333 1,442 1,428Average realized price per pound $ 2.73 $ 2.77 $ 2.74 $ 2.96
Molybdenum (millions of recoverable pounds)Productiona 8 9 32 32
Unit net cash costs per pound of copperb
Site production and delivery, excluding adjustments $ 2.07 $ 2.01 $ 2.05 $ 1.94By-product credits (0.22) (0.34) (0.24) (0.26)Treatment charges 0.11 0.12 0.11 0.11Unit net cash costs $ 1.96 $ 1.79 $ 1.92 $ 1.79
a. Refer to summary operating data on page 3 for FCX's consolidated molybdenum sales, which includes sales of molybdenum produced at the North America copper mines.
b. For a reconciliation of unit net cash costs per pound to production and delivery costs applicable to sales reported in FCX's consolidated financial statements, refer to the supplemental schedules, "Product Revenues and Production Costs," beginning on page XIII, which are available on FCX's website, "fcx.com."
North America's consolidated copper sales volumes of 358 million pounds in fourth-quarter 2019 were higher than fourth-quarter 2018 copper sales volumes of 333 million pounds, primarily reflecting timing of shipments and higher production from Morenci. North America copper sales are estimated to approximate 1.6 billion pounds for the year 2020, compared with 1.4 billion pounds in 2019.
Average unit net cash costs (net of by-product credits) for the North America copper mines of $1.96 per pound of copper in fourth-quarter 2019 were higher than fourth-quarter 2018 unit net cash costs of $1.79 per pound, primarily reflecting lower by-product/molybdenum credits.
Average unit net cash costs (net of by-product credits) for the North America copper mines are expected to approximate $1.93 per pound of copper for the year 2020, based on achievement of current sales volume and cost estimates and assuming an average molybdenum price of $10.00 per pound. The impact of price changes during 2020 on North America's average unit net cash costs would approximate $0.04 per pound for each $2 per pound change in the average price of molybdenum.
South America Mining. FCX operates two copper mines in South America - Cerro Verde in Peru (in which FCX owns a 53.56 percent interest) and El Abra in Chile (in which FCX owns a 51 percent interest). These operations are consolidated in FCX's financial statements. In addition to copper, the Cerro Verde mine produces molybdenum concentrate and silver.
Operating and Development Activities. Cerro Verde's expanded operations benefit from its large-scale, long-lived reserves and cost efficiencies and have continued to perform well. Debottlenecking projects and additional initiatives to enhance operating rates continue to be advanced. Cerro Verde concentrating operations averaged 396,800 metric tons of ore per day in fourth-quarter 2019, approximately 10 percent above design capacity. Ongoing productivity and innovation initiatives are targeting the opportunity to increase production to 420,000 metric tons of ore per day in 2021.
FCX continues to evaluate a large-scale expansion at El Abra to process additional sulfide material and to achieve higher recoveries. El Abra's large sulfide resource could potentially support a major mill project similar to facilities constructed at Cerro Verde. Technical and economic studies continue to be evaluated to determine the optimal scope and timing for the project in parallel with extending the life of the current leaching operation.

Freeport-McMoRan 6
Operating Data. Following is summary consolidated operating data for South America mining:
Three Months EndedDecember 31,
Years EndedDecember 31,
2019 2018 2019 2018Copper (millions of recoverable pounds)
Production 320 318 1,183 1,249Sales 345 325 1,183 1,253Average realized price per pound $ 2.76 $ 2.74 $ 2.71 $ 2.87
Molybdenum (millions of recoverable pounds)Productiona 8 8 29 28
Unit net cash costs per pound of copperb
Site production and delivery, excluding adjustments $ 1.85 c $ 1.77 $ 1.85 $ 1.79 d
By-product credits (0.18) (0.26) (0.27) (0.24)Treatment charges 0.17 0.19 0.18 0.19Royalty on metals 0.01 0.01 0.01 0.01Unit net cash costs $ 1.85 $ 1.71 $ 1.77 $ 1.75
a. Refer to summary operating data on page 3 for FCX's consolidated molybdenum sales, which includes sales of
molybdenum produced at Cerro Verde.b. For a reconciliation of unit net cash costs per pound to production and delivery costs applicable to sales reported in FCX's
consolidated financial statements, refer to the supplemental schedules, "Product Revenues and Production Costs," beginning on page XIII, which are available on FCX's website, "fcx.com."
c. Includes a charge of $0.04 per pound of copper for adjustments to deferred profit sharing for prior years. d. Includes charges totaling $0.06 per pound of copper associated with Cerro Verde's three-year collective labor agreement.
South America's consolidated copper sales volumes of 345 million pounds in fourth-quarter 2019 were higher than fourth-quarter 2018 copper sales volumes of 325 million pounds, primarily reflecting timing of shipments. Sales from South America mining are expected to approximate 1.15 billion pounds of copper for the year 2020, similar to the year 2019.
Average unit net cash costs (net of by-product credits) for South America mining of $1.85 per pound of copper in fourth-quarter 2019 were higher than unit net cash costs of $1.71 per pound in fourth-quarter 2018, primarily reflecting lower by-product credits and adjustments to deferred profit sharing for prior years.
Average unit net cash costs (net of by-product credits) for South America mining are expected to approximate $1.95 per pound of copper for the year 2020, based on current sales volume and cost estimates and assuming an average price of $10.00 per pound of molybdenum.
Indonesia Mining. PT-FI's assets include one of the world's largest copper and gold deposits at the Grasberg minerals district in Papua, Indonesia. PT-FI produces copper concentrate that contains significant quantities of gold and silver. FCX has a 48.76 percent ownership interest in PT-FI and manages its mining operations. Under the terms of the shareholders agreement, FCX’s economic interest in PT-FI approximates 81 percent through 2022. PT-FI's results are consolidated in FCX's financial statements.
Operating and Development Activities. During fourth-quarter 2019, PT-FI completed mining in the Grasberg open pit and continues to achieve important milestones in ramping-up production of large-scale quantities of copper and gold from its significant underground ore bodies. In aggregate, the Grasberg open pit produced over 27 billion pounds of copper and 46 million ounces of gold in the 30-year period from 1990 through 2019.
Grasberg Block Cave. PT-FI has commenced extraction of ore from the Grasberg Block Cave underground mine, which is the same ore body historically mined from the surface in the Grasberg open pit. Reserves from the Grasberg Block Cave totaled 17.2 billion pounds of copper and 14.2 million ounces of gold at December 31, 2019, representing approximately half of PT-FI's total copper and gold reserves. Undercutting, drawbell construction and ore extraction activities in the Grasberg Block Cave underground mine continue to track expectations. Ore
Freeport-McMoRan 7
extraction from the Grasberg Block Cave underground mine averaged 11,200 metric tons of ore per day in fourth-quarter 2019, including a planned three week outage for the installation of ore-flow infrastructure. Following completion of the maintenance program in mid-December, ore extraction from the Grasberg Block Cave averaged 17,000 metric tons of ore per day. Monitoring data on cave propagation in the Grasberg Block Cave underground mine is providing confidence in growing production rates over time. As existing drawpoints mature and additional drawpoints are added, cave development is expected to increase production rates to an average of 30,000 metric tons of ore per day in 2020, over 60,000 metric tons of ore per day in 2021 and 130,000 metric tons of ore per day in 2023 from five production blocks spanning 335,000 square meters.
Deep Mill Level Zone (DMLZ). The DMLZ underground mine, located east of the Grasberg ore body and below the Deep Ore Zone (DOZ) underground mine, has continued its ramp up of production. Hydraulic fracturing operations have been effective in managing rock stresses and pre-conditioning the cave following mining-induced seismic activity experienced in 2017 and 2018. Ore extraction continues to exceed expectations, averaging 14,900 metric tons of ore per day in fourth-quarter 2019 and reached approximately 16,000 metric tons of ore per day at year-end 2019. Ongoing hydraulic fracturing operations combined with continued undercutting and drawbell openings in the two currently active production blocks are expected to expand the cave, supporting higher production rates that are expected to average 29,000 metric tons of ore per day in 2020, approach 60,000 metric tons of ore per day in 2021 and 80,000 metric tons of ore per day in 2022 from three production blocks.
Results to date from the Grasberg Block Cave and DMLZ underground mines are positive and in line with long-term plans to reach full production rates. Because of the nature of block caving, estimates of timing of future production from PT-FI's underground ore bodies will continue to be reviewed and may be modified as additional information becomes available.
Indonesian Smelter. In connection with the extension of PT-FI's mining rights from 2031 to 2041, PT-FI committed to construct a new smelter in Indonesia by December 21, 2023. A site for the new smelter has been selected, and ground preparation is advancing. Engineering and front-end engineering and design for the selected process technology are advancing and expected to be completed in 2020. The preliminary capital cost estimate for the project approximates $3 billion, pending completion of final engineering. Estimated capital expenditures for 2020 approximate $0.5 billion. PT-FI has advanced financing discussions with a syndicate of banks and expects the project will be funded by a bank loan to PT-FI. The debt service for the new smelter will be shared by PT-FI's shareholders according to their respective equity ownership percentages. As a result, FCX's future distributions from PT-FI will incorporate approximately 49 percent of the smelter debt service.
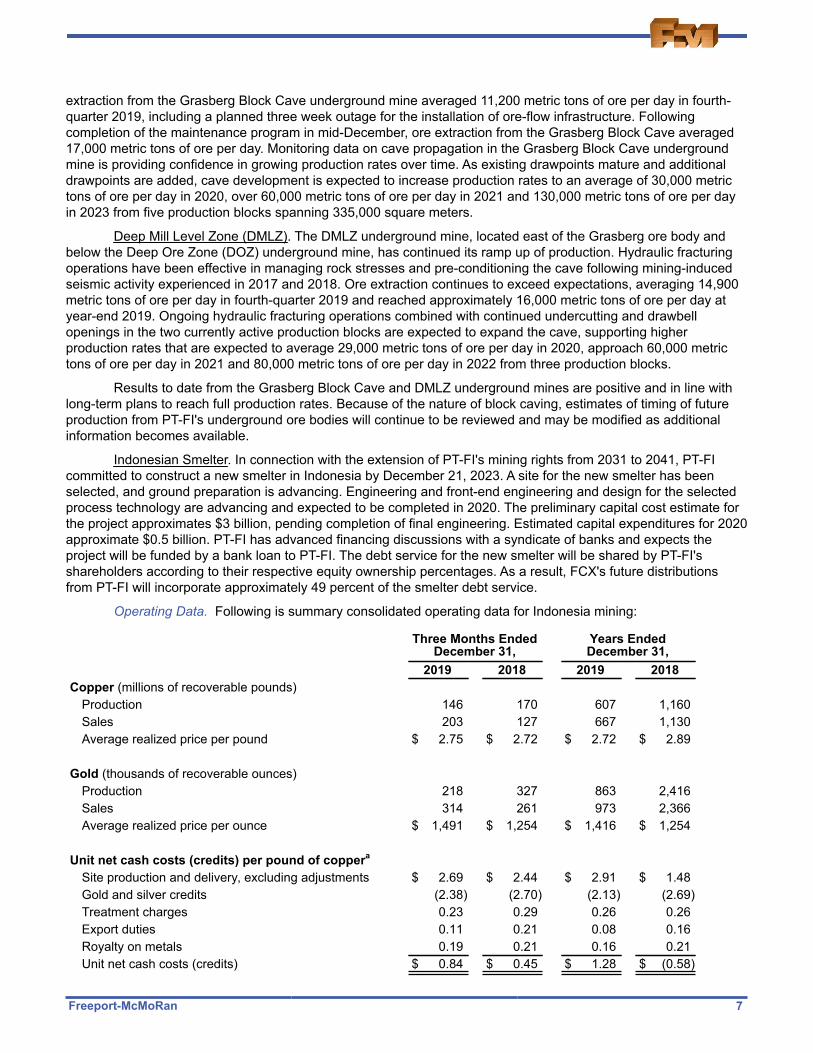
Operating Data. Following is summary consolidated operating data for Indonesia mining:
Three Months EndedDecember 31,
Years EndedDecember 31,
2019 2018 2019 2018Copper (millions of recoverable pounds)
Production 146 170 607 1,160Sales 203 127 667 1,130Average realized price per pound $ 2.75 $ 2.72 $ 2.72 $ 2.89
Gold (thousands of recoverable ounces)Production 218 327 863 2,416Sales 314 261 973 2,366Average realized price per ounce $ 1,491 $ 1,254 $ 1,416 $ 1,254
Unit net cash costs (credits) per pound of coppera
Site production and delivery, excluding adjustments $ 2.69 $ 2.44 $ 2.91 $ 1.48Gold and silver credits (2.38) (2.70) (2.13) (2.69)Treatment charges 0.23 0.29 0.26 0.26Export duties 0.11 0.21 0.08 0.16Royalty on metals 0.19 0.21 0.16 0.21Unit net cash costs (credits) $ 0.84 $ 0.45 $ 1.28 $ (0.58)
Freeport-McMoRan 8
a. For a reconciliation of unit net cash costs (credits) per pound to production and delivery costs applicable to sales reported in FCX's consolidated financial statements, refer to the supplemental schedules, "Product Revenues and Production Costs," beginning on page XIII, which are available on FCX's website, "fcx.com."
PT-FI's consolidated sales of 203 million pounds of copper and 314 thousand ounces of gold in fourth-quarter 2019 were higher than fourth-quarter 2018 consolidated sales of 127 million pounds of copper and 261 thousand ounces of gold, reflecting the extension of mining in the Grasberg open pit, which was completed in December 2019, and timing of shipments.
Consolidated sales volumes from PT-FI are expected to approximate 750 million pounds of copper and 0.8 million ounces of gold in 2020, compared with 667 million pounds of copper and 1.0 million ounces of gold in 2019. As PT-FI continues to ramp-up production from its underground ore bodies, metal production is expected to improve significantly by 2021.
Because of the fixed nature of a large portion of PT-FI's costs, unit net cash costs can vary significantly from quarter to quarter depending on copper and gold volumes. PT-FI's unit net cash costs (including gold and silver credits) of $0.84 per pound of copper in fourth-quarter 2019, were higher than unit net cash costs of $0.45 per pound in fourth-quarter 2018, primarily reflecting lower copper production and gold credits.
Assuming an average gold price of $1,500 per ounce for 2020 and achievement of current sales volume and cost estimates, unit net cash costs (including gold and silver credits) for PT-FI are expected to approximate $1.04 per pound of copper for the year 2020. The impact of price changes during 2020 on PT-FI's average unit net cash costs would approximate $0.05 per pound for each $50 per ounce change in the average price of gold.
PT-FI's projected sales volumes and unit net cash costs for the year 2020 are dependent on a number of factors, including operational performance, timing of shipments and the Indonesian government's extension of PT-FI's export license beyond March 8, 2020.
PT-FI's estimated annual capital spending on underground mine development projects is expected to average $0.8 billion per year for the three-year period 2020 through 2022, net of scheduled contributions from PT Indonesia Asahan Aluminium (Persero) (PT Inalum). In accordance with applicable accounting guidance, aggregate costs (before scheduled contributions from PT Inalum), which are expected to average $1.0 billion per year for the three-year period 2020 through 2022, will be reflected as an investing activity in FCX's cash flow statement, and contributions from PT Inalum will be reflected as a financing activity.
Molybdenum Mines. FCX has two wholly owned molybdenum mines in Colorado - the Henderson underground mine and the Climax open-pit mine. The Henderson and Climax mines produce high-purity, chemical-grade molybdenum concentrate, which is typically further processed into value-added molybdenum chemical products. The majority of the molybdenum concentrate produced at the Henderson and Climax mines, as well as from FCX's North America and South America copper mines, is processed at FCX's conversion facilities.
Operating and Development Activities. Production from the Molybdenum mines totaled 5 million pounds of molybdenum in fourth-quarter 2019 and 29 million pounds for the year 2019, compared with 9 million pounds in fourth-quarter 2018 and 35 million pounds for the year 2018. The decrease in the 2019 periods primarily reflects the impacts of market conditions. Refer to summary operating data on page 3 for FCX's consolidated molybdenum sales and average realized prices, which includes sales of molybdenum produced at the Molybdenum mines and from FCX's North America and South America copper mines.
Unit net cash costs for the Molybdenum mines of $14.20 per pound of molybdenum in fourth-quarter 2019 and $10.80 per pound for the year 2019 were higher than unit net cash costs of $9.16 per pound in fourth-quarter 2018 and $8.77 per pound for the year 2018, primarily reflecting lower volumes. Based on current sales volume and cost estimates, average unit net cash costs for the Molybdenum mines are expected to approximate $10.50 per pound of molybdenum for the year 2020.
For a reconciliation of unit net cash costs per pound to production and delivery costs applicable to sales reported in FCX's consolidated financial statements, refer to the supplemental schedules, "Product Revenues and Production Costs," beginning on page XIII, which are available on FCX's website, "fcx.com."

Freeport-McMoRan 9
Mining Exploration Activities. FCX's mining exploration activities are generally associated with its existing mines, focusing on opportunities to expand reserves and resources to support development of additional future production capacity. A drilling program to further delineate the Lone Star resource continues to indicate significant additional mineralization in this district, with higher ore grades than FCX's other North America copper mines. Exploration results continue to indicate opportunities for significant future potential reserve additions in North America and South America. Exploration spending is expected to approximate $70 million for the year 2020, compared with $77 million in 2019.
Preliminary Estimated Recoverable Proven and Probable Mineral Reserves. FCX has significant reserves, resources and future development opportunities within its portfolio of mining assets. FCX's preliminary estimated consolidated recoverable proven and probable reserves from its mines at December 31, 2019, include 116.0 billion pounds of copper, 29.6 million ounces of gold and 3.58 billion pounds of molybdenum, which were determined using $2.50 per pound for copper, $1,200 per ounce for gold and $10.00 per pound for molybdenum. The preliminary estimated recoverable proven and probable mining reserves presented in the table below represent the estimated metal quantities from which FCX expects to be paid after application of estimated metallurgical recovery rates and smelter recovery rates, where applicable. Recoverable reserve volumes are those which FCX estimates can be economically and legally extracted or produced at the time of the reserve determination.
Preliminary Estimated Recoverable Proven and Probable Mineral Reservesat December 31, 2019
Copper Gold Molybdenum(billion pounds) (million ounces) (billion pounds)
North America 47.2 0.5 2.87South America 33.2 — 0.71Indonesia 35.6 29.1 —
Consolidated basisa 116.0 29.6 3.58
Net equity interestb 83.4 16.1 3.25
a. Consolidated reserves represent estimated metal quantities after reduction for FCX's joint venture partner interest at the Morenci mine in North America. Excluded from the table above are FCX's estimated recoverable proven and probable reserves of 375 million ounces of silver, which were determined using $15 per ounce.
b. Net equity interest reserves represent estimated consolidated metal quantities further reduced for noncontrolling interest ownership. FCX's net equity interest for estimated metal quantities in Indonesia reflects 81.27 percent through 2022 and 48.76 percent from 2023 through 2041. Excluded from the table above are FCX's estimated net recoverable proven and probable reserves of 251 million ounces of silver.
The following table summarizes changes in FCX's preliminary estimated consolidated recoverable proven and probable copper, gold and molybdenum reserves during 2019:
Copper Gold Molybdenum(billion pounds) (million ounces) (billion pounds)
Reserves at December 31, 2018 119.6 30.8 3.78Net revisions (0.4) (0.3) (0.11)Production (3.2) (0.9) (0.09)Reserves at December 31, 2019 116.0 29.6 3.58
In addition to the preliminary estimated consolidated recoverable proven and probable reserves, FCX's preliminary estimated mineralized material at December 31, 2019, which was assessed using $3.00 per pound for copper, totaled 133 billion pounds of incremental contained copper. FCX continues to pursue opportunities to convert this material into reserves, future production volumes and cash flow.

Freeport-McMoRan 10
CASH FLOWS, ASSET SALES, CASH and DEBT
Operating Cash Flows. FCX generated operating cash flows of $170 million in fourth-quarter 2019 and $1.5 billion (including $349 million of working capital and other sources) for the year 2019. Fourth-quarter and year 2019 operating cash flows included a $250 million payment to Indonesia tax authorities for historical contested tax audits.
Based on current sales volume and cost estimates, and assuming average prices of $2.85 per pound of copper, $1,500 per ounce of gold and $10.00 per pound of molybdenum, FCX's consolidated operating cash flows are estimated to approximate $2.4 billion (including $0.2 billion of working capital and other sources) for the year 2020. The impact of price changes during 2020 on operating cash flows would approximate $350 million for each $0.10 per pound change in the average price of copper, $35 million for each $50 per ounce change in the average price of gold and $125 million for each $2 per pound change in the average price of molybdenum.
Capital Expenditures. Capital expenditures totaled $0.7 billion in fourth-quarter 2019 (including approximately $0.4 billion for major projects) and $2.65 billion for the year 2019 (including approximately $1.5 billion for major projects).
Capital expenditures are expected to approximate $2.8 billion for the year 2020, including $1.8 billion for major projects primarily associated with underground development activities in the Grasberg minerals district and completion of the Lone Star copper leach project, and exclude estimates associated with the new smelter in Indonesia. A large portion of the capital expenditures relate to projects that are expected to add significant production and cash flow in future periods, enabling FCX to generate operating cash flows exceeding capital expenditures in future years.
FCX expects capital expenditures for the development of the new smelter in Indonesia to approximate $0.5 billion in 2020, of which approximately 49 percent will be attributable to FCX's equity interest. PT-FI expects these amounts to be funded by a new bank loan.
Asset Sales. In November 2019, FCX completed the sale of its cobalt refinery in Kokkola, Finland, and related cobalt cathode precursor business for total cash consideration of approximately $200 million, including approximately $50 million of working capital. FCX recorded a gain of $59 million on the transaction.
In December 2019, FCX completed the sale of its interest in the lower zone of the Timok exploration project in Serbia for cash consideration of $240 million at closing, plus the right to future contingent payments of up to $150 million. In addition, the purchaser agreed to pay $107 million of previously agreed contingent consideration related to FCX's 2016 sale of its interest in the upper zone of the Timok exploration project in three installment payments between 2020 and 2022. FCX recorded a gain of $343 million on the transaction.
Cash. Following is a summary of the U.S. and international components of consolidated cash and cash equivalents available to the parent company, net of noncontrolling interests' share, taxes and other costs at December 31, 2019 (in billions):
Cash at domestic companies $ 1.3Cash at international operations 0.7
Total consolidated cash and cash equivalents 2.0Noncontrolling interests' share (0.3)
Cash, net of noncontrolling interests' share $ 1.7Withholding taxes — a
Net cash available $ 1.7
a. Rounds to less than $0.1 billion.
Debt. At December 31, 2019, FCX's consolidated debt totaled $9.8 billion, with a related weighted-average interest rate of 4.5 percent. FCX had no borrowings, $13 million in letters of credit issued and $3.5 billion available under its revolving credit facility at December 31, 2019.

Freeport-McMoRan 11
FINANCIAL POLICY On December 18, 2019, FCX declared a quarterly cash dividend of $0.05 per share on its common stock, which will be paid on February 3, 2020, to shareholders of record as of January 15, 2020. The declaration of dividends is at the discretion of the Board of Directors (Board) and will depend upon FCX’s financial results, cash requirements, future prospects and other factors deemed relevant by the Board.
WEBCAST INFORMATION
A conference call with securities analysts to discuss FCX's fourth-quarter 2019 results is scheduled for today at 10:00 a.m. Eastern Time. The conference call will be broadcast on the Internet along with slides. Interested parties may listen to the conference call live and view the slides by accessing “fcx.com.” A replay of the webcast will be available through Friday, February 21, 2020.
-----------------------------------------------------------------------------------------------------------
FCX is a leading international mining company with headquarters in Phoenix, Arizona. FCX operates large, long-lived, geographically diverse assets with significant proven and probable reserves of copper, gold and molybdenum. FCX is one of the world's largest publicly traded copper producers.
FCX’s portfolio of assets includes the Grasberg minerals district in Indonesia, one of the world's largest copper and gold deposits; and significant mining operations in North America and South America, including the large-scale Morenci minerals district in Arizona and the Cerro Verde operation in Peru. Additional information about FCX is available on FCX's website at "fcx.com."
Cautionary Statement and Regulation G Disclosure: This press release contains forward-looking statements in which FCX discusses its potential future performance. Forward-looking statements are all statements other than statements of historical facts, such as plans, projections or expectations relating to ore grades and milling rates; production and sales volumes; unit net cash costs; operating cash flows; capital expenditures; FCX's expectations regarding its share of PT-FI's net (loss) income and future cash flows through 2022; PT-FI's development, financing, construction and completion of a new smelter in Indonesia; FCX's expectations regarding results associated with productivity and innovation initiatives; exploration efforts and results; development and production activities, rates and costs; liquidity; tax rates; export quotas and duties; the impact of copper, gold and molybdenum price changes; the impact of deferred intercompany profits on earnings; reserve estimates; execution of the settlement agreement associated with the Louisiana coastal erosion cases; and future dividend payments, share purchases and sales. The words “anticipates,” “may,” “can,” “plans,” “believes,” “estimates,” “expects,” “projects,” "targets," “intends,” “likely,” “will,” “should,” “to be,” ”potential" and any similar expressions are intended to identify those assertions as forward-looking statements. The declaration of dividends is at the discretion of the Board and will depend on FCX's financial results, cash requirements, future prospects, and other factors deemed relevant by the Board. FCX cautions readers that forward-looking statements are not guarantees of future performance and actual results may differ materially from those anticipated, expected, projected or assumed in the forward-looking statements. Important factors that can cause FCX's actual results to differ materially from those anticipated in the forward-looking statements include, but are not limited to, supply of and demand for, and prices of, copper, gold and molybdenum; mine sequencing; changes in mine plans; production rates; timing of shipments; results of feasibility studies; potential inventory adjustments; potential impairment of long-lived mining assets; the potential effects of violence in Indonesia generally and in the province of Papua; the Indonesian government's extension of PT-FI's export license after March 8, 2020; risks associated with underground mining; satisfaction of requirements in accordance with PT-FI's special mining license (IUPK) to extend mining rights from 2031 through 2041; FCX's ability to achieve the expected results of its productivity and innovation initiatives; industry risks; regulatory changes; political and social risks; labor relations; weather- and climate-related risks; environmental risks; litigation results; cybersecurity incidents; and other factors described in more detail under the heading “Risk Factors” in FCX's Annual Report on Form 10-K for the year ended December 31, 2018, filed with the U.S. Securities and Exchange Commission (SEC). Investors are cautioned that many of the assumptions upon which FCX's forward-looking statements are based are likely to change after the forward-looking statements are made, including for example commodity prices, which FCX cannot control, and production volumes and costs, some aspects of which FCX may not be able to control. Further, FCX may make changes to its business plans that could affect its results. FCX cautions investors that it does not intend to update forward-looking statements more frequently than quarterly notwithstanding any changes in its assumptions, changes in business plans, actual experience or other changes, and FCX undertakes no obligation to update any forward-looking statements. This press release also contains certain financial measures such as adjusted net income and unit net cash costs (credits) per pound of copper and molybdenum, which are not recognized under U.S. generally accepted accounting principles. As required by SEC Regulation G, reconciliations of these measures to amounts reported in FCX's consolidated financial statements are in the supplemental schedules of this press release, which are also available on FCX's website, "fcx.com."
I
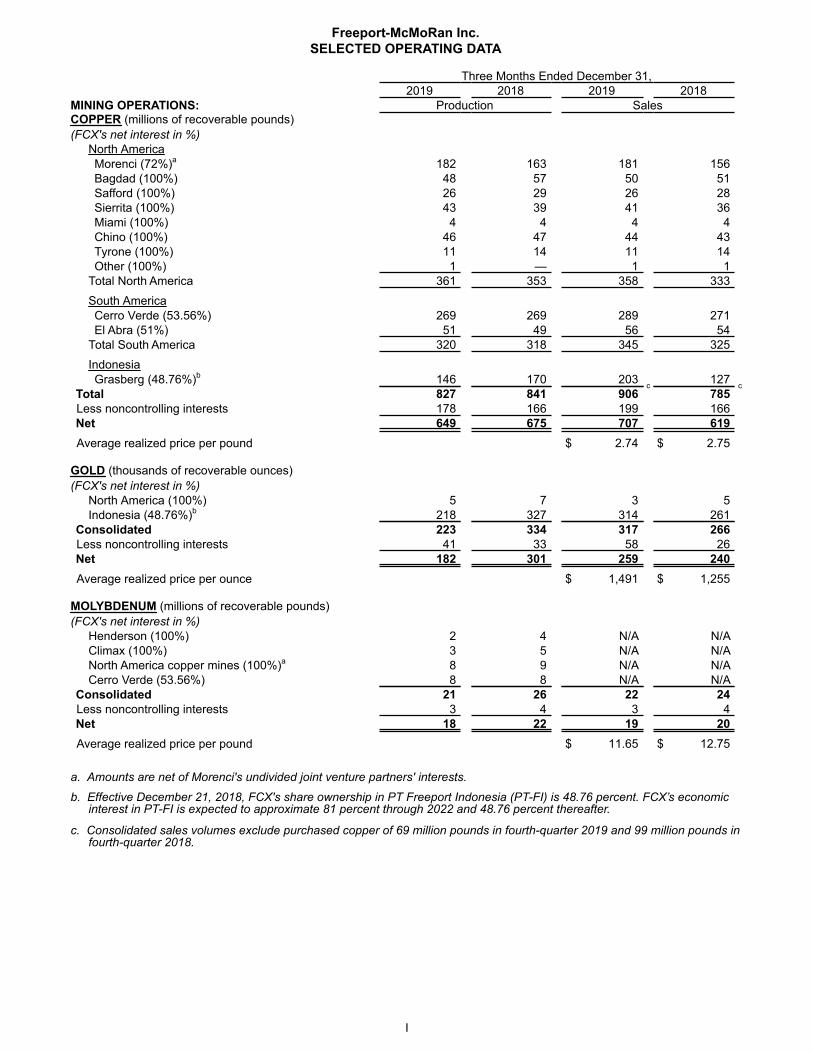
Freeport-McMoRan Inc.SELECTED OPERATING DATA
Three Months Ended December 31,2019 2018 2019 2018
MINING OPERATIONS: Production SalesCOPPER (millions of recoverable pounds) (FCX's net interest in %)
North AmericaMorenci (72%)a 182 163 181 156Bagdad (100%) 48 57 50 51Safford (100%) 26 29 26 28Sierrita (100%) 43 39 41 36Miami (100%) 4 4 4 4Chino (100%) 46 47 44 43Tyrone (100%) 11 14 11 14Other (100%) 1 — 1 1
Total North America 361 353 358 333South AmericaCerro Verde (53.56%) 269 269 289 271El Abra (51%) 51 49 56 54
Total South America 320 318 345 325IndonesiaGrasberg (48.76%)b 146 170 203 127
Total 827 841 906c
785c
Less noncontrolling interests 178 166 199 166Net 649 675 707 619Average realized price per pound $ 2.74 $ 2.75
GOLD (thousands of recoverable ounces)(FCX's net interest in %)
North America (100%) 5 7 3 5Indonesia (48.76%)b 218 327 314 261
Consolidated 223 334 317 266Less noncontrolling interests 41 33 58 26Net 182 301 259 240Average realized price per ounce $ 1,491 $ 1,255
MOLYBDENUM (millions of recoverable pounds)(FCX's net interest in %)
Henderson (100%) 2 4 N/A N/AClimax (100%) 3 5 N/A N/ANorth America copper mines (100%)a 8 9 N/A N/ACerro Verde (53.56%) 8 8 N/A N/A
Consolidated 21 26 22 24Less noncontrolling interests 3 4 3 4Net 18 22 19 20Average realized price per pound $ 11.65 $ 12.75
a. Amounts are net of Morenci's undivided joint venture partners' interests.
b. Effective December 21, 2018, FCX's share ownership in PT Freeport Indonesia (PT-FI) is 48.76 percent. FCX’s economicinterest in PT-FI is expected to approximate 81 percent through 2022 and 48.76 percent thereafter.
c. Consolidated sales volumes exclude purchased copper of 69 million pounds in fourth-quarter 2019 and 99 million pounds infourth-quarter 2018.

II
Freeport-McMoRan Inc.SELECTED OPERATING DATA (continued)
Years Ended December 31,2019 2018 2019 2018
MINING OPERATIONS: Production SalesCopper (millions of recoverable pounds) (FCX's net interest in %)
North AmericaMorenci (72%)a 730 684 717 700Bagdad (100%) 218 199 218 197Safford (100%) 110 123 111 127Sierrita (100%) 160 152 157 154Miami (100%) 15 16 15 16Chino (100%) 175 173 174 176Tyrone (100%) 48 55 49 56Other (100%) 1 2 1 2
Total North America 1,457 1,404 1,442 1,428South AmericaCerro Verde (53.56%) 1,003 1,049 1,002 1,051El Abra (51%) 180 200 181 202
Total South America 1,183 1,249 1,183 1,253IndonesiaGrasberg (48.76%)b 607 1,160 667 1,130
Total 3,247 3,813 3,292c
3,811c
Less noncontrolling interests 668 695 679 694Net 2,579 3,118 2,613 3,117Average realized price per pound $ 2.73 $ 2.91
Gold (thousands of recoverable ounces)(FCX's net interest in %)
North America (100%) 19 23 18 23Indonesia (48.76%)b 863 2,416 973 2,366
Consolidated 882 2,439 991 2,389Less noncontrolling interests 162 228 182 223Net 720 2,211 809 2,166Average realized price per ounce $ 1,415 $ 1,254
Molybdenum (millions of recoverable pounds)(FCX's net interest in %)
Henderson (100%) 12 14 N/A N/AClimax (100%) 17 21 N/A N/ANorth America (100%)a 32 32 N/A N/ACerro Verde (53.56%) 29 28 N/A N/A
Consolidated 90 95 90 94Less noncontrolling interests 13 13 13 13Net 77 82 77 81Average realized price per pound $ 12.61 $ 12.50
a. Amounts are net of Morenci's undivided joint venture partners' interests.
b. Effective December 21, 2018, FCX's share ownership in PT-FI is 48.76 percent. FCX’s economic interest in PT-FI isexpected to approximate 81 percent through 2022 and 48.76 percent thereafter.
c. Consolidated sales volumes exclude purchased copper of 379 million pounds for the year 2019 and 356 million pounds forthe year 2018.

III
Freeport-McMoRan Inc.SELECTED OPERATING DATA (continued)
Three Months Ended December 31, Years Ended December 31,2019 2018 2019 2018
100% North America Copper MinesLeach Operations
Leach ore placed in stockpiles (metric tons per day) 743,700 704,000 750,900 681,400Average copper ore grade (percent) 0.24 0.23 0.23 0.24Copper production (millions of recoverable pounds) 252 228 993 951
Mill OperationsOre milled (metric tons per day) 330,700 310,500 326,100 301,000Average ore grades (percent):
Copper 0.33 0.35 0.34 0.35Molybdenum 0.02 0.03 0.02 0.02
Copper recovery rate (percent) 84.2 87.0 87.0 87.8Production (millions of recoverable pounds):
Copper 179 188 748 719Molybdenum 9 11 34 35
100% South America MiningLeach Operations
Leach ore placed in stockpiles (metric tons per day) 208,000 171,600 205,900 195,200Average copper ore grade (percent) 0.38 0.34 0.37 0.33Copper production (millions of recoverable pounds) 76 73 268 287
Mill OperationsOre milled (metric tons per day) 396,800 395,800 393,100 387,600Average ore grades (percent):
Copper 0.38 0.36 0.36 0.38Molybdenum 0.02 0.01 0.02 0.01
Copper recovery rate (percent) 83.6 87.7 83.5 84.3Production (millions of recoverable pounds):
Copper 245 245 916 962Molybdenum 8 8 29 28
100% Indonesia MiningOre extracted and milled (metric tons per day):
Grasberg open pita 14,500 110,800 60,100 133,300Deep Ore Zone underground mineb 26,100 35,600 25,500 33,800Deep Mill Level Zone underground mineb 14,900 4,700 9,800 3,200Grasberg Block Cave underground mineb 11,200 4,300 8,600 4,000Big Gossan underground mineb 6,500 5,100 6,100 3,800
Total 73,200 160,500 110,100 178,100Average ore grades:
Copper (percent) 1.16 0.73 0.84 0.98Gold (grams per metric ton) 1.31 1.08 0.93 1.58
Recovery rates (percent):Copper 91.0 88.7 88.4 91.8Gold 79.5 80.0 75.0 84.7
Production (recoverable):Copper (millions of pounds) 146 197 607 1,227Gold (thousands of ounces) 218 391 863 2,697
100% Molybdenum MinesOre milled (metric tons per day) 21,500 30,300 30,100 27,900Average molybdenum ore grade (percent) 0.13 0.16 0.14 0.18Molybdenum production (millions of recoverable pounds) 5 9 29 35
a. Includes ore from related stockpiles.
b. Reflects ore extracted, including ore from development activities that result in metal production.

IV
Freeport-McMoRan Inc.CONSOLIDATED STATEMENTS OF OPERATIONS (Unaudited)
Three Months Ended Years EndedDecember 31, December 31,
2019 2018 2019 2018(In Millions, Except Per Share Amounts)
Revenuesa $ 3,911 $ 3,684 $ 14,402b
$ 18,628Cost of sales:
Production and deliveryb,c 2,930 2,897 11,514 11,687Depreciation, depletion and amortization 391 403
b1,412 1,754
b
Metals inventory adjustments 79 2 179 4Total cost of sales 3,400 3,302 13,105 13,445
Selling, general and administrative expensesb 99 102 414 443Mining exploration and research expenses 21 33 104 105Environmental obligations and shutdown costs 20 13 105 89Net gain on sales of assets (404)
d(82) (417)
d(208)
Total costs and expenses 3,136 3,368 13,311 13,874Operating income 775 316 1,091 4,754Interest expense, netb,c,e (219) (509) (620) (945)Net (loss) gain on early extinguishment of debt — (1) (27) 7Other (expenses) income, netb (190) 13
c(138) 76
c,f
Income (loss) from continuing operations before income taxesand equity in affiliated companies' net earnings 366 (181) 306 3,892
(Provision for) benefit from income taxesg (329) 552 (510) (991)Equity in affiliated companies' net earnings 5 3 12 8Net income (loss) from continuing operations 42 374 (192) 2,909Net income (loss) from discontinued operations 1 4 3 (15)Net income (loss) 43 378 (189) 2,894Net (income) loss attributable to noncontrolling interests (34) 107 (50)
h(292)
Net income (loss) attributable to common stockholdersi $ 9 $ 485 $ (239) $ 2,602
Diluted net income (loss) per share attributable to common stock:Continuing operations $ — $ 0.33 $ (0.17) $ 1.79Discontinued operations — — — (0.01)
$ — $ 0.33 $ (0.17) $ 1.78
Weighted-average common shares outstanding:Basic 1,452 1,450 1,451 1,449Diluted 1,457 1,457 1,451 1,458
Dividends declared per share of common stock $ 0.05 $ 0.05 $ 0.20 $ 0.20
a. Includes adjustments to provisionally priced concentrate and cathode sales. For a summary of adjustments to provisionally priced copper sales, refer to the supplemental schedule, "Derivative Instruments," beginning on page IX.
b. Includes PT-FI and other net charges, which are summarized in the supplemental schedule, "Adjusted Net Income," beginning on page VII.
c. Includes net charges associated with disputed Cerro Verde royalties for prior years, which are summarized in the supplemental schedule, "Adjusted Net Income," beginning on page VII.
d. Primarily includes $343 million associated with the sale of FCX's interest in the lower zone of the Timok exploration project in Serbia and $59 million associated with the sale of FCX's cobalt refinery in Kokkola, Finland, and related cobalt cathode precursor business.
e. Consolidated interest costs (before capitalization and excluding interest expense associated with disputed Cerro Verde royalties and PT-FI's historical contested tax disputes) totaled $159 million in fourth-quarter 2019, $170 million in fourth-quarter 2018, $623 million for the year 2019 and $671 million for the year 2018. Interest expense associated with disputed Cerro Verde royalties totaled $24 million in fourth-quarter 2019, $363 million in fourth-quarter 2018, $68 million for the year 2019 and $370 million for the year 2018. Interest expense associated with PT-FI's historical contested tax disputes totaled $78 million in the 2019 periods.
f. Includes $30 million of interest received with the refund of PT-FI's prior years' tax receivables. g. For a summary of FCX's provision for income taxes, refer to the supplemental schedule, "Income Taxes," beginning on page
VIII.h. Includes noncontrolling interest impacts associated with tax charges to record deferred taxes for historical balances in
accordance with tax accounting guidance. Refer to the supplemental schedule, "Income Taxes," beginning on page VIII.i. FCX defers recognizing profits on intercompany sales until final sales to third parties occur. For a summary of net impacts
from changes in these deferrals, refer to the supplemental schedule, "Deferred Profits," on page X.

V
Freeport-McMoRan Inc.CONSOLIDATED BALANCE SHEETS (Unaudited)
December 31,2019 2018
(In Millions)ASSETSCurrent assets:
Cash and cash equivalents $ 2,020 $ 4,217Trade accounts receivable 741 829Income and other tax receivables 426 493Inventories:
Materials and supplies, net 1,649 1,528Mill and leach stockpiles 1,028 1,088Product 1,281 1,778
Other current assets 655 422Total current assets 7,800 10,355
Property, plant, equipment and mine development costs, net 29,584 28,010Long-term mill and leach stockpiles 1,540 1,679Other assets 1,885 2,172Total assets $ 40,809 $ 42,216
LIABILITIES AND EQUITYCurrent liabilities:
Accounts payable and accrued liabilities $ 2,576 $ 2,625Current portion of environmental and asset retirement obligations 436 449Accrued income taxes 119 165Dividends payable 73 73Current portion of debt 5 17
Total current liabilities 3,209 3,329Long-term debt, less current portion 9,821 11,124Deferred income taxes 4,210 4,032Environmental and asset retirement obligations, less current portion 3,630 3,609Other liabilities 2,491 2,230
Total liabilities 23,361 24,324
Equity:Stockholders' equity:
Common stock 158 158Capital in excess of par value 25,830 26,013Accumulated deficit (12,280) (12,041)Accumulated other comprehensive loss (676) (605)Common stock held in treasury (3,734) (3,727)
Total stockholders' equity 9,298 9,798Noncontrolling interestsa 8,150 8,094
Total equity 17,448 17,892Total liabilities and equity $ 40,809 $ 42,216
a. Includes $4.6 billion associated with the December 2018 PT-FI transaction, including $4.1 billion associated with the PT Indonesia Asahan Aluminium (Persero) acquisition of Rio Tinto's joint venture interest.

VI
Freeport-McMoRan Inc.CONSOLIDATED STATEMENTS OF CASH FLOWS (Unaudited)
Years EndedDecember 31,
2019 2018(In Millions)
Cash flow from operating activities:Net (loss) income $ (189) $ 2,894Adjustments to reconcile net (loss) income to net cash provided by operating activities:
Depreciation, depletion and amortization 1,412 1,754Metals inventory adjustments 179 4Net gain on sales of assets (417) (208)Stock-based compensation 63 76Net charges for environmental and asset retirement obligations, including accretion 221 262Payments for environmental and asset retirement obligations (244) (239)Net charges for defined pension and postretirement plans 108 81Pension plan contributions (75) (75)Net loss (gain) on early extinguishment of debt 27 (7)Deferred income taxes 29 (404)(Income) loss on discontinued operations (3) 15Dividends received from PT Smelting 40 —Charges for PT-FI surface water tax, withholding tax and environmental matters 30 162Payments for PT-FI surface water and withholding tax matters (67) —Charges for Cerro Verde royalty dispute 65 371Payments for Cerro Verde royalty dispute (187) (56)U.S. tax reform benefit — (123)Other, net 141 12Changes in working capital and other, excluding disposition amounts:
Accounts receivable 119 649Inventories 259 (537)Other current assets 60 (28)Accounts payable and accrued liabilities (60) (106)Accrued income taxes and timing of other tax payments (29) (634)
Net cash provided by operating activities 1,482 3,863
Cash flow from investing activities:Capital expenditures:
North America copper mines (877) (601)South America (256) (237)Indonesia (1,369) (1,001)Molybdenum mines (19) (9)Other (131) (123)
Acquisition of PT Rio Tinto Indonesia — (3,500)Proceeds from sales of:
Timok exploration project and Freeport Cobalt 452 —PT Indonesia Papua Metal Dan Mineral — 457Other assets 109 93
Other, net (12) (97)Net cash used in investing activities (2,103) (5,018)
Cash flow from financing activities:Proceeds from debt 1,879 632Repayments of debt (3,197) (2,717)Proceeds from sale of PT-FI shares — 3,500Cash dividends and distributions paid:
Common stock (291) (218)Noncontrolling interests (82) (278)
Contributions from noncontrolling interests 165 —Other, net (30) (19)
Net cash (used in) provided by financing activities (1,556) 900
Net decrease in cash, cash equivalents, restricted cash and restricted cash equivalents (2,177) (255)Cash, cash equivalents, restricted cash and restricted cash equivalents at beginning of year 4,455 4,710Cash, cash equivalents, restricted cash and restricted cash equivalents at end of yeara $ 2,278 $ 4,455
a. Includes restricted cash and restricted cash equivalents of $258 million at December 31, 2019, and $238 million at December 31, 2018.

VII
Freeport-McMoRan Inc.ADJUSTED NET INCOME
Adjusted net income is intended to provide investors and others with information about FCX's recurring operating performance. This information differs from net income (loss) attributable to common stock determined in accordance with U.S. generally accepted accounting principles (GAAP) and should not be considered in isolation or as a substitute for measures of performance determined in accordance with U.S. GAAP. FCX's adjusted net income follows, which may not be comparable to similarly titled measures reported by other companies (in millions, except per share amounts).
Three Months Ended December 31,2019 2018
Pre-tax After-taxa Per Share Pre-tax After-taxa Per ShareNet income attributable to common stock N/A $ 9 $ — N/A $ 485 $ 0.33
PT-FI net charges $ (266)b
$ (283) $ (0.20) $ (192)c
$ (94) $ (0.07)Metals inventory adjustments (79) (77) (0.05) (2) (2) —Cerro Verde royalty dispute (16)
d(7) — (399)
d(195) (0.13)
Other net charges (17)e
(5) — (63)f
(34) (0.02)Net adjustments to environmental obligations and
related litigation reserves (5) (5) — (5) (5) —Net gain on sales of assets 404 326 0.22 82 82 0.05Net loss on early extinguishment of debt — — — (1) (1) —Net tax creditsg N/A 29 0.02 N/A 569 0.39Gain on discontinued operations 1 1 — 4 4 —
$ 21h
$ (22)h
$ (0.02)h
$ (576) $ 324 $ 0.22
Adjusted net income attributable to commonstock N/A $ 31 $ 0.02 N/A $ 161 $ 0.11
Years Ended December 31,2019 2018
Pre-tax After-taxa Per Share Pre-tax After-taxa Per ShareNet (loss) income attributable to common stock N/A $ (239) $ (0.17) N/A $ 2,602 $ 1.78
PT-FI net charges $ (460)b
$ (379) $ (0.26) $ (223)c
$ (110) $ (0.08)Metals inventory adjustments (179) (144) (0.10) (4) (4) —Cerro Verde royalty dispute (16)
d(7) — (406)
d(195) (0.13)
Cerro Verde labor agreement — — — (69) (22) (0.02)Other net charges (59)
e(26) (0.02) (46)
f(26) (0.02)
Net adjustments to environmental obligations andrelated litigation reserves (68) i (68) (0.05) (57) (57) (0.04)
Net gain on sales of assets 417 339 0.23 208 208 0.14Net (loss) gain on early extinguishment of debt (27) (26) (0.02) 7 7 —Interest on tax refunds — — — 30 19 0.01Net tax creditsg N/A 34 0.02 N/A 574 0.39Gain (loss) on discontinued operations 3 3 — (15) (15) (0.01)
$ (390)h
$ (275)h
$ (0.19)h
$ (575) $ 379 $ 0.24
Adjusted net income attributable to commonstock N/A $ 36 $ 0.02 N/A $ 2,223 $ 1.54
a. Reflects impact to FCX net income (loss) attributable to common stock (i.e., net of any taxes and noncontrolling interests).b. Reflects charges of $234 million associated with PT-FI's historical contested tax audits ($156 million in other (expenses)
income, net and $78 million in interest expense, net) and $32 million for a currency exchange adjustment to value added tax receivables at PT-FI in other expenses (income), net. The year 2019 also includes charges of $28 million in production and delivery costs for an adjustment to the settlement of the historical surface water tax matters with the local regional tax authority in Papua, Indonesia, and $166 million in revenues, primarily associated with an unfavorable Indonesia Supreme Court ruling related to PT-FI export duties.
c. Reflects charges in production and delivery of $69 million for surface water tax settlements with the local regional tax authority in Papua, Indonesia, $32 million for assessments for prior period permit fees with Indonesia's Ministry of Environment and Forestry, $72 million for disputed payroll withholding taxes for prior years and other tax settlements, and $62 million to write-off certain previously capitalized project costs for the new Indonesian smelter. These charges were partly offset by inventory adjustments ($43 million in fourth-quarter 2018 and $12 million for the year 2018).
VIII
Freeport-McMoRan Inc.ADJUSTED NET INCOME (continued)
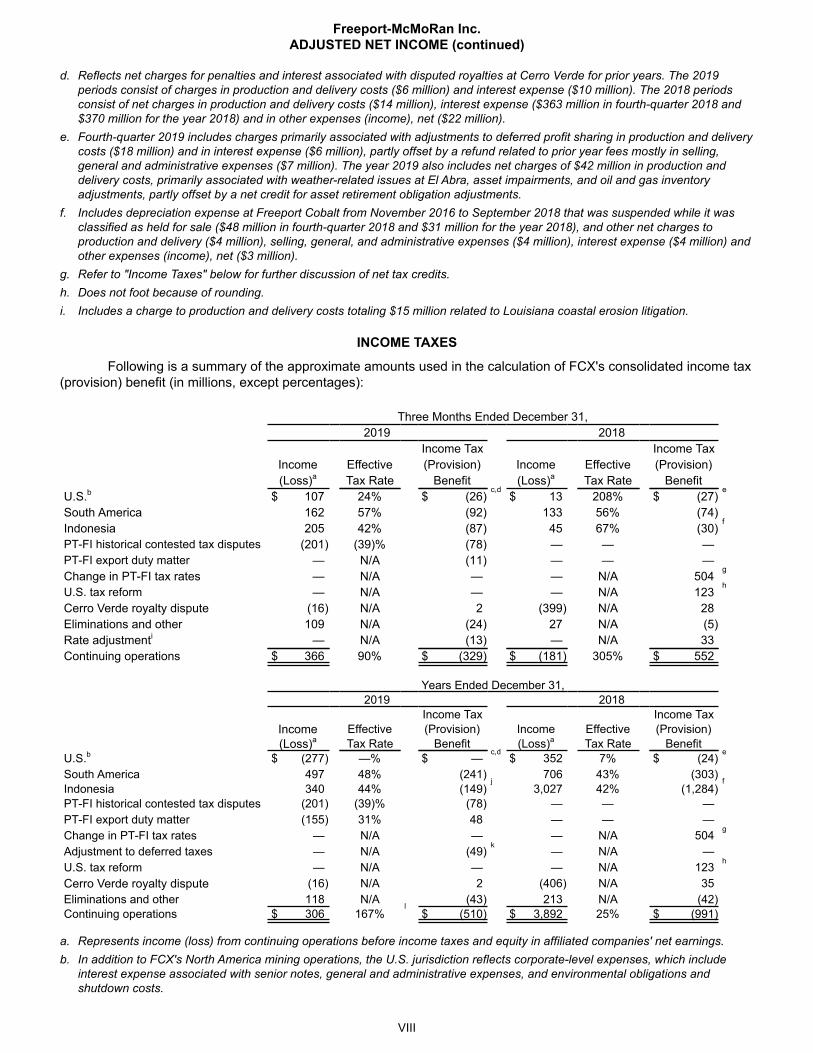
d. Reflects net charges for penalties and interest associated with disputed royalties at Cerro Verde for prior years. The 2019 periods consist of charges in production and delivery costs ($6 million) and interest expense ($10 million). The 2018 periods consist of net charges in production and delivery costs ($14 million), interest expense ($363 million in fourth-quarter 2018 and $370 million for the year 2018) and in other expenses (income), net ($22 million).
e. Fourth-quarter 2019 includes charges primarily associated with adjustments to deferred profit sharing in production and delivery costs ($18 million) and in interest expense ($6 million), partly offset by a refund related to prior year fees mostly in selling, general and administrative expenses ($7 million). The year 2019 also includes net charges of $42 million in production and delivery costs, primarily associated with weather-related issues at El Abra, asset impairments, and oil and gas inventory adjustments, partly offset by a net credit for asset retirement obligation adjustments.
f. Includes depreciation expense at Freeport Cobalt from November 2016 to September 2018 that was suspended while it was classified as held for sale ($48 million in fourth-quarter 2018 and $31 million for the year 2018), and other net charges to production and delivery ($4 million), selling, general, and administrative expenses ($4 million), interest expense ($4 million) and other expenses (income), net ($3 million).
g. Refer to "Income Taxes" below for further discussion of net tax credits.h. Does not foot because of rounding. i. Includes a charge to production and delivery costs totaling $15 million related to Louisiana coastal erosion litigation.
INCOME TAXES
Following is a summary of the approximate amounts used in the calculation of FCX's consolidated income tax (provision) benefit (in millions, except percentages):
Three Months Ended December 31,2019 2018
Income Tax Income TaxIncome Effective (Provision) Income Effective (Provision)(Loss)a Tax Rate Benefit (Loss)a Tax Rate Benefit
U.S.b $ 107 24% $ (26)c,d
$ 13 208% $ (27)e
South America 162 57% (92) 133 56% (74)Indonesia 205 42% (87) 45 67% (30)
f
PT-FI historical contested tax disputes (201) (39)% (78) — — —PT-FI export duty matter — N/A (11) — — —Change in PT-FI tax rates — N/A — — N/A 504
g
U.S. tax reform — N/A — — N/A 123h
Cerro Verde royalty dispute (16) N/A 2 (399) N/A 28Eliminations and other 109 N/A (24) 27 N/A (5)Rate adjustmenti — N/A (13) — N/A 33Continuing operations $ 366 90% $ (329) $ (181) 305% $ 552
Years Ended December 31,2019 2018
Income Tax Income TaxIncome Effective (Provision) Income Effective (Provision)(Loss)a Tax Rate Benefit (Loss)a Tax Rate Benefit
U.S.b $ (277) —% $ —c,d
$ 352 7% $ (24)e
South America 497 48% (241) 706 43% (303)Indonesia 340 44% (149)
j3,027 42% (1,284)
f
PT-FI historical contested tax disputes (201) (39)% (78) — — —PT-FI export duty matter (155) 31% 48 — — —Change in PT-FI tax rates — N/A — — N/A 504
g
Adjustment to deferred taxes — N/A (49)k
— N/A —U.S. tax reform — N/A — — N/A 123
h
Cerro Verde royalty dispute (16) N/A 2 (406) N/A 35Eliminations and other 118 N/A (43) 213 N/A (42)Continuing operations $ 306 167%
l$ (510) $ 3,892 25% $ (991)
a. Represents income (loss) from continuing operations before income taxes and equity in affiliated companies' net earnings.b. In addition to FCX's North America mining operations, the U.S. jurisdiction reflects corporate-level expenses, which include
interest expense associated with senior notes, general and administrative expenses, and environmental obligations and shutdown costs.

IX
Freeport-McMoRan Inc.INCOME TAXES (continued)
c. The fourth quarter and year 2019 include a tax credit of $29 million associated with adjustments to the calculation of transition tax related to U.S. tax reform. The year 2019 also includes tax credits of $24 million, associated with state law changes and the settlement of state income tax examinations.
d. The fourth quarter and year 2019 include a tax charge of $53 million associated with the sale of FCX's interest in the lower zone of the Timok exploration project in Serbia.
e. The fourth quarter and year 2018 include net tax charges totaling $20 million, primarily associated with adjustments to the calculation of transition tax related to U.S. tax reform. The year 2018 also includes a tax credit of $5 million associated with the settlement of a state income tax examination.
f. The fourth quarter and year 2018 include a tax credit of $20 million ($17 million net of noncontrolling interests) for adjustment to PT-FI's historical tax positions.
g. The fourth quarter and year 2018 reflect a tax credit of $504 million ($453 million net of noncontrolling interest) resulting from the reduction in PT-FI's statutory tax rates in accordance with its new special mining license (IUPK).
h. The Tax Cuts and Jobs Act (the Act), which was enacted on December 22, 2017, included significant modifications to U.S. tax laws and created many new complex tax provisions. In December 2018, we completed our analysis of the Act and recognized benefits totaling $123 million ($119 million net of noncontrolling interest) in the fourth quarter and year 2018 associated with alternative minimum tax credit refunds.
i. In accordance with applicable accounting rules, FCX adjusts its interim provision for income taxes equal to its consolidated tax rate.
j. The year 2019 includes a tax charge of $5 million ($4 million net of noncontrolling interest) primarily for non-deductible penalties related to PT-FI’s surface water tax settlement.
k. The year 2019 includes net tax charges totaling $49 million ($15 million net of noncontrolling interests) primarily to adjust deferred taxes on historical balance sheet items in accordance with tax accounting principles.
l. The consolidated effective income tax rate is a function of the combined effective tax rates for the jurisdictions in which FCX operates, excluding the U.S. jurisdiction. Because FCX's U.S. jurisdiction generated net losses in the year 2019 that did not result in a realized tax benefit, applicable accounting rules require FCX to adjust its annual effective tax rate to exclude the impact of U.S. net losses.
Assuming achievement of current sales volume and cost estimates and average prices of $2.85 per pound for copper, $1,500 per ounce for gold and $10.00 per pound for molybdenum, FCX estimates its consolidated effective tax rate for the year 2020 would approximate 42 percent. Changes in sales volumes and average prices during 2020 would incur tax impacts at estimated effective rates of 38 percent for Indonesia, 40 percent for Peru and 0 percent for the U.S.
Variations in the relative proportions of juristictional income result in fluctuations to FCX's consolidated effective income tax rate. Because of FCX's U.S. tax position, it does not record a financial statement impact for income or losses generated in the U.S.; therefore, the consolidated effective tax rate is generally higher than the international rates at lower copper prices and lower than international rates at higher copper prices.
DERIVATIVE INSTRUMENTS
For the year 2019, FCX's mined copper was sold 56 percent in concentrate, 22 percent as cathode and 22 percent as rod from North America operations. Substantially all of FCX's copper concentrate and cathode sales contracts provide final copper pricing in a specified future month (generally one to four months from the shipment date) based primarily on quoted London Metal Exchange (LME) monthly average copper prices. FCX records revenues and invoices customers at the time of shipment based on then-current LME prices, which results in an embedded derivative on provisionally priced concentrate and cathode sales that is adjusted to fair value through earnings each period, using the period-end forward prices, until final pricing on the date of settlement. LME copper settlement prices averaged $2.67 per pound during fourth-quarter 2019 and settled at $2.79 per pound on December 31, 2019. Because a significant portion of FCX's copper concentrate and cathode sales in any quarterly period usually remain subject to final pricing, the quarter-end forward price is a major determinant of the average recorded copper price for the period. FCX's average realized copper price was $2.74 per pound in fourth-quarter 2019.

X
Freeport-McMoRan Inc.DERIVATIVE INSTRUMENTS (continued)
Following is a summary of the adjustments to prior period and current period provisionally priced copper sales (in millions, except per share amounts):
Three Months Ended December 31,2019 2018
PriorPerioda
CurrentPeriodb Total
PriorPerioda
CurrentPeriodb Total
Revenues $ 33 $ 58 $ 91 $ (32) $ (36) $ (68)Net income attributable to common stock $ 14 $ 24 $ 38 $ (15) $ (14) $ (29)Net income per share of common stock $ 0.01 $ 0.02 $ 0.03 $ (0.01) $ (0.01) $ (0.02)
a. Reflects adjustments to prior period provisionally priced copper sales at September 30, 2019 and 2018.b. Reflects adjustments to provisionally priced copper sales in the fourth quarters of 2019 and 2018.
Years Ended December 31,2019 2018
PriorPerioda
CurrentPeriodb Total
PriorPerioda
CurrentPeriodb Total
Revenues $ 58 $ (24) $ 34 $ (70) $ (240) $ (310)Net income attributable to common stock $ 24 $ (16) $ 8 $ (31) $ (104) $ (135)Net income per share of common stock $ 0.02 $ (0.01) $ 0.01 $ (0.02) $ (0.07) $ (0.09)
a. Reflects adjustments to provisionally priced copper sales at December 31, 2018 and 2017.b. Reflects adjustments to provisionally priced copper sales for the years 2019 and 2018.
At December 31, 2019, FCX had provisionally priced copper sales at its copper mining operations totaling 269 million pounds of copper (net of intercompany sales and noncontrolling interests) recorded at an average price of $2.80 per pound, subject to final pricing over the next several months. FCX estimates that each $0.05 change in the price realized from the December 31, 2019 provisional price would have an approximate $9 million effect on 2020 net income attributable to common stock. The LME copper price settled at $2.77 per pound on January 22, 2020.
DEFERRED PROFITS
FCX defers recognizing profits on sales from its mining operations to Atlantic Copper and on 25 percent of PT-FI's sales to PT Smelting (PT-FI's 25 percent-owned Indonesian smelting unit) until final sales to third parties occur. Changes in these deferrals attributable to variability in intercompany volumes resulted in net additions (reductions) to operating income totaling $1 million ($2 million to net income attributable to common stock) in fourth-quarter 2019, $81 million ($46 million to net income attributable to common stock) in fourth-quarter 2018, $(22) million ($(18) million to net income attributable to common stock) for the year 2019 and $69 million ($42 million to net income attributable to common stock) for the year 2018. FCX's net deferred profits on its inventories at Atlantic Copper and PT Smelting to be recognized in future periods' net income attributable to common stock totaled $38 million at December 31, 2019. Quarterly variations in ore grades, the timing of intercompany shipments and changes in product prices will result in variability in FCX's net deferred profits and quarterly earnings.
BUSINESS SEGMENTS
FCX has organized its mining operations into four primary divisions – North America copper mines, South America mining, Indonesia mining and Molybdenum mines, and operating segments that meet certain thresholds are reportable segments. Separately disclosed in the following tables are FCX's reportable segments, which include the Morenci, Bagdad, Cerro Verde and Grasberg (Indonesia Mining) copper mines, the Rod & Refining operations and Atlantic Copper Smelting & Refining. Intersegment sales between FCX’s business segments are based on terms similar to arms-length transactions with third parties at the time of the sale. Intersegment sales may not be reflective of the actual prices ultimately realized because of a variety of factors, including additional processing, the timing of sales to unaffiliated customers and transportation premiums. FCX allocates certain operating costs, expenses and capital expenditures to its operating divisions and individual segments. However, not all costs and expenses applicable to an operation are allocated. U.S. federal and state income taxes are recorded and managed at the corporate level (included in Corporate, Other & Eliminations), whereas foreign income taxes are recorded and managed at the applicable country level. In addition, most mining exploration and research activities are managed on a consolidated basis, and those costs along with some selling, general and administrative costs, are not allocated to the operating divisions or individual segments. Accordingly, the following segment information reflects management determinations that may not be indicative of what the actual financial performance of each operating division or segment would be if it was an independent entity.

XI
Freeport-McMoRan Inc. BUSINESS SEGMENTS (continued)
(In millions) Atlantic Corporate
,North America Copper Mines South America Mining Copper OtherOther Cerro Other Indonesia Molybdenum Rod & Smelting & Elimi- FCX
Morenci Bagdad Mines Total Verde Mines Total Mining Mines Refining & Refining nations TotalThree Months Ended December 31, 2019 Revenues:
Unaffiliated customers $ 54 $ — $ 41 $ 95 $ 783 $ 156 $ 939 $ 937a
$ — $ 1,054 $ 509 $ 377b
$ 3,911Intersegment 453 172 372 997 51 — 51 1 54 8 — (1,111) —
Production and delivery 356 124 376 856 541 137 678 546 65 1,060 483 (758) 2,930Depreciation, depletion and amortization 43 13 32 88 112 20 132 125 12 2 7 25 391Metals inventory adjustments — — (9) (9) — — — 5 49 — — 34 79Selling, general and administrative expenses — — — — 2 — 2 34 — — 5 58 99Mining exploration and research expenses — — 1 1 — — — — — — — 20 21Environmental obligations and shutdown costs 1 — — 1 — — — — — — — 19 20Net gain on sales of assets — — — — — — — — — — — (404) (404)Operating income (loss) 107 35 13 155 179 (1) 178 228 (72) — 14 272 775
Interest expense, net 1 — — 1 35 — 35 80 — — 5 98 219Provision for (benefit from) income taxes — — — — 91 (1) 90 176 — — 3 60 329Total assets at December 31, 2019 2,880 783 4,326 7,989 8,612 1,676 10,288 16,485 1,798 193 761 3,295 40,809Capital expenditures 59 50 127 236 72 8 80 377 8 2 16 16 735
Three Months Ended December 31, 2018 Revenues:
Unaffiliated customers $ 32 $ — $ 24 $ 56 $ 678 $ 151 $ 829 $ 583a
$ — $ 1,119 $ 541 $ 556b
$ 3,684Intersegment 415 174 408 997 79 — 79 (1) 103 7 1 (1,186) —
Production and delivery 291 120 346 757 496 124 620 460 75 1,125 524 (664) 2,897Depreciation, depletion and amortization 43 9 34 86 120 24 144 72 19 3 7 72 403Metals inventory adjustments — — 2 2 — — — — — — — — 2Selling, general and administrative expenses — — 1 1 2 — 2 27 — — 5 67 102Mining exploration and research expenses — — 1 1 — — — — — — — 32 33Environmental obligations and shutdown costs — — — — — — — — — — — 13 13Net gain on sale of assets — — — — — — — — — — — (82) (82)Operating income (loss) 113 45 48 206 139 3 142 23 9 (2) 6 (68) 316
Interest expense, net — — 1 1 381 — 381 1 — — 7 119 509Provision for (benefit from) income taxes — — — — 46 — 46 (499) — — — (99) (552)Total assets at December 31, 2018 2,922 671 3,937 7,530 8,524 1,707 10,231 15,646 1,796 233 773 6,007 42,216Capital expenditures 65 18 105 188 42 7 49 306 3 2 6 26 580
a. Includes PT-FI's sales to PT Smelting totaling $540 million in fourth-quarter 2019 and $122 million in fourth-quarter 2018.b. Includes revenues from FCX's molybdenum sales company, which includes sales of molybdenum produced by the Molybdenum mines and by certain of the North America and South America copper
mines.

XII
Freeport-McMoRan Inc. BUSINESS SEGMENTS (continued)
(In millions) Atlantic Corporate
,North America Copper Mines South America Mining Copper OtherOther Cerro Other Indonesia Molybdenum Rod & Smelting & Elimi- FCX
Morenci Bagdad Mines Total Verde Mines Total Mining Mines Refining & Refining nations TotalYear Ended December 31, 2019 Revenues:
Unaffiliated customers $ 143 $ — $ 224 $ 367 $ 2,576 $ 499 $3,075 $ 2,713a
$ — $ 4,457 $ 2,063 $ 1,727b
$14,402Intersegment 1,864 763 1,392 4,019 313 — 313 58 344 26 5 (4,765) —
Production and delivery 1,376 512 1,431 3,319 1,852 474 2,326 2,055 299 4,475 1,971 (2,931) 11,514Depreciation, depletion and amortization 171 46 132 349 406 68 474 406 62 9 28 84 1,412Metals inventory adjustments 1 — 29 30 2 — 2 5 50 — — 92 179Selling, general and administrative expenses 2 1 1 4 8 — 8 125 — — 20 257 414Mining exploration and research expenses — — 2 2 — — — — — — — 102 104Environmental obligations and shutdown costs 1 — — 1 — — — — — — — 104 105Net gain on sales of assets — — — — — — — — — — — (417) (417)Operating income (loss) 456 204 21 681 621 (43) 578 180 (67) (1) 49 (329) 1,091
Interest expense, net 3 — 1 4 114 — 114 82 — — 22 398 620Provision for (benefit from) income taxes — — — — 250 (11) 239 167 — — 5 99 510Capital expenditures 231 150 496 877 232 24 256 1,369 19 5 34 92 2,652
Year Ended December 31, 2018 Revenues:
Unaffiliated customers $ 90 $ — $ 54 $ 144 $ 2,709 $ 594 $3,303 $ 5,446a
$ — $ 5,103 $ 2,299 $ 2,333b
$18,628Intersegment 2,051 710 1,789 4,550 352 — 352 113 410 31 3 (5,459) —
Production and delivery 1,183 483 1,458 3,124 1,887 478 2,365 1,864 289 5,117 2,218 (3,290) 11,687Depreciation, depletion and amortization 176 41 143 360 456 90 546 606 79 11 27 125 1,754Metals inventory adjustments — — 4 4 — — — — — — — — 4Selling, general and administrative expenses 3 1 2 6 9 — 9 123 — — 21 284 443Mining exploration and research expenses — — 3 3 — — — — — — — 102 105Environmental obligations and shutdown costs — — 2 2 — — — — — — — 87 89Net gain on sales of assets — — — — — — — — — — — (208) (208)Operating income (loss) 779 185 231 1,195 709 26 735 2,966 42 6 36 (226) 4,754
Interest expense, net 3 — 1 4 429 — 429 1 — — 25 486 945Provision for income taxes — — — — 253 15 268 755 — — 1 (33) 991Capital expenditures 216 39 346 601 220 17 237 1,001 9 5 16 102 1,971
a. Includes PT-FI's sales to PT Smelting totaling $1.9 billion for the year 2019 and $2.2 billion for the year 2018.b. Includes revenues from FCX's molybdenum sales company, which includes sales of molybdenum produced by the Molybdenum mines and by certain of the North America and South America copper
mines.
XIII
Freeport-McMoRan Inc.PRODUCT REVENUES AND PRODUCTION COSTS
Unit net cash costs (credits) per pound of copper and molybdenum are measures intended to provide investors with information about the cash-generating capacity of FCX's mining operations expressed on a basis relating to the primary metal product for the respective operations. FCX uses this measure for the same purpose and for monitoring operating performance by its mining operations. This information differs from measures of performance determined in accordance with U.S. GAAP and should not be considered in isolation or as a substitute for measures of performance determined in accordance with U.S. GAAP. These measures are presented by other metals mining companies, although FCX's measures may not be comparable to similarly titled measures reported by other companies.
FCX presents gross profit per pound of copper in the following tables using both a “by-product” method and a “co-product” method. FCX uses the by-product method in its presentation of gross profit per pound of copper because (i) the majority of its revenues are copper revenues, (ii) it mines ore, which contains copper, gold, molybdenum and other metals, (iii) it is not possible to specifically assign all of FCX's costs to revenues from the copper, gold, molybdenum and other metals it produces and (iv) it is the method used by FCX's management and Board to monitor FCX's mining operations and to compare mining operations in certain industry publications. In the co-product method presentations, shared costs are allocated to the different products based on their relative revenue values, which will vary to the extent FCX's metals sales volumes and realized prices change.
FCX shows revenue adjustments for prior period open sales as a separate line item. Because these adjustments do not result from current period sales, these amounts have been reflected separately from revenues on current period sales. Noncash and other costs, which are removed from site production and delivery costs in the calculation of unit net cash costs (credits), consist of items such as stock-based compensation costs, start-up costs, inventory adjustments, long-lived asset impairments, restructuring and/or unusual charges. As discussed above, gold, molybdenum and other metal revenues at copper mines are reflected as credits against site production and delivery costs in the by-product method. The following schedules are presentations under both the by-product and co-product methods together with reconciliations to amounts reported in FCX's consolidated financial statements.

XIV
Freeport-McMoRan Inc.PRODUCT REVENUES AND PRODUCTION COSTS (continued)
North America Copper Mines Product Revenues, Production Costs and Unit Net Cash CostsThree Months Ended December 31, 2019(In millions) By-Product Co-Product Method
Method Copper Molybdenuma Otherb TotalRevenues, excluding adjustments $ 976 $ 976 $ 86 $ 21 $ 1,083Site production and delivery, before net noncash and other costs shown below 741 681 74 14 769By-product credits (79) — — — —Treatment charges 41 40 — 1 41
Net cash costs 703 721 74 15 810Depreciation, depletion and amortization (DD&A) 87 80 5 2 87Metals inventory adjustments (9) (9) — — (9)Noncash and other costs, net 46 43 2 1 46
Total costs 827 835 81 18 934Other revenue adjustments, primarily for pricing on prior period open sales 11 11 — — 11Gross profit $ 160 $ 152 $ 5 $ 3 $ 160
Copper sales (millions of recoverable pounds) 357 357Molybdenum sales (millions of recoverable pounds)a 8
Gross profit per pound of copper/molybdenum:
Revenues, excluding adjustments $ 2.73 $ 2.73 $ 10.07Site production and delivery, before net noncash and other costs shown below 2.07 1.90 8.57By-product credits (0.22) — —Treatment charges 0.11 0.11 —
Unit net cash costs 1.96 2.01 8.57DD&A 0.24 0.23 0.62Metals inventory adjustments (0.03) (0.03) —Noncash and other costs, net 0.14 0.13 0.26
Total unit costs 2.31 2.34 9.45Other revenue adjustments, primarily for pricing on prior period open sales 0.03 0.03 —Gross profit per pound $ 0.45 $ 0.42 $ 0.62
Reconciliation to Amounts ReportedMetals
Production InventoryRevenues and Delivery DD&A Adjustments
Totals presented above $ 1,083 $ 769 $ 87 $ (9)Treatment charges (12) 29 — —Noncash and other costs, net — 46 — —Other revenue adjustments, primarily for pricing on prior period open sales 11 — — —Eliminations and other 10 12 1 —North America copper mines 1,092 856 88 (9)Other miningc 3,553 2,832 278 54Corporate, other & eliminations (734) (758) 25 34As reported in FCX's consolidated financial statements $ 3,911 $ 2,930 $ 391 $ 79
a. Reflects sales of molybdenum produced by certain of the North America copper mines to FCX's molybdenum sales company at market-based pricing.
b. Includes gold and silver product revenues and production costs.c. Represents the combined total for FCX's other mining operations as presented in the supplemental schedule, "Business Segments,"
beginning on page X.

XV
Freeport-McMoRan Inc.PRODUCT REVENUES AND PRODUCTION COSTS (continued)
North America Copper Mines Product Revenues, Production Costs and Unit Net Cash CostsThree Months Ended December 31, 2018(In millions) By-Product Co-Product Method
Method Copper Molybdenuma Otherb TotalRevenues, excluding adjustments $ 918 $ 918 $ 116 $ 22 $ 1,056Site production and delivery, before net noncash and other costs shown below 666 589 90 13 692By-product credits (112) — — — —Treatment charges 41 39 — 2 41
Net cash costs 595 628 90 15 733DD&A 85 77 6 2 85Metals inventory adjustments 2 2 — — 2Noncash and other costs, net 24 22 2 — 24
Total costs 706 729 98 17 844Other revenue adjustments, primarily for pricing on prior period open sales (3) (3) — — (3)Gross profit $ 209 $ 186 $ 18 $ 5 $ 209
Copper sales (millions of recoverable pounds) 332 332Molybdenum sales (millions of recoverable pounds)a 9
Gross profit per pound of copper/molybdenum:
Revenues, excluding adjustments $ 2.77 $ 2.77 $ 11.92Site production and delivery, before net noncash and other costs shown below 2.01 1.78 9.25By-product credits (0.34) — —Treatment charges 0.12 0.12 —
Unit net cash costs 1.79 1.90 9.25DD&A 0.26 0.23 0.66Metals inventory adjustments 0.01 0.01 —Noncash and other costs, net 0.07 0.06 0.18
Total unit costs 2.13 2.20 10.09Other revenue adjustments, primarily for pricing on prior period open sales (0.01) (0.01) —Gross profit per pound $ 0.63 $ 0.56 $ 1.83
Reconciliation to Amounts Reported MetalsProduction Inventory
Revenues and Delivery DD&A AdjustmentsTotals presented above $ 1,056 $ 692 $ 85 $ 2Treatment charges (11) 30 — —Noncash and other costs, net — 24 — —Other revenue adjustments, primarily for pricing on prior period open sales (3) — — —Eliminations and other 11 11 1 —North America copper mines 1,053 757 86 2Other miningc 3,261 2,804 245 —Corporate, other & eliminations (630) (664) 72 —As reported in FCX's consolidated financial statements $ 3,684 $ 2,897 $ 403 $ 2
a. Reflects sales of molybdenum produced by certain of the North America copper mines to FCX's molybdenum sales company at market-based pricing.
b. Includes gold and silver product revenues and production costs.c. Represents the combined total for FCX's other mining operations as presented in the supplemental schedule, "Business Segments,"
beginning on page X.

XVI
Freeport-McMoRan Inc.PRODUCT REVENUES AND PRODUCTION COSTS (continued)
North America Copper Mines Product Revenues, Production Costs and Unit Net Cash CostsYear Ended December 31, 2019(In millions) By-Product Co-Product Method
Method Copper Molybdenuma Otherb TotalRevenues, excluding adjustments $ 3,950 $ 3,950 $ 370 $ 84 $ 4,404Site production and delivery, before net noncash and other costs shown below 2,957 2,711 299 53 3,063By-product credits (348) — — — —Treatment charges 161 155 — 6 161
Net cash costs 2,770 2,866 299 59 3,224DD&A 348 318 23 7 348Metals inventory adjustments 30 30 — — 30Noncash and other costs, net 110 98 9 3 110
Total costs 3,258 3,312 331 69 3,712Other revenue adjustments, primarily for pricing on prior period open sales 4 4 — — 4Gross profit $ 696 $ 642 $ 39 $ 15 $ 696
Copper sales (millions of recoverable pounds) 1,441 1,441Molybdenum sales (millions of recoverable pounds)a 32
Gross profit per pound of copper/molybdenum:
Revenues, excluding adjustments $ 2.74 $ 2.74 $ 11.51Site production and delivery, before net noncash and other costs shown below 2.05 1.88 9.29By-product credits (0.24) — —Treatment charges 0.11 0.11 —
Unit net cash costs 1.92 1.99 9.29DD&A 0.24 0.21 0.72Metals inventory adjustments 0.02 0.02 —Noncash and other costs, net 0.08 0.07 0.29
Total unit costs 2.26 2.29 10.30Other revenue adjustments, primarily for pricing on prior period open sales — — —Gross profit per pound $ 0.48 $ 0.45 $ 1.21
Reconciliation to Amounts ReportedMetals
Production InventoryRevenues and Delivery DD&A Adjustments
Totals presented above $ 4,404 $ 3,063 $ 348 $ 30Treatment charges (60) 101 — —Noncash and other costs, net — 110 — —Other revenue adjustments, primarily for pricing on prior period open sales 4 — — —Eliminations and other 38 45 1 —North America copper mines 4,386 3,319 349 30Other miningc 13,054 11,126 979 57Corporate, other & eliminations (3,038) (2,931) 84 92As reported in FCX's consolidated financial statements $ 14,402 $ 11,514 $ 1,412 $ 179
a. Reflects sales of molybdenum produced by certain of the North America copper mines to FCX's molybdenum sales company at market-based pricing.
b. Includes gold and silver product revenues and production costs.c. Represents the combined total for FCX's other mining operations as presented in the supplemental schedule, "Business Segments,"
beginning on page X.

XVII
Freeport-McMoRan Inc.PRODUCT REVENUES AND PRODUCTION COSTS (continued)
North America Copper Mines Product Revenues, Production Costs and Unit Net Cash CostsYear Ended December 31, 2018(In millions) By-Product Co-Product Method
Method Copper Molybdenuma Otherb TotalRevenues, excluding adjustments $ 4,217 $ 4,217 $ 376 $ 90 $ 4,683Site production and delivery, before net noncash and other costs shown below 2,766 2,522 291 52 2,865By-product credits (367) — — — —Treatment charges 150 144 — 6 150
Net cash costs 2,549 2,666 291 58 3,015DD&A 359 327 24 8 359Metals inventory adjustments 4 4 — — 4Noncash and other costs, net 90 83 6 1 90
Total costs 3,002 3,080 321 67 3,468Other revenue adjustments, primarily for pricing on prior period open sales (5) (5) — — (5)Gross profit $ 1,210 $ 1,132 $ 55 $ 23 $ 1,210
Copper sales (millions of recoverable pounds) 1,426 1,426Molybdenum sales (millions of recoverable pounds)a 32
Gross profit per pound of copper/molybdenum:
Revenues, excluding adjustments $ 2.96 $ 2.96 $ 11.64Site production and delivery, before net noncash and other costs shown below 1.94 1.77 9.03By-product credits (0.26) — —Treatment charges 0.11 0.10 —
Unit net cash costs 1.79 1.87 9.03DD&A 0.25 0.23 0.73Metals inventory adjustments — — —Noncash and other costs, net 0.07 0.06 0.17
Total unit costs 2.11 2.16 9.93Other revenue adjustments, primarily for pricing on prior period open sales — — —Gross profit per pound $ 0.85 $ 0.80 $ 1.71
Reconciliation to Amounts ReportedMetals
Production InventoryRevenues and Delivery DD&A Adjustments
Totals presented above $ 4,683 $ 2,865 $ 359 $ 4Treatment charges (30) 120 — —Noncash and other costs, net — 90 — —Other revenue adjustments, primarily for pricing on prior period open sales (5) — — —Eliminations and other 46 49 1 —North America copper mines 4,694 3,124 360 4Other miningc 17,060 11,853 1,269 —Corporate, other & eliminations (3,126) (3,290) 125 —As reported in FCX's consolidated financial statements $ 18,628 $ 11,687 $ 1,754 $ 4
a. Reflects sales of molybdenum produced by certain of the North America copper mines to FCX's molybdenum sales company at market-based pricing.
b. Includes gold and silver product revenues and production costs.c. Represents the combined total for FCX's other mining operations as presented in the supplemental schedule, "Business Segments,"
beginning on page X.

XVIII
Freeport-McMoRan Inc.PRODUCT REVENUES AND PRODUCTION COSTS (continued)
South America Mining Product Revenues, Production Costs and Unit Net Cash CostsThree Months Ended December 31, 2019(In millions) By-Product Co-Product Method
Method Copper Othera TotalRevenues, excluding adjustments $ 954 $ 954 $ 74 $ 1,028Site production and delivery, before net noncash and other costs shown below 638 596 55 651By-product credits (61) — — —Treatment charges 60 60 — 60Royalty on metals 2 2 — 2
Net cash costs 639 658 55 713DD&A 132 122 10 132Noncash and other costs, net 26 24 2 26
Total costs 797 804 67 871Other revenue adjustments, primarily for pricing on prior period open sales 23 23 — 23Gross profit $ 180 $ 173 $ 7 $ 180
Copper sales (millions of recoverable pounds) 345 345
Gross profit per pound of copper:
Revenues, excluding adjustments $ 2.76 $ 2.76Site production and delivery, before net noncash and other costs shown below 1.85 1.72By-product credits (0.18) —Treatment charges 0.17 0.17Royalty on metals 0.01 0.01
Unit net cash costs 1.85 1.90DD&A 0.38 0.36Noncash and other costs, net 0.08 0.07
Total unit costs 2.31 2.33Other revenue adjustments, primarily for pricing on prior period open sales 0.07 0.07Gross profit per pound $ 0.52 $ 0.50
Reconciliation to Amounts Reported
ProductionRevenues and Delivery DD&A
Totals presented above $ 1,028 $ 651 $ 132Treatment charges (60) — —Royalty on metals (2) — —Noncash and other costs, net — 26 —Other revenue adjustments, primarily for pricing on prior period open sales 23 — —Eliminations and other 1 1 —South America mining 990 678 132Other miningb 3,655 3,010 234Corporate, other & eliminations (734) (758) 25As reported in FCX's consolidated financial statements $ 3,911 $ 2,930 $ 391
a. Includes silver sales of 1.3 million ounces ($18.42 per ounce average realized price). Also reflects sales of molybdenum produced by Cerro Verde to FCX's molybdenum sales company at market-based pricing.
b. Represents the combined total for FCX's other mining operations as presented in the supplemental schedule, "Business Segments," beginning on page X.

XIX
Freeport-McMoRan Inc.PRODUCT REVENUES AND PRODUCTION COSTS (continued)
South America Mining Product Revenues, Production Costs and Unit Net Cash CostsThree Months Ended December 31, 2018(In millions) By-Product Co-Product Method
Method Copper Othera TotalRevenues, excluding adjustments $ 889 $ 889 $ 97 $ 986Site production and delivery, before net noncash and other costs shown below 576 525 63 588By-product credits (85) — — —Treatment charges 61 61 — 61Royalty on metals 2 2 — 2
Net cash costs 554 588 63 651DD&A 144 130 14 144Noncash and other costs, net 33
b30 3 33
Total costs 731 748 80 828Other revenue adjustments, primarily for pricing on prior period open sales (14) (14) — (14)Gross profit $ 144 $ 127 $ 17 $ 144
Copper sales (millions of recoverable pounds) 325 325
Gross profit per pound of copper:
Revenues, excluding adjustments $ 2.74 $ 2.74Site production and delivery, before net noncash and other costs shown below 1.77 1.61By-product credits (0.26) —Treatment charges 0.19 0.19Royalty on metals 0.01 0.01
Unit net cash costs 1.71 1.81DD&A 0.44 0.40Noncash and other costs, net 0.10
b0.09
Total unit costs 2.25 2.30Other revenue adjustments, primarily for pricing on prior period open sales (0.05) (0.05)Gross profit per pound $ 0.44 $ 0.39
Reconciliation to Amounts ReportedProduction
Revenues and Delivery DD&ATotals presented above $ 986 $ 588 $ 144Treatment charges (61) — —Royalty on metals (2) — —Noncash and other costs, net — 33 —Other revenue adjustments, primarily for pricing on prior period open sales (14) — —Eliminations and other (1) (1) —South America mining 908 620 144Other miningc 3,406 2,941 187Corporate, other & eliminations (630) (664) 72As reported in FCX's consolidated financial statements $ 3,684 $ 2,897 $ 403
a. Includes silver sales of 1.3 million ounces ($13.59 per ounce average realized price). Also reflects sales of molybdenum produced by Cerro Verde to FCX's molybdenum sales company at market-based pricing.
b. Includes charges of $14 million ($0.04 per pound of copper) at Cerro Verde associated with disputed royalties for prior years.c. Represents the combined total for FCX's other mining operations as presented in the supplemental schedule, "Business Segments,"
beginning on page X.

XX
Freeport-McMoRan Inc.PRODUCT REVENUES AND PRODUCTION COSTS (continued)
South America Mining Product Revenues, Production Costs and Unit Net Cash CostsYear Ended December 31, 2019(In millions) By-Product Co-Product Method
Method Copper Othera TotalRevenues, excluding adjustments $ 3,213 $ 3,213 $ 358 $ 3,571Site production and delivery, before net noncash and other costs shown below 2,185 1,991 245 2,236By-product credits (307) — — —Treatment charges 212 212 — 212Royalty on metals 7 6 1 7
Net cash costs 2,097 2,209 246 2,455DD&A 474 427 47 474Metals inventory adjustments 2 2 — 2Noncash and other costs, net 94 90 4 94
Total costs 2,667 2,728 297 3,025Other revenue adjustments, primarily for pricing on prior period open sales 37 37 — 37Gross profit $ 583 $ 522 $ 61 $ 583
Copper sales (millions of recoverable pounds) 1,183 1,183
Gross profit per pound of copper:
Revenues, excluding adjustments $ 2.71 $ 2.71Site production and delivery, before net noncash and other costs shown below 1.85 1.68By-product credits (0.27) —Treatment charges 0.18 0.18Royalty on metals 0.01 0.01
Unit net cash costs 1.77 1.87DD&A 0.40 0.36Metals inventory adjustments — —Noncash and other costs, net 0.08 0.07
Total unit costs 2.25 2.30Other revenue adjustments, primarily for pricing on prior period open sales 0.03 0.03Gross profit per pound $ 0.49 $ 0.44
Reconciliation to Amounts Reported MetalsProduction Inventory
Revenues and Delivery DD&A AdjustmentsTotals presented above $ 3,571 $ 2,236 $ 474 $ 2Treatment charges (212) — — —Royalty on metals (7) — — —Noncash and other costs, net — 94 — —Other revenue adjustments, primarily for pricing on prior period open sales 37 — — —Eliminations and other (1) (4) — —South America mining 3,388 2,326 474 2Other miningb 14,052 12,119 854 85Corporate, other & eliminations (3,038) (2,931) 84 92As reported in FCX's consolidated financial statements $ 14,402 $ 11,514 $ 1,412 $ 179
a. Includes silver sales of 4.7 million ounces ($16.57 per ounce average realized price). Also reflects sales of molybdenum produced by Cerro Verde to FCX's molybdenum sales company at market-based pricing.
b. Represents the combined total for FCX's other mining operations as presented in the supplemental schedule, "Business Segments," beginning on page X.
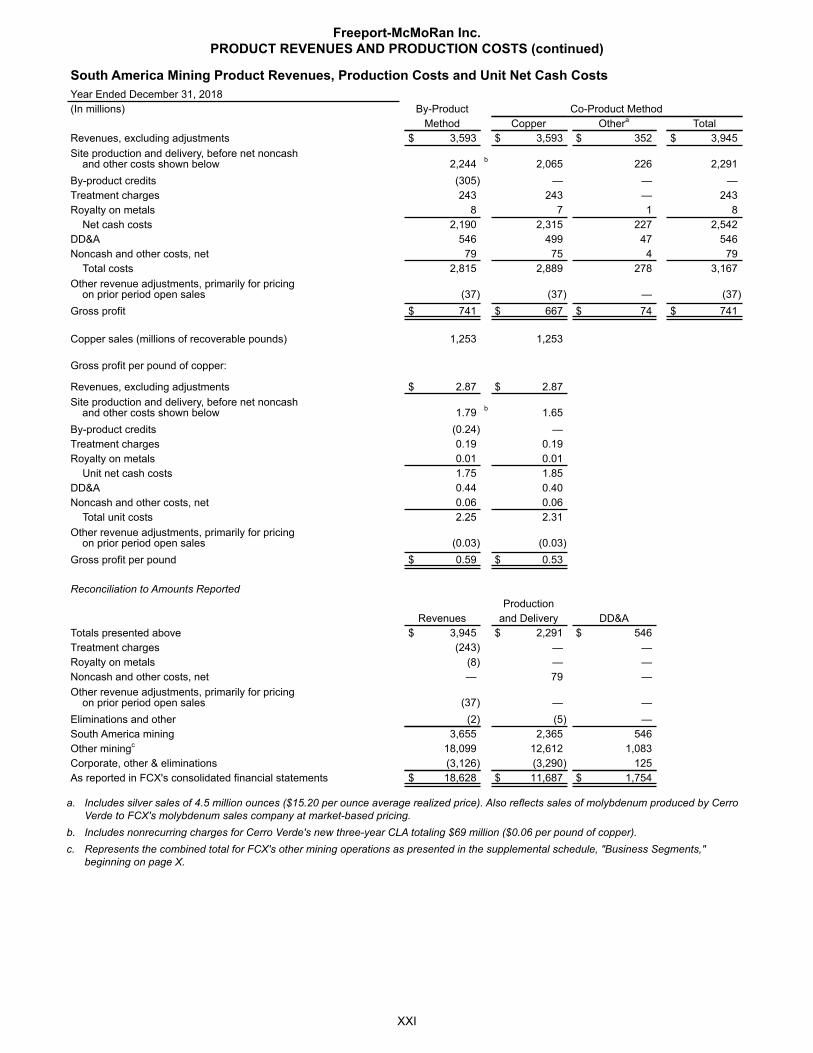
XXI
Freeport-McMoRan Inc.PRODUCT REVENUES AND PRODUCTION COSTS (continued)
South America Mining Product Revenues, Production Costs and Unit Net Cash CostsYear Ended December 31, 2018(In millions) By-Product Co-Product Method
Method Copper Othera TotalRevenues, excluding adjustments $ 3,593 $ 3,593 $ 352 $ 3,945Site production and delivery, before net noncash and other costs shown below 2,244 b 2,065 226 2,291By-product credits (305) — — —Treatment charges 243 243 — 243Royalty on metals 8 7 1 8
Net cash costs 2,190 2,315 227 2,542DD&A 546 499 47 546Noncash and other costs, net 79 75 4 79
Total costs 2,815 2,889 278 3,167Other revenue adjustments, primarily for pricing on prior period open sales (37) (37) — (37)Gross profit $ 741 $ 667 $ 74 $ 741
Copper sales (millions of recoverable pounds) 1,253 1,253
Gross profit per pound of copper:
Revenues, excluding adjustments $ 2.87 $ 2.87Site production and delivery, before net noncash and other costs shown below 1.79 b 1.65By-product credits (0.24) —Treatment charges 0.19 0.19Royalty on metals 0.01 0.01
Unit net cash costs 1.75 1.85DD&A 0.44 0.40Noncash and other costs, net 0.06 0.06
Total unit costs 2.25 2.31Other revenue adjustments, primarily for pricing on prior period open sales (0.03) (0.03)Gross profit per pound $ 0.59 $ 0.53
Reconciliation to Amounts ReportedProduction
Revenues and Delivery DD&ATotals presented above $ 3,945 $ 2,291 $ 546Treatment charges (243) — —Royalty on metals (8) — —Noncash and other costs, net — 79 —Other revenue adjustments, primarily for pricing on prior period open sales (37) — —Eliminations and other (2) (5) —South America mining 3,655 2,365 546Other miningc 18,099 12,612 1,083Corporate, other & eliminations (3,126) (3,290) 125As reported in FCX's consolidated financial statements $ 18,628 $ 11,687 $ 1,754
a. Includes silver sales of 4.5 million ounces ($15.20 per ounce average realized price). Also reflects sales of molybdenum produced by Cerro Verde to FCX's molybdenum sales company at market-based pricing.
b. Includes nonrecurring charges for Cerro Verde's new three-year CLA totaling $69 million ($0.06 per pound of copper).c. Represents the combined total for FCX's other mining operations as presented in the supplemental schedule, "Business Segments,"
beginning on page X.

XXII
Freeport-McMoRan Inc.PRODUCT REVENUES AND PRODUCTION COSTS (continued)
Indonesia Mining Product Revenues, Production Costs and Unit Net Cash CostsThree Months Ended December 31, 2019(In millions) By-Product Co-Product Method
Method Copper Gold Silvera TotalRevenues, excluding adjustments $ 556 $ 556 $ 468 $ 14 $ 1,038Site production and delivery, before net noncash and other costs shown below 545 292 246 7 545Gold and silver credits (482) — — — —Treatment charges 46 25 20 1 46Export duties 21 11 10 — 21Royalty on metals 39 18 21 — 39
Net cash costs 169 346 297 8 651DD&A 125 67 56 2 125Metals inventory adjustments 5 5 — — 5Noncash and other costs, net 6 1 5 — 6
Total costs 305 419 358 10 787Other revenue adjustments, primarily for pricing on prior period open sales 6 6 — — 6PT Smelting intercompany profit 5 3 2 — 5Gross profit $ 262 $ 146 $ 112 $ 4 $ 262
Copper sales (millions of recoverable pounds) 203 203Gold sales (thousands of recoverable ounces) 314
Gross profit per pound of copper/per ounce of gold:
Revenues, excluding adjustments $ 2.75 $ 2.75 $ 1,491Site production and delivery, before net noncash and other costs shown below 2.69 1.44 783Gold and silver credits (2.38) — —Treatment charges 0.23 0.12 66Export duties 0.11 0.06 31Royalty on metals 0.19 0.09 66
Unit net cash costs 0.84 1.71 946DD&A 0.62 0.33 179Metals inventory adjustments 0.03 0.03 —Noncash and other costs, net 0.03 — 16
Total unit costs 1.52 2.07 1,141Other revenue adjustments, primarily for pricing on prior period open sales 0.03 0.03 (1)PT Smelting intercompany profit 0.03 0.01 8Gross profit per pound/ounce $ 1.29 $ 0.72 $ 357
Reconciliation to Amounts Reported MetalsProduction Inventory
Revenues and Delivery DD&A AdjustmentsTotals presented above $ 1,038 $ 545 $ 125 $ 5Treatment charges (46) — — —Export duties (21) — — —Royalty on metals (39) — — —Noncash and other costs, net — 6 — —Other revenue adjustments, primarily for pricing on prior period open sales 6 — — —PT Smelting intercompany profit — (5) — —Indonesia mining 938 546 125 5Other miningb 3,707 3,142 241 40Corporate, other & eliminations (734) (758) 25 34As reported in FCX's consolidated financial statements $ 3,911 $ 2,930 $ 391 $ 79
a. Includes silver sales of 0.8 million ounces ($17.20 per ounce average realized price).b. Represents the combined total for FCX's other mining operations as presented in the supplemental schedule, "Business Segments,"
beginning on page X.

XXIII
Freeport-McMoRan Inc.PRODUCT REVENUES AND PRODUCTION COSTS (continued)
Indonesia Mining Product Revenues, Production Costs and Unit Net Cash CostsThree Months Ended December 31, 2018(In millions) By-Product Co-Product Method
Method Copper Gold Silvera TotalRevenues, excluding adjustments $ 346 $ 346 $ 327 $ 4 $ 677Site production and delivery, before net noncash and other costs shown below 311 159 150 2 311Gold and silver credits (343) — — — —Treatment charges 37 19 18 — 37Export duties 27 14 13 — 27Royalty on metals 26 13 13 — 26
Net cash costs 58 205 194 2 401DD&A 72 36 35 1 72Noncash and other costs, net 216
b111 104 1 216
Total costs 346 352 333 4 689Other revenue adjustments, primarily for pricing on prior period open sales (17) (17) 12 — (5)PT Smelting intercompany profit 67 34 33 — 67Gross profit $ 50 $ 11 $ 39 $ — $ 50
Copper sales (millions of recoverable pounds) 127 127Gold sales (thousands of recoverable ounces) 261
Gross profit per pound of copper/per ounce of gold:
Revenues, excluding adjustments $ 2.72 $ 2.72 $ 1,254Site production and delivery, before net noncash and other costs shown below 2.44 1.25 576Gold and silver credits (2.70) — —Treatment charges 0.29 0.15 68Export duties 0.21 0.11 50Royalty on metals 0.21 0.10 50
Unit net cash costs 0.45 1.61 744DD&A 0.57 0.29 133Noncash and other costs, net 1.70
b0.87 401
Total unit costs 2.72 2.77 1,278Other revenue adjustments, primarily for pricing on prior period open sales (0.14) (0.14) 47PT Smelting intercompany profit 0.54 0.28 127Gross profit per pound/ounce $ 0.40 $ 0.09 $ 150
Reconciliation to Amounts ReportedProduction
Revenues and Delivery DD&ATotals presented above $ 677 $ 311 $ 72Treatment charges (37) — —Export duties (27) — —Royalty on metals (26) — —Noncash and other costs, net — 216 —Other revenue adjustments, primarily for pricing on prior period open sales (5) — —PT Smelting intercompany profit — (67) —Indonesia mining 582 460 72Other miningc 3,732 3,101 259Corporate, other & eliminations (630) (664) 72As reported in FCX's consolidated financial statements $ 3,684 $ 2,897 $ 403
a. Includes silver sales of 284 thousand ounces ($14.69 per ounce average realized price).b. Includes net charges of $192 million ($1.51 per pound of copper) primarily associated with the PT-FI divestment transaction, partly offset by
inventory adjustments. c. Represents the combined total for FCX's other mining operations as presented in the supplemental schedule, "Business Segments,"
beginning on page X.

XXIV
Freeport-McMoRan Inc.PRODUCT REVENUES AND PRODUCTION COSTS (continued)
Indonesia Mining Product Revenues, Production Costs and Unit Net Cash CostsYear Ended December 31, 2019(In millions) By-Product Co-Product Method
Method Copper Gold Silvera TotalRevenues, excluding adjustments $ 1,814 $ 1,814 $ 1,378 $ 40 $ 3,232Site production and delivery, before net noncash and other costs shown below 1,938 1,088 826 24 1,938Gold and silver credits (1,419) — — — —Treatment charges 171 96 73 2 171Export duties 56 31 24 1 56Royalty on metals 107 58 48 1 107
Net cash costs 853 1,273 971 28 2,272DD&A 406 228 173 5 406Metals inventory adjustments 5 5 — — 5Noncash and other costs, net 246
b136 107 3 246
Total costs 1,510 1,642 1,251 36 2,929Other revenue adjustments, primarily for pricing on prior period open sales 18 18 1 — 19PT Smelting intercompany loss (17) (10) (7) — (17)Gross profit $ 305 $ 180 $ 121 $ 4 $ 305
Copper sales (millions of recoverable pounds) 667 667Gold sales (thousands of recoverable ounces) 973
Gross profit per pound of copper/per ounce of gold:
Revenues, excluding adjustments $ 2.72 $ 2.72 $ 1,416Site production and delivery, before net noncash and other costs shown below 2.91 1.63 849Gold and silver credits (2.13) — —Treatment charges 0.26 0.14 75Export duties 0.08 0.05 25Royalty on metals 0.16 0.09 49
Unit net cash costs 1.28 1.91 998DD&A 0.61 0.34 178Metals inventory adjustments 0.01 0.01 —Noncash and other costs, net 0.37
b0.20 110
Total unit costs 2.27 2.46 1,286Other revenue adjustments, primarily for pricing on prior period open sales 0.03 0.03 2PT Smelting intercompany loss (0.02) (0.02) (8)Gross profit per pound/ounce $ 0.46 $ 0.27 $ 124
Reconciliation to Amounts Reported MetalsProduction Inventory
Revenues and Delivery DD&A AdjustmentsTotals presented above $ 3,232 $ 1,938 $ 406 $ 5Treatment charges (171) — — —Export duties (56) — — —Royalty on metals (107) — — —Noncash and other costs, net (146) 100 — —Other revenue adjustments, primarily for pricing on prior period open sales 19 — — —PT Smelting intercompany loss — 17 — —Indonesia mining 2,771 2,055 406 5Other miningc 14,669 12,390 922 82Corporate, other & eliminations (3,038) (2,931) 84 92As reported in FCX's consolidated financial statements $ 14,402 $ 11,514 $ 1,412 $ 179
a. Includes silver sales of 2.5 million ounces ($16.15 per ounce average realized price).b. Includes charges totaling $166 million ($0.25 per pound of copper) primarily associated with an unfavorable Indonesia Supreme Court ruling
related to certain disputed PT-FI export duties. Also includes charges totaling $28 million ($0.04 per pound of copper) associated with adjustments to the settlement of the historical surface water tax disputes with the local regional tax authority in Papua, Indonesia, partly offset by adjustments to prior year treatment charges totaling $20 million ($0.03 per pound of copper).
c. Represents the combined total for FCX's other mining operations as presented in the supplemental schedule, "Business Segments," beginning on page X.

XXV
Freeport-McMoRan Inc.PRODUCT REVENUES AND PRODUCTION COSTS (continued)
Indonesia Mining Product Revenues, Production Costs and Unit Net Cash (Credits) CostsYear Ended December 31, 2018(In millions) By-Product Co-Product Method
Method Copper Gold Silvera TotalRevenues, excluding adjustments $ 3,264 $ 3,264 $ 2,967 $ 57 $ 6,288Site production and delivery, before net noncash and other costs shown below 1,678 871 792 15 1,678Gold and silver credits (3,041) — — — —Treatment charges 294 153 139 2 294Export duties 180 93 85 2 180Royalty on metals 238 122 114 2 238
Net cash (credits) costs (651) 1,239 1,130 21 2,390DD&A 606 314 286 6 606Noncash and other costs, net 242
b126 114 2 242
Total costs 197 1,679 1,530 29 3,238Other revenue adjustments, primarily for pricing on prior period open sales (34) (34) 17 — (17)PT Smelting intercompany profit 56 29 27 — 56Gross profit $ 3,089 $ 1,580 $ 1,481 $ 28 $ 3,089
Copper sales (millions of recoverable pounds) 1,130 1,130Gold sales (thousands of recoverable ounces) 2,366
Gross profit per pound of copper/per ounce of gold:
Revenues, excluding adjustments $ 2.89 $ 2.89 $ 1,254Site production and delivery, before net noncash and other costs shown below 1.48 0.77 335Gold and silver credits (2.69) — —Treatment charges 0.26 0.14 59Export duties 0.16 0.08 36Royalty on metals 0.21 0.11 48
Unit net cash (credits) costs (0.58) 1.10 478DD&A 0.54 0.28 121Noncash and other costs, net 0.21
b0.11 48
Total unit costs 0.17 1.49 647Other revenue adjustments, primarily for pricing on prior period open sales (0.03) (0.03) 7PT Smelting intercompany profit 0.04 0.03 12Gross profit per pound/ounce $ 2.73 $ 1.40 $ 626
Reconciliation to Amounts ReportedProduction
Revenues and Delivery DD&ATotals presented above $ 6,288 $ 1,678 $ 606Treatment charges (294) — —Export duties (180) — —Royalty on metals (238) — —Noncash and other costs, net — 242 —Other revenue adjustments, primarily for pricing on prior period open sales (17) — —PT Smelting intercompany profit — (56) —Indonesia mining 5,559 1,864 606Other miningc 16,195 13,113 1,023Corporate, other & eliminations (3,126) (3,290) 125As reported in FCX's consolidated financial statements $ 18,628 $ 11,687 $ 1,754
a. Includes silver sales of 3.8 million ounces ($15.24 per ounce average realized price).b. Includes net charges of $223 million ($0.20 per pound of copper) primarily associated with the PT-FI divestment transaction, partly offset by
an inventory adjustment. c. Represents the combined total for FCX's other mining operations as presented in the supplemental schedule, "Business Segments,"
beginning on page X.

XXVI
Freeport-McMoRan Inc.PRODUCT REVENUES AND PRODUCTION COSTS (continued)
Molybdenum Mines Product Revenues, Production Costs and Unit Net Cash Costs
Three Months Ended December 31,(In millions) 2019 2018
Revenues, excluding adjustmentsa $ 58 $ 110Site production and delivery, before net noncash and other costs shown below 64 73Treatment charges and other 4 7
Net cash costs 68 80DD&A 12 19Metals inventory adjustments 49 —Noncash and other costs, net 1 2
Total costs 130 101Gross (loss) profit $ (72) $ 9
Molybdenum sales (millions of recoverable pounds)a 5 9
Gross (loss) profit per pound of molybdenum:
Revenues, excluding adjustmentsa $ 12.03 $ 12.52Site production and delivery, before net noncash and other costs shown below 13.33 8.32Treatment charges and other 0.87 0.84
Unit net cash costs 14.20 9.16DD&A 2.42 2.16Metals inventory adjustments 10.04 —Noncash and other costs, net 0.30 0.17
Total unit costs 26.96 11.49Gross (loss) profit per pound $ (14.93) $ 1.03
Reconciliation to Amounts ReportedMetals
Production InventoryThree Months Ended December 31, 2019 Revenues and Delivery DD&A AdjustmentsTotals presented above $ 58 $ 64 $ 12 $ 49Treatment charges and other (4) — — —Noncash and other costs, net — 1 — —Molybdenum mines 54 65 12 49Other miningb 4,591 3,623 354 (4)Corporate, other & eliminations (734) (758) 25 34As reported in FCX's consolidated financial statements $ 3,911 $ 2,930 $ 391 $ 79
Three Months Ended December 31, 2018Totals presented above $ 110 $ 73 $ 19 $ —Treatment charges and other (7) — — —Noncash and other costs, net — 2 — —Molybdenum mines 103 75 19 —Other miningb 4,211 3,486 312 2Corporate, other & eliminations (630) (664) 72 —As reported in FCX's consolidated financial statements $ 3,684 $ 2,897 $ 403 $ 2
a. Reflects sales of the Molybdenum mines' production to FCX's molybdenum sales company at market-based pricing. On a consolidated basis, realizations are based on the actual contract terms for sales to third parties; as a result, FCX's consolidated average realized price per pound of molybdenum will differ from the amounts reported in this table.
b. Represents the combined total for FCX's other mining operations as presented in the supplemental schedule, "Business Segments," beginning on page X. Also includes amounts associated with FCX's molybdenum sales company, which includes sales of molybdenum produced by the Molybdenum mines and by certain of the North America and South America copper mines.

XXVII
Freeport-McMoRan Inc.PRODUCT REVENUES AND PRODUCTION COSTS (continued)
Molybdenum Mines Product Revenues, Production Costs and Unit Net Cash Costs
Years Ended December 31,(In millions) 2019 2018
Revenues, excluding adjustmentsa $ 369 $ 440Site production and delivery, before net noncash and other costs shown below 293 282Treatment charges and other 25 30
Net cash costs 318 312DD&A 62 79Metals inventory adjustments 50 —Noncash and other costs, net 6 7
Total costs 436 398Gross (loss) profit $ (67) $ 42
Molybdenum sales (millions of recoverable pounds)a 29 35
Gross (loss) profit per pound of molybdenum:
Revenues, excluding adjustmentsa $ 12.51 $ 12.36Site production and delivery, before net noncash and other costs shown below 9.95 7.92Treatment charges and other 0.85 0.85
Unit net cash costs 10.80 8.77DD&A 2.11 2.21Metals inventory adjustments 1.69 —Noncash and other costs, net 0.20 0.19
Total unit costs 14.80 11.17Gross (loss) profit per pound $ (2.29) $ 1.19
Reconciliation to Amounts ReportedMetals
Production InventoryYear Ended December 31, 2019 Revenues and Delivery DD&A AdjustmentsTotals presented above $ 369 $ 293 $ 62 $ 50Treatment charges and other (25) — — —Noncash and other costs, net — 6 — —Molybdenum mines 344 299 62 50Other miningb 17,096 14,146 1,266 37Corporate, other & eliminations (3,038) (2,931) 84 92As reported in FCX's consolidated financial statements $ 14,402 $ 11,514 $ 1,412 $ 179
Year Ended December 31, 2018Totals presented above $ 440 $ 282 $ 79 $ —Treatment charges and other (30) — — —Noncash and other costs, net — 7 — —Molybdenum mines 410 289 79 —Other miningb 21,344 14,688 1,550 4Corporate, other & eliminations (3,126) (3,290) 125 —As reported in FCX's consolidated financial statements $ 18,628 $ 11,687 $ 1,754 $ 4
a. Reflects sales of the Molybdenum mines' production to FCX's molybdenum sales company at market-based pricing. On a consolidated basis, realizations are based on the actual contract terms for sales to third parties; as a result, FCX's consolidated average realized price per pound of molybdenum will differ from the amounts reported in this table.
b. Represents the combined total for FCX's other mining operations as presented in the supplemental schedule, "Business Segments," beginning on page X. Also includes amounts associated with FCX's molybdenum sales company, which includes sales of molybdenum produced by the Molybdenum mines and by certain of the North America and South America copper mines.