
4L_Punys_1_
37
Small Hydropower situation in New Member States and Candidate countries Petras PUNYS Lithuanian Hydropower Association / University of Agriculture SMALL HYDROPOWER WORKSHOP Lausanne, 30 th June – 1 st July 2005
description
http://www.esha.be/fileadmin/esha_files/documents/workshops/Lausanne/4L_Punys_1_.pdf
Transcript of 4L_Punys_1_

Small Hydropower situation in New Member States and Candidate
countries
Petras PUNYS Lithuanian Hydropower Association / University
of Agriculture
SMALL HYDROPOWER WORKSHOPLausanne, 30thJune – 1st July 2005

OVERVIEWBackground
Small Hydropower at first glance: EU –15, EU –10, Accession Countries
Individual countries: EU –10 and Candidate Countries
Conclusions
SMALL HYDROPOWER WORKSHOPLausanne, 30thJune – 1st July 2005

REPORT
“Small Hydropower (SHP) situation in Accession countries”
September 2004
Marketing work group:
ADEME, IT Power, ESHA and Lithuanian Hydropower Association

EU –15: 15 Members of the EU before enlargement in May 2004EU –10: 10 New Member States
Candidate (Accession): 3 Candidate Countries to the EU membership

Activities covered in the project were:
Compilation of a database of key Small Hydropower (SHP) statistics and information in the New EU Member States and Candidate countries
Analysis of SHP statistics, existing potential for SHP, technical and environmental aspects, water and energy industries and service capability

A review of institutional, economic and regulatory issues of the legislation in force relating to SHP,
Forecasting of SHP installed capacities & electricity generation, identification of the preliminary targets of SHP contribution in implementing the EU RES-E Directive,
Comparison of the SHP sectors both in EU-15 and EU-10 and CC

Survey of SHP situation:8 new EU countries (except Cyprus and Malta) + 3
Candidate countries + Croatia (episodically). Reference year: 2002/2003
BlueAGE (Blue Energy for a Green Europe) study (ESHA, SERO, IEFE, 2001)
ESHA data base
International Journal on Hydropower & Dams (2004) , World Energy Council (2004) , EBRD (Black and
Veatch, (2002), IEA (2003) , EREC (2003), Eurostat (2004),WWF (2004)
Information sources of the study

Small Hydropower at first glance:
EU –15,EU –10,
Accession (Candidate) Countries -CC
SHP plants (<10 MW) in operation

Num
ber
of S
HP
Number of Small Hydropower Plants
0
5000
10000
15000
EU-15 EU-10New Accession
13 352
2 776 388
Czech Republic-1302

0
2500
5000
7500
10000
EU-15 EU-10New Accession
SHP
Inst
alle
d C
apac
ity M
W
9 909
822 608
SHP Installed Capacity
Czech Republic -273 MWPoland – 238 MW
Romania - 275 MWTurkey –177 MW

0
0.5
1
1.5
2
EU-15 EU-10 CC
Average SHP plant size
SHP
plan
t siz
e M
W
0.7
0.3
1.6

42.7
2.3
0
1
2
3
4
5
EU-15 EU-10 CC
A SHP plant of installed capacity of 1 MW produces .....GWh/year
Ele
ctri
city
gen
erat
ion
GW
h/ye
ar

SHP age distribution
0
25
50
75
100
EU-15 EU-10 CC
Perc
enta
ge o
f SH
P ag
e %
40 and 59 years old
> 60 years old58%
31%
10%10% 10%
37%

0
0.5
1
1.5
2
EU-15 EU-10New Accession
SHP
cont
ribu
tion
%
1.47
0.67 0.64
SHP Contribution to total electricity generation
Slovenia – 2%

0
5
10
15
EU-15 EU-10New Accession
SHP
cont
ribu
tion
%
SHP Contribution to total Hydropower electricity generation
10.812.8
2.3

0
5
10
15
EU-15 EU-10 CC
SHP in the Renewable Electricity mix (RES-E)
9 11
2.2
SHP
cont
ribu
tion
% %

0
25
50
75
100
EU-15 EU-10 CC
82
34
6
%
Dev
elop
ed s
o fa
r %
Percentage of developed economically feasible potential so far %

Rem
aini
ng p
oten
tial
GW
h/ye
ar
SHP remaining economically feasible potential
0
5000
10000
15000
20000
EU-15 EU-10New Accession
19645
3421
21182
Poland – 1600 GWh/year
Turkey – 19 300 GWh/year

Small- scale water turbine manufacturers
Num
ber
of S
HP
man
ufac
ture
rs
0
20
40
60
80
EU-15 EU-10 CC
70
183

ITEM Direc-
tion EU- 15
EU-10
CC
SHP PLANTS IN OPERATION Number of SHP plants Max 1 <5 <34 Average size of plant Max 1 <2.3 >2.2 % of old SHP plants Min 1 <3 <6
INSTALLED CAPACITY AND ELECTRICITY GENERATION Installed capacity Max 1 <12 <16 Electricity generation by SHP plants Max 1 <15 <28 Electricity generation by a plant of 1 MW Max 1 <1.5 <1.7
SHP POTENTIAL Remaining SHP potential Max 1 <4.4 1.2
SHP IN THE GROSS ELECTRICITY MIX Contribution to gross electricity production % Max 1 <2.2 <2.3 Contribution to hydropower production % Max 1 >1.2 <4.7
SHP IN THE RENEWABLE ELECTRICITY MIX Contribution to RES-E Max 1 >1.2 <4
SHP PROJECTION INTO THE FUTURE Installed capacity by 2010 (rise in % ) Max 1 >1 >1.2 Electricity generation by 2010 (rise in %) Max 1 >1.2 > 1.3
Comparison of SHP sectors (datum: EU-15) 1st 2nd 3rd

Individual countries:
EU –10 and Candidate countries

0.0
0.1
0.2
0.3
0.4
0.5
0.6
0.7
CzechRepublic
Estonia Hungary Latvia Lithuania Poland Slovakia Slovenia Bulgaria Romania Turkey
Gross theoretical potential
Technically feasble potential
Economically feasible potential
Hydropower specific energy (annual energy divided by the area of a country- GWh/year/km2)
Data: The International Journal on Hydropower & Dams .
GW
h/ye
ar/k
m2
Economically feasible
potential
Technically feasible potential
3d
1 st
2nd2nd
2nd

SHP DefinitionP< 10 MW, except:
Estonia – 1 MW,
Latvia -2 MW,
Croatia, Hungary, Poland -5 MW
Turkey – 50 MW
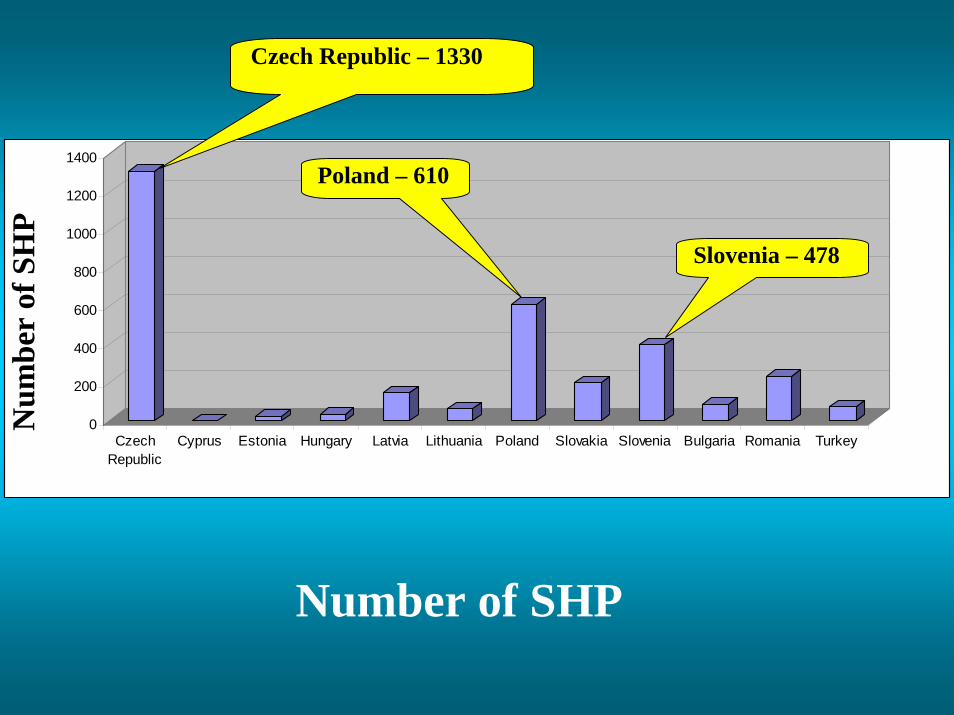
0
200
400
600
800
1000
1200
1400
CzechRepublic
Cyprus Estonia Hungary Latvia Lithuania Poland Slovakia Slovenia Bulgaria Romania Turkey
Number of SHP
Num
ber
of S
HP
Czech Republic – 1330
Poland – 610
Slovenia – 478

0
100
200
300
CzechRepublic
Cyprus Estonia Hungary Latvia Lithuania Poland Slovakia Slovenia Bulgaria Romania Turkey
SHP installed capacity, MW
Inst
alle
d ca
paci
ty M
W
Romania – 278Czech Republic – 275
Low installed capacity

0
20
40
60
80
100
CzechRepublic
Estonia Hungary Latvia Lithuania Poland Slovakia Slovenia Bulgaria Romania Turkey
SHP
by h
ead
%
Low
Medium
High
Percentage of small hydropower plants by head (low head <5m, medium head 5-15m,
high head>15m)
Low head High head
Low head High head
Medium head
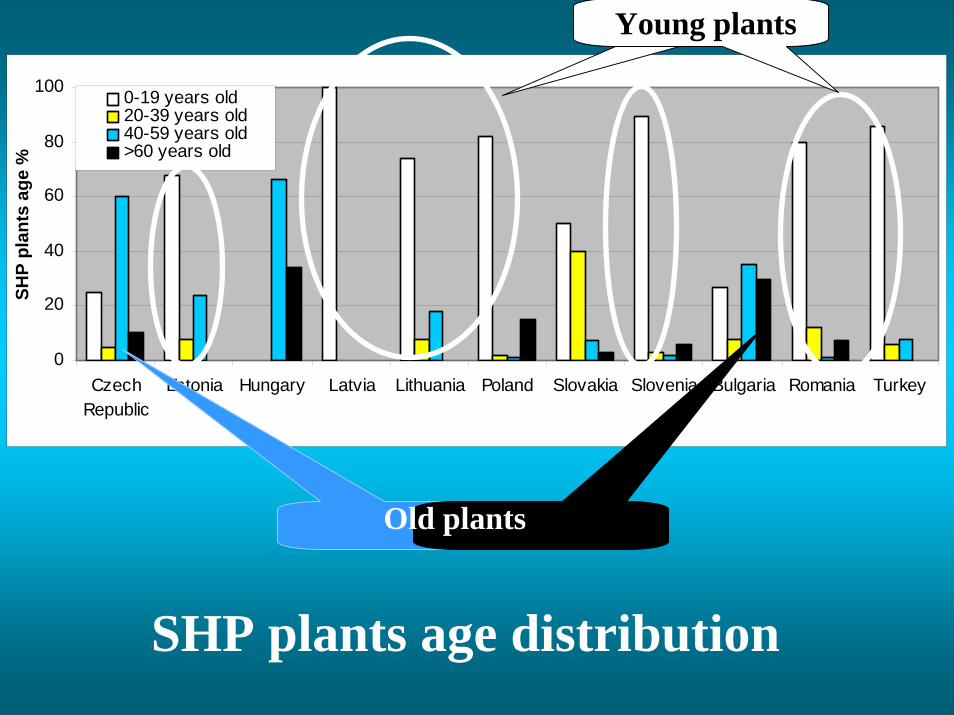
0
20
40
60
80
100
CzechRepublic
Estonia Hungary Latvia Lithuania Poland Slovakia Slovenia Bulgaria Romania Turkey
SHP
plan
ts a
ge %
0-19 years old20-39 years old40-59 years old>60 years old
SHP plants age distribution
Young plants
Old plants

0.0
0.5
1.0
1.5
2.0
CzechRepublic
Cyprus Estonia Hungary Latvia Lithuania Poland Slovakia Slovenia Bulgaria Romania Turkey EU-15Con
trib
utio
n to
gro
ss e
lect
ricity
pro
duct
ion
%
SHP contribution to gross electricity generation
Slovenia – 2%
Czech Republic– ~1%

0
20
40
60
80
100
CzechRepublic
Estonia Hungary Latvia Lithuania Poland Slovakia Slovenia Bulgaria Romania TurkeyRen
ewab
le e
lect
ricity
pro
duct
ion
%Large HydroSmall HydroOther Renew ables
Share of large and small hydro, and other renewable energy sources in the total renewable electricity generation
Other RES-E
Small Hydro

SHP Ownership
0
20
40
60
80
100
CzechRepublic
Estonia Hungary Latvia Lithuania Poland Slovenia Bulgaria Romania Turkey
Priv
atiz
ed %

0
1
2
3
4
5
6
7
8
CzechRepublic
Estonia Hungary Latvia Lithuania Poland Slovakia Slovenia Bulgaria Romania Turkey EU-15
Buy
bac
k ra
te €
cent
s/kW
h
Buy back rates (€cents/kWh)
Average

SHP INDUSTRY STATE
1= no turbine manufacturers, 2= Turbine manufactures exist, but they are not able to cover domestic demand, 3=Turbine manufactures exist; they are able to cover domestic demand with limited export capacities, 4=Turbine manufactures exist; they are able to cover domestic demand with some export capacities, 5= high capability of turbine manufacturing industry)
1
2
3
4
5
CzechRepublic
Estonia Hungary Latvia Lithuania Poland Slovakia Slovenia Bulgaria Romania Turkey
SHP
turb
ine
man
ufac
turi
ng
indu
stry
cap
abili
ties
Czech Republic & Slovenia

1
2
3
4
5
CzechRepub lic
Estonia Hungary Latvia Lithuania Po land Slo vakia Slovenia Bulgaria Romania Turkey
Deg
ree
of g
ravi
ty
Visual impact
Fishery
Water regulation
Competion w ith other uses
Other kinds of resistance
Resistances to SHP development (1-no impact, 5- severe impact)
Visual impactFishery

Forecasted SHP installed capacity (MW) by 2010 and 2015
0
100
200
300
400
CzechRepublic
Estonia Hungary Latvia Lithuania Poland Slovakia Slovenia Bulgaria Romania Turkey
Fore
cast
ed in
stal
led
capa
city
M
W
2010
2015

Forecasted SHP electricity generation (GWh/year) by 2010 and 2015
0
400
800
1200
1600
CzechRepublic
Estonia Hungary Latvia Lithuania Poland Slovakia Slovenia Bulgaria Romania Turkey
Fore
cast
ed g
ener
atio
n G
Wh/
year
2010
2015

Only general fragments of SHP situation basically related to the SHP statistics in the New
Member States and Accession countries are outlined here. More detailed information on SHP in each country is given in its profile.
The report is available at ESHA Website.
http://www.esha.be/Library.htmPlease visit the Network Website:
http://www.esha.be/ukthematic.htm
CONCLUSIONS

Thank you for attention !
SMALL HYDROPOWER WORKSHOPLausanne, 30th June – 1st July 2005


