4C.o.....each of our core operating segments, where we are concentrating resources on businesses in...
58
ANNUAL R EPORT 2004 Year ended March 31, 2004
Transcript of 4C.o.....each of our core operating segments, where we are concentrating resources on businesses in...

ANNUAL REPORT 2004Year ended March 31, 2004
1 Overview of the Mitsui Fudosan Group
2 An Interview with President and CEO Hiromichi Iwasa
8 Segment Information
22 Corporate Governance
23 Management
24 Corporate Social Responsibility
26 Six-Year Summary
27 Management’s Discussion and Analysis
32 Consolidated Financial Statements
54 Domestic and Overseas Network
55 Investor Information
CONTENTS A CAUTION CONCERNING FORWARD-LOOKING STATEMENTSStatements made in this report with respect to the Mitsui FudosanGroup’s current plans, estimates, strategies and beliefs and otherstatements that are not historical facts are forward-lookingstatements about the future performance of the Mitsui FudosanGroup. These statements are based on management’s assumptionsand beliefs in light of the information currently available to it andtherefore readers should not place undue reliance on them. TheMitsui Fudosan Group cautions that a number of importantfactors such as general economic conditions and exchange ratescould cause actual results to differ materially from those discussedin the forward-looking statements.
Millions of yen Thousands of U.S. dollarsexcept per share amounts % Change except per share amounts
2004 2003 2004/2003 2004
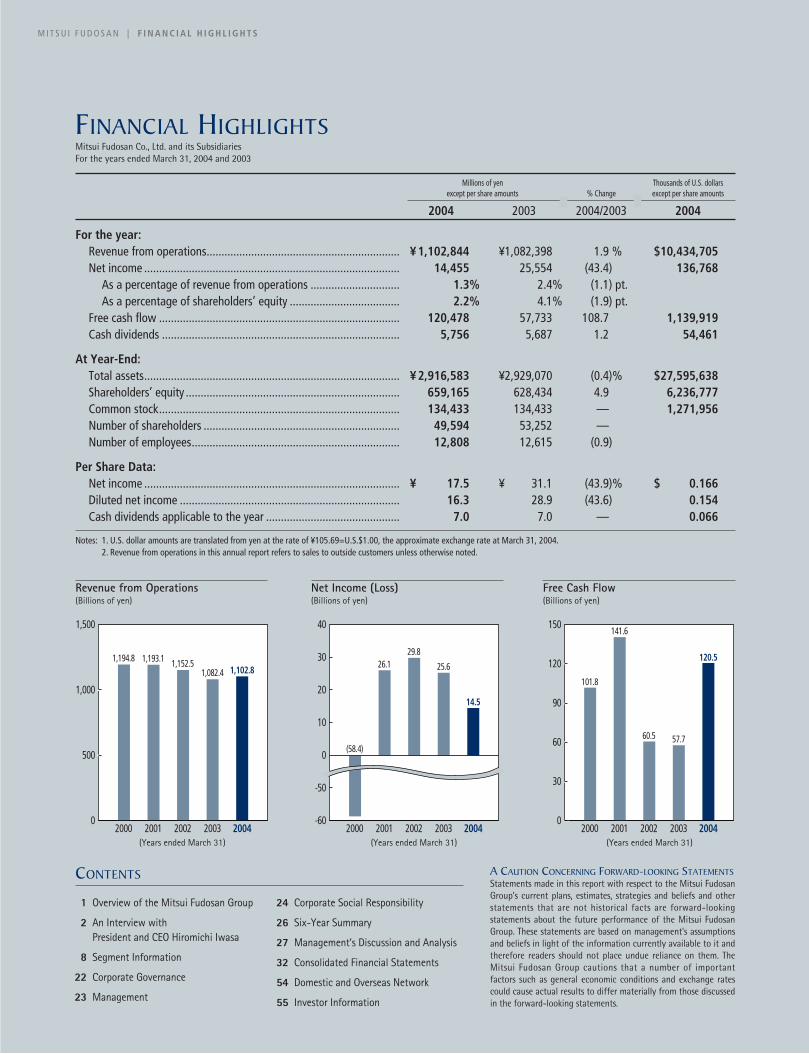
For the year:Revenue from operations................................................................. ¥1,102,844 ¥1,082,398 1.9 % $10,434,705Net income ...................................................................................... 14,455 25,554 (43.4) 136,768
As a percentage of revenue from operations .............................. 1.3% 2.4% (1.1) pt.As a percentage of shareholders’ equity ..................................... 2.2% 4.1% (1.9) pt.
Free cash flow ................................................................................. 120,478 57,733 108.7 1,139,919Cash dividends ................................................................................ 5,756 5,687 1.2 54,461
At Year-End:Total assets...................................................................................... ¥2,916,583 ¥2,929,070 (0.4)% $27,595,638Shareholders’ equity ........................................................................ 659,165 628,434 4.9 6,236,777Common stock................................................................................. 134,433 134,433 — 1,271,956Number of shareholders .................................................................. 49,594 53,252 —Number of employees...................................................................... 12,808 12,615 (0.9)
Per Share Data:Net income ...................................................................................... ¥ 17.5 ¥ 31.1 (43.9)% $ 0.166Diluted net income .......................................................................... 16.3 28.9 (43.6) 0.154Cash dividends applicable to the year ............................................. 7.0 7.0 — 0.066
Notes: 1. U.S. dollar amounts are translated from yen at the rate of ¥105.69=U.S.$1.00, the approximate exchange rate at March 31, 2004.2. Revenue from operations in this annual report refers to sales to outside customers unless otherwise noted.
0
30
60
90
120
150
2000 2001 2002 2003 2004
101.8
141.6
60.5 57.7
120.5
-602000 2001 2002 2003 2004
(58.4)
26.129.8
25.6
14.5
-50
0
10
20
30
40
0
500
1,000
1,500
2000 2001 2002 2003 2004
1,194.8 1,193.1 1,152.51,082.4 1,102.8
Revenue from Operations(Billions of yen)
Net Income (Loss)(Billions of yen)
Free Cash Flow(Billions of yen)
M I T S U I F U D O S A N | F I N A N C I A L H I G H L I G H T S
FINANCIAL HIGHLIGHTSMitsui Fudosan Co., Ltd. and its SubsidiariesFor the years ended March 31, 2004 and 2003
(Years ended March 31) (Years ended March 31) (Years ended March 31)

Leasing
Sales of Housing, OfficeBuildings and Land
Construction
Brokerage, ConsignmentSales and Consulting
Property Management
Sales of Housing Materialsand Merchandise
Facility Operations
Other
OVERVIEW OF THE MITSUI FUDOSAN GROUP
➤ Japan’s largest comprehensive real estate group
➤ Strong cash flow generated by diversified portfolio of properties and businesses
➤ Clear focus on creating value by providing solutions to end users, originators and investors
➤ Constantly developing new business models to remain at the forefront of its changing markets
➤ Emphasizing lower debt levels to improve financial strength
1
Market and Positioning Share of Revenuefrom Operations
Share of Operating Income Business
O V E R V I E W O F M I T S U I F U D O S A N | M I T S U I F U D O S A N
30.1%
31.8%
16.4%
4.9%
7.0%
5.6%
3.4%
0.8%
➤ Over 5 million square meters of total floor space in office buildings and retail facilities, in addition to more than 40 thousand units of rental housing owned and/or managed by Mitsui Fudosan. Superior facilities and outstanding locations, with customer-oriented operations. Occupancy rates in our leasing business remain high.
50.6%
➤ Cumulative sales of over 100 thousand residential units, with sales of about 6,000 units annually, including condominiums and detached housing. Attention to excellent living environments and customer asset value. Now involved in developing a variety of properties for sale to investors.
26.5%
➤ Primarily the construction of 2x4 wood-frame homes through listed subsidiary, Mitsui Home Co., Ltd. Integrated construction and planning capabilities, as well as a reputation for quality. Reorganization has reduced costs.
1.1%
➤ Leading position in the real estate brokerage business and in consignment sales of residential housing. Well-experienced in providing various consulting services to originators and investors using a powerful network of relationships with corporate clients. A strategic business because it is less capital intensive.
11.3%
➤ Well known as a trusted provider of property management services for office buildings, retail facilities and condominiums. Demonstrated success in maintaining and improving the value of properties entrusted by clients. Also a strategic business because it is less capital intensive.
8.7%
➤ Wholesale and retail sales of housing materials, DIY products, flowers and gardening supplies.
0.1%
➤ Operation of approximately 3,500 hotel rooms in 15 hotels throughout Japan, the Halekulani Hotel and the Waikiki Parc Hotel in Hawaii, and 7 golf courses.
—
➤ Financing operations for housing loans, leasing business and other activities. 2.1%
Note: Operating income data includes unallocatable eliminations and corporate. See Note 16, page 51 for additional segment information.

➤ Mission, strategies and goalChallenge Plan 2008 is a long-termmanagement plan announced in May 2003covering the six years from April 2003 toMarch 2009 (fiscal 2003 — fiscal 2008). Itencompasses three core strategies based onour mission of evolving as Japan’s leadingprovider of real estate solutions and services.While maintaining our intense focus on ourcustomers, we will adapt our business modelto changing market realities and improvethe efficiency of Group companycooperation to achieve our objectives. Ourgoal is to generate sustainable earningsgrowth — and shareholder returns.
AN INTERVIEW WITHPRESIDENT AND CEO HIROMICHI IWASA
How did Challenge Plan 2008 create value forstakeholders during the year ended March 31, 2004,the first year of the plan?
Challenge Plan 2008 has already helped MitsuiFudosan generate value for customers,shareholders and other stakeholders despite achallenging operating environment.
We made good progress during the past fiscal year,
the first year of the plan. Consolidated revenue from
operations increased 1.9 percent year-on-year, or
¥20.4 billion, to ¥1,102.8 billion. Revenue increased in
each of our core operating segments, where we are
concentrating resources on businesses in which our
competitive advantage is strongest. Operating income
increased by ¥6.0 billion to ¥109.2 billion, primarily
because of an increase in fee-based income. Net
income decreased to ¥14.5 billion because of
extraordinary losses, including a devaluation of real
property for sale. Despite lower net income, we
maintained dividends at ¥7.0 per share. Hiromichi Iwasa, Member of the Board,
President and Chief Executive Officer
M I T S U I F U D O S A N | A N I N T E R V I E W W I T H P R E S I D E N T A N D C E O H I R O M I C H I I W A S A
2
Evolve as Japan’s leading provider of real estate solutions and services
Customer-focused management
Combined effect
Mission
Strategies
Goal
Business model reform Efficient Group management
Sustainable earnings growth
C H A L L E N G E P L A N 2 0 0 8
A discussion of Mitsui Fudosan's three core businesses of holding, trading and management,performance in the first year of Challenge Plan 2008, and strategies for generating additionalshareholder value.

How were results in Mitsui Fudosan’s three core businesses of holding, trading and management inthe first year of Challenge Plan 2008?
During the past fiscal year, operating income in the holding business decreased. However, weexceeded our operating income projections in the trading and management businesses.
In the holding business, demolition of several major office buildings to make way for reconstruction reduced
earnings. In addition, the large supply of new office space that went on the market in 2003 has affected our
existing buildings, and contributed to the ¥4.9 billion decrease in operating income from the holding business for
the past fiscal year. However, the office building market continues to recover, and we have formulated a package
of measures to accomplish in moving toward our goal of operating income of ¥80.0 billion in this business.
Earnings in the trading business increased slightly. We are implementing incremental changes in its profit
structure and increasing its weighting as an investor-oriented business. We are reshaping and expanding the
trading business to make it a driving force for growth by using our network of end users, investors and
originators.
The management business made dramatic progress during the past fiscal year. The success of the Mitsui
Fudosan Group in delivering services and solutions to end users, investors and originators increased fee income.
The restructuring and consolidation of Group subsidiaries involved in the management business has had a
strongly beneficial effect.
In covering what these three business specifically entail, the status of their respective operatingenvironments, and the Mitsui Fudosan Group’s strategies for each business during the current fiscalyear and beyond, what are your goals for the holding businessholding business, and how will you achieve them?
In the holding business, we expect growth because of the recovery of the office building marketand our project pipeline.
Long-term stable revenues generated from office and retail properties, and asset quality improvement
through replacement, reconstruction and renovation characterize the holding business.
The operating environment for the office building business appears to be improving measurably and returning
to a more normal state. While large-scale buildings put in operation by other companies substantially increased
A N I N T E R V I E W W I T H P R E S I D E N T A N D C E O H I R O M I C H I I W A S A | M I T S U I F U D O S A N
3
➤ Quantitative consolidated targetsWe are targeting operating income of ¥160billion while reducing total assets to¥2,700 billion. Growth in development andmanagement operations will be one key tosuccess. We also intend to consistentlyreduce interest-bearing debt, with a targetof reducing the debt/equity ratio to 1.2times, which will be key to maintaining asolid financial structure.
FY 2008 (Targets)
Revenue from operations ¥1,102.8 billion
Operating income ¥109.2 billion
Operating income margin 9.9%
Operating cash flow ¥141.6 billion
Total assets ¥2,916.6 billion
Interest-bearing debt ¥1,321.5 billion
ROA* 4.1%
Debt/Equity ratio** 2.0
FY 2003
¥1,082.4 billion
¥103.3 billion
9.5%
¥118.5 billion
¥2,929.1 billion
¥1,397.2 billion
3.8%
2.2
FY 2002
* ROA = (Operating income + Non-operating income) / Total assets at fiscal year-end** Debt/Equity ratio = Interest-bearing debt / Shareholders' equity
¥1,300.0 billion
¥160.0 billion
12.3%
¥130.0 billion
¥2,700.0 billion
¥990.0 billion
6.0%
1.2

supply in the Tokyo metropolitan area during the first half of fiscal 2003, vacancies gradually decreased and the
leasing market began to recover from the second half of fiscal 2003. The performance of tenant companies
improved, and we have already begun to see increased demand for space among the more successful companies.
On a parent company basis, our vacancy rate for office buildings in the Tokyo metropolitan area as of March 31,
2004 was 4.4 percent, and we project further improvement by March 2005 based on the reduced amount of floor
space we have to market.
In addition to the start of operation of new buildings, rental revenue at existing buildings is stabilizing. As a
result, we project a recovery in earnings from the second half of the current fiscal year. Moreover, we will
complete a series of projects under Challenge Plan 2008, and our project pipeline supports our favorable outlook.
Mitsui Fudosan has fully leased the approximately 800,000 square meters of new floor space it put into
operation from spring 2002 to the completion of the Nihonbashi 1-Chome Building in January 2004. This
performance indicates that with the base of trust of our broad network of tenant companies we can achieve the
objectives of Challenge Plan 2008. We have also begun fortifying our sales organization for the new large-scale
office buildings that we will be completing.
What is the status of the retail facilities business, a key component of the holding business?
The retail facilities business is a Mitsui Fudosan strength, and we intend to generate substantialgrowth in it.
Since opening the Tokyo Bay LaLaport shopping center in 1981, we have been developing retail facilities in
various locations throughout Japan, and strengthening our retail facility management know-how and our
network of relationships with retail tenant companies. We have also developed outlet malls in six locations, thus
creating a new type of facility configuration that allows tenant companies to raise supply chain efficiency, which
has strengthened our relationships with tenants. In addition, we have developed a variety of facility
configurations with features that suit the communities they serve, including super-regional shopping centers, the
Lifestyle Park series and central business district retail facilities. Over the years, we have developed a wide array of
facilities using a broad range of techniques in working with our network of originators. In particular, we have
used fixed-term leaseholds in aggressively expanding our retail facility business. These sorts of businesses have a
high return on investment, and increase return on assets.
M I T S U I F U D O S A N | A N I N T E R V I E W W I T H P R E S I D E N T A N D C E O H I R O M I C H I I W A S A
4
C H A L L E N G E P L A N 2 0 0 8
Our business model positions us at everystage of the real estate value chain, fromdevelopment to trading, brokerage andmanagement. It allows us to make use ofour comprehensive strengths to both buildestablished operations and captureemerging market opportunities. Thisbusiness model also ensures that we haveaccess to every major group of real estatemarket participants. Our prominent brandwill be a key factor supporting effectiveimplementation of this model.
➤ Mitsui Fudosan’s business model
Business core:Ability to identify needs andstructure real estate solutionsacross customer groups
Strengths:1. Creating value =
Real estate development strength2. Maintaining and enhancing value =
Real estate management strength3. Realizing value =
Trading and brokerage strength
Originators
Investors
Tenants Residents
Consumers
Real estate market
Financial market
End-user market
Large existing customer base
>>>>>>>>>>>>>>>
Real estateholdings solutions
Optimal space andservices in multipleproperty types
Investment opportunitiesand managementservices
Provider of real estatesolutions and services

FY2002 FY2003 FY2008FY2008
Management Business ¥22.1 billion
Trading Business
Holding Business
¥46.5 billion
¥65.0 billion¥80.0 billion
¥31.9 billion
¥40.0 billion
¥60.1 billion
¥32.2 billion
¥28.7 billion
➤ Operating income targets for core businesses
Looking forward, Mitsui Fudosan plans to continue opening facilities that contribute to revenue and earnings
by using our strong network of originators to make proposals for projects such as making effective use of
formerly industrial land. This will enhance our pipeline of large-scale projects.
What does the trtrading businessading business entail, what is the status of the operating environment for thisbusiness, and where is it headed during the current fiscal year and beyond?
Quality properties coupled with expertise and a broad network of relationships will supportgrowth in serving both end users and investors.
The trading business entails capital gains in the near and medium term from sales of developed properties,
including the sale of condominiums and detached houses to individual clients; the development and sale of
office, retail and residential properties to real estate investors; and the sale of assets held in private funds. The
opportunities presented by Japan’s growing real estate investment markets are significant.
In the business of developing residential housing for sale to end users, more than 80,000 units annually have
come onto the condominium market of the Tokyo metropolitan area since 1999. At the same time, the needs of
customers acquiring housing have moved to a higher level and diversified. As a result, the balance among location,
product planning and price has become even more crucial, and will remain central in the future. In this operating
environment, Mitsui Fudosan is emphasizing high quality and profitability with the aim of stably supplying 5,000 to
5,500 condominium units and 800 to 1,000 detached houses annually. Our tasks include reducing sales expenses
and increasing operating margins. We are therefore restructuring our approach to sales for greater efficiency.
The operating environment for the business of developing properties for sale to investors is characterized by
a desire among corporations and financial institutions to scale back assets. Moreover, investors are increasingly
interested in quality properties. Mitsui Fudosan is deploying its operating expertise and network of relationships
to answer these needs. In the investor-oriented trading business, we aim to achieve profitable growth through
quantitative expansion. In the year ended March 31, 2004, we generated earnings from the Park Axis and other
projects, and from other innovative approaches to the real estate investment market.
We project further growth by linking the development and sale of housing to end users and the solidly growing
business of developing properties for sale to investors. Controlling overall segment investment and return will be key
to achieving our objective under Challenge Plan 2008 of operating income of ¥40.0 billion in this business.
A N I N T E R V I E W W I T H P R E S I D E N T A N D C E O H I R O M I C H I I W A S A | M I T S U I F U D O S A N
5

Real Estate Holdings (Office/Retail/Residential)
Accounting Segments
Sales of Housing, Office Buildings and Land
Leasing
Condominiums and Detached Houses
Residential
Car Parking
Brokerage, ConsignmentSales and Consulting Management Business
Trading Business
Holding Business
Property Management 10.8
14.1
32.9
28.7 46.5
109.2 109.2 160.0
OthersOthers (11.6) (11.8) (6.5)
TotalTotal
32.2 40.0
60.1 80.0
FY08(Target)
Challenge Plan 2008 Segments
63.0
FY03
Sublet Properties
Office/Retail/ResidentialProperty for Sale
Office/Retail Sublet before 2001
Sublet after 2002
(Billions of yen) FY03(Billions of yen)
➤ Breakdown of operating income
M I T S U I F U D O S A N | A N I N T E R V I E W W I T H P R E S I D E N T A N D C E O H I R O M I C H I I W A S A
6
C H A L L E N G E P L A N 2 0 0 8
How has Mitsui Fudosan structured its value-up type trading and asset management business andwhat is the outlook for this business?
Flexibly structured deals will generate capital gains and move Mitsui Fudosan smoothly along thevalue chain from flow business to stable fee business.
We invested heavily in our value-up type trading and asset management business during the past fiscal year,
and project that it will contribute to performance in the future. In our value-up type trading business, we add
value to assets and sell them to investors. We aim to provide good investment opportunities to investors and to
enjoy capital gains from the assets. This part of the business model is the so-called flow business. After that,
however, by providing asset management services to the investors, we successively shift our position in the value
chain from the flow business to the stable fee business. This business represents one of the techniques we are
using to implement business model reform under Challenge Plan 2008.
Our information network and ability to provide solutions to originators is the starting point from which we
use our expertise in real estate selection to acquire business opportunities. We create flexibly structured deals that
accommodate the needs of originators and potential investors and the features of particular buildings and parcels
of land. We then add value in numerous ways to the assets acquired from originators to create investment
products with enhanced appeal to investors. Specific examples of the ways we enhance the value of assets include
using our development capabilities not only to create new buildings, but also to renovate buildings and convert
them to new uses, and using our management skills to raise occupancy and streamline administrative costs. Once
investors have acquired the assets we have enhanced, we then provide high-level asset and property management
services that maintain and increase the value of the asset into the future. Expansion in such assets under
management will serve to increase our earnings in the management business.
What does the management businessmanagement business entail, what is the status of the operating environment forthis business, and where is it headed during the current fiscal year and beyond?
The management business is a key component of our drive to generate earnings from ourexpertise in making our business less capital intensive.
The management business entails fee income generated from a full range of management services,
including brokerage, consulting, master leases, project management, and asset and property management. This

A N I N T E R V I E W W I T H P R E S I D E N T A N D C E O H I R O M I C H I I W A S A | M I T S U I F U D O S A N
7
business is professional expertise intensive rather than capital intensive. We aim to generate growth in this
business by increasing originator and investor assets under management. The balance of assets under
management as of March 31, 2004 totaled ¥1.44 trillion. The fee income from assets under management
accounted for approximately ¥10 billion of the ¥28.7 billion in operating income from the management
business. Our target is assets under management totaling ¥3 trillion by the end of March 2009, and we expect
growth in the value-up type trading business to contribute to this increase. We moved to raise efficiency
throughout the Mitsui Fudosan Group during the past fiscal year by implementing a functional reorganization
that addressed the need for an efficient allocation of operating responsibilities among the Group subsidiaries
included in the management business.
The residential housing brokerage services for individuals and the corporate brokerage services of Mitsui Real
Estate Sales Co., Ltd. contributed strongly to the increase in operating income from the management business during
the year ended March 2004. In addition, we expect a significant increase in the contribution from the business of
subleasing office buildings, retail facilities and rental housing, and the car-park leasing business in the future.
Financial integrity and efficient operations will be critical to future success. How is Mitsui Fudosanimproving its financial structure and raising management efficiency to support the interests ofshareholders?
A key step has been further strengthening our sound financial structure, with the goal ofimproving our ability to flexibly structure our overall exposure to risk for maximum return.
Interest-bearing debt totaled ¥1.3 trillion as of March 31, 2004. We have been reducing interest-bearing debt
consistently, and exceeded the targets we set at the beginning of the past fiscal year. We also increased
shareholders’ equity and reduced our debt-to-equity ratio to 2.0 times as well.
Japan’s economy is recovering, and we are continuing to implement the initiatives contained in Challenge
Plan 2008 to further strengthen our financial structure so that we can continue to aggressively pursue our many
business opportunities while insulating the Company against interest rate increases.
On the other hand, off-balance-sheet liabilities have increased. The active real estate investment market has
created a substantial increase in investment opportunities for Mitsui Fudosan. We have used special purpose
companies (SPCs) to introduce capital from investors. Our net equity investments in SPCs on the balance sheet as
of March 31, 2004 totaled approximately ¥105 billion. We have complemented equity investment with loans to
cover the property acquisition costs of investment vehicles, which resulted in off-balance-sheet liabilities totaling
approximately ¥215 billion. While this debt is not on Mitsui Fudosan’s balance sheet, we are monitoring it in an
investment management approach that combines off-balance-sheet liabilities with on-balance-sheet equity
investment. We will also continue to appropriately disclose off-balance-sheet liabilities in the future.
What are Mitsui Fudosan’s main initiatives and objectives for the current fiscal year?
We will further accelerate execution of the three core strategies of Challenge Plan 2008.While new businesses such as the trading and management business for the real estate investors’ market
generated solid growth and contributed to earnings, our existing office building and condominium businesses
require further effort. Challenge Plan 2008 encompasses three core strategies: customer-focused management,
business model reform and efficient Group management. Our strategic focus is not limited to new growth
opportunities, but also includes rapidly re-engineering existing businesses.
Our objective is to generate stable returns for shareholders as we further associate the Mitsui Fudosan brand
with customer and client satisfaction, innovation and quality. I would like to thank our shareholders and other
stakeholders for their support. We look forward to continuing to earn that support as we evolve as a leading
provider of real estate solutions and services.

M I T S U I F U D O S A N | S E G M E N T I N F O R M A T I O N
8
LEASING
Nihonbashi 1-Chome Building(Completed in January 2004 / 98,063m2)
An InvigoratingAtmosphere…The Nihonbashi 1-Chome Building, astriking multipurpose office and retailfacility developed with strong partners, is anew landmark completed in January 2004.Featuring a plaza and atrium to invigorateand refresh occupants, the curved glassfaçade also enhances the use of naturallight to provide a comfortable workingenvironment. Office tenants appreciate theincorporation of the latest security,earthquake resistance and informationtechnologies.
…A ReinvigoratingInfluenceCOREDO Nihonbashi, the retail facility atthe Nihonbashi 1-Chome Building, hasbecome a popular shopping destination thathas revitalized its environs. A redevelopmenton a site that had been occupied by anaging department store, the facilityconnects Nihonbashi’s long history as ashopping and cultural district with a stylishpresent. COREDO Nihonbashi’s 33restaurants, boutiques and other stores addappeal to the building — and vitality to theshopping experience.
The Mitsui Fudosan brand encompasses more than fivemillion square meters of total floor space undermanagement in office buildings and retail facilities as wellas more than 40,000 units of rental housing, offeringsuperior environments for living, working and shopping.

LE
AS
ING
S E G M E N T I N F O R M A T I O N | M I T S U I F U D O S A N
9
ResultsLeasing segment revenue for the fiscal yearended March 31, 2004 increased 0.8 percentyear-on-year, or ¥2.7 billion, to ¥332.4 billion.New office buildings and properties in operationfor a full year contributed to revenue growth,supported by the Company’s strengths inmarketing. The car-park leasing businessoperated by a subsidiary also secured strongorders and increased revenue. Demolition ofseveral major existing office buildings to makeway for reconstruction, however, restrainedgrowth in revenue, as did decreased revenuefrom existing buildings. Segment operatingincome decreased 5.3 percent year-on-year, or¥3.5 billion, to ¥63.0 billion. Factors in thedecline included the decrease in revenueassociated with the reconstruction projectsunder way during the fiscal year, and an increasein floor space that was temporarily unleased dueto tenant changeover.
On a consolidated basis including overseasoperations, the vacancy rate for office buildingsand retail facilities was 5.0 percent as of March31, 2004, compared to 6.0 percent on March 31,2003 and September 30, 2003. The vacancy rateof Tokyo metropolitan area office buildings on aparent basis as of March 31, 2004 improved to4.4 percent from 5.4 percent a year earlier and5.8 percent in September 2003.
Office BuildingsMitsui Fudosan centers its office buildingbusiness on the concept of placing “workersfirst.” Office buildings serve as the base ofoperations for corporate activities. Buildings thatare designed with a focus on the people whowork in them contribute to tenant operatingefficiency and effective worker relationships.
The Company’s office buildings are located ina variety of areas according to multiple core andmultiple area strategies. Throughout Japan’surban areas, and especially in Tokyo’s centralbusiness district, we operate approximately 300buildings that are occupied by more than 3,000corporate tenants. Office building needs havemultiplied in accordance with the globalization,diversification and advancement of business. TheMitsui Fudosan Group meets these needs byoffering a wide variety of options ranging fromlarge corporate head office buildings to smalloffice space.
Performance benefited from the full-yearcontribution of the Garden Air Tower (Chiyoda-ku, Tokyo), which was completed in February2003, and the Jimbocho Mitsui Building(Chiyoda-ku, Tokyo), completed in March 2003as a part of urban redevelopment in theculturally rich Jimbocho area. Through these andother projects, we create office buildings withenduring value that support both theirneighboring communities and tenants.
Newly completed projects also contributed toresults. Roppongi T-Cube (Minato-ku, Tokyo), amixed-use residential and office property, wasfully leased. Operation of the Nihonbashi 1-Chome Building (Chuo-ku, Tokyo) began inJanuary 2004. This uniquely designed officebuilding with sophisticated technologies includesa retail facility, COREDO Nihonbashi.
Mitsui Fudosan moved forward with newprojects under construction, such as theToranomon Kotohira Tower (Minato-ku, Tokyo).We also made steady progress in the Ginza 8-Chome project (tentative name; Chuo-ku,Tokyo), which is a reconstruction of thepredecessor Ginza Mitsui Building. Moreover,the former Mitsui-East Number 3 Building isunder reconstruction in the Muromachi MitsuiShinkan Building project (tentative name; Chuo-ku, Tokyo), a cutting-edge high-rise buildingcomplex. The project is designed to complementthe historical ambience of the Mitsui MainBuilding, and to provide the latest in officefunctions to satisfy the needs of globalcorporations. The Muromachi Mitsui ShinkanBuilding will also include a Mandarin OrientalHotel and will enhance the new prosperity ofthe area.
Retail FacilitiesMitsui Fudosan operates approximately 50 retailfacilities throughout Japan and maintainsrelationships with over 1,000 client companiesand a wide range of originators, includingregional public entities. Mitsui Fudosanfrequently works with originators using fixed-term leaseholds, which serve to limit its initialcapital outlays for developing retail facilities andincrease its return on assets (ROA). Since the1981 opening of Tokyo-Bay LaLaport(Funabashi-shi, Chiba Prefecture), the first large-scale suburban shopping center in Japan, MitsuiFudosan has created exciting retail space that is
0
100
200
300
400
2000 2001 2002 2003 2004
325.6 329.8 331.5 329.7 332.4
Revenue from Operations(Billions of yen)
0
2
4
6
8
Mar. 02 Sep. 02 Mar. 03 Sep. 03 Mar. 04
4.1
5.2
6.0 6.0
5.0
Vacancy Rate for Office Buildingsand Retail Facilities (%)
0
50
25
75
100
2000 2001 2002 2003 2004
61.1
68.671.7
66.663.0
Operating Income(Billions of yen)
(Years ended March 31)
(Years ended March 31)

M I T S U I F U D O S A N | S E G M E N T I N F O R M A T I O N
1 0
LALA Garden Tsukuba(Completed in March 2004 / 22,218m2)
New Concepts inShoppingOpened in March 2004, LALA GardenTsukuba embodies the Mitsui Lifestyle Parkconcept of a shopping center encompassingsmall and medium-sized retail spaces thatserves as a place for the community togather and communicate. Designed for 62tenants, the facility creates a city center forTsukuba, a planned city that is home tomany research facilities. Families appreciatethe inviting atmosphere and convenientaccess to everyday goods and specialluxuries in one location.
Roppongi T-Cube(Completed in September 2003 / 61,807m2)
A Modern, MultipurposeOffice ComplexA joint development between SamsungJapan Corporation and Mitsui Fudosan ,Roppongi T-Cube was completed inSeptember 2003. This multipurpose complexincorporates serviced apartments and retailfacilities around a core of leased officespace. Roppongi T-Cube is located in theheart of the vibrant Roppongi district,which is gaining attention as a newbusiness center.
Muromachi Mitsui Shinkan Building(tentative name) and Mitsui Main Building(Muromachi Mitsui Shinkan Building: Scheduled forcompletion in September 2005 / 133,855m2. MitsuiMain Building: Completed in June 1929 / 36,225m2)
Combining the Old and the NewThis project juxtaposes the modern architectureof the Muromachi Mitsui Shinkan Building withthe Mitsui Main Building, a RegisteredImportant Cultural Property in Nihonbashi, acenter of history, culture and industry.

LE
AS
ING
S E G M E N T I N F O R M A T I O N | M I T S U I F U D O S A N
1 1
LaLa Terrace Minamisenju(Completed in April 2004 / 13,385m2)
Opened in April 2004 as a Mitsui LifestylePark, LaLa Terrace Minamisenju is an openmall on a human scale with 31 tenants.
Stellar Town(Completed in April 2004 / 141,621m2)
One of the largest shopping centers inSaitama Prefecture, Stellar Town openedin April 2004 to meet the needs of itsresidential area with style.
Years ended March 31 2004 2003Floor space Revenue Floor space Revenue
(m2) (Millions of yen) (m2) (Millions of yen)
Office buildings and retail facilities:Owned ..................................................................................... 1,877,654 1,839,819Managed.................................................................................. 1,434,888 1,404,963
Total ........................................................................................... 3,312,542 ¥259,396 3,244,782 ¥259,029
Units Revenue Units Revenue(Millions of yen) (Millions of yen)
Residential:Owned ..................................................................................... 274 373Managed.................................................................................. 44,671 42,169
Total ........................................................................................... 44,945 ¥ 49,295 42,542 ¥ 46,730
Revenue Revenue(Millions of yen) (Millions of yen)
Other .......................................................................................... ¥ 23,689 ¥ 23,912Total revenue ............................................................................. ¥332,380 ¥329,671Operating income....................................................................... ¥ 63,017 ¥ 66,563
in step with diversifying lifestyles, including thedevelopment of Japan’s first factory outlet mallin Osaka in 1995. Since then, the Company hasdeveloped a total of six outlet malls through2002, demonstrating the appeal of outletshopping to the general public.
Adding to its portfolio of shopping centersthat offer new lifestyle proposals and generate ahigh return on investment, the Company openedTREAGE Shirahata (Fujisawa-Shi, KanagawaPrefecture) in April 2003. It was the first in theMitsui Lifestyle Park series of unique retailfacilities that contain numerous small andmedium-sized shopping complexes. MitsuiFudosan expanded this series by opening LALAGarden Tsukuba (Tsukuba-shi, Ibaraki Prefecture)in March 2004. LaLa Terrace Minamisenju(Arakawa-ku, Tokyo), another in the series,opened soon after in April 2004. The potentialmarkets for this shopping center format in Japanare numerous, and Mitsui Fudosan expectssteady expansion in this sector.
Urban shopping centers remain animportant strategic focus. COREDO Nihonbashi(Chuo-ku, Tokyo) opened within the Nihonbashi1-Chome Building during the past fiscal year.The Kojun Building in Ginza (Chuo-ku, Tokyo),another urban shopping center, will open inSeptember 2004.
Exemplifying a strategic focus on super-regional shopping centers, Mitsui Fudosan alsoopened Stellar Town, one of the largest shoppingcenters in Saitama Prefecture. Another retailproject currently under development is the
tentatively named Koshien Shopping Center(Nishinomiya-shi, Hyogo Prefecture). This project,which will open in November 2004, isrepresentative of Mitsui Fudosan’s ability tocreate compelling proposals for prospectivetenants and shoppers alike as this shoppingcenter also has an entertainment facility wherecustomers can enjoy themselves.
Leased Housing and OtherThe Mitsui Fudosan Group has built a solidposition in the leased housing business andoperated 44,945 units as of March 31, 2004. Thisbusiness is based on masterleasing fromcorporate and individual owners. As a part ofthese efforts, we merged the leased housingoperations of Mitsui Real Estate Sales Co., Ltd.,which was made a wholly owned subsidiary inOctober 2002, with Mitsui Fudosan HousingLease Co., Ltd. in April 2003. This move clarifiedthe position of Mitsui Fudosan Housing Lease asthe center of the leased housing business of theMitsui Fudosan Group, and makes it a powerfulbrand partner for both owners and tenants.These businesses supported revenue growthduring the past fiscal year.
The Leasing segment also includes the car-park leasing business of Mitsui Real Estate Sales,which entails the management of parkingfacilities and is a growing business thatcontributed to revenue gains. In this business,the Mitsui Fudosan Group typically works withan originator in creating a profitable, immediatesolution for idle land assets.

M I T S U I F U D O S A N | S E G M E N T I N F O R M A T I O N
1 2
SALES OF HOUSING,OFFICE BUILDINGSAND LAND
Park City Tokyo Bay Shin-Urayasu(Two buildings completed in March 2004 and onescheduled for completion in March 2005, totaling701 units)
Theme Town by the SeaMinutes from both Tokyo and the TokyoDisney Resort, Park City Tokyo Bay Shin-Urayasu offers residents the opportunityto live in a “Theme Town” in a park-likesetting by the sea while allowing easyaccess to central Tokyo. Thecondominiums are designed to appeal tothe needs and tastes of modern urbanfamilies and to flexibly accommodatechanging stages of life. Park City TokyoBay Shin-Urayasu embodies enduringvalue and comfortable living.
Shibuya Garden Front(Completed in September 2003 / 23,288m2)
New Ways of Creating ValueCompleted in September 2003, this cutting-edge office building in a developingbusiness district near Shibuya Station inTokyo also represents a cutting-edgegrowth strategy for Mitsui Fudosan. Afterdeveloping the building in cooperation witha major life insurance company, MitsuiFudosan sold the property to NipponBuilding Fund Inc., and is now generating asteady revenue stream from managing theproperty under contract.
Sales of condominiums and detached houses are acore business in the Tokyo metropolitan area andthroughout Japan. The Mitsui Fudosan Group alsoutilizes its broad expertise and relationships inpackaging properties as investments.
SA
LE
SO
FH
OU
SIN
G,
OF
FIC
EB
UIL
DIN
GS
AN
DL
AN
D
S E G M E N T I N F O R M A T I O N | M I T S U I F U D O S A N
1 3
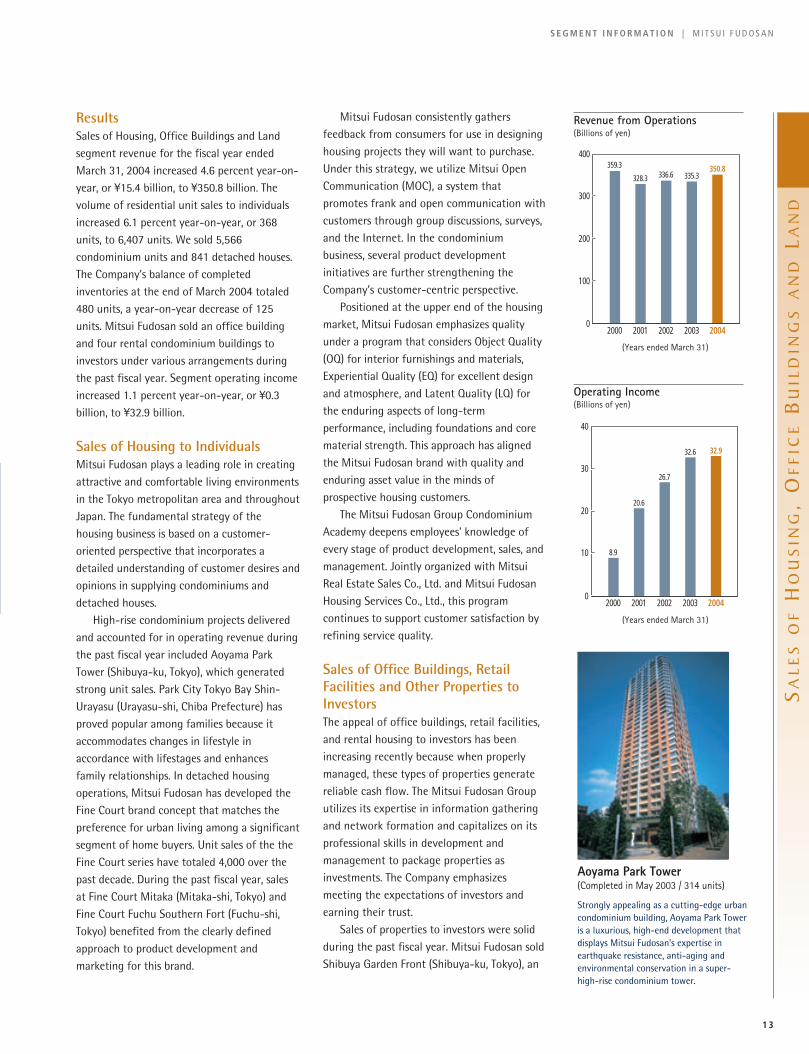
ResultsSales of Housing, Office Buildings and Landsegment revenue for the fiscal year endedMarch 31, 2004 increased 4.6 percent year-on-year, or ¥15.4 billion, to ¥350.8 billion. Thevolume of residential unit sales to individualsincreased 6.1 percent year-on-year, or 368units, to 6,407 units. We sold 5,566condominium units and 841 detached houses.The Company’s balance of completedinventories at the end of March 2004 totaled480 units, a year-on-year decrease of 125units. Mitsui Fudosan sold an office buildingand four rental condominium buildings toinvestors under various arrangements duringthe past fiscal year. Segment operating incomeincreased 1.1 percent year-on-year, or ¥0.3billion, to ¥32.9 billion.
Sales of Housing to IndividualsMitsui Fudosan plays a leading role in creatingattractive and comfortable living environmentsin the Tokyo metropolitan area and throughoutJapan. The fundamental strategy of thehousing business is based on a customer-oriented perspective that incorporates adetailed understanding of customer desires andopinions in supplying condominiums anddetached houses.
High-rise condominium projects deliveredand accounted for in operating revenue duringthe past fiscal year included Aoyama ParkTower (Shibuya-ku, Tokyo), which generatedstrong unit sales. Park City Tokyo Bay Shin-Urayasu (Urayasu-shi, Chiba Prefecture) hasproved popular among families because itaccommodates changes in lifestyle inaccordance with lifestages and enhancesfamily relationships. In detached housingoperations, Mitsui Fudosan has developed theFine Court brand concept that matches thepreference for urban living among a significantsegment of home buyers. Unit sales of the theFine Court series have totaled 4,000 over thepast decade. During the past fiscal year, salesat Fine Court Mitaka (Mitaka-shi, Tokyo) andFine Court Fuchu Southern Fort (Fuchu-shi,Tokyo) benefited from the clearly definedapproach to product development andmarketing for this brand.
Mitsui Fudosan consistently gathersfeedback from consumers for use in designinghousing projects they will want to purchase.Under this strategy, we utilize Mitsui OpenCommunication (MOC), a system thatpromotes frank and open communication withcustomers through group discussions, surveys,and the Internet. In the condominiumbusiness, several product developmentinitiatives are further strengthening theCompany’s customer-centric perspective.
Positioned at the upper end of the housingmarket, Mitsui Fudosan emphasizes qualityunder a program that considers Object Quality(OQ) for interior furnishings and materials,Experiential Quality (EQ) for excellent designand atmosphere, and Latent Quality (LQ) forthe enduring aspects of long-termperformance, including foundations and corematerial strength. This approach has alignedthe Mitsui Fudosan brand with quality andenduring asset value in the minds ofprospective housing customers.
The Mitsui Fudosan Group CondominiumAcademy deepens employees' knowledge ofevery stage of product development, sales, andmanagement. Jointly organized with MitsuiReal Estate Sales Co., Ltd. and Mitsui FudosanHousing Services Co., Ltd., this programcontinues to support customer satisfaction byrefining service quality.
Sales of Office Buildings, RetailFacilities and Other Properties toInvestors The appeal of office buildings, retail facilities,and rental housing to investors has beenincreasing recently because when properlymanaged, these types of properties generatereliable cash flow. The Mitsui Fudosan Grouputilizes its expertise in information gatheringand network formation and capitalizes on itsprofessional skills in development andmanagement to package properties asinvestments. The Company emphasizesmeeting the expectations of investors andearning their trust.
Sales of properties to investors were solidduring the past fiscal year. Mitsui Fudosan soldShibuya Garden Front (Shibuya-ku, Tokyo), an
0
100
200
300
400
2000 2001 2002 2003 2004
359.3
328.3 336.6 335.3350.8
Revenue from Operations(Billions of yen)
0
20
30
10
40
2000 2001 2002 2003 2004
8.9
20.6
26.7
32.6 32.9
Operating Income(Billions of yen)
(Years ended March 31)
(Years ended March 31)
Aoyama Park Tower(Completed in May 2003 / 314 units)
Strongly appealing as a cutting-edge urbancondominium building, Aoyama Park Toweris a luxurious, high-end development thatdisplays Mitsui Fudosan’s expertise inearthquake resistance, anti-aging andenvironmental conservation in a super-high-rise condominium tower.

M I T S U I F U D O S A N | S E G M E N T I N F O R M A T I O N
1 4
office building, to the Nippon Building Fund,Inc., a J-REIT. The Company also packaged andsold to investors four rental housing properties,including Park Axis Minami Azabu (Minato-ku,Tokyo) and Park Axis Azabu Sendaizaka(Minato-ku, Tokyo).
In this business, Mitsui Fudosan works withoriginators that seek to lighten the asset side
of their balance sheets. The Company recordeddividends allocated in proportion to its equityinvestment in such projects during the pastfiscal year. Mitsui Fudosan expects to generatefurther growth in this business by fullydeploying its know-how and expertise.
SA
LES
OF
HO
US
ING
, O
FF
ICE
BU
ILD
ING
SA
ND
LAN
D
Fine Court Mitaka(46 units)
Mitsui Fudosan puts its expertise in creating beautifulliving environments to use in its Fine Court series ofdetached housing, offered primarily in the Tokyometropolitan area.
Park Axis Minami Azabu(Completed in February 2003 / 64 units)
The Park Axis series of rentalcondominiums, all in excellent Tokyolocations, is designed for a diverse array of lifestyles.
Years ended March 31 2004 2003Units Revenue Average unit price Units Revenue Average unit price
Housing Sales (Millions of yen) (Millions of yen) (Millions of yen) (Millions of yen)
Detached housing: Tokyo metropolitan area........................... 655 ¥ 35,117 ¥53.6 709 ¥ 39,872 ¥56.2Other ......................................................... 186 4,574 24.6 212 7,112 33.5
Total .......................................................................................... 841 ¥ 39,691 ¥47.2 921 ¥ 46,984 ¥51.0Condominiums: Tokyo metropolitan area........................... 3,934 ¥204,201 ¥51.9 3,514 ¥117,226 ¥50.4
Other ......................................................... 1,632 49,973 30.6 1,604 51,416 32.1Total .......................................................................................... 5,566 ¥254,174 ¥45.7 5,118 ¥228,642 ¥44.7Total housing sales: Tokyo metropolitan area ........................... 4,589 ¥239,318 ¥52.2 4,223 ¥217,098 ¥51.4
Other ......................................................... 1,818 54,547 30.0 1,816 58,528 32.2Total .......................................................................................... 6,407 ¥293,865 ¥45.9 6,039 ¥275,626 ¥45.6Other sales revenue: Land .......................................................... ¥ 28,893 ¥ 28,583
Buildings ................................................... 28,004 31,132Total .......................................................................................... ¥ 56,897 ¥ 59,715Total revenue ............................................................................ ¥350,762 ¥335,341Operating income ...................................................................... ¥ 32,937 ¥ 32,590

CONSTRUCTION
CO
NS
TR
UC
TIO
N
S E G M E N T I N F O R M A T I O N | M I T S U I F U D O S A N
1 5
0
100
200
300
400
2000 2001 2002 2003 2004
273.1 283.8
237.2
183.1 180.5
Revenue from Operations(Billions of yen)
2000 2001 2002 2003 2004
6.06.7
(5.2) 0.31.3
0
5
-5.0
10
Operating Income(Billions of yen)
ResultsRevenue for the Construction segmentdecreased 1.4 percent year-on-year, or ¥2.6billion, to ¥180.5 billion. Segment operatingincome increased ¥1.0 billion to ¥1.3 billion.The Group company responsible for thisbusiness, Mitsui Home Co., Ltd. executed asweeping reform program that reduced costof revenues and selling, general andadministrative expenses. In addition, thespecialized company that Mitsui Homecreated in 2002 to handle its remodelingbusiness, Mitsui Home Remodeling Co., Ltd.,contributed to improved earnings throughrevenue gains.
ReviewMitsui Home Co., Ltd. is one of the leaders inJapan in constructing two-by-four wood-frame homes. The company takes ordersmainly for the construction of individualhouses and flats. Reduced contract volume ina challenging market, however, has putpressure on segment revenue and earnings.Mitsui Home has responded with acomprehensive reform program that hasgenerated strong results and a return toprofitability. Aside from the cost reductionsmentioned above, the program entailedrevising the Mitsui Home’s organizationalstructure while further strengthening brandpower and improving customer satisfaction.
Orders, Order Backlogs and Project Completions(Millions of yen)
Years ended March 31 2004 2003Orders: Work-on-hand at beginning of period............................ ¥ 90,944 ¥ 90,701
Orders during period...................................................... 141,666 149,041Total ........................................................................................... ¥232,610 ¥239,742Project completions .................................................................... ¥143,764 ¥148,798Work-on-hand at end of period.................................................. ¥ 88,846 ¥ 90,944
Projects(Millions of yen)
Years ended March 31 2004 2003Orders: Project completions ....................................................... ¥143,764 ¥148,798
Work-on-hand at end of period:Total ........................................................................... ¥ 88,846 ¥ 90,944Work in progress ........................................................ 8,911 12,993
As a percentage of work-on-handat end of period................................................. 10.0% 14.3%
Projects during period ................................................................ ¥139,682 ¥147,408
Note: Includes Mitsui Home Co., Ltd., but does not include subsidiaries of Mitsui Home Group.
(Years ended March 31)
(Years ended March 31)

Tokyo Mid-Town Project(Grand opening scheduled for Spring 2007 /566,000m2)
A New InternationalGatewayUnder redevelopment with domesticpartners on a former Defense Agency site inRoppongi, Tokyo, the Tokyo Mid-TownProject will create an attractive venue forwork, pleasure, home life and relaxation.Mitsui Fudosan is the manager of thisproject, which will encompass office, retail,residential and cultural facilities, and willinclude a Ritz-Carlton hotel. Four hectaresof parkland surround the complex.
M I T S U I F U D O S A N | S E G M E N T I N F O R M A T I O N
1 6
ResultsRevenue for the Brokerage, ConsignmentSales and Consulting segment increased 15.2percent year-on-year, or ¥7.1 billion, to ¥53.6billion. The increase in revenue was primarilythe result of strong growth in brokeragetransaction volume at the Group companyprimarily responsible for this business, MitsuiReal Estate Sales Co., Ltd. Consultingoperations also generated solid gains in feerevenue from project management andinvestment management services. Segmentoperating income increased 28.0 percent, or¥3.1 billion, to ¥14.1 billion.
ReviewThe Brokerage, Consignment Sales andConsulting segment is central to MitsuiFudosan’s ability to achieve the targets ofChallenge Plan 2008 in evolving as acomprehensive provider of real estatesolutions and services.
Mitsui Real Estate Sales has the leadingbrokerage share in Japan’s residential housing
secondary market. This strength is based on anationwide network of 234 brokerage officesas of March 2004. Corporate brokerage is arapidly growing area because of increasingdemand among corporations to lighten theasset side of their balance sheets. Mitsui RealEstate Sales became a wholly ownedconsolidated subsidiary, after which itassumed responsibility for Mitsui Fudosan’scorporate brokerage business in April 2003.
In addition, Mitsui Real Estate Sales buildson strong synergy with Mitsui Fudosan’scondominium operations, and employs itswell-developed marketing and operatingcapabilities in handling consignment sales ofcondominiums on behalf of a number ofclient companies as well.
In consulting services, Mitsui Fudosanmanages various projects, providing investorsand owners with expertise and specializedknowledge in real estate development.Projects completed during the past fiscal yearinclude Shiodome Media Tower (Minato-ku,Tokyo), which was completed in July 2003 on
0
30
45
15
60
2000 2001 2002 2003 2004
40.2 41.545.7 46.5
53.6
Revenue from Operations(Billions of yen)
BROKERAGE, CONSIGNMENT SALES AND CONSULTING
(Years ended March 31)

Shiodome Media Tower(Completed in July 2003 / 66,488m2)
Adding Value to aClient’s Head OfficeKyodo News, a cooperative newsorganization, needed a head office thatmaximized its value, and turned to MitsuiFudosan for solutions. As a projectmanager, Mitsui Fudosan created a planthat entailed developing the high-techShiodome Media Tower, an office and hotelcomplex, on a superb site in central Tokyoon behalf of Kyodo. Upon completion of thecomplex in July 2003, Mitsui Fudosan wasselected as the property manager.
S E G M E N T I N F O R M A T I O N | M I T S U I F U D O S A N
Years ended March 31 2004 2003Units Revenue Units Revenue
(Millions of yen) (Millions of yen)
Brokerage................................................................................... 28,499 ¥37,919 24,885 ¥29,406Consignment sales ..................................................................... 7,632 9,173 7,682 10,578Consulting .................................................................................. — 6,493 — 6,520Total revenue ............................................................................. — ¥53,585 — ¥46,504Operating income....................................................................... — ¥14,078 — ¥10,997
0
10
15
5
20
2000 2001 2002 2003 2004
13.4 13.6
17.5
11.0
14.1
Operating Income(Billions of yen)
behalf of Kyodo News; and Roppongi T-Cube(Minato-ku, Tokyo), a mixed-use office andresidential complex completed in September2003 on behalf of Samsung Japan.
Other projects under way include theTokyo Mid-Town Project (Minato-ku, Tokyo),which is scheduled for completion in spring2007. In the Minami Aoyama 1-ChomeHousing Complex Reconstruction Project,Mitsui Fudosan structured a consortium andwill create an integrated complexincorporating public housing and privatefacilities. Mitsui Fudosan is also providingconsulting services in connection with theAkasaka 5-Chome TBS RedevelopmentProject. Management of these projects willdeploy the capabilities of Group companies.
J-REITs and other real estate investmentbusinesses are an increasingly important areaof operations that offer opportunities for
growth in revenue and earnings. NipponBuilding Fund Management Ltd. offers fundmanagement services on a consignment basis,acting on behalf of Nippon Building Fund Inc.In addition, the Company provides brokerageservices for office buildings that NipponBuilding Fund may decide to purchase.Moreover, Mitsui Fudosan InvestmentAdvisors, Inc. provides investors with assetmanagement services and other arrangementand coordination services. In April 2004,Mitsui Fudosan also set up Mitsui GemstoneFund I, a value-added private real estateinvestment fund that serves institutionalinvestors, including domestic pension funds.As the fund’s investment and asset manager,Mitsui Fudosan also receives fee income.
BR
OK
ER
AG
E,
CO
NS
IGN
ME
NT
SA
LES
AN
DC
ON
SU
LTIN
G
1 7
(Years ended March 31)

Shiodome City Center(Completed in January 2003 / 211,641m2)
Fee Business Maximizes BenefitsCompleted in early 2003, Shiodome CityCenter is a large-scale, mixed-useredevelopment project in which jointownership with Alderney Investments Pte.Ltd., an affiliate of the Government ofSingapore Investment Corporation Pte. Ltd.,minimized Mitsui Fudosan’s initial outlaysand increased fee revenue. Mitsui Fudosanis currently handling property and assetmanagement responsibilities includingtenant leasing.
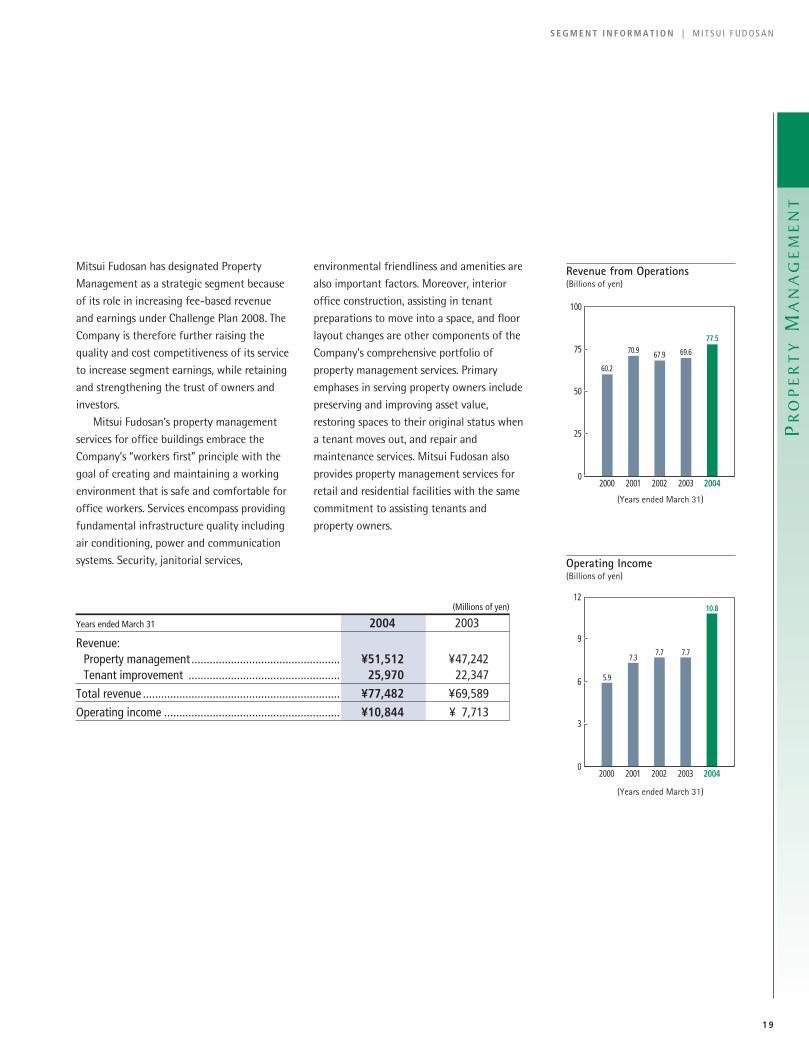
ResultsRevenue for the Property Managementsegment increased 11.3 percent year-on-year,or ¥7.9 billion, to ¥77.5 billion. New propertymanagement contracts for large-scale buildingsthat Mitsui Fudosan developed, such asShiodome City Center (Minato-ku, Tokyo),Jimbocho Mitsui Building (Chiyoda-ku, Tokyo)and Shiodome Media Tower (Minato-ku, Tokyo)supported the gain in revenue. Segmentoperating income increased 40.6 percent, or¥3.1 billion, to ¥10.8 billion as a result of theincrease in revenue.
ReviewThe Mitsui Fudosan Group provides officemanagement services mainly through Groupcompanies Mitsui Fudosan Building
Management Co., Ltd. and Daiichi Seibi Co., Ltd.Other Group companies involved in propertymanagement include Mitsui Fudosan HousingServices Co., Ltd., which managescondominiums developed by Mitsui Fudosan,and Lalaport Co., Ltd., which manages retailfacilities. This business also draws strength fromthe comprehensive skills portfolio of the MitsuiFudosan Group covering property management,leasing management and other areas. At thesame time, property management operationsprovide opportunities for Mitsui Fudosan tolisten to clients and learn their needs, whichprovides valuable feedback supporting thedevelopment and marketing of compellingproperties.
As in the case of the Brokerage,Consignment Sales and Consulting segment,
PROPERTY MANAGEMENT
M I T S U I F U D O S A N | S E G M E N T I N F O R M A T I O N
1 8
PR
OP
ER
TY
MA
NA
GE
ME
NT
1 9
0
50
75
25
100
2000 2001 2002 2003 2004
60.2
70.9 67.9 69.6
77.5
Revenue from Operations(Billions of yen)
0
9
6
3
12
2000 2001 2002 2003 2004
5.9
7.37.7 7.7
10.8
Operating Income(Billions of yen)
Mitsui Fudosan has designated PropertyManagement as a strategic segment becauseof its role in increasing fee-based revenueand earnings under Challenge Plan 2008. TheCompany is therefore further raising thequality and cost competitiveness of its serviceto increase segment earnings, while retainingand strengthening the trust of owners andinvestors.
Mitsui Fudosan’s property managementservices for office buildings embrace theCompany’s “workers first” principle with thegoal of creating and maintaining a workingenvironment that is safe and comfortable foroffice workers. Services encompass providingfundamental infrastructure quality includingair conditioning, power and communicationsystems. Security, janitorial services,
environmental friendliness and amenities arealso important factors. Moreover, interioroffice construction, assisting in tenantpreparations to move into a space, and floorlayout changes are other components of theCompany’s comprehensive portfolio ofproperty management services. Primaryemphases in serving property owners includepreserving and improving asset value,restoring spaces to their original status whena tenant moves out, and repair andmaintenance services. Mitsui Fudosan alsoprovides property management services forretail and residential facilities with the samecommitment to assisting tenants andproperty owners.
S E G M E N T I N F O R M A T I O N | M I T S U I F U D O S A N
(Years ended March 31)
(Years ended March 31)
(Millions of yen)
Years ended March 31 2004 2003
Revenue:Property management ................................................. ¥51,512 ¥47,242Tenant improvement .................................................. 25,970 22,347
Total revenue ................................................................. ¥77,482 ¥69,589Operating income .......................................................... ¥10,844 ¥ 7,713

ResultsSegment revenue decreased 6.0 percentyear-on-year, or ¥3.9 billion, to ¥61.8billion. Consumer spending remainedlackluster during the past fiscal year, andrevenues decreased as a result of thedivestiture of the supermarket operationsof Uni Living Co., Ltd. Segment operatingincome, however, increased to ¥0.2 billion,primarily due to recovery in Mitsui Home’smaterial processing and sales business.
ReviewMitsui Home Components Co., Ltd. andother subsidiaries produce and markethousing materials. Uni Living Co., Ltd.manages home centers and retails do-it-yourself (DIY) goods, mainly in the Tokyometropolitan area. Daiichi Seed Co., Ltd.engages in the wholesale and retail offlowers and gardening supplies.
ResultsSegment revenue decreased 8.0 percentyear-on-year, or ¥3.3 billion, to ¥37.6billion. The discontinuation of LaLaport SkiDome SSAWS in September 2002 hasdepressed revenue in this segment, and anunfavorable domestic and internationalenvironment during the past fiscal yearrestrained travel, which reduced hoteloccupancy rates and revenue from hoteloperations. Segment operating loss totaled¥0.5 billion, compared to an operating loss
0
40
20
60
80
2000 2001 2002 2003 2004
69.9 70.6 71.6
65.761.8
Revenue from Operations(Billions of yen)
0
1
1.5
0.5
2
2000 2001 2002 2003 2004
0.3
0.8
1.3
0.10.2
Operating Income(Billions of yen)
0
45
15
30
60
2000 2001 2002 2003 2004
46.2 47.445.0
40.937.6
Revenue from Operations(Billions of yen)
SALES OF HOUSING MATERIALSAND MERCHANDISE
FACILITYOPERATIONS
2 0
M I T S U I F U D O S A N | S E G M E N T I N F O R M A T I O N
(Years ended March 31) (Years ended March 31) (Years ended March 31)
(Millions of yen)
Years ended March 31 2004 2003
Revenue:Housing materials ....................................................... ¥19,956 ¥21,336Merchandise .............................................................. 41,813 44,346
Total revenue ................................................................. ¥61,769 ¥65,682Operating income .......................................................... ¥151 ¥ 105
Years ended March 31
Revenue:Hotels ...................................................................Other ...................................................................
Total revenue...........................................................Operating income (loss)...........................................

of ¥3.4 billion for the previous fiscal yeardue to the closure of the unprofitableLaLaport Ski Dome SSAWS.
ReviewThe Garden Hotel chain comprisesapproximately 3,500 rooms in 15 hotelsthroughout Japan. Hotel operations alsoinclude the Halekulani Hotel in Honolulu,Hawaii, which is highly rated for thequality of its hospitality. In Japan, theGroup manages seven golf courses.
ResultsSegment revenue decreased 25.0 percentyear-on-year, or ¥2.9 billion, to ¥8.7 billion.Segment operating income increased 2.2percent to ¥2.6 billion.
ReviewMitsui Home Linkage Co., Ltd. providesbridging finance to the customers of MitsuiHome and engages in finance and leasebusiness. Mitsui Fudosan Loan GuaranteeCo., Ltd. provides home loan guarantees.
-5
-2.5
0
2000 2001 2002 2003 2004
(0.0) (0.1)
(4.3)
(3.4)
(0.5)
Operating Income (Loss)(Billions of yen)
0
12
18
6
2000 2001 2002 2003 2004
20.120.8
16.9
11.6
8.7
24
Revenue from Operations(Billions of yen)
02000 2001 2002 2003 2004
2.8
3.8
0.9
2.5 2.6
2
3
1
4
Operating Income(Billions of yen)
OTHER
2 1
S E G M E N T I N F O R M A T I O N | M I T S U I F U D O S A N
(Years ended March 31) (Years ended March 31) (Years ended March 31)
(Millions of yen)
2004 2003
......................... ¥24,486 ¥25,664
......................... 13,144 15,216
......................... ¥37,630 ¥40,880
......................... ¥ (527) ¥ (3,356)
(Millions of yen)
Years ended March 31 2004 2003
Revenue:Finance and lease ....................................................... ¥1,583 ¥ 2,029Other ......................................................................... 7,150 9,611
Total revenue ................................................................. ¥8,733 ¥11,640Operating income .......................................................... ¥2,591 ¥ 2,535

CORPORATE GOVERNANCE
An approach to corporate governance based on ensuring sound, transparent and efficient management.
An Efficient, Effective Organization
Mitsui Fudosan’s corporate officer system separates
management and executive functions to create a
business execution system that can flexibly
accommodate both the Company’s capabilities and
the changing operating environment. The corporate
officer system supplements the responsibilities of the
Board of Directors by enhancing Group decision-
making, thus supporting the integrity and efficiency
of management. In addition, Mitsui Fudosan reduced
the number of directors to eight during the past fiscal
year to allow greater flexibility in the decision-
making process.
Mitsui Fudosan employs a system of autonomous
corporate auditors to ensure transparency and
objective evaluation of management. Three of the
five members of the Board of Corporate Auditors are
from outside the Company to enhance objectivity.
Our corporate governance system also benefits from
the Advisory Committee, which provides management
with the diverse perspectives of external experts from
academia and business.
Strengthening Compliance
Circumspect compliance is essential to maintaining
the trust of stakeholders and society and achieving
the goals of Challenge Plan 2008 in strategic areas
such as asset management. A member of the Board of
Directors is responsible for overseeing compliance.
This director chairs a Compliance Committee that
ensures full understanding of and compliance with
relevant rules and regulations. Activities include
managing the compliance code for employee
behavior and the compliance manual detailing
operating rules, regulations, and other matters.
M I T S U I F U D O S A N | C O R P O R A T E G O V E R N A N C E
2 2
Guidelines for Employee Behavior
Vision / Mission
Compliance Manual
Compliance Code
Moredetailed code of conduct

MANAGEMENT (As of June 29, 2004)
Members of the Board
Chairman of the Board
Jun-Ichiro- Tanaka
President and Chief Executive Officer
Hiromichi Iwasa
Executive Vice President
Yotaro Hayashi
Senior Managing Directors
Koichi OmuroOsamu OgawaKazuichi Nagata
Managing Directors
Takayuki NamaeTatsuo Soda
Auditors
Senior Corporate Auditor
Hisamitsu Tsubahara
Corporate Auditors
Nobumi TobariKen-Ichi KamiyaKen FujiiAkira Watanabe
Left : Hiromichi Iwasa, Right : Jun-Ichiro- Tanaka Seated, from left: Osamu Ogawa, Yotaro Hayashi, Koichi OmuroStanding, from left: Tatsuo Soda, Kazuichi Nagata, Takayuki Namae
Officers
M A N A G E M E N T | M I T S U I F U D O S A N
2 3
President and Chief Executive Officer
Hiromichi Iwasa
Executive Vice President
Yotaro Hayashi
Senior Executive Officers
Koichi OmuroOsamu OgawaKazuichi Nagata
Executive Officers
Takayuki NamaeTatsuo SodaYuji YokoyamaMitsuhiro MatsumotoMinoru SatouKuniaki IkeyaYoshiki Kageyama
Officers
Shigeo SasakiTakayoshi SaitoTakao IwadouMasayuki IsobeTeruaki Ueyama

CORPORATE SOCIAL RESPONSIBILITY
CSR is a core management theme for Mitsui Fudosan, which conducts vigorousenvironmental and social contribution activities.
M I T S U I F U D O S A N | C O R P O R A T E S O C I A L R E S P O N S I B I L I T Y
2 4
Environmental Accounting
Mitsui Fudosan applies environmental accounting to allbuildings it owns and manages in its Office BuildingDivision. The system is linked to the Company’s financialmanagement system to permit automatic evaluation ofthe impact of environmental costs and refinement toexamine them on a per-unit basis. The environmentalaccounting system has improved awareness ofecological considerations and prompt cost-efficientresponses.
Reduction of Hazardous Materials
Mitsui Fudosan has standardized its high-grade, low-formaldehyde building materials as part of itscommitment to people's health in offeringcondominiums and detached houses. In addition, MitsuiFudosan has built a framework for compliance withenvironment-related laws and ordinances to reduce theuse of hazardous materials. Measures include rigorouscontrol of polychlorinated biphenyl,chlorofluorocarbons and halons.
CO2 Emission Reduction
As part of efforts to reduce the volume of CO2
emissions, we are vigorously implementing suchmeasures as the introduction of energy-savingequipment and systems and the development ofbuildings with longer lives. We are also aggressive indeveloping buildings that incorporate ample greenspaces both on the ground and on rooftops.
Waste Reduction
Mitsui Fudosan recycles used paper and tile carpet. Thisannual report is printed with 100% recycled paperutilizing used OA paper collected from office buildingsmanaged by Mitsui Fudosan. In addition, Mitsui Fudosanseparates and collects waste construction materials atbuilding sites with the aim of reusing these materials tothe greatest extent possible.
Environmental Activities
Mitsui Fudosan’s Environmental Policy has codified the Company’s serious commitment to harmonious coexistence with
the environment by establishing goals and plans based on a clear understanding of the impact of corporate activities. We
aim to continually improve our contribution through aggressive measures to conserve the global environment by working
to reduce ecological impact and to prevent pollution. When necessary, we employ independent standards, based on strict
observance of relevant laws. Mitsui Fudosan also employs an environmental management system that includes
environmental accounting. We conduct open communication with communities and society through disclosure of
relevant information via the Internet and other media. Ongoing education programs promote awareness of environmental
issues among all employees.
Recycling effortsinclude tile carpetused in MitsuiFudosan buildings.

Social and Communication Activities
Mitsui Fudosan contributes to its local community and the urban environment by providing financial support for
Metrolink Nihonbashi, an electric bus that offers free shuttle service in Nihonbashi, Tokyo’s primary business and
commercial district. Moreover, Mitsui Fudosan has published statistics on real estate and related issues since 1977.
Mitsui Fudosan’s sponsorship of annual events includes the Tokyo Summer Festival, which introduces music from around
the world, and the Sumida River Fireworks, one of the most famous fireworks displays in Tokyo.
Eco Life Support and Environmental Improvement
Under our Eco Life Support program, we areencouraging individuals to participate in environmentalconservation. Regular communication with customersthrough newsletters and handbooks provides numeroussuggestions for meaningful support for environmentalconservation that individuals can do without trouble.We have also developed Eco Life Support products suchas electric meters that help people manage energy useand automatic switches to turn off power to selectedappliances at night. Mitsui Fudosan is also creatingsystems that allow people to participate in theseparation and collection of refuse in offices.
Environmental Communication and Support
Mitsui Fudosan communicates its environmental policiesand activities to society through means such as theCompany’s environmental reports. In addition, MitsuiFudosan strives to raise the environmental awareness of
each employee by providingenvironment-relatededucation. We also contributeto environmentalorganizations and support theefforts of volunteers.
C O R P O R A T E S O C I A L R E S P O N S I B I L I T Y | M I T S U I F U D O S A N
2 5
Mitsui Fudosansponsors the annualSumida RiverFireworks in Tokyo.
Mitsui Fudosan provides support forthe Metrolink Nihonbashi electricshuttle bus.
Real estate statisticspublished by Mitsui Fudosan
The Mitsui Fudosan Grouppublishes an environmental report.

M I T S U I F U D O S A N | S I X - Y E A R S U M M A R Y
SIX-YEAR SUMMARYMitsui Fudosan Co., Ltd. and its Subsidiaries
2 6
Thousands ofMillions of yen U.S. dollars
except per share amounts except per share amounts
Years ended March 31, 2004 2003 2002 2001 2000 1999 2004
FOR THE YEAR:Revenue from operations ................. ¥1,102,844 ¥1,082,398 ¥1,152,484 ¥1,193,081 ¥1,194,837 ¥1,140,242 $10,434,705Interest, dividends and miscellaneous ................................ 11,652 11,187 35,842 61,205 16,565 9,426 110,247
Costs and expenses (including tax) ................................ 1,103,241 1,070,613 1,163,972 1,226,612 1,274,736 1,205,625 10,438,462
Equity in net income (loss) of affiliated companies....................... 3,535 2,905 3,301 510 4,768 (663) 33,447
Minority interests ............................. (335) (323) 2,152 (2,072) 148 20,826 (3,169)Net income (loss) ............................. 14,455 25,554 29,807 26,112 (58,418) (35,794) 136,768
AT YEAR-END:Total assets ...................................... ¥2,916,583 ¥2,929,070 ¥3,028,969 ¥2,846,467 ¥2,991,203 ¥3,202,426 $27,595,638Shareholders’ equity ........................ 659,165 628,434 609,536 411,097 395,132 492,591 6,236,777Common stock ................................. 134,433 134,433 134,433 134,433 134,433 134,433 1,271,956Number of employees ...................... 12,808 12,615 12,503 13,380 13,484 13,589
PER SHARE DATA:Net income (loss) ............................. ¥ 17.5 ¥ 31.1 ¥ 36.7 ¥ 32.1 ¥ (71.9) ¥ (44.1) $ 0.166Cash dividends applicable tothe year.......................................... 7.0 7.0 7.0 6.0 5.0 5.0 0.066
RATIOS:Equity ratio (%)................................ 22.6 21.5 20.1 14.4 13.2 15.4Return on assets (%)........................ 4.06 3.78 3.86 3.98 3.10 2.06
Note: U.S. dollar amounts are translated from yen at the rate of ¥105.69 =U.S.$1.00, the approximate exchange rate at March 31, 2004.ROA = (Operating income + Non-operating income) / Average total assets

MANAGEMENT’S DISCUSSION AND ANALYSISMitsui Fudosan Co., Ltd. and its Subsidiaries
M A N A G E M E N T ’ S D I S C U S S I O N A N D A N A L Y S I S | M I T S U I F U D O S A N
Income Analysis(Billions of yen, %)
Years ended March 31 2004 2003 2002
Revenue from operations.............................................................. ¥1,102.8 100.0% ¥1,082.4 100.0% ¥1,152.5 100.0%
Cost of revenue from operations................................................... 873.6 79.2 858.6 79.3 916.8 79.6
Selling, general and administrative expenses ............................... 120.0 10.9 120.5 11.1 132.7 11.5
Operating income ......................................................................... 109.2 9.9 103.3 9.6 103.0 8.9
Other revenues ............................................................................. 11.7 1.1 11.2 1.0 35.8 3.1
Interest expenses .......................................................................... 22.8 2.1 26.6 2.5 31.8 2.8
Other expenses ............................................................................. 78.0 7.1 46.6 4.3 67.0 5.8
Equity in net income of affiliated companies ................................ 3.5 0.3 2.9 0.3 3.3 0.3
Income before income taxes ......................................................... 23.6 2.1 44.2 4.1 43.3 3.7
Income taxes................................................................................. 8.8 0.8 18.3 1.7 15.7 1.4
Minority interests.......................................................................... (0.3) (0.0) (0.3) (0.0) 2.2 0.2
Net income ................................................................................... ¥ 14.5 1.3 ¥ 25.6 2.4 ¥ 29.8 2.5
Revenue from OperationsFor the fiscal year ended March 31, 2004, consolidated revenue from operations increased 1.9 percentyear-on-year, or ¥20.4 billion, to ¥1,102.8 billion. Revenue increased in the Leasing segment, the Sales ofHousing, Office Buildings and Land segment, the Brokerage, Consignment Sales and Consulting segment,and the Property Management segment. This growth compensated for lower revenue in other segmentsthat has resulted from Mitsui Fudosan’s emphasis on selection and concentration on businesses in whichits competitive advantage is strongest, and on reorganizing the Mitsui Fudosan Group for improvedoperating efficiency. Revenue growth was particularly pronounced in the Sales of Housing, OfficeBuildings and Land segment, reflecting in part the increase in units of housing sold.
Cost of Revenue from Operations and SGA ExpensesCost of revenue from operations increased 1.8 percent year-on-year, or ¥15.0 billion, to ¥873.6 billion, inline with the increase in revenue from operations. As a result, gross profit increased 2.4 percent, or ¥5.4billion, to ¥229.2 billion, and the gross margin improved slightly to 20.8 percent from 20.7 percent for theprevious fiscal year.
Despite the increase in revenue from operations, selling, general and administrative (SGA) expensesdecreased 0.5 percent year-on-year, or ¥0.5 billion, to ¥120.0 billion.
Operating IncomeThe accompanying consolidated financial statements do not include operating income as a discrete lineitem. Calculated as revenue from operations less cost of revenue from operations and SGA expenses,operating income increased 5.8 percent, or ¥6.0 billion, year-on-year to ¥109.2 billion.
By primary operating segment, operating income for the Leasing segment decreased 5.3 percent, or¥3.5 billion, to ¥63.0 billion. Factors included the decline in revenue because of reconstruction projects aspart of an ongoing renovation program to improve the value of Mitsui Fudosan’s assets and an increase intemporarily unleased floor space during tenant changeovers. The vacancy rate for office buildings andretail facilities, however, improved to 5.0 percent from 6.0 percent at the previous fiscal year-end.Operating income for the Sales of Housing, Office Buildings and Land segment increased 1.1 percent, or¥0.3 billion, to ¥32.9 billion. Units of detached housing and condominiums sold increased by 368 to6,407. Sales of office and rental condominium buildings to investors also supported earnings. Operatingincome for the Construction segment increased to ¥1.3 billion, reflecting a reduction in operating costs as
2 7
0
500
1,000
1,500
2000 2001 2002 2003 2004
1,194.8 1,193.1 1,152.51,082.4 1,102.8
Revenue from Operations(Billions of yen)
(Years ended March 31)
0
30
60
90
120
150
2000 2001 2002 2003 2004
81.9
108.3103.0 103.3
109.2
Operating Income(Billions of yen)
(Years ended March 31)

a result of restructuring at Mitsui Home. Operating income for the Brokerage, Consignment Sales andConsulting segment increased 28.0 percent, or ¥3.1 billion, to ¥14.1 billion. A substantial increase in feeincome from project and investment fund management supported earnings in this segment, as did higherbrokerage transaction volume in the individual and corporate markets at Mitsui Real Estate Sales.Operating income for the Property Management segment increased 40.6 percent, or ¥3.1 billion, to ¥10.8billion. An increase in property management contracts, largely for buildings for which Mitsui Fudosanserved as project manager during construction, supported earnings growth.
Other Revenue and Expenses and Interest ExpensesInterest, dividends and miscellaneous revenue increased marginally to ¥11.7 billion. Interest incomedecreased 11.3 percent, or ¥0.2 billion, and proceeds from sale of property and equipment also decreased.Gain on sale of investment securities, however, totaled ¥4.7 billion, compared to ¥0.6 billion in theprevious fiscal year. Dividend income decreased 2.5 percent.
Interest expense decreased 14.5 percent, or ¥3.9 billion, to ¥22.8 billion, reflecting Mitsui Fudosan’songoing program of decreasing interest-bearing liabilities and generating revenue from businesses thatare less capital intensive. The interest coverage ratio, calculated as the sum of operating income andinterest, dividends and miscellaneous revenue divided by interest expense, improved to 5.3 timescompared to 4.3 times for the previous fiscal year.
Other expenses increased 67.6 percent, or ¥31.5 billion, to ¥78.0 billion. This year-on-year change wasprimarily the result of a one-time charge to earnings for loss on devaluation of real property for saletotaling ¥64.2 billion as Mitsui Fudosan moved to ensure the integrity of its balance sheet by aligning thevalue of assets in its portfolio with current market prices. This devaluation loss was a non-cash charge toearnings that did not reduce cash provided by operations or the Company’s ability to meet currentobligations and pay dividends. The absence of one-time items recorded in the previous fiscal year,including losses on devaluation of other securities and disposal of fixed assets, helped to mitigate theimpact of the devaluation loss.
Income before Income Taxes and Net IncomeEquity in net income of affiliated companies increased 21.7 percent to ¥3.5 billion, reflecting improvedperformance at affiliates including Oriental Land Co., Ltd., the operator of Tokyo Disney Resort. Due to theimpact of the revaluation loss discussed above, however, income before income taxes decreased 46.5percent year-on-year, or ¥20.6 billion, to ¥23.6 billion. Income taxes net of deferrals decreased 51.7percent, or ¥9.5 billion, to ¥8.8 billion.
Consequently, net income decreased 43.4 percent year-on-year, or ¥11.1 billion, to ¥14.5 billion. Netincome per share decreased to ¥17.5 from ¥31.1 for the previous fiscal year. Fully diluted earnings pershare decreased to ¥16.3 from ¥28.9 for the previous fiscal year.
Annual cash dividends per share totaled ¥7.0, unchanged from the previous fiscal year.
Liquidity, Capital Resources and Financial Position
Current AssetsCurrent assets decreased 2.3 percent from the previous fiscal year-end, or ¥16.1 billion, to ¥671.8 billion.Cash and cash equivalents increased 23.4 percent, or ¥26.9 billion, from a year earlier. Compared to theprevious fiscal year-end, inventories decreased 18.4 percent, or ¥76.9 billion, to ¥340.1 billion.Inventories decreased due to the devaluation of real property for sale, which also had the effect ofincreasing deferred income taxes. Inventories also decreased due to cost recovery on sales of housing.Investment in special purpose companies as part of the trading business resulted in an increase in othercurrent assets.
Working capital decreased to ¥56.6 billion from ¥86.8 billion a year earlier, and the current ratio was1.09 times, compared to 1.14 times a year earlier.
-602000 2001 2002 2003 2004
(58.4)
26.129.8
25.6
14.5
-50
0
10
20
30
40
Net Income (Loss)(Billions of yen)
-802000 2001 2002 2003 2004
(71.9)
32.1
36.7
31.1
17.5
-70
0
10
20
30
40
Net Income (Loss) per Share(Yen)
M I T S U I F U D O S A N | M A N A G E M E N T ’ S D I S C U S S I O N A N D A N A L Y S I S
2 8
(Years ended March 31)
(Years ended March 31)
0
1,000
2,000
3,000
4,000
2000 2001 2002 2003 2004
2,991.22,846.5
3,029.0 2,929.1 2,916.6
Total Assets(Billions of yen)
(As of March 31)

Assets(Billions of yen, %)
As of March 31 2004 2003 2002
Cash and cash equivalents............................................................ ¥ 141.7 4.9% ¥ 114.8 3.9% ¥ 117.5 4.0%
Inventories .................................................................................... 340.1 11.7 417.0 14.3 467.7 15.4
Other current assets...................................................................... 190.1 6.5 156.1 5.3 163.8 5.4
Investments and other assets ....................................................... 598.0 20.5 562.9 19.2 588.9 19.4
Net property and equipment......................................................... 1,646.7 56.4 1,678.3 57.3 1,691.1 55.8
Total.............................................................................................. ¥2,916.6 100.0% ¥2,929.1 100.0% ¥3,029.0 100.0%
M A N A G E M E N T ’ S D I S C U S S I O N A N D A N A L Y S I S | M I T S U I F U D O S A N
Liabilities, Minority Interests in Consolidated Subsidiaries and Shareholders’ Equity(Billions of yen, %)
As of March 31 2004 2003 2002
Interest-bearing debt—Short term ............................................... ¥ 275.2 9.4% ¥ 293.7 10.0% ¥ 310.4 10.2%
Interest-bearing debt—Long term ................................................ 1,046.3 35.9 1,103.5 37.7 1,150.1 38.0
Total interest-bearing debt ....................................................... 1,321.5 45.3 1,397.2 47.7 1,460.5 48.2
Other current liabilities ................................................................. 340.1 11.7 307.5 10.5 344.6 11.4
Other long-term liabilities ............................................................. 579.8 19.9 578.8 19.7 594.2 19.6
Minority interests in consolidated subsidiaries ............................. 16.0 0.5 17.2 0.6 20.2 0.7
Shareholders’ equity ..................................................................... 659.2 22.6 628.4 21.5 609.5 20.1
Total.............................................................................................. ¥2,916.6 100.0% ¥2,929.1 100.0% ¥3,029.0 100.0%
Investments and Other AssetsInvestments and other assets increased 6.2 percent from a year earlier, or ¥35.2 billion, to ¥598.0 billion.The primary factor was an increase in the total of investment securities to ¥189.3 billion, an increase of45.2 percent, or ¥58.9 billion, from a year earlier. This increase resulted in part from recovery in the pricesof listed stocks in the Company’s portfolio.
Property and EquipmentProperty and equipment decreased 1.9 percent from a year earlier, or ¥31.6 billion, to ¥1,646.7 billion,primarily reflecting normal depreciation.
Current LiabilitiesCurrent liabilities increased 2.4 percent from a year earlier, or ¥14.2 billion, to ¥615.3 billion. Notes andaccounts payable increased compared to a year earlier. Long-term debt due within one year decreasedsubstantially, despite additions including ¥10.0 billion in 1.05 percent yen notes due during 2004, as aresult of the redemption of 1.4 percent convertible debentures and 1.7 percent yen notes during the pastfiscal year, which together totaled ¥81.2 billion. Commercial paper as of the balance sheet date increased,as did income taxes payable. Despite the increase in current liabilities, Mitsui Fudosan’s ability to meet itsshort-term commitments as expressed by the current ratio was essentially unchanged from a year earlier.
Long-term LiabilitiesLong-term liabilities decreased 3.3 percent from a year earlier, or ¥56.2 billion, to ¥1,626.2 billion. Long-term debt due after one year decreased 5.2 percent from a year earlier, or ¥57.2 billion, to ¥1,046.3billion, reflecting Mitsui Fudosan’s emphasis on steadily reducing interest-bearing debt, which decreasedto ¥1,321.5 billion, and on enhancing the trading and management businesses.
Shareholders’ Equity and Total CapitalShareholders’ equity increased 4.9 percent from a year earlier, or ¥30.7 billion, to ¥659.2 billion. Additionsto net assets as a result of net income for the fiscal year as represented by retained earnings supportedthe increase in shareholders’ equity. In addition, the rise in financial asset prices during the fiscal year
0
1
2
3
4
5
2000 2001 2002 2003 2004
3.10
3.98 3.86 3.784.06
ROA(%)
(Years ended March 31)
0
400
800
1,200
1,600
2,000
2000 2001 2002 2003 2004
1,660.11,554.4
1,460.51,397.2
1,321.5
Interest-Bearing Debt(Billions of yen)
(As of March 31)2 9
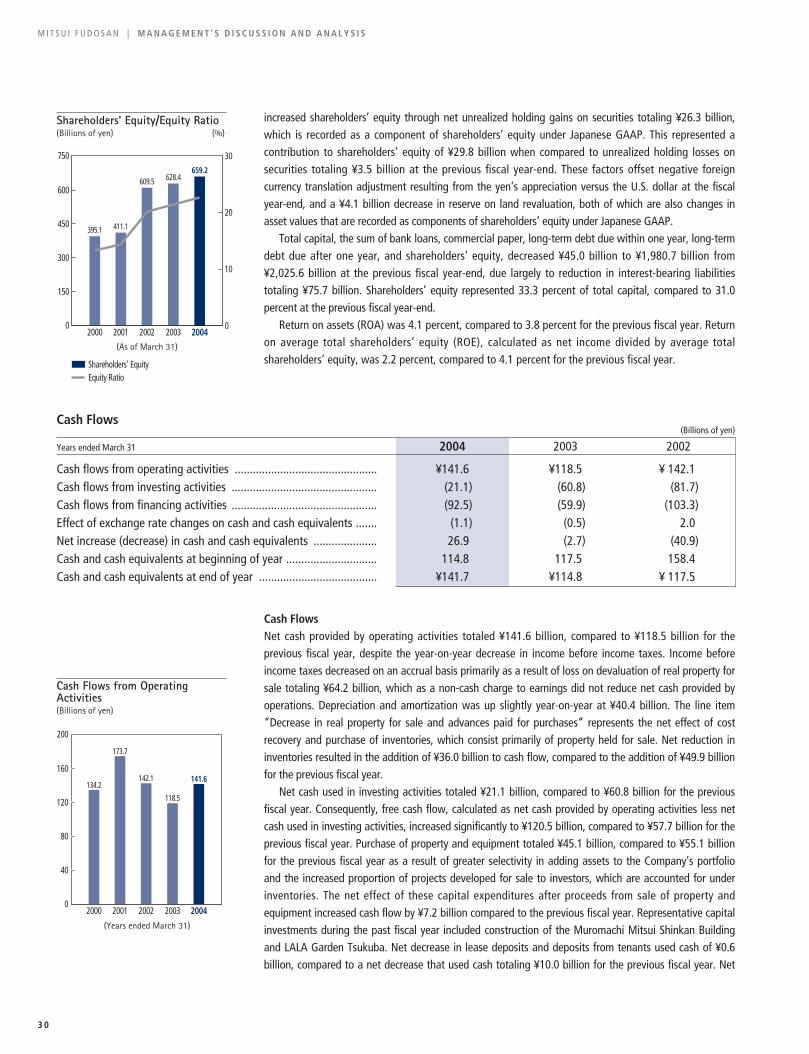
increased shareholders’ equity through net unrealized holding gains on securities totaling ¥26.3 billion,which is recorded as a component of shareholders’ equity under Japanese GAAP. This represented acontribution to shareholders’ equity of ¥29.8 billion when compared to unrealized holding losses onsecurities totaling ¥3.5 billion at the previous fiscal year-end. These factors offset negative foreigncurrency translation adjustment resulting from the yen’s appreciation versus the U.S. dollar at the fiscalyear-end, and a ¥4.1 billion decrease in reserve on land revaluation, both of which are also changes inasset values that are recorded as components of shareholders’ equity under Japanese GAAP.
Total capital, the sum of bank loans, commercial paper, long-term debt due within one year, long-termdebt due after one year, and shareholders’ equity, decreased ¥45.0 billion to ¥1,980.7 billion from¥2,025.6 billion at the previous fiscal year-end, due largely to reduction in interest-bearing liabilitiestotaling ¥75.7 billion. Shareholders’ equity represented 33.3 percent of total capital, compared to 31.0percent at the previous fiscal year-end.
Return on assets (ROA) was 4.1 percent, compared to 3.8 percent for the previous fiscal year. Returnon average total shareholders’ equity (ROE), calculated as net income divided by average totalshareholders’ equity, was 2.2 percent, compared to 4.1 percent for the previous fiscal year.
Cash FlowsNet cash provided by operating activities totaled ¥141.6 billion, compared to ¥118.5 billion for theprevious fiscal year, despite the year-on-year decrease in income before income taxes. Income beforeincome taxes decreased on an accrual basis primarily as a result of loss on devaluation of real property forsale totaling ¥64.2 billion, which as a non-cash charge to earnings did not reduce net cash provided byoperations. Depreciation and amortization was up slightly year-on-year at ¥40.4 billion. The line item“Decrease in real property for sale and advances paid for purchases” represents the net effect of costrecovery and purchase of inventories, which consist primarily of property held for sale. Net reduction ininventories resulted in the addition of ¥36.0 billion to cash flow, compared to the addition of ¥49.9 billionfor the previous fiscal year.
Net cash used in investing activities totaled ¥21.1 billion, compared to ¥60.8 billion for the previousfiscal year. Consequently, free cash flow, calculated as net cash provided by operating activities less netcash used in investing activities, increased significantly to ¥120.5 billion, compared to ¥57.7 billion for theprevious fiscal year. Purchase of property and equipment totaled ¥45.1 billion, compared to ¥55.1 billionfor the previous fiscal year as a result of greater selectivity in adding assets to the Company’s portfolioand the increased proportion of projects developed for sale to investors, which are accounted for underinventories. The net effect of these capital expenditures after proceeds from sale of property andequipment increased cash flow by ¥7.2 billion compared to the previous fiscal year. Representative capitalinvestments during the past fiscal year included construction of the Muromachi Mitsui Shinkan Buildingand LALA Garden Tsukuba. Net decrease in lease deposits and deposits from tenants used cash of ¥0.6billion, compared to a net decrease that used cash totaling ¥10.0 billion for the previous fiscal year. Net
0
150
300
450
600
20
30
10
0
750
2000 2001 2002 2003 2004
395.1 411.1
609.5 628.4659.2
Shareholders’ EquityEquity Ratio
Shareholders’ Equity/Equity Ratio(Billions of yen) (%)
0
40
80
120
160
200
2000 2001 2002 2003 2004
134.2
173.7
142.1
118.5
141.6
Cash Flows from OperatingActivities(Billions of yen)
M I T S U I F U D O S A N | M A N A G E M E N T ’ S D I S C U S S I O N A N D A N A L Y S I S
3 0
(As of March 31)
Cash Flows(Billions of yen)
Years ended March 31 2004 2003 2002
Cash flows from operating activities ............................................... ¥141.6 ¥118.5 ¥ 142.1Cash flows from investing activities ................................................ (21.1) (60.8) (81.7)Cash flows from financing activities ................................................ (92.5) (59.9) (103.3)Effect of exchange rate changes on cash and cash equivalents ....... (1.1) (0.5) 2.0Net increase (decrease) in cash and cash equivalents ..................... 26.9 (2.7) (40.9)Cash and cash equivalents at beginning of year .............................. 114.8 117.5 158.4Cash and cash equivalents at end of year ....................................... ¥141.7 ¥114.8 ¥ 117.5
(Years ended March 31)

purchase of marketable and investment securities totaled ¥3.4 billion, compared to net purchase of ¥16.5billion for the previous fiscal year as Mitsui Fudosan increased sales of cross-holding securities, while alsoincreasing investments in Tokutei Mokuteki Kaisha, specific purpose companies, in trading business duringthe fiscal year.
Net cash used in financing activities totaled ¥92.5 billion, compared to ¥59.9 billion for the previousfiscal year, primarily because Mitsui Fudosan increased its use of internal capital resources to fund debtreduction and restrain additional borrowing. Net increase in bank loans and commercial paper totaled¥24.3 billion, compared to a net decrease of ¥26.6 billion for the previous fiscal year, primarily reflectingthe increase in favorably priced commercial paper used for short-term working capital requirements.Proceeds from long-term debt totaled ¥180.1 billion, down substantially from ¥232.4 billion for theprevious fiscal year. Repayment of long-term debt, consisting primarily of long-term bank loans, totaled¥219.8 billion, compared to ¥289.5 billion for the previous fiscal year. Proceeds from issuance of bondtotaling ¥10.0 billion, representing the domestic issue of an unsecured yen straight bond, was downsignificantly absent the issue of ¥80.0 billion in convertible bonds in the previous fiscal year, whilepayments for redemption of bonds increased to ¥81.2 billion from ¥50.0 billion for the previous fiscal year.Net repayments of long-term debt therefore totaled ¥110.9 billion on a cash basis, reflecting MitsuiFudosan’s emphasis on reducing operating leverage and future interest expense. Cash dividends paidtotaled ¥5.8 billion, compared to ¥5.7 billion for the previous fiscal year.
The Company therefore reduced long-term interest bearing liabilities and paid cash dividends wellwithin the scope of free cash flow as defined above. This supported a net increase in cash and cashequivalents of 23.4 percent from a year earlier, or ¥26.9 billion, to ¥141.7 billion.
Risk InformationThe operations of the Mitsui Fudosan Group are subject to a number of risks, some of which are outlinedbelow along with issues that may not necessarily constitute risk factors but that may influence investordecisions.
Changes in DemandEconomic conditions influence demand among tenant companies for space in the office buildings that theMitsui Fudosan Group owns and manages, and influence demand among individuals for housing. Adownturn in the Japanese economy may exert a material impact on the Mitsui Fudosan Group’sperformance and the value of its assets.
Interest RatesHigher interest rates in the future could increase the Mitsui Fudosan Group’s funding costs, raise thereturns investors expect from real estate investments and reduce demand among individuals for housing,and may therefore exert a material impact on the Mitsui Fudosan Group’s performance and the value ofits assets.
Regulations and TaxationChanges in the regulations and systems of taxation relevant to the real estate business may exert amaterial impact on the Mitsui Fudosan Group’s performance and the value of its assets.
Natural DisastersNatural disasters may damage or destroy the Mitsui Fudosan Group’s assets, and may therefore exert amaterial impact on the Mitsui Fudosan Group’s performance and the value of its assets.
0
30
60
90
120
150
2000 2001 2002 2003 2004
101.8
141.6
60.5 57.7
120.5
Free Cash Flow(Billions of yen)
M A N A G E M E N T ’ S D I S C U S S I O N A N D A N A L Y S I S | M I T S U I F U D O S A N
3 1
(Years ended March 31)
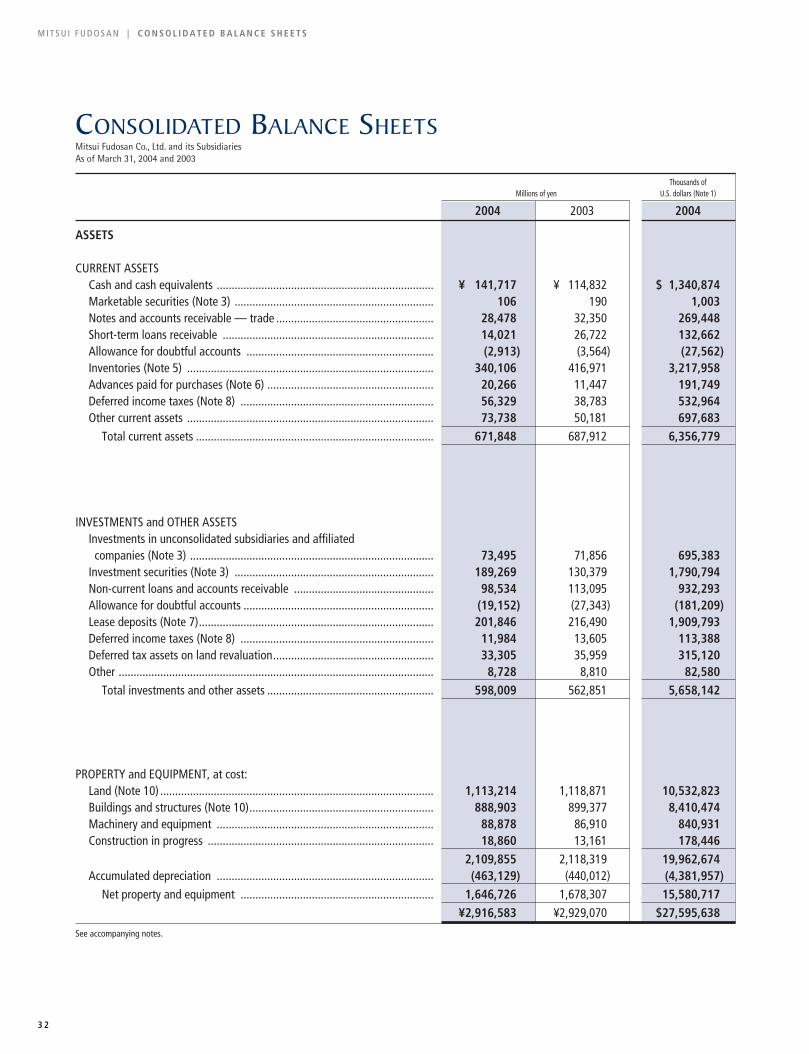
M I T S U I F U D O S A N | C O N S O L I D A T E D B A L A N C E S H E E T S
CONSOLIDATED BALANCE SHEETSMitsui Fudosan Co., Ltd. and its SubsidiariesAs of March 31, 2004 and 2003
3 2
Thousands of Millions of yen U.S. dollars (Note 1)
2004 2003 2004
ASSETS
CURRENT ASSETSCash and cash equivalents ......................................................................... ¥ 141,717 ¥ 114,832 $ 1,340,874Marketable securities (Note 3) ................................................................... 106 190 1,003Notes and accounts receivable — trade ..................................................... 28,478 32,350 269,448Short-term loans receivable ....................................................................... 14,021 26,722 132,662Allowance for doubtful accounts ............................................................... (2,913) (3,564) (27,562)Inventories (Note 5) ................................................................................... 340,106 416,971 3,217,958Advances paid for purchases (Note 6) ........................................................ 20,266 11,447 191,749Deferred income taxes (Note 8) ................................................................. 56,329 38,783 532,964Other current assets ................................................................................... 73,738 50,181 697,683
Total current assets ................................................................................ 671,848 687,912 6,356,779
INVESTMENTS and OTHER ASSETSInvestments in unconsolidated subsidiaries and affiliated companies (Note 3) .................................................................................. 73,495 71,856 695,383
Investment securities (Note 3) ................................................................... 189,269 130,379 1,790,794Non-current loans and accounts receivable ............................................... 98,534 113,095 932,293Allowance for doubtful accounts ................................................................ (19,152) (27,343) (181,209)Lease deposits (Note 7)............................................................................... 201,846 216,490 1,909,793Deferred income taxes (Note 8) ................................................................. 11,984 13,605 113,388Deferred tax assets on land revaluation...................................................... 33,305 35,959 315,120Other .......................................................................................................... 8,728 8,810 82,580
Total investments and other assets ........................................................ 598,009 562,851 5,658,142
PROPERTY and EQUIPMENT, at cost:Land (Note 10) ............................................................................................ 1,113,214 1,118,871 10,532,823Buildings and structures (Note 10).............................................................. 888,903 899,377 8,410,474Machinery and equipment ......................................................................... 88,878 86,910 840,931Construction in progress ............................................................................ 18,860 13,161 178,446
............................................................................................................... 2,109,855 2,118,319 19,962,674Accumulated depreciation ......................................................................... (463,129) (440,012) (4,381,957)
Net property and equipment ................................................................. 1,646,726 1,678,307 15,580,717............................................................................................................... ¥2,916,583 ¥2,929,070 $27,595,638
See accompanying notes.

C O N S O L I D A T E D B A L A N C E S H E E T S | M I T S U I F U D O S A N
3 3
Thousands of Millions of yen U.S. dollars (Note 1)
2004 2003 2004
LIABILITIES, MINORITY INTERESTS IN CONSOLIDATEDSUBSIDIARIES AND SHAREHOLDERS’ EQUITY
CURRENT LIABILITIESBanks loans (Note 10) ................................................................................ ¥ 45,036 ¥ 36,816 $ 426,114Commercial paper ...................................................................................... 37,000 18,000 350,080Long-term debt due within one year (Note 10) .......................................... 193,174 238,881 1,827,742Notes and accounts payable — trade ........................................................ 117,965 91,823 1,116,142Accrued expenses ...................................................................................... 17,850 17,839 168,890Income taxes payable ................................................................................ 16,975 3,398 160,611Advances and deposits received ................................................................ 149,530 145,582 1,414,798Other current liabilities .............................................................................. 37,762 48,789 357,290
Total current liabilities ........................................................................... 615,292 601,128 5,821,667
LONG-TERM LIABILITIESAllowance for employees’ retirement benefits (Note 9) .............................. 23,420 20,530 221,591Allowance for directors’ and corporate auditors’ retirement benefits ........ 1,683 2,083 15,924Long-term debt due after one year (Note 10) ............................................ 1,046,292 1,103,514 9,899,631Deposits from tenants (Note 11) ................................................................ 291,322 307,786 2,756,382Deferred income taxes (Note 8) ................................................................. 46,099 22,604 436,172Deferred tax liabilities on land revaluation ................................................. 151,019 156,438 1,428,886Other liabilities and deferred credits .......................................................... 66,317 69,367 627,468
Total long-term liabilities........................................................................ 1,626,152 1,682,322 15,386,054
MINORITY INTERESTS IN CONSOLIDATED SUBSIDIARIES ............................... 15,974 17,186 151,140
CONTINGENT LIABILITIES (Note 17)
SHAREHOLDERS’ EQUITY (Note 12)Common stock
Authorized—1,770,000,000 sharesIssued— 823,390,384 shares in 2004 and 2003 .................................... 134,433 134,433 1,271,956
Additional paid-in capital ........................................................................... 205,823 205,823 1,947,422Reserve on land revaluation........................................................................ 158,227 162,289 1,497,086Retained earnings ...................................................................................... 167,890 155,391 1,588,514Net unrealized holding gains (losses) on securities .................................... 26,317 (3,452) 249,002Foreign currency translation adjustment .................................................... (32,545) (25,010) (307,930)
............................................................................................................... 660,145 629,474 6,246,050Treasury stock ............................................................................................. (980) (1,040) (9,273)
Total shareholders’ equity ...................................................................... 659,165 628,434 6,236,777............................................................................................................... ¥2,916,583 ¥2,929,070 $27,595,638
See accompanying notes.

M I T S U I F U D O S A N | C O N S O L I D A T E D S T A T E M E N T S O F I N C O M E
CONSOLIDATED STATEMENTS OF INCOMEMitsui Fudosan Co., Ltd. and its SubsidiariesFor the years ended March 31, 2004, 2003 and 2002
3 4
Thousands of Millions of yen U.S. dollars (Note 1)
2004 2003 2002 2004
REVENUESRevenue from operations (Note 16)............................................. ¥1,102,844 ¥1,082,398 ¥1,152,484 $10,434,705Interest, dividends and miscellaneous (Note 13) ......................... 11,652 11,187 35,842 110,247
................................................................................................ 1,114,496 1,093,585 1,188,326 10,544,952
COSTS AND EXPENSESCost of revenue from operations ................................................. 873,627 858,584 916,845 8,265,938Selling, general and administrative expenses .............................. 119,971 120,519 132,688 1,135,122Interest ........................................................................................ 22,758 26,617 31,761 215,328Other (Note 14)............................................................................ 78,028 46,557 66,964 738,272
................................................................................................ 1,094,384 1,052,277 1,148,258 10,354,660
EQUITY IN NET INCOME OF AFFILIATED COMPANIES .................... 3,535 2,905 3,301 33,447
INCOME BEFORE INCOME TAXES .................................................... 23,647 44,213 43,369 223,739
INCOME TAXES (Note 8)Current......................................................................................... 23,915 5,516 14,608 226,275Deferred....................................................................................... (15,058) 12,820 1,106 (142,473)
Total ........................................................................................ 8,857 18,336 15,714 83,802................................................................................................ 14,790 25,877 27,655 139,937
MINORITY INTERESTS ..................................................................... (335) (323) 2,152 (3,169)
NET INCOME ................................................................................... ¥ 14,455 ¥ 25,554 ¥ 29,807 $ 136,768
Yen U.S. dollars (Note 1)
PER SHARE INFORMATION 2004 2003 2002 2004
Net assets per share .................................................................... ¥ 801.5 ¥ 764.2 ¥ 750.2 $ 7.583Net income per share— Basic ....................................................................................... 17.5 31.1 36.7 0.166— Diluted.................................................................................... 16.3 28.9 36.2 0.154Cash dividends............................................................................. 7.0 7.0 7.0 0.066
See accompanying notes.

C O N S O L I D A T E D S T A T E M E N T S O F S H A R E H O L D E R S ’ E Q U I T Y | M I T S U I F U D O S A N
CONSOLIDATED STATEMENTS OF SHAREHOLDERS’ EQUITYMitsui Fudosan Co., Ltd. and its SubsidiariesFor the years ended March 31, 2004, 2003 and 2002
3 5
Millions of yen
NetShares of unrealized Foreigncommon Additional Reserve holding gains currency
stock Common paid-in on land Retained (losses) on translation Treasury(thousands) stock capital revaluation earnings securities adjustment stock
BALANCE AT MARCH 31, 2001........................... 812,560 ¥134,433 ¥204,693 ¥ — ¥ 98,644 ¥ 729 ¥(27,397) ¥ (5)Revaluation of property and equipment.......... — — — — 368 — — —Change in number of consolidated subsidiaries .... — — — — 3,697 — — —Increase due to land revaluation ..................... — — — 156,405 10,368 — — —Net income...................................................... — — — — 29,807 — — —Cash dividends paid ........................................ — — — — (5,689) — — —Bonuses to directors........................................ — — — — (168) — — —Foreign currency translation adjustment ........ — — — — — — 7,383 —Treasury stock ................................................ — — — — — — — (98)Net unrealized holding losses on securities..... — — — — — (3,634) — —
BALANCE AT MARCH 31, 2002........................... 812,560 134,433 204,693 156,405 137,027 (2,905) (20,014) (103)Increase due to integration of MITSUI REAL ESTATE SALES Co., Ltd............. 10,830 — 1,130 — — — — —
Revaluation of property and equipment.......... — — — — 120 — — —Increase due to changes in effective tax rates .... — — — 5,884 — — — —Reversal of reserve on land revaluation, net of tax.... — — — — (1,515) — — —Other ............................................................... — — — — (3) — — —Net income...................................................... — — — — 25,554 — — —Cash dividends paid ........................................ — — — — (5,687) — — —Bonuses to directors........................................ — — — — (105) — — —Foreign currency translation adjustment ........ — — — — — — (4,996) —Treasury stock ................................................ — — — — — — — (937)Net unrealized holding losses on securities..... — — — — — (547) — —
BALANCE AT MARCH 31, 2003........................... 823,390 134,433 205,823 162,289 155,391 (3,452) (25,010) (1,040)Revaluation of property and equipment (Note 2(H)) .. — — — — (285) — — —Reversal of reserve on land revaluation, net of tax.... — — — (4,062) 4,204 — — —Other ............................................................... — — — — (6) — — —Net income...................................................... — — — — 14,455 — — —Cash dividends paid ........................................ — — — — (5,756) — — —Bonuses to directors........................................ — — — — (113) — — —Foreign currency translation adjustment ........ — — — — — — (7,535) —Treasury stock ................................................ — — — — — — — 60Net unrealized holding gains on securities...... — — — — — 29,769 — —
BALANCE AT MARCH 31, 2004........................... 823,390 ¥134,433 ¥205,823 ¥158,227 ¥167,890 ¥26,317 ¥(32,545) ¥ (980)
Thousands of U.S. dollars (Note 1)
BALANCE AT MARCH 31, 2003........................... $1,271,956 $1,947,422 $1,535,519 $1,470,253 $(32,662) $(236,635) $(9,840) Revaluation of property and equipment (Note 2(H)) .. — — — (2,697) — — —Reversal of reserve on land revaluation, net of tax ... — — (38,433) 39,777 — — —Other ............................................................... — — — (57) — — —Net income...................................................... — — — 136,768 — — —Cash dividends paid ........................................ — — — (54,461) — — —Bonuses to directors........................................ — — — (1,069) — — —Foreign currency translation adjustment ........ — — — — — (71,295) —Treasury stock ................................................ — — — — — — 567Net unrealized holding gains on securities...... — — — — 281,664 — —
BALANCE AT MARCH 31, 2004........................... $1,271,956 $1,947,422 $1,497,086 $1,588,514 $249,002 $(307,930) $(9,273)
See accompanying notes.

M I T S U I F U D O S A N | C O N S O L I D A T E D S T A T E M E N T S O F C A S H F L O W S
3 6
CONSOLIDATED STATEMENTS OF CASH FLOWSMitsui Fudosan Co., Ltd. and its SubsidiariesFor the years ended March 31, 2004, 2003 and 2002
Thousands ofMillions of yen U.S. dollars (Note 1)
2004 2003 2002 2004
Cash flows from operating activities:Income before income taxes.................................................................... ¥ 23,647 ¥ 44,213 ¥ 43,369 $ 223,739Adjustments to reconcile income before income taxes to net cash
provided by operating activitiesDepreciation and amortization ........................................................... 40,415 39,782 47,540 382,392Equity in net income of affiliated companies ...................................... (3,535) (2,904) (3,301) (33,447)Gain on sales of property and equipment, net.................................... (411) (2,192) (19,536) (3,889)Loss on disposal of property and equipment ...................................... 855 5,491 419 8,090Allowance for doubtful accounts, net ................................................. 1,040 1,963 6,491 9,840Loss on devaluation of real property for sale...................................... 64,231 — 444 607,730Loss on disposal of real property for sale............................................ — 1,575 — —Interest and dividend income ............................................................. (3,163) (3,370) (3,829) (29,927)Interest expense ................................................................................. 22,758 26,617 31,761 215,328Loss on devaluation of other securities............................................... — 20,267 21,296 —Gain on sales of marketable securities, net ........................................ (4,669) (672) (1,716) (44,176)Loss incurred in certain housing project ............................................. — 2,333 — —Non-recurring depreciation (Note 14)................................................. — — 18,477 —Compensation received for retirement of property ............................. — — (3,015) —Decrease in accounts receivable ......................................................... 3,962 77 4,776 37,487Decrease in real property for sale and advances paid for purchases... 35,951 49,916 2,988 340,155Decrease in accounts payable............................................................. (2,711) (2,143) (14,180) (25,650)Bonuses paid to directors ................................................................... (117) (105) (192) (1,107)Interests and dividends received......................................................... 3,819 4,070 4,784 36,134Interests paid ...................................................................................... (22,652) (26,658) (32,155) (214,325)Income taxes paid............................................................................... (5,765) (16,436) (9,395) (54,546)Other, net ........................................................................................... (12,055) (23,339) 47,096 (114,061)
Net cash provided by operating activities ...................................... 141,600 118,485 142,122 1,339,767Cash flows from investing activities:
Purchase of property and equipment....................................................... (45,120) (55,071) (57,124) (426,909)Proceeds from sale of property and equipment ....................................... 13,442 16,191 39,310 127,183Increase in deposits from tenants ............................................................ 51,100 39,448 27,252 483,489Decrease in deposits from tenants........................................................... (63,605) (57,027) (45,689) (601,807)Increase in lease deposits ........................................................................ (18,962) (10,862) (4,360) (179,411)Decrease in lease deposits....................................................................... 30,845 18,483 18,958 291,844Purchase of marketable and investment securities .................................. (14,957) (20,266) (38,243) (141,518)Proceeds from sale of marketable and investment securities .................. 11,526 3,770 4,642 109,055Increase in non-current loans and accounts receivable............................ (6,404) (22,243) (19,999) (60,592)Decrease in non-current loans and accounts receivable .......................... 26,090 24,457 14,948 246,854Other, net ................................................................................................ (5,077) 2,368 (21,353) (48,037)
Net cash used in investing activities .............................................. (21,122) (60,752) (81,658) (199,849)Cash flows from financing activities:
Proceeds from long-term debt ................................................................. 180,140 232,350 299,393 1,704,419Repayment of long-term debt.................................................................. (219,781) (289,504) (187,982) (2,079,487)Increase (Decrease) in bank loans and commercial paper ....................... 24,250 (26,553) (188,908) 229,445Proceeds from issuance of bond .............................................................. 10,000 80,000 — 94,616Payments for redemption of bond ........................................................... (81,242) (50,000) (20,000) (768,682)Cash dividends paid................................................................................. (5,757) (5,698) (5,690) (54,471)Proceeds from issuance of shares to minority shareholders..................... — 15 285 —Payment of dividends to minority shareholders ....................................... (554) (524) (397) (5,242)Sale of treasury stocks ............................................................................. 434 17 — 4,106
Net cash used in financing activities.............................................. (92,510) (59,897) (103,299) (875,296)Effect of exchange rate changes on cash and cash equivalents.................... (1,083) (563) 1,958 (10,246)Net increase (decrease) in cash and cash equivalents .................................. 26,885 (2,727) (40,877) 254,376Cash and cash equivalents at beginning of year........................................... 114,832 117,559 158,436 1,086,498Cash and cash equivalents at end of year .................................................... ¥141,717 ¥114,832 ¥117,559 $1,340,874See accompanying notes.
Millions of yen
Additional paid in capital.............. ¥1,130Supplemental information of non-cash transaction:Non-cash investing and financing activities for the year ended March 31, 2003;Issuance of common stock by stock-for-stock transfer for
integration of MITSUI REAL ESTATE SALES Co., Ltd.

N O T E S T O C O N S O L I D A T E D F I N A N C I A L S T A T E M E N T S | M I T S U I F U D O S A N
3 7
NOTES TO CONSOLIDATED FINANCIAL STATEMENTSMitsui Fudosan Co., Ltd. and its Subsidiaries
1. BASIS OF PRESENTING CONSOLIDATED FINANCIAL STATEMENTS
The accompanying consolidated financial statements of MitsuiFudosan Co., Ltd. (the “Company”) have been prepared inaccordance with the provisions set forth in the Japanese Securitiesand Exchange Law and its related accounting regulations, and inconformity with accounting principles generally accepted in Japan,which are different in certain respects as to application and disclosurerequirements of International Financial Reporting Standards.
The accounts of overseas subsidiaries are based on theiraccounting records maintained in conformity with generally acceptedaccounting principles prevailing in the respective countries ofdomicile. The accompanying consolidated financial statements havebeen restructured and translated into English (with some expandeddescriptions and the inclusion of consolidated statements ofshareholders’ equity) from the consolidated financial statements of
the Company prepared in accordance with Japanese GAAP andfiled with the appropriate Local Finance Bureau of the Ministry ofFinance as required by the Securities and Exchange Law. Somesupplementary information included in the statutory Japaneselanguage consolidated financial statements, but not required for fairpresentation, is not presented in the accompanying consolidatedfinancial statements.
The translations of the Japanese yen amounts into U.S. dollarsare included solely for the convenience of readers, using theprevailing exchange rate at March 31, 2004, which was ¥105.69 toU.S. $1.00. The convenience translations should not be construed asrepresentations that the Japanese yen amounts have been, couldhave been, or could in the future be, converted into U.S. dollars atthis or any other rate of exchange.
2. SIGNIFICANT ACCOUNTING POLICIES
(A) CONSOLIDATIONThe consolidated financial statements include the accounts of theCompany and its subsidiaries. The excess of investment cost over theCompany’s share of the underlying equity in the net assets of theconsolidated subsidiary at the date of acquisition is amortized overfive years on a straight-line basis. However, for amounts that aredifficult to assess, the term of occurrence and immaterial amountsare charged to income as incurred.
All significant inter-company accounts and transactions havebeen eliminated. In the elimination of investments in subsidiaries,the assets and liabilities of the subsidiaries, including the portionattributable to minority shareholders, are recorded based on the fairvalue at the time the Company acquired control of the respectivesubsidiaries.
(B) USE OF ESTIMATESThe preparation of the consolidated financial statements inconformity with the generally accepted accounting principlesrequires management to make certain estimates and assumptionsthat affect the reported amounts in the financial statements and theaccompanying notes. Actual results could differ from thoseestimates.
(C) EQUITY METHODInvestments in all significant affiliated companies are accounted forby the equity method and, accordingly, stated at cost adjusted forequity in undistributed earnings and losses from the date ofacquisition.
(D) TRANSLATION OF FOREIGN CURRENCY ACCOUNTSForeign currency receivables and payables are translated atappropriate year-end current rates and the resulting translationgains or losses are taken into income currently.
Financial statements of consolidated overseas subsidiaries aretranslated into Japanese yen at the year-end rate, except thatshareholders’ equity accounts are translated at historical rates andincome statement items resulting from transactions with theCompany at the rates used by the Company.
Differences arising from translation are presented as “Foreigncurrency translation adjustment” in shareholders’ equity.
(E) CASH AND CASH EQUIVALENTSDeposits in banks and short-term investments which are highlyliquid, readily convertible to cash and with insignificant risk ofmarket value fluctuation, with a maturity of three months or less atthe time of purchase are treated as cash equivalents.
(F) SECURITIESHeld-to-maturity securities are stated at amortized cost.
Other securities with market values are stated at market value.Unrealized gains and unrealized losses on these securities arereported, net of applicable income taxes, as a separate componentof shareholders’ equity. Realized gains and losses on sale of suchsecurities are computed using moving-average cost.
Other securities without market values are stated at moving-average cost.
The Company and its consolidated subsidiaries recognize losses

M I T S U I F U D O S A N | N O T E S T O C O N S O L I D A T E D F I N A N C I A L S T A T E M E N T S
3 8
for the difference between the market value and the carrying amountwhen the market value significantly declines. The Company and itsconsolidated subsidiaries consider the decline to be significant whenthe market value of the other securities declines more than 50% ofthe carrying amount. When the market value of the other securitiesdeclines from 30% to less than 50% of the carrying amount, thedecline is also determined to be significant if the market value of thesecurities is considered not to be recoverable to the carrying amount.
If the net realizable value of the securities without market valuedeclines significantly below the carrying amount, it is written downto net realizable value with a corresponding charge in the statementsof income.
(G) INVENTORIES, REVENUE AND RELATED COSTSInventories are stated at cost, cost being determined mainly by thespecific identification method. Costs do not include interest andadministrative expenses incurred during or after development of realestate, which are charged to income when incurred. Revenue fromthe leasing is recognized on an accrual basis over the lease term.Revenue from sale of properties is recognized in full when deliveredand accepted by the customers. Revenue from construction work isrecognized by the completed contract method, except long-termcontracts exceeding certain amounts, which are accounted for by thepercentage-of-completion method, and related costs are recognizedas incurred.
(H) PROPERTY AND EQUIPMENT, RELATED DEPRECIATION ANDREVALUATION
Property and equipment are carried mainly at cost. Land andbuildings owned by consolidated subsidiaries in the United Kingdomand Turkey are stated at fair value, with unrealized gains and lossesexcluded from earnings and reported in a separate component ofshareholders’ equity as revaluation of property and equipment.
When disposed of, the cost and related accumulated depreciationor revaluation of property and equipment are removed from therespective accounts and the net difference, less any amounts realizedon disposal, is reflected in the statements of income.
Depreciation of property and equipment is mainly computed bythe declining-balance method over the estimated useful lives of theassets, except for those listed below which are calculated using thestraight-line method.
1. Office buildings of the Company2. Buildings acquired by the domestic consolidated subsidiaries after
April 1, 19983. Property and equipment of overseas subsidiaries
Estimated useful lives used in the computation of depreciation aregenerally as follows:
Buildings 29-50 yearsStructures 15-17 yearsMachinery 07-15 yearsEquipment 03-15 years
For buildings on fixed term leasehold, the Company computesdepreciation using the straight-line method, over its lease termassuming no residual value.
Due to the scheduled discontinuance of the LaLaport Ski DomeSSAWS operation at September 30, 2002, the Company changed itsestimated useful life for depreciation purposes as of April 1, 2001 tobe consistent with that date. Accordingly, the Company recorded anadditional depreciation amount of ¥18,477 million related to prioryears as a “Special charge due to a change in estimated useful livesof fixed assets” included in other expense in the accompanyingstatement of income for the year ended March 31, 2002.
(I) IMPAIRMENT LOSS ON FIXED ASSETS On August 9, 2002, “Opinion Concerning Establishment ofAccounting Standard for the Impairment of Fixed Assets” was issuedby the Business Accounting Deliberation Council and on October 31,2003, Financial Accounting Standards Implementation Guidance No.6 “Implementation Guidance for Accounting Standard for theImpairment of Fixed Assets” was issued by the Accounting StandardsBoard of Japan. The adoption of these standard and guidance aremandatory effective at the beginning of the fiscal year beginningafter April 1, 2005. Early application of these standard and guidanceis permitted.
The Company and its consolidated subsidiaries have not adoptedthese standard and guidance.
(J) LAND REVALUATIONPursuant to the Law Concerning Land Revaluation and the revisionsthereof, the Company and certain consolidated subsidiaries revaluedland used for business activities on March 31, 2002.
The land prices for revaluation were determined based on theappraisal prices by real estate appraisers in accordance with Article2, Paragraph 5 of the Enforcement Ordinance Concerning LandRevaluation. The difference between quoted appraisal value and thecarrying amount is recorded, net of applicable income taxes, as“Reserve on land revaluation” as a separate component ofshareholders’ equity.

N O T E S T O C O N S O L I D A T E D F I N A N C I A L S T A T E M E N T S | M I T S U I F U D O S A N
3 9
(K) ALLOWANCE FOR DOUBTFUL ACCOUNTSThe Company and its domestic consolidated subsidiaries provide fordoubtful accounts principally at an amount computed based on thehistorical bad debt ratio during a certain reference period plus anestimated uncollectible amount based on the analysis of certainindividual accounts, including claims in bankruptcy.
(L) ALLOWANCE FOR EMPLOYEES’ RETIREMENT BENEFITSThe Company has a retirement plan which provides for lump-sumpayment and annuity. Upon retirement age or at 60, a regularemployee is entitled to receive a lump-sum payment and an annuity,or in certain cases at the option of the retiring employee, the fullamount of the retirement benefits may be paid in a lump-sum. Theretirement benefits are based primarily upon the years of employee’sservice and monthly pay at the time of retirement.
The allowance and expenses for retirement benefits aredetermined based on the amounts actuarially calculated usingcertain assumptions.
The Company and its consolidated subsidiaries provide allowancefor employees’ retirement benefits at fiscal year end based on theestimated amounts of projected benefit obligation and the fair valueof the plan assets at that date.
(M) ALLOWANCE FOR DIRECTORS’ AND CORPORATE AUDITORS’RETIREMENT BENEFITS
Allowance for retirement benefits for directors and corporateauditors of the Company and its 21 consolidated subsidiaries are alsoprovided under the internal guidelines.
(N) ACCOUNTING FOR CERTAIN LEASE TRANSACTIONSFinance leases which do not transfer ownership of the leased assetsto lessees are accounted for as operating leases under accountingprinciples generally accepted in Japan.
(O) INCOME TAXESThe Company and its consolidated domestic subsidiaries are subject toa corporate tax of 30%, an inhabitant tax of approximately 6% and adeductible enterprise tax of approximately 10%, which in theaggregate resulted in a statutory income tax rate of approximately42% for the year ended March 31, 2002, 2003 and 2004.
Income taxes are provided for on the basis of income for financialstatement purposes. The tax effect of temporary differences betweenthe carrying amounts of assets and liabilities for financial statementsand income tax purposes is recognized as deferred income taxes.
According to the revised local tax law, which introduces theassessment by estimation on the basis of the size of business as toenterprise taxes effective for the year commencing on April 1, 2004or later, the Company and its consolidated domestic subsidiaries
used the revised statutory tax rate, 40.7% for calculating the taxeffect of the temporary differences expected to be reversed afterApril 1, 2004 for the year ended March 31, 2003. As a result,deferred tax assets decreased by ¥777 million, deferred tax liabilitieson land revaluation decreased by ¥4,393 million and income taxes-deferred increased by ¥699 million compared with what would havebeen recorded under the previous local tax law at March 31, 2003.
(P) DERIVATIVES AND HEDGE ACCOUNTINGThe Company and its consolidated subsidiaries defer recognition ofgains or losses resulting from changes in fair value of derivativefinancial instruments until the related losses or gains on the hedgeditems are recognized, if derivative financial instruments are used ashedges and meet certain hedging criteria.
However, in cases where forward foreign exchange contracts areused as hedges and meet certain hedging criteria, forward foreignexchange contracts and hedged items are accounted for in thefollowing manner:
1. If a forward foreign exchange contract is executed to hedge anexisting foreign currency receivable or payable,(a) the difference, if any, between the Japanese yen amount ofthe hedged foreign currency receivable or payable translatedusing the spot rate at the inception date of the contract and thebook value of the receivable or payable is recognized in theincome statements in the period which includes the inceptiondate, and(b) the discount or premium on the contract (that is, thedifference between the Japanese yen amount of the contracttranslated using the contracted forward rate and that translatedusing the spot rate at the inception date of the contract) isrecognized over the term of the contract.
2. If a forward foreign exchange contract is executed to hedge afuture transaction denominated in a foreign currency, the futuretransaction will be recorded using the contracted forward rate,and no gains or losses on the forward foreign exchange contractare recognized. Also, if interest rate swap contracts are used ashedge and meet certain hedging criteria, the net amount to bepaid or received under the interest rate swap contract is added toor deducted from the interest on the assets or liabilities for whichthe swap contract was executed.
(Q) EARNINGS PER SHAREEffective April 1, 2002, the Company and its domestic consolidatedsubsidiaries adopted the new accounting standard for earnings pershare and related guidance (Accounting Standards Board StatementNo. 2, “Accounting Standard for Earnings Per Share” and FinancialStandards Implementation Guidance No. 4, “Implementation

M I T S U I F U D O S A N | N O T E S T O C O N S O L I D A T E D F I N A N C I A L S T A T E M E N T S
4 0
Guidance for Accounting Standard for Earnings Per Share,” issued bythe Accounting Standards Board of Japan on September 25, 2002).
Net assets per share and net income per share for the year endedMarch 31, 2002 would have been reported as follows, if this newaccounting standard were applied retroactively.
Yen
Net assets per share..................................................... ¥750.2Net income per share
— Basic ............................................................. 36.5— Diluted.......................................................... 36.0
(R) TREASURY STOCK AND REDUCTION OF STATUTORY RESERVESEffective April 1, 2002, the Company adopted the new accountingstandard for treasury stock and reversal of statutory reserves(Accounting Standards Board Statement No. 1, “AccountingStandard for Treasury Stock and Reduction of Statutory Reserves,”issued by the Accounting Standards Board of Japan on February 21,2002). The effect on net income of the adoption of the newaccounting standard was immaterial.
(S) RECLASSIFICATIONSCertain prior years’ amounts have been reclassified to conform to the2004 presentation. These changes had no impact on previouslyreported results of operations.
3. MARKET VALUE INFORMATION OF MARKETABLE SECURITIES AND INVESTMENT SECURITIES
(1) The following tables summarize historical cost, book value and market value of securities with market values as of March 31, 2004 and 2003:
(a) Held-to-maturity securities with market values
Millions of yen
2004 2003Book Market Book MarketValue Value Difference Value Value Difference
Securities whose market value exceeds book valueNational and local government bonds, etc. ........................................... ¥436 ¥446 ¥10 ¥485 ¥501 ¥16
Securities whose market value does not exceed book valueNational and local government bonds, etc. ........................................... 122 122 — 156 156 —
Total ........................................................................................................ ¥558 ¥568 ¥10 ¥641 ¥657 ¥16
Thousands of U.S. dollars
2004Book MarketValue Value Difference
Securities whose market value exceeds book valueNational and local government bonds, etc. ........................................... $4,125 $4,220 $95
Securities whose market value does not exceed book valueNational and local government bonds, etc. ........................................... 1,154 1,154 —
Total ........................................................................................................ $5,279 $5,374 $95

N O T E S T O C O N S O L I D A T E D F I N A N C I A L S T A T E M E N T S | M I T S U I F U D O S A N
4 1
(b) Other securities with market values
Millions of yen
2004 2003Historical Book Value Historical Book Value
Cost (Market Value) Difference Cost (Market Value) Difference
Securities whose book value (market value) exceeds historical costStocks................................................................................................... ¥42,682 ¥82,746 ¥40,064 ¥ 2,968 ¥ 3,617 ¥ 649Bonds
National and local government bonds, etc. .................................... 60 62 2 80 84 4Corporate bonds.............................................................................. — — — 10 10 —
Other.................................................................................................... 8,192 12,150 3,958 8,191 9,409 1,218
Subtotal ............................................................................................... 50,934 94,958 44,024 11,249 13,120 1,871Securities whose book value (market value) does not exceedhistorical cost
Stocks .................................................................................................. 4,473 4,111 (362) 49,000 41,422 (7,578)Other ................................................................................................... — — — 1 1 —
Subtotal .............................................................................................. 4,473 4,111 (362) 49,001 41,423 (7,578)
Total ........................................................................................................ ¥55,407 ¥99,069 ¥43,662 ¥60,250 ¥54,543 ¥(5,707)
Thousands of U.S. dollars
2004Historical Book Value
Cost (Market Value) Difference
Securities whose book value (market value) exceeds historical costStocks................................................................................................... $403,841 $782,912 $379,071Bonds
National and local government bonds, etc. .................................... 568 587 19Corporate bonds.............................................................................. — — —
Other.................................................................................................... 77,510 114,959 37,449
Subtotal ............................................................................................... 481,919 898,458 416,539Securities whose book value (market value) does not exceedhistorical cost
Stocks................................................................................................... 42,322 38,897 (3,425)Other.................................................................................................... — — —
Subtotal ............................................................................................... 42,322 38,897 (3,425)
Total ........................................................................................................ $524,241 $937,355 $413,114
(2) The following tables summarize other securities sold in the years ended March 31, 2004, 2003 and 2002:
Millions of yen
2004 2003 2002Sales amount Gains Losses Sales amount Gains Losses Sales amount Gains Losses
¥11,030 ¥4,669 ¥160 ¥3,282 ¥678 ¥70 ¥2,407 ¥1,170 ¥187
Thousands of U.S. dollars
2004Sales amount Gains Losses
$104,362 $44,176 $1,514

M I T S U I F U D O S A N | N O T E S T O C O N S O L I D A T E D F I N A N C I A L S T A T E M E N T S
4 2
(3) The following tables summarize the book value of securities without market value as of March 31, 2004 and 2003:
Millions of yen Thousands of U.S. dollars
2004 2003 2004
Other securitiesUnlisted stocks (excluding OTC securities).................................................... ¥32,348 ¥31,499 $306,065Other (preferred securities and other) ........................................................... 57,257 43,782 541,745
(4) The redemption schedule on held-to-maturity securities and other securities as of March 31, 2004 and 2003 is shown as follows:
Millions of yen
2004Due after 1 Due after 5
Due within Year and within Years and Due after1 Year 5 Years within 10 Years 10 Years
National and local government bonds, etc. ................................................. ¥116 ¥514 ¥ — ¥ —
Total ............................................................................................................ ¥116 ¥514 ¥ — ¥ —
2003Due after 1 Due after 5
Due within Year and within Years and Due after1 Year 5 Years within 10 Years 10 Years
National and local government bonds, etc. ................................................. ¥198 ¥350 ¥190 ¥ —Corporate bonds ........................................................................................... 10 — — —
Total ............................................................................................................ ¥208 ¥350 ¥190 ¥ —
Thousands of U.S. dollars
2004Due after 1 Due after 5
Due within Year and within Years and Due after1 Year 5 Years within 10 Years 10 Years
National and local government bonds, etc. ................................................. $1,098 $4,863 $ — $ —
Total ............................................................................................................ $1,098 $4,863 $ — $ —

N O T E S T O C O N S O L I D A T E D F I N A N C I A L S T A T E M E N T S | M I T S U I F U D O S A N
4 3
4. DERIVATIVE FINANCIAL INSTRUMENTS AND HEDGING TRANSACTIONS
The Company and its consolidated subsidiaries use forward foreignexchange contracts and interest rate swaps contracts as derivativefinancial instruments only for the purpose of mitigating future risksof fluctuation of foreign currency exchange rates and interest rateincreases.
Forward foreign currency and interest rate swap contracts aresubject to risks of foreign exchange rate changes and interest ratechanges, respectively.
The derivative transactions are executed and managed by theCompany’s Accounting and Finance Department in accordance withthe established policies and within the specified limits on theamounts of derivative transactions allowed.
The Company and its consolidated subsidiaries do not usederivative financial instruments for speculative trading purposes. Thederivative financial instruments are executed with creditworthyfinancial institutions, and the Company’s management believesthere is little risk of default by counterparties.
The following summarizes hedging derivative financialinstruments used by the Companies and its consolidated subsidiariesand items hedged:
Hedging instruments:Forward foreign exchange contractsForeign currency swap contractsInterest rate swap contracts
Hedged items:Expected foreign currency transactionsForeign currency debtBorrowings and debentures
Forward foreign exchange contracts are executed within thescope of ordinary payments and receipts in foreign currency to hedgeagainst market fluctuation risks. Interest rate swap contracts areexecuted on a provisional basis to hedge against market fluctuationrisks.
The assessment of hedge effectiveness is omitted becausesignificant terms of hedging instruments and those of the itemshedged are the same and the risk of changes in foreign exchangerates and interest rates would be entirely eliminated.
5. INVENTORIES
Inventories at March 31, 2004 and 2003 comprised the following:
Millions of yen Thousands of U.S. dollars
2004 2003 2004
Real property for sale.................................................................................... ¥323,308 ¥397,547 $3,059,022Expenditure on contracts in progress............................................................ 8,211 10,233 77,689Other ............................................................................................................ 8,587 9,191 81,247
............................................................................................................ ¥340,106 ¥416,971 $3,217,958
6. ADVANCES PAID FOR PURCHASES
Advances paid for purchases comprise primarily advance payments for purchasing real estate for sale.
7. LEASE DEPOSITS
The Company and its consolidated subsidiaries lease certain officebuildings and retail facilities from the owners thereof and subleasethem to subtenants. In these transactions, the Company and its
consolidated subsidiaries pay lease deposits to the owners andreceive deposits from subtenants. (See Note 11)

M I T S U I F U D O S A N | N O T E S T O C O N S O L I D A T E D F I N A N C I A L S T A T E M E N T S
4 4
8. INCOME TAXES
Significant components of the Company’s deferred tax assets and liabilities as of March 31, 2004 and 2003, are as follows:
Millions of yen Thousands of U.S. dollars
2004 2003 2004
Deferred tax assets:Allowance for loss on sale of real property for sale .................................... ¥ 43,019 ¥ 21,921 $ 407,030Unrealized inter-company transactions....................................................... 7,019 7,058 66,411Allowance for loss on valuation of securities .............................................. 15,920 14,100 150,629Net operating loss carryforwards ................................................................ 4,372 5,627 41,366Excess allowance for retirement benefits ................................................... 9,240 7,430 87,426Excess allowance for doubtful accounts...................................................... 6,458 6,402 61,103Excess accrued employees’ bonuses ........................................................... — 3,479 —Accrued employees’ bonuses ...................................................................... 4,371 — 41,357Unrealized loss on valuation of securities ................................................... 7 3,185 66Excess depreciation expense....................................................................... 2,245 5,748 21,241Excess prepaid expense .............................................................................. 1,514 1,208 14,325Other........................................................................................................... 16,298 11,086 154,206
Total ....................................................................................................... ¥110,463 ¥ 87,244 $1,045,160
Deferred tax liabilities:Deferred gain on sale of land and buildings for tax purposes ..................... ¥ (33,481) ¥(33,813) $ (316,785)Reversal of loss on valuation of investment in consolidated subsidiaries..... (13,655) (12,903) (129,199)Unrealized inter-company transactions....................................................... (5,676) (5,660) (53,704)Unrealized gain on valuation of securities .................................................. (18,049) (844) (170,773)Valuation differences of consolidated subsidiaries ..................................... (996) (423) (9,424)Other........................................................................................................... (16,392) (3,817) (155,095)
Total ....................................................................................................... ¥ (88,249) ¥(57,460) $ (834,980)
Net deferred tax assets.................................................................................... ¥ (22,214) ¥ 29,784 $ (210,180)
Significant differences between the statutory tax rate and the Company’s effective tax rate as of March 31, 2004 and 2002 are as follows:
2004
Statutory tax rate...................................................................................... 42.0 %(Adjustments)Equity in net income of affiliated companies ............................................ (6.3)Permanent differences:
Expense account and other ................................................................. 4.9 Dividend income and other .................................................................. (0.6)
Other ........................................................................................................ (2.5)Effective tax rate....................................................................................... 37.5 %
2002
Statutory tax rate...................................................................................... 42.0 %(Adjustments)Sale of shares in subsidiaries accounted for by the equity method........... 0.4Change in consolidated subsidiaries ......................................................... (3.5)Equity in net income of affiliated companies ............................................ (3.2)Other ........................................................................................................ 0.5Effective tax rate....................................................................................... 36.2 %
Information as of March 31, 2003 has not been disclosed as the differences are immaterial.
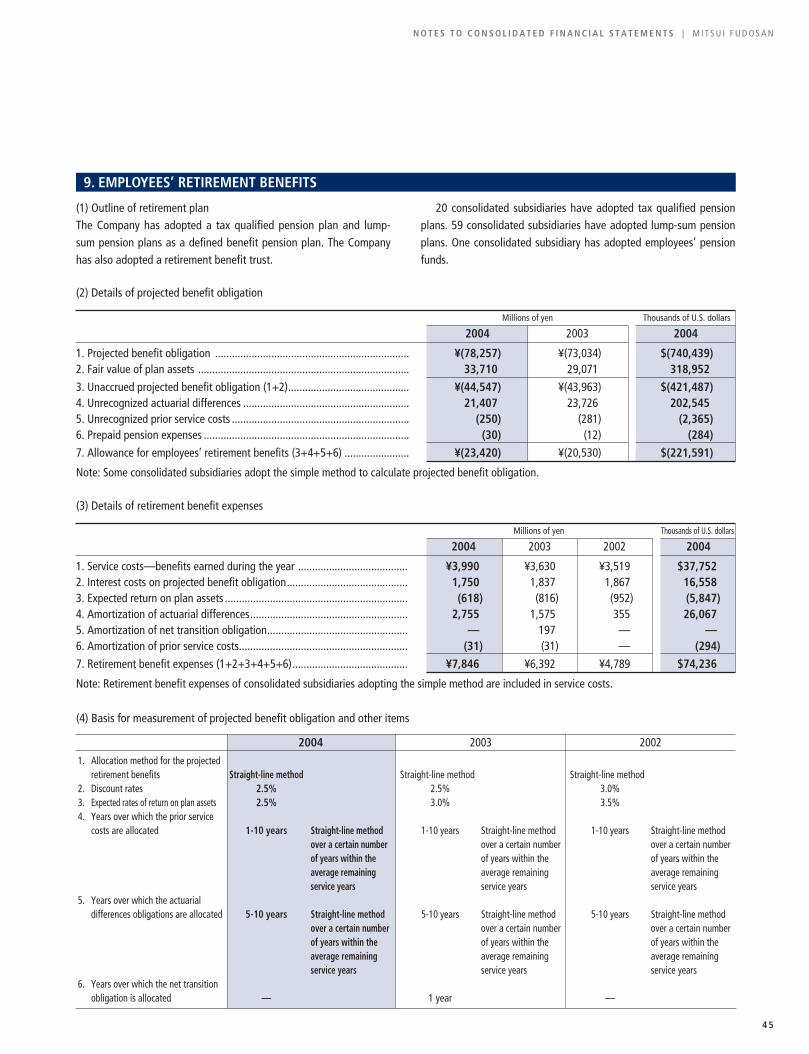
N O T E S T O C O N S O L I D A T E D F I N A N C I A L S T A T E M E N T S | M I T S U I F U D O S A N
4 5
9. EMPLOYEES’ RETIREMENT BENEFITS
(1) Outline of retirement planThe Company has adopted a tax qualified pension plan and lump-sum pension plans as a defined benefit pension plan. The Companyhas also adopted a retirement benefit trust.
20 consolidated subsidiaries have adopted tax qualified pensionplans. 59 consolidated subsidiaries have adopted lump-sum pensionplans. One consolidated subsidiary has adopted employees’ pensionfunds.
(2) Details of projected benefit obligation
Millions of yen Thousands of U.S. dollars
2004 2003 2004
1. Projected benefit obligation ..................................................................... ¥(78,257) ¥(73,034) $(740,439)2. Fair value of plan assets ........................................................................... 33,710 29,071 318,952
3. Unaccrued projected benefit obligation (1+2)........................................... ¥(44,547) ¥(43,963) $(421,487)4. Unrecognized actuarial differences ........................................................... 21,407 23,726 202,5455. Unrecognized prior service costs ............................................................... (250) (281) (2,365)6. Prepaid pension expenses ......................................................................... (30) (12) (284)
7. Allowance for employees’ retirement benefits (3+4+5+6) ....................... ¥(23,420) ¥(20,530) $(221,591)
Note: Some consolidated subsidiaries adopt the simple method to calculate projected benefit obligation.
(3) Details of retirement benefit expenses
Millions of yen Thousands of U.S. dollars
2004 2003 2002 2004
1. Service costs—benefits earned during the year ....................................... ¥3,990 ¥3,630 ¥3,519 $37,7522. Interest costs on projected benefit obligation........................................... 1,750 1,837 1,867 16,5583. Expected return on plan assets ................................................................. (618) (816) (952) (5,847)4. Amortization of actuarial differences........................................................ 2,755 1,575 355 26,0675. Amortization of net transition obligation.................................................. — 197 — —6. Amortization of prior service costs............................................................ (31) (31) — (294)
7. Retirement benefit expenses (1+2+3+4+5+6)......................................... ¥7,846 ¥6,392 ¥4,789 $74,236
Note: Retirement benefit expenses of consolidated subsidiaries adopting the simple method are included in service costs.
(4) Basis for measurement of projected benefit obligation and other items
20041. Allocation method for the projected
retirement benefits Straight-line method2. Discount rates 2.5%3. Expected rates of return on plan assets 2.5%4. Years over which the prior service
costs are allocated 1-10 years Straight-line methodover a certain numberof years within theaverage remainingservice years
5. Years over which the actuarialdifferences obligations are allocated 5-10 years Straight-line method
over a certain numberof years within theaverage remainingservice years
6. Years over which the net transitionobligation is allocated —
2003
Straight-line method2.5%3.0%
1-10 years Straight-line methodover a certain numberof years within theaverage remainingservice years
5-10 years Straight-line methodover a certain numberof years within theaverage remainingservice years
1 year
2002
Straight-line method3.0%3.5%
1-10 years Straight-line methodover a certain numberof years within theaverage remainingservice years
5-10 years Straight-line methodover a certain numberof years within theaverage remainingservice years
—

M I T S U I F U D O S A N | N O T E S T O C O N S O L I D A T E D F I N A N C I A L S T A T E M E N T S
4 6
10. BANK LOANS AND LONG-TERM DEBT
Bank loans consist of short-term notes and short-term borrowingsunder the loan agreements. The Company and its consolidatedsubsidiaries have had no difficulty in renewing such notes and
borrowings, when they considered it appropriate to do so.Long-term debt at March 31, 2004 and 2003 comprised the
following:
Millions of yen Thousands of U.S. dollars
2004 2003 2004
Long-term loans, principally from banks and insurance companies:Loans secured by collateral or bank guarantees ...................................... ¥ 62,930 ¥ 62,299 $ 595,421Unsecured loans....................................................................................... 951,536 983,854 9,003,084
............................................................................................................ 1,014,466 1,046,153 9,598,505Bonds and debenturesDomestic:
1.40% convertible debentures due 2003 ................................................. — 46,242 —2.45% yen notes due 2008 ..................................................................... 25,000 25,000 236,5411.70% yen notes due 2003 ..................................................................... — 35,000 —3.00% yen notes due 2013 ..................................................................... 10,000 10,000 94,6161.05% yen notes due 2004 ..................................................................... 10,000 10,000 94,6161.56% yen notes due 2006 ..................................................................... 10,000 10,000 94,6162.08% yen notes due 2009 ..................................................................... 10,000 10,000 94,6161.77% yen notes due 2006 ..................................................................... 10,000 10,000 94,6162.20% yen notes due 2009 ..................................................................... 10,000 10,000 94,6162.33% yen notes due 2009 ..................................................................... 10,000 10,000 94,6162.17% yen notes due 2008 ..................................................................... 5,000 5,000 47,3101.84% yen notes due 2006 ..................................................................... 10,000 10,000 94,6162.29% yen notes due 2009 ..................................................................... 10,000 10,000 94,6162.25% yen notes due 2012 ..................................................................... 5,000 5,000 47,3102.04% yen notes due 2010 ..................................................................... 10,000 10,000 94,6161.04% yen notes due 2013 ...................................................................... 10,000 — 94,616
Overseas:0% convertible bonds with stock acquisition rights due 2010 ................. 80,000 80,000 756,931
............................................................................................................ 1,239,466 1,342,395 11,727,373Less amount due within one year ................................................................. 193,174 238,881 1,827,742
............................................................................................................ ¥1,046,292 ¥1,103,514 $ 9,899,631
The following assets were pledged as collateral for secured loans:
Millions of yen Thousands of U.S. dollars
2004 2003 2004
Collateralized assetsLand ......................................................................................................... ¥ 37,763 ¥ 35,300 $ 357,300Buildings and structures and others ......................................................... 89,103 94,303 843,060
Total ............................................................................................................ ¥126,866 ¥129,603 $1,200,360

N O T E S T O C O N S O L I D A T E D F I N A N C I A L S T A T E M E N T S | M I T S U I F U D O S A N
4 7
As is customary in Japan, collateral must be given if requested,under certain circumstances, by a lending bank and such bank hasthe right to offset cash deposited with it against any debt orobligation that becomes due and, in case of default and certain otherspecified events, against all debt payable to the bank. The Companyand its consolidated subsidiaries have never received any suchrequests nor do they expect that any such request will be made.
The trust deeds, under which the 1.4% domestic convertibledebentures were issued, provided for the conversion thereof intoshares at the conversion price per share of ¥2,220.00.
Terms and conditions of the 0% convertible bonds with stockacquisition rights (“Bonds”) due 2010 are as follows:
Aggregate principal amount ¥80,000,000,000Denomination ¥2,000,000 eachConversion price ¥1,425 per shareThe issue price of the Bonds 100% of the principal amount of
the BondsExercise period of stock
acquisition rights From September 17, 2002 to July16, 2010
Maturity date July 30, 2010 unless previouslyredeemed, exercised or cancelled
If the outstanding convertible bonds had been converted atMarch 31, 2004, 56,140 thousand shares of common stock wouldhave been issued.
The annual maturities of long-term debt at March 31, 2004 were as follows:
Year ending March 31 Millions of yen Thousands of U.S. dollars
2005 ......................................................................................................... ¥ 193,174 $ 1,827,7422006 ......................................................................................................... 163,489 1,546,8732007 ......................................................................................................... 147,568 1,396,2342008 ......................................................................................................... 71,697 678,3712009 ......................................................................................................... 145,616 1,377,765Thereafter ................................................................................................. 517,922 4,900,388
Total ......................................................................................................... ¥1,239,466 $11,727,373
11. DEPOSITS FROM TENANTS
Deposits from tenants at March 31, 2004 and 2003 comprised the following:
Millions of yen Thousands of U.S. dollars
2004 2003 2004
Non-interest-bearing ................................................................................... ¥263,985 ¥274,356 $2,497,729 Interest-bearing ........................................................................................... 27,337 33,430 258,653
Total ............................................................................................................ ¥291,322 ¥307,786 $2,756,382
Average interest rate .................................................................................... 1.65% 1.73%
The Company and its consolidated subsidiaries generally makelease agreements with tenants under which they receive bothinterest-bearing deposits and non-interest-bearing deposits fromtenants. The non-interest-bearing deposits are not refundable during
the life of the lease. The interest-bearing deposits are generallyrefundable to the tenant in ten equal annual payments commencingin the eleventh year with an interest rate of 1.65% per annum fromthe beginning of the eleventh year.

M I T S U I F U D O S A N | N O T E S T O C O N S O L I D A T E D F I N A N C I A L S T A T E M E N T S
4 8
12. SHAREHOLDERS’ EQUITY
Under the Japanese Commercial Code (the “Code”), the entireamount of the issue price of shares is required to be accounted for ascapital, although a company may, by resolution of its board ofdirectors, account for an amount not exceeding one-half of the issueprice of the new shares as additional paid-in capital.
Effective October 1, 2001, the Code provides that an amountequal to at least 10% of cash dividends and other cashappropriations shall be appropriated and set aside as statutoryreserves until the total amount of legal reserve and additional paid-in capital equals 25% of common stock. The legal reserve andadditional paid-in capital may be used to eliminate or reduce a
deficit by resolution of the shareholders’ meeting or may becapitalized by resolution of the Board of Directors. On condition thatthe total amount of legal reserve and additional paid-in capitalremains being equal to or exceeding 25% of common stock, they areavailable for distribution by the resolution of shareholders’ meeting.Legal reserve is included in retained earnings in the accompanyingfinancial statements.
The maximum amount that the Company can distribute asdividends is calculated based on the unconsolidated financialstatements of the Company in accordance with the Code.
13. MAJOR COMPONENTS OF INTEREST, DIVIDENDS AND MISCELLANEOUS
Thousands of Millions of yen U.S. dollars
Years ended March 31, 2004 2003 2002 2004
Interest income ............................................................................................. ¥ 1,220 ¥ 1,376 ¥ 2,042 $ 11,543Dividend income ........................................................................................... 1,943 1,993 1,788 18,384Gain on sale of fixed assets .......................................................................... 411 3,687 23,612 3,889Gain on sale of shares in affiliated companies.............................................. — 90 585 —Gain on sale of investment securities ........................................................... 4,669 582 1,129 44,176Compensation received for retirement of property ....................................... — — 3,015 —Other ............................................................................................................ 3,409 3,459 3,671 32,255
Total ............................................................................................................ ¥11,652 ¥11,187 ¥35,842 $110,247
14. MAJOR COMPONENTS OF COSTS AND EXPENSES — OTHER
Thousands of Millions of yen U.S. dollars
Years ended March 31, 2004 2003 2002 2004
Provision for doubtful accounts .................................................................... ¥ 1,518 ¥ 1,963 ¥ 6,491 $ 14,363Loss on sale of fixed assets........................................................................... — 1,494 4,077 —Loss on disposal of fixed assets ................................................................... 855 5,491 418 8,090Loss on devaluation of other securities......................................................... — 20,267 21,296 —Loss on investments in affiliated companies................................................. — 492 914 —Special charge due to a change in estimated useful lives of fixed assets (Note 2 (H))................................................................................................. — — 18,477 —
Loss on devaluation of real property for sale ................................................ 64,231 — 443 607,730Loss on disposal of real property for sale...................................................... — 1,575 — —Loss incurred in certain housing project........................................................ — 2,333 — —Other ............................................................................................................ 11,424 12,942 14,848 108,089
Total ............................................................................................................ ¥78,028 ¥46,557 ¥66,964 $738,272
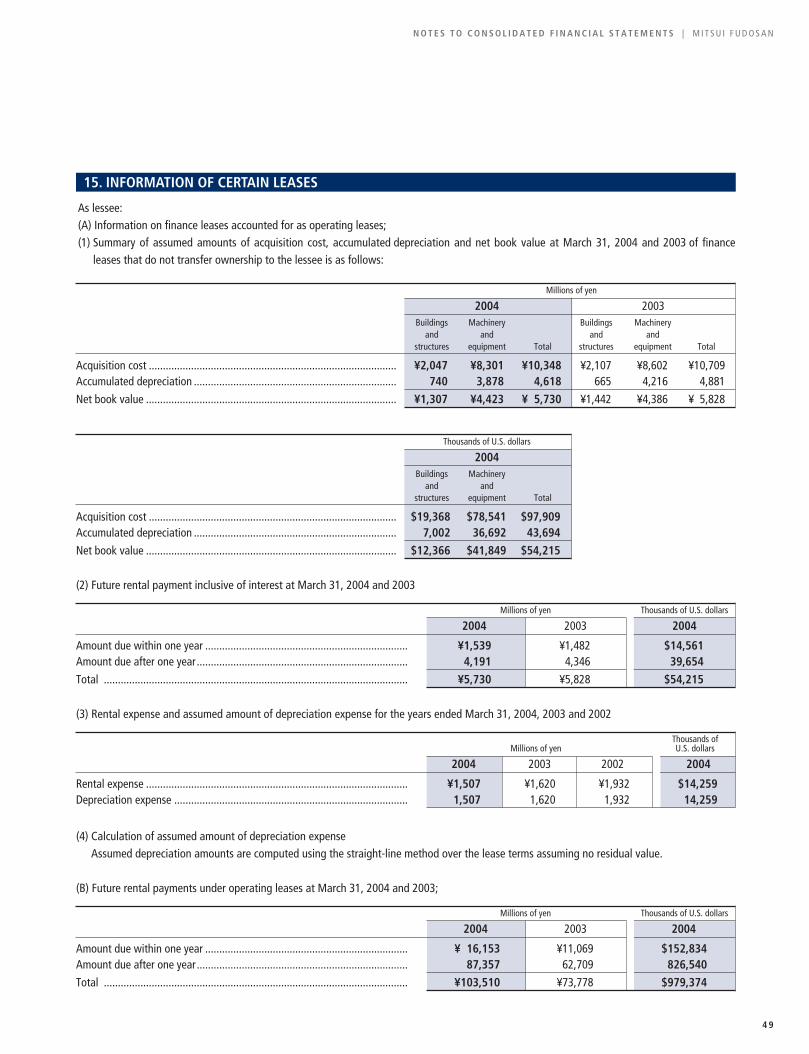
N O T E S T O C O N S O L I D A T E D F I N A N C I A L S T A T E M E N T S | M I T S U I F U D O S A N
4 9
15. INFORMATION OF CERTAIN LEASES
As lessee:(A) Information on finance leases accounted for as operating leases;(1) Summary of assumed amounts of acquisition cost, accumulated depreciation and net book value at March 31, 2004 and 2003 of finance
leases that do not transfer ownership to the lessee is as follows:
Millions of yen
2004 2003Buildings Machinery Buildings Machinery
and and and andstructures equipment Total structures equipment Total
Acquisition cost ........................................................................................ ¥2,047 ¥8,301 ¥10,348 ¥2,107 ¥8,602 ¥10,709Accumulated depreciation ........................................................................ 740 3,878 4,618 665 4,216 4,881
Net book value ......................................................................................... ¥1,307 ¥4,423 ¥ 5,730 ¥1,442 ¥4,386 ¥ 5,828
Thousands of U.S. dollars
2004Buildings Machinery
and andstructures equipment Total
Acquisition cost ........................................................................................ $19,368 $78,541 $97,909Accumulated depreciation ........................................................................ 7,002 36,692 43,694
Net book value ......................................................................................... $12,366 $41,849 $54,215
(2) Future rental payment inclusive of interest at March 31, 2004 and 2003
Millions of yen Thousands of U.S. dollars
2004 2003 2004
Amount due within one year ........................................................................ ¥1,539 ¥1,482 $14,561Amount due after one year........................................................................... 4,191 4,346 39,654
Total ............................................................................................................ ¥5,730 ¥5,828 $54,215
(3) Rental expense and assumed amount of depreciation expense for the years ended March 31, 2004, 2003 and 2002
Thousands of Millions of yen U.S. dollars
2004 2003 2002 2004
Rental expense ............................................................................................. ¥1,507 ¥1,620 ¥1,932 $14,259Depreciation expense ................................................................................... 1,507 1,620 1,932 14,259
(4) Calculation of assumed amount of depreciation expenseAssumed depreciation amounts are computed using the straight-line method over the lease terms assuming no residual value.
(B) Future rental payments under operating leases at March 31, 2004 and 2003;
Millions of yen Thousands of U.S. dollars
2004 2003 2004
Amount due within one year ........................................................................ ¥ 16,153 ¥11,069 $152,834Amount due after one year........................................................................... 87,357 62,709 826,540
Total ............................................................................................................ ¥103,510 ¥73,778 $979,374
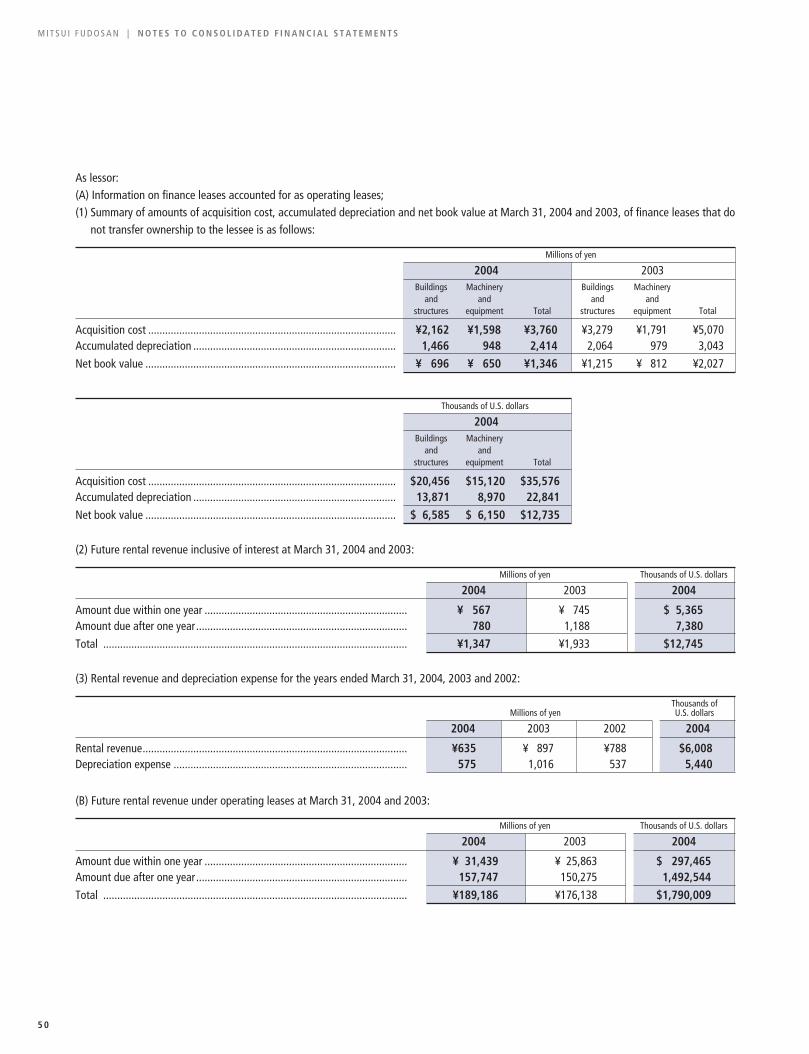
M I T S U I F U D O S A N | N O T E S T O C O N S O L I D A T E D F I N A N C I A L S T A T E M E N T S
5 0
As lessor:(A) Information on finance leases accounted for as operating leases;(1) Summary of amounts of acquisition cost, accumulated depreciation and net book value at March 31, 2004 and 2003, of finance leases that do
not transfer ownership to the lessee is as follows:
Millions of yen
2004 2003Buildings Machinery Buildings Machinery
and and and andstructures equipment Total structures equipment Total
Acquisition cost ........................................................................................ ¥2,162 ¥1,598 ¥3,760 ¥3,279 ¥1,791 ¥5,070Accumulated depreciation ........................................................................ 1,466 948 2,414 2,064 979 3,043
Net book value ......................................................................................... ¥ 696 ¥ 650 ¥1,346 ¥1,215 ¥ 812 ¥2,027
Thousands of U.S. dollars
2004Buildings Machinery
and andstructures equipment Total
Acquisition cost ........................................................................................ $20,456 $15,120 $35,576Accumulated depreciation ........................................................................ 13,871 8,970 22,841
Net book value ......................................................................................... $ 6,585 $ 6,150 $12,735
(2) Future rental revenue inclusive of interest at March 31, 2004 and 2003:
Millions of yen Thousands of U.S. dollars
2004 2003 2004
Amount due within one year ........................................................................ ¥ 567 ¥ 745 $ 5,365Amount due after one year........................................................................... 780 1,188 7,380
Total ............................................................................................................ ¥1,347 ¥1,933 $12,745
(3) Rental revenue and depreciation expense for the years ended March 31, 2004, 2003 and 2002:
Thousands of Millions of yen U.S. dollars
2004 2003 2002 2004
Rental revenue.............................................................................................. ¥635 ¥ 897 ¥788 $6,008Depreciation expense ................................................................................... 575 1,016 537 5,440
(B) Future rental revenue under operating leases at March 31, 2004 and 2003:
Millions of yen Thousands of U.S. dollars
2004 2003 2004
Amount due within one year ........................................................................ ¥ 31,439 ¥ 25,863 $ 297,465Amount due after one year........................................................................... 157,747 150,275 1,492,544
Total ............................................................................................................ ¥189,186 ¥176,138 $1,790,009

N O T E S T O C O N S O L I D A T E D F I N A N C I A L S T A T E M E N T S | M I T S U I F U D O S A N
5 1
16. SEGMENT INFORMATION
(1) LeasingLeasing of office buildings, retail facilities, residential properties, etc.(2) Sales of Housing, Office Buildings and LandSales of detached housing, condominiums, buildings, and land, etc.(3) ConstructionConstruction of detached housing, flats, etc. (including planning anddesign).(4) Brokerage, Consignment Sales and ConsultingReal estate agency, sales agency, and sales consignment services, aswell as project management services for development of officebuildings, retail facilities, etc., and asset management services forinvestors. Mitsui Real Estate Sales, which is mainly involved in thissegment, became a wholly owned subsidiary in October 2002, bystock-for-stock transfer.
(5) Property ManagementProperty management services. (including tenant improvement)(6) Sales of Housing Materials and MerchandiseManufacture and sales of housing materials, as well as wholesaleand retail sale of general goods. In October 2002, the supermarketarm of Uni Living, a “do-it-yourself” retailer, a wholly ownedsubsidiary, was sold to Maruetsu Inc.(7) Facility OperationsOperation of hotels and golf courses, etc. Skidome SSAWS (Chiba),part of this segment, was closed in September 2002.(8) OtherFinancing operations for housing loans and leasing business, etc.
Millions of yen
EliminationYear ended March 31, 2004 (1) (2) (3) (4) (5) (6) (7) (8) or Corporate Consolidated
Revenue from operations:
Outside customers ........... ¥ 332,380 ¥350,762 ¥180,503 ¥53,585 ¥77,482 ¥61,769 ¥ 37,630 ¥ 8,733 ¥ — ¥1,102,844
Inter-segment .................. 5,329 — 7,251 11,656 20,722 32,463 386 10,855 (88,662) —-
............................... 337,709 350,762 187,754 65,241 98,204 94,232 38,016 19,588 (88,662) 1,102,844
Costs and expenses* ....... 274,692 317,825 186,422 51,163 87,360 94,081 38,543 16,997 (73,485) 993,598
Operating income (loss) .. ¥ 63,017 ¥ 32,937 ¥ 1,332 ¥14,078 ¥10,844 ¥ 151 ¥ (527) ¥ 2,591 ¥ (15,177) ¥ 109,246
Assets .............................. ¥1,914,041 ¥485,771 ¥ 57,076 ¥43,973 ¥39,911 ¥49,742 ¥116,140 ¥31,633 ¥205,296 ¥2,916,583
Depreciation .................... 27,353 565 2,198 823 1,076 1,138 3,503 3,083 676 40,415
Capital expenditures ....... 23,204 1,396 2,412 1,578 964 2,043 1,754 1,968 520 35,839
Millions of yen
EliminationYear ended March 31, 2003 (1) (2) (3) (4) (5) (6) (7) (8) or Corporate Consolidated
Revenue from operations:
Outside customers............ ¥ 329,671 ¥335,341 ¥183,091 ¥46,504 ¥69,589 ¥65,682 ¥ 40,880 ¥11,640 ¥ — ¥1,082,398
Inter-segment................... 5,726 — 9,304 10,098 17,554 32,183 263 10,451 (85,579) —
............................... 335,397 335,341 192,395 56,602 87,143 97,865 41,143 22,091 (85,579) 1,082,398
Costs and expenses*........ 268,834 302,751 192,068 45,605 79,430 97,760 44,499 19,555 (71,400) 979,102
Operating income (loss) ... ¥ 66,563 ¥ 32,590 ¥ 327 ¥10,997 ¥ 7,713 ¥ 105 ¥ (3,356) ¥ 2,535 ¥ (14,179) ¥ 103,295
Assets............................... ¥1,959,853 ¥454,474 ¥ 61,104 ¥32,291 ¥36,421 ¥47,925 ¥119,455 ¥33,798 ¥183,749 ¥2,929,070
Depreciation..................... 26,900 466 1,945 671 934 1,190 3,555 3,496 625 39,782
Capital expenditures ........ 48,500 770 2,488 983 778 824 3,307 2,411 1,098 61,159
*Includes cost of revenue from operations and selling, general and administrative expenses.

M I T S U I F U D O S A N | N O T E S T O C O N S O L I D A T E D F I N A N C I A L S T A T E M E N T S
5 2
Millions of yen
EliminationYear ended March 31, 2002 (1) (2) (3) (4) (5) (6) (7) (8) or Corporate Consolidated
Revenue from operations:
Outside customers ........... ¥ 331,501 ¥336,642 ¥237,243 ¥45,743 ¥67,916 ¥ 71,577 ¥ 44,968 ¥16,894 ¥ — ¥1,152,484
Inter-segment .................. 5,896 — 10,457 9,437 18,485 29,361 590 11,637 (85,863) —
............................... 337,397 336,642 247,700 55,180 86,401 100,938 45,558 28,531 (85,863) 1,152,484
Costs and expenses* ....... 265,679 309,973 252,929 37,638 78,736 99,596 49,829 27,670 (72,517) 1,049,533
Operating income (loss) .. ¥ 71,718 ¥ 26,669 ¥ (5,229) ¥17,542 ¥ 7,665 ¥ 1,342 ¥ (4,271) ¥ 861 ¥ (13,346) ¥ 102,951
Assets .............................. ¥1,984,496 ¥454,826 ¥ 60,245 ¥57,273 ¥34,802 ¥ 48,772 ¥133,920 ¥57,920 ¥196,715 ¥3,028,969
Depreciation .................... 28,436 400 2,314 687 756 1,212 26,785 4,142 1,286 66,018
Capital expenditures ....... 47,186 363 3,923 934 863 474 3,041 4,089 1,229 62,102
Thousands of U.S. dollars
EliminationYear ended March 31, 2004 (1) (2) (3) (4) (5) (6) (7) (8) or Corporate Consolidated
Revenue from operations:
Outside customers .............. $ 3,144,858 $3,318,781 $1,707,853 $507,001 $733,106 $584,436 $ 356,041 $ 82,629 $ — $10,434,705
Inter-segment ..................... 50,421 — 68,606 110,285 196,064 307,153 3,652 102,706 (838,887) —
.................................... 3,195,279 3,318,781 1,776,459 617,286 929,170 891,589 359,693 186,335 (838,887) 10,434,705
Costs and expenses* ......... 2,599,035 3,007,143 1,763,856 484,085 826,568 890,160 364,679 160,821 (695,288) 9,401,060
Operating income (loss) .... $ 596,244 $ 311,638 $ 12,603 $133,201 $102,602 $ 1,429 $ (4,986) $ 24,514 $ (143,599) $ 1,033,645
Assets ............................... $18,109,954 $4,340,723 $ 540,032 $416,056 $377,623 $470,641 $1,098,874 $299,300 $1,942,435 $27,595,638
Depreciation ........................ 258,804 5,346 20,797 7,787 10,181 10,767 33,144 29,170 6,396 382,392
Capital expenditures .......... 219,548 13,208 22,821 14,930 9,121 19,330 16,596 18,621 4,920 339,095
*Includes cost of revenue from operations and selling, general and administrative expenses.
Japan area accounted for more than 90% of the consolidatedrevenue of all segments and the total amount of segment assets.Consequently, disclosure of segment information by geographic areahas been omitted.
Overseas sales accounted for less than 10% of the consolidatedrevenue. Consequently, disclosure of overseas sales information hasbeen omitted.
17. CONTINGENT LIABILITIES
Contingent liabilities at March 31, 2004 and 2003 are as follows:
Millions of yen Thousands of U.S. dollars
2004 2003 2004
Loans guaranteed ......................................................................................... ¥163,693 ¥188,371 $1,548,803
Millions of yen Thousands of U.S. dollars
Year-end cash dividends at ¥3.5 (U.S. $0.033 ) per share ........................ ¥2,878 $27,231Bonuses to directors ................................................................................. 102 965
18. SUBSEQUENT EVENTS
(A) APPROPRIATION OF RETAINED EARNINGSOn June 29, 2004, at the 92nd Ordinary General Shareholder’s Meeting, the Company’s shareholders approved the appropriations of retainedearnings of the Company at March 31, 2004 as follows:

I N D E P E N D E N T A U D I T O R S ’ R E P O R T | M I T S U I F U D O S A N
INDEPENDENT AUDITORS’ REPORT
5 3
To the Board of Directors of
MITSUI FUDOSAN CO., LTD.:
We have audited the accompanying consolidated balance sheets of MITSUI FUDOSAN CO., LTD. and consolidated
subsidiaries as of March 31, 2004 and 2003, and the related consolidated statements of income, shareholders’
equity and cash flows for each of the three years in the period ended March 31, 2004, expressed in Japanese yen.
These consolidated financial statements are the responsibility of the Company’s management. Our responsibility is
to independently express an opinion on these consolidated financial statements based on our audits.
We conducted our audits in accordance with auditing standards generally accepted in Japan. Those standards
require that we plan and perform the audit to obtain reasonable assurance about whether the financial statements
are free of material misstatement. An audit includes examining, on a test basis, evidence supporting the amounts
and disclosures in the financial statements. An audit also includes assessing the accounting principles used and
significant estimates made by management, as well as evaluating the overall financial statement presentation. We
believe that our audits provide a reasonable basis for our opinion.
In our opinion, the consolidated financial statements referred to above present fairly, in all material respects, the
consolidated financial position of MITSUI FUDOSAN CO., LTD. and subsidiaries as of March 31, 2004 and 2003, and
the consolidated results of their operations and their cash flows for each of the three years in the period ended
March 31, 2004, in conformity with accounting principles generally accepted in Japan.
The U.S. dollar amounts in the accompanying consolidated financial statements with respect to the year ended
March 31, 2004 are presented solely for convenience. Our audit also included the translation of yen amounts into
U.S. dollar amounts and, in our opinion, such translation has been made on the basis described in Note 1 to the
consolidated financial statements.
Tokyo, Japan
June 29, 2004

Mitsui Fudosan America, Inc.1251 Avenue of the Americas Suite 800,New York, N.Y. 10020, U.S.A.Tel: 1-212-403-5600Fax: 1-212-403-5657
Halekulani Corporation700 Bishop Street Suite 600,Honolulu, Hawaii 96813, U.S.A.Tel: 1-808-526-1186Fax: 1-808-536-8794
Mitsui Fudosan (U.K.) Ltd.7th Floor, 20 Old Bailey, London, EC4M 7EP,United KingdomTel: 44-20-7489-1379Fax: 44-20-7236-2771
Mitsui Fudosan (Asia) Pte Ltd.16 Raffles Quay, #37-01 Hong Leong Building,Singapore 048581Tel: 65-6-220-8358Fax: 65-6-224-8783
(as of August 1, 2004)
HalekulaniCorporation
Mitsui Fudosan(Asia) Pte Ltd.
Mitsui FudosanAmerica,Inc.
Mitsui Fodosan(U.K.) Ltd.
Sapporo Branch
Sendai Branch
HEAD OFFICE
Chiba BranchYokohama Branch
Kansai Head Office
Hiroshima Branch
Kyushu Branch Nagoya Branch
DOMESTIC AND OVERSEAS NETWORK
Domestic NetworkHEAD OFFICEMitsui Main Building1-1, Nihonbashi-Muromachi 2-chome,Chuo-ku, Tokyo 103-0022
BRANCH OFFICESKansai Head OfficeMidosuji Mitsui Building1-3, Bingo-machi 4-chome, Chuo-ku, Osaka-shi,Osaka 541-0051
Sapporo BranchSapporo Mitsui Building1, Kitanijyo Nishi 4-chome, Chuo-ku, Sapporo-shi,Hokkaido 060-0002
Sendai BranchSendai Sanshin Building2-2, Chuo 1-chome, Aoba-ku, Sendai-shi,Miyagi 980-0021
Chiba BranchChiba Chuo Twin Building No.111-1, Chuo 1-chome, Chuo-ku, Chiba-shi,Chiba 260-0013
Yokohama BranchYokohama Creation Square5-1, Sakae-cho, Kanagawa-ku, Yokohama-shi,Kanagawa 221-0052
Nagoya BranchNagoya Mitsui Main Building24-30, Meieki Minami 1-chome, Nakamura-ku,Nagoya-shi,Aichi 450-0003
Hiroshima BranchNakamachi Mitsui Building9-12, Nakamachi, Naka-ku, Hiroshima-shi,Hiroshima 730-0037
Kyushu BranchHakata Mitsui Building10-1, Kami Gofuku-machi, Hakata-ku, Fukuoka-shi,Fukuoka 812-0036
OFFICESYokkaichi OfficeAmsquare3-31, Yasujima 1-chome, Yokkaichi-shi, Mie 510-8531
Kyoto OfficeKyoto Mitsui Building8, Naginatahoko-cho Karasuma Higashi-Hairu,Shijo-Dori Shimogyo-ku, Kyoto-shi,Kyoto 600-8008
Okayama OfficeOkayama Fukokuseimei Ekimae Building1-6, Ekimoto-machi, Okayama-shi,Okayama 700-0024
Oita OfficeOita Mitsui Building4-35, Maizuru-machi 1-chome, Oita-shi,Oita 870-0044
Kumamoto OfficeNishijima Mitsui Building1-20, Sakura-machi, Kumamoto-shi,Kumamoto 860-0805
Overseas Network
M I T S U I F U D O S A N | D O M E S T I C A N D O V E R S E A S N E T W O R K
5 4

INVESTOR INFORMATION (Parent Company)
0
300
600
900
1,200
1,500
0
150,000
120,000
90,000
60,000
30,000
FY2001Apr. 01 Mar. 02 Apr. 02 Mar. 03 Apr. 03 Mar. 04FY2002 FY2003
Common stock price range (¥) Tokyo Price Index Close
Monthly trading volume (thousand shares)
Monthly stock price range (yen)
I N V E S T O R I N F O R M A T I O N | M I T S U I F U D O S A N
5 5
Mitsui Fudosan Co., Ltd.
Head Office:1-1, Nihonbashi-Muromachi 2-chome, Chuo-ku, Tokyo,103-0022, Japan
Date of Establishment:July 15, 1941
Share Capital:¥134,433 million
Listing :Tokyo, Osaka (Ticker: 8801)
Number of Shares:Authorized: 1,770,000,000Issued and outstanding: 823,390,384
Number of Shareholders:49,594
Monthly Stock Data (TSE):
Transfer Agent:The Chuo Mitsui Trust and Banking Company, Limited
Number of Employees:1,645
URL:http://www.mitsuifudosan.co.jp/english
E-mail:[email protected]
Composition of shareholders:
Securities Companies1.26%
Others0.13%
Other Japanese Companies6.51%
Individuals9.94%
Non-Japanese Institutions34.40%
Financial Institutions47.76%
1
2
3
4 5 6
1. Nihonbashi 1-chome Building2&4. Roppongi T-Cube
3. LALA Garden Tsukuba5. Fine Court Mitaka6. Park Court Futagotamagawa
On the Cover

This annual report is printed with 100% recycled paper utilizing usedOA paper collected from office buildings managed by Mitsui Fudosan.
This report was produced in August 2004.Printed in Japan