48V to 5V, 5A Forward Converteruploads.cq-dx.ru/pdf/CS/cs5126dm.rev1.pdf · · 2014-06-3048V to...
16
48V to 5V, 5A Forward Converter a CS5126 Demonstration Manual January, 2000 - Rev. 1 CS5126DM
-
Upload
hoangxuyen -
Category
Documents
-
view
228 -
download
1
Transcript of 48V to 5V, 5A Forward Converteruploads.cq-dx.ru/pdf/CS/cs5126dm.rev1.pdf · · 2014-06-3048V to...

48V to 5V,5A Forward Converter
a CS5126 Demonstration Manual
January, 2000 - Rev. 1CS5126DM

CS5126 Demonstration Manual 2 ON Semiconductor
Description Features
• 36 to 75VDC Input Voltage Range • 5V, 5A Isolated Output• 1.62" × 1.95" Footprint• 82% Typical Efficiency• External Synchronization 170kHz to 450kHz• Input Undervoltage Shutdown and Sleep Mode• Remote Enable Input• Overcurrent Protection• Thermal Shutdown
Application Diagram
The CS5126 demonstration board is a fixed frequency,isolated, 48VDC to 5VDC forward converter. High effi-ciency over a wide input voltage range is accomplishedby powering the CS5126 controller from a flybackwinding on the forward inductor. Blanking, short cir-cuit, overload, and input undervoltage protection areall accomplished by integrated CS5126 circuitry.
+48VDC
48VRTN
SYNC
ENABLE
+5VDC
ISOLATEDRETURN
Pin Description
Pin Symbol Function
+48VDC 36 to 75VDC Input.
48VRTN Return for +48VDC Input.
SYNC Clock synchronization pin. A positive edge will terminate the current PWM cycle. Ground this pin if it is not used.
ENABLE This pin is internally pulled up and performs the UVLO function if left open. Pull this pin to between 2.3V and 2.6V to stop the converter from switching. Pull this pin to below 1.5V to put the converter in sleep mode.
+5VDC +5VDC Isolated Output.
ISOLATED RETURN Return for +5VDC Output.

ON Semiconductor 3 CS5126 Demonstration Manual
Absolute Maximum Ratings TA = 25°C
Input/Output Name Minimum Maximum Unit
+48VDC –0.3 80.0 Volts
Output Current Internally Limited Amps
SYNC –1 40 Volts
ENABLE –0.3 6.0 Volts
Isolated Return –500 +500 VDC
TA = 25°C, 36 to 75V, 200kHz, Unless Otherwise Specified
Parameter Test Condition MIN TYP MAX UNITS
Output Voltage 0.25A < IOUT < 5A 4.85 5.00 5.15 V
Load Reg. 0.25A < IOUT < 5A 0.1 %
Line Reg. 0.25A < IOUT < 5A 0.02 %
Transient Regulation & Step Between 50% and 75% 180 mVRecovery Time to within 2% of Maximum Load. 75 µs
Output Ripple and Noise 75VIN @ Full Load(20MHz BW) 60 mVP-P
Input Current Ripple 75VIN @ Full Load, 200kHz 35 mArms
Efficiency 0.5A Out, 60% %5A Out 82% %
Enable / S.S. Time Full Load 4 ms
Enable (Turn-on) 2.30 2.45 2.60 VThreshold
Enable Hysteresis 170 185 200 mV
Sleep Mode (Turn-off) 1.50 1.83 2.30 VThreshold
Sleep Mode Hysteresis 35.0 85.0 1.5 mV
Enable Pin Source Current Enable Pin = 0V 1 mA
Sleep Mode Input Current 75VIN 2 3 mA
Undervoltage Lockout 28 31 33 Volts(Turn-off)
Undervoltage Lockout 31 33 35 V(Turn-on)
Undervoltage Lockout 2 VHysteresis
SYNC Threshold 2 4 6 V
SYNC Frequency Range VIN > 48V for frequencies 170 450 kHzabove 250kHz
Overcurrent Limit VIN = 36V 5.7 AThreshold VIN = 75V 6.0
Oscillator Freq. Free running 170 200 230 kHz
Electrical Characteristics

CS5126 Demonstration Manual 4 ON Semiconductor
Demonstration Board Operation Guidelines
Demonstration Board Schematic
Input Power
The converter is designed to run with an input voltagebetween 36VDC to 75VDC. Approximately 0.87A ofcurrent is required for full load with a 36V input.
Output Load
An external load is required for the demo board to runnormally at fixed frequency. If the demo board is run
with a load less than 150mA the output will be regulat-ed at 5V in hiccup mode.
SYNC
The Sync threshold is scaled to allow the converter tobe synchronized to a typical MOSFET gate drive levels.When the converter is not being synchronized to anexternal source this pin should be tied low.
Figure 1. Circuit Schematic
ON Semiconductor 5 CS5126 Demonstration Manual
Theory of Operation
Enable/UVLO
R2 and R6 form a divider for the UVLO function. If theENABLE pin of the supply is left open it will operate inone of three modes depending on the input voltage.For VIN less than 18V the supply will be in sleep mode.For VIN between 18V and 31V the PWM section is dis-abled. If VIN exceeds 35V the supply operate normally.
The ENABLE pin can also be controlled by open collec-tor logic to perform an ENABLE function. Any time theENABLE pin is below 1.5V the supply will be in sleepmode and input current will be less than 3mA.
VCC BiasR1 and D3 provide a reference for Q1 high to regulateVcc at about 9V when the converter is not running.When the converter is running normally, the flybackwinding of T1 is clamped at 12V (in proportion to theoutput voltage), the base of Q1 is reverse biased andVcc is powered from T1.
Current Sensing
R4 is the current sense resistor. The turn-on spikes,shown in Figures 11-13, are blanked internally by theCS5126. During heavy load conditions the primary cur-
rent is pulse by pulse limited as shown in Figures 14and 15. Under conditions with high currents and fastrise-times, the converter will enter a low duty cycle hic-cup mode as shown in Figure 16.
Soft Start & Hiccup Mode
Soft Start capacitor C11 determines the Soft Start timeduring turn-on, and the dead time when the supply isoperating in hiccup mode. During Soft Start there willbe a dead time of about 1.6ms while C8 charges to 1.6 V. The ramp-up time of the output voltage will lastabout 1-2ms depending on output load.
During hiccup mode the dead time will be about 1.4mswhile C8 charges from 0.25V to 1.6V as shown inFigure 16.
Feedback
R3 and R8 divide the 5V output to the 1.24V referenceof optoisolator U2. C9 and the Thevenin resistance ofR3 and R8 set the low frequency roll-off of U2. R7 setsthe maximum current through U2’s photodiode andadjusts gain. C12 provides a phase boost near thecrossover frequency. C10 is primarily intended toimprove high frequency noise reduction.
Design Guidelines
Transformer Design and Resonant Reset
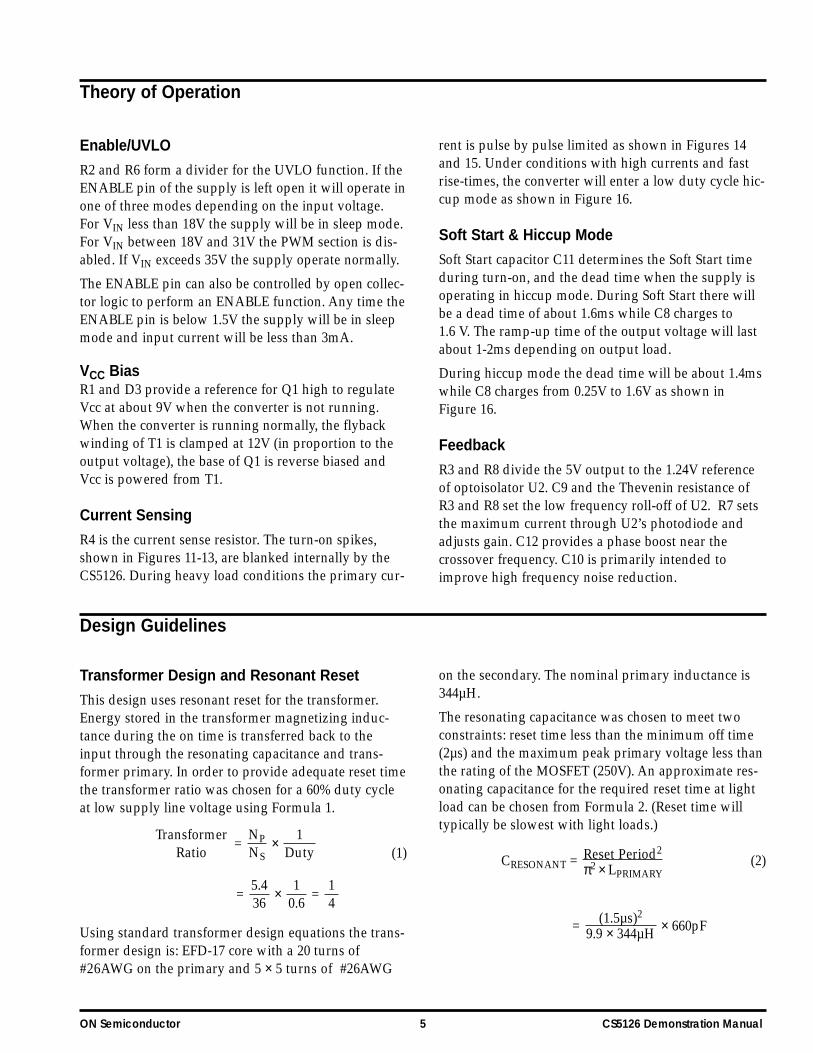
This design uses resonant reset for the transformer.Energy stored in the transformer magnetizing induc-tance during the on time is transferred back to theinput through the resonating capacitance and trans-former primary. In order to provide adequate reset timethe transformer ratio was chosen for a 60% duty cycleat low supply line voltage using Formula 1.
= ×(1)
= × =
Using standard transformer design equations the trans-former design is: EFD-17 core with a 20 turns of#26AWG on the primary and 5 × 5 turns of #26AWG
on the secondary. The nominal primary inductance is344µH.
The resonating capacitance was chosen to meet twoconstraints: reset time less than the minimum off time(2µs) and the maximum peak primary voltage less thanthe rating of the MOSFET (250V). An approximate res-onating capacitance for the required reset time at lightload can be chosen from Formula 2. (Reset time willtypically be slowest with light loads.)
CRESONANT = (2)
= × 660pF(1.5µs)2
9.9 × 344µH
Reset Period2
π2 × LPRIMARY14
10.6
5.436
1Duty
NPNS
TransformerRatio

CS5126 Demonstration Manual 6 ON Semiconductor
Design Guidelines continued
CRESONANT is made up of all capacitances associatedwith the transformer including the MOSFET draincapacitance, transformer internal capacitance and theSchottky diode capacitance. The effective IRF634 capac-itance was estimated at 150pF from the data sheet. Thevalue for the Schottky capacitance was estimated at160pF from curves on a MBRB20200CT data sheet andcontributes 10pF when reflected to the primary. Theinternal transformer primary capacitance is estimatedto be 100pF based on transformer dimensions and theinsulation thickness of #26 single build wire. These cal-culations leave 390pF to be added externally to thetransformer primary.
If the actual reset time is too long the capacitor valuecan be reduced. If the overshoot is too high and thereset period too long the transformer ratio can beadjusted for a lower duty cycle. An estimate of the peakprimary voltage can be made by calculating the energystored in the transformer during each cycle (Formula 3)and then by calculating the peak primary voltage basedon transferring the stored energy to the resonatingcapacitance (Formula 4).
ESTORED = − (3)
−
= − −
= 10.7µJ
(V is the input voltage minus the voltage drops in thesense resistor, power MOSFET and transformer primary.)
VPEAK = (2 × ESTORED / CRESONANT)1/2 + VIN (4)
= (2 × 10.7µJ / 660pF)1/2 + 48V = 228V
The results of the above formulas are only approxi-mate. Neither equation includes effects of leakageinductance or MOSFET capacitance change with drain
voltage. The final values for the resonant reset circuitcan be chosen empirically. The typical peak voltagemeasured on the circuit ranged from 160V to 210V.
The value of the resonating capacitor is related to theoperating frequency. An external 390pF capacitor waschosen as the optimum value for the converter at200kHz. At frequencies above 200kHz, this capacitor islarger than optimum. At higher frequencies, a smallervalue will raise efficiency and reduce reset time. Athigher frequencies with input voltages less than 48V,subharmonic oscillation may occur when a new PWMcycle begins before the transformer is reset as shown inFigure 23.
Output Inductor and Current Sense ResistorSelection
The values of the current sense resistor (R4) and theoutput inductor are related by the slope compensationramp. The current sense resistor value is also con-strained by the converter current limit threshold.Several iterations of the procedure below might berequired to choose compatible values.
1. Choose (estimate) a value for the output inductor – 10µH.
2. Calculate output filter ripple at high supply line volt-age in continuous conduction mode.
IPK−PK = = = 1.85APK−PK
3. Calculate peak secondary current at high line andcurrent limit threshold.
ISEC(PK) = IMAX + IP−P/2 = 6A + 0.93A = 6.93A
4. Calculate peak primary current at high line and current limit threshold.
× + = 6.93A
× + =
5. Calculate 1st current sense threshold (using formulain CS5126 datasheet).
2A75V × 1.5µs
344µH14
VIN × TONLPRI
NSNP
IPRI(PK) = ISEC(PK)
5.3V × 3.5µs10µH
VOUT × TOFFL
.68W200k
.5W200k
(48 – 1.5)2 × .462
2 × 344µH × 200k2
Switching LossF
Core LossF
V2 × D2
2 × LPRI × F2

ON Semiconductor 7 CS5126 Demonstration Manual
Design Guidelines continued
Typical Performance Characteristics
Figure 2: Typical Output Efficiency at 48VIN, 200kHz.
The figures below show typical performance of the CS5126 Demo Board. All waveforms were taken withthe 20MHz filter option selected on the oscilloscope.
Figure 3: Typical Output Efficiency at 5A Out 200kHz.
= − 0.13
= − 0.13 = 0.375V
6. Choose current sense resistor value.
RSENSE = = = 0.19Ω
7. Recalculate inductor value for slope compensationfactor of 1. (See data sheet.)
= × VOUT + VRECTIFIER
× × ×
= × ( ) × × 0.19Ω × 1
= 12.6µH
8. If required, recalculate with the new inductor valuestarting at step 2. The actual values for this designwere 0.2Ω and 12.3µH.
145V + 0.3V
120mV / µs
SlopeValueFactor
RSENSENSECONDARY
NPRIMARY
1Internal Ramp
InductorValue
(H)
0.375V2A
1st ThresholdIPRIpk
2.65 – .085 × 1.55
2.65V − 85mV/µs × TON
51st
Threshold

CS5126 Demonstration Manual 8 ON Semiconductor
Typical Performance Characteristics continued
Figure 7: Primary Voltage and Output Ripple at 36VIN, 1A Out. (Primary side floating. Output grounded directly to body of Ch3 scope probe.)
Figure 8: Transient Response 1.5A to 4.6A Step.
Figure 9: Transient Response 3.5A to 4.6 Step.Figure 6: Primary Voltage and Output Ripple at 75VIN, 5A Out. (Primary side floating. Output grounded directly to body of Ch3 scope probe.)
Figure 5: Startup Waveforms @ 48 VIN with 1A (5Ω) Load.
Figure 4: Startup Waveforms @ 48 VIN 5A (1Ω) Load.

ON Semiconductor 9 CS5126 Demonstration Manual
Typical Performance Characteristics continued
Figure 13: Current Sense 75VIN, 5A Out Expanded.
Figure 14: Current Sense 36VIN, Output Shorted.
Figure 15: Current Sense 75 VIN, Output Shorted.
Figure 11: Current Sense 36VIN, 5A Out.
Figure 12: Current Sense 75VIN, 0.5A Out.
Figure 10: Control Loop @ 48VIN, 2.5A Out. Crossover = 9kHz. PM = 50°. GM = 11dB.

CS5165 Demonstration Manual 10 ON Semiconductor
Typical Performance Characteristics continued
Figure 19: Synchronized Operation, 48VIN, 5A Out, 200kHz.
Figure 20: Synchronized Operation, 48VIN, 5A Out, 300kHz.
Figure 21: Synchronized Operation, 48VIN, 5A Out, 400kHz.Figure 18: Synchronized Operation, 48VIN, 5A Out, 170kHz.
Figure 17: V-I Curves during High Output Currents.
Figure 16: Second Threshold Operation. 85VIN, Output shorted. (A low impedance connection is required to reach second threshold.)

ON Semiconductor 11 CS5165 Demonstration Manual
Figure 23: Synchronized Operation, 48VIN, 5A Out, 550kHz. (Note the subharmonic oscillation when a new PWM cycle starts during the high dv/dt portion transformer reset.)
Figure 24: Efficiency During Synchronized Operation at Full Load.
Typical Performance Characteristics continued
Figure 22: Synchronized Operation, 48VIN, 5A Out, 450kHz. Figure 25: Component Temperature vs. Load at 75VIN.
Figure 26: Component Temperature vs. Frequency at 48 VIN, 5A Out.
Location 1A 5A Shorted Output Output Output
(~7.6A)Ambient 25°C 26°C 28°C
PCB (near 35°C 45°C 50°Cthe VCC TP)
U1 48°C 60°C 66°CU2 33°C 47°C 60°CQ2 45°C 63°C 65°CT1 35°C 70°C 95°CT2 50°C 73°C 70°CD1 39°C 83°C 111°C
Location 200kHz 300kHz 450kHz Ambient 27°C 27°C 28°C
PCB (near 46°C 46°C 49°Cthe VCC TP)
U1 60°C 65°C 71°CU2 46°C 46°C 47°CQ2 62°C 64°C 73°CT1 69°C 67°C 67°CT2 73°C 67°C 70°CD1 83°C 83°C 83°C

CS5165 Demonstration Manual 12 ON Semiconductor
Converter Bill of Material
Item Qty. Reference Part Mfg. & P/N Distributor
1 2 C1, 2 cer, 1.5µF, 100V TDK C5750XR72A155K TDK 603-886-6600
2 1 C3 cer, 0.22µF, 100V, 1206 Kemet C1206C224M5UAC Newark 800-463-9275
3 2 C4, 10 cer, 1000pF, 50V, 0805 Panasonic ECU-V1H102KBN Digi-Key
4 1 C5 0.47µF, 25V, 1206 Panasonic ECJ-3YB1E474K Digi-Key
5 1 C6 cer, 390pF, 500V Novacap 1206X391M501N Novacap 661-295-5920
6 2 C7, 8 47µF, 6.3V Panasonic EEFCDOJ470R Digi-Key
7 2 C9, 11 cer, .01µF, 50V, 0805 Panasonic ECU-V1H103KBG Digi-Key
8 1 C12 cer, .022µF, 50V, 0805 Panasonic ECU-V1H223KBG Digi-Key
9 1 D1 schottky, dual Motorola MBRD2060CT Newark
10 1 D2 diode Motorola MMBD6100LT1 Newark
11 1 D3 zener diode Panasonic Digi-Key MA3110TR-ND Digi-Key
12 1 L1 Inductor, 10µH J.W. Miller PM54-100M Newark
13 1 Q1 Transistor, NPN Zetex FZT493 Digi-Key14
15 1 Q2 MOSFET, 250V I.R. IRF634S Newark
16 1 R1 res, 39k, 0805 Panasonic ERJ-6GEYJ393V Digi-Key
17 1 R2 res, 200k, 1%, 0805 Panasonic ERJ-6ENF2003V Digi-Key
18 1 R3 res, 30.1K, 0805 Panasonic ERJ-6ENF3012V Digi-Key
19 1 R4 res, 0.2ohm, 1% 1206 Dale WSL1206R200FE25 Allied 800-433-5700
20 1 R6 res, 17.4k, 0805 Panasonic ERJ-6ENF1742V Digi-Key
21 1 R7 res, 1k, 0805 Panasonic ERJ-6GEYJ103V Digi-Key
22 1 R8 res, 10k, 1%, 0805 Panasonic ERJ-6ENF1002V Digi-Key
23 2 R9, 10 res, 10k, 0805 Panasonic ERJ-6GEYJ103V Digi-Key
24 1 T1 Inductor with Coiltronics CTX15-14527 Coiltronicsaux. winding 561-241-7876
25 1 T2 Transformer, forward Coiltronics CTX15-14526 Coiltronics
26 1 U1 Current Mode Controller ON Semiconductor ON SemiconductorCS5126-DR8 401-885-3600
27 1 U2 Opto-isolator Motorola/QT Arrow ElectronicsOptoelectronics MOC8106 516-391-1300
28 1 U3 Shunt Regulator Texas Instruments Wyle ElectronicsTLV431CDBV 781-271-9953
Bill of Materials
Miscellaneous Bill of Material
Item Qty. Reference Part Mfg. & P/N Distributor
1 4 TP1, 2, 4, 5 turret terminal Cambion 160-1558-02-01-00 Newark
2 10 TP3, 6-14 single pin header Winpoint 201-01-S-3-02-T
3 4 F1-4 standoff Bumpons Digi-Key(Digi-Key) SJ5003-0-ND

ON Semiconductor 13 CS5165 Demonstration Manual
Demo Board Layout
PCB Layout
Figure 27: Top (component) Layer.
Figure 28: Bottom (solder) Layer.
© Semiconductor Components Industries, LLC, 2000
ON Semiconductor and the ON Logo are trademarks ofSemiconductor Components Industries, LLC (SCILLC).ON Semiconductor reserves the right to make changeswithout further notice to any products herein. For addi-tional information and the latest available information,please contact your local ON Semiconductor represen-tative.

Notes

Notes

Notes