47376 MLF Cover - IIS Windows Serverlibrary.corporate-ir.net/library/88/884/88490/items/... · ·...
64
MAPLE LEAF FOODS INC. 2005 Annual Report MAPLE LEAF FOODS INC. 2005 ANNUAL REPORT Passionate People Passionate about Food
Transcript of 47376 MLF Cover - IIS Windows Serverlibrary.corporate-ir.net/library/88/884/88490/items/... · ·...

MA
PL
E
LE
AF
F
OO
DS
I
NC
.2
00
5
An
nu
al
R
ep
or
t
MAPLE LEAF FOODS INC. 2005 ANNUAL REPORT
Passionate People Passionate about Food
On the Cover: A historical landmark in Toronto, the
St. Lawrence Market and its many fine purveyors of
fresh meats, cheeses, produce and other food products
has served as the inspiration for food lovers for more
than 100 years. Such markets provide an ideal venue for
our passionate people who are constantly seeking new
ideas for innovative food products for our customers
and consumers.
Pictured left to right are: Jeannie Schmitz (Canada Bread
Fresh Bakery), Glen Gratton (Agribusiness Group),
Andy Persaud (Maple Leaf Consumer Foods) and
Valerie Walton (Maple Leaf Global Foods).
M A P L E L E A F F O O D S I N C .
30 St. Clair Avenue West, Suite 1500
Toronto, Ontario, Canada M4V 3A2
www.mapleleaf.com
Passionate People Passionate about Food
Printed in Canada
47376_MLF_Cover.qxd 3/20/06 4:36 PM Page 1
C O R P O R A T E P R O F I L E
aple Leaf Foods is a Canadian success story with
growing global reach. Our roots in the flour
business date back to a small-town mill in 1836, our
meat processing business back to the 1860s, and our
bakery business to the amalgamation of five separate companies in 1911.
Rich in history, Maple Leaf Foods entered our current growth phase in
1995 when McCain Capital Corporation pooled our expertise in
the food business with the financial resources of Ontario Teachers’
Pension Plan Board. Today, Maple Leaf Foods employs approximately
24,000 people, exports to nearly 80 countries, and operates in Canada,
the United States, the United Kingdom, Europe, Southeast
Asia and Mexico.
Our Meat Products and Agribusiness operations are strategically
linked to produce high quality meat products, minimize underlying
commodity market exposure, and maximize earnings. They include
animal nutrition, hog production, fresh value-added pork and poultry
products, processed meats and home meal solutions, global sales and
trading, and rendering operations.
Our Bakery operations are concentrated in North America and the
United Kingdom. We are the Canadian market leader in
premium nutrition fresh bakery products, such as whole grain and
organic breads. We are also a major North American supplier of
frozen ready-to-bake, par-baked and pre-baked breads, rolls and
specialty bakery items, in addition to fresh pasta and sauces. In the
U.K., we operate three plants, including one of the largest bagel plants
in the world, servicing the fast growing U.K. and European markets.
Our value creation strategy is supported by our flagship brands
which are growing well above industry averages – Maple Leaf® and
Schneiders® in the meat category and Dempster’s® in the bakery
category. They each deliver a promise to consumers: leadership in food
safety, quality and taste, and nutrition. Behind our products and our
many brands are our passionate people, and their passion for food.
M
Table of Contents1 Financial Highlights
2 Operations Overview
3 Segmented Operating Results
5 Letter from the Chairman
6 Letter to Fellow Shareholders
14 Financials
CAPITAL STOCK
The Company’s authorized capital consists of anunlimited number of voting and an unlimited numberof non-voting common shares. At December 31, 2005,105,704,812 voting shares and 22,000,000 non-votingshares were issued and outstanding, for a total of127,704,812 outstanding shares. There were 1,208shareholders of record of which 1,163 were registeredin Canada, holding 99.4% of the issued voting shares.All of the issued non-voting shares are held by OntarioTeachers’ Pension Plan Board. These non-voting sharesmay be converted into voting shares at any time.
OWNERSHIP
The Company’s major shareholders are McCainCapital Corporation holding 41,518,153 sharesrepresenting 32.5% of the total issued and outstanding shares issued and Ontario Teachers’Pension Plan Board holding 20,728,371 voting sharesand 22,000,000 non-voting shares representing 33.4%of the total issued and outstanding shares. The remainder of the issued and outstanding shares arepublicly held.
CORPORATE OFFICE
Maple Leaf Foods Inc.30 St. Clair Avenue WestSuite 1500Toronto, Ontario, Canada M4V 3A2Tel: (416) 926-2000Fax: (416) 926-2018Website: www.mapleleaf.com
ANNUAL AND GENERAL MEETING
The annual and general meeting of shareholders ofMaple Leaf Foods Inc. will be held on Wednesday, April26, 2006 at 11:00 a.m. at the Glenn Gould Studio,Canadian Broadcasting Centre, 250 Front Street West,Toronto, Canada.
DIVIDENDS
The declaration and payment of quarterly dividends aremade at the discretion of the Board of Directors.Anticipated payment dates in 2006: March 31, June 30,September 29 and December 29.
SHAREHOLDER INQUIRIES
Inquiries regarding dividends, change of address,transfer requirements or lost certificates should bedirected to the Company’s transfer agent:Computershare Investor Services Inc.Stock and Bond Transfer Department100 University Avenue, 9th FloorToronto, Ontario M5J 2Y1Tel: (514) 982-7555or 1-800-564-6253 (toll-free North America)or [email protected]
COMPANY INFORMATION
For public and investment analysis inquiries, pleasecontact our Vice-President, Public & Investor Relationsat (416) 926-2000.
For copies of annual and quarterly reports, annualinformation form and other disclosure documents,please contact our Senior Vice-President, Transactionsand Administration and Corporate Secretary at(416) 926-2000.
TRANSFER AGENT AND REGISTRAR
Computershare Investor Services Inc.100 University Avenue, 9th FloorToronto, Ontario, Canada M5J 2Y1Tel: (514) 982-7555or 1-800-564-6253 (toll-free North America)or [email protected]
AUDITORS
KPMG LLP
Toronto, Ontario
STOCK EXCHANGE LISTINGS AND STOCK
SYMBOL
The Company’s voting common shares are listedon The Toronto Stock Exchange and trade under thesymbol “MFI”.
RAPPORT ANNUEL
Si vous désirez recevoir un exemplaire de la versionfrançaise de ce rapport, veuillez écrire à l’adressesuivante : Secrétaire de la société, Les Aliments MapleLeaf Inc., 30 St. Clair Avenue West, Toronto, OntarioM4V 3A2.
C O R P O R A T E I N F O R M A T I O N
47376_MLF_Cover.qxd 3/20/06 4:36 PM Page 2

P A S S I O N A T E P E O P L E • P A S S I O N A T E A B O U T F O O D
1
F I N A N C I A L H I G H L I G H T S
• 66.6% Meat Products
• 20.8% Bakery Products
• 12.6% Agribusiness
• 72.9% Domestic
• 13.9% U.S.
• 13.2% Other International
TOTAL ASSETS BYGROUP
• 48.6% Meat Products
• 21.8% Bakery Products
• 20.0% Agribusiness
• 9.6% Non-allocated
• 38.7% Agribusiness
• 38.5% Bakery Products
• 22.8% Meat Products
For years ended December 31(In millions of Canadian dollars, except share information)
2005 2004 2003 2002 2001
Consolidated results
Sales $ 6,463 $ 6,365 $ 5,042 $ 5,076 $ 4,775
Earnings from operations (i) 263 256 152 204 158
Net earnings 94 102 30 80 53
Return on assets employed (ii) 8.2% 8.9% 6.4% 9.2% 7.6%
Financial position
Net assets employed (iii) $ 2,256 $ 2,105 $ 1,561 $ 1,430 $ 1,387
Shareholders’ equity 999 906 654 644 573
Net borrowings 1,063 1,046 785 667 685
Per share
Net earnings $ 0.74 $ 0.90 $ 0.27 $ 0.71 $ 0.55
Dividends 0.16 0.16 0.16 0.16 0.16
Book value 7.82 7.24 5.78 5.70 5.12
Number of shares (millions)
Weighted average 126.8 113.6 113.1 112.5 95.9
Outstanding at December 31 127.7 125.2 113.2 112.9 112.0
(i) Before restructuring costs (2003 and 2005).(ii) After tax, but before interest, calculated on average month-end net assets employed. Before restructuring costs (2003 and 2005).(iii) Total assets, less cash, future tax assets and non-interest bearing liabilities.
DOMESTIC VS.INTERNATIONAL SALES
SALES BY GROUP OPERATING EARNINGS BEFORE
RESTRUCTURING COSTS

P A S S I O N A T E P E O P L E • P A S S I O N A T E A B O U T F O O D
2
• M A P L E L E A F C O N S U M E R F O O D S
Supported by our flagship brands – Maple Leaf® andSchneiders® – and a family of strong regional brands,Maple Leaf Consumer Foods is Canada’s leading producer of premium quality processed meat and home meal solutions. Products include refrigeratedfully cooked roasts, frozen meat products, bacon, ham,wieners, deli and canned meats, single serve entrées and“hand-held” meat and pastry products.Plants: 24, Distribution Centres: 7
• M A P L E L E A F F R E S H F O O D S
Maple Leaf Fresh Foods is Canada’s leading multi-species fresh meat company, producing premium quality, fresh and frozen value-added pork, chicken,and turkey products. Brands include Maple Leaf ® Prime™
Naturally*, Maple Leaf ® Fresh Grill!, Maple Leaf ®
Fresh Roast!, Maple Leaf ® Prime™ Turkey, Mitchell’sGourmet Foods and Maple Leaf ® Medallion™ Naturally.Plants: 12, Hatcheries: 3
• M A P L E L E A F G L O B A L F O O D S
Canada’s largest exporter of agri-food products, supported by global offices in key markets, includingSoutheast Asia, Europe and Mexico. Operationsinclude the marketing, distribution and trading ofvalue-added protein, bakery and agri-food products,including pork products, seafood, grain and soy products, pre-cooked meat and poultry products,french fries, bakery products and pet food.Plants: 2, Trading Offices: 8
B A K E R Y P R O D U C T S
F R E S H B A K E R Y
The leading Canadian producer and distributor of freshbaked products including breads, rolls, bagels andartisan breads with brands such as Dempster’s®,POM®, Ben’s®, McGavin’s and Healthy Way.Dempster’s® is the national brand leader in highernutrition, whole grain products. The Company alsomanufactures a variety of fresh and filled fresh pastaand sauces under the Olivieri® brand, distributing tocustomers across North America.Plants: 24, Distribution Centres: 12
* Canada’s leading brand of chicken
• E L I T E S W I N E
The Company’s hog management operations are animportant component of Maple Leaf’s quality controland Vertical Co-ordination strategy, supplyingapproximately 20% of Maple Leaf Fresh Foods’pork requirements. With 130,000 sows undermanagement, Elite Swine is the largest hog producerin Canada and the seventh largest production system inNorth America.
• M A P L E L E A F A N I M A L N U T R I T I O N
Canada’s leading animal nutrition organization, supported by leading trusted brands – Shur-Gain inEastern Canada and Landmark Feeds in WesternCanada – and excellence in research and development.The business provides animal nutrition products and services, including swine, dairy and beef cattle, poultry,aquaculture, equine and pet food.Feed Mills: 18, Retail Sales Centres: 13, Hatcheries: 3,
Research Facilities: 3
• R O T H S A Y
Canada’s largest recycler of animal by-products intovalue-added products, including animal feed, aminoacid supplements, biodiesel and other industrial uses.Rothsay provides an essential service for its customers and other Maple Leaf operations by responsibly managing and recapturing the value ofinedible by-products. Plants: 6
F R O Z E N B A K E R Y
A leading North American producer and distributor offrozen unbaked, par-baked and fully baked breads,rolls and bagels and artisan breads for retail and foodservice customers, and a U.K.-based producer ofbagels and specialty breads for the U.K. and Europeanmarkets. Brands include Grace Baking, CaliforniaGoldminer and the Wholesome Harvest line of premiumnutrition products, in addition to the New York Bagelbrand in the U.K. Plants: 12
P R O T E I N V A L U E C H A I N
• Maple LeafAnimal
Nutrition
Feed
• Elite Swine
HogProduction
• Maple Leaf Consumer Foods• Maple Leaf Fresh Foods• Maple Leaf Global Foods
Processing, Marketing & Distribution
• Rothsay
By-Products
O P E R A T I O N S O V E R V I E W
M E A T P R O D U C T S A G R I B U S I N E S S
For detailed information on these operations, visit www.mapleleaf.com.

P R O T E I N V A L U E C H A I N
(In millions of Canadian dollars)
2005 2004 % change
Meat Products Group
Sales $ 4,300 $ 4,127 4 %
Earnings from operations before restructuring costs 60 68 (13)%
Total assets 1,550 1,463 6 %
Agribusiness Group
Sales $ 817 $ 925 (12)%
Earnings from operations before restructuring costs 102 99 3 %
Total assets 640 603 6 %
TOTAL PROTEIN VALUE CHAIN
(In millions of Canadian dollars)
2005 2004 % change
Sales $ 5,117 $ 5,052 1 %
Earnings from operations before restructuring costs 162 167 (3)%
Total assets 2,190 2,066 6 %
The Meat Products Group includes Consumer Foods, Fresh Foods and Global Foods operations.
The Agribusiness Group comprises Animal Nutrition, hog production and rendering operations.
B A K E R Y P R O D U C T S G R O U P
TOTAL BAKERY PRODUCTS GROUP (In millions of Canadian dollars)
2005 2004 % change
Sales $ 1,346 $ 1,313 3 %
Earnings from operations before restructuring costs 101 89 14 %
Total assets 695 702 (1)%
The Bakery Products Group is comprised of Maple Leaf Foods’ 87.5% ownership in Canada Bread Company, Limited,
a leading producer and distributor of fresh and frozen bakery products and fresh pasta and sauces, with operations across
Canada, the United States and the United Kingdom.
S E G M E N T E D O P E R A T I N G R E S U L T S

Our independent directors have had highly successful
careers as leaders in business, academia and public
service. Because of this, they add significant
perspective and oversight into how management
shapes strategy and manages the business.”
From left to right:
Purdy Crawford
Michael McCain
Chaviva Hosek
Jim Hankinson
Scott McCain
Diane McGarry
Bob Stewart
Jeffrey Gandz
Ted Newall
Bob Hiller
Gord Ritchie
Don Loadman
“

P A S S I O N A T E P E O P L E • P A S S I O N A T E A B O U T F O O D
5
L E T T E R F R O M T H E C H A I R M A N
Delivering long-term shareholder value is seldom a
straight line of profit gains. Implementing the right
strategy to achieve high financial returns in a
diversified global food company means growth
often happens in expansive bursts. It may come in
the form of large acquisitions that expand our
global presence, or exciting new product
innovations that transform the marketplace. Great
companies are premised on such intensity.
The alignment of growth ambitions with
shareholder value involves serious equity
commitments by directors and managers. Our two
largest shareholders – McCain Capital Corporation
and Ontario Teachers’ Pension Plan Board – own
approximately 70 percent of the Company. The 10
independent directors on our 13-member board
have also pledged a substantial amount as an
investment in our future.
An important distinction is that all shareholders
don’t necessarily share the same interests, because
investment horizons are different. Our Board and
management team are managing this Company for
long-term value creation. Shareholders, current and
prospective, should keep this top of mind as you
make investment decisions and measure our success.
We operate in a complex environment with
multiple stakeholders – government, communities,
unions and industry groups to name a few. On this
basis, shareholders need a Board well experienced
in value creation, but also who bring a diversity
of experience to the Company’s management. Our
independent directors have had highly successful
careers as leaders in business, academia and public
service. Because of this, they add significant
perspective and oversight into how management
shapes strategy and manages the business.
We are always looking for ways to better engage
directors in the business and with our people. Last
year, we introduced an innovative new program
called “Board Connect”, where directors spend a
day shadowing a senior operations manager. This
allows them to garner first hand insights into our
business and engage directly with our people. One
director enjoyed a day in the life of a sales executive,
another organizing fresh pork shipments across
the border, while a third participated with the
Consumer Foods’ management team in their annual
budget process. This program will continue in 2006.
Building corporate greatness means dramatic
changes in the next few years as we step with increased
boldness onto the world stage. Your Board will
assess these and all our major business decisions
with a shareholder lens; ensuring long-term value
creation is supported each step of the way.
Sincerely,
G. Wallace F. McCain,Chairman
G. Wallace F. McCainChairman

P A S S I O N A T E P E O P L E • P A S S I O N A T E A B O U T F O O D
6
L E T T E R T O F E L L O W S H A R E H O L D E R S
We accomplished a great deal in 2005 as we
implemented structural changes throughout the
organization and increased operating earnings by
17% in the first nine months compared with the prior
year. Unfortunately that momentum slowed in the
fourth quarter due to a sharp rise in energy costs,
an unexpected drop in the yen, and higher timing
related advertising and promotion costs. The net result
for 2005 compared with the prior year was as follows:
• Sales increased by 2% to $6.5 billion
• Earnings from operations also increased by 3% to $2631 million
• Earnings per share declined to $0.811 from $0.90
• Cash flow from operating activities increased by
10% to $260 million
• Capital expenditures decreased to $152 million
from $157 million
• Return on net assets declined to 8.2%1 from 8.9%
• Share price closed the year at $15.20, up 1.5%,
outperforming the S&P Food Products Index by 7%
Operating earnings in our Meat Products Group
declined by 13% to $60 million for the year.
The main cause was an industry-wide contraction
in commodity processor margins – approximately
30% in pork and 41% in poultry versus the prior
year. We offset these negative underlying influences
in three ways. First, our Vertical Co-ordination
strategy to minimize commodity influences on our
earnings is working. We effectively own 20% of
our hog supply and this natural hedge against
high hog prices offsets a substantial portion of
the commodity processor margin decline. Second,
we added value to our commodity products
through gains in processing, innovation, and better
sales and marketing execution. Finally, our brand
focused, consumer-oriented, fresh bread and
consumer packaged meats and meals businesses
both performed brilliantly as a result of brand
marketing and sales effectiveness, operational
improvements, and lower raw material costs.
Higher hog prices were the main reason why our
Agribusiness Group’s operating profits increased
by 3% to $102 million. This improvement more
than offset the costs of commissioning a new
high-efficiency feed mill in Atlantic Canada. We
also completed construction of the first commercial
Michael H. McCainPresident and Chief Executive Officer
1 Before restructuring costs (please refer to Management’s Discussion and Analysis)

P A S S I O N A T E P E O P L E • P A S S I O N A T E A B O U T F O O D
7
biodiesel plant in Canada, employing a proprietary
process developed at Maple Leaf Foods to convert
tallow into a valuable renewable fuel source. The
Agribusiness Group plays a vital role in our value
chain strategy by delivering stable earnings,
providing virtually all animal feed requirements to
our poultry producers and hog production business,
and converting inedible animal by-products into
earnings streams through our rendering operations.
Our Bakery Products Group, which reflects our
87.5% ownership of
Canada Bread, recorded
another very strong
year, capitalizing on
acquisitions and mergers
completed several years
ago. Operating earnings grew by 14% to
$101 million, driven largely by our fresh bakery
operations. The Group faced the challenges of
higher energy and distribution costs and the
start-up costs of a large bagel plant in the U.K. The
portfolio benefit of being in the bakery business
cannot be overstressed as there are excellent
synergies between the protein and bakery businesses.
We like this business very much and will continue
to acquire Canada Bread shares at the right price,
although we have no overt strategy to buy out the
remaining shares.
Maple Leaf continues to be a strong cash generator,
with $260 million in operating cash flow in 2005.
We invested $152 million in capital for the year,
which supported the construction of a high-
efficiency feed mill in Eastern Canada, a biodiesel
plant in Quebec and environmental upgrades in
our rendering business.
We ended the year with
a strong balance sheet,
reflected in a Net
Debt/EBITDA ratio of
2.6x and a commitment
to maintaining investment grade credit quality.
Our long-term compound annual growth rate in
earnings per share since 1995 is 10.4% versus our
goal of 15%, and our return on net assets was
8.2% in 2005, versus our target of 11.5%.
S I M P L I F Y I N G O U R S T R U C T U R E
Much of 2005 was devoted to building a stronger
organization that will support lasting long-term
“ M U C H O F 2 0 0 5 WA S D E V O T E D
T O B U I L D I N G A S T R O N G E R
O R G A N I Z AT I O N T H AT W I L L
C R E AT E L A S T I N G L O N G - T E R M
S H A R E H O L D E R VA L U E . ”
Ear
ning
s Pe
r Sh
are
(1)
RONA
Long-Term Financial Targets:EPS CAGR > 15%RONA 11.5%
1995 1996 1997 1998 1999 2000 2001 2002 2003 2004 2005
0.00
0.10
0.20
0.30
0.40
0.50
0.60
0.70
0.80
0.90
1.00
0%
1%
2%
3%
4%
5%
6%
7%
8%
9%
10%
(1) Before restructuring costs
EPS
RONAEPS CAGR: 10.4%
L E T T E R T O F E L L O W S H A R E H O L D E R S

P A S S I O N A T E P E O P L E • P A S S I O N A T E A B O U T F O O D
8
L E T T E R T O F E L L O W S H A R E H O L D E R S
shareholder value. We began 2005 with 14
independent operating companies, plus several
ancillary business units. We finished the year with
10 streamlined operating companies. All consumer
foods businesses, including Schneider Foods,
Maple Leaf Consumer Foods and Larsen Packers,
were merged as Maple Leaf Consumer Foods. Our
fresh pork and poultry operations were consolidated
as Maple Leaf Fresh Foods. In the Agribusiness
Group, Shur-Gain and Landmark Feeds were
combined as Maple Leaf Animal Nutrition. Our
international trading business was reorganized as
Maple Leaf Global Foods, and is expanding beyond
its core strength in trading to increase geographic
and value-added product diversification.
These types of mergers always put strain on an
organization. Supported by the discipline and
methodology of Six Sigma, they were accomplished
with professionalism and stability, ensuring we
always kept our customers’ needs first. The task of
aligning our core processes and completing very
complex organizational change will continue in
2006. This simpler organizational structure will
deliver operational efficiencies and enable us
to more effectively leverage the competitive
advantages of our national scope, strong brands
and product diversity.
O U R F O U N D A T I O N S
The enduring feature of our Company is our deep
conviction in the long-term benefit of investing in
people and disciplines, specifically our Leadership
Edge and Six Sigma programs. In 2005, we
expanded that commitment by investing over 8,400
person days in leadership values and skills
development through the Maple Leaf Leadership
Academy and Six Sigma training programs. Our team
of 130 Six Sigma Black Belt professionals manage a
portfolio of what is now more than 570 projects.
We know from long experience that safe plants
are well run plants. We are pleased to report that
we recorded our fifth consecutive year of double-
digit improvement in health and safety measures.
In 2005, our lost time accident frequency rate
improved by a remarkable 38%.
F O U R T H Q U A R T E R C H A L L E N G E S
Our fourth quarter results dampened a year of
strong operating performance due to three factors.
First, we faced unprecedented rapid increases in
energy costs, with more than 40% of oil and gas
cost increases occurring in Q4. This is a large cost
From left to right: Wayne Johnson, Brock Furlong, Lynda Kuhn, Doug Dodds

P A S S I O N A T E P E O P L E • P A S S I O N A T E A B O U T F O O D
9
L E T T E R T O F E L L O W S H A R E H O L D E R S
line that affects each of our business units either
directly in the case of manufacturing and
distribution or indirectly in higher ingredient,
packaging and overhead costs. We are confident
that we will be able to pass these cost increases on
in our pricing, although there is a lag effect,
category by category, as we plug into natural
re-pricing rhythms with our customers.
Second, the yen declined 16% against the
Canadian dollar in the quarter compared to the first
six months of 2005,
causing margin pressure
on our Japanese pork
exports, which are priced
in yen. While this should
normalize over the
medium term, it accounted for a significant portion of
the fourth quarter earnings decline. Japan is
important to our fresh pork strategy and is a great,
though inconsistent market from quarter to quarter.
In Q4 we experienced the downside of this curve,
although our results in Japan for the full year were
satisfactory. Compounding the currency impact, the
Japanese market finished the year with unusually
high frozen pork inventories, as domestic
consumption returned to more normal levels after
two robust years. We believe that both of these
factors are short term. Meanwhile, we have made
headway in diversifying our international markets
for premium quality pork, although there is still
lots of opportunity to better balance our important
Japanese business with other markets.
Third, advertising and promotional costs to
support product launches and brand building were
higher due to timing related costs that are
expected to yield returns
in market share and
brand leadership.
Despite these short-
term challenges, the
foundations of the
business continue to get stronger with each passing
year. We have aggressive growth targets and, as
significant shareholders, take a longer-term view to
wealth creation. The Maple Leaf story will never
be a straight line of rising profits. While we seek
steady earnings growth, we do not manage the
business quarter to quarter. Our commitment to
long-term shareholder value creation is resolute.
“ D E S P I T E T H E S E S H O R T- T E R M
C H A L L E N G E S , T H E F O U N D AT I O N S
O F T H E B U S I N E S S C O N T I N U E
T O G E T S T R O N G E R W I T H
E A C H P A S S I N G Y E A R . ”
From left to right: Rick Young, Rocco Cappuccitti, Kevin Golding, Jerry Vergeer, Bruce Miyashita

P A S S I O N A T E P E O P L E • P A S S I O N A T E A B O U T F O O D
10
L E T T E R T O F E L L O W S H A R E H O L D E R S
V A L U E C R E A T I O N S T R A T E G I E S
A N D O P P O R T U N I T I E S
The food business provides enormous opportunities
for companies that understand and achieve the
necessary balance between rigorously controlling
costs and growing the top line profitably through
innovation and adding value.
At Maple Leaf Foods, seven strategic elements
form the blueprint for wealth creation and govern all
key business decisions. Each is underpinned with
specific medium-term initiatives:
• Add value for our customers
• Add value to our products
• Invest in leading market shares
• Build our brands
• Innovate
• Drive costs out
• Diversify globally
We are continuously seeking to move our customer
relationships from transactional to strong “enterprise”
partnerships by developing deep insights into their
needs and tailoring our relationship to plug into each
of their unique strategies. Our value-added product
focus spans the Company, from innovation in feed
formulation to new bakery product technology such
as FroBake® in our bakery business. Market share
leadership is critical in this industry to
establish stable market conduct and achieve high
plant efficiencies. We will not compete in a market
that we cannot lead and we have leading market
shares in all our businesses. We are brand equity
builders, and we use innovation as a key brand
building platform. Driving costs out of our business
model is essential to success, supported by Six Sigma
methodology and insights, appropriate capital
investments, consolidation of supply chains into
larger scale facilities, and application of standardized
processes throughout our business structure. We
expect longer-term value creation will be driven by
global diversification, which offers excellent
opportunities in both protein and bakery.
Applying these strategic principles, there are four
major value creation opportunities in the mid-term, in
addition to our many other initiatives. The first is to
complete the merger between Schneider Foods and
Maple Leaf and realize the synergies that result from
having leading brands and market shares in Canadian
packaged consumer meats and meals. The second is
to grow margins in our fresh meat businesses by
adding value to commodity products through service
and value-added processing. The third is harvesting
our investment in the frozen and U.K. bakery
From left to right: Barry McLean, Randy Powell, Michael Detlefsen, Annalisa King

P A S S I O N A T E P E O P L E • P A S S I O N A T E A B O U T F O O D
11
L E T T E R T O F E L L O W S H A R E H O L D E R S
businesses, where we feel we have significant
opportunity to drive sales volume and earnings
growth. The fourth is to reduce costs in our hog
production operations and restore competitiveness
with the U.S. industry.
M E G A - B R A N D S ; M E G A F U T U R E
The equity in a brand accrues benefits to brand
owners for decades. Very few companies have a
single “mega-brand”. In Canada, we are proud to
have three leading food brands – Schneiders®, Maple
Leaf® and Dempster’s®.
They are among the top
25 brands in the country
and growing well in
excess of the average for
this peer group – a major
accomplishment of our sales and marketing teams. What
keeps these brands fresh, hot and generating better
returns? A time-tested recipe of brand strategy, brand
support and lots of brand innovation.
The Schneiders® brand has penetrated the position
of “Taste The Difference Quality Makes®” deep into
the Canadian awareness. Supported by European
craftsmanship, heritage and top quality ingredients,
the “taste” proposition continues to resonate
with consumers. The Maple Leaf® brand position
of “We Take Care™” gives consumers added
confidence through our commitment to food safety
leadership. In the bakery category, Dempster’s® leads
the premium nutrition whole grain bakery market,
supported by the newly launched brand position
“Nourish Yourself™”. As one of Canada’s leading
national TV advertisers, we support these brands with
continuous and creative breakthrough advertising.
Brands drive market share leadership, and
innovation drives brands. Consumers are always
seeking something “new”
from the brands they
trust. O u r innovation
platform keeps getting
stronger and stronger.
Recent examples include
Maple Leaf® Fully Cooked Roasts, Maple Leaf®
Fresh Grill! and Maple Leaf® Fresh Roast!, all
targeted to meet the needs of time-starved
consumers. In the bakery category, early in 2006
we launched Dempster’s® Smart™, a white bread
made with all the benefits of whole grains and the
first product of its kind in Canada.
T H E N E X T C H A P T E R
The last decade has been transformational. In
many ways, that’s just the end of the first chapter.
“ S C H N E I D E R S ® , M A P L E L E A F ® A N D
D E M P S T E R ’ S ® . . . A R E A M O N G T H E
T O P 2 5 B R A N D S I N T H E C O U N T RY A N D
G R O W I N G W E L L I N E X C E S S O F T H E
AV E R A G E F O R T H I S P E E R G R O U P. ”
From left to right: Rory McAlpine, Peter Smith, Maryanne Chantler, Pat Ressa Absent: Peter Maycock
P A S S I O N A T E P E O P L E • P A S S I O N A T E A B O U T F O O D
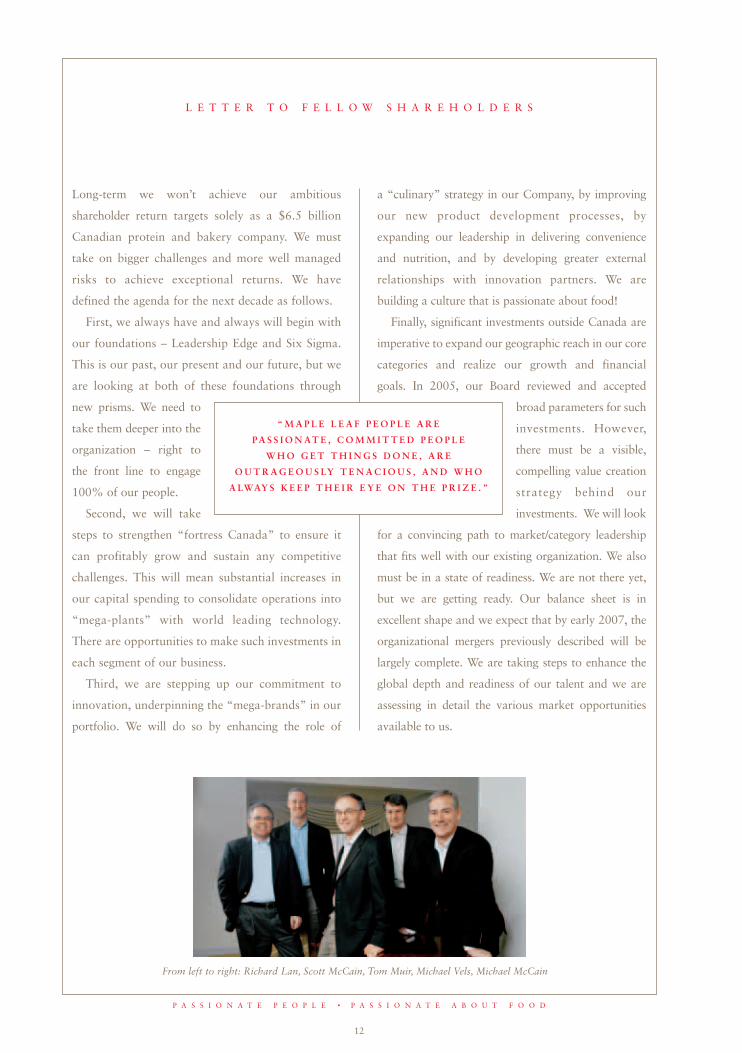
12
L E T T E R T O F E L L O W S H A R E H O L D E R S
Long-term we won’t achieve our ambitious
shareholder return targets solely as a $6.5 billion
Canadian protein and bakery company. We must
take on bigger challenges and more well managed
risks to achieve exceptional returns. We have
defined the agenda for the next decade as follows.
First, we always have and always will begin with
our foundations – Leadership Edge and Six Sigma.
This is our past, our present and our future, but we
are looking at both of these foundations through
new prisms. We need to
take them deeper into the
organization – right to
the front line to engage
100% of our people.
Second, we will take
steps to strengthen “fortress Canada” to ensure it
can profitably grow and sustain any competitive
challenges. This will mean substantial increases in
our capital spending to consolidate operations into
“mega-plants” with world leading technology.
There are opportunities to make such investments in
each segment of our business.
Third, we are stepping up our commitment to
innovation, underpinning the “mega-brands” in our
portfolio. We will do so by enhancing the role of
a “culinary” strategy in our Company, by improving
our new product development processes, by
expanding our leadership in delivering convenience
and nutrition, and by developing greater external
relationships with innovation partners. We are
building a culture that is passionate about food!
Finally, significant investments outside Canada are
imperative to expand our geographic reach in our core
categories and realize our growth and financial
goals. In 2005, our Board reviewed and accepted
broad parameters for such
investments. However,
there must be a visible,
compelling value creation
strategy behind our
investments. We will look
for a convincing path to market/category leadership
that fits well with our existing organization. We also
must be in a state of readiness. We are not there yet,
but we are getting ready. Our balance sheet is in
excellent shape and we expect that by early 2007, the
organizational mergers previously described will be
largely complete. We are taking steps to enhance the
global depth and readiness of our talent and we are
assessing in detail the various market opportunities
available to us.
“ M A P L E L E A F P E O P L E A R E
P A S S I O N AT E , C O M M I T T E D P E O P L E
W H O G E T T H I N G S D O N E , A R E
O U T R A G E O U S LY T E N A C I O U S , A N D W H O
A LWAY S K E E P T H E I R E Y E O N T H E P R I Z E . ”
From left to right: Richard Lan, Scott McCain, Tom Muir, Michael Vels, Michael McCain

P A S S I O N A T E P E O P L E • P A S S I O N A T E A B O U T F O O D
13
L E T T E R T O F E L L O W S H A R E H O L D E R S
Over the longer-term, we are also proactively
minimizing risk from disease by preparing ourselves
for the potential outbreak of a global influenza
pandemic. We pay close attention to the risk of
avian influenza due to our industry affiliations.
While we are primarily a processor and our business
model is to not own poultry growing operations, we
are taking steps with our employees and producer
partners to reduce risk. The larger concern we all
share is the threat of a pandemic in the human
population. We cannot control this outcome,
although we can take a leadership position in
preparedness, which is exactly what we are doing
– both in our industry and inside our Company.
P A S S I O N A T E P E O P L E ;
P A S S I O N A T E A B O U T F O O D
We continue to nurture and develop the greatest
asset of this organization – our people and their
leadership capabilities, which defines our culture.
Maple Leaf people are passionate, committed
people who get things done, are outrageously
tenacious, and who always keep their eye on the
prize. It’s an amazing place!
Adding to this team are the newest members of
our Executive Council, Annalisa King who leads our
Vertical Co-ordination group, and Maryanne
Chantler who heads up our Purchasing and Supply
Chain group. Both Annalisa and Maryanne have a
strong history in operating and finance roles at
Maple Leaf and they continue to make outstanding
contributions in their new responsibilities. Rory
McAlpine, who has a diverse background in
government and international trade, also recently
joined Maple Leaf’s senior leadership team, to
lead and build our Government and Industry
Relations program.
We are entering 2006 with a great deal of
confidence. Our underlying operating and financial
fundamentals are strong and the talent we have
across the organization, thousands of Maple Leaf
Foods employees, is what will drive value
creation. They are an amazing team, and on that
basis you have invested well.
Michael H. McCain President and
Chief Executive Officer
Richard A. LanPresident and Chief Operating Officer,
Bakery Products Group
J. Scott McCainPresident and Chief Operating Officer,
Agribusiness Group
Tom P. Muir Executive Vice-President andChief Development Officer
Michael H. VelsExecutive Vice-President and
Chief Financial Officer
F I N A N C I A L S
Financial Contents
15 Results of Operations
16 Operating Segments
17 Operating Review
17 Meat Products Group
18 Agribusiness Group
19 Bakery Products Group
20 Acquisitions
21 Capital Resources and Liquidity
23 Derivatives
24 Environment
24 Risk Factors
28 Critical Accounting Estimates
29 Changes in Accounting Policies
30 Recent Accounting Pronouncements
32 Summary of Quarterly Results
32 Forward-Looking Statements
34 Management’s Statement of Responsibility
34 Auditors’ Report to the Shareholders
35 Consolidated Financial Statements
38 Notes to the Consolidated Financial Statements
58 Corporate Governance and Board of Directors
60 Senior Management and Officers
61 Corporate Information

P A S S I O N A T E P E O P L E • P A S S I O N A T E A B O U T F O O D
15
THE BUSINESS
Maple Leaf Foods Inc. is a leading Canadian food
processing company committed to delivering quality
food products to consumers around the world. Head-
quartered in Toronto, Canada, the Company employs
approximately 24,000 people at its operations across
Canada and in the United States, Europe and Asia.
EFFECT OF RESTRUCTURING AND OTHER ITEMS
Except where noted, operating earnings, net earnings,
earnings per share (“EPS”) and return on net assets
(“RONA”) comparisons for 2005 exclude
$13.2 million before tax ($8.3 million after-tax and
minority interest) in restructuring costs incurred in the
first quarter of 2005. Management believes that this is
the most appropriate basis on which to evaluate
operating results, as restructuring costs are not
representative of continuing operations. Year-over-year
and quarterly comparisons are also affected by the
inclusion of an additional week of operations in the
fourth quarter of 2004, which affect sales and earnings
comparisons in the fourth quarter and full year.
M A N A G E M E N T ’ S D I S C U S S I O N A N D A N A L Y S I S
SELECTED FINANCIAL HIGHLIGHTS
The following is a summary of audited financial information for the three years ended December 31, 2005.
(In thousands of dollars except per share information) 2005 2004 2003
Sales $ 6,462,581 $ 6,364,983 $ 5,041,896
Operating earnings before restructuring costs 263,034 256,364 152,428
Net earnings(i) 94,242 102,283 30,217
Net earnings before restructuring costs(i) 102,588 102,283 40,609
Total assets 3,189,780 3,038,133 2,148,721
Net debt 1,062,755 1,046,335 696,678
RONA(ii) 8.2% 8.9% 6.4%
Per share
EPS $ 0.74 $ 0.90 $ 0.27
EPS before restructuring costs $ 0.81 $ 0.90 $ 0.36
Cash dividends $ 0.16 $ 0.16 $ 0.16
(i) 2003 and 2004 restated in accordance with Note 2 to the Consolidated Financial Statements. (ii) This is not a recognized measure under Canadian Generally Accepted Accounting Principles. The calculation of RONA comprises tax-
affected earnings before interest divided by average monthly net assets. Net assets are defined as total assets, less cash, future tax assetsand non-interest bearing liabilities. These calculations and definitions may not be comparable to measures used by other companies.
RESULTS OF OPERATIONS
Operating results for 2005 reflected strong performance
from most businesses and the full year contribution of
Schneider Foods, purchased in April 2004. Earnings for
the full year were affected by weaker results in the
fourth quarter, due to a combination of factors,
including higher energy costs, lower earnings from
exports to Japan and higher advertising and
promotional costs. Management is of the opinion that
these are largely short-term factors which can be
mitigated through price increases. The value-added
businesses, particularly consumer products and fresh
bakery, contributed strongly to earnings through a
combination of new product innovation, operating
improvements and lower raw material costs in the meat
business earlier in the year. The Company also benefited
from portfolio balance across the Protein Value Chain
operations as weaker commodity processing margins
and lower rendering earnings were partly offset by
higher hog profits. Overall, changes in prices of
P A S S I O N A T E P E O P L E • P A S S I O N A T E A B O U T F O O D
16
As noted above, in response to higher costs, particularly
energy, price increases will be implemented in 2006.
Sales for the year increased 2% to $6.5 billion,
primarily due to the acquisition of Schneider Foods in
April 2004. This increase in sales was partially offset by
the inclusion of an additional week of operating results
in the fourth quarter of 2004 and by lower commodity
prices that affected sales in the Company’s pork,
poultry, feed and rendering businesses.
Earnings from operations before restructuring costs
increased 3% to $263.0 million for the year. Net
earnings for the year before restructuring costs of
$102.6 million ($0.81 per share), compared to
$102.3 million ($0.90 per share) last year. Including
restructuring costs, net earnings were $94.2 million
($0.74 per share). RONA declined to 8.2% from 8.9%
in 2004, primarily due to the increase in assets resulting
from the purchase of Schneider Foods.
OPERATING SEGMENTS
The combination of the Company’s Meat Products
Group and the Agribusiness Group comprises the
Protein Value Chain operations, which are involved in
M A N A G E M E N T ’ S D I S C U S S I O N A N D A N A L Y S I S
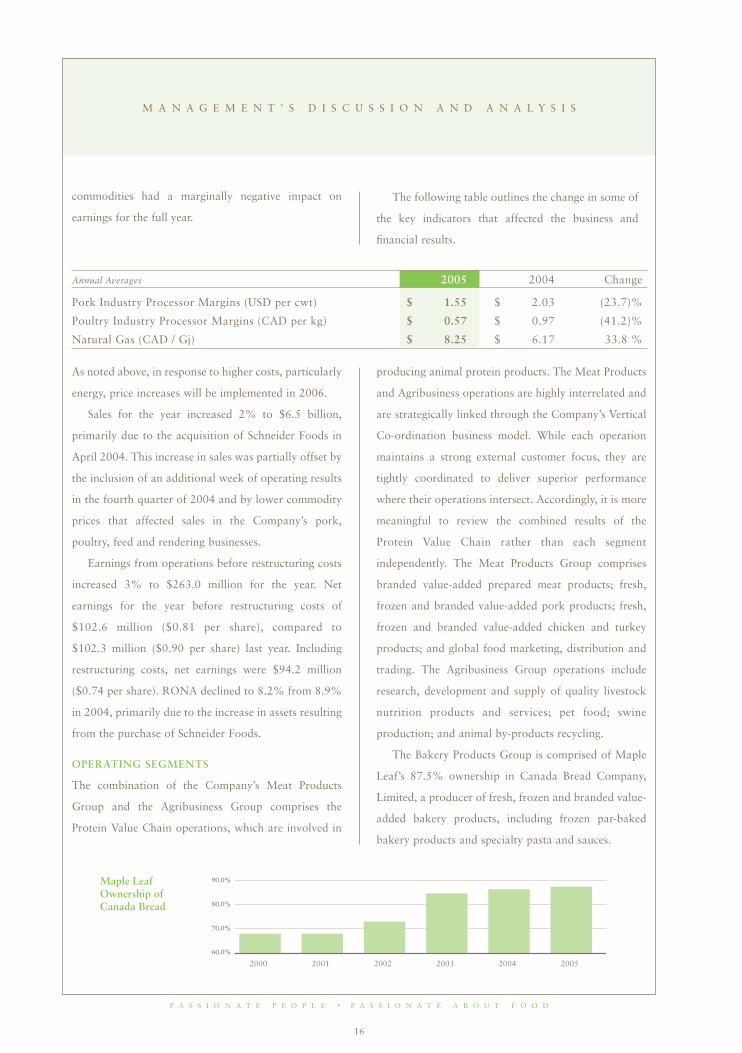
Annual Averages 2005 2004 Change
Pork Industry Processor Margins (USD per cwt) $ 1.55 $ 2.03 (23.7)%
Poultry Industry Processor Margins (CAD per kg) $ 0.57 $ 0.97 (41.2)%
Natural Gas (CAD / Gj) $ 8.25 $ 6.17 33.8 %
producing animal protein products. The Meat Products
and Agribusiness operations are highly interrelated and
are strategically linked through the Company’s Vertical
Co-ordination business model. While each operation
maintains a strong external customer focus, they are
tightly coordinated to deliver superior performance
where their operations intersect. Accordingly, it is more
meaningful to review the combined results of the
Protein Value Chain rather than each segment
independently. The Meat Products Group comprises
branded value-added prepared meat products; fresh,
frozen and branded value-added pork products; fresh,
frozen and branded value-added chicken and turkey
products; and global food marketing, distribution and
trading. The Agribusiness Group operations include
research, development and supply of quality livestock
nutrition products and services; pet food; swine
production; and animal by-products recycling.
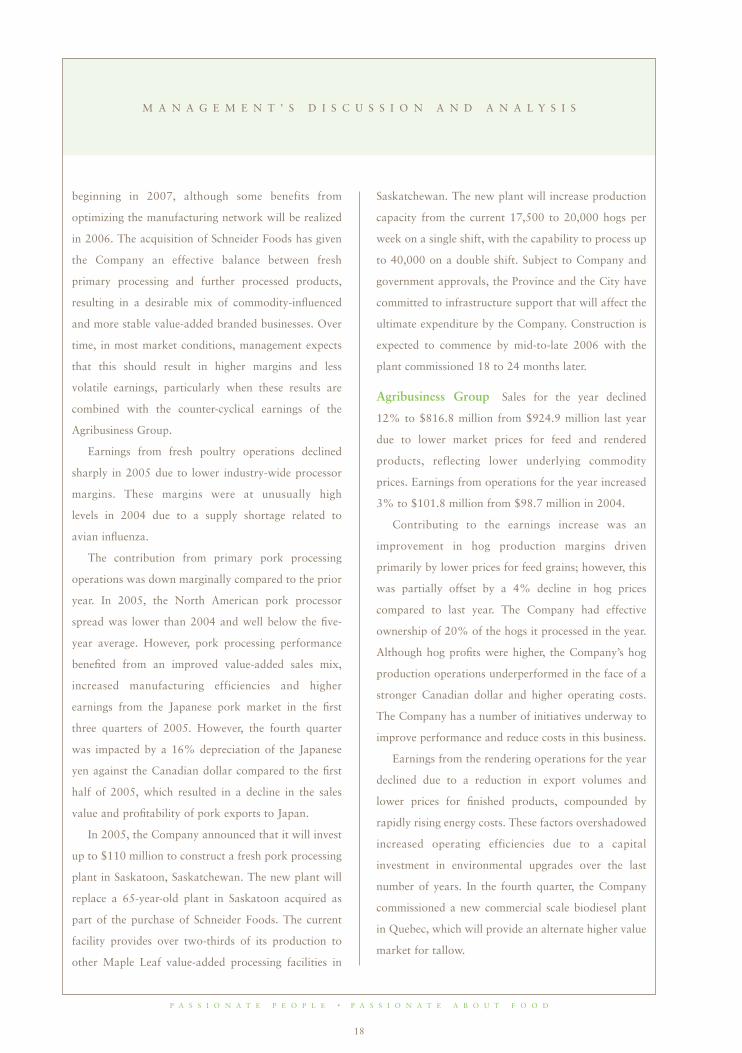
The Bakery Products Group is comprised of Maple
Leaf’s 87.5% ownership in Canada Bread Company,
Limited, a producer of fresh, frozen and branded value-
added bakery products, including frozen par-baked
bakery products and specialty pasta and sauces.
Maple Leaf Ownership of Canada Bread
60.0%
70.0%
80.0%
90.0%
2000 2001 2002 2003 2004 2005
commodities had a marginally negative impact on
earnings for the full year.
The following table outlines the change in some of
the key indicators that affected the business and
financial results.

P A S S I O N A T E P E O P L E • P A S S I O N A T E A B O U T F O O D
17
Protein Value Chain Operations Protein Value
Chain earnings for the year declined 3% due to
industry-wide decreases in both pork and poultry
processor margins, higher energy costs, higher costs in
the Company’s hog production operations and lower
profits from rendering operations. These factors more
than offset positive contributions from consumer
products and lower feed costs.
Meat Products Group Sales for the year were up
4% to $4.3 billion compared to $4.1 billion last year,
due to the acquisition of Schneider Foods in April 2004.
Offsetting this was the effect of lower commodity prices
that reduced sales values. Earnings from operations for
the year were $59.9 million, down from $68.5 million
last year.
The consumer products business, which is the
combination of the Schneider Foods and the former
M A N A G E M E N T ’ S D I S C U S S I O N A N D A N A L Y S I S
Maple Leaf Consumer Foods operations, achieved
excellent operating results driven by the full-year
contribution of Schneider Foods, lower raw material
costs and the contribution of higher margin products
such as Maple Leaf Fully Cooked Roasts and
Schneiders lunch kits. These strong results were partly
offset in the fourth quarter by higher energy costs and
timing of advertising and promotional spending to
support brand positioning and new product launches.
This business will implement price increases in 2006 to
offset inflationary costs.
The Schneider Foods merger has met expectations to
date. In 2005, the two organizations were combined
with the majority of systems integration to follow in
2006. This will yield future gains in procurement,
supply chain, working capital and customer service. An
integrated manufacturing strategy will be implemented
OPERATING REVIEW
The following table, which forms the basis of discussion in this document of the Company’s results of operations,
reflects operating earnings by business group before restructuring costs.
Earnings from Operations
($ millions) 2005 2004 Change 2003
Meat Products Group $ 59.9 $ 68.4 (13)% $ 24.3
Agribusiness Group 101.8 98.7 3 % 69.9
Protein Value Chain 161.7 167.2 (3)% 94.2
Bakery Products Group 101.3 89.2 14 % 58.2
$ 263.0 $ 256.4 3 % $ 152.4
Segmented Operating Earnings
1995 1996 1997 1998 1999 2000 2001 2002 2003 2004 2005
Meat Products Group
Agribusiness Group
Bakery Products Group
0
(50)
50
100
150
200
250
300
Ear
ning
s fr
om O
pera
tion
($
mill
ions
)
P A S S I O N A T E P E O P L E • P A S S I O N A T E A B O U T F O O D
18
beginning in 2007, although some benefits from
optimizing the manufacturing network will be realized
in 2006. The acquisition of Schneider Foods has given
the Company an effective balance between fresh
primary processing and further processed products,
resulting in a desirable mix of commodity-influenced
and more stable value-added branded businesses. Over
time, in most market conditions, management expects
that this should result in higher margins and less
volatile earnings, particularly when these results are
combined with the counter-cyclical earnings of the
Agribusiness Group.
Earnings from fresh poultry operations declined
sharply in 2005 due to lower industry-wide processor
margins. These margins were at unusually high
levels in 2004 due to a supply shortage related to
avian influenza.
The contribution from primary pork processing
operations was down marginally compared to the prior
year. In 2005, the North American pork processor
spread was lower than 2004 and well below the five-
year average. However, pork processing performance
benefited from an improved value-added sales mix,
increased manufacturing efficiencies and higher
earnings from the Japanese pork market in the first
three quarters of 2005. However, the fourth quarter
was impacted by a 16% depreciation of the Japanese
yen against the Canadian dollar compared to the first
half of 2005, which resulted in a decline in the sales
value and profitability of pork exports to Japan.
In 2005, the Company announced that it will invest
up to $110 million to construct a fresh pork processing
plant in Saskatoon, Saskatchewan. The new plant will
replace a 65-year-old plant in Saskatoon acquired as
part of the purchase of Schneider Foods. The current
facility provides over two-thirds of its production to
other Maple Leaf value-added processing facilities in
Saskatchewan. The new plant will increase production
capacity from the current 17,500 to 20,000 hogs per
week on a single shift, with the capability to process up
to 40,000 on a double shift. Subject to Company and
government approvals, the Province and the City have
committed to infrastructure support that will affect the
ultimate expenditure by the Company. Construction is
expected to commence by mid-to-late 2006 with the
plant commissioned 18 to 24 months later.
Agribusiness Group Sales for the year declined
12% to $816.8 million from $924.9 million last year
due to lower market prices for feed and rendered
products, reflecting lower underlying commodity
prices. Earnings from operations for the year increased
3% to $101.8 million from $98.7 million in 2004.
Contributing to the earnings increase was an
improvement in hog production margins driven
primarily by lower prices for feed grains; however, this
was partially offset by a 4% decline in hog prices
compared to last year. The Company had effective
ownership of 20% of the hogs it processed in the year.
Although hog profits were higher, the Company’s hog
production operations underperformed in the face of a
stronger Canadian dollar and higher operating costs.
The Company has a number of initiatives underway to
improve performance and reduce costs in this business.
Earnings from the rendering operations for the year
declined due to a reduction in export volumes and
lower prices for finished products, compounded by
rapidly rising energy costs. These factors overshadowed
increased operating efficiencies due to a capital
investment in environmental upgrades over the last
number of years. In the fourth quarter, the Company
commissioned a new commercial scale biodiesel plant
in Quebec, which will provide an alternate higher value
market for tallow.
M A N A G E M E N T ’ S D I S C U S S I O N A N D A N A L Y S I S

P A S S I O N A T E P E O P L E • P A S S I O N A T E A B O U T F O O D
19
The animal nutrition operations continued to post
steady results for the year.
Bakery Products Group Sales increased by 3% to
$1.3 billion, reflecting higher prices and continued
growth in higher value whole grain and specialty
products. Sales comparisons would have been stronger
if not for the inclusion of an additional week of
operating results in the fourth quarter of 2004.
Earnings from operations for the year increased 14%
to $101.3 million from $89.2 million in 2004 as price
increases and a sales mix that is weighted towards health
and well-being categories contributed to earnings in the
first three quarters. Earnings, particularly in the fourth
quarter, were negatively impacted by higher fuel, energy
and other inflationary costs.
Strong sales of branded whole grain, whole wheat
and specialty fresh bakery products, higher prices, and
Six Sigma driven operating improvements all
contributed to strong earnings growth for the year. This
offset the impact of rising fuel, energy and flour costs
and increased advertising and promotional spending in
the back half of the year.
The Olivieri pasta and sauce business experienced
year over year sales and volume growth reflecting a
decline in the effect of low carbohydrate diets.
The North American frozen business experienced
significant increases in fuel, energy and related costs
which offset the operational improvements in the year
in freight and distribution.
The U.K. bakery operations benefited from sales
growth largely due to overall market growth of
18%. Full year margin growth in 2005 was more than
offset by increased advertising expenditures to support
the New York Bagel brand in the U.K., higher energy
and flour costs and additional costs associated with
commissioning a new bagel plant in Rotherham, England.
Other Income Other income increased to
$7.0 million, up from $2.7 million in 2004. The
increase was due to substantially higher earnings from
equity investments acquired as part of the Schneider
Foods acquisition, insurance proceeds, and gains on
fixed asset disposals that were partially offset by a loss
on conversion of the convertible debenture in the first
quarter of 2005.
Restructuring Costs During the first quarter of
2005, the Company recorded $13.2 million in
restructuring costs ($8.8 million after-tax) in respect of
certain plant closures and operational restructuring for
several of its businesses associated with the integration
of Schneider Foods, the closure of the Company’s
bakery in Peterborough, England, and certain other
operational restructuring items. Of the $13.2 million,
$5.0 million represents the writedown of certain capital
assets that were disposed of or that have become
impaired as a result of restructuring and $8.2 million
relates to provisions for employee terminations, facility
exit costs, and other restructuring costs. Of the
$8.2 million in provisions, $2.9 million was paid
in 2005.
The Company expects to complete the remaining
major components of these restructuring plans in 2006.
Furthermore, management continues to seek out
efficiencies and further optimization opportunities. Any
such rationalization initiatives undertaken in 2006 may
result in charges to earnings and will be recorded in the
quarter in which they occur and disclosed as
restructuring costs.
Interest Expense Interest expense for the year
increased to $98.3 million compared to $89.8 million
last year. In the fourth quarter of 2004, the Company
refinanced a significant portion of its debt, replacing
short-term, lower rate debt with longer-term, fixed rate
M A N A G E M E N T ’ S D I S C U S S I O N A N D A N A L Y S I S

P A S S I O N A T E P E O P L E • P A S S I O N A T E A B O U T F O O D
20
notes that have higher interest rates than short-term
floating debt and therefore contributed to higher
average interest rates of 6.2% paid compared to last
year (2004: 6.0%). A full year impact of the acquisition
of Schneider Foods, partly offset by an equity issue in
December 2004, also contributed to higher interest
expense in the current year. At December 2005, 86% of
indebtedness was not exposed to interest rate
fluctuations.
Income Taxes Income tax expense decreased to
$51.3 million from $57.0 million in 2004. The
Company’s effective tax rate was 32.4% in 2005
compared to 33.7% in 2004. Components of the
changes are provided in Note 18 to the Consolidated
Financial Statements.
ACQUISITIONS
On April 5, 2004, the Company acquired Schneider
Foods for cash consideration of $376.7 million,
including transaction costs of $8.1 million and the
assumption of Schneider Foods’ debt, for a total
purchase price of approximately $500 million.
Schneider Foods is one of Canada’s largest producers
of premium-branded quality food products, specializing
in packaged processed meats, poultry and grocery
products. The Company employs approximately 5,000
people at 20 facilities across Canada.
As at June 30, 2005, the purchase price allocation
(including fair values assigned to intangible assets,
certain fixed assets, legal claims, long-term debt,
pensions, post-retirement benefits and taxes) had been
completed. Other costs of integration that cannot be
allocated to the purchase price were charged to earnings
as incurred. Goodwill resulting from the transaction is
included in the total assets of the Meat Products Group.
The acquisition of Schneider Foods transforms the
Meat Products Group since it significantly increased the
mix of value-added products and management
anticipates this will result in higher margins and more
stable cash flow and earnings. Schneider Foods
and Maple Leaf Consumer Foods have highly
complementary businesses and brands that provide for
significant growth and cost reduction opportunities for
the combined operations.
In May 2005, the Company purchased the
remaining 32% interest in a subsidiary of Schneider
Foods, Cappola Food Inc., for net proceeds of
approximately $3.6 million resulting in additional
goodwill of approximately $1.5 million.
TRANSACTIONS WITH RELATED PARTIES
During 2004 and 2005, the Company completed a
series of market and private agreement purchases of
Canada Bread shares. As a result of these transactions,
the ownership interest in Canada Bread increased from
84.7% at the beginning of 2004 to 87.5% as 225,300
(2004: 490,400) shares were purchased in 2005.
The aggregate value of cash paid and shares issued
to finance these transactions in 2004 and 2005 was
$29.4 million and the allocation of these amounts to
M A N A G E M E N T ’ S D I S C U S S I O N A N D A N A L Y S I S
160
80
120
)snoillim $( xepa
C
Capital Expenditures
1996
83.2
1995
71.8
1997
114.9
1998
90.8
1999
121.8
2000
108.6
2001
86.8
2002
92.2
2003
132.6
2004
156.8
2005
152.1
Meat Products Group
Agribusiness Group
Bakery Products Group
Depreciation
0
40
140
60
180
100
20
P A S S I O N A T E P E O P L E • P A S S I O N A T E A B O U T F O O D
21
the underlying assets and liabilities of Canada Bread
resulted in an increase in goodwill of $10.8 million.
On December 20, 2004, the Company issued
11.3 million common shares pursuant to a public
offering at $14.55 per share. McCain Capital
Corporation acquired 5,154,639 shares pursuant to
this equity issue, increasing its share ownership in the
Company to 33.2%.
CAPITAL RESOURCES AND LIQUIDITY
The food industry segments in which the Company
operates are generally characterized by high sales
volume and rapid turnover of inventories and accounts
receivable. In general, accounts receivable and
inventories are readily convertible into cash. An
exception to this is the Agribusiness Group where credit
granted to agricultural customers can have longer
collection terms that are matched to crop and livestock
cycles. Investment in working capital is also affected by
fluctuations in the prices of raw materials, seasonal and
other market-related fluctuations. For example,
although an increase or decrease in pork or grain
commodity prices may not affect margins, they can
have a material effect on investment in working capital,
primarily inventory and accounts receivable.
Due to its diversity of operations, the Company has
in the past consistently generated a strong base level of
operating cash flow, even in periods of higher
commodity prices and restructuring of its operations.
These operating cash flows provide a good base of
underlying liquidity that the Company supplements
with credit facilities to provide longer-term funding and
to finance fluctuations in working capital levels.
Cash Flow from Operations Operating cash flow
for the year of $259.7 million compared to
$235.5 million last year. The increase in cash flow was
largely due to a reduction in long-term receivables and
an improvement in operating working capital, offset by
an increase in future tax assets.
Capital Expenditures Capital spending for the year
decreased to $152.1 million from $156.8 million last
year. The most significant investments in capital in
2005 included the construction of a new feed mill in
Atlantic Canada, a biodiesel plant in Quebec, and
environmental upgrades in the rendering operations in
the early part of the year. During 2005, the Company
completed the construction of a bakery in Rotherham,
England, which was commissioned in the second
quarter of 2005.
Debt Facilities The Company’s strategy related to
liquidity is to reduce reliance on any single source of
credit, maintain sufficient undrawn credit facilities and
to spread debt maturities over time to reduce refinancing
risk. In order to ensure continued access to
competitively priced credit, the Company’s policy is to
maintain its primary credit ratios and leverage at levels
that provide access to investment grade credit. In
circumstances where the Company determines it is
appropriate to reduce leverage, it will use equity or other
forms of liquidity as an additional source of capital.
Immediately following the acquisition of Schneider
Foods in April 2004, the Company commenced a
financial plan to strengthen its balance sheet and
liquidity position. Through a combination of strong
operating cash flows and an equity issue in December
2004, the Company significantly reduced its leverage
ratio, net debt to EBITDA (net debt to earnings
before income taxes, depreciation and amortization),
from a post acquisition high of 3.5x to 2.6x as at
December 31, 2005.
In December 2004, the Company refinanced its
short-term acquisition debt with longer-term debt
sourced in the U.S. and Canadian private placement
M A N A G E M E N T ’ S D I S C U S S I O N A N D A N A L Y S I S

P A S S I O N A T E P E O P L E • P A S S I O N A T E A B O U T F O O D
22
market. The Company’s core revolving bank facility
was increased in size and the term extended for three
years, maturing in December 2007. In January 2005,
the Company redeemed $80 million of its 6%
convertible debentures for cash and the remaining
$11 million were tendered for conversion to common
equity. After completing these transactions, the
Company had extended the average term of its debt
facilities and secured significant un-utilized committed
liquidity. These transactions are explained more fully in
Note 8 to the Consolidated Financial Statements.
At December 31, 2005, the Company had aggregate
credit facilities, including subsidiary debt, of $1.9 billion,
of which $1.2 billion was utilized (including
$77.6 million in respect of letters of credit). Subsidiary
debt facilities available amounted to $159.9 million, of
which $136.3 was utilized (including $8.1 million in
respect of letters of credit) at year end.
To access competitively priced financing, and to
further diversify its funding sources, the Company
operates several accounts receivable financing facilities.
At year end, the Company had $230.1 million (2004:
$209.7 million) outstanding under these facilities.
Where cost effective to do so, the Company may
finance automobiles, heavy equipment, computers and
office equipment with operating lease facilities.
Variable Interest Entities (“VIEs”) In 1999, the
Company entered into agreements, including a
conditional sales agreement, to finance $130.0 million
of the construction cost of a new hog processing facility
in Brandon, Manitoba. This financing provided the
Company with access to well priced funding. The
Company is required to make payments during the term
of the agreement and, at maturity in August 2006, it is
management’s intention to purchase the facility for
$78.0 million. At December 31, 2005, the Company
had outstanding commitments of $87.8 million (2004:
$100.8 million) related to the facility. Recent changes
in Canadian accounting standards required the
re-characterization of this arrangement (see Note 2(m)
to the Consolidated Financial Statements). Therefore,
commencing January 1, 2005, the Company included
the value of the Brandon asset and a related debt
amount of $87.8 million on its balance sheet.
M A N A G E M E N T ’ S D I S C U S S I O N A N D A N A L Y S I S
Contractual Obligations The following table provides information about certain of the Company’s significant
contractual obligations as at December 31, 2005.
Payments due by fiscal year
($ millions) Total 2006 2007 2008 2009 2010 After 2010
Long-term debt $ 1,143.3 $ 110.4 $ 81.7 $ 12.9 $ 175.9 $ 217.2 $ 545.2
Cross-currency swaps related
to long-term debt 98.5 — 23.3 — 5.8 23.3 46.1
Lease obligations 203.2 40.4 31.9 25.9 18.7 16.1 70.2
Total contractual obligations $ 1,445.0 $ 150.8 $ 136.9 $ 38.8 $ 200.4 $ 256.6 $ 661.5
Management is of the opinion that its cash flow and
sources of financing provide the Company with
sufficient resources to finance ongoing business
requirements and its planned capital expenditure
program. Additional details concerning financing are
set out in the Notes to the Consolidated Financial
Statements. As at December 31, 2005, the Company
was in compliance with all debt covenants.

P A S S I O N A T E P E O P L E • P A S S I O N A T E A B O U T F O O D
23
DERIVATIVES
Inherent in the food business is the exposure to market
risks from changes in interest rates, foreign exchange
rates and commodity prices (including wheat, feed
grains and livestock). When considered appropriate,
these exposures may be managed by the use of
derivative financial instruments, including interest rate
swaps, currency contracts, commodity futures and
options. Information on the Company’s material year
end derivative hedge positions is set out in Note 10 to
the Consolidated Financial Statements. If the Company
had not entered into these contracts, operating earnings
for 2005 would have been lower by $9.0 million (2004:
higher by $16.3 million) and interest expense would
have been lower by $19.2 million (2004: lower by
$17.7 million).
Management hedges commodities when it
determines that conditions are appropriate to mitigate
risks and reduce the risk of loss from adverse changes
in commodity prices. The Company attempts to closely
match commodity contract terms with the underlying
hedged exposure and continually measures the
effectiveness of the hedge in place.
The Company either enters into interest rate swaps
or has negotiated fixed interest rates on credit facilities
such that the interest payment on a relatively high
percentage of its outstanding debt is not exposed to
fluctuations in interest rates. Details of the Company’s
outstanding derivative transactions are set out in
Note 10 to the Consolidated Financial Statements. At
December 31, 2005, 86% (2004: 96%) of the
Company’s exposure to interest rate fluctuations was
hedged or fixed.
The Company periodically enters into foreign
exchange hedges to fix certain of its foreign currency
exposure. This involves the use of cross-currency swaps
and foreign currency-denominated debt to hedge the
Company’s balance sheet exposure and the use of spot,
forward and option contracts to manage the
Company’s exposure to foreign currency cash flows.
All hedging and derivative activity is in accordance
with risk management policies that specify both the
type of allowed derivatives, maximum trading
exposures and the definition of allowable hedge
activity. Counterparty risk is monitored and controlled
carefully, and no derivative instruments may be entered
into with a counterparty whose public credit rating is
less than A credit quality.
During 2005, there were no material derivative
gains or losses related to the ineffectiveness of hedges
and no material hedges were discontinued in 2005 as a
result of it becoming probable that a forecasted
transaction would not occur.
SEASONALITY
The Company is sufficiently large and diversified that
seasonal factors within each operation and business tend
to offset each other and in isolation do not have a
material impact on the Company’s consolidated
earnings. For example, pork processing margins tend to
be higher in the back half of the year when hog prices
historically decline, and as a result, earnings from hog
production tend to be lower. Strong demand for grilled
meat products positively affects the fresh and processed
meats operations, while back to school promotions
support increased sales of bakery, sliced meats and lunch
items. Higher demand for turkey and ham products
occurs in the fourth quarter and spring holiday seasons.
SHARE CAPITAL AND DIVIDENDS
During 2005, the Company repurchased 127,000
common shares for cancellation pursuant to a normal
course issuer bid at an average exercise price of $15.66
per share. The excess of the purchase cost over the book
value of the shares was charged to retained earnings.
M A N A G E M E N T ’ S D I S C U S S I O N A N D A N A L Y S I S

P A S S I O N A T E P E O P L E • P A S S I O N A T E A B O U T F O O D
24
In each of the quarters of 2005, the Company
declared and paid cash dividends of $0.04 per common
share. This represents a total dividend of $0.16 per
common share and aggregate dividend payments of
$20 million and $18 million in the prior year.
As at January 31, 2006, there were 127,761,512
common shares of the Company issued and
outstanding.
ENVIRONMENT
Maple Leaf Foods is conscious of its environmental
responsibilities. Each of its businesses operates within
the framework of an environmental policy entitled
“Our Environmental Commitment” that is approved
by the Board of Directors’ Environment, Health and
Safety Committee. The Company’s environmental
program is monitored on a regular basis by the
Committee, including compliance with regulatory
requirements, the use of internal environmental
specialists and independent, external environmental
analyses. The Company continues to invest in
environmental infrastructure related to water, waste
and air emissions to ensure that environmental
standards continue to be met or exceeded, while
implementing procedures to minimize the impact of
operations on the environment. Expenditures related to
current environmental requirements are not expected to
have a material effect on the financial position or
earnings of the Company.
RISK FACTORS
The Company operates in the food processing sector,
and is therefore subject to risks and uncertainties
related to these businesses that may have adverse effects
on the Company’s results of operations and financial
position. Some of these risks and uncertainties are
outlined below. Prospective investors should carefully
review and evaluate the following risk factors together
with all of the other information contained in this
report. The risk factors described below are not the
only risk factors facing the Company. The Company
may be subject to risks and uncertainties not described
below that the Company is not presently aware of or
that the Company may currently deem insignificant.
Food Safety and Consumer Health The Company
is subject to risks that affect the food industry in
general, including risks posed by food spoilage or
contamination, consumer product liability, and the
potential costs and disruptions of a product recall. The
Company actively manages these risks by maintaining
strict and rigorous controls and processes in its
manufacturing facilities and distribution systems. The
Company’s facilities are subject to audit by federal
health agencies in Canada and similar institutions
outside of Canada, and performs its own audits to
ensure compliance with its internal standards, which
are generally at, or higher than, regulatory agency
standards. However, the Company cannot guarantee
that compliance with procedures and regulations will
necessarily mitigate the risks related to food safety.
Livestock The Company is susceptible to risks
related to health status of livestock both within and
outside its Protein Value Chain. Livestock health
problems could adversely affect production, supply of
raw material to manufacturing facilities and consumer
confidence. The Company monitors herd health status
and has strict bio-security procedures and employee
training programs throughout its hog production
system. However, not all livestock procured by the
Company may be subject to these processes, as hog and
poultry livestock is also purchased from independent
third parties, and the Company cannot guarantee that
an outbreak of animal disease in Canada will not have a
material adverse effect on the Company’s financial
M A N A G E M E N T ’ S D I S C U S S I O N A N D A N A L Y S I S

P A S S I O N A T E P E O P L E • P A S S I O N A T E A B O U T F O O D
25
statements. Maple Leaf Foods has developed a
comprehensive internal contingency plan for dealing
with animal disease occurrences or a more broad-based
pandemic and has taken steps to encourage the
Canadian government to enhance both the country’s
prevention measures and preparedness plans.
Credit Risk of Customers The Company sells
products, primarily feed and services, to the agricultural
industry and provides credit to customers in this sector.
Terms of sale vary from relatively short credit terms to
extended terms designed to match livestock marketing
cycles. As the Company’s customers are exposed to
market and other risk, credit provided in this segment
has a higher degree of risk and subject to greater levels
of default. The Company carefully monitors the level of
credit made available to individual customers, and
registers security where possible, but the Company
cannot completely eliminate the risk of extended credit
to agricultural customers. Default by customers on
credit extended by the Company may have a material
adverse effect on the Company’s financial condition and
results of operation.
Foreign Currencies A significant amount of the
Company’s revenues and costs are either denominated in
or directly linked to other currencies (primarily U.S.
dollars and Japanese yen). In periods when the Canadian
dollar has appreciated both rapidly and materially
against these foreign currencies, revenues linked to U.S.
dollars or Japanese yen are immediately reduced while
the Company’s ability to change prices or realize on
natural hedges may lag the immediate currency change.
The effect of such sudden change in exchange rates can
have a significant impact on the Company’s earnings.
Due to the diversity of the Company’s operations,
normal fluctuations in other currencies do not generally
have a material impact on the Company’s profitability
due to either “natural hedges” and offsetting currency
exposures (for example, when revenues and costs are
both linked to other currencies) or ability in the near
term to change prices of its products to offset adverse
currency movements. As a result, currency fluctuations
would not normally be considered a material risk to the
Company. Over time, the Company reduces this risk by
realizing natural hedges, increasing prices, or where
possible or necessary, reducing costs.
Commodity The Company is a purchaser of certain
commodities, such as wheat, feed grains, livestock and
natural gas, in the course of normal operations. The
Company may use commodity futures and options for
hedging purposes to reduce the effect of changing prices
in the short term. On a longer-term basis, the Company
manages the risk of increases in commodities and other
input costs by increasing the price it charges to
its customers.
International Trade The Company exports
significant amounts of its products to customers outside
Canada and certain of its inputs are affected by global
commodity prices. As a result, the Company can be
affected, both positively and adversely, by international
events that affect the price of food commodities or the
free flow of food products between countries. Examples
of such events are animal disease in other countries,
trade actions and tariffs on food products, and
government subsidies of competing agricultural
products. This was the case, for example, when the
United States initiated a countervail and anti-dumping
case against live swine from Canada, which disrupted
and slowed the flow of market hogs from Canada to the
United States. The Company mitigated this risk by
mounting a legal defense in conjunction with industry
stakeholders to successfully win the case. Also, in 2005,
Canada launched a case against the United States on
M A N A G E M E N T ’ S D I S C U S S I O N A N D A N A L Y S I S

P A S S I O N A T E P E O P L E • P A S S I O N A T E A B O U T F O O D
26
corn countervail and anti-dumping. The Company is
once again striving to mitigate this risk by mounting a
legal defense in conjunction with other major users of
corn and industry stakeholders, sourcing alternative
inputs, and obtaining duty deferral permits.
Hog and Pork Market Cyclicality The Company’s
results of operations and financial condition are
partially dependent upon the cost and supply of hogs
and the selling prices for its products, both of which are
influenced by constantly changing market forces of
supply and demand over which the Company has little
or no control. The North American pork processing
markets are highly competitive, with major and regional
companies competing in each market. The market prices
for pork products regularly experience periods of supply
and demand imbalance, and are sensitive to changes in
industry processing capacity. Factors contributing to this
cyclicality include the substantial capital investment and
high fixed costs required to manufacture pork products
efficiently and the significant costs associated with plant
closures. In addition, the supply and market price of live
hogs is dependent upon a variety of factors over which
the Company has little or no control, including
fluctuations in the size of herds maintained by North
American hog suppliers, environmental and
conservation regulations, economic conditions, the
relative cost of feed for hogs, weather, livestock diseases
and other factors. Although the Company’s pork value
chain Vertical Co-ordination strategy is designed to
reduce certain of these risks, severe price swings in raw
materials, and the resultant impact on the prices the
Company charges for its products, have at times had,
and may in the future have, material adverse effects on
the Company’s financial condition and results of
operations. There can be no assurance that all or part of
any increased costs experienced by the Company from
time-to-time can be passed along to consumers of the
Company’s products directly or in a timely manner. As a
result, there is no assurance that the occurrence of these
events will not have a material adverse effect on the
Company’s financial condition and results of operation.
Governmental Regulation and Changes in
Legislation The Company’s operations are subject
to extensive regulation by government agencies in the
countries in which it operates including the Canadian
Food Inspection Agency and the Ministry of
Agriculture in Canada. These agencies regulate the
processing, packaging, storage, distribution, advertising
and labelling of the Company’s products, including
food safety standards. The Company’s manufacturing
facilities and products are subject to inspection by
federal, provincial and local authorities. The Company
believes that it is currently in material compliance with
all laws and regulations and maintains all material
permits and licences relating to its operations.
Nevertheless, there can be no assurance that the
Company is in compliance with such laws and
regulations or that it will be able to comply with such
laws and regulations in the future. Failure by the
Company to comply with applicable laws and
regulations could subject the Company to civil
remedies, including fines, injunctions, recalls or
seizures, as well as potential criminal sanctions, which
could have a material adverse effect on the Company.
Various governments throughout the world are
considering regulatory proposals relating to genetically
modified organisms, drug residues or food ingredients,
food safety and market and environmental regulation
that, if adopted, may increase the Company’s costs. If
any of these or other proposals are enacted, the
Company could experience a disruption in supply and
may be unable to pass on the cost increases to its
M A N A G E M E N T ’ S D I S C U S S I O N A N D A N A L Y S I S

P A S S I O N A T E P E O P L E • P A S S I O N A T E A B O U T F O O D
27
customers without incurring volume loss as a result of
higher prices.
Environmental Regulation The Company’s
operations are subject to extensive environmental laws
and regulations pertaining to the discharge of materials
into the environment and the handling and disposition
of wastes (including solid and hazardous wastes) or
otherwise relating to protection of the environment.
Failure to comply can have serious consequences, such
as criminal as well as civil penalties, liability for
damages, and negative publicity to the Company. The
Company has incurred and will continue to incur
capital and operating expenditures to comply with such
laws and regulations. No assurances can be given that
additional environmental issues relating to presently
known matters or identified sites or to other matters or
sites will not require additional expenditures, or that
requirements applicable to the Company will not be
altered in ways that will require the Company to incur
significant additional costs. In addition, certain of the
Company’s facilities have been in operation for many
years and, over such time, the Company and other prior
operators of such facilities have generated and disposed
of wastes which are or may be considered hazardous.
Future discovery of previously unknown contamination
of property underlying or in the vicinity of the
Company’s present or former properties or
manufacturing facilities and/or waste disposal sites
could require the Company to incur material
unforeseen expenses. Occurrences of any such events
may have a material affect on the Company’s financial
results and financial condition.
Consolidating Customer Environment As the
retail grocery and foodservice trades continue to
consolidate and customers grow larger, the Company is
required to adjust to changes in purchasing practices
and customer sophistication, as failure to do so could
result in losing sales volumes and market share. The
Company’s net sales and profitability could also be
affected by deterioration in the financial condition of,
or other adverse developments in the relationship with,
one or more of its major customers.
Leverage The terms of the Company’s credit
facilities and the terms of the notes, if issued, include
covenants which could limit the Company’s operating
and financial flexibility. The Company’s ability to make
scheduled payments of principal or interest on, or
refinance, its indebtedness depends on its future
business performance, which is subject to economic,
financial, competitive and other factors beyond its
control. Any failure by the Company to satisfy its
obligations with respect to its indebtedness at maturity
or prior thereto would constitute a default under such
indebtedness and could cause a default under the
agreements governing other indebtedness, if any, of
the Company.
Animal Disease and Pandemic The Company is
subject to risks that affect agriculture and animal
health, including disease affecting its employees, such as
a pandemic. These risks can result in disruptions of
trade, consumer confidence issues, and impact its ability
to manufacture, ship products and perform core
business processes. The Company actively manages
these risks by maintaining a general emergency
response process. These processes involve prevention,
preparedness including emergency simulations,
response and recovery plans. In 2005, the Company
initiated a project to update its emergency response
plans to more thoroughly address pandemic
implications. An annual update to these plans will
M A N A G E M E N T ’ S D I S C U S S I O N A N D A N A L Y S I S
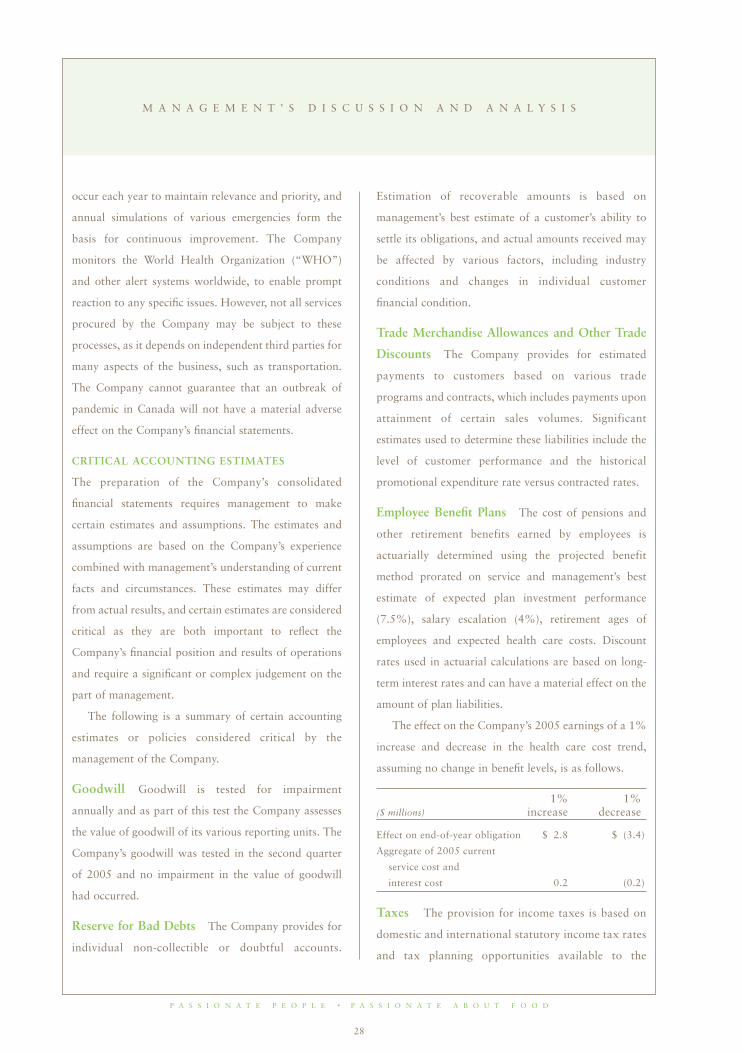
P A S S I O N A T E P E O P L E • P A S S I O N A T E A B O U T F O O D
28
occur each year to maintain relevance and priority, and
annual simulations of various emergencies form the
basis for continuous improvement. The Company
monitors the World Health Organization (“WHO”)
and other alert systems worldwide, to enable prompt
reaction to any specific issues. However, not all services
procured by the Company may be subject to these
processes, as it depends on independent third parties for
many aspects of the business, such as transportation.
The Company cannot guarantee that an outbreak of
pandemic in Canada will not have a material adverse
effect on the Company’s financial statements.
CRITICAL ACCOUNTING ESTIMATES
The preparation of the Company’s consolidated
financial statements requires management to make
certain estimates and assumptions. The estimates and
assumptions are based on the Company’s experience
combined with management’s understanding of current
facts and circumstances. These estimates may differ
from actual results, and certain estimates are considered
critical as they are both important to reflect the
Company’s financial position and results of operations
and require a significant or complex judgement on the
part of management.
The following is a summary of certain accounting
estimates or policies considered critical by the
management of the Company.
Goodwill Goodwill is tested for impairment
annually and as part of this test the Company assesses
the value of goodwill of its various reporting units. The
Company’s goodwill was tested in the second quarter
of 2005 and no impairment in the value of goodwill
had occurred.
Reserve for Bad Debts The Company provides for
individual non-collectible or doubtful accounts.
Estimation of recoverable amounts is based on
management’s best estimate of a customer’s ability to
settle its obligations, and actual amounts received may
be affected by various factors, including industry
conditions and changes in individual customer
financial condition.
Trade Merchandise Allowances and Other Trade
Discounts The Company provides for estimated
payments to customers based on various trade
programs and contracts, which includes payments upon
attainment of certain sales volumes. Significant
estimates used to determine these liabilities include the
level of customer performance and the historical
promotional expenditure rate versus contracted rates.
Employee Benefit Plans The cost of pensions and
other retirement benefits earned by employees is
actuarially determined using the projected benefit
method prorated on service and management’s best
estimate of expected plan investment performance
(7.5%), salary escalation (4%), retirement ages of
employees and expected health care costs. Discount
rates used in actuarial calculations are based on long-
term interest rates and can have a material effect on the
amount of plan liabilities.
The effect on the Company’s 2005 earnings of a 1%
increase and decrease in the health care cost trend,
assuming no change in benefit levels, is as follows.
1% 1%($ millions) increase decrease
Effect on end-of-year obligation $ 2.8 $ (3.4)
Aggregate of 2005 current
service cost and
interest cost 0.2 (0.2)
Taxes The provision for income taxes is based on
domestic and international statutory income tax rates
and tax planning opportunities available to the
M A N A G E M E N T ’ S D I S C U S S I O N A N D A N A L Y S I S

P A S S I O N A T E P E O P L E • P A S S I O N A T E A B O U T F O O D
29
Company in the jurisdictions in which it operates.
Significant judgement is required in determining
income tax provisions and in evaluating tax positions.
The Company establishes additional provisions for
income taxes when, despite the belief that existing tax
positions are fully supportable, there remain certain tax
positions that may be reviewed by tax authorities. The
Company adjusts these additional accruals in light of
changing facts and circumstances. The tax provision
includes the impact of changes to accruals that are
considered appropriate.
Restructuring Reserves The Company evaluates
accruals related to restructuring at each reporting date
to ensure these accruals are still appropriate. In certain
instances, management may determine that these
accruals are no longer required because of efficiencies in
carrying out restructuring activities. In certain
circumstances, management may determine that certain
accruals are insufficient as new events occur or as
additional information is obtained.
CHANGES IN ACCOUNTING POLICIES
Convertible Debt Effective January 1, 2005, the
Company adopted an amendment to Canadian
accounting principles, section 3860, “Financial
Instruments – Disclosure and Presentation”, on a
retroactive basis with restatement of prior periods. The
revised standard, which is effective for January 1, 2005,
requires obligations of a fixed amount that may be
settled, at the issuer’s option, by a variable number of
the issuer’s own equity instruments to be presented as
liabilities. As a result of adopting the revised standard,
the Company reclassified the principal component of its
convertible debenture (see Note 12 to the Consolidated
Financial Statements) as a debt instrument and
reclassified the interest, accretion charges and related
tax effects in the statement of earnings in the
comparative periods. Retroactive application of this
standard resulted in a reclassification of $89.7 million
from shareholders’ equity to debt as at December 31,
2004. The impact of the revised standard was a
reduction in net earnings of $4.5 million (net of tax) for
the year ended December 31, 2004 and $4.5 million for
the year ended December 31, 2005. There was no
impact to basic or diluted earnings per share for prior
periods as a result of adopting this change.
Variable Interest Entities (“VIEs”) The Company
adopted the guidance in Accounting Guideline 15,
“Consolidation of Variable Interest Entities”,
retroactively without restatement of prior periods,
effective January 1, 2005. As a result of the adoption,
there are several previously unconsolidated entities that
are now consolidated with the results of the Company.
The most significant was the consolidation of the
Company’s hog processing facility in Brandon,
Manitoba. This resulted in an increase in assets and
long-term debt of approximately $87.8 million as of
December 31, 2005. In addition, several of the
Company’s investments in various previously equity-
accounted hog facilities are now consolidated. The
results of the consolidation of these hog production
facilities is an increase in debt of approximately
$19.7 million and an increase in total assets of
approximately $29.0 million. There was no impact on
the net earnings of the Company arising from the
consolidation of these entities.
Sales Classification New guidance provided by EIC
Abstract 156 “Accounting by a Vendor for
Consideration Given to a Customer (including a reseller
of the vendor’s products)” requires vendors to classify
certain consideration provided to customers as a
M A N A G E M E N T ’ S D I S C U S S I O N A N D A N A L Y S I S

P A S S I O N A T E P E O P L E • P A S S I O N A T E A B O U T F O O D
30
First Second Third Fourth
($ millions) Quarter Quarter Quarter Quarter Total
2005
Reported sales $ 1,582.3 $ 1,666.2 $ 1,615.8 $ 1,598.2 $ 6,462.6
Trade merchandising allowances
and other discounts 81.6 85.8 86.2 79.7 333.3
Adjusted sales $ 1,500.7 $ 1,580.4 $ 1,529.6 $ 1,518.5 $ 6,129.3
2004
Reported sales $ 1,194.7 $ 1,689.5 $ 1,698.5 $ 1,782.3 $ 6,365.0
Trade merchandising allowances
and other discounts 50.0 83.2 85.3 90.4 308.9
Adjusted sales $ 1,144.7 $ 1,606.3 $ 1,613.2 $ 1,691.9 $ 6,056.1
RECENT ACCOUNTING PRONOUNCEMENTS
In 2005, the Canadian Accounting Standards Board
issued three new standards that introduce new
requirements for the recognition and measurement of
financial instruments that are based on and similar to
standards issued by the Financial Accounting Standards
Board in the U.S. and the International Accounting
Standards Board.
Comprehensive Income Section 1530 requires that
entities present comprehensive income and its
components, as well as net income in its financial
statements. Comprehensive income is the change in
equity of an enterprise during a period from
transactions and other events from non-owner sources.
It includes all changes in equity during a period except
those resulting from investments by and distributions
to owners.
M A N A G E M E N T ’ S D I S C U S S I O N A N D A N A L Y S I S
Financial Instruments Section 3855 requires that
all financial assets be classified as held for trading, held
to maturity, loans and receivables or available for sale.
All derivative instruments, including those that are
embedded in, but not closely related to, another
contract must be classified as held for trading. Financial
assets and liabilities classified as held for trading must
be measured at fair value with gains and losses
recognized in the periods in which they arise. Financial
assets classified as held to maturity, loans and
receivables, and financial liabilities not classified as held
for trading, must be measured at their amortized cost.
Financial assets classified as available for sale are
measured at fair value with gains and losses recognized
in other comprehensive income until the underlying
financial asset is derecognized or becomes impaired.
reduction of revenue rather than as cost of sales unless
the vendor receives, or will receive, an identifiable
benefit in exchange for the consideration. This EIC is
effective for fiscal and interim periods beginning on or
after January 1, 2006. The Company will adopt this
standard retroactively as of January 1, 2006 as required.
The impact of the adoption of this standard will
reduce sales by approximately $333.3 million (2004:
$308.9 million), with no impact on net earnings or
EPS as follows.
P A S S I O N A T E P E O P L E • P A S S I O N A T E A B O U T F O O D
31
M A N A G E M E N T ’ S D I S C U S S I O N A N D A N A L Y S I S
Hedges Section 3865 establishes standards for when
and how hedge accounting may be applied. The
standard requires that hedges be designated as either
fair value hedges, cash flow hedges or hedges of a net
investment in a self-sustaining operation. For a fair
value hedge, the gain or loss on the hedging item is
recognized in earnings in the period of change together
with the offsetting change attributable to the hedged
risk. For a cash flow hedge, as well as a hedge of a net
investment in a self-sustaining foreign operation, the
effective portion of the gain or loss on the hedging item
is initially reported in other comprehensive income and
subsequently recognized in earnings when the hedged
item affects earnings.
These three new accounting standards are effective for
fiscal years beginning on or after October 1, 2006 and
would therefore be applicable to the Company’s 2007
fiscal year. The Company has not yet determined the
impact of these new standards on its operations and
financial condition.
Variable Interest Entities In October 2005,
EIC-157 “Implicit Variable Interests under AcG-15”
was issued which clarifies that a reporting enterprise
should consider whether it holds an implicit variable
interest in a VIE or potential VIE. The Committee also
reached a consensus that the determination of whether
an implicit variable interest exists should be based on
whether the reporting enterprise may absorb variability
of the VIE or potential VIE. The Company adopted the
guidance in AcG-15 retroactively without restatement
of prior periods, effective January 1, 2005. The
adoption of this guideline did not have a material
impact on the Company.
Conditional Asset Retirement Obligations In
December 2005, the EIC released abstract EIC-159,
“Conditional Asset Retirement Obligations”. A
conditional asset retirement obligation is an obligation
associated with the retirement of a long-lived asset
where the timing and/or method of settlement are
conditional on a future event. To address the issue of
when to recognize such an obligation, the Committee
reached a consensus that a liability be recognized at fair
value when the fair value of the obligation can be
reasonably estimated. Should the fair value of the
obligation not be reasonably estimable, this fact and its
reason(s) are to be disclosed. The Company does not
anticipate this EIC to have any impact on its results or
financial position.
RESPONSIBILITIES OF MANAGEMENT AND
BOARD OF DIRECTORS
Management is responsible for the reliability and
timeliness of content disclosed in the Management’s
Discussion & Analysis (“MD&A”), which is current as
of February 22, 2006. Management also acknowledges
responsibility for the existence and effectiveness of
systems, controls and procedures to ensure that
information used internally by management and
disclosed externally is reliable and timely.
It is the responsibility of the Audit Committee to
provide oversight in reviewing the MD&A and the
Board of Directors to approve the MD&A. The Board
of Directors and the Audit Committee review all
material matters relating to the necessary systems,
controls and procedures in place to ensure the
appropriateness and timeliness of MD&A disclosures.

P A S S I O N A T E P E O P L E • P A S S I O N A T E A B O U T F O O D
32
SUMMARY OF QUARTERLY RESULTS
The following is a summary of unaudited quarterly financial information for the eight interim periods ended December
31, 2005 (in thousands of dollars except per share information).
First Second Third Fourth
Quarter Quarter Quarter Quarter Total
Sales 2005 $ 1,582,278 $ 1,666,243 $ 1,615,812 $ 1,598,248 $ 6,462,581
2004 1,194,731 1,689,490 1,698,508 1,782,254 6,364,983
Net earnings 2005 12,748 33,237 30,061 18,196 94,242
2004(i) 18,115 25,035 26,710 32,423 102,283
Net earnings before
restructuring costs 2005 21,094 33,237 30,061 18,196 102,588
2004(i) 18,115 25,035 26,710 32,423 102,283
Earnings per share:
Basic 2005 $ 0.10 $ 0.26 $ 0.24 $ 0.14 $ 0.74
2004 0.16 0.22 0.24 0.28 0.90
Basic before
restructuring costs 2005 0.17 0.26 0.24 0.14 0.81
2004 0.16 0.22 0.24 0.28 0.90
Diluted 2005 0.10 0.25 0.23 0.14 0.72
2004 0.16 0.22 0.23 0.28 0.89 (i) Restated in accordance with Note 2 to the Consolidated Financial Statements.
For an explanation and analysis of quarterly results, refer to the MD&A in the 2005 Interim Reports to Shareholders
filed on SEDAR and also available on the Company’s website at www.mapleleaf.com.
FORWARD-LOOKING STATEMENTS
This document contains, and the Company’s oral and
written public communications often contain, forward-
looking statements that are based on current
expectations, estimates, forecasts and projections about
the industries in which the Company operates and
beliefs and assumptions made by the management of
the Company. Such statements include, but are not
limited to, statements with respect to our objectives and
goals, as well as statements with respect to our beliefs,
plans, objectives, expectations, anticipations, estimates
and intentions. Words such as “expect,” “anticipate,”
“intend,” “attempt,” “may,” “plan,” “believe,”
“seek,” “estimate,” and variations of such words and
M A N A G E M E N T ’ S D I S C U S S I O N A N D A N A L Y S I S
similar expressions are intended to identify such
forward-looking statements. These statements are not
guarantees of future performance and involve
assumptions and risks and uncertainties that are
difficult to predict. Therefore, actual outcomes and
results may differ materially from what is expressed,
implied or forecasted in such forward-looking
statements. The Company does not intend, and the
Company disclaims any obligation to update any
forward-looking statements, whether written or oral, or
whether as a result of new information, future events
or otherwise.
These forward-looking statements are based on a
variety of factors and assumptions including, but not

P A S S I O N A T E P E O P L E • P A S S I O N A T E A B O U T F O O D
33
limited to: the condition of the Canadian and U.S.
economies, the rate of appreciation of the Canadian
dollar versus the U.S. dollar and Japanese yen, the
availability and prices of livestock, raw materials,
energy and supplies, product pricing, the competitive
environment and related market conditions, operating
efficiencies, access to capital, the cost of compliance
with environmental and health standards, adverse
results from ongoing litigation and actions of domestic
and foreign governments. These assumptions have been
derived from information currently available to the
Company including information obtained by the
Company from third-party industry analysts. Actual
results may differ materially from those predicted by
such forward-looking statements. While the Company
does not know what impact any of these differences
may have, its business, results of operations, financial
condition and the market price of its securities may be
materially adversely affected. Factors that could cause
actual results or outcomes to differ materially from the
results expressed or implied by forward-looking
statements include, among other things: the risks posed
by food contamination, consumer liability and product
recalls; the risks related to the health status of livestock;
the risks related to the creditworthiness of customers to
whom the Company extends credit; the Company’s
exposure to currency exchange risks; the impact of
international events on commodity prices and the free
flow of goods; the cyclical nature of the cost and supply
of hogs and the pork market generally; the risks posed
by compliance with extensive government regulation;
the impact of the rate of duty imposed by the United
States government on the shipment of live swine to the
United States; the risk due to the consolidating
customer environment; leverage risk and the risk posed
by pandemic.
M A N A G E M E N T ’ S D I S C U S S I O N A N D A N A L Y S I S

P A S S I O N A T E P E O P L E • P A S S I O N A T E A B O U T F O O D
34
Management recognizes its responsibility for conducting
the Company’s affairs in the best interests of all its
shareholders. The Consolidated Financial Statements
and related information in the annual report are the
responsibility of management. The Consolidated
Financial Statements have been prepared in accordance
with Canadian generally accepted accounting principles,
which involve the use of judgement and estimates in
applying the accounting principles selected. Other
financial information in the annual report is consistent
with that in the Consolidated Financial Statements.
The Company maintains systems of internal controls,
which are designed to provide reasonable assurance that
accounting records are reliable and to safeguard the
Company’s assets. The Company’s independent auditors,
KPMG LLP, Chartered Accountants, have audited and
reported on the Company’s Consolidated Financial
Statements. Their opinion is based upon audits
conducted by them in accordance with Canadian
generally accepted auditing standards to obtain
reasonable assurance that the Consolidated Financial
Statements are free of material misstatement.
The Audit Committee of the Board of Directors, all
of whom are independent of the Company or any of its
affiliates, meets periodically with the independent
external auditors, the internal auditors and
management representatives to review the internal
accounting controls, the consolidated quarterly and
annual financial statements and other financial
reporting matters. Both the internal and independent
external auditors have unrestricted access to the Audit
Committee. The Audit Committee reports its findings
and makes recommendations to the Board of Directors.
M A N A G E M E N T ’ S S T A T E M E N T O F R E S P O N S I B I L I T Y
We have audited the consolidated balance sheets of
Maple Leaf Foods Inc. as at December 31, 2005 and
2004 and the consolidated statements of earnings,
retained earnings and cash flows for the years then
ended. These financial statements are the responsibility
of the Company’s management. Our responsibility is to
express an opinion on these financial statements based
on our audits.
We conducted our audits in accordance with
Canadian generally accepted auditing standards. Those
standards require that we plan and perform an audit to
obtain reasonable assurance whether the financial
statements are free of material misstatement. An audit
includes examining, on a test basis, evidence supporting
the amounts and disclosures in the financial statements.
An audit also includes assessing the accounting
principles used and significant estimates made by
management, as well as evaluating the overall financial
statement presentation.
In our opinion, these consolidated financial
statements present fairly, in all material respects, the
financial position of the Company as at December 31,
2005 and 2004 and the results of its operations and its
cash flows for the years then ended in accordance with
Canadian generally accepted accounting principles.
Chartered Accountants
Toronto, Canada
February 21, 2006
A U D I T O R S ’ R E P O R T T O T H E S H A R E H O L D E R S
February 21, 2006
M. H. VelsM. H. McCain Executive Vice-President andPresident and Chief Executive Officer Chief Financial Officer

P A S S I O N A T E P E O P L E • P A S S I O N A T E A B O U T F O O D
35
C O N S O L I D A T E D B A L A N C E S H E E T S
As at December 31(In thousands of Canadian dollars)
2005 2004
ASSETS
Current assetsCash and cash equivalents $ 80,502 $ 111,770
Accounts receivable (Note 3) 247,014 292,462
Inventories (Note 4) 400,848 385,128
Future tax asset – current (Note 18) 15,329 6,708
Prepaid expenses and other assets 12,104 13,218
755,797 809,286
Investments in associated companies 61,939 82,302
Property and equipment (Note 5) 1,137,317 973,718
Other long-term assets (Note 6) 261,907 246,603
Future tax asset – non-current (Note 18) 38,499 26,976
Goodwill 847,853 816,408
Other intangibles (Note 7) 86,468 82,840
$ 3,189,780 $ 3,038,133
LIABILITIES AND SHAREHOLDERS’ EQUITY
Current liabilitiesAccounts payable and accrued charges $ 669,941 $ 637,966
Income and other taxes payable 31,727 27,651
Current portion of long-term debt (Note 8) 110,428 105,910
812,096 771,527
Long-term debt (Note 8) 1,032,829 1,052,195
Future tax liability (Note 18) 56,183 29,207
Other long-term liabilities (Note 9) 202,576 205,542
Minority interest 87,425 74,109
Shareholders’ equity (Note 13) 998,671 905,553
$ 3,189,780 $ 3,038,133
Contingencies and commitments (Note 22)
See accompanying Notes to the Consolidated Financial Statements
On behalf of the Board:
Michael H. McCain Robert W. Hiller
Director Director
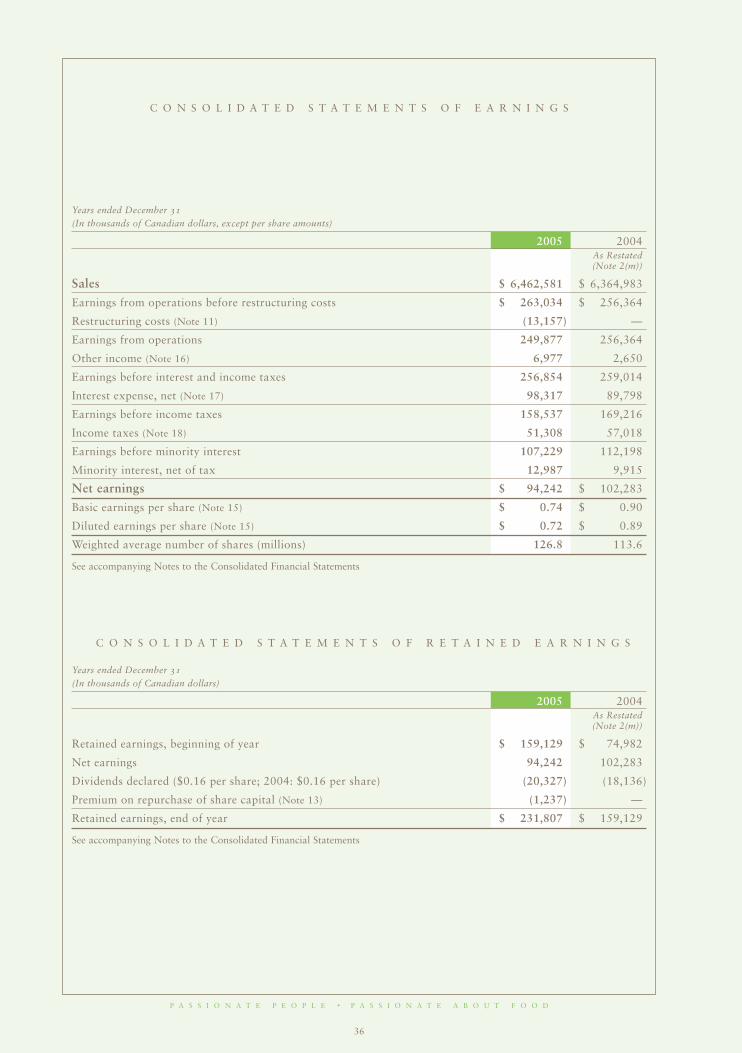
P A S S I O N A T E P E O P L E • P A S S I O N A T E A B O U T F O O D
36
C O N S O L I D A T E D S T A T E M E N T S O F E A R N I N G S
Years ended December 31(In thousands of Canadian dollars, except per share amounts)
2005 2004As Restated (Note 2(m))
Sales $ 6,462,581 $ 6,364,983
Earnings from operations before restructuring costs $ 263,034 $ 256,364
Restructuring costs (Note 11) (13,157) —
Earnings from operations 249,877 256,364
Other income (Note 16) 6,977 2,650
Earnings before interest and income taxes 256,854 259,014
Interest expense, net (Note 17) 98,317 89,798
Earnings before income taxes 158,537 169,216
Income taxes (Note 18) 51,308 57,018
Earnings before minority interest 107,229 112,198
Minority interest, net of tax 12,987 9,915
Net earnings $ 94,242 $ 102,283
Basic earnings per share (Note 15) $ 0.74 $ 0.90
Diluted earnings per share (Note 15) $ 0.72 $ 0.89
Weighted average number of shares (millions) 126.8 113.6
See accompanying Notes to the Consolidated Financial Statements
C O N S O L I D A T E D S T A T E M E N T S O F R E T A I N E D E A R N I N G S
Years ended December 31(In thousands of Canadian dollars)
2005 2004As Restated (Note 2(m))
Retained earnings, beginning of year $ 159,129 $ 74,982
Net earnings 94,242 102,283
Dividends declared ($0.16 per share; 2004: $0.16 per share) (20,327) (18,136)
Premium on repurchase of share capital (Note 13) (1,237) —
Retained earnings, end of year $ 231,807 $ 159,129
See accompanying Notes to the Consolidated Financial Statements

P A S S I O N A T E P E O P L E • P A S S I O N A T E A B O U T F O O D
37
C O N S O L I D A T E D S T A T E M E N T S O F C A S H F L O W S
Years ended December 31(In thousands of Canadian dollars)
2005 2004As Restated (Note 2(m))
CASH PROVIDED BY (USED IN)
Operating activitiesNet earnings $ 94,242 $ 102,283
Add (deduct) items not affecting cash
Depreciation and amortization 132,489 125,494
Stock-based compensation (Note 14) 8,425 4,095
Minority interest 12,987 9,915
Future income taxes (8,921) 7,985
Undistributed earnings of associated companies (7,620) (6,289)
Loss on repayment of convertible debenture 1,108 —
Gain on sale of property and equipment (5,814) (892)
Loss (gain) on sale of investments 363 (417)
Other (3,026) (21,053)
Change in other long-term receivables 6,840 (6,018)
Increase in net pension asset (39,226) (38,247)
Change in non-cash operating working capital 67,836 58,614
259,683 235,470Financing activitiesDividends paid (20,327) (18,136)
Dividends paid to minority interest (1,031) (956)
Increase in long-term debt 592 1,023,007
Decrease in long-term debt (122,948) (772,101)
Increase in share capital (Note 13) 19,421 166,243
Shares repurchased for cancellation (Note 13) (1,989) —
Other (13,454) (17,529)
(139,736) 380,528Investing activitiesAdditions to property and equipment (152,130) (156,777)
Proceeds from sale of property and equipment 14,778 12,649
Purchase of Canada Bread shares (Note 20) (7,004) (18,909)
Purchase of net assets of businesses, net of cash acquired (Note 21) (3,621) (382,666)
Change in investments, net — 1,111
Other (3,238) 1,456
(151,215) (543,136)
Increase (decrease) in cash and cash equivalents (31,268) 72,862
Cash and cash equivalents, beginning of year 111,770 38,908
Cash and cash equivalents, end of year $ 80,502 $ 111,770
Supplemental cash flow information:
Net interest paid $ 103,342 $ 77,585
Net income taxes paid 54,053 44,910
See accompanying Notes to the Consolidated Financial Statements

P A S S I O N A T E P E O P L E • P A S S I O N A T E A B O U T F O O D
38
1. THE COMPANY
Maple Leaf Foods Inc. (“Maple Leaf Foods” or the “Company”) is a leading Canadian-based food processing
company, serving wholesale, retail, foodservice, industrial and agricultural customers across North America and
internationally. The Company’s results are organized into three segments: Meat Products Group, Agribusiness Group
and Bakery Products Group.
2. SIGNIFICANT ACCOUNTING POLICIES
The following are the significant accounting policies of the Company. The preparation of periodic financial statements
necessarily involves the use of estimates and approximations. Should the underlying assumptions change, the actual
amounts could differ from those estimates.
(a) Principles of consolidationThe consolidated financial statements include the accounts of the Company and its subsidiaries and the Company’s
proportionate share of the assets, liabilities, revenue and expenses of joint ventures over which the Company
exercises joint control. Investments in associated companies, over which the Company exercises significant
influence, are accounted for by the equity method. Variable Interest Entities (“VIEs”), as defined by Accounting
Guideline 15 – “Consolidation of Variable Interest Entities” are consolidated by the Company when it is
determined that the Company will, as the primary beneficiary, absorb the majority of the VIEs expected losses
and/or expected residual returns.
(b) Translation of foreign currenciesThe accounts of the Company are presented in Canadian dollars. The financial statements of foreign subsidiaries,
associated companies and joint ventures whose unit of measure is not the Canadian dollar are translated into
Canadian dollars using the exchange rate in effect at the year-end for assets and liabilities and the average exchange
rates for the period for revenue and expenses. Exchange gains or losses on translation of foreign subsidiaries are
deferred and included as a separate component in shareholders’ equity until realized.
(c) Hedging arrangementsThe Company enters into hedging arrangements to manage its exposure to currency, commodity price and interest
rate fluctuations. The Company uses hedge accounting to record for these derivative transactions.
The Company formally documents all relationships between hedging instruments and hedged items, as well as
its risk management objective and strategy for undertaking various hedged transactions. This process includes
assigning all derivatives to specific assets and liabilities on the balance sheet or to specific firm commitments or
anticipated transactions. The Company formally assesses, using regression analysis, both at the inception of the
hedge and on a quarterly basis, whether the derivatives that are used in hedging transactions are effective in
offsetting the changes in the fair values or the cash flows of hedged items.
The Company uses currency forward contracts and options to hedge its exposures to transactions denominated
in foreign currencies. The Company also uses futures and options to hedge its exposures to commodity based
transactions (wheat, live hogs, grains). When the criteria for hedge effectiveness is met, the gains and losses on the
currency and/or commodity hedging instruments are recognized in the consolidated financial statements in the same
period as the underlying transaction is recorded in net earnings. Any accrued amounts receivable and payable under
the terms of such contracts are included in accounts receivable and accounts payable, respectively. When hedge
effectiveness is not met, the Company records the fair value of the hedging items as other liabilities or assets on the
balance sheet. Any resulting gains or losses are recorded in operating earnings. Where the Company enters into
forward exchange contracts to hedge the principal and/or interest on related debt payable in foreign currencies,
unrealized losses or gains on such contracts are matched with exchange gains or losses on the debt and/or interest
payable.
The Company enters into interest rate and foreign exchange swaps to reduce the impact of fluctuating interest
N O T E S T O T H E C O N S O L I D A T E D F I N A N C I A L S T A T E M E N T S
Years ended December 31, 2005 and 2004 (Tabular amounts in thousands of Canadian dollars, unless otherwise indicated)
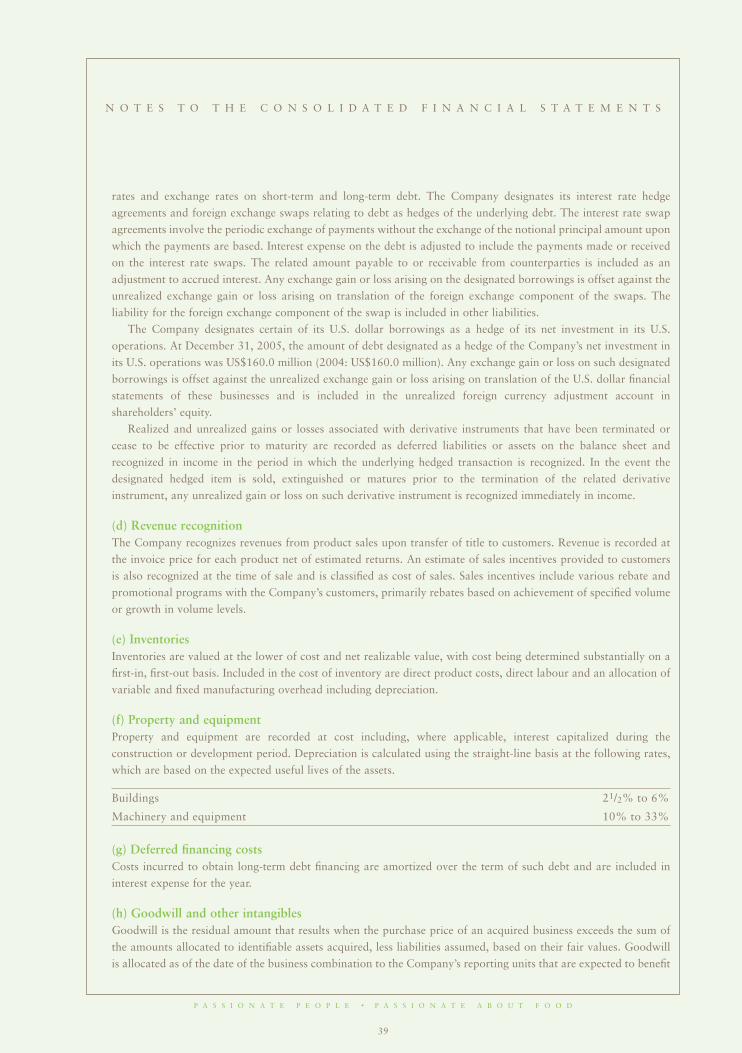
P A S S I O N A T E P E O P L E • P A S S I O N A T E A B O U T F O O D
39
rates and exchange rates on short-term and long-term debt. The Company designates its interest rate hedge
agreements and foreign exchange swaps relating to debt as hedges of the underlying debt. The interest rate swap
agreements involve the periodic exchange of payments without the exchange of the notional principal amount upon
which the payments are based. Interest expense on the debt is adjusted to include the payments made or received
on the interest rate swaps. The related amount payable to or receivable from counterparties is included as an
adjustment to accrued interest. Any exchange gain or loss arising on the designated borrowings is offset against the
unrealized exchange gain or loss arising on translation of the foreign exchange component of the swaps. The
liability for the foreign exchange component of the swap is included in other liabilities.
The Company designates certain of its U.S. dollar borrowings as a hedge of its net investment in its U.S.
operations. At December 31, 2005, the amount of debt designated as a hedge of the Company’s net investment in
its U.S. operations was US$160.0 million (2004: US$160.0 million). Any exchange gain or loss on such designated
borrowings is offset against the unrealized exchange gain or loss arising on translation of the U.S. dollar financial
statements of these businesses and is included in the unrealized foreign currency adjustment account in
shareholders’ equity.
Realized and unrealized gains or losses associated with derivative instruments that have been terminated or
cease to be effective prior to maturity are recorded as deferred liabilities or assets on the balance sheet and
recognized in income in the period in which the underlying hedged transaction is recognized. In the event the
designated hedged item is sold, extinguished or matures prior to the termination of the related derivative
instrument, any unrealized gain or loss on such derivative instrument is recognized immediately in income.
(d) Revenue recognitionThe Company recognizes revenues from product sales upon transfer of title to customers. Revenue is recorded at
the invoice price for each product net of estimated returns. An estimate of sales incentives provided to customers
is also recognized at the time of sale and is classified as cost of sales. Sales incentives include various rebate and
promotional programs with the Company’s customers, primarily rebates based on achievement of specified volume
or growth in volume levels.
(e) InventoriesInventories are valued at the lower of cost and net realizable value, with cost being determined substantially on a
first-in, first-out basis. Included in the cost of inventory are direct product costs, direct labour and an allocation of
variable and fixed manufacturing overhead including depreciation.
(f) Property and equipmentProperty and equipment are recorded at cost including, where applicable, interest capitalized during the
construction or development period. Depreciation is calculated using the straight-line basis at the following rates,
which are based on the expected useful lives of the assets.
Buildings 21/2% to 6%
Machinery and equipment 10% to 33%
(g) Deferred financing costsCosts incurred to obtain long-term debt financing are amortized over the term of such debt and are included in
interest expense for the year.
(h) Goodwill and other intangiblesGoodwill is the residual amount that results when the purchase price of an acquired business exceeds the sum of
the amounts allocated to identifiable assets acquired, less liabilities assumed, based on their fair values. Goodwill
is allocated as of the date of the business combination to the Company’s reporting units that are expected to benefit
N O T E S T O T H E C O N S O L I D A T E D F I N A N C I A L S T A T E M E N T S

P A S S I O N A T E P E O P L E • P A S S I O N A T E A B O U T F O O D
40
from the synergies of the business combination. The Company assigns value to certain acquired identifiable
intangible assets, primarily brands, poultry quota and delivery routes. Definite life intangibles are amortized over
their estimated useful lives. Goodwill is tested for impairment annually in the second quarter and otherwise as
required if events occur that indicate that it is more likely than not that the fair value of a reporting unit has been
impaired. Impairment of goodwill is tested at the reporting unit level by comparing the reporting unit’s carrying
amount to its fair value.
(i) Income taxesThe Company uses the asset and liability method of accounting for income taxes. Accordingly, future tax assets and
liabilities are recognized for the future tax consequences attributable to differences between the financial statement
carrying amounts of assets and liabilities and their respective tax bases. Future tax assets and liabilities are
measured using enacted or substantively enacted tax rates expected to apply to taxable income in the years in which
those temporary differences are expected to be recovered or settled. In addition, the effect on future tax assets and
liabilities of a change in tax rates is recognized in income in the year that includes the enactment or substantive
enactment date.
(j) Employee benefit plansThe Company accrues obligations and costs in respect of employee benefit plans. The cost of pensions and other
retirement benefits earned by employees is actuarially determined using the projected benefit method prorated on
service and management’s best estimate of expected plan investment performance, salary escalation, retirement ages
of employees and expected health care costs. Changes in these assumptions could affect future pension expense. For
the purpose of calculating the expected return on plan assets, those assets are valued at fair value. Past service costs
arising from plan amendments are amortized on a straight-line basis over the average remaining service period of
employees active at the date of amendment.
Actuarial gains and losses in excess of 10% of the greater of the actuarial liabilities and the market value of
assets at the beginning of the year and all gains and losses due to changes in plan provisions are amortized on a
straight-line basis over the expected average remaining service period of the active plan members. When a
restructuring of a benefit plan gives rise to both a curtailment and settlement of obligations, the curtailment is
accounted for prior to the settlement.
(k) Stock-based compensationThe Company applies the fair value method of accounting for its stock-based compensation. The fair value at grant
date of stock options (“options”) is estimated using the Black-Scholes option-pricing model with an assumed
forfeiture rate. The fair value of restricted stock units (“RSUs”) are measured based on the intrinsic value of the
award on grant date with an assumed forfeiture rate. Compensation cost is recognized on a straight-line basis over
the expected vesting period of the stock-based compensation.
For awards issued prior to January 1, 2003, the Company has not recognized any stock-based compensation
cost. The Company has disclosed the pro forma impact under the fair value method of awards granted in 2002 (see
Note 14).
(l) Statement of cash flowsCash and cash equivalents are defined as cash and short-term securities with maturities less than 90 days at the date
of acquisition, less bank indebtedness.
(m) Accounting Changes(i) Convertible DebenturesEffective January 1, 2005, the Company adopted an amendment to Canadian accounting principles, section
3860, “Financial Instruments – Disclosure and Presentation”, on a retroactive basis with restatement of prior
N O T E S T O T H E C O N S O L I D A T E D F I N A N C I A L S T A T E M E N T S

P A S S I O N A T E P E O P L E • P A S S I O N A T E A B O U T F O O D
41
N O T E S T O T H E C O N S O L I D A T E D F I N A N C I A L S T A T E M E N T S
periods. The revised standard, which is effective for January 1, 2005, requires obligations of a fixed amount
that may be settled, at the issuer’s option, by a variable number of the issuer’s own equity instruments to be
presented as liabilities. As a result of adopting the revised standard, the Company reclassified the principal
component of its convertible debenture (Note 12) as a debt instrument and reclassified the interest, accretion
charges and related tax effects in the statement of earnings in the comparative periods. The impact of the
revised standard was a reduction in net earnings of $4.5 million (net of tax) for the year ended December 31,
2004. There was no impact to basic or diluted earnings per share for prior periods as a result of adopting
this change.
(ii) Variable Interest EntitiesThe Company adopted the guidance in Accounting Guideline 15, “Consolidation of Variable Interest
Entities”, retroactively without restatement of prior periods, effective January 1, 2005. As a result of the
adoption, there are several previously unconsolidated entities that are now consolidated with the results of the
Company. The most significant was the consolidation of the Company’s hog processing facility in Brandon,
Manitoba. This resulted in an increase in assets and long-term debt of approximately $87.8 million as of
December 31, 2005. In addition, several of the Company’s investments in various previously equity accounted
hog facilities are now consolidated. The results of the consolidation of these hog production facilities is an
increase in debt of approximately $19.7 million and an increase in total assets of approximately $29.0 million.
There was no impact on the net earnings of the Company arising from the consolidation of these entities.
(n) Comparative figuresCertain 2004 comparative figures have been reclassified to conform with the financial statement presentation
adopted in 2005.
3. ACCOUNTS RECEIVABLE
Under revolving securitization programs the Company has sold certain of its trade accounts receivable to financial
institutions. The Company retains servicing responsibilities and retains a limited recourse obligation for delinquent
receivables. At December 31, 2005, trade accounts receivable being serviced under this program amounted to
$230.1 million (2004: $209.7 million).
4. INVENTORIES
2005 2004
Material held for production $ 216,588 $ 185,724
Finished products 184,260 199,404
$ 400,848 $ 385,128
5. PROPERTY AND EQUIPMENT
2005 2004
Land $ 72,233 $ 68,025
Buildings 594,651 465,881
Machinery and equipment 1,447,956 1,271,259
Construction in progress 90,456 83,267
Land held for development or sale 1,993 710
2,207,289 1,889,142
Less: Accumulated depreciation 1,069,972 915,424
$ 1,137,317 $ 973,718

P A S S I O N A T E P E O P L E • P A S S I O N A T E A B O U T F O O D
42
N O T E S T O T H E C O N S O L I D A T E D F I N A N C I A L S T A T E M E N T S
6. OTHER LONG-TERM ASSETS
2005 2004
Pension assets (Note 19) $ 220,540 $ 199,304
Deferred financing costs 22,985 22,750
Notes and mortgages receivable 9,003 12,044
Other 9,379 12,505
$ 261,907 $ 246,603
7. OTHER INTANGIBLES
2005 2004
Brands $ 59,232 $ 59,501
Poultry quota 24,442 20,114
Other 2,794 3,225
$ 86,468 $ 82,840
8. LONG-TERM DEBT
2005 2004
Notes payable:
– due 2009 (US$140 million)(a) $ 163,226 $ 168,504
– due 2007 (US$60 million)(a) 69,954 72,216
– due 2010 (US$75 million and CAD$115 million)(b) 202,443 205,270
– due 2011 (US$207.0 million)(c) 241,341 249,145
– due 2014 (US$98 million and CAD$105 million)(c) 219,258 222,953
– due 2016 (US$7 million and CAD$20 million)(c) 28,161 28,425
– due 2010 (CAD$10 million)(d) 11,726 13,991
– due 2016 (CAD$54.3 million)(d) 62,577 66,896
Bank debt – due 2006(e) 87,750 —
Convertible debenture(f) — 90,034
Other(g) 56,821 40,671
$ 1,143,257 $ 1,158,105
Less: Current portion 110,428 105,910
$ 1,032,829 $ 1,052,195
(a) In December 2002, the Company issued US$200.0 million of notes payable. The notes payable include a
US$140.0 million tranche, bearing interest at 6.3% per annum and due in 2009, and a US$60.0 million tranche,
bearing interest at 5.6% per annum and due in 2007. Through the use of cross-currency swaps (Note 10), the
Company effectively converted US$75.0 million into Canadian dollar-denominated debt of $116.5 million bearing
interest at floating interest rates being the three-month bankers’ acceptance rate plus 2.5% per annum. The financial
impact of currency rate changes on the swap is reported as other liabilities. At December 31, 2005, the swap liability
was $29.1 million (2004: $26.2 million) based on year-end exchange rates.
(b) In April 2000, the Company issued notes payable due April 28, 2010. The notes payable include a Canadian dollar-
denominated tranche for CAD$115.0 million, bearing interest at 7.7% per annum, and a U.S. dollar-denominated

P A S S I O N A T E P E O P L E • P A S S I O N A T E A B O U T F O O D
43
tranche for US$75.0 million, bearing interest at 8.5% per annum. Through the use of cross-currency swaps (Note 10),
the Company effectively converted the U.S. dollar tranche into Canadian dollar-denominated debt, resulting in a
Canadian dollar-denominated amount of $110.8 million at an effective fixed interest rate of 7.7% per annum. The
financial impact of currency rate changes on the swap is reported as other liabilities. At December 31, 2005, the swap
liability was $23.3 million (2004: $20.5 million) based on year-end exchange rates.
(c) In December 2004, the Company issued $500.0 million of notes payable. The notes were issued in tranches of U.S.
and Canadian dollar-denominations, with maturity dates from seven to 12 years and bearing interest at fixed annual
coupon rates. Details of the five tranches are:
Principal Maturity Date Annual Coupon
US$207 million 2011 5.2%
US$98 million 2014 5.6%
US$7 million 2016 5.8%
CAD$105 million 2014 6.1%
CAD$20 million 2016 6.2%
Interest is payable semi-annually. Through the use of cross-currency swaps (Note 10), the Company effectively
converted: US$177.0 million of debt maturing in 2011 into Canadian dollar-denominated debt of $231.0 million
bearing interest at an annual fixed rate of 5.4%, US$98 million of debt maturing in 2014 into Canadian dollar-
denominated debt of $135.3 million bearing interest at an annual fixed rate of 6.0%, and US$2 million of debt
maturing in 2016 into Canadian dollar-denominated debt of $2.7 million bearing interest at an annual fixed rate of
6.1%. The financial impact of currency rate changes on the swaps is reported as other liabilities. At December 31,
2005, the swap liabilities were $46.1 million based on year-end exchange rates (2004: $31.9 million).
(d) Concurrent with the acquisition of Schneider Corporation in April 2004 (Note 21), the Company assumed the
liabilities outstanding under previously issued debentures by Schneider Corporation. On the closing date, the
debentures provided for principal payments totalling $13.1 million and $60.0 million, respectively, and bear interest
at fixed annual rates of 10.0% and 7.5%, respectively. The debentures require annual principal repayments over the
term of the bonds that have final maturity dates of September 2010 and October 2016, respectively. These debentures
were recorded at their fair value on the acquisition closing date. The difference between the acquisition date fair value
and the face value of the bonds is amortized over the remaining life of the debentures on an effective yield basis. On
December 31, 2005, the remaining book values were $11.7 million for the 2010 debentures (2004: $14.0 million) and
$62.6 million for the 2016 debentures (2004: $66.9 million) and the remaining principal payments outstanding are
$10.0 million and $54.3 million, respectively (2004: $11.6 million and $57.3 million).
(e) In 1999, the Company entered into agreements, including a conditional sales agreement, to finance $130.0 million
of the construction cost of a new hog processing facility in Brandon, Manitoba. In August 2006, the Company has the
option to purchase the facility for $78.0 million or to put back the facility to the seller. Effective, January 1, 2005,
pursuant to accounting guideline AcG-15, the Brandon facility is recorded as an asset of the Company with its related
obligations. At December 31, 2005, long-term debt related to this facility totals $87.8 million bearing interest at
floating interest rates based on bankers’ acceptance rates.
(f) At December 31, 2004, the Company had convertible debentures with a principal amount of $91.3 million
outstanding. These convertible debentures had a maturity date of December 2005 and were recorded as equity. On
December 8, 2004, the Company issued a cash redemption notice with payment due on January 7, 2005. Accordingly,
as of that date, the Company reclassified the liability component of the convertible debentures to current debt. On
January 7, 2005, certain of the debenture holders tendered $79.8 million for cash redemption and the remaining
debenture holders tendered $11.5 million of the debentures for conversion to common equity (see Notes 12 and 13).
N O T E S T O T H E C O N S O L I D A T E D F I N A N C I A L S T A T E M E N T S

P A S S I O N A T E P E O P L E • P A S S I O N A T E A B O U T F O O D
44
N O T E S T O T H E C O N S O L I D A T E D F I N A N C I A L S T A T E M E N T S
(g) Subsidiaries of the Company have various lending facilities, including capital leases, with interest rates ranging
from non-interest bearing to 10.0% per annum. These facilities are repayable over various terms from 2006 to 2011.
As at December 31, 2005, $56.8 million (2004: $40.7 million) was outstanding.
(h) The Company has a primary bank debt facility of $700.0 million with a maturity date of December 6, 2007. This
facility can be drawn in either Canadian or U.S. dollars and bears interest based on bankers’ acceptance rates for
Canadian dollar loans and LIBOR for U.S. dollar loans. As at December 31, 2005, $69.5 million (2004: $66.0 million)
of the revolving facility was utilized in respect of letters of credit and trade finance.
The Company’s various facilities with Canadian chartered banks and other lenders, all of which are unsecured, are
subject to certain financial covenants.
The Company’s blended average effective cost of borrowing for 2005 was 6.2% (2004: 6.0%) after taking into
account the impact of interest rate hedges.
Required repayments of long-term debt are as follows.
2006 $ 110,428
2007 81,680
2008 12,887
2009 175,898
2010 217,199
Thereafter 545,165
Total long-term debt $ 1,143,257
9. OTHER LONG-TERM LIABILITIES
2005 2004
Foreign currency hedge liability (Note 10) $ 98,474 $ 78,703
Pension liabilities (Note 19) 36,535 63,827
Post retirement benefits (Note 19) 61,135 58,669
Other 6,432 4,343
$ 202,576 $ 205,542
10. DERIVATIVE FINANCIAL INSTRUMENTS AND RISK MANAGEMENT
In the ordinary course of business, the Company enters into derivative financial instruments to reduce underlying fair
value and cash flow risks associated with foreign currency, interest rates and commodity prices.
Foreign currency risk managementThe Company uses foreign currency forward contracts and options to manage a portion of its currency exposures.
These currency exposures relate primarily to U.S. dollar and Japanese yen denominated export sales and, to a lesser
extent, expenditures denominated in other foreign currencies.
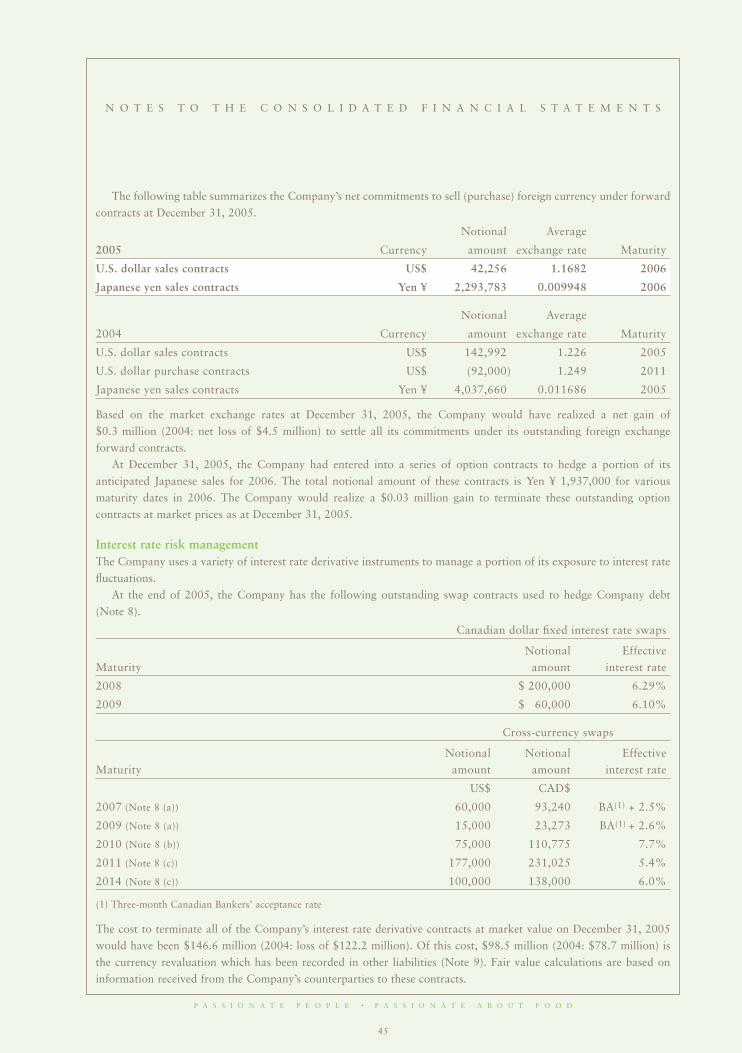
P A S S I O N A T E P E O P L E • P A S S I O N A T E A B O U T F O O D
45
N O T E S T O T H E C O N S O L I D A T E D F I N A N C I A L S T A T E M E N T S
The following table summarizes the Company’s net commitments to sell (purchase) foreign currency under forward
contracts at December 31, 2005.
Notional Average
2005 Currency amount exchange rate Maturity
U.S. dollar sales contracts US$ 42,256 1.1682 2006
Japanese yen sales contracts Yen ¥ 2,293,783 0.009948 2006
Notional Average
2004 Currency amount exchange rate Maturity
U.S. dollar sales contracts US$ 142,992 1.226 2005
U.S. dollar purchase contracts US$ (92,000) 1.249 2011
Japanese yen sales contracts Yen ¥ 4,037,660 0.011686 2005
Based on the market exchange rates at December 31, 2005, the Company would have realized a net gain of
$0.3 million (2004: net loss of $4.5 million) to settle all its commitments under its outstanding foreign exchange
forward contracts.
At December 31, 2005, the Company had entered into a series of option contracts to hedge a portion of its
anticipated Japanese sales for 2006. The total notional amount of these contracts is Yen ¥ 1,937,000 for various
maturity dates in 2006. The Company would realize a $0.03 million gain to terminate these outstanding option
contracts at market prices as at December 31, 2005.
Interest rate risk managementThe Company uses a variety of interest rate derivative instruments to manage a portion of its exposure to interest rate
fluctuations.
At the end of 2005, the Company has the following outstanding swap contracts used to hedge Company debt
(Note 8).
Canadian dollar fixed interest rate swaps
Notional Effective
Maturity amount interest rate
2008 $ 200,000 6.29%
2009 $ 60,000 6.10%
Cross-currency swaps
Notional Notional Effective
Maturity amount amount interest rate
US$ CAD$
2007 (Note 8 (a)) 60,000 93,240 BA(1) + 2.5%
2009 (Note 8 (a)) 15,000 23,273 BA(1) + 2.6%
2010 (Note 8 (b)) 75,000 110,775 7.7%
2011 (Note 8 (c)) 177,000 231,025 5.4%
2014 (Note 8 (c)) 100,000 138,000 6.0%
(1) Three-month Canadian Bankers’ acceptance rate
The cost to terminate all of the Company’s interest rate derivative contracts at market value on December 31, 2005
would have been $146.6 million (2004: loss of $122.2 million). Of this cost, $98.5 million (2004: $78.7 million) is
the currency revaluation which has been recorded in other liabilities (Note 9). Fair value calculations are based on
information received from the Company’s counterparties to these contracts.
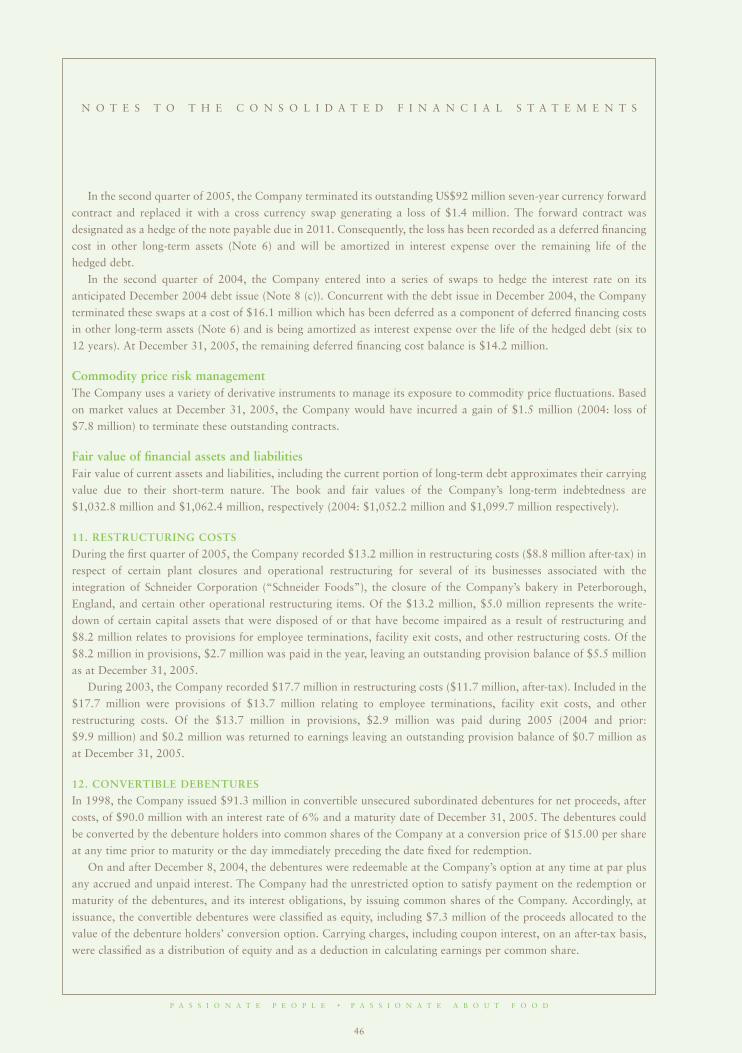
P A S S I O N A T E P E O P L E • P A S S I O N A T E A B O U T F O O D
46
N O T E S T O T H E C O N S O L I D A T E D F I N A N C I A L S T A T E M E N T S
In the second quarter of 2005, the Company terminated its outstanding US$92 million seven-year currency forward
contract and replaced it with a cross currency swap generating a loss of $1.4 million. The forward contract was
designated as a hedge of the note payable due in 2011. Consequently, the loss has been recorded as a deferred financing
cost in other long-term assets (Note 6) and will be amortized in interest expense over the remaining life of the
hedged debt.
In the second quarter of 2004, the Company entered into a series of swaps to hedge the interest rate on its
anticipated December 2004 debt issue (Note 8 (c)). Concurrent with the debt issue in December 2004, the Company
terminated these swaps at a cost of $16.1 million which has been deferred as a component of deferred financing costs
in other long-term assets (Note 6) and is being amortized as interest expense over the life of the hedged debt (six to
12 years). At December 31, 2005, the remaining deferred financing cost balance is $14.2 million.
Commodity price risk managementThe Company uses a variety of derivative instruments to manage its exposure to commodity price fluctuations. Based
on market values at December 31, 2005, the Company would have incurred a gain of $1.5 million (2004: loss of
$7.8 million) to terminate these outstanding contracts.
Fair value of financial assets and liabilitiesFair value of current assets and liabilities, including the current portion of long-term debt approximates their carrying
value due to their short-term nature. The book and fair values of the Company’s long-term indebtedness are
$1,032.8 million and $1,062.4 million, respectively (2004: $1,052.2 million and $1,099.7 million respectively).
11. RESTRUCTURING COSTS
During the first quarter of 2005, the Company recorded $13.2 million in restructuring costs ($8.8 million after-tax) in
respect of certain plant closures and operational restructuring for several of its businesses associated with the
integration of Schneider Corporation (“Schneider Foods”), the closure of the Company’s bakery in Peterborough,
England, and certain other operational restructuring items. Of the $13.2 million, $5.0 million represents the write-
down of certain capital assets that were disposed of or that have become impaired as a result of restructuring and
$8.2 million relates to provisions for employee terminations, facility exit costs, and other restructuring costs. Of the
$8.2 million in provisions, $2.7 million was paid in the year, leaving an outstanding provision balance of $5.5 million
as at December 31, 2005.
During 2003, the Company recorded $17.7 million in restructuring costs ($11.7 million, after-tax). Included in the
$17.7 million were provisions of $13.7 million relating to employee terminations, facility exit costs, and other
restructuring costs. Of the $13.7 million in provisions, $2.9 million was paid during 2005 (2004 and prior:
$9.9 million) and $0.2 million was returned to earnings leaving an outstanding provision balance of $0.7 million as
at December 31, 2005.
12. CONVERTIBLE DEBENTURES
In 1998, the Company issued $91.3 million in convertible unsecured subordinated debentures for net proceeds, after
costs, of $90.0 million with an interest rate of 6% and a maturity date of December 31, 2005. The debentures could
be converted by the debenture holders into common shares of the Company at a conversion price of $15.00 per share
at any time prior to maturity or the day immediately preceding the date fixed for redemption.
On and after December 8, 2004, the debentures were redeemable at the Company’s option at any time at par plus
any accrued and unpaid interest. The Company had the unrestricted option to satisfy payment on the redemption or
maturity of the debentures, and its interest obligations, by issuing common shares of the Company. Accordingly, at
issuance, the convertible debentures were classified as equity, including $7.3 million of the proceeds allocated to the
value of the debenture holders’ conversion option. Carrying charges, including coupon interest, on an after-tax basis,
were classified as a distribution of equity and as a deduction in calculating earnings per common share.

P A S S I O N A T E P E O P L E • P A S S I O N A T E A B O U T F O O D
47
N O T E S T O T H E C O N S O L I D A T E D F I N A N C I A L S T A T E M E N T S
On December 8, 2004, the Company issued a redemption notice for the aggregate principal amount on the
debentures of $91.3 million for cash at par plus accrued interest with a redemption date of January 7, 2005. As a
result, the Company no longer had the option to satisfy repayment on redemption with common shares. Accordingly,
as of that date the Company reclassified $90.0 million of the convertible debentures to current debt, leaving
$7.3 million related to the debenture holders’ conversion option within shareholders’ equity. For the period from the
date of the reclassification to December 31, 2004, the carrying charges, including coupon interest, were classified as
interest expense.
On January 7, 2005, certain of the debenture holders exercised their conversion rights and the Company issued
763,933 common shares for a reduction in the total cash to be paid by the Company upon redemption of
approximately $11.5 million. Accordingly, the Company paid $79.8 million to redeem the remaining debentures out-
standing, resulting in a net loss on redemption of $1.1 million.
13. SHAREHOLDERS’ EQUITY
Shareholders’ equity consists of the following.
2005 2004
Share capital $ 765,666 $ 731,291
Retained earnings 231,807 159,129
Convertible debentures (Note 12) — 7,304
Contributed surplus 19,756 4,944
Unrealized foreign currency adjustment (18,558) 2,885
$ 998,671 $ 905,553
The authorized share capital of Maple Leaf Foods consists of an unlimited number of common shares and an unlimited
number of non-voting common shares. As at December 31, 2005, there were 105,704,812 voting common shares
issued and outstanding (2004: 103,174,627) and 22,000,000 non-voting common shares issued and outstanding
(2004: 22,000,000). The non-voting common shares carry rights identical to those of the common shares, except that
they have no voting rights other than as specified in the Canada Business Corporations Act. Each non-voting common
share is convertible at any time into one common share at the option of the holder. Holders of non-voting common
shares have a separate class vote on any amendment to the articles of the Company, if the non-voting common shares
would be affected by such amendment in a manner that is different from the holders of common shares.
Details of share transactions relating to both voting and non-voting shares during the year are as follows.
Number of Share
shares capital
Balance, December 31, 2003 113,174,213 $ 565,048
Issued for cash on exercise of options (Note 14) 660,414 6,197
Issued for cash from treasury (b) 11,340,000 160,046
Balance, December 31, 2004 125,174,627 731,291
Issued for cash on exercise of options (Note 14) 1,678,802 19,421
Issued on conversion of convertible debentures (Note 12) 763,933 12,218
Issued to purchase additional shares in Canada Bread Company, Limited (Note 20) 214,450 3,495
Repurchased for cancellation (a) (127,000) (759)
Balance, December 31, 2005 127,704,812 $ 765,666
(a) During 2005, the Company repurchased for cancellation 127,000 common shares pursuant to a normal course
issuer bid at an average exercise price of $15.66 per share. The excess of the purchase cost over the book value of the
shares was charged to retained earnings.
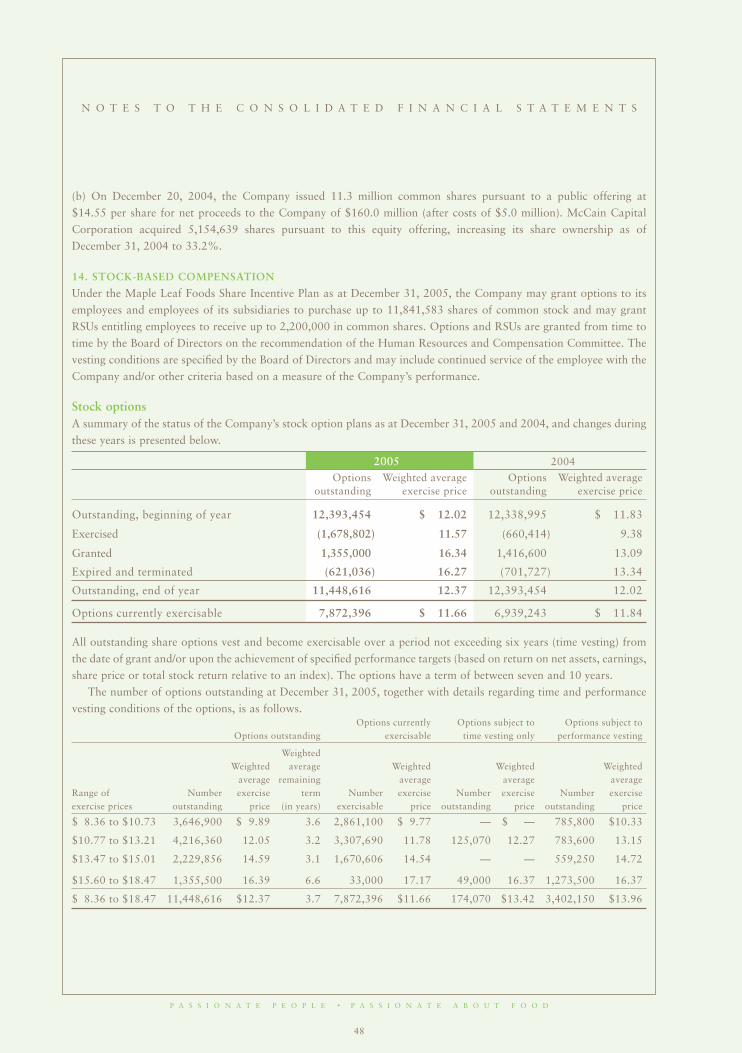
P A S S I O N A T E P E O P L E • P A S S I O N A T E A B O U T F O O D
48
N O T E S T O T H E C O N S O L I D A T E D F I N A N C I A L S T A T E M E N T S
(b) On December 20, 2004, the Company issued 11.3 million common shares pursuant to a public offering at
$14.55 per share for net proceeds to the Company of $160.0 million (after costs of $5.0 million). McCain Capital
Corporation acquired 5,154,639 shares pursuant to this equity offering, increasing its share ownership as of
December 31, 2004 to 33.2%.
14. STOCK-BASED COMPENSATION
Under the Maple Leaf Foods Share Incentive Plan as at December 31, 2005, the Company may grant options to its
employees and employees of its subsidiaries to purchase up to 11,841,583 shares of common stock and may grant
RSUs entitling employees to receive up to 2,200,000 in common shares. Options and RSUs are granted from time to
time by the Board of Directors on the recommendation of the Human Resources and Compensation Committee. The
vesting conditions are specified by the Board of Directors and may include continued service of the employee with the
Company and/or other criteria based on a measure of the Company’s performance.
Stock optionsA summary of the status of the Company’s stock option plans as at December 31, 2005 and 2004, and changes during
these years is presented below.
2005 2004
Options Weighted average Options Weighted averageoutstanding exercise price outstanding exercise price
Outstanding, beginning of year 12,393,454 $ 12.02 12,338,995 $ 11.83
Exercised (1,678,802) 11.57 (660,414) 9.38
Granted 1,355,000 16.34 1,416,600 13.09
Expired and terminated (621,036) 16.27 (701,727) 13.34
Outstanding, end of year 11,448,616 12.37 12,393,454 12.02
Options currently exercisable 7,872,396 $ 11.66 6,939,243 $ 11.84
All outstanding share options vest and become exercisable over a period not exceeding six years (time vesting) from
the date of grant and/or upon the achievement of specified performance targets (based on return on net assets, earnings,
share price or total stock return relative to an index). The options have a term of between seven and 10 years.
The number of options outstanding at December 31, 2005, together with details regarding time and performance
vesting conditions of the options, is as follows.Options currently Options subject to Options subject to
Options outstanding exercisable time vesting only performance vesting
WeightedWeighted average Weighted Weighted Weighted
average remaining average average averageRange of Number exercise term Number exercise Number exercise Number exerciseexercise prices outstanding price (in years) exercisable price outstanding price outstanding price
$ 8.36 to $10.73 3,646,900 $ 9.89 3.6 2,861,100 $ 9.77 — $ — 785,800 $10.33
$10.77 to $13.21 4,216,360 12.05 3.2 3,307,690 11.78 125,070 12.27 783,600 13.15
$13.47 to $15.01 2,229,856 14.59 3.1 1,670,606 14.54 — — 559,250 14.72
$15.60 to $18.47 1,355,500 16.39 6.6 33,000 17.17 49,000 16.37 1,273,500 16.37
$ 8.36 to $18.47 11,448,616 $12.37 3.7 7,872,396 $11.66 174,070 $13.42 3,402,150 $13.96

P A S S I O N A T E P E O P L E • P A S S I O N A T E A B O U T F O O D
49
N O T E S T O T H E C O N S O L I D A T E D F I N A N C I A L S T A T E M E N T S
During 2005, the Company granted 1,355,000 stock options (2004: 1,416,600) at a weighted average exercise price
per share of $16.34 (2004: $13.09). The fair value of the total options issued is determined using the Black-Scholes
option pricing model with the following weighted average assumptions.
2005 2004
Expected option life (in years) 4.2 4.2
Risk-free interest rate 4.3% 3.9%
Expected annual volatility 29.5% 33.4%
Dividend yield 1.0% 1.2%
The estimated fair value of options granted during the year was $4.4 million (2004: $4.5 million). This value is
amortized to income over the vesting period of the related options. The amortization of the fair value of options in
2005 is $5.2 million (2004: $3.4 million) and is recorded in contributed surplus.
Restricted stock unitsIn 2005, the Company granted 811,750 RSUs (2004: 789,000) to its employees under the Company’s Share Incentive
Plan. Each RSU entitles the holder to receive one common share in the capital of the Company at specified future dates.
The issuance of these shares is dependent upon the achievement of specified stock performance targets relative to a
North American index of food stocks, and continued employment with the Company.
All outstanding RSUs vest over a period of not less than three years and not exceeding five years (time vesting) from
the date of grant and upon the achievement of specified stock price performance targets relative to a North American
index of food stocks.
A summary of the status of the Company’s RSU plan as at December 31, 2005 and 2004 and changes during these
years is presented below.
2005 2004
RSUs Weighted average RSUs Weighted averageoutstanding price at grant outstanding price at grant
Outstanding, beginning of year 783,125 $ 12.73 — $ —Exercised — — — —Granted 811,750 16.33 789,000 12.73
Expired and terminated (16,250) 13.50 (5,875) 12.71
Outstanding, end of year 1,578,625 $ 14.82 783,125 $ 12.73
The fair value of the RSUs on the date of grant was $9.1 million, which is amortized to income on a pro rata basis
over the vesting periods of the related RSUs. The amortization of the fair value of the RSUs in 2005 is $3.2 million
(2004: $0.7 million).
The fair value of the total RSUs granted in the year is determined using a present value calculation with an assumed
forfeiture rate, based on the following weighted average assumptions.
2005 2004
Expected RSU life (in years) 3.3 3.3
Forfeiture rate 30% 23.1%
Discount rate 4.0% 4.0%
Dividend yield 1.1% 1.3%
Weighted average remaining term (in years) 4.2 4.7

P A S S I O N A T E P E O P L E • P A S S I O N A T E A B O U T F O O D
50
N O T E S T O T H E C O N S O L I D A T E D F I N A N C I A L S T A T E M E N T S
Pro forma impact on earningsIn 2003, the Company elected to early adopt the new “Stock-based Compensation and Other Stock-based Payments”
accounting rules on a prospective basis for awards granted or modified after January 1, 2003. During 2002, the
Company granted 2,503,500 stock options at a weighted average price per share of $14.36. The effect of these stock
option awards, had they been charged to earnings during the year on a fair value basis, would have been an expense
of $0.1 million (2004: $3.4 million) with a related reduction to basic and diluted earnings per common share of $nil
(2004: $0.03). As at December 31, 2005, there was no remaining unrecorded expense on options granted prior to
January 31, 2003.
15. EARNINGS PER SHARE
The following table sets forth the calculation of basic and diluted earnings per share.
2005 2004
Numerator:
Earnings available to common shareholders – basic $ 94,242 $ 102,283
Effect on earnings of dilutive securities:
Convertible debt (ii) — 4,882
Earnings available to common shareholders – diluted $ 94,242 $ 107,165
Denominator:
Weighted average common shares outstanding (in millions) 126.813 113.623
Effect of dilutive securities (in millions):
Employee stock options (i) 3.244 1.095
Convertible debt — 6.087
Weighted average shares – diluted (in millions) 130.057 120.805
(i) Excludes the effect of 10.3 million options and restricted stock units (2004: 12.1 million) to purchase common shares that are anti-dilutive.
(ii) As explained in Note 12, the convertible debentures were all converted or repaid on January 7, 2005.
2005 2004
Earnings per share:
Basic $ 0.74 $ 0.90
Diluted 0.72 0.89
16. OTHER INCOME (EXPENSE)
2005 2004
Earnings from associated companies $ 3,131 $ 985
Gain on sale of property and equipment 3,498 892
Dividends received 510 144
Gain on sale of investments, net 363 417
Rental income 300 458
Earnings (loss) from real estate operations 283 (246)
Loss on conversion of debenture (1,108) —
$ 6,977 $ 2,650

P A S S I O N A T E P E O P L E • P A S S I O N A T E A B O U T F O O D
51
N O T E S T O T H E C O N S O L I D A T E D F I N A N C I A L S T A T E M E N T S
17. INTEREST EXPENSE
2005 2004
Interest expense on long-term debt $ 90,154 $ 81,226
Other net interest expense 8,163 8,572
$ 98,317 $ 89,798
18. INCOME TAXES
Income tax expense varies from the amount that would be computed by applying the combined federal and provincial
statutory income taxes rate as a result of the following.
2005 2004
Income tax expense according to combined statutory
rate of 34.5% (2004: 35.1%) $ 54,770 $ 59,735
Increase (decrease) in income taxes resulting from:
Adjustment to net future tax liabilities for changes in tax laws and rates (167) (136)
Rate differences in foreign subsidiaries (3,853) (4,320)
Manufacturing and processing credit (1,961) (2,177)
Non-taxable gains (398) (1,118)
Share option expense 2,928 1,423
Equity in earnings of associated companies (1,562) (1,751)
Dividends not taxable (181) (58)
Large corporations tax 1,947 1,599
Other (215) 3,821
$ 51,308 $ 57,018

P A S S I O N A T E P E O P L E • P A S S I O N A T E A B O U T F O O D
52
N O T E S T O T H E C O N S O L I D A T E D F I N A N C I A L S T A T E M E N T S
The tax effects of temporary differences that give rise to significant portions of the future tax assets and future tax
liabilities at December 31 are presented below.
2005 2004
Future tax assets:
Non-capital loss carry forwards $ 113,199 $ 114,479
Accrued liabilities 22,476 24,686
Tax on intra-subsidiary asset transfer 18,620 19,089
Other 12,111 2,491
$ 166,406 $ 160,745
Future tax liabilities:
Property and equipment $ 80,419 $ 81,557
Cash basis farming 8,440 13,472
Investments in associated companies 1,135 1,135
Net pension asset 49,551 42,140
Goodwill and other intangibles 16,273 17,688
Other 13,350 3,736
$ 169,168 $ 159,728
Classified in the consolidated financial statements as:
Future tax asset – current $ 15,329 $ 6,708
Future tax asset – non-current 38,499 26,976
Future tax liability – current (407) (3,461)
Future tax liability – non-current (56,183) (29,207)
Net future tax liability $ (2,762) $ 1,016

P A S S I O N A T E P E O P L E • P A S S I O N A T E A B O U T F O O D
53
N O T E S T O T H E C O N S O L I D A T E D F I N A N C I A L S T A T E M E N T S
19. PENSIONS AND OTHER POST-RETIREMENT BENEFITS
Information about the Company’s defined benefit plans as at December 31, in aggregate, is as follows.
Post-retirement Schneider Other 2005 2004
benefit pension pension Total Total
Accrued benefit obligation:
Balance, beginning of year $ 58,666 $ 418,720 $ 535,014 $ 1,013,200 $ 508,668
Addition of Schneider Foods’
plans (Note 21) — — — — 464,441
Current service cost 779 42 19,162 19,983 16,340
Interest cost 3,382 23,464 30,930 57,776 49,230
Benefits paid (2,804) (22,856) (38,961) (64,621) (58,551)
Actuarial losses 6,214 39,853 57,191 103,258 28,175
Employee contributions — 116 5,426 5,542 4,897
Balance, end of year $ 66,237 $ 459,339 $ 609,762 $ 1,135,138 $ 1,013,200
Plan assets:
Fair value, beginning of year $ — $ 353,238 $ 838,517 $ 1,191,755 $ 792,618
Addition of Schneider Foods’
plans (Note 21) — — — — 338,817
Actual return on plan assets — 39,791 135,648 175,439 106,139
Employer contributions 2,804 21,093 2,780 26,677 18,446
Employee contributions — 116 5,426 5,542 4,897
Benefits paid (2,804) (22,856) (38,961) (64,621) (58,551)
Asset transfer to Company defined
contribution plan — — (13,488) (13,488) (10,611)
Fair value, end of year $ — $ 391,382 $ 929,922 $ 1,321,304 $ 1,191,755
Funded status – plan surplus
(deficit) $ (66,237) $ (67,957) $ 320,360 $ 186,166 $ 178,555
Unamortized transition amount — — (171,754) (171,754) (190,334)
Unamortized actuarial losses 5,102 28,145 49,482 82,729 69,400
Unamortized prior service cost — — 1,028 1,028 1,124
Other — — (194) (194) —
Accrued benefit asset (liability) $ (61,135) $ (39,812) $ 198,922 $ 97,975 $ 58,745
Amounts recognized in the consolidated balance sheet consist of:
2005 2004
Other long-term assets $ 220,540 $ 199,304
Accounts payable and accrued charges 24,895 18,063
Other long-term liabilities 97,670 122,496

P A S S I O N A T E P E O P L E • P A S S I O N A T E A B O U T F O O D
54
N O T E S T O T H E C O N S O L I D A T E D F I N A N C I A L S T A T E M E N T S
Pension benefit expense (income).
2005 2004
Current service cost – defined benefit $ 19,204 $ 15,566
Current service cost – defined contribution 18,049 18,100
Interest cost 54,394 47,110
Actual return on plan assets (175,439) (106,415)
Difference between actual and expected return 87,801 31,348
Actuarial losses recognized 97,044 30,064
Difference between actual and recognized actuarial losses in the year (96,028) (31,325)
Amortization of transitional obligation (18,580) (18,580)
Amortization of prior service cost 96 96
Net benefit plan income $ (13,459) $ (14,036)
The significant actuarial assumptions adopted in measuring the Company’s accrued benefit obligations are as follows.
2005 2004
Discount rate used to calculate net benefit plan expense 5.75% 6.00%
Discount rate used to calculate year-end benefit obligation 5.00% 5.75%
Expected long-term rate of return on plan assets 7.50% 7.50%
Rate of compensation increase 4.00% 4.00%
Other post-retirement benefit expense.
2005 2004
Current service cost $ 779 $ 774
Interest cost 3,382 2,120
Actuarial gain recognized 6,214 —
Difference between actual and expected actuarial gain (6,214) —
$ 4,161 $ 2,894
Impact of 1% change in health care cost trend.
1% Increase 1% Decrease
Effect of end-of-year obligation $ 2,802 $ (3,405)
Aggregate of 2005 current service cost and interest cost 202 (227)
Measurement dates:
2005 expense December 31, 2004
Balance sheet December 31, 2005
The pension assets are invested in the following asset categories at December 31, 2005 and December 31, 2004.
2005 2004
Asset category:
Equity securities 72% 70%
Debt securities 28% 30%
100% 100%

P A S S I O N A T E P E O P L E • P A S S I O N A T E A B O U T F O O D
55
N O T E S T O T H E C O N S O L I D A T E D F I N A N C I A L S T A T E M E N T S
20. INVESTMENT IN CANADA BREAD COMPANY, LIMITED (“CANADA BREAD”)
During 2005, the Company acquired 225,300 shares (2004: 490,400) in Canada Bread for $10.5 million (2004:
$18.9 million) comprised of cash of $7.0 million and shares of $3.5 million, increasing its ownership to 87.5%.
The allocation of the acquisition of shares is as follows.
2005 2004
Property and equipment $ 138 $ 2,848
Goodwill 6,081 4,752
Other intangibles 195 4,019
Future income taxes (75) (1,547)
Minority interest 4,161 8,837
Total purchase cost $ 10,500 $ 18,909
21. ACQUISITIONS AND DIVESTITURES
On April 5, 2004, the Company acquired Schneider Corporation (“Schneider Foods”) for cash consideration of
$376.7 million including transaction costs of $8.1 million and the assumption of Schneider Foods’ debt. As at June
30, 2005 the purchase price allocation (including fair value assigned to intangible assets, certain fixed assets, legal
claims, indebtedness, pensions, post-retirement benefits and taxes) was finalized. Goodwill resulting from the above
transaction is included in the total assets of the Meat Products Group.
In May 2005, the Company purchased the remaining 32% interest in Cappola Food Inc. for net proceeds of
approximately $3.6 million resulting in additional goodwill of approximately $1.5 million.
Details of net assets acquired and purchase adjustments made in 2005 and 2004 are as follows.
Schneider 2005 2004Foods Other Total Total
Net working capital (deficit) $ (4,443) $ — $ (4,443) $ 79,286
Investments — — — 21,191
Property and equipment (2,976) — (2,976) 152,604
Other assets (1,977) — (1,977) 7,689
Goodwill 28,149 1,504 29,653 293,378
Other intangibles — — — 72,480
Long-term debt — — — (146,691)
Future income taxes 19,886 — 19,886 27,014
Pension benefit liability (250) — (250) (75,993)
Post employment benefit liability (53) — (53) (49,631)
Other long-term liabilities (38,336) — (38,336) (1,255)
Minority interest — 2,074 2,074 (1,737)
Retained earnings — 82 82 —
Total purchase cost — 3,660 3,660 378,335
Consideration:
Cash — 3,621 3,621 382,666
Accounts payable, accrued charges,
and long-term debt — 39 39 (4,331)
$ — $ 3,660 $ 3,660 $ 378,335

P A S S I O N A T E P E O P L E • P A S S I O N A T E A B O U T F O O D
56
22. CONTINGENCIES AND COMMITMENTS
(a) The Company has been named as defendant in several legal actions and is subject to various risks and
contingencies arising in the normal course of business. Management is of the opinion that the outcome of these
uncertainties will not have a material adverse effect on the Company’s financial position.
(b) In the normal course of business, the Company and its subsidiaries enter into sales commitments with customers,
and purchase commitments with suppliers. These commitments are for varying terms and can provide for fixed or
variable prices. With respect to certain of its contracts, the Company has the right to acquire at fair value, and the
suppliers have the right to sell back to the Company, certain assets which have an estimated fair value of $14.3 million.
The Company believes that these contracts serve to reduce risk, and it is not anticipated that losses will be incurred on
these contracts.
(c) The Company has operating lease, rent and other commitments, that require minimum annual payments as follows.
2006 $ 40,488
2007 31,880
2008 25,858
2009 18,683
2010 16,075
Thereafter 70,185
$ 203,169
23. SEGMENTED FINANCIAL INFORMATION
The Company’s operations are classified into the following three primary business segments, which have been used for
the operating segment disclosures for all years presented:
(a) Meat Products Group includes the Company’s meat and meat-related businesses, comprising the primary pork and
poultry processing, prepared meats, and global food marketing operations.
(b) Agribusiness Group includes the Company’s feed and pet food businesses, animal by-products recycling, swine
production, poultry growing and hatching operations.
(c) Bakery Products Group comprises the Company’s 87.5% ownership in Canada Bread Company, Limited, a
producer of fresh and frozen par-baked bakery products, and fresh pasta and sauces.
N O T E S T O T H E C O N S O L I D A T E D F I N A N C I A L S T A T E M E N T S

P A S S I O N A T E P E O P L E • P A S S I O N A T E A B O U T F O O D
57
N O T E S T O T H E C O N S O L I D A T E D F I N A N C I A L S T A T E M E N T S
(In thousands of Canadian dollars) 2005 2004
Sales to customers
Meat Products Group $ 4,300,290 $ 4,127,255
Agribusiness Group 816,776 924,912
Bakery Products Group 1,345,515 1,312,816
$ 6,462,581 $ 6,364,983
Earnings from operations, before restructuring costs
Meat Products Group $ 59,881 $ 68,440
Agribusiness Group 101,862 98,736
Bakery Products Group 101,291 89,188
$ 263,034 $ 256,364
Capital expenditures
Meat Products Group $ 59,287 $ 51,833
Agribusiness Group 36,266 34,879
Bakery Products Group 56,577 70,065
$ 152,130 $ 156,777
Depreciation and amortization
Meat Products Group $ 62,788 $ 60,816
Agribusiness Group 24,502 21,323
Bakery Products Group 45,199 43,355
$ 132,489 $ 125,494
Total assets
Meat Products Group $ 1,550,439 $ 1,463,253
Agribusiness Group 639,622 603,055
Bakery Products Group 694,519 702,137
Non-allocated assets 305,200 269,688
$ 3,189,780 $ 3,038,133
The Agribusiness Group operating earnings include the Company’s share of earnings from equity-accounted hog
investments in the year in the amount of $4.5 million (2004: $5.3 million losses).
During the year, total sales to customers outside of Canada were $1,753.9 million (2004: $1,840.3 million) of
which $901.0 million (2004: $962.2 million) were sales to customers in the United States.

P A S S I O N A T E P E O P L E • P A S S I O N A T E A B O U T F O O D
58
CORPORATE GOVERNANCE
The Board of Directors and management of theCompany are committed to maintaining a highstandard of corporate governance. The Board hasresponsibility for the overall stewardship of theCompany and discharges such responsibility byreviewing, discussing and approving the Company’sstrategic planning and organizational structure andsupervising management with a view to preserving andenhancing the underlying value of the Company.Management of the business within this process andstructure is the responsibility of the Chief ExecutiveOfficer and senior management.
The Board has adopted guidelines to assist it inmeeting its corporate governance responsibilities. Therole of the Board, the CEO, the Chairman, LeadDirector and the individual committees are clearlydelineated. Together with the Chairman, Lead Directorand the Corporate Governance Committee, the Boardassesses its processes and practices regularly to ensureits governance objectives are met.
Composition of the Board of Directors
The Board is comprised of experienced directors with adiversity of relevant skills and competencies. The Boardof Directors has assessed each of the Company’s 10non-management directors to be independent. These10 directors are also considered independent under therelevant securities regulations.
A more comprehensive analysis of the Company’sapproach to corporate governance matters is includedin the Management Proxy Circular for the April 26,2006 Annual and General Meeting of Shareholders.
BOARD OF DIRECTORS
Purdy Crawford O.C.Counsel, Osler, Hoskin & Harcourt (Law firm)
Mr. Crawford, 74, is a director of a number of U.S.and Canadian companies. Until February 2000, he wasthe non-Executive Chairman of Imasco Limited and CTFinancial Services. Mr. Crawford is an Officer of theOrder of Canada and a member of the CanadianBusiness Hall of Fame.Director since: 1995
Jeffrey GandzProfessor, Managing Director – Program Design, Richard IveySchool of Business, University of Western Ontario
Dr. Gandz, 61, has been a consultant for many Canadian and multinational corporations andgovernment ministries, and is the author of severalbooks, many articles and government reports on avariety of subjects, including leadership andorganizational effectiveness.Director since: 1999
James F. HankinsonPresident and Chief Executive OfficerOntario Power Generation (Electric generation company)
Mr. Hankinson, 62, is a director of a number ofCanadian companies. Mr. Hankinson retired as President and CEO of New Brunswick PowerCorporation in 2002. He was President and ChiefOperating Officer of Canadian Pacific Limited until 1995.Director since: 1995
Robert W. HillerCorporate Director
Mr. Hiller, 69, has served as a director and senior officerof a number of large multinational food companies inthe United States and in Canada. Until 1991, he wasSenior Vice-President and Chief Financial Officer ofthe Campbell Soup Company Limited.
Director since: 1995
Chaviva M. HosekPresident and Chief Executive OfficerThe Canadian Institute for Advanced Research (Research Institute)
Dr. Hosek, 59, received her Ph.D. from HarvardUniversity in 1973. She was Director of Policy andResearch from 1993 to 2000 in the Prime Minister’sOffice. Her career has included a term as Minister ofHousing for the Province of Ontario and a 13-yearperiod as an academic at the University of Toronto.Dr. Hosek serves as a director of Inco Limited.
Director since: 2002
C O R P O R A T E G O V E R N A N C E A N D B O A R D O F D I R E C T O R S

P A S S I O N A T E P E O P L E • P A S S I O N A T E A B O U T F O O D
59
Donald E. LoadmanCorporate Director and Business Consultant
Mr. Loadman’s career includes service in Canadaand the United States with three multinationalfood and packaged goods companies. Until 1991Mr. Loadman was Chairman of Pillsbury International.Mr. Loadman, 73, is a resident of California.Until 1996, Mr. Loadman was Chairman of AultFoods Limited.
Director since: 1995
G. Wallace F. McCain O.C.Chairman, Maple Leaf Foods Inc.
Mr. McCain, 75, was appointed Chairman followingthe acquisition of the Company in April 1995.Mr. McCain co-founded McCain Foods Limited in1956 which has grown to become one of the largestfrozen food companies in the world. Mr. McCain wasPresident and Co-CEO of McCain Foods Limited until1994 and is currently its Vice-Chairman and directorof other associated companies within the McCain FoodsGroup. Mr. McCain is an Officer of the Orderof Canada.
Director since: 1995
J. Scott McCainPresident and Chief Operating Officer, Agribusiness Group,Maple Leaf Foods Inc.
Before joining Maple Leaf Foods Inc. in April 1995,Mr. McCain was Vice-President for Production ofMcCain Foods Limited in Canada, a company he joinedin 1978 and where he held progressively seniorpositions in manufacturing and operations. He is adirector of Canada Bread Company, Limited andMcCain Capital Corporation. Mr. McCain, 49, is adirector of McCain Foods Group.
Director since: 1995
Michael H. McCainPresident and Chief Executive Officer, Maple Leaf Foods Inc.
Mr. McCain, 47, joined Maple Leaf Foods Inc. in April1995 after 16 years with McCain Foods Limited inCanada and the United States. Prior to leaving in March1995, Mr. McCain was the President and ChiefExecutive Officer of McCain Foods USA Inc. He is adirector of Canada Bread Company, Limited,McCain Foods Group and is a past director of theAmerican Frozen Food Institute. Mr. McCain is aDirector of Royal Bank of Canada and serves on theBoard of Trustees of The Hospital for Sick Children in Toronto.
Director since: 1995
Diane E. McGarryCorporate Director
Ms. McGarry, 56, is a director of Omnova SolutionsInc. Her career includes over 30-years’ experience withXerox including five years in Canada as Chairman,President and CEO of Xerox Canada from 1993 to 1998.Prior to retiring in 2005, Ms. McGarry held the positionof Chief Marketing Officer, Xerox Corporation.
Director since: 2005
J. Edward Newall O.C.Chairman, Newall & Associates (Consulting firm)
Mr. Newall, 70, is also Chairman and Director ofNOVA Chemicals Corporation, Chairman and Director of Canadian Pacific Railway Ltd. andChairman and director of Novelis Inc. In 1998 heretired as Vice-Chairman and CEO of NOVACorporation. He served as a Director of Alcan Inc. tillDecember 2004 and as a director of Royal BankFinancial Group till January 2005. Mr. Newall is anOfficer of the Order of Canada.
Director since: 1997
Gordon RitchieChairman of Public Affairs, Hill & Knowlton Canada (Government and public relations company)
Mr. Ritchie, 62, is also CEO of Strategico Inc. and adirector of a number of leading Canadian corporations.Mr. Ritchie had 22 years of distinguished public service.As Ambassador for Trade Negotiations, Mr. Ritchiewas one of the principal architects of theCanada/United States Free Trade Agreement.
Director since: 1995
Robert T. StewartCorporate Director
Mr. Stewart, 73, is a director of a number of largeNorth American companies in various industries.Mr. Stewart had a 40-year career with Scott PaperLimited, retiring in 1995 as Chairman and CEO.
Director since: 1995
Note: Ages of the Board of Directors provided as at March 2006.
C O R P O R A T E G O V E R N A N C E A N D B O A R D O F D I R E C T O R S

P A S S I O N A T E P E O P L E • P A S S I O N A T E A B O U T F O O D
60
COMMITTEES OF THE BOARD OF DIRECTORS
Audit Committee
R.W. Hiller, ChairmanJ.F. HankinsonD.E. LoadmanJ.E. NewallG. Ritchie
Corporate Governance Committee
P. Crawford, ChairmanJ. GandzD.E. LoadmanR.T. Stewart
Environment, Health and Safety Committee
R.T. Stewart, ChairmanJ.F. HankinsonR.W. HillerC.M. Hosek
Human Resources and Compensation Committee
J.E. Newall, ChairmanP. CrawfordJ. GandzC.M. HosekG. Ritchie
CORPORATE COUNCIL
G. Wallace F. McCainChairman
Michael H. McCainPresident and Chief Executive Officerand Chief Operating Officer, Meat Products Group
J. Scott McCainPresident and Chief Operating Officer, Agribusiness Group
Richard A. LanPresident and Chief Operating Officer, Bakery Products Group
Michael H. VelsExecutive Vice-President and Chief Financial Officer
Thomas P. MuirExecutive Vice-President and Chief Development Officer
Douglas W. DoddsChief Strategy Officer
Wayne JohnsonSenior Vice-President and Chief Human Resources Officer
Rocco CappuccittiSenior Vice-President, Transactions and Administrationand Corporate Secretary
Lynda J. KuhnVice-President, Public & Investor Relations
EXECUTIVE COUNCIL
(Includes members of the Corporate Council and Senior Operating Management as follows)
Michael E. DetlefsenPresident, Maple Leaf Global Foods
Brock J. FurlongPresident, Canada Bread Frozen Bakery
Kevin P. GoldingPresident, Rothsay and Elite Swine Inc.
Annalisa KingSenior Vice-President, Vertical Co-ordination
Rory A. McAlpineVice-President, Government and Industry Relations
C. Barry McLeanPresident, Canada Bread Fresh Bakery
Peter G. MaycockManaging Director, Maple Leaf Bakery U.K.
Bruce Y. MiyashitaVice-President, Six Sigma
Randy A. PowellPresident, Maple Leaf Fresh Foods
Patrick A. RessaChief Information Officer
Peter C. SmithVice-President, Corporate Engineering
Maryanne ChantlerVice-President, Purchasing and Supply Chain
Jerry VergeerPresident, Maple Leaf Animal Nutrition
Richard YoungPresident, Maple Leaf Consumer Foods
OTHER CORPORATE OFFICERS
J. Nicholas BolandVice-President, Finance
Natalie M. MarcheVice-President and Treasurer
Judith A. RobinsonAssistant Corporate Secretary
S E N I O R M A N A G E M E N T A N D O F F I C E R S

C O R P O R A T E P R O F I L E
aple Leaf Foods is a Canadian success story with
growing global reach. Our roots in the flour
business date back to a small-town mill in 1836, our
meat processing business back to the 1860s, and our
bakery business to the amalgamation of five separate companies in 1911.
Rich in history, Maple Leaf Foods entered our current growth phase in
1995 when McCain Capital Corporation pooled our expertise in
the food business with the financial resources of Ontario Teachers’
Pension Plan Board. Today, Maple Leaf Foods employs approximately
24,000 people, exports to nearly 80 countries, and operates in Canada,
the United States, the United Kingdom, Europe, Southeast
Asia and Mexico.
Our Meat Products and Agribusiness operations are strategically
linked to produce high quality meat products, minimize underlying
commodity market exposure, and maximize earnings. They include
animal nutrition, hog production, fresh value-added pork and poultry
products, processed meats and home meal solutions, global sales and
trading, and rendering operations.
Our Bakery operations are concentrated in North America and the
United Kingdom. We are the Canadian market leader in
premium nutrition fresh bakery products, such as whole grain and
organic breads. We are also a major North American supplier of
frozen ready-to-bake, par-baked and pre-baked breads, rolls and
specialty bakery items, in addition to fresh pasta and sauces. In the
U.K., we operate three plants, including one of the largest bagel plants
in the world, servicing the fast growing U.K. and European markets.
Our value creation strategy is supported by our flagship brands
which are growing well above industry averages – Maple Leaf® and
Schneiders® in the meat category and Dempster’s® in the bakery
category. They each deliver a promise to consumers: leadership in food
safety, quality and taste, and nutrition. Behind our products and our
many brands are our passionate people, and their passion for food.
M
Table of Contents1 Financial Highlights
2 Operations Overview
3 Segmented Operating Results
5 Letter from the Chairman
6 Letter to Fellow Shareholders
14 Financials
CAPITAL STOCK
The Company’s authorized capital consists of anunlimited number of voting and an unlimited numberof non-voting common shares. At December 31, 2005,105,704,812 voting shares and 22,000,000 non-votingshares were issued and outstanding, for a total of127,704,812 outstanding shares. There were 1,208shareholders of record of which 1,163 were registeredin Canada, holding 99.4% of the issued voting shares.All of the issued non-voting shares are held by OntarioTeachers’ Pension Plan Board. These non-voting sharesmay be converted into voting shares at any time.
OWNERSHIP
The Company’s major shareholders are McCainCapital Corporation holding 41,518,153 sharesrepresenting 32.5% of the total issued and outstanding shares issued and Ontario Teachers’Pension Plan Board holding 20,728,371 voting sharesand 22,000,000 non-voting shares representing 33.4%of the total issued and outstanding shares. The remainder of the issued and outstanding shares arepublicly held.
CORPORATE OFFICE
Maple Leaf Foods Inc.30 St. Clair Avenue WestSuite 1500Toronto, Ontario, Canada M4V 3A2Tel: (416) 926-2000Fax: (416) 926-2018Website: www.mapleleaf.com
ANNUAL AND GENERAL MEETING
The annual and general meeting of shareholders ofMaple Leaf Foods Inc. will be held on Wednesday, April26, 2006 at 11:00 a.m. at the Glenn Gould Studio,Canadian Broadcasting Centre, 250 Front Street West,Toronto, Canada.
DIVIDENDS
The declaration and payment of quarterly dividends aremade at the discretion of the Board of Directors.Anticipated payment dates in 2006: March 31, June 30,September 29 and December 29.
SHAREHOLDER INQUIRIES
Inquiries regarding dividends, change of address,transfer requirements or lost certificates should bedirected to the Company’s transfer agent:Computershare Investor Services Inc.Stock and Bond Transfer Department100 University Avenue, 9th FloorToronto, Ontario M5J 2Y1Tel: (514) 982-7555or 1-800-564-6253 (toll-free North America)or [email protected]
COMPANY INFORMATION
For public and investment analysis inquiries, pleasecontact our Vice-President, Public & Investor Relationsat (416) 926-2000.
For copies of annual and quarterly reports, annualinformation form and other disclosure documents,please contact our Senior Vice-President, Transactionsand Administration and Corporate Secretary at(416) 926-2000.
TRANSFER AGENT AND REGISTRAR
Computershare Investor Services Inc.100 University Avenue, 9th FloorToronto, Ontario, Canada M5J 2Y1Tel: (514) 982-7555or 1-800-564-6253 (toll-free North America)or [email protected]
AUDITORS
KPMG LLP
Toronto, Ontario
STOCK EXCHANGE LISTINGS AND STOCK
SYMBOL
The Company’s voting common shares are listedon The Toronto Stock Exchange and trade under thesymbol “MFI”.
RAPPORT ANNUEL
Si vous désirez recevoir un exemplaire de la versionfrançaise de ce rapport, veuillez écrire à l’adressesuivante : Secrétaire de la société, Les Aliments MapleLeaf Inc., 30 St. Clair Avenue West, Toronto, OntarioM4V 3A2.
C O R P O R A T E I N F O R M A T I O N
47376_MLF_Cover.qxd 3/20/06 4:36 PM Page 2
MA
PL
E
LE
AF
F
OO
DS
I
NC
.2
00
5
An
nu
al
R
ep
or
t
MAPLE LEAF FOODS INC. 2005 ANNUAL REPORT
Passionate People Passionate about Food
On the Cover: A historical landmark in Toronto, the
St. Lawrence Market and its many fine purveyors of
fresh meats, cheeses, produce and other food products
has served as the inspiration for food lovers for more
than 100 years. Such markets provide an ideal venue for
our passionate people who are constantly seeking new
ideas for innovative food products for our customers
and consumers.
Pictured left to right are: Jeannie Schmitz (Canada Bread
Fresh Bakery), Glen Gratton (Agribusiness Group),
Andy Persaud (Maple Leaf Consumer Foods) and
Valerie Walton (Maple Leaf Global Foods).
M A P L E L E A F F O O D S I N C .
30 St. Clair Avenue West, Suite 1500
Toronto, Ontario, Canada M4V 3A2
www.mapleleaf.com
Passionate People Passionate about Food
Printed in Canada
47376_MLF_Cover.qxd 3/20/06 4:36 PM Page 1