4(7/2+).'0 !0%23 - OECD 7. Dans près de la moitié des pays de l’OCDE, les délais d’attente...
74
DELSA/ELSA/WD/HEA(2003)7 OECD HEALTH WORKING PAPERS 7 Explaining Waiting Times Variations for Elective Surgery across OECD Countries Luigi Siciliani and Jeremy Hurst
-
Upload
nguyenngoc -
Category
Documents
-
view
214 -
download
0
Transcript of 4(7/2+).'0 !0%23 - OECD 7. Dans près de la moitié des pays de l’OCDE, les délais d’attente...
DELSA/ELSA/WD/HEA(2003)7
OECD HEALTH WORKING PAPERS
7
Explaining Waiting Times Variations for Elective Surgery across OECD Countries
Luigi Siciliani and Jeremy Hurst

Unclassified DELSA/ELSA/WD/HEA(2003)7 Organisation de Coopération et de Développement Economiques Organisation for Economic Co-operation and Development 07-Oct-2003 ___________________________________________________________________________________________
English - Or. English DIRECTORATE FOR EMPLOYMENT, LABOUR AND SOCIAL AFFAIRS EMPLOYMENT, LABOUR AND SOCIAL AFFAIRS COMMITTEE
OECD HEALTH WORKING PAPERS NO. 7 Explaining Waiting Times Variations for Elective Surgery across OECD Countries
Luigi Siciliani and Jeremy Hurst
JT00150885
Document complet disponible sur OLIS dans son format d'origine Complete document available on OLIS in its original format
DE
LSA
/EL
SA/W
D/H
EA
(2003)7 U
nclassified
English - O
r. English

DELSA/ELSA/WD/HEA(2003)7
2
DIRECTORATE FOR EMPLOYMENT, LABOUR AND SOCIAL AFFAIRS
OECD HEALTH WORKING PAPERS This series is designed to make available to a wider readership health studies prepared for use within the OECD. Authorship is usually collective, but principal writers are named. The papers are generally available only in their original language – English or French – with a summary in the other. Comment on the series is welcome, and should be sent to the Directorate for Employment, Labour and Social Affairs, 2, rue André-Pascal, 75775 PARIS CEDEX 16, France.
The opinions expressed and arguments employed here are the responsibility of the author(s) and do not necessarily reflect those of the OECD
Applications for permission to reproduce or translate all or part of this material should be made to:
Head of Publications Service
OECD 2, rue André-Pascal
75775 Paris, CEDEX 16 France
Copyright OECD 2003

DELSA/ELSA/WD/HEA(2003)7
3
ACKNOWLEDGEMENTS
1. The authors wish to thank those colleagues who helped them in the drafting of this report: John Martin, Martine Durand and Peter Scherer for comments on earlier versions of the paper; Gabrielle Hodgson for her statistical assistance and Marianne Scarborough for her secretarial assistance. They also wish to thank the following experts from participating countries. Australia: Alice Creelman, Mary-Julia Diethelm, Jacky Fogerty, Elaine Pulleine, Phil Ghirardello (Department of Health and Ageing), Jeff Richardson (Monash University); Canada: Diane Lugsdin, Sylvie Gauthier (Health Canada), Jennifer Zelmer, Indra Pulcins (Canadian Institute for Health Information), John McGurran (Western Canada Waiting List Project); Denmark: Frans Clemmesen, Steffen Nielsen, Henrik Mulvad Hansen (Department of Interior and Health); Finland: Jouko Isolauri (Ministry of Social Affairs and Health); Järvelin Jutta, Unto Häkkinen (STAKES); Ireland: Joseph Cregan, Robbie Breen (Department of Health and Children); Italy: Alessandro Solipaca (ISTAT); Netherlands: Saskia Van Eck, Marian van der Maten, Anno Pomp (Ministry of Health, Welfare and Sports); New Zealand: Francis Dickinson, Andrew Holmes; Norway: Marit Getz Wold, Inger M. Nilstad, Guri G. Kjæserud, (Ministry of Health), Ola Kindseth, Karl-Gerhard Hem (Sintef Unimed); Spain: Carmen M. de Pancorbo, Isabel de la Mata Barranco, Maria A. Gogorcena; Sweden: Marianne Hanning (Swedish Federation of County Councils); United Kingdom: Clive Smee, Barry McCormick, David Bensley, Elizabeth Lawler (English Department of Health). They also wish to thank others who helped them in an expert capacity: Peter C. Smith (University of York), Reinhard Busse (Technische Universitaet Berlin), Alain Sommers (BIAC) and Elizabeth Docteur (OECD). Finally, they wish to thank Joergen Lotz (Danish delegation to the OECD) for helping to devise the project and for his strong support.
DELSA/ELSA/WD/HEA(2003)7
4
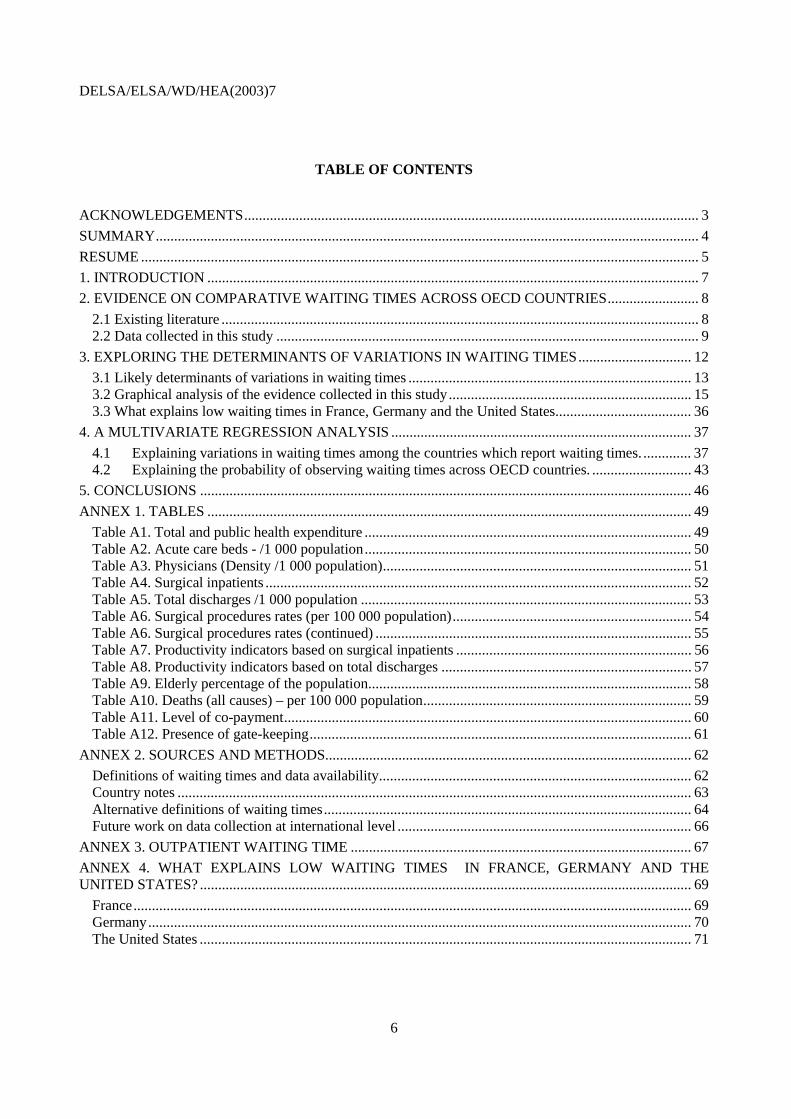
SUMMARY
2. Waiting times for elective surgery are a significant health policy concern in approximately half of all OECD countries. The main objectives of the OECD Waiting Times project were to: i) review policy initiatives to reduce waiting times in 12 OECD countries; and ii) to investigate the causes of variations in waiting times for non-emergency surgery across countries. The first objective was addressed in an earlier report (Hurst and Siciliani, 2003; OECD Health Working paper, n.6).
3. This report is devoted to the second objective. An interesting feature of OECD countries is that while some countries report significant waiting, others do not. Waiting times are a serious health policy issue in the 12 countries involved in this project (Australia, Canada, Denmark, Finland, Ireland, Italy, Netherlands, New Zealand, Norway, Spain, Sweden, and the United Kingdom). Waiting times are not recorded administratively in a second group of countries (Austria, Belgium, France, Germany, Japan, Luxembourg, Switzerland, and the United States) but are anecdotally (informally) reported to be low.
4. This paper contains a comparative analysis of these two groups of countries and addresses what factors may explain the absence of waiting times in the second group. It suggests that there is a clear negative association between waiting times and capacity, either measured in terms of number of beds or number of practising physicians. Analogously, a higher level of health spending is also systematically associated with lower waiting times, all other things equal.
5. Among the group of countries with waiting times, it is the availability of doctors that has the most significant negative association with waiting times. Econometric estimates suggest that a marginal increase of 0.1 practising physicians and specialists (per 1 000 population) is associated respectively with a marginal reduction of mean waiting times of 8.3 and 6.4 days (at the sample mean) and a marginal reduction of median waiting times of 7.6 and 8.9 days, across all procedures included in the study. Analogously, an increase in total health expenditure per capita of $100 is associated with a reduction of mean waiting times of 6.6 days and of median waiting times of 6.1 days.
6. In the comparison between countries with and without waiting times, low availability of acute care beds is significantly associated with the presence of waiting times. Also, evidence from this and other studies suggests that fee-for-service remuneration for specialists, as opposed to salaried remuneration, is negatively associated with the presence of waiting times. Fee-for-service systems may induce specialists to increase productivity and may also discourage the formation of visible queues because of competitive pressures. In addition, evidence from this and other studies suggests that activity-based funding for hospitals may also help reduce waiting times.

DELSA/ELSA/WD/HEA(2003)7
5
RESUME
7. Dans près de la moitié des pays de l’OCDE, les délais d’attente pour les interventions chirurgicales non urgentes constituent un important sujet de préoccupation pour les responsables de la politique de la santé. Le projet de l’OCDE sur ce sujet vise principalement les objectifs suivants : i) examiner les initiatives prises par les pouvoirs publics en vue de réduire ces délais d’attente dans douze pays Membres ; ii) rechercher les causes des différences observées d’un pays à l’autre quant à ces délais. Un précédent rapport a été consacré au premier de ces objectifs (Hurst et Siciliani, 2003 ; document de travail de l’OCDE sur la santé, n°6).
8. Le présent document porte sur le second objectif. Il est intéressant de noter que, si certains pays de l’OCDE font état de délais d’attente non négligeables, ce n’est pas le cas pour d’autres. Ces délais posent un épineux problème de fond en matière de santé dans les douze pays qui participent au projet (Australie, Canada, Danemark, Espagne, Finlande, Irlande, Italie, Nouvelle-Zélande, Norvège, Pays-Bas, Royaume-Uni et Suède). Or, dans huit autres pays (Allemagne, Autriche, Belgique, Etats-Unis, France, Japon, Luxembourg et Suisse), ces temps d’attente sont, semble-t-il, peu importants.
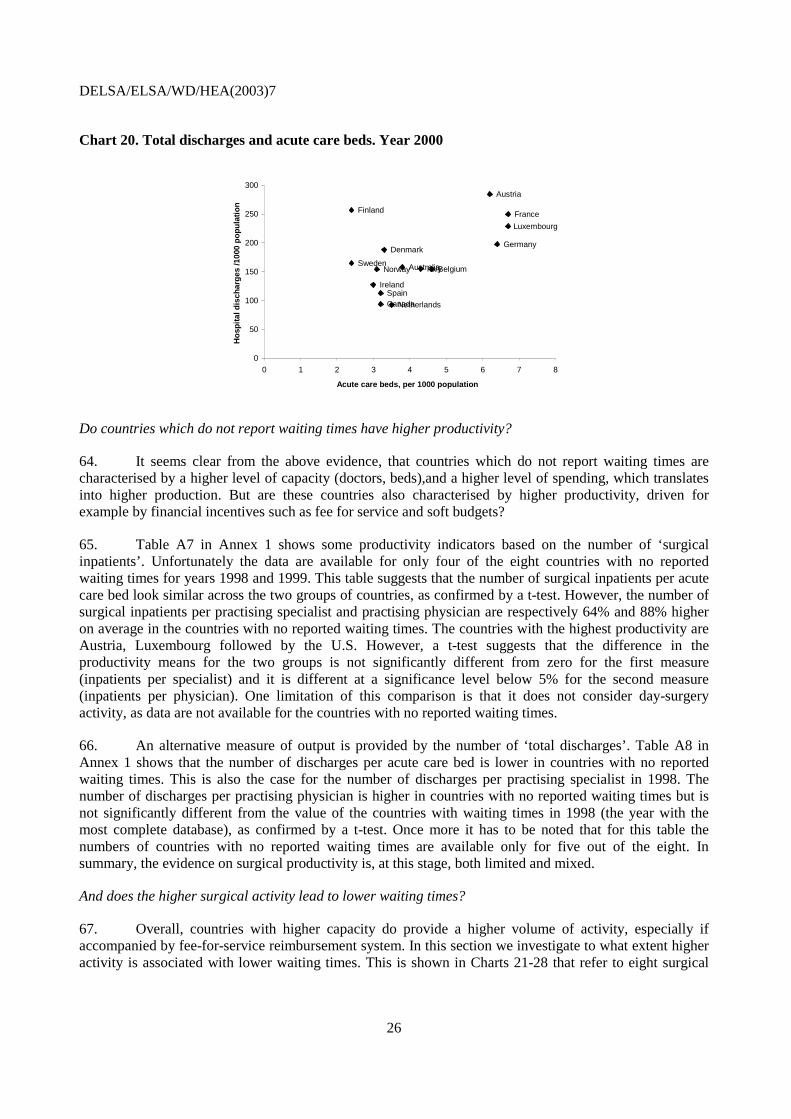
9. Cet exposé présente une analyse comparative de la situation de ces deux groupes de pays et s’intéresse aux facteurs de nature à expliquer l’absence de délais d’attente dans le second. Il montre qu’il existe une nette corrélation négative entre ces délais et la capacité, qu’elle soit mesurée en nombre de lits ou en nombre de médecins en exercice. De même, des dépenses de santé élevées vont systématiquement de pair avec de faibles délais d’attente, toutes choses étant égales par ailleurs.
10. Dans les pays où il existe des délais d’attente, c’est avec l’offre de médecins que ceux-ci ont la corrélation négative la plus forte. Selon des estimations économétriques, une augmentation marginale de 0.1 médecins et spécialistes en exercice (pour 1 000 habitants) entraîne respectivement une réduction marginale des délais d’attente moyens de 8.3 et 6.4 jours (moyenne de l’échantillon) et une réduction marginale des délais d’attente médians de 7.6 et 8.9 jours. De même, un accroissement de 100 dollars des dépenses totales de santé par habitant induit une diminution des délais d’attente moyens de 6.6 jours et des délais d’attente médians de 6.1 jours.
11. La comparaison des pays connaissant des délais d’attente avec ceux où ces délais sont absents montre qu’une offre peu importante de lits pour soins de courte durée est en forte corrélation avec l’existence de délais d’attente. De plus, il ressort des observations recueillies dans le cadre de cette étude et d’autres travaux que la rémunération des spécialistes à l’acte plutôt que par un salaire est en corrélation négative avec l’existence de délais d’attente. Il se peut que les systèmes de paiement à l’acte incitent les spécialistes à accroître leur productivité et qu’ils freinent aussi la formation de files d’attente visibles en raison de la pression exercée par la concurrence. Cette analyse et d’autres études donnent à penser que l’octroi aux hôpitaux d’un financement lié à l’activité peut aussi contribuer à faire baisser les délais d’attente.
DELSA/ELSA/WD/HEA(2003)7
6
TABLE OF CONTENTS
ACKNOWLEDGEMENTS............................................................................................................................ 3 SUMMARY.................................................................................................................................................... 4 RESUME ........................................................................................................................................................ 5 1. INTRODUCTION ...................................................................................................................................... 7 2. EVIDENCE ON COMPARATIVE WAITING TIMES ACROSS OECD COUNTRIES......................... 8
2.1 Existing literature .................................................................................................................................. 8 2.2 Data collected in this study ................................................................................................................... 9
3. EXPLORING THE DETERMINANTS OF VARIATIONS IN WAITING TIMES............................... 12 3.1 Likely determinants of variations in waiting times ............................................................................. 13 3.2 Graphical analysis of the evidence collected in this study.................................................................. 15 3.3 What explains low waiting times in France, Germany and the United States..................................... 36
4. A MULTIVARIATE REGRESSION ANALYSIS .................................................................................. 37 4.1 Explaining variations in waiting times among the countries which report waiting times. ............. 37 4.2 Explaining the probability of observing waiting times across OECD countries. ........................... 43
5. CONCLUSIONS ...................................................................................................................................... 46 ANNEX 1. TABLES .................................................................................................................................... 49
Table A1. Total and public health expenditure ......................................................................................... 49 Table A2. Acute care beds - /1 000 population......................................................................................... 50 Table A3. Physicians (Density /1 000 population).................................................................................... 51 Table A4. Surgical inpatients .................................................................................................................... 52 Table A5. Total discharges /1 000 population .......................................................................................... 53 Table A6. Surgical procedures rates (per 100 000 population)................................................................. 54 Table A6. Surgical procedures rates (continued) ...................................................................................... 55 Table A7. Productivity indicators based on surgical inpatients ................................................................ 56 Table A8. Productivity indicators based on total discharges .................................................................... 57 Table A9. Elderly percentage of the population........................................................................................ 58 Table A10. Deaths (all causes) – per 100 000 population......................................................................... 59 Table A11. Level of co-payment............................................................................................................... 60 Table A12. Presence of gate-keeping........................................................................................................ 61
ANNEX 2. SOURCES AND METHODS.................................................................................................... 62 Definitions of waiting times and data availability..................................................................................... 62 Country notes ............................................................................................................................................ 63 Alternative definitions of waiting times.................................................................................................... 64 Future work on data collection at international level ................................................................................ 66
ANNEX 3. OUTPATIENT WAITING TIME ............................................................................................. 67 ANNEX 4. WHAT EXPLAINS LOW WAITING TIMES IN FRANCE, GERMANY AND THE UNITED STATES? ...................................................................................................................................... 69
France........................................................................................................................................................ 69 Germany.................................................................................................................................................... 70 The United States ...................................................................................................................................... 71

DELSA/ELSA/WD/HEA(2003)7
7
1. INTRODUCTION
12. Waiting times for elective surgery are a main health policy concern in approximately half of all OECD countries. The main objectives of the OECD Waiting Times project have been to: i) review policy initiatives to reduce waiting times in 12 OECD countries; and ii) to investigate the causes of variations in waiting times for non-emergency surgery across countries. The first objective was addressed in an earlier report (Hurst and Siciliani, 2003; OECD Health Working paper, No.6).
13. This report is devoted to the second objective. An interesting feature of OECD countries is that while some countries report significant waiting, others do not. For the 12 countries involved in this project, waiting times are a serious health policy issue. In most of these countries waiting times are routinely recorded through administrative databases. These 12 countries are: Australia, Canada, Denmark, Finland, Ireland, Italy, Netherlands, New Zealand, Norway, Spain, Sweden and the United Kingdom1.
14. A second group of eight OECD countries can be identified, where waiting times are reported to be low. For these countries policy makers indicate that waiting times are not an issue. These countries are: Austria, Belgium, France, Germany, Japan, Luxembourg, Switzerland and the United States.
15. This paper contains a comparative analysis of these two groups of countries and addresses what factors may explain the absence of waiting times in the second group. The remaining ten OECD countries are not included in this study, either because it is not known to what extent waiting times represent an issue or because adequate information is not available at present. These ten countries are: Czech Republic, Greece, Hungary, Iceland, Korea, Mexico, Poland, Portugal, Slovak Republic and Turkey.
16. Waiting times are a complex phenomenon and are the results of many possible determinants and variables. However, only a subset of these variables can be measured empirically at an international level. This is a limitation of the present study. A more comprehensive approach has been used in an earlier separate report, which looks in detail at how each country with waiting times has tried to manage them (Hurst and Siciliani, 2003).
17. The study is organised in the following way. Section 2 provides evidence of waiting times across OECD countries. Section 3 explores the factors that may explain variations in waiting times. Section 4 provides a set of multivariate regression analyses which quantify the effect of various determinants on waiting times. Section 5 contains conclusions. Four annexes are also included. Annex 1 presents Tables A1-A12, which support the analysis. Annex 2 contains the information relative to the data collection, including sources and methods. Annex 3 presents some available evidence on outpatient waiting times. Annex 4 seeks to explain how three countries without waiting times (France, Germany and the United States) seem to avoid them.
1 This list of countries is not exhaustive of all OECD countries with waiting times (for example, waiting
times are currently an issue in Portugal, as well).

DELSA/ELSA/WD/HEA(2003)7
8
2. EVIDENCE ON COMPARATIVE WAITING TIMES ACROSS OECD COUNTRIES
18. This section presents international evidence on waiting times for elective surgery across OECD countries. We first describe the evidence from the available literature, which is mainly based on small-sample surveys. We then present further evidence gathered through the OECD Waiting-Times project from large national administrative databases.
2.1 Existing literature
19. There is a small amount of comparative waiting-time data from international surveys. One advantage of international surveys is that they report evidence also for countries where waiting times are not a policy concern. However, they are often based on small samples of respondents.
20. Table 1 shows some data on waiting for surgery in eight European countries (Fleming et al., 1992). It provides figures on the proportion of patients, who in 1990 waited longer than 12 weeks between specialist assessment and surgery, as reported by samples of GPs for samples of their patients in each country. It reports Portugal as the country with the highest percentage of patients waiting longer than 12 weeks (58.1%), followed by the United Kingdom (41.7%), Italy (36.3%), Norway (28%), Germany (19.4%), Spain (18.5%), Switzerland (16.1%) and the Netherlands (15.2%). The main limitations of this survey are that the information was reported by the GPs (and not directly by the patients). Moreover as the survey dates back to more than ten years ago, the waiting times which were reported may not reflect the current situation. Note how surprisingly Germany and Switzerland report similar percentages compared to Spain and the Netherlands.
Table 1. Waiting between specialist appointment and surgical intervention
% of patients waiting for surgery more than 12 weeks (year 1990) Countries where waiting times are not a policy concern Germany 19.4 Switzerland 16.1 Countries where waiting times are a policy concern Italy 36.3 Netherlands 15.2 Norway 28.0 Portugal 58.1 Spain 18.5 United Kingdom 41.7
Source: Fleming, et al., 1992. 21. Table 2 shows data of a recent study (Blendon et al., 2002) for five English-speaking countries, which measures the percentage of respondents to a phone survey in 2001, who had experienced elective surgery in the last two years and who said they had waited longer than four months for elective surgery. It was found that 38% of patients had been waiting for at least 4 months in the United Kingdom, 27% in Canada, 26% in New Zealand, 23% in Australia and 5% in the U.S.

DELSA/ELSA/WD/HEA(2003)7
9
Table 2. Percentage of patients waiting for elective surgery more than 4 months
Base: Those with elective surgery in the past 2 years Year 1998 Year 2001 Countries where waiting times are not a policy concern United States 1 5 Countries where waiting times are a policy concern Australia 17 23 Canada 12 27 New Zealand 22 26 United Kingdom 33 38
Source: Blendon, et al., 2002. 22. Table 3 summarises the information contained in three further surveys. Carroll et al. (1995) focused on waiting times for cardiovascular procedures in four countries. It found that the percentage of the respondents in need of elective coronary bypass who had been waiting for more than three months was 88.9% in the United Kingdom, 46.7% in Canada, 18.2% in Sweden and 0% in the U.S. For elective coronary angiography the percentage was 22.8% in the United Kingdom, 16.1% in Canada, 15.4% in Sweden and 0% in the U.S. Similarly, Coyte et al. (1994) found that surveyed patients in need of knee replacement had a median waiting time of eight weeks in Canada (Ontario) and three weeks in the U.S. In Germany, self-reported mean waiting times for cataract surgery was equal to 35 days in 2000 (Wenzel, Reuscher and Aral, 2001; the survey was based on 450 institutions and 926 operating ophthalmologists).
Table 3. Inpatient waiting times.
CABG % waiting more than 3 months (year 1993)
PTCA % waiting more than 3 months (year 1993)
Knee replacement Median waiting time (weeks) (year 1985-1989)
Cataract surgery Median waiting time (weeks) (year 2000)
Countries where waiting times are not a policy concern Germany 5 weeks United States 0% 0% Countries where waiting times are a policy concern Canada 46.7% 16.1% 8 weeks (Ontario) Sweden 18.2% 15.4% 3 weeks United Kingdom 88.9% 22.8%
23. Finally for some OECD countries, there is some anecdotal evidence that waiting times are low. Imai, Jacobzone and Lenain (2000; p.2) report that “the health system in France is regarded as delivering high quality services, with freedom of choice and generally no waiting lists for treatments”. For Belgium, WHO (2000; p.33) reports that “Patients do not usually have to wait long, if at all, for access either to general practitioners or specialists”.
2.2 Data collected in this study
24. In this study data on waiting times were requested by questionnaire for ten elective procedures in twelve countries. The results are shown in Tables 4 and 5. The preferred definition of waiting times was “The time elapsed for a patient on the elective surgery waiting list from the date they were added to the waiting list for the procedure, after specialist assessment, to the date they were admitted to an inpatient or

DELSA/ELSA/WD/HEA(2003)7
10
day-case surgical unit for the procedure”. This definition is commonly referred to as “the waiting time of the patients admitted”. The main reason for choosing this measure is that it is the one most widely available in OECD countries.
25. This measurement is available in eight countries, at least for some surgical procedures. Alternative measures such as the “waiting time of the patients on the list” or “total waiting” (inpatient plus outpatient) were available for few countries. Measures of the inpatient waiting time of the patients on the list were available for Spain (Insalud; mean), Ireland and Sweden (percentage of patients waiting longer than 12 months). Measures of total waiting (from GP referral to treatment) were available in Denmark and Norway (see Annexes 2 and 3 for more details).
26. Tables 4 and 5 report respectively the mean and median inpatient waiting time of the patient admitted. More details about the methodology and the samples considered are included in Annex 2.
Table 4. Mean inpatient waiting times of patients admitted by surgical procedure. Year 2000. Number of days.
Hip replace-ment
Knee Repla- Cement
Cataract surgery
Varicose veins
Hyste-rectomy
Prosta-tectomy
Cholecy-stectomy
Inguinal and femoral hernia
CABG
PTCA
Australia 163 201 179 216 54 69 83 87 44 Denmark 112 112 71 99 75 73 Finland 206 274 233 280 100 81 159 125 42 30 Norway 133 160 63 142 64 75 103 109 46 53 Netherlands 96 85 111 107 61 60 71 75 18 Spain (Insalud) 123 148 104 117 102 62 107 102 39 81 Sweden 199 United Kingdom (England) 244 281 206 227 159 52 156 150 213 80 Notes: More details on “Sources and methods” are contained in Annex 2. Australia: includes Queensland, South Australia and Western Australia. Norway: cataract waiting time refers to 2001. Spain: includes INSALUD population only. United Kingdom: includes English population only.
Table 5. Median inpatient waiting times of patients admitted by surgical procedure. Year 2000. Number of days.
Hip Replace-ment
Knee Repla- Cement
Cataract surgery
Varicose veins
Hyste-rectomy
Prosta-tectomy
Cholecy-stectomy
Inguinal and femoral hernia
CABG
PTCA
Australia 98 120 120 94 38 24 48 46 22
Canada
112( BC) 105(MN) 162(SK)
136 (BC) 105(MN) 291(SK)
80 (BC)
23(ON) 10(SK)
Denmark 87 90 36 69 57 46
Finland 148 202 189 155 70 39 90 74 34 20
Norway 99 132 28 110 37 47 63 74 25 18 United Kingdom (England) 211 261 182 178 110 37 97 95 191 58 Notes: More details on “Sources and methods” are contained in Annex 2. Australia: includes Queensland, South Australia and Western Australia. Canada: BC=British Columbia, MN=Manitoba, ON=Ontario and SK= Saskatchewan. Norway: cataract waiting time refers to 2001. Spain: includes INSALUD population only. United Kingdom: includes English population only.

DELSA/ELSA/WD/HEA(2003)7
11
27. The countries with highest waiting times were the United Kingdom (England) and Finland, followed by Denmark, Norway, Australia and Spain (Insalud). The country with the shortest waiting times was the Netherlands. It is interesting to note how the waiting times for less urgent procedures (for example hip and knee replacement, cataract surgery) are systematically higher than the waiting times for more urgent procedures (for example hysterectomy, CABG, PTCA). This provides evidence that specialists do prioritise patients according to their urgency.
28. As the waiting times distributions tend to be positively skewed, the mean and median can be significantly different. The mean is consistently larger than the median. This is because there is a small proportion of patients with very long waits (Sanmartin, 2001). Comparing waiting times in Tables 4 and 5, the difference between mean and median varies between 22-43%, depending on the procedure considered.
29. Finally, although in this study we focus on inpatient waiting time, a significant part of the total waiting experienced by the patients includes outpatient waiting (the time from GP referral to the specialist visit). Preliminary evidence from three countries (the United Kingdom (England), Denmark and Norway) suggests that outpatient waiting accounts for at least one third of total waiting (see Annex 3 for more details).
DELSA/ELSA/WD/HEA(2003)7
12
3. EXPLORING THE DETERMINANTS OF VARIATIONS IN WAITING TIMES
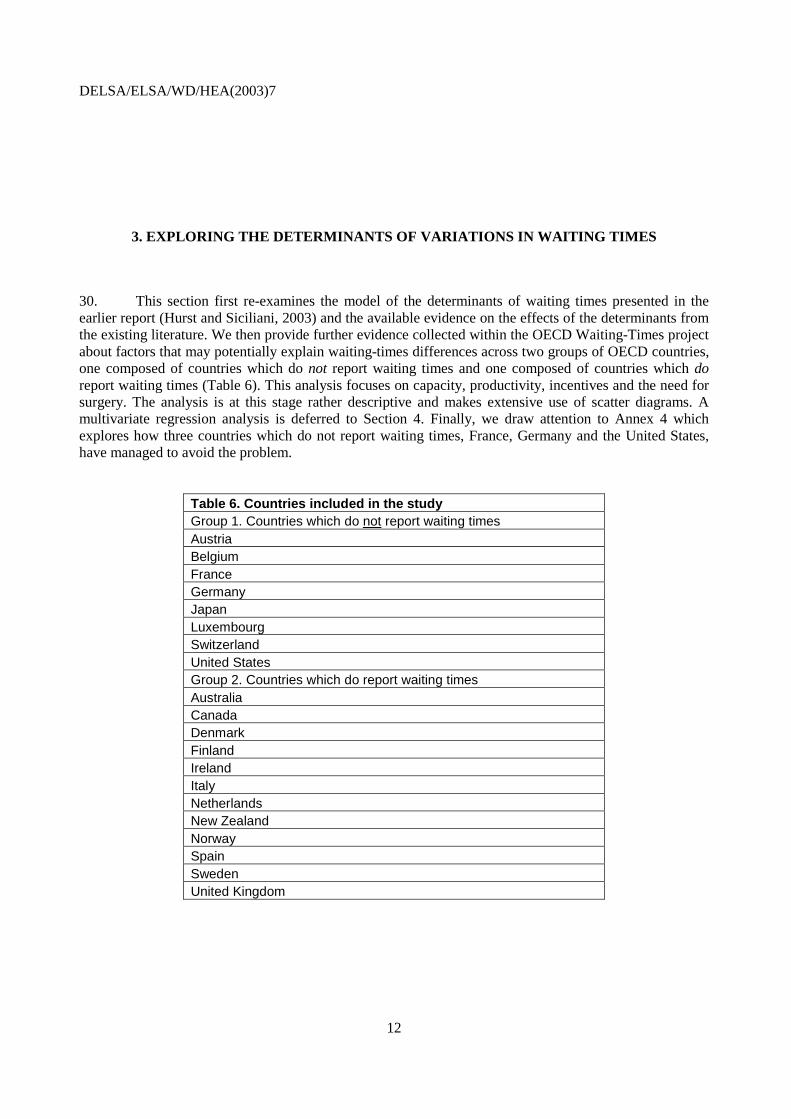
30. This section first re-examines the model of the determinants of waiting times presented in the earlier report (Hurst and Siciliani, 2003) and the available evidence on the effects of the determinants from the existing literature. We then provide further evidence collected within the OECD Waiting-Times project about factors that may potentially explain waiting-times differences across two groups of OECD countries, one composed of countries which do not report waiting times and one composed of countries which do report waiting times (Table 6). This analysis focuses on capacity, productivity, incentives and the need for surgery. The analysis is at this stage rather descriptive and makes extensive use of scatter diagrams. A multivariate regression analysis is deferred to Section 4. Finally, we draw attention to Annex 4 which explores how three countries which do not report waiting times, France, Germany and the United States, have managed to avoid the problem.
Table 6. Countries included in the study Group 1. Countries which do not report waiting times Austria Belgium France Germany Japan Luxembourg Switzerland United States Group 2. Countries which do report waiting times Australia Canada Denmark Finland Ireland Italy Netherlands New Zealand Norway Spain Sweden United Kingdom

DELSA/ELSA/WD/HEA(2003)7
13
3.1 Likely determinants of variations in waiting times
31. A model of the likely determinants of waiting times (Chart 1) and the relevant evidence from the literature was reviewed in an earlier report (Hurst and Siciliani, 2003) and is summarised in this section. Waiting times may be determined by demand factors that affect the inflow to the waiting list, and by supply factors, that affect the outflow. The demand for elective surgery is determined by the health status of the population and by the state of medical technology, which determines the range of conditions which are treatable and patient’s expectations. Various financial incentives, such as the extent of cost sharing by public patients, the proportion of the population with private health insurance and the price of private surgery, are also likely to be factors influencing demand. Meanwhile, given the key role that doctors play in managing demand, the thresholds for referrals and for additions to the list, set by GPs and surgeons, respectively will be important. Competitive fee-for-service payment of surgeons, unlike salaried payment, may encourage many to offer fast access – that is, to maintain short queues (Iversen and Luras, 2002) – especially where there are no gatekeepers and such surgeons can assume primary care responsibilities for patients. In contrast, allowing dual practice by salaried surgeons (in both public and private sectors) may encourage some surgeons to lengthen the public queues to boost the demand for their private practices (DeCoster et al., 2000; Morga and Xavier, 2001).
32. The supply of elective surgery depends on both public and private surgical capacity and the productivity with which capacity is used. Evidence on the impact of capacity is provided by Martin and Smith (1999) who showed that the waiting time is negatively associated with the number of available beds (elasticity equal to -0.242), using an English database from the Hospital Episode Statistics in fiscal year 1991-92. Similarly, Lindsay and Feigenbaum (1984) found waiting times to be negatively associated with both the number of available doctors and beds.
GP ass- essment
Waiting list (stock)
Surgeon assessment
Public procedure performed
additions inflow
treatments outflow
leakage
Private procedure performed
Private elective treatment
Emergency surgical treatment
referrals
Return to GP
Waiting time
+ + -
- +
Health status Technology Severity thresholds Patients expectations Cost sharing PHI coverage Price of private
+
Public capacity (beds, surgeons) Capacity in the private sector Productivity (public and private)
+
Chart 1
Emergency arrivals
DELSA/ELSA/WD/HEA(2003)7
14
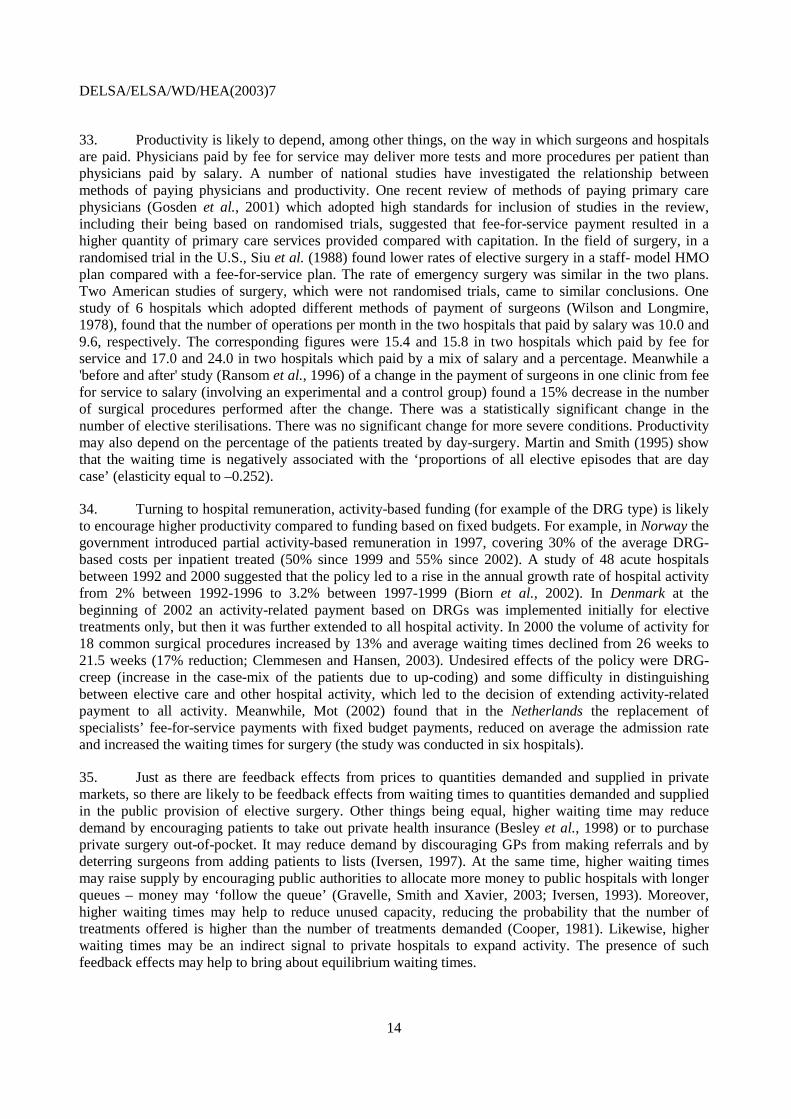
33. Productivity is likely to depend, among other things, on the way in which surgeons and hospitals are paid. Physicians paid by fee for service may deliver more tests and more procedures per patient than physicians paid by salary. A number of national studies have investigated the relationship between methods of paying physicians and productivity. One recent review of methods of paying primary care physicians (Gosden et al., 2001) which adopted high standards for inclusion of studies in the review, including their being based on randomised trials, suggested that fee-for-service payment resulted in a higher quantity of primary care services provided compared with capitation. In the field of surgery, in a randomised trial in the U.S., Siu et al. (1988) found lower rates of elective surgery in a staff- model HMO plan compared with a fee-for-service plan. The rate of emergency surgery was similar in the two plans. Two American studies of surgery, which were not randomised trials, came to similar conclusions. One study of 6 hospitals which adopted different methods of payment of surgeons (Wilson and Longmire, 1978), found that the number of operations per month in the two hospitals that paid by salary was 10.0 and 9.6, respectively. The corresponding figures were 15.4 and 15.8 in two hospitals which paid by fee for service and 17.0 and 24.0 in two hospitals which paid by a mix of salary and a percentage. Meanwhile a 'before and after' study (Ransom et al., 1996) of a change in the payment of surgeons in one clinic from fee for service to salary (involving an experimental and a control group) found a 15% decrease in the number of surgical procedures performed after the change. There was a statistically significant change in the number of elective sterilisations. There was no significant change for more severe conditions. Productivity may also depend on the percentage of the patients treated by day-surgery. Martin and Smith (1995) show that the waiting time is negatively associated with the ‘proportions of all elective episodes that are day case’ (elasticity equal to –0.252).
34. Turning to hospital remuneration, activity-based funding (for example of the DRG type) is likely to encourage higher productivity compared to funding based on fixed budgets. For example, in Norway the government introduced partial activity-based remuneration in 1997, covering 30% of the average DRG-based costs per inpatient treated (50% since 1999 and 55% since 2002). A study of 48 acute hospitals between 1992 and 2000 suggested that the policy led to a rise in the annual growth rate of hospital activity from 2% between 1992-1996 to 3.2% between 1997-1999 (Biorn et al., 2002). In Denmark at the beginning of 2002 an activity-related payment based on DRGs was implemented initially for elective treatments only, but then it was further extended to all hospital activity. In 2000 the volume of activity for 18 common surgical procedures increased by 13% and average waiting times declined from 26 weeks to 21.5 weeks (17% reduction; Clemmesen and Hansen, 2003). Undesired effects of the policy were DRG-creep (increase in the case-mix of the patients due to up-coding) and some difficulty in distinguishing between elective care and other hospital activity, which led to the decision of extending activity-related payment to all activity. Meanwhile, Mot (2002) found that in the Netherlands the replacement of specialists’ fee-for-service payments with fixed budget payments, reduced on average the admission rate and increased the waiting times for surgery (the study was conducted in six hospitals).
35. Just as there are feedback effects from prices to quantities demanded and supplied in private markets, so there are likely to be feedback effects from waiting times to quantities demanded and supplied in the public provision of elective surgery. Other things being equal, higher waiting time may reduce demand by encouraging patients to take out private health insurance (Besley et al., 1998) or to purchase private surgery out-of-pocket. It may reduce demand by discouraging GPs from making referrals and by deterring surgeons from adding patients to lists (Iversen, 1997). At the same time, higher waiting times may raise supply by encouraging public authorities to allocate more money to public hospitals with longer queues – money may ‘follow the queue’ (Gravelle, Smith and Xavier, 2003; Iversen, 1993). Moreover, higher waiting times may help to reduce unused capacity, reducing the probability that the number of treatments offered is higher than the number of treatments demanded (Cooper, 1981). Likewise, higher waiting times may be an indirect signal to private hospitals to expand activity. The presence of such feedback effects may help to bring about equilibrium waiting times.

DELSA/ELSA/WD/HEA(2003)7
15
3.2 Graphical analysis of the evidence collected in this study
36. In this section we provide a graphical analysis of the cross-country evidence on waiting times and determinants collected within the OECD Waiting-Times project, informed by the model described above. Ideally, the investigation of waiting times for elective surgery would require data on surgeons, number of surgical beds, surgical expenditure and surgical need. However, these data are not yet available mainly due to cross-country comparability problems. In particular, our attempt to collect data on the number of surgeons and the number of surgical beds was not successful. Number of surgeons was reported by three countries and the number of surgical beds by only two countries. Hence, the analysis below falls back on total numbers of specialists and doctors, as a proxy for the number of surgeons, the total number of acute care beds, as a proxy for the number of surgical beds, and the total public and private health expenditure as a proxy for surgical expenditure. The implicit assumption is that the surgical share of these aggregate variables is reasonably similar across countries. Finally, it is difficult to find good measures of need for elective surgery. For example, for cataract surgery a good indicator of need would be the incidence of the population affected by cataract. Such data are not available at an international level. Consequently, in this study we have used as a proxy for need the percentage of the population over 65.
Do countries which do not report waiting times spend more?
37. In the light of the model outlined above and the evidence from the literature, we may advance the hypothesis that, higher health expenditure per capita is associated with higher rates of surgery and, for a given demand, a lower waiting time for surgery across countries. Table A1 in Annex 1 shows that total and public health expenditure per capita (US$PPP), were respectively 31% (19%, excluding the U.S.) and 16% higher in the countries not reporting waiting times in year 2000. Total health expenditure (per capita) was on average 2 750$ in countries not reporting waiting times and 2 092$ in countries with waiting times. Public health expenditure (per capita) was 1 842$ in countries not reporting waiting times and 1 585$ in countries with waiting times. Private health expenditure was 44% higher in countries not reporting waiting times. However this percentage reduces to 9% when U.S. and Switzerland are excluded from the comparison2. A t-test suggests that the difference in the health expenditure means for the two groups is different from zero at a significance level below 5% in the case of total health expenditure and 10% in the case of public health expenditure.
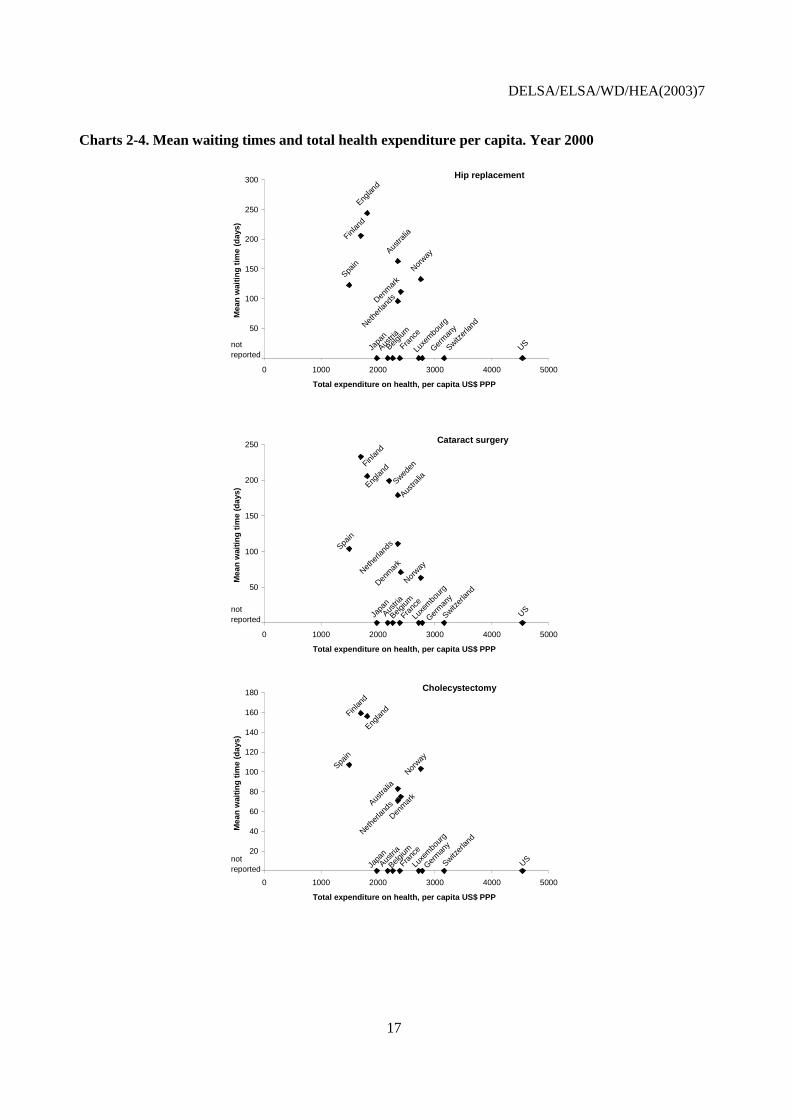
38. In Charts 2-7, we plot the mean waiting time for three common surgical procedures (hip replacement, cataract surgery and cholecystectomy) against health expenditure per capita in 2000. Correlations suggest in general a negative association. This implies that among the countries who report waiting times, countries with higher expenditure have lower waiting times. Charts 2-4 refer to total health expenditure, while Charts 5-7 to public health expenditure. We focus on these three procedures as they are representative of the waiting times within a country and tend to be correlated with the waiting times for other procedures.
39. The countries considered in Charts 2-4 may be classified into three categories: countries with low expenditure (less than 1900$), average expenditure (between 1900-2500$) and high expenditure (more than 2500$). Countries with low expenditure are the U.K., Finland and Spain; countries with average expenditure are Austria, Belgium, France, Australia, Denmark, Norway and the Netherlands; countries with high expenditure are Germany, Luxembourg, Switzerland and the U.S.
40. The charts suggest that countries like Finland and the U.K. have low expenditure and report generally the highest waiting times. On the other hand, countries like Germany, Luxembourg, Switzerland
2 For the US and Switzerland private health expenditure counts respectively for 56% and 44% of total health
expenditure (OECD Health Data, 2003).

DELSA/ELSA/WD/HEA(2003)7
16
and the U.S., have highest expenditure and do not report waiting times. However, Spain is a low-expenditure country but reports relatively low waiting times (similar to Denmark and Norway). Norway is a high-expenditure country (similar to Germany and Luxembourg) but reports relatively high waiting times (with the exception of cataract surgery).
41. More equivocal is the middle-expenditure category. It is interesting to note that, despite these countries being characterised by a similar level of expenditure, waiting times are reported in Australia, Denmark, the Netherlands and Sweden, but are not reported in Austria, Belgium and France.
42. A similar picture may be obtained from Charts 5-7 by plotting waiting times against public health expenditure per capita. Finland and the U.K. have highest waiting times and lowest public expenditure (below 1500$). Germany and Luxembourg do not report waiting times and have highest public expenditure (above 2000$). As in the previous case, Spain is a low public-expenditure country (below 1500$) but reports relatively low waiting times. Norway is a high-expenditure country (above 2000$) but reports relatively high waiting times (with the exception of cataract surgery). Among the countries with average level of public expenditure (between 1500$-2000$), Australia, Denmark and Sweden report waiting times while Austria, Belgium, France and Japan do not3.
43. Similar results may be obtained by using median waiting times as opposed to mean waiting times in the above charts for both total and public health expenditure.
44. The above evidence suggests that variations in expenditure may be an important determinant of waiting times but certainly not the only one. Moreover, it raises the following further questions. For similar level of total expenditure why do countries like Austria, Belgium and France not report waiting times while countries like Australia, Norway and Denmark do? How can Spain have such low waiting times with such low expenditure? Why does Norway not report low waiting times given its higher expenditure?
45. One possibility is that differences in expenditure do not necessarily reflect differences in surgical capacity and activity. Indeed, one limitation of the above charts is that health expenditure figures include not only hospital expenditure but also other expenditure (including pharmaceutical, public health and other…). An alternative is to proxy the amount of resources involved in the hospital sector by measuring the amount of acute care beds and personnel within each country. This is developed in the next section.
46. Another possible explanation is that countries with similar levels of expenditure, if exposed to different types of incentive and institutional settings may end up with very different level of waiting times. Certain financial incentives may for example induce increases in productivity, while certain institutional settings may induce a higher propensity to add patients on the list (for example in the presence of dual practice).
47. Finally, some countries may implement policies aimed at managing and reducing demand (as in New Zealand and Spain), independently of higher health expenditure. For example in Spain financial incentives for reductions in waiting times may have induced specialists to contain demand. In New Zealand the introduction of a booking system was aimed at raising clinical thresholds for adding patients to waiting lists (for more details see Hurst and Siciliani, 2003).
3 US and Switzerland are excluded from this comparison as a high share of health expenditure is private
(56% for the US and 44% for Switzerland).
DELSA/ELSA/WD/HEA(2003)7
17
Charts 2-4. Mean waiting times and total health expenditure per capita. Year 2000
USSwitzer
land
Luxe
mbour
g
Japa
n
Germ
any
Franc
e
Belgium
Austri
a
Spain
Nethe
rland
s
Norway
Finlan
d
Englan
d
Denm
ark
Austra
lia
0
50
100
150
200
250
300
0 1000 2000 3000 4000 5000
Total expenditure on health, per capita US$ PPP
Mea
n w
aiti
ng
tim
e (d
ays)
not reported
Hip replacement
Austra
lia
Denm
ark
Englan
dFinlan
d
NorwayNeth
erlan
dsSpain
Sweden
Austri
a
Belgium
Franc
e
Germ
any
Japa
n
Luxe
mbo
urg
Switzer
land
US
0
50
100
150
200
250
0 1000 2000 3000 4000 5000
Total expenditure on health, per capita US$ PPP
Mea
n w
aiti
ng
tim
e (d
ays)
not reported
Cataract surgery
USSwitzer
land
Luxe
mbo
urg
Japa
n
Germ
any
Franc
e
Belgium
Austri
a
Spain
Nethe
rland
s
Norway
Finlan
d
Englan
d
Denmar
kAus
tralia
0
20
40
60
80
100
120
140
160
180
0 1000 2000 3000 4000 5000
Total expenditure on health, per capita US$ PPP
Mea
n w
aiti
ng
tim
e (d
ays)
not reported
Cholecystectomy

DELSA/ELSA/WD/HEA(2003)7
18
Charts 5-7. Mean waiting times and public health expenditure per capita. Year 2000
USSwitz
erlan
d
Luxe
mbo
urg
Japa
n
Germ
any
Franc
e
Belgium
Austri
a
Spain
Nether
lands
Norway
Finlan
dEng
land
Denm
ark
Austra
lia
0
50
100
150
200
250
300
0 500 1000 1500 2000 2500 3000
Public expenditure on health, per capita US$ PPP
Mea
n w
aiti
ng
tim
e (d
ays)
not reported
Hip replacement
USSwitz
erlan
d
Luxe
mbo
urg
Japa
n
Germ
any
Franc
e
Belgium
Austri
a
Sweden
Spain
Nethe
rland
s
Norway
Finlan
d
Englan
d
Denm
ark
Austra
lia
0
50
100
150
200
250
0 500 1000 1500 2000 2500 3000
Public expenditure on health, per capita US$ PPP
Mea
n w
aiti
ng
tim
e (d
ays)
not reported
Cataract surgery
USSwitz
erlan
d
Luxe
mbo
urg
Japa
n
Germ
any
Franc
e
Belgium
Austri
a
Spain
Nether
lands
Norway
Finlan
d
Englan
d
Denm
arkAus
tralia
0
20
40
60
80
100
120
140
160
180
0 500 1000 1500 2000 2500 3000
Public expenditure on health, per capita US$ PPP
Mea
n w
aiti
ng
tim
e (d
ays)
not reported
Cholecystectomy

DELSA/ELSA/WD/HEA(2003)7
19
Do countries which do not report waiting times have higher capacity (beds, doctors)?
48. The two main inputs in the hospital production function are the personnel and the beds (often considered a rough proxy for capital). In this section we explore to what extent countries with higher beds and doctors report lower levels of waiting times. Table A2 in Annex 1 shows how countries not reporting waiting times had in 1998 on average 66% more acute care beds (per 1 000 population) compared to countries reporting waiting times. For example in year 1998 the average number of acute care beds was 5.8 (per 1 000 pop.) for the countries not reporting waiting as opposed to 3.5 for countries reporting waiting times4. A t-test suggests that the difference in the acute beds means for the two groups is different from zero at a significance level below 1%.
49. Charts 8-10 provide the relationship between waiting times (for three surgical procedures) and the number of acute care beds (per 1 000 population) in year 2000. Note that the countries, which do not report waiting times, with the exception of the U.S., have systematically higher number of acute care beds compared to countries with waiting times. The countries with the highest number of beds are France, Luxembourg, Germany and Austria (6.2-6.7 per 1 000 population), followed by Switzerland (4.1 per 1 000 population). A notable exception among the countries without waiting times is the U.S., with a very low number of acute care beds (2.9 per 1 000 population). This may be explained by the large share of activity that is carried out within the ambulatory care as opposed to the acute care sector (Docteur, Suppanz and Woo, 2003). It may also be explained by the remuneration system, usually based on payment per case by Diagnosis Related Groups (DRGs), which encourages reductions in length of stay.
50. Among the countries with waiting times, only a weak negative pattern is found between waiting times and acute care beds. Most of the countries with waiting times have a number of beds ranging in the interval 3.1-3.9 per 1 000 population (Norway, Spain, Denmark, Netherlands, Australia and the U.K.). The two countries with the lowest number of beds are Sweden and Finland (2.4 beds per 1 000 population). They report relatively high waiting times. Similar patterns may be identified for other surgical procedures.
51. One limitation of the above comparisons is that the figures on acute care beds include all hospitals (publicly and privately owned, publicly and privately funded). It is the number of publicly-funded beds (either publicly or privately owned) which is likely to affect most the waiting times for public patients. The number of privately-funded beds may also help to reduce waiting times, as long as patients are induced to opt for the private treatment. Another limitation of the above data is that the number of beds refers to all acute care (medical, surgical, elective and emergency) while the waiting times relate to selected elective procedures.
52. Overall, we may conclude that availability of acute beds differs markedly between the two groups of countries but not significantly within each group. A low endowment of acute care beds may constitute a binding constraint for countries with waiting times, limiting, in the short run, the opportunity to increase output to a great extent.
4 In comparing the numbers of acute care beds, some cautionary notes should be considered. Irish data do
not include beds in private hospitals. Finnish data are based on the number of occupied beddays. Both these figures are then downward biased. On the other hand, data for Luxembourg and the Netherlands include day care beds, which bias upwards their figures.

DELSA/ELSA/WD/HEA(2003)7
20
Charts 8-10. Mean waiting times and acute care beds. Year 2000
USSwitz
erlan
d
Luxe
mbo
urg
Germ
any
Franc
e
Austri
a
Sweden
Spain
Nethe
rland
s
Norway
Finlan
d
Englan
d
Denm
ark
Austra
lia
0
50
100
150
200
250
0 1 2 3 4 5 6 7 8
Acute care beds, per 1000 population, 2000
Mea
n w
aiti
ng
tim
e (d
ays)
not reported
Cataract surgery
USSwitz
erlan
d
Luxe
mbo
urg
Germ
any
Franc
e
Austri
a
Spain
Nethe
rland
sNor
way
Finlan
d
Englan
d
Denm
ark
Austra
lia
0
50
100
150
200
250
300
0 1 2 3 4 5 6 7 8
Acute care beds, per 1000 population, 2000
Mea
n w
aiti
ng
tim
e (d
ays)
not reported
Knee replacement
USSwitz
erlan
d
Luxe
mbo
urg
Germ
any
Franc
e
Austri
a
Spain
Nethe
rland
s
Norway
Finla
nd
Englan
d
Denm
ark
Austra
lia
0
20
40
60
80
100
120
140
160
180
0 1 2 3 4 5 6 7 8
Acute care beds, per 1000 population, 2000
Mea
n w
aiti
ng
tim
e (d
ays)
not reported
Cholecystectomy
53. Another important set of inputs to the hospital production function is provided by personnel (doctors, nurses and administrative staff). For elective surgery, the more appropriate measure (among the available ones) of the labour input is the number of “practising specialists”. However, in this section we also consider the total number of “practising physicians” on the ground that the data may be more comparable across countries and are available for a higher number of countries5.
5 The underlying assumption is that the proportion of GPs and other doctors as opposed to specialists does
not vary greatly across countries.

DELSA/ELSA/WD/HEA(2003)7
21
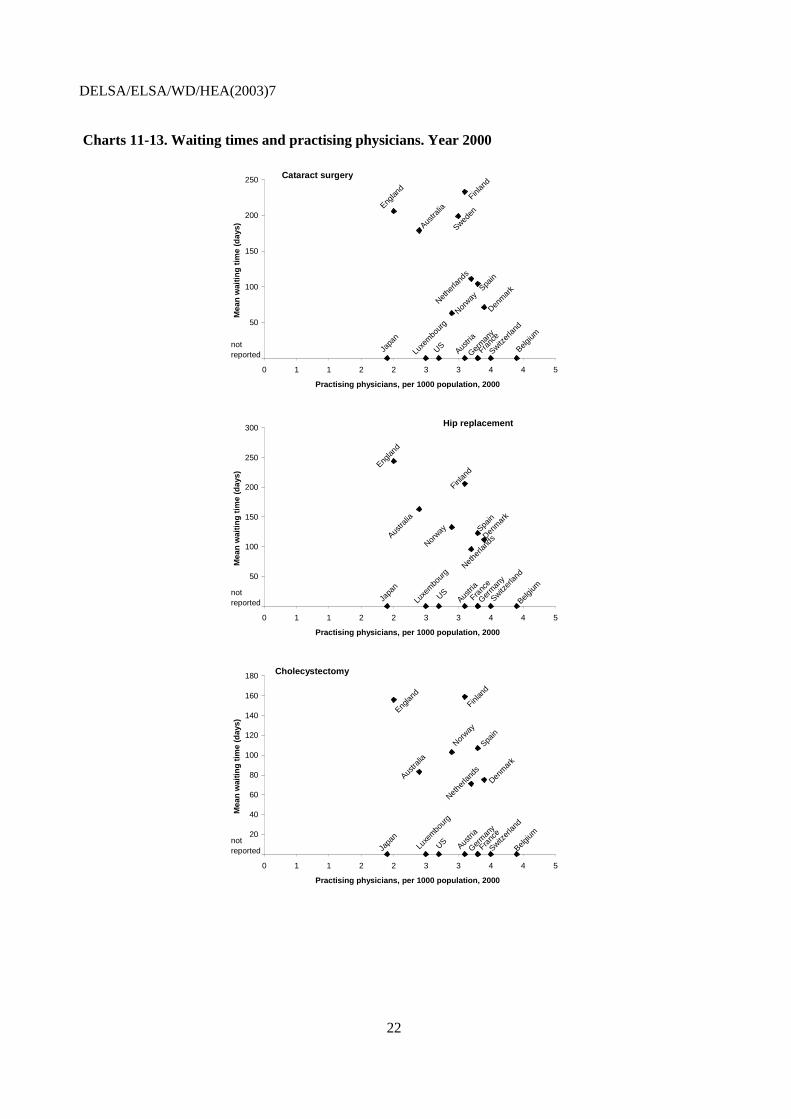
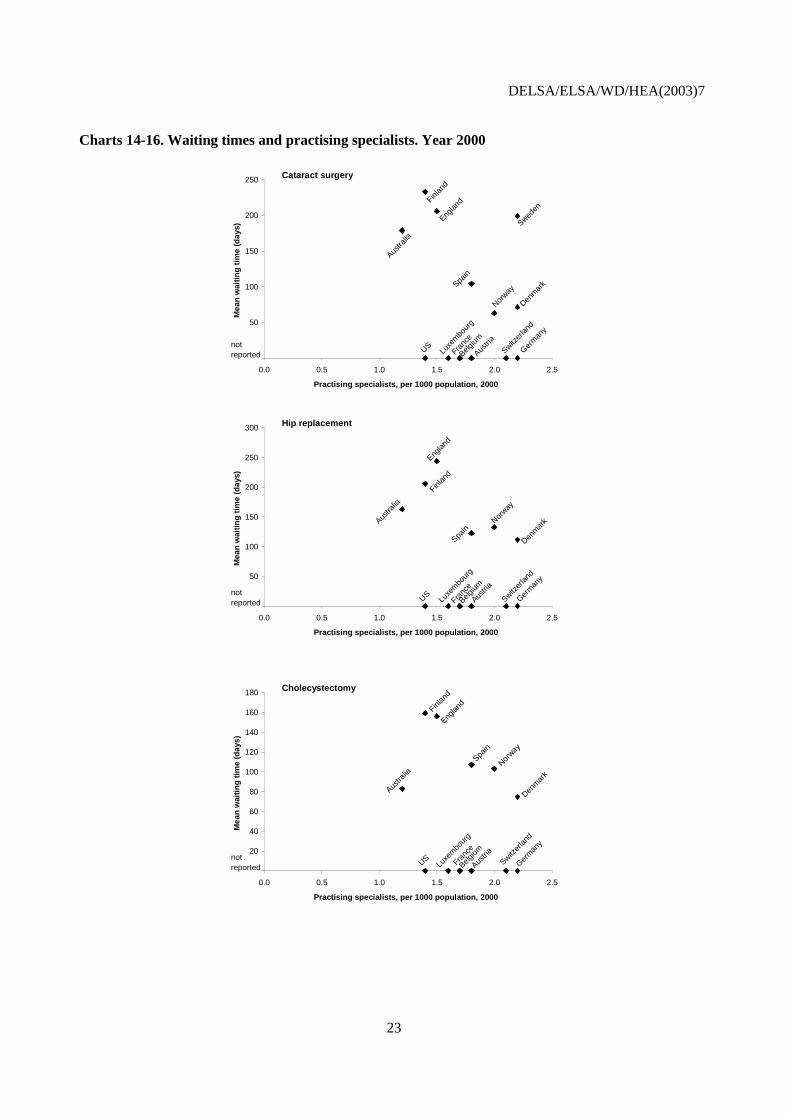
54. Table A3 in Annex 1 compares the number of practising physicians and specialists in the two groups of countries over the period 1998-2000. It shows that countries not reporting waiting times had on average in 1998 respectively 13.4% and 23.4% more practising physicians and practising specialists. For example in 1998, countries not reporting waiting had a number of practising physicians (per 1 000 population) equal to 2.9 as opposed to 2.6 for countries with waiting times. In the same year the number of practising specialists was 1.7 per 1 000 population in countries not reporting waiting times as opposed to 1.4 for countries with waiting times6. A t-test suggests that the difference in the doctor’s means for the two groups is different from zero at a significance level below 5% in the case of the practising physicians and 10% in the case of practising specialists. Charts 11-13 show the relationship of waiting times with the number of practising physicians (per 1 000 population) while Charts 14-16 show the relationship with practising specialists.
55. Among the countries with waiting times, both the availability of physicians and specialists show a negative correlation with variations in waiting times. From Chart 11 which refers to cataract surgery, we can also see how Sweden and Finland have considerable higher waiting times given the amount of doctors, compared to the other countries with waiting times. A possible explanation is that these countries are also characterised by a low level of acute care beds.
56. On the other hand, countries without waiting times often have similar levels of doctors compared to countries with waiting times. For example, Austria, France, Germany and Switzerland have a number of physicians which vary in the interval 3.1-3.3 per 1 000 population. That is very similar to the level reported by the Netherlands and Spain, 3.2 and 3.3 per 1 000 population respectively. However, the first group of countries has a considerably higher number of acute care beds. Countries with the highest availability of physicians (Belgium and Switzerland) also report no waiting times, 3.9 and 3.5 per 1 000 population respectively.
57. This evidence suggests that the number of available doctors (and human resources) may play only a partial role in explaining variations in waiting times (analogously to what was found for total and public health expenditure). It also suggests that higher numbers of personnel may be associated with lower waiting times if combined with other inputs (such as the number of acute care beds). Another possibility is that other institutional differences may also play a role. For example, incentives and remuneration systems may encourage higher productivity in countries without waiting times or, on the contrary, induce a high propensity to add patients on the list.
58. Similar patterns may be obtained between mean waiting times and doctors for other surgical procedures, and between median waiting times and doctors. Finally, analogously to the above section, it is important to point out the limitations of the data used. Figures on doctors include all physicians and specialists working either for the public or private sector. They refer to the whole health care sector, while waiting times refer to selected surgical procedures. Moreover the number of doctors may not be the only relevant measure of hospital personnel, as for example the availability of nurses may also play a crucial role.
6 In comparing the numbers of practising physicians and specialists across countries, a cautionary note
should be introduced. Despite the OECD definition referring to “practising” physicians and specialists only, most of the countries include also the physicians and specialists working in industry, administration and research. This is the case for Belgium, France, Germany, Switzerland and US, among the group of countries without waiting times, and Canada, Denmark, Finland, Ireland, Netherlands, New Zealand, Spain, Sweden. For more information see Sources and methods of OECD Health data (2003).
DELSA/ELSA/WD/HEA(2003)7
22
Charts 11-13. Waiting times and practising physicians. Year 2000
USSwitz
erlan
d
Luxe
mbo
urg
Japa
n
Germ
any
Franc
e
Belgium
Austri
a
Sweden
Spain
Nethe
rland
s
Norway
Finlan
d
Englan
d
Denm
ark
Austra
lia
0
50
100
150
200
250
0 1 1 2 2 3 3 4 4 5
Practising physicians, per 1000 population, 2000
Mea
n w
aiti
ng
tim
e (d
ays)
not reported
Cataract surgery
USSwitz
erlan
d
Luxe
mbo
urg
Japa
n
Germ
any
Franc
e
Belgium
Austri
a
Spain
Nethe
rland
sNor
way
Finlan
dEng
land
Denm
ark
Austra
lia
0
50
100
150
200
250
300
0 1 1 2 2 3 3 4 4 5
Practising physicians, per 1000 population, 2000
Mea
n w
aiti
ng
tim
e (d
ays)
not reported
Hip replacement
USSwitz
erlan
d
Luxe
mbo
urg
Japa
n
Germ
any
Franc
e
Belgium
Austri
a
Spain
Nethe
rland
s
Norway
Finlan
d
Englan
d
Denm
ark
Austra
lia
0
20
40
60
80
100
120
140
160
180
0 1 1 2 2 3 3 4 4 5
Practising physicians, per 1000 population, 2000
Mea
n w
aiti
ng
tim
e (d
ays)
not reported
Cholecystectomy
DELSA/ELSA/WD/HEA(2003)7
23
Charts 14-16. Waiting times and practising specialists. Year 2000
USSwitz
erlan
d
Luxe
mbo
urg
Germ
any
Franc
e
Belgium
Austri
a
Sweden
Spain
Norway
Finlan
d
Englan
d
Denm
ark
Austra
lia
0
50
100
150
200
250
0.0 0.5 1.0 1.5 2.0 2.5
Practising specialists, per 1000 population, 2000
Mea
n w
aiti
ng
tim
e (d
ays)
not reported
Cataract surgery
USSwitz
erlan
d
Luxe
mbo
urg
Germ
any
Franc
e
Belgium
Austri
a
Spain
Norway
Finlan
d
Englan
d
Denm
arkAus
tralia
0
50
100
150
200
250
300
0.0 0.5 1.0 1.5 2.0 2.5
Practising specialists, per 1000 population, 2000
Mea
n w
aiti
ng
tim
e (d
ays)
not reported
Hip replacement
US Switzer
land
Luxe
mbo
urg
Germ
any
Franc
e
Belgium
Austri
a
Spain
Norway
Finlan
d
Englan
d
Denm
ark
Austra
lia
0
20
40
60
80
100
120
140
160
180
0.0 0.5 1.0 1.5 2.0 2.5
Practising specialists, per 1000 population, 2000
Mea
n w
aiti
ng
tim
e (d
ays)
not reported
Cholecystectomy
DELSA/ELSA/WD/HEA(2003)7
24
Do countries which do not report waiting times produce more activity (surgical inpatients, discharges)?
59. We may advance the hypothesis that, higher spending and capacity generates more output, which translates into a higher supply and, for a given demand, a lower waiting time for surgery. In this section we investigate the relationship between capacity and activity and in the next section the relationship between activity and waiting times.
60. One straightforward way to measure activity, is to look at the total volume of surgical inpatients, which is presented in Table A4 in Annex 1. This table is broken down by inpatient and day-surgery. Note that information on day-surgery is generally not available for the countries that do not report waiting times. A comparison based on total surgical activity is therefore not possible. The information on inpatient surgery includes only four countries in the group without waiting times and eight in the group with waiting times. Nevertheless, this table suggests that in 1998 inpatient surgical activity (per 1 000 population) was on average 68% higher in the countries without waiting times7. A t-test suggests that the difference in the inpatient activity for the two groups is significantly different from zero.
61. Charts 17-18 show the relationship between surgical inpatients and, respectively, the number of practising specialists and the number of acute care beds. Chart 17 suggests that countries with more specialists are associated with a higher volume of inpatient surgical activity. Austria and Luxembourg have the highest level of productivity in terms of the highest number of surgical inpatients per practising specialist. For Luxembourg, this may be explained by the fee-for-service system to remunerate specialists. In Austria a mixed remuneration system is used for specialists (salary plus extra charges for each patient treated). In addition, at hospital level an activity-based funding based on DRGs is used in Austria, which may well help to explain the higher productivity. Chart 18 shows how the higher productivity of the specialists in Austria and Luxembourg is also made possible thanks to higher beds capacity available in the system (in other words, the number of beds is not a binding constraint).
62. A similar picture may be obtained by using the more aggregate indicator of activity measured by the “total number of discharges” (Charts 19-20). Table A5 in Annex 1 suggests that in 1998 total discharges (per 1 000 population) was on average 29% higher in the countries without waiting times. The countries with highest discharges are Austria, France, Luxembourg and Finland. Chart 20 suggests once more how the availability of a higher number of beds seems to play a crucial role for generating higher levels of activity for Austria, France, Germany and Luxembourg. A t-test suggests that the difference in the mean discharges for the two groups is significantly different from zero.
63. Finally, Table A6 in Annex 1 provides procedure rates for nine surgical procedures in year 2000. For all procedures, countries with no reported waiting times have on average higher levels of activity. For hip and knee replacement countries with no reported waiting times have on average 57% and 84% higher rates. This percentage is respectively 43%, 53% for prostatectomy and hysterectomy, 44% for CABG, 56% for ‘Inguinal and femoral hernia’, 17% for cataract surgery, 72% for cholecystectomy and 91% for varicose veins. A t-test suggests that the difference in the surgical procedure means for the two groups is different from zero at a significance level below 5% for hip replacement, knee replacement, prostatectomy, inguinal and femoral hernia, cholecystectomy and varicose veins. This is not the case for hysterectomy, CABG and cataract surgery.
7 For Ireland, the data refer to procedures, as opposed to patients. More than one procedure may be recorded
for each patient.

DELSA/ELSA/WD/HEA(2003)7
25
Chart 17. Surgical inpatients and specialists. Year 2000
US
Luxembourg
Germany
Austria
SwedenSpain
Norway
New ZealandNetherlands
Finland
Denmark
Canada
Australia
0
20
40
60
80
100
120
140
0.0 0.5 1.0 1.5 2.0 2.5
Practising specialists, per 1000 population
Inp
atie
nt
surg
ery
/100
0 p
op
ula
tio
n
Chart 18. Surgical inpatients and acute care beds. Year 2000
US
Luxembourg
Germany
Austria
SwedenSpain
Norway
Netherlands
Italy
Ireland
Finland
Denmark
Canada
Australia
0
20
40
60
80
100
120
140
0 1 2 3 4 5 6 7 8
Acute care beds, per 1000 population, 2000
Inp
atie
nt
surg
ery
/100
0 p
op
ula
tio
n
Chart 19. Total discharges and specialists. Year 2000
Luxembourg
Germany
France
Belgium
Austria
Sweden
Spain
Norway
New Zealand
Netherlands
Finland
Denmark
Canada
Australia
0
50
100
150
200
250
300
0 1 1 2 2 3
Practising specialists, per 1000 population
Ho
spit
al d
isch
arg
es /1
000
po
pu
lati
on
DELSA/ELSA/WD/HEA(2003)7
26
Chart 20. Total discharges and acute care beds. Year 2000
Luxembourg
Germany
France
Belgium
Austria
Sweden
Spain
Norway
Netherlands
Italy
Ireland
Finland
Denmark
Canada
Australia
0
50
100
150
200
250
300
0 1 2 3 4 5 6 7 8
Acute care beds, per 1000 population
Ho
spit
al d
isch
arg
es /1
000
po
pu
lati
on
Do countries which do not report waiting times have higher productivity?
64. It seems clear from the above evidence, that countries which do not report waiting times are characterised by a higher level of capacity (doctors, beds),and a higher level of spending, which translates into higher production. But are these countries also characterised by higher productivity, driven for example by financial incentives such as fee for service and soft budgets?
65. Table A7 in Annex 1 shows some productivity indicators based on the number of ‘surgical inpatients’. Unfortunately the data are available for only four of the eight countries with no reported waiting times for years 1998 and 1999. This table suggests that the number of surgical inpatients per acute care bed look similar across the two groups of countries, as confirmed by a t-test. However, the number of surgical inpatients per practising specialist and practising physician are respectively 64% and 88% higher on average in the countries with no reported waiting times. The countries with the highest productivity are Austria, Luxembourg followed by the U.S. However, a t-test suggests that the difference in the productivity means for the two groups is not significantly different from zero for the first measure (inpatients per specialist) and it is different at a significance level below 5% for the second measure (inpatients per physician). One limitation of this comparison is that it does not consider day-surgery activity, as data are not available for the countries with no reported waiting times.
66. An alternative measure of output is provided by the number of ‘total discharges’. Table A8 in Annex 1 shows that the number of discharges per acute care bed is lower in countries with no reported waiting times. This is also the case for the number of discharges per practising specialist in 1998. The number of discharges per practising physician is higher in countries with no reported waiting times but is not significantly different from the value of the countries with waiting times in 1998 (the year with the most complete database), as confirmed by a t-test. Once more it has to be noted that for this table the numbers of countries with no reported waiting times are available only for five out of the eight. In summary, the evidence on surgical productivity is, at this stage, both limited and mixed.
And does the higher surgical activity lead to lower waiting times?
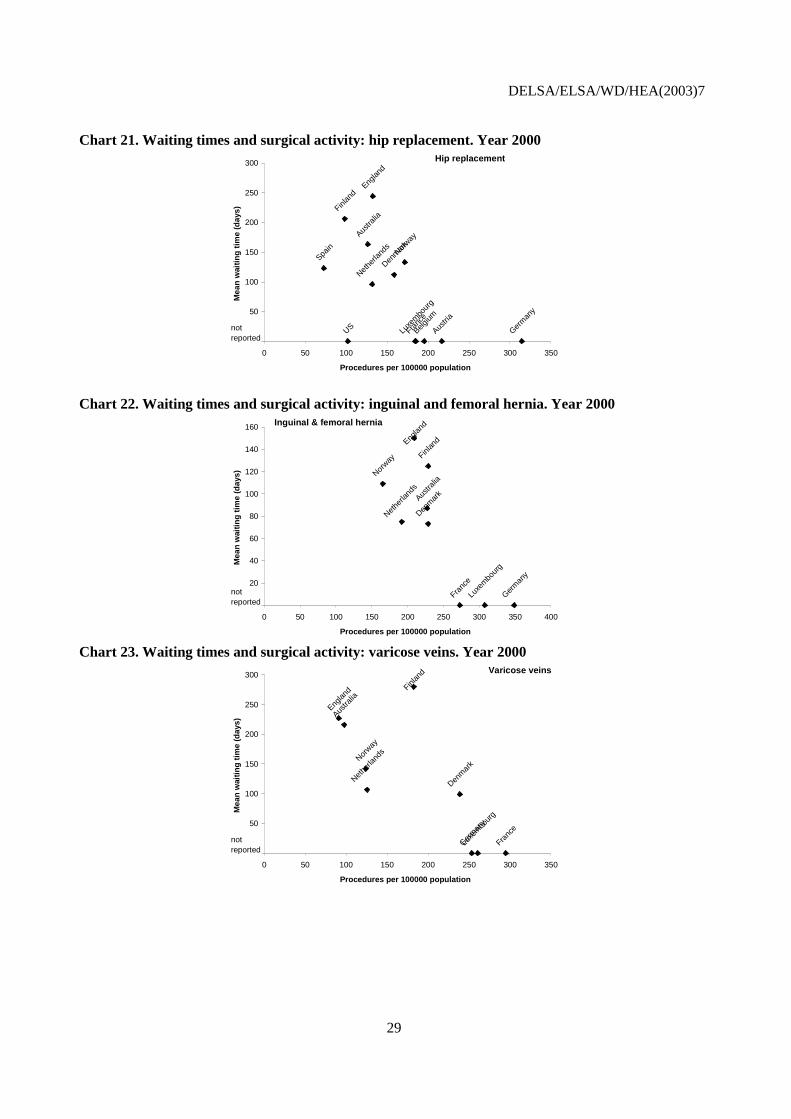
67. Overall, countries with higher capacity do provide a higher volume of activity, especially if accompanied by fee-for-service reimbursement system. In this section we investigate to what extent higher activity is associated with lower waiting times. This is shown in Charts 21-28 that refer to eight surgical
DELSA/ELSA/WD/HEA(2003)7
27
procedures (hip replacement, hysterectomy, prostatectomy, inguinal and femoral hernia, cholecystectomy, varicose veins, cataract surgery and knee replacement).
68. Before proceeding, it is important to point out how the relationship between waiting time and activity at individual surgical procedure is a complex one. The level of activity is determined by supply factors (like beds and doctors) but also by demand factors (such as the level of need). If the higher activity reflects higher supply, then it will be associated with lower waiting times. If higher activity reflects a higher level of demand, then it may be associated also with higher waiting times. If the level of need is constant across countries, the association between activity and waiting times should reflect variations in supply and then be negative. If capacity is constant across countries, then it should reflect variations in demand and it should be positive. In other terms, some countries may have high supply and high waiting times, compared to other countries simply because they have higher need.
69. Moreover, for a given level of activity provided and for a given level of need, countries may have different propensities to add patients on the list. In other words, severity thresholds for adding patients to the list may differ across countries. If so, a country with high severity thresholds may have a lower waiting time compared to a country with low severity thresholds.
70. At the aggregate level, proxies for the level of need might be the percentage of elderly people in the population or mortality rates. With respect to these two variables, countries with no reported waiting times do not differ significantly from countries with waiting times (see below). However, countries may differ in the level of need at surgical procedure level. For example, numbers of people in need of cataract or affected by arthritis may differ across OECD countries. At this stage, there is not enough evidence at international level to measure and control for the level of need (or disease incidence) at surgical procedure level for a significant number of OECD countries.
71. These cautionary notes need to be taken into account when interpreting the relationship between activity and waiting times. Chart 21 refers to hip replacement and shows among the countries with waiting times a weak negative association. On the other hand, countries who do not report waiting times always report higher activity, with the exception of the U.S. (as already mentioned, it is likely that in the U.S. a much larger share of surgical activity is conducted not as inpatient but in day surgery). A very similar picture can be obtained for ‘inguinal and femoral hernia’ and varicose veins (Charts 22-23). From these charts we may then be tempted to conclude that a negative relation exists between activity and waiting times.
72. However, a different picture may be obtained for cholecystectomy, prostatectomy and hysterectomy (Charts 24-26). In these cases, although on average, countries which do not report waiting times have higher activity, several countries without waiting times can be identified that report similar levels of activity to countries with waiting times. Moreover, for this last group an even weaker association is detected between the two variables.
73. Chart 27 shows that for cataract surgery, a positive association between activity and waiting times can be found for countries with waiting times. Chart 28 shows an analogous figure for knee replacement. As already mentioned, these associations may be explained by different levels of need or by different propensities to add patients to the list.
74. Finally, it is worth stressing how difficult it is at this stage to obtain fully comparable figures on surgical procedure rates. A variety of methodological problems may bias our measurements (hospital activity classification system, principal or secondary diagnosis, double counting, measures of treatments as opposed to patients).

DELSA/ELSA/WD/HEA(2003)7
28
DELSA/ELSA/WD/HEA(2003)7
29
Chart 21. Waiting times and surgical activity: hip replacement. Year 2000
US Luxe
mbo
urg
Germ
any
Franc
e
Belgium
Austri
a
Spain Nor
way
Nethe
rland
s
Finlan
dEng
land
Denm
ark
Austra
lia
0
50
100
150
200
250
300
0 50 100 150 200 250 300 350
Procedures per 100000 population
Mea
n w
aiti
ng
tim
e (d
ays)
not reported
Hip replacement
Chart 22. Waiting times and surgical activity: inguinal and femoral hernia. Year 2000
Austra
lia
Denm
ark
Englan
d
Finlan
d
Nethe
rland
s
Norway
Franc
e
Germ
any
Luxe
mbo
urg
0
20
40
60
80
100
120
140
160
0 50 100 150 200 250 300 350 400
Procedures per 100000 population
Mea
n w
aiti
ng
tim
e (d
ays)
not reported
Inguinal & femoral hernia
Chart 23. Waiting times and surgical activity: varicose veins. Year 2000
Luxe
mbo
urg
Germ
any
Franc
e
Norway
Nethe
rland
s
Finlan
d
Englan
d
Denm
ark
Austra
lia
0
50
100
150
200
250
300
0 50 100 150 200 250 300 350
Procedures per 100000 population
Mea
n w
aiti
ng
tim
e (d
ays)
not reported
Varicose veins

DELSA/ELSA/WD/HEA(2003)7
30
Chart 24. Waiting times and surgical activity: cholecystectomy. Year 2000
Luxe
mbo
urg
Germ
any
Franc
e
Norway
Nethe
rland
s
Finlan
d
Englan
d
Denm
ark
Austra
lia
0
20
40
60
80
100
120
140
160
180
0 50 100 150 200 250 300 350
Procedures per 100000 population
Mea
n w
aiti
ng
tim
e (d
ays)
not reported
Cholecystectomy
Chart 25. Waiting times and surgical activity: prostatectomy. Year 2000
US Luxe
mbo
urg
Germ
any
Franc
e
Belgium
Austri
a
Norway
Nethe
rland
sFinl
and
Austra
lia
0
10
20
30
40
50
60
70
80
90
0 50 100 150 200 250 300 350 400
Procedures per 100000 population
Mea
n w
aiti
ng
tim
e (d
ays)
not reported
Prostatectomy
Chart 26. Waiting times and surgical activity: hysterectomy. Year 2000
US Luxe
mbo
urg
Germ
any
Franc
e
Belgium
Austri
a
Spain
Norway
Nethe
rland
sFinl
and
Englan
d
Austra
lia
0
20
40
60
80
100
120
140
160
180
0 50 100 150 200 250 300 350 400 450
Procedures per 100000 population
Mea
n w
aiti
ng
tim
e (d
ays)
not reported
Hysterectomy

DELSA/ELSA/WD/HEA(2003)7
31
Chart 27. Waiting times and surgical activity: cataract surgery. Year 2000
Luxe
mbo
urg
Germ
any
Franc
e
Sweden
Norway
Nether
lands
Finlan
d
Englan
d
Denm
ark
Austra
lia
0
50
100
150
200
250
0 100 200 300 400 500 600 700 800
Procedures per 100000 population
Mea
n w
aiti
ng
tim
e (d
ays)
not reported
Cataract surgery
Chart 28. Waiting times and surgical activity: knee replacement. Year 2000
USLuxe
mbo
urg
Germ
any
Franc
e
Austri
a
SpainNorway
Nethe
rland
s
Finlan
d
Englan
d
Denm
ark
Austra
lia
0
50
100
150
200
250
300
0 20 40 60 80 100 120 140 160
Procedures per 100000 population
Mea
n w
aiti
ng
tim
e (d
ays)
not reported
Knee replacement
Are countries which do not report waiting times characterised by different remuneration systems for doctors and hospitals?
75. As the productivity indicators have at this stage some limitations, it is interesting to investigate also the structural constraints and incentives provided by different remuneration and budgeting systems for specialists and hospitals respectively. These are summarised in Table 7.
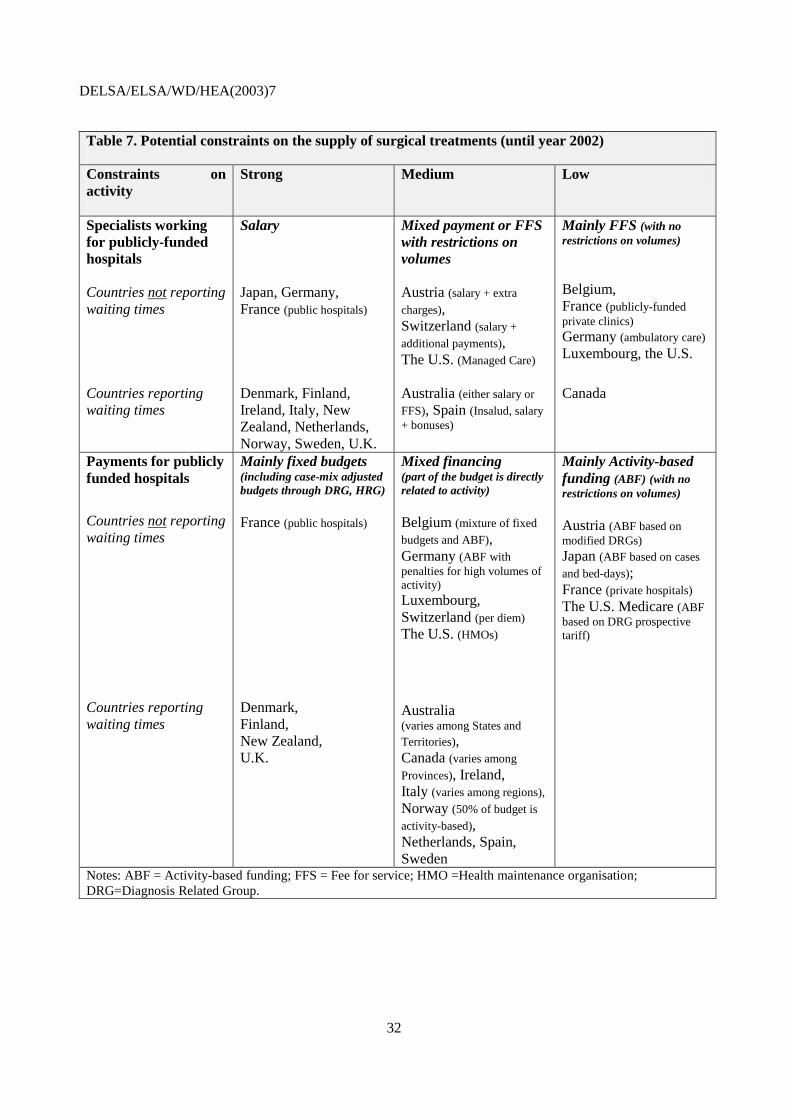
DELSA/ELSA/WD/HEA(2003)7
32
Table 7. Potential constraints on the supply of surgical treatments (until year 2002)
Constraints on activity
Strong Medium Low
Specialists working for publicly-funded hospitals Countries not reporting waiting times Countries reporting waiting times
Salary Japan, Germany, France (public hospitals) Denmark, Finland, Ireland, Italy, New Zealand, Netherlands, Norway, Sweden, U.K.
Mixed payment or FFS with restrictions on volumes Austria (salary + extra
charges), Switzerland (salary +
additional payments), The U.S. (Managed Care) Australia (either salary or
FFS), Spain (Insalud, salary + bonuses)
Mainly FFS (with no restrictions on volumes) Belgium, France (publicly-funded private clinics) Germany (ambulatory care) Luxembourg, the U.S.
Canada
Payments for publicly funded hospitals
Countries not reporting waiting times Countries reporting waiting times
Mainly fixed budgets (including case-mix adjusted budgets through DRG, HRG) France (public hospitals)
Denmark, Finland, New Zealand, U.K.
Mixed financing (part of the budget is directly related to activity) Belgium (mixture of fixed
budgets and ABF), Germany (ABF with penalties for high volumes of activity) Luxembourg, Switzerland (per diem)
The U.S. (HMOs)
Australia (varies among States and Territories), Canada (varies among
Provinces), Ireland, Italy (varies among regions), Norway (50% of budget is
activity-based), Netherlands, Spain, Sweden
Mainly Activity-based funding (ABF) (with no restrictions on volumes) Austria (ABF based on modified DRGs) Japan (ABF based on cases
and bed-days); France (private hospitals) The U.S. Medicare (ABF based on DRG prospective tariff)
Notes: ABF = Activity-based funding; FFS = Fee for service; HMO =Health maintenance organisation; DRG=Diagnosis Related Group.
DELSA/ELSA/WD/HEA(2003)7
33
Specialists 76. It is commonly thought that one of the reasons underlying the presence of waiting times is the lack of incentives for hospitals doctors to deliver higher productivity. If hospital doctors are paid by salary, there may be little incentive for them to increase activity. On the contrary, doctors paid by fee for service may exert a higher effort. In this section we intend to analyse to what extent variations in waiting times across OECD countries may be partially explained by differences in the remuneration system of the doctors.
77. In ten of the twelve countries with waiting times considered in this study, hospital specialists are remunerated according to salary. This is the case in Denmark, Finland, Ireland, Italy, New Zealand, Netherlands, Norway, Sweden and the U.K. Increasingly, bonus systems have been also introduced to encourage increases in productivity, especially in Spain. In Australia, the remuneration system differs across States and Territories and may be either based on salary or on fee for service. In Canada specialists tend to be remunerated by fee for service but ceilings may be placed on the volume of activity.
78. Among the countries without waiting times, different remuneration systems are also used. In three of the eight countries considered, specialists are salaried, as in Japan, Germany (but not in ambulatory care) and in France within public hospitals.
79. At the other extreme, specialists are remunerated purely by fee for service in Belgium, Luxembourg, the U.S. (not necessarily for Medicare) and France within publicly-funded private hospitals (which account for 30% of the beds).
80. Two intermediate situations are represented by Austria and Switzerland, where the salary is combined with the possibility of obtaining additional payments related to the activity performed. More precisely, in Austria, hospital specialists are salaried but receive in addition to their salary a share of the extra charges paid by the patients in special-class accommodation and a share of outpatient-department charges. In Switzerland, most hospital doctors are salaried but can also receive additional payments for services provided to people with supplementary health insurance but have to pay part of this income to the hospitals.
81. Countries not reporting waiting times are more likely to reward specialists according to the activity performed, but this is not always the case.
Hospitals 82. Another claimed reason underlying the presence of waiting times is the lack of incentives towards higher productivity at hospital level. If hospitals are paid according to fixed budgets, there may be little incentives to increase activity. On the contrary, hospitals paid in proportion to the activity performed will be rewarded for the higher volumes provided. In this section we intend to analyse to what extent variations in waiting times across OECD countries may be partially explained by differences in the payment systems for the hospitals.
83. In practice, hospital payment arrangements can be often quite complex to describe and may differ remarkably across OECD countries. Table 7 attempts to identify the main features and classify countries according to three categories (mainly fixed budgets, mixed financing, mainly activity-based funding). In four of the twelve countries with waiting times considered in this study, hospitals are remunerated according to mainly fixed budgets. This is the case for Denmark, Finland, New Zealand and the U.K. Mixed financing is present in several countries either because of differences in regions or because only a share of the budget is based on activity-based funding. For example in Australia, Canada, Italy and Sweden
DELSA/ELSA/WD/HEA(2003)7
34
remuneration systems vary remarkably according to Provinces, Territories, Regions and Counties. In Norway, more than 50% of the funding is at present related to activity through the use of DRGs schedules. In the Netherlands, hospital budgets consist of a fixed component (based on location, infrastructure, buildings, beds and specialists) and a variable component (derived from the production-agreements with the health insurers and includes four factors: nursing days, number of admissions, number of first outpatient visits and volume of day care). In Spain additions to regular budgets were made for hospitals which increased the volume of elective activity. In Ireland public hospitals are remunerated according to fixed budgets for publicly-funded patients, but fee for service for privately-funded ones.
84. Among the countries not reporting waiting times, hospitals budgets have been in general more often related to the activity performed. Countries that have mainly implemented activity-based funding are: Austria, Japan, France (for private hospitals) and the U.S. (for Medicare). The exact financial arrangements may differ across countries. The U.S. and Austria have been using mainly DRG-based prospective tariffs to remunerate activity. In Japan, funding is related to both cases performed and number of bed-days. Countries with mixed financing are Belgium, Germany, Luxembourg and Switzerland. In Belgium and Luxembourg the budget for hospitals is partly fixed and partly based on activity. In Germany, for example, despite the link between revenues and activity, activity-based funding was accompanied by financial penalties when actual volumes were higher than the pre-negotiated ones. In Switzerland a method based mainly on per diem is used (which does not necessarily induce the treatment of a higher number of patients). An interesting case is provided by France, where public purchasers remunerate public hospitals through fixed budgets and private hospitals through a per diem.
85. To summarise, it is more likely for countries which do not report waiting times to be characterised by a lower degree of restriction on the volume of activity performed.
Do countries which do not report waiting times have younger populations?
86. It may be argued that countries which do not report waiting times do not because they have a lower demand for treatments. One driver of need and demand is the share of the population which is elderly. Table A9 in Annex 1 shows that the percentage of the population older than 65 in 2000 was on average equal to 15.6% for the countries with waiting times as opposed to 14.6% in the countries without. A t-test suggests that this difference is not significantly different from zero. The percentage of the population older than 80 years old is 3.6% in both groups of countries. The age structure of the population seems to be similar across the two groups of countries.
87. Charts 29-31 provide the relationship between the waiting time of selected surgical procedures and the percentage of population older than 65 years.
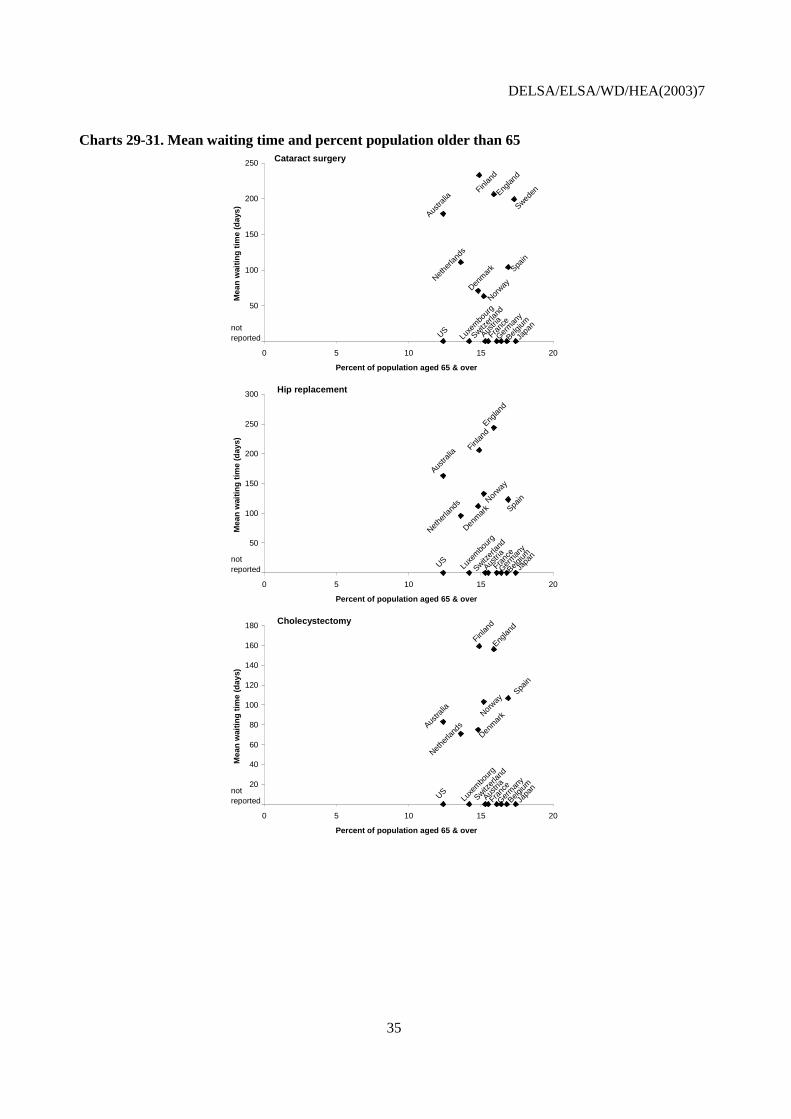
DELSA/ELSA/WD/HEA(2003)7
35
Charts 29-31. Mean waiting time and percent population older than 65
USSwitz
erlan
d
Luxe
mbo
urg
Japa
n
Germ
any
Franc
e
Belgium
Austri
a
Sweden
Spain
Nethe
rland
s
Norway
Finlan
d
Englan
d
Denm
ark
Austra
lia
0
50
100
150
200
250
0 5 10 15 20
Percent of population aged 65 & over
Mea
n w
aiti
ng
tim
e (d
ays)
not reported
Cataract surgery
USSwitz
erlan
d
Luxe
mbo
urg
Japa
n
Germ
any
Franc
e
Belgium
Austri
a
Spain
Nethe
rland
s Norway
Finlan
dEng
land
Denm
ark
Austra
lia
0
50
100
150
200
250
300
0 5 10 15 20
Percent of population aged 65 & over
Mea
n w
aiti
ng
tim
e (d
ays)
not reported
Hip replacement
USSwitz
erlan
d
Luxe
mbo
urg
Japa
n
Germ
any
Franc
e
Belgium
Austri
a
Spain
Nethe
rland
sNorw
ay
Finlan
d
Englan
d
Denm
ark
Austra
lia
0
20
40
60
80
100
120
140
160
180
0 5 10 15 20
Percent of population aged 65 & over
Mea
n w
aiti
ng
tim
e (d
ays)
not reported
Cholecystectomy
DELSA/ELSA/WD/HEA(2003)7
36
Do countries which do not report waiting times have sicker populations?
88. Another aggregate indicator of need is the mortality rate. Table A10 in Annex 1 suggests a lower rate for the countries reported to be without waiting times, but, excluding Japan from the sample, the rates look very similar (in year 1998, there were 659 deaths per 100 000 population for the group without waiting times as opposed to 658). Moreover, mortality rates may not be an appropriate indicator for measuring the need for elective surgery, as for most procedures patients not receiving the treatment are unlikely to die but are likely to have a lower health status and lower quality of life.
Are countries with no reported waiting times characterised by higher levels of co-payment?
89. One factor that influences the demand for treatments is the presence of cost-sharing. In table A11 in Annex 1 we describe the degree of cost-sharing for the two groups of countries for inpatient care.
90. No significant differences can be found among the two groups. For countries with waiting times, inpatient care is usually free of charge or characterised by very low co-payments (Sweden, Ireland for Category II patients). Countries without waiting times have also very low co-payments or no co-payments at all (Germany, Austria).
What is the role of gate-keepers?
91. Table A12 in Annex 1 indicates that in countries with waiting times, general practitioners often act as gatekeepers, while in countries reported to be without waiting times they do not. This striking association does not have an easy explanation.
92. The term ‘gatekeeper’ suggests that general practitioners (GPs) should control the demand for access to specialists, avoiding unnecessary referrals, thereby lowering waiting times.
93. However, it may be that where there is a clear division of labour between generalists and specialists, GPs feel that they have a responsibility to pass on to surgeons any patients they consider could benefit from surgery, as opposed to medical treatment, creating an upward pressure on demand. By contrast, where specialists (surgeons) can be approached directly by patients and have offices outside the hospitals, they may become skilled at handling excess demand by adopting ‘watchful’ waiting without adding patients to formal hospital lists. Moreover, GPs who are salaried or capitated may reduce their workload by referring to specialists all patients, without reducing their income.
94. These arguments will not apply to the same extent to GPs who are paid on a fee-for-service basis or GP fundholders (or, more generally, GPs holding a hospital budget), who have to pay a price for referrals and admissions for their patients, as in the U.K. There is evidence that such GPs reduce admissions among their patients compared with non-fundholding GPs (Gravelle et al., 2002).
3.3 What explains low waiting times in France, Germany and the United States
95. Annex 4 is devoted to three country studies on France, Germany and the United States. The aim is to examine how these three countries have avoided the problem of waiting times. In all three countries all or most of the population is covered by public or private health insurance, there is high capacity in hospitals and day-surgery units and some or all providers are financially highly motivated to meet demand.

DELSA/ELSA/WD/HEA(2003)7
37
4. A MULTIVARIATE REGRESSION ANALYSIS
96. In this section we use regression analysis to try to separate out the partial statistical associations between waiting times and several potential determinants. We test to what extent variations in determinants such as capacity, expenditure, payment methods and need are negatively or positively associated with variations in waiting times across OECD countries, holding other factors constant.
97. The analysis is divided into two parts. Section 4.1 investigates variations in mean and median waiting times for several surgical procedures. The analysis includes only eight OECD countries for which waiting times are reported and for which comparable data are available (Australia, Denmark, the United Kingdom (England), Finland, Norway, Netherlands, Spain (Insalud) and Sweden, see Tables 4 and 5). We test the following hypotheses: i) to what extent a higher availability of capacity (proxied by the number of acute care beds and doctors) and resources (proxied by total and public health expenditure) are negatively associated with waiting times; ii) to what extent a higher level of need (roughly proxied by the percentage of older population) is positively associated with waiting times; iii) to what extent a higher percentage of activity performed in day surgery is negatively associated with waiting times;
98. Section 4.2 has a wider scope and includes a sample of twenty OECD countries, twelve reporting waiting times (Australia, Canada, Denmark, Finland, Ireland, Italy, New Zealand, Norway, Netherlands, Spain, Sweden and the United Kingdom) and eight not reporting them (Austria, Belgium, France, Germany, Japan, Luxembourg, Switzerland and the United States). The object of the analysis is not to investigate variations in waiting times, as they are not easily observable for the second group of countries. It is to investigate the factors associated with the probability of reporting waiting times, measured through a binary/dummy variable (d=1, if the country reports waiting times, d=0 if not). Analogously to Section 4.1, the following hypotheses are tested: i) to what extent a higher availability of capacity (proxied by the number of acute care beds and doctors) and resources (proxied by total and public health expenditure) reduces the probability of reporting waiting times; ii) to what extent a higher level of need (roughly proxied by the percentage of older population) increases the probability of reporting waiting times; iii) to what extent fee-for-service remuneration systems for specialists and activity-based funding for hospitals reduces the probability of reporting waiting times.
99. The approach followed is broadly consistent with the one adopted by Martin and Smith (1999) and Lindsay and Feigenbaum (1984). Other related empirical studies are Goddard and Tavakoli (1998), Blundell and Windmeijer (2000), Propper, Croxson and Shearer (2002) and Gravelle, Dusheiko and Sutton (2002).
4.1 Explaining variations in waiting times among the countries which report waiting times.
Multivariate regression analysis
100. In this section we use multivariate regression analysis to quantify more explicitly the impact of different factors on variations in waiting times (for example the impact of an increase of doctors on reductions in waiting times).
101. This analysis focuses on a limited number of eight countries for which comparable waiting times have been reported (see Section 2).

DELSA/ELSA/WD/HEA(2003)7
38
The model
102. The empirical equation to be estimated is the following.
wijt = const.+ ∑j dj αj +∑t dt αt + x1(it) β1 + x2(ijt) β2 + error term [1] where wijt denotes the mean or median waiting time, the subscript “i” indicates the country (i=1,…,I), “j” the type of surgical procedure (j=1,…,J). dj and dt correspond to the dummies associated to surgical procedure “j” and year “t”. x1(it) is a vector of explanatory variables that vary across time and country but not at the “surgical procedure” level (for example number of acute care beds per 1 000 population, practicing physicians per 1 000 population, percentage of the population older than 65 years old). x2(ijt) is a vector of explanatory and control variables which vary across time, country and type of surgical procedure (for example, the percentage of surgical procedures performed as day-surgery, age and sex of the patients treated). This approach is similar to the one adopted by Lindsay and Feigenbaum (1984) and Propper, Croxson and Shearer (2002).
Data
103. Comparable data on mean waiting times were collected for 11 procedures, 8 countries and several years. The database is unbalanced, as the number of observations differs among countries with respect to both the number of procedures and the number of years available. To allow comparability, surgical procedures have been defined according to the ICD-9-CM international classification system.
104. The eight countries included are Australia, Denmark, Finland, the Netherlands, Norway, Spain (Insalud), Sweden and the United Kingdom (England). The 11 procedures considered are cataract surgery, cholecystectomy, hip replacement, knee replacement, knee arthroscopy, prostatectomy, vaginal hysterectomy, varicose veins, inguinal and femoral hernia, CABG and PTCA. Countries generally reported the data for most or all the procedures. However, for Sweden only data on cataract surgery was available. Data were available in general for 1-6 years (Australia: 2 years; Denmark: 5 years; Finland: 6 years; Norway: 2 years; Netherlands: 2 years; Spain (Insalud): 1 year; Sweden: 5 years) with the exception of the United Kingdom (England) where data were available for 10 years. In this study mean waiting times refer to the period 1996-2001.
105. Several explanatory variables are considered: health expenditure per capita (total and public); the number of practising specialists and physicians; the number of acute care beds; the percentage of elderly people in the population; and the percentage of procedures carried out as day-surgery. As control variables, which measure the characteristics of the patients in the different populations or the different case-mix, we also include the age of the patients and the percentage of the patients who are female (as in Propper, Croxson and Shearer, 2002).
106. Among the different variables, we have also considered the inclusions of two dummy variables, one for countries whose hospitals are partly paid through activity-based funding (as in Norway) and one for countries whose doctors are partly paid on a fee-for-service basis (as in Australia). However, sensitivity analysis suggests that the coefficients associated with the two dummies are not robust and for this reason they were finally dropped from the final model specifications.
107. The analysis has also been replicated using as dependent variable the median waiting time. In this case the number of countries is lower. The sample includes Australia, Denmark, Finland, Norway and the United Kingdom (England).
DELSA/ELSA/WD/HEA(2003)7
39
Results (mean waiting time)
108. The results of the regression analysis are provided in Table 8 and are based on a sample size of 224 observations. The dependent variable is, in this case, the mean waiting time. We consider four different models8.
109. In Model 1 we include among the explanatory variables the acute care beds and physicians, but not health expenditure (to avoid multicollinearity). As expected, countries with more physicians and beds are associated with lower levels of waiting times. The results suggest that, at the sample mean, a marginal increase of 0.1 acute care beds (per 1 000 population) is associated with a marginal reduction of mean waiting times of 5.6 days. A marginal increase of 0.1 practicing physicians (per 1 000 population) is associated with a marginal reduction of mean waiting time of 8.3 days.
110. In Model 2 we include as an explanatory variable the number of specialists as opposed to the number of physicians. In this case a marginal increase of 0.1 acute care beds (per 1 000 population) is associated with a marginal reduction of mean waiting times of only 0.95 day, which is significant at 10% level. A marginal increase of 0.1 practicing specialists (per 1 000 population) is associated with a marginal reduction of mean waiting time of 6.4 days.
111. Both Models 1 and 2 report that countries with a higher percentage of procedures carried out in day-surgery are also associated with lower waiting times. An increase of 1% in the percentage of day-surgery is associated with a reduction in mean waiting times of 0.7 days.
112. Models 3 and 4 include among the explanatory variables respectively the total and public health expenditure, but not the acute care beds and physicians (to avoid multicollinearity). The results suggest that, at the sample mean, an increase in total and public health expenditure per capita of $100 reduces the mean waiting times respectively by 6.6 and 5.6 days. Unlike Models 1 and 2, the coefficient of the percentage of day-surgery is not significant.
113. In all models, the coefficient on the percentage of older population is always positive but significant only for Models 2 and 3, suggesting a weak positive association between waiting times and old populations.
114. The two control variables (age and sex of the patients) emerge as significant in Models 1, 2 and 3. The parameters associated with the year dummies (dummy = 1, if year = 1997, 1998, 1999, 2000, 2001) are positive and are generally increasing over time suggesting an upward trend in waiting times. However, the dummies were significant for years 1998, 1999, 2000 for Models 2 and 3 and for years 1999, 2000 and 2001 for Model 4.
8 A more sophisticated approach, based on panel data techniques was attempted but proved to be
unsuccessful. One reason is that, despite the database being a panel, there is not enough variation over time in the explanatory variables. The number of beds and the number of practicing physicians vary little over time.
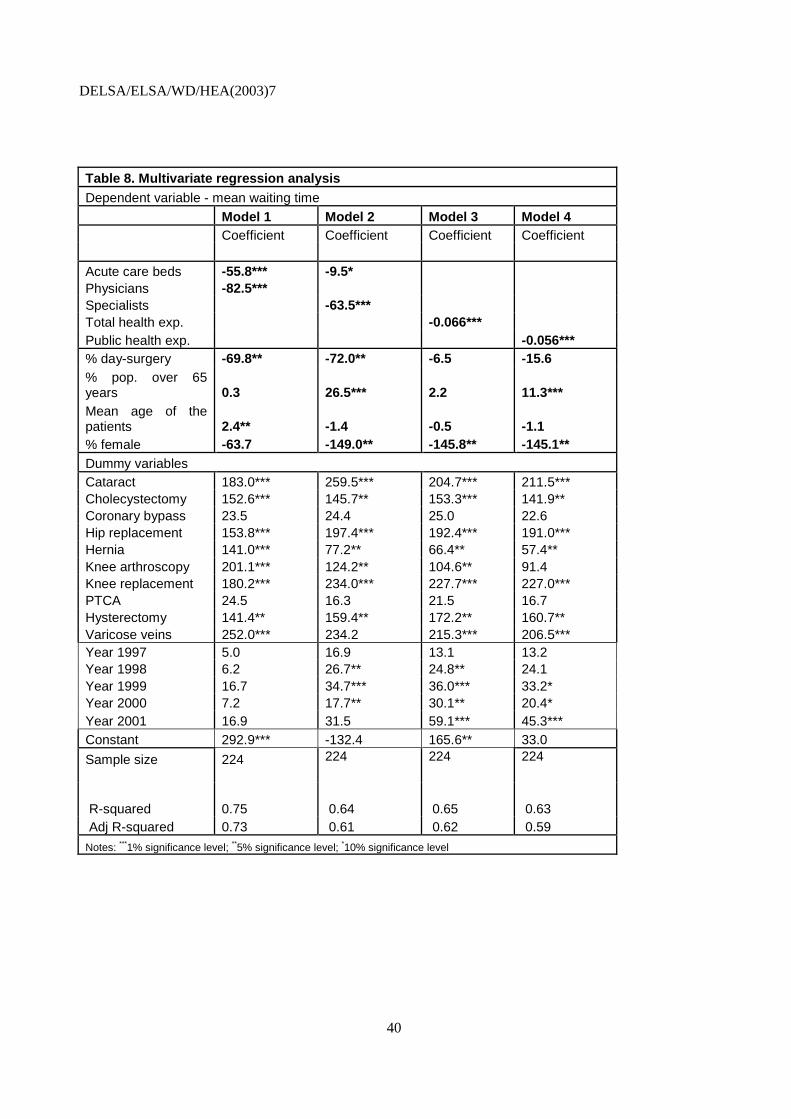
DELSA/ELSA/WD/HEA(2003)7
40
Table 8. Multivariate regression analysis Dependent variable - mean waiting time Model 1 Model 2 Model 3 Model 4 Coefficient Coefficient Coefficient Coefficient Acute care beds -55.8*** -9.5* Physicians -82.5*** Specialists -63.5*** Total health exp. -0.066*** Public health exp. -0.056*** % day-surgery -69.8** -72.0** -6.5 -15.6 % pop. over 65 years 0.3 26.5*** 2.2 11.3*** Mean age of the patients 2.4** -1.4 -0.5 -1.1 % female -63.7 -149.0** -145.8** -145.1** Dummy variables Cataract 183.0*** 259.5*** 204.7*** 211.5*** Cholecystectomy 152.6*** 145.7** 153.3*** 141.9** Coronary bypass 23.5 24.4 25.0 22.6 Hip replacement 153.8*** 197.4*** 192.4*** 191.0*** Hernia 141.0*** 77.2** 66.4** 57.4** Knee arthroscopy 201.1*** 124.2** 104.6** 91.4 Knee replacement 180.2*** 234.0*** 227.7*** 227.0*** PTCA 24.5 16.3 21.5 16.7 Hysterectomy 141.4** 159.4** 172.2** 160.7** Varicose veins 252.0*** 234.2 215.3*** 206.5*** Year 1997 5.0 16.9 13.1 13.2 Year 1998 6.2 26.7** 24.8** 24.1 Year 1999 16.7 34.7*** 36.0*** 33.2* Year 2000 7.2 17.7** 30.1** 20.4* Year 2001 16.9 31.5 59.1*** 45.3*** Constant 292.9*** -132.4 165.6** 33.0
Sample size
224
224 224 224
R-squared 0.75 0.64 0.65 0.63 Adj R-squared 0.73 0.61 0.62 0.59
Notes: ***1% significance level; **5% significance level; *10% significance level

DELSA/ELSA/WD/HEA(2003)7
41
Results (median waiting time)
115. Table 9 replicates the above analysis by using the median waiting time as dependent variable instead of the mean. The sample is in this case smaller (188 observations) and includes Australia, Denmark, Finland, Norway and the United Kingdom (England). We consider four different models. The results are broadly consistent with the previous section.
116. Model 1 suggests that, at the sample mean, a marginal increase of 0.1 acute care beds (per 1 000 population) is associated with a marginal reduction of median waiting times of 4.7 days. A marginal increase of 0.1 practicing physicians (per 1 000 population) is associated with a marginal reduction of median waiting time of 7.6 days. Analogously, Model 2 suggests that a marginal increase of 0.1 practicing specialists (per 1 000 population) is associated with a marginal reduction of median waiting time of 8.9 days. However, unlike all the previous specifications the number of acute care beds does not seem to be significantly associated with waiting times.
117. Models 3 and 4 suggest that, at the sample mean, an increase in total and public health expenditure per capita of 100$ is associated with a reduction in median waiting times of 6.1 days for both specifications.
118. Model 1 reports that countries with a higher percentage of procedures carried out in day-surgery are also associated with lower waiting times. However, the variable is not significant for the remaining three models. In all models, the coefficient on the percentage of older population is always positive and significant. The control variables ‘% female’ emerges as significant only in Models 3 and 4. The parameters associated with the year dummies are positive and are generally increasing over time suggesting an upward trend in waiting times.

DELSA/ELSA/WD/HEA(2003)7
42
Table 9. Multivariate regression analysis Dependent variable - median waiting time
Model 1 Model 2 Model 3 Model 4 Coefficient Coefficient Coefficient Coefficient Acute care beds -46.9*** 6.4 Physicians -75.6*** Specialists -88.5*** Total health exp. -0.061*** Public health exp. -0.061*** % day-surgery -83.0** -34.9 3.21 4.7
% pop. over 65 years 11.4*** 27.3*** 16.35*** 22.3***
Mean age of the patients -1.5 -0.4 0.05 0.1 % female -20.5 -9.5 -117.1* -106.2* Dummy variables Cataract 191.6*** 138.9*** 174.41*** 165.7*** Cholecystectomy 48.7 54.0 135.19** 128.2** Coronary bypass 10.3 15.2 38.60* 36.9* Hip replacement 129.6*** 119.8*** 178.26*** 171.9*** Hernia 62.5** 60.3** 64.54 63.7* Knee arthroscopy 72.5 65.9 96.64** 92.9* Knee replacement 163.4*** 151.4*** 215.66*** 208.5*** PTCA -11.2 -5.5 23.94 21.8 Hysterectomy 32.7 41.9 157.19** 147.6** Varicose veins 131.2*** 119.0*** 180.11*** 173.1*** Year 1997 10.5 19.8** 14.89 13.6 Year 1998 11.5 29.4*** 23.83** 22.0** Year 1999 22.5** 38.5*** 34.66*** 31.4*** Year 2000 14.2 39.7*** 48.32*** 43.2*** Year 2001 22.0** 52.2*** 57.39*** 51.8***
Constant 297.2*** -273.1*** -135.24 -249.8*** Sample size 188 188 188 188 R-squared 0.79 0.78 0.73 0.73 Adj R-squared 0.76 0.75 0.7 0.7
Notes: ***1% significance level; **5% significance level; *10% significance level

DELSA/ELSA/WD/HEA(2003)7
43
4.2 Explaining the probability of observing waiting times across OECD countries.
A Probit analysis.
119. The analysis conducted in Section 3 suggests that countries not reporting waiting times have higher resources and capacity. But is each relationship statistically significant, keeping other factors constant?
120. This section analyses a sample of twenty OECD countries to investigate the factors associated with the probability of reporting waiting times, measured through a binary/dummy variable.
The model
121. Define Y as a dummy variable to indicate that “a country reports significant waiting times”. Then Y = 1 for the countries involved in the Waiting times project. Y = 0 for the countries where waiting times are not reported. Note that the “0” value does not imply that the country has zero waiting times, but simply that it does not report any. The waiting time may be positive but low.
122. We estimate the following Probit model:
Prob(Yit =1) = Ф (β’xit) + εit i=1,…,n t=1,…,T [2] where Ф(.) is the standard normal distribution (Greene, 1997; Maddala, 1989). xit is a vector of independent variables which may explain the probability of observing waiting times. β reflects the impact of changes in x on the probability of observing waiting times. “i“ indicates the country, while “t” the year.
Data
123. The database includes 197 observations. The data refer to 20 countries over the period 1992-2000. The sample includes 12 countries with waiting times (for which Y=1; Australia, Canada, Denmark, Finland, Ireland, Italy, Netherlands, New Zealand, Norway, Spain, Sweden and the United Kingdom) and 8 countries which do not report waiting times (for which Y=0; Austria, Belgium, France, Japan, Germany, Luxembourg, Switzerland and the U.S.).
124. Among the variables which may potentially explain the probability of observing waiting times, we include health expenditure per capita (total and public), the number of practising specialists and physicians, and the number of acute care beds. We include the percentage of the population older than 65 years, as a more aged population may increase demand for surgery, and a time trend in an attempt to control for technological change.
125. We also specify a categorical variable related to the remuneration system of hospitals and specialists. For hospitals, a value equal to “0” is assigned to countries with strong constraints on hospital activity (mainly fixed budgets); a value equal to “1” for countries with medium constraints; and a value equal to “2” for countries with low constraints (mainly activity-based funding) (see Table 7 for more details)9. In this way a negative coefficient from the analysis would suggest that countries with lower constraints on the activity have a lower probability of reporting waiting times.
9 A value equal to “1” has been assigned to France as, among publicly funded hospitals, public hospitals are
remunerated mainly through fixed budgets while private hospitals are paid fee-for-service.
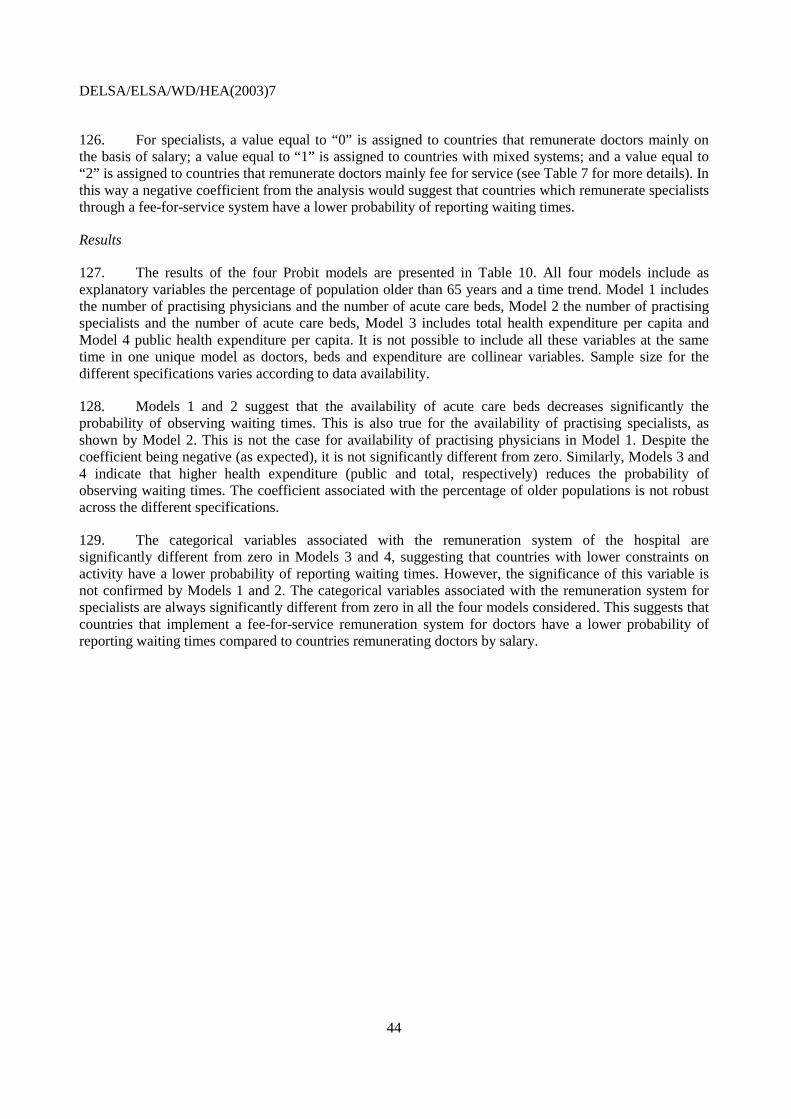
DELSA/ELSA/WD/HEA(2003)7
44
126. For specialists, a value equal to “0” is assigned to countries that remunerate doctors mainly on the basis of salary; a value equal to “1” is assigned to countries with mixed systems; and a value equal to “2” is assigned to countries that remunerate doctors mainly fee for service (see Table 7 for more details). In this way a negative coefficient from the analysis would suggest that countries which remunerate specialists through a fee-for-service system have a lower probability of reporting waiting times.
Results
127. The results of the four Probit models are presented in Table 10. All four models include as explanatory variables the percentage of population older than 65 years and a time trend. Model 1 includes the number of practising physicians and the number of acute care beds, Model 2 the number of practising specialists and the number of acute care beds, Model 3 includes total health expenditure per capita and Model 4 public health expenditure per capita. It is not possible to include all these variables at the same time in one unique model as doctors, beds and expenditure are collinear variables. Sample size for the different specifications varies according to data availability.
128. Models 1 and 2 suggest that the availability of acute care beds decreases significantly the probability of observing waiting times. This is also true for the availability of practising specialists, as shown by Model 2. This is not the case for availability of practising physicians in Model 1. Despite the coefficient being negative (as expected), it is not significantly different from zero. Similarly, Models 3 and 4 indicate that higher health expenditure (public and total, respectively) reduces the probability of observing waiting times. The coefficient associated with the percentage of older populations is not robust across the different specifications.
129. The categorical variables associated with the remuneration system of the hospital are significantly different from zero in Models 3 and 4, suggesting that countries with lower constraints on activity have a lower probability of reporting waiting times. However, the significance of this variable is not confirmed by Models 1 and 2. The categorical variables associated with the remuneration system for specialists are always significantly different from zero in all the four models considered. This suggests that countries that implement a fee-for-service remuneration system for doctors have a lower probability of reporting waiting times compared to countries remunerating doctors by salary.
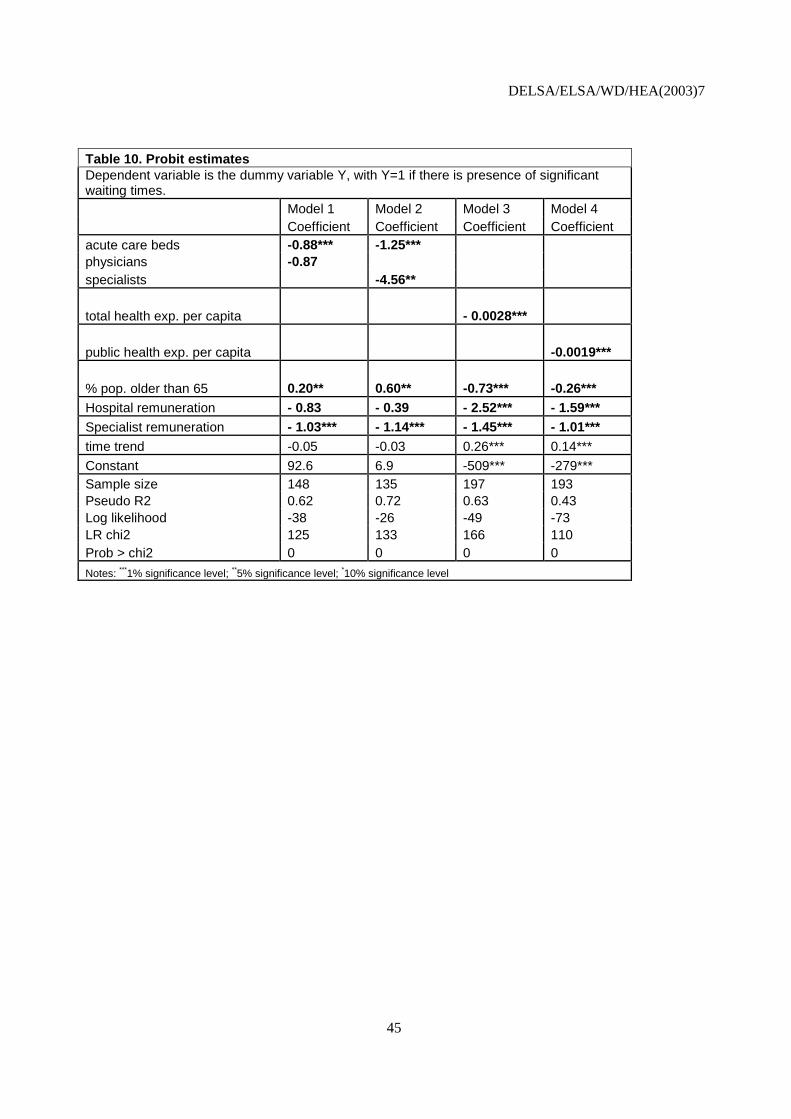
DELSA/ELSA/WD/HEA(2003)7
45
Table 10. Probit estimates Dependent variable is the dummy variable Y, with Y=1 if there is presence of significant waiting times. Model 1 Model 2 Model 3 Model 4 Coefficient Coefficient Coefficient Coefficient acute care beds -0.88*** -1.25*** physicians -0.87 specialists -4.56**
total health exp. per capita - 0.0028***
public health exp. per capita -0.0019***
% pop. older than 65 0.20** 0.60** -0.73*** -0.26*** Hospital remuneration - 0.83 - 0.39 - 2.52*** - 1.59*** Specialist remuneration - 1.03*** - 1.14*** - 1.45*** - 1.01*** time trend -0.05 -0.03 0.26*** 0.14***
Constant 92.6 6.9 -509*** -279*** Sample size 148 135 197 193 Pseudo R2 0.62 0.72 0.63 0.43 Log likelihood -38 -26 -49 -73 LR chi2 125 133 166 110 Prob > chi2 0 0 0 0
Notes: ***1% significance level; **5% significance level; *10% significance level

DELSA/ELSA/WD/HEA(2003)7
46
5. CONCLUSIONS
130. This study has added to the limited evidence on the causes of variations in waiting times across OECD countries for publicly-funded elective surgical procedures. It is based on a questionnaire submitted to twelve countries which provided data on waiting times from administrative databases together with more limited survey data for eight countries for which significant waiting times are not reported. Countries with the highest waiting times were the United Kingdom (England) and Finland, followed by Denmark, Norway, Australia and Spain (Insalud). The country with the shortest waiting times was the Netherlands.
131. These data have been used to investigate associations between waiting times and several potential determinants such as capacity, expenditure, need and financial incentives for hospitals and specialists. The results include evidence of a clear negative association between waiting times and capacity, measured either in terms of number of beds or number of practising physicians. Analogously, a higher level of health spending is systematically associated with lower waiting times. On the other hand, a higher proportion of elderly in the total population is not a major predictor of waiting times across different countries. The evidence also suggests that financial incentives for hospitals and doctors may influence waiting times. Fee-for-service systems induce specialists to increase productivity, a finding in line with other studies, and may also discourage the formation of visible queues because of competitive pressures and the incentive to disguise demand, especially if there are no gatekeepers and surgeons assume primary care responsibilities for patients. Meanwhile, activity-based funding appears to encourage hospitals to increase activity compared with fixed budgets.
132. It is found that among the countries reporting waiting times, it is the availability of doctors, rather than beds that explains most variations in waiting times. The econometric estimates suggest that a marginal increase of 0.1 practising physicians and specialists per 1 000 population is associated respectively with a marginal reduction of mean waiting times of 8.3 and 6.4 days (at the sample mean) and a marginal reduction of median waiting times of 7.6 and 8.9 days. Analogously, an increase in total health expenditure per capita of $100 is associated with a reduction of mean waiting times of 6.6 days and of median waiting times of 6.1 days.
133. In the comparison between countries that do and do not report waiting times, the evidence suggests that it is the higher availability of acute care beds that plays a key role in explaining lower waiting times. This should not be taken as implying that countries which have cut over time the number of acute care beds due to technological development should necessarily restore them. Nevertheless, it is interesting to recall from the first report of the Waiting Times Project, that a couple of countries, Ireland and the United Kingdom (England), which have closed many acute care beds in recent decades, are now opening a limited number of new acute beds in the face of rising demand, as well as expanding day-surgery capacity.
134. In addition, it was found that countries that remunerate specialists through fee-for-service mechanisms have a lower probability of reporting waiting times than countries which remunerate specialists by salary, controlling for other factors. There is also preliminary evidence that activity-based funding for hospitals may also help reducing waiting times. These results are broadly consistent with the existing literature.
135. Although this study has shed some additional light on the causes of international variations in waiting times for publicly-funded elective surgery, many questions remain. In particular, because data on day surgery rates and on resources used specifically for surgery are unavailable for many countries, and because of lack of comparability at an international level, relatively little has been revealed about variations in the productivity of surgery across countries. This would seem to be an important area for future data collection and research, not only to shed further light on the causes of variations in waiting times but also to provide lessons about the most efficient way to provide care in this costly and growing sector of health care.

DELSA/ELSA/WD/HEA(2003)7
47
REFERENCES
Besley, T., et al., 1998, “Private and public health insurance in the U.K.”, European Economic Review, 42, 491-497.
Biorn, E., T. Hagen, T. Iversen and J. Magnussen, 2002, “The effect of activity-based financing on hospital efficiency”, Working paper 8, Health Economics Research Programme, University of Oslo.
Blendon, R.J., et al., 2002, “Inequities in health care: a five-country survey”, Health Affairs, 21,3, 182-191.
Blundell, R. and F. Windmeijer, 2000, “Identifying demand for health resources using waiting times information”, Health Economics, 9, 465-474.
Carroll, R.J., et al., 1995, “International Comparison of Waiting Times for Selected Cardiovascular Procedures”, Journal of the American College of Cardiology, 1, 557-63.
Clemmesen, F. and M. Hansen, 2003, “Erfaringerne med meraktivitetsfinansiering af sygehuse”, Samfundsøkonomen, 3, 11-16.
Cromwell, D.A., et al., 2002, “Surgery dot.com: the quality of information disseminated by web-based waiting time information services”‚ Medical Journal of Australia, 177.
Coyte, P.C., et al., 1994, “Waiting Times for Knee Replacement Surgery in the United States and Ontario”, The New England Journal of Medicine, 20.
Cooper, R.B., 1981, “Basic Queuing Theory”, North Holland, New York.
DeCoster, C., et al., 2000, “Waiting times for surgical procedures”, Medical Care, 37, 6, 187-205.
Docteur, E., H. Suppanz and J. Woo, 2003, “The U.S. Health system: an assessment and prospective directions for reform”, OECD, Economics Department Working papers, n. 350.
Fleming, D.M., et al., 1992, “The European study of referrals from primary to secondary care”, Royal College of General Practitioners, London, Occasional Paper No. 56.
Goddard, J. and M. Tavakoli, 1998, “Referral rates and waiting lists: some empirical evidence”, Health Economics, 7, 545-549.
Gosden, T. et al., 2001, “Impact of payment method on behaviour of primary care physicians: a systematic review”, Journal of Health Services Policy; 6; 44-55.
Gravelle, H., P.C. Smith, and A. Xavier, 2003, “Waiting lists and waiting times: a model of the market for elective surgery”, Oxford Economic Papers, 55, 1, 81-103.
Gravelle, H., M. Dusheiko, M. Sutton, 2002, “The demand for elective surgery in a public system: time and money prices in the U.K. National Health Service”, Journal of Health Economics, 21, 423-429.
Greene, W., 1997, Econometric Analysis, Third Edition, Prentice-Hall International, London.
Hurst, J. and L. Siciliani, 2003, “Tackling excessive waiting times for elective surgery: a comparison of policies in twelve OECD countries”, OECD Health Working Paper, n.6.
Imai, Y., S. Jacobzone and P. Lenain, 2000, “The changing health system in France”, Economics Department Working papers, n. 269.
Iversen, T., 1993, “A theory of hospital waiting lists”, Journal of Health Economics, 12, 55-71.
Iversen, T., 1997, “The effect of a private sector on the waiting time in a National Health Service”, Journal of Health Economics; 16, 381-396.

DELSA/ELSA/WD/HEA(2003)7
48
Iversen, T., and H. Luras, 2002, “Waiting times as a competitive device: an example from general medical practice”, International Journal of Health Care Finance and Economics, 2, 189-204.
Lindsay, C.M. and Feigenbaum, B., 1984, “Rationing by waiting lists”, American Economic Review, 74, 3, 404-417.
Maddala, G.S., 1989, Limited-dependent and qualitative variables in econometrics, Econometric Society Monographs n.3, Cambridge University Press.
Martin, S., and P.C. Smith, 1999, “Rationing by waiting lists: an empirical investigation”, Journal of Public Economics, 71, 141-64.
Martin, S., and P.C. Smith, 1995, “Modelling waiting times for elective surgery”, Occasional Paper, Centre of Health Economics, University of York, n.24.
Mot, E.S., 2002, “Paying the medical specialist: the eternal puzzle: experiments in the Netherlands”, PhD Thesis, Amsterdam.
Morga, A., and A. Xavier, 2001, “Hospital specialists’ private practice and its impact on the number of NHS patients treated and on the delay for elective treatment”, Discussion papers in Economics, The University of York, n.2001/01.
OECD, 2003, OECD Health Data 2003, CD-ROM, Paris.
Propper, C., B. Croxson, A. Shearer, 2002, “Waiting times for hospital admissions: the impact of GP fundholding”, Journal of Health Economics, 21, 227-252.
Ransom, S.B. et al., 1996, “The effect of capitated and fee-for-service remuneration on physician decision making in gynaecology”, Obstetrics and Gynaecology, 5, 707-710.
Sanmartin, C., 2001, “Toward standard definitions of waiting times”, Western Canada Waiting List Project, Final Report.
Siu, A.L. et al., 1988, “Use of the hospital in a randomised trial of prepaid care”, Journal of American Medical Association, 259, 1343-1346.
Wenzel, M., A. Reuscher, H. Aral, 2001, “Zum Stand der Katarakt- und refraktiven Chirurgie Umfrage von DGII und BVA 2000 im internationalen Vergleich”, Ophtalmo-Chirurgie, 13, 137-143.
WHO, 2000, Health care systems in transitions. Belgium, European Observatory on health care systems.
WHO, 2000, Health care systems in transitions. Germany, European Observatory on health care systems.
Wilson, S.E. and W.P. Longmire, 1978, “Does method of surgeon payment affect surgical care?”, Journal of Surgical Research, 24, 457-468.
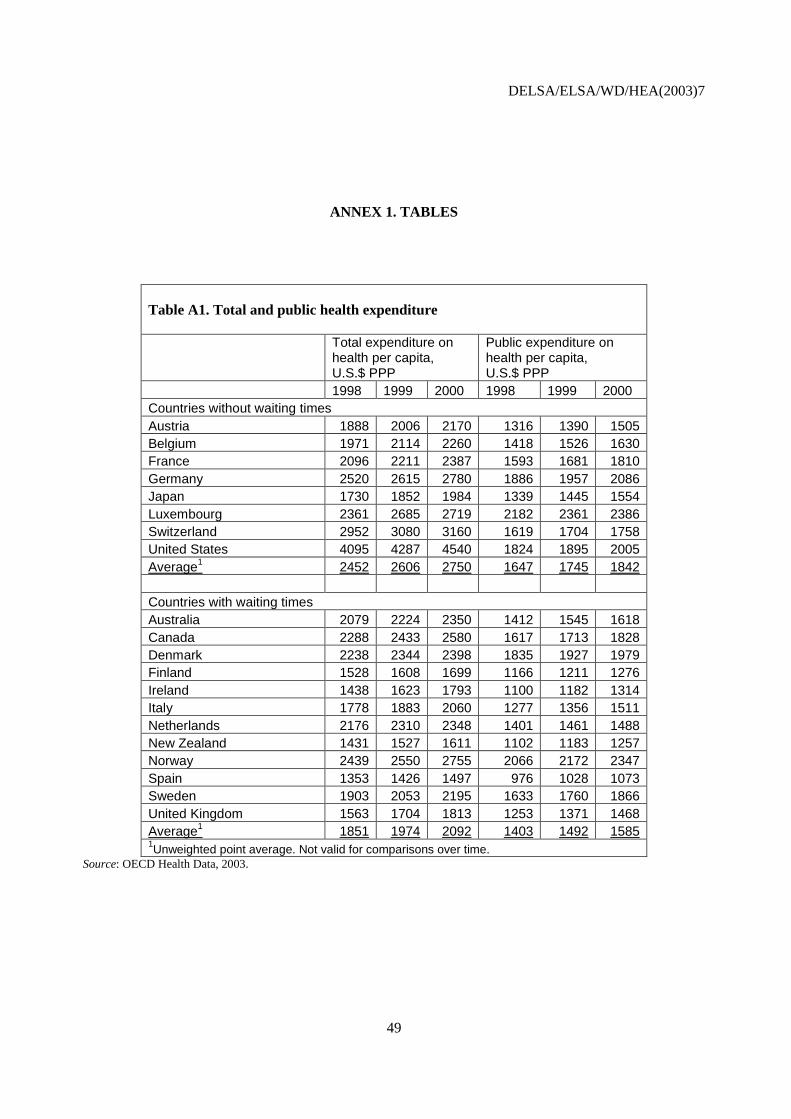
DELSA/ELSA/WD/HEA(2003)7
49
ANNEX 1. TABLES
Table A1. Total and public health expenditure
Total expenditure on health per capita, U.S.$ PPP
Public expenditure on health per capita, U.S.$ PPP
1998 1999 2000 1998 1999 2000 Countries without waiting times Austria 1888 2006 2170 1316 1390 1505 Belgium 1971 2114 2260 1418 1526 1630 France 2096 2211 2387 1593 1681 1810 Germany 2520 2615 2780 1886 1957 2086 Japan 1730 1852 1984 1339 1445 1554 Luxembourg 2361 2685 2719 2182 2361 2386 Switzerland 2952 3080 3160 1619 1704 1758 United States 4095 4287 4540 1824 1895 2005 Average1 2452 2606 2750 1647 1745 1842 Countries with waiting times Australia 2079 2224 2350 1412 1545 1618 Canada 2288 2433 2580 1617 1713 1828 Denmark 2238 2344 2398 1835 1927 1979 Finland 1528 1608 1699 1166 1211 1276 Ireland 1438 1623 1793 1100 1182 1314 Italy 1778 1883 2060 1277 1356 1511 Netherlands 2176 2310 2348 1401 1461 1488 New Zealand 1431 1527 1611 1102 1183 1257 Norway 2439 2550 2755 2066 2172 2347 Spain 1353 1426 1497 976 1028 1073 Sweden 1903 2053 2195 1633 1760 1866 United Kingdom 1563 1704 1813 1253 1371 1468 Average1 1851 1974 2092 1403 1492 1585 1Unweighted point average. Not valid for comparisons over time.
Source: OECD Health Data, 2003.

DELSA/ELSA/WD/HEA(2003)7
50
Table A2. Acute care beds - /1 000 population
1998 1999 2000 Countries without waiting times Austria 6.4 6.3 6.2 Belgium France 7 6.9 6.7 Germany 6.5 6.4 6.4 Japan Luxembourg 7.1 7 6.7 Switzerland 4.4 4.4 4.1 United States 3.1 3 2.9 Average1 5.8 5.7 5.5 Countries with waiting times Australia 3.9 3.8 3.8 Canada 3.5 3.2 3.2 Denmark 3.4 3.3 Finland 2.6 2.5 2.4 Ireland 3.1 3 3 Italy 5 4.5 4.3 Netherlands 3.7 3.6 3.5 New Zealand Norway 3.2 3.2 3.1 Spain 3.2 Sweden 2.6 2.5 2.4 United Kingdom 3.9 3.9 3.9 Average1 3.5 3.4 3.2 1Unweighted point average. Not valid for comparisons over time.
Source: OECD Health Data, 2003.

DELSA/ELSA/WD/HEA(2003)7
51
Table A3. Physicians (Density /1 000 population)
Practicing physicians Practicing specialists Year 1998 1999 2000 1998 1999 2000 Countries without waiting times Austria 3 3 3.1 1.7 1.7 1.8 Belgium 3.7 3.8 3.9 1.7 France 3.3 3.3 3.3 1.7 1.7 1.7 Germany 3.2 3.2 3.3 2.1 2.1 2.2 Japan 1.9 1.9 Luxembourg 2.4 2.5 2.5 1.6 1.7 1.6 Switzerland 3.3 3.4 3.5 1.7 1.8 2.1 United States 2.7 2.7 1.4 1.4 Average1 2.9 3.1 3.1 1.7 1.7 1.9 Countries with waiting times Australia 2.5 2.5 2.4 1.1 1.1 1.2 Canada 2.1 2.1 2.1 1.1 1.1 1.1 Denmark 3.3 3.4 3.4 2.1 2.1 2.2 Finland 3 3.1 3.1 1.4 1.4 1.4 Ireland 2.2 2.3 2.2 Italy Netherlands 2.9 3.1 3.2 New Zealand 2.2 2.2 2.2 0.7 0.7 0.7 Norway 2.7 2.8 2.9 1.9 2 2 Spain 2.9 3.0 3.3 1.8 Sweden 2.8 2.9 3 2.2 United Kingdom 1.9 2 2 1.4 1.5 1.5 Average1 2.6 2.7 2.8 1.4 1.3 1.5 1Unweighted point average. Not valid for comparisons over time.
Source: OECD Health Data, 2003.
DELSA/ELSA/WD/HEA(2003)7
52
Table A4. Surgical inpatients
Total surgical in-patients /1 000 population
Day-surgery /1 000 population
1998 1999 2000 1998 1999 2000 Countries without waiting times Austria 128.4 129.8 130.1 Belgium France Germany 72 77.6 Japan Luxembourg 128.6 129.4 129.2 88.1 87.8 85.9 Switzerland United States 86.2 85.4 82.4 Average1 103.8 97.6 105.8 Countries with waiting times Australia 51 51.2 50 36.7 40.5 38.4 Canada 35.2 34.6 33.9 Denmark 76.9 76.4 75.7 109.7 117.2 133.9 Finland 61.9 60.1 58.9 27.2 29.8 31.2 Ireland2 78.7 90.5 100.5 58.1 63.5 69.6 Italy 108.9 109.1 110.4 27 29.5 34.3 Netherlands 40.2 39.1 37.7 31.6 32.1 32.6 New Zealand 29.4 29.5 30.7 16.5 17.6 18.4 Norway 67 68.2 27.8 28.3 Spain 52.9 10.6 Sweden 50.7 51.5 52.6 United Kingdom Average1 61.8 64.1 65.1 48.4 52.1 66.8 Notes: 1Unweighted point average. Not valid for comparisons over time. 2 Procedures, not patients.
Source: OECD Health Data, 2003.
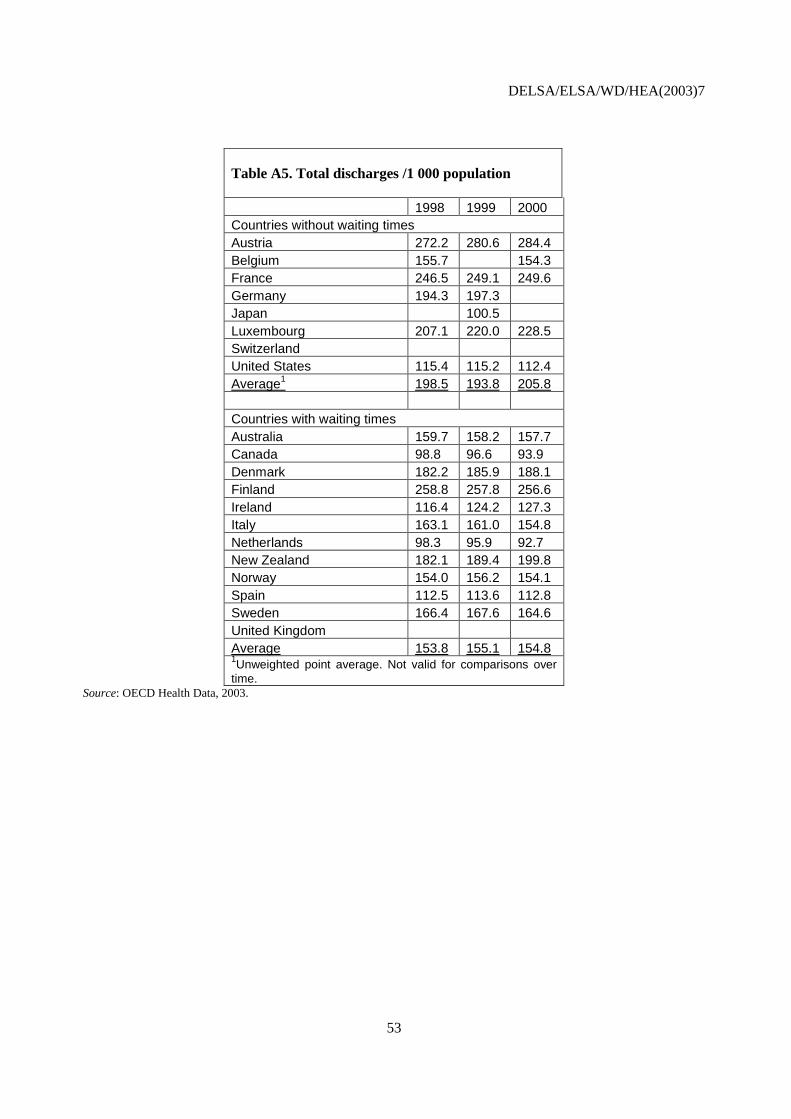
DELSA/ELSA/WD/HEA(2003)7
53
Table A5. Total discharges /1 000 population
1998 1999 2000 Countries without waiting times Austria 272.2 280.6 284.4 Belgium 155.7 154.3 France 246.5 249.1 249.6 Germany 194.3 197.3 Japan 100.5 Luxembourg 207.1 220.0 228.5 Switzerland United States 115.4 115.2 112.4 Average1 198.5 193.8 205.8 Countries with waiting times Australia 159.7 158.2 157.7 Canada 98.8 96.6 93.9 Denmark 182.2 185.9 188.1 Finland 258.8 257.8 256.6 Ireland 116.4 124.2 127.3 Italy 163.1 161.0 154.8 Netherlands 98.3 95.9 92.7 New Zealand 182.1 189.4 199.8 Norway 154.0 156.2 154.1 Spain 112.5 113.6 112.8 Sweden 166.4 167.6 164.6 United Kingdom Average 153.8 155.1 154.8 1Unweighted point average. Not valid for comparisons over time.
Source: OECD Health Data, 2003.

DELSA/ELSA/WD/HEA(2003)7
54
Table A6. Surgical procedures rates (per 100 000 population)
Hip Replace- ment (inpatient)
Knee replace- ment (inpatient)
Prostate-ctomy (inpatient)
Hystere- ctomy (inpatient)
CABG (inpatient)
Inguinal and femoral hernia (total, inpatient and day surgery)
Countries without waiting times Austria 217 120.7 230 95 56.7 Belgium 195.6 336 150 982 France 184.6 80.1 286 120 40.1 273 Germany 314.3 149.2 320 236 122.7 349 Japan Luxembourg 185.1 105.6 222 375 40.7 307.4 Switzerland United States 102.3 115.8 133 143 204.8 Average1 199.8 114.3 254.5 186.5 93.8 309.8
Countries with waiting times Australia 126.3 96.8 246 165 89.4 227.4 Canada 93.1 88.5 167 108 68.6 Denmark 158.6 48.2 195 45 66.2 228.6 Finland 98.2 104.6 175 400 80.3 229.1 Ireland (136) 29.4 120 53 26.8 125.6 Italy 117.6 40.9 197 74 48 300.1 Netherlands 132 49.5 151 87 92.9 191.9 New Zealand 120.9 65.3 119 63 103.3 111.7 Norway 171.4 46.7 215 206 76.1 165.5 Spain 72.8 48.3 45 17 Sweden 166.3 194 174 72.8 United Kingdom 132.5 63.8 42 40.8 209.5 Average1 127.1 62.0 177.9 121.8 65.2 198.8 Notes: 1Unweighted average. 2 year = 1997.
Source: OECD Health Data, 2003.
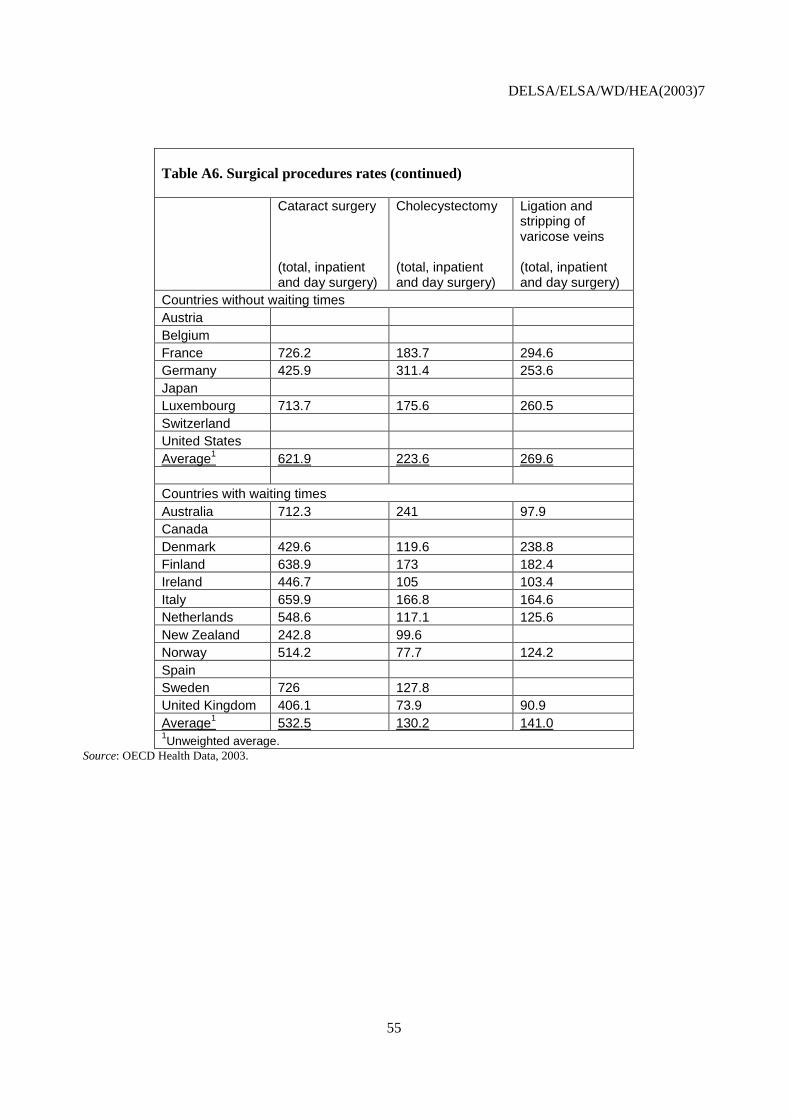
DELSA/ELSA/WD/HEA(2003)7
55
Table A6. Surgical procedures rates (continued)
Cataract surgery (total, inpatient and day surgery)
Cholecystectomy (total, inpatient and day surgery)
Ligation and stripping of varicose veins (total, inpatient and day surgery)
Countries without waiting times Austria Belgium France 726.2 183.7 294.6 Germany 425.9 311.4 253.6 Japan Luxembourg 713.7 175.6 260.5 Switzerland United States Average1 621.9 223.6 269.6
Countries with waiting times Australia 712.3 241 97.9 Canada Denmark 429.6 119.6 238.8 Finland 638.9 173 182.4 Ireland 446.7 105 103.4 Italy 659.9 166.8 164.6 Netherlands 548.6 117.1 125.6 New Zealand 242.8 99.6 Norway 514.2 77.7 124.2 Spain Sweden 726 127.8 United Kingdom 406.1 73.9 90.9 Average1 532.5 130.2 141.0 1Unweighted average.
Source: OECD Health Data, 2003.

DELSA/ELSA/WD/HEA(2003)7
56
Table A7. Productivity indicators based on surgical inpatients
Surgical inpatient per acute care bed
Surgical inpatient per practicing specialist
Surgical inpatient per practicing physician
1998 1999 2000 1998 1999 2000 1998 1999 2000 Countries without waiting times Austria 20.1 20.6 21.0 75.5 76.4 72.3 42.8 43.3 42.0 Belgium France Germany 11.1 12.1 34.3 37.0 22.5 24.3 Japan Luxembourg 18.1 18.5 19.3 80.4 76.1 80.8 53.6 51.8 51.7 Switzerland United States 27.8 28.5 28.4 61.6 61.0 31.9 31.6 Average1 19.3 19.9 22.9 62.9 62.6 76.5 37.7 37.7 46.8 Countries with waiting times Australia 13.1 13.5 13.2 46.4 46.5 41.7 20.4 20.5 20.8 Canada 10.1 10.8 10.6 32.0 31.5 30.8 16.8 16.5 16.1 Denmark 22.6 23.2 36.6 36.4 34.4 23.3 22.5 22.3 Finland 23.8 24.0 24.5 44.2 42.9 42.1 20.6 19.4 19.0 Ireland 25.4 30.2 33.5 35.8 39.3 45.7 Italy 21.8 24.2 25.7 Netherlands 10.9 10.9 10.8 13.9 12.6 11.8 New Zealand 42.0 42.1 43.9 13.4 13.4 14.0 Norway 20.9 22.0 33.5 34.1 23.9 23.5 Spain 16.5 29.4 18.2 Sweden 19.5 20.6 21.9 23.9 18.1 17.8 17.5 United Kingdom Average1 18.2 19.8 20.3 38.4 38.8 35.8 20.0 20.7 21.2 1Unweighted point average. Not valid for comparisons over time.
Source: OECD Health Data, 2003.
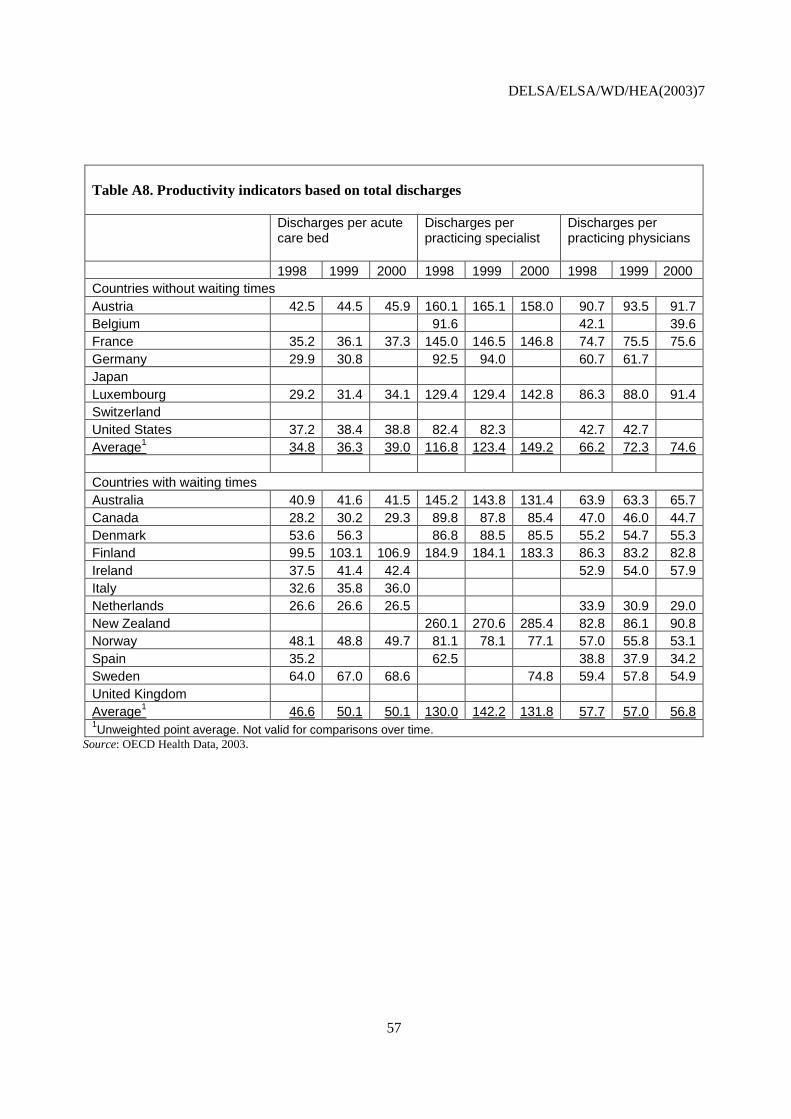
DELSA/ELSA/WD/HEA(2003)7
57
Table A8. Productivity indicators based on total discharges
Discharges per acute care bed
Discharges per practicing specialist
Discharges per practicing physicians
1998 1999 2000 1998 1999 2000 1998 1999 2000 Countries without waiting times Austria 42.5 44.5 45.9 160.1 165.1 158.0 90.7 93.5 91.7 Belgium 91.6 42.1 39.6 France 35.2 36.1 37.3 145.0 146.5 146.8 74.7 75.5 75.6 Germany 29.9 30.8 92.5 94.0 60.7 61.7 Japan Luxembourg 29.2 31.4 34.1 129.4 129.4 142.8 86.3 88.0 91.4 Switzerland United States 37.2 38.4 38.8 82.4 82.3 42.7 42.7 Average1 34.8 36.3 39.0 116.8 123.4 149.2 66.2 72.3 74.6 Countries with waiting times Australia 40.9 41.6 41.5 145.2 143.8 131.4 63.9 63.3 65.7 Canada 28.2 30.2 29.3 89.8 87.8 85.4 47.0 46.0 44.7 Denmark 53.6 56.3 86.8 88.5 85.5 55.2 54.7 55.3 Finland 99.5 103.1 106.9 184.9 184.1 183.3 86.3 83.2 82.8 Ireland 37.5 41.4 42.4 52.9 54.0 57.9 Italy 32.6 35.8 36.0 Netherlands 26.6 26.6 26.5 33.9 30.9 29.0 New Zealand 260.1 270.6 285.4 82.8 86.1 90.8 Norway 48.1 48.8 49.7 81.1 78.1 77.1 57.0 55.8 53.1 Spain 35.2 62.5 38.8 37.9 34.2 Sweden 64.0 67.0 68.6 74.8 59.4 57.8 54.9 United Kingdom Average1 46.6 50.1 50.1 130.0 142.2 131.8 57.7 57.0 56.8 1Unweighted point average. Not valid for comparisons over time.
Source: OECD Health Data, 2003.
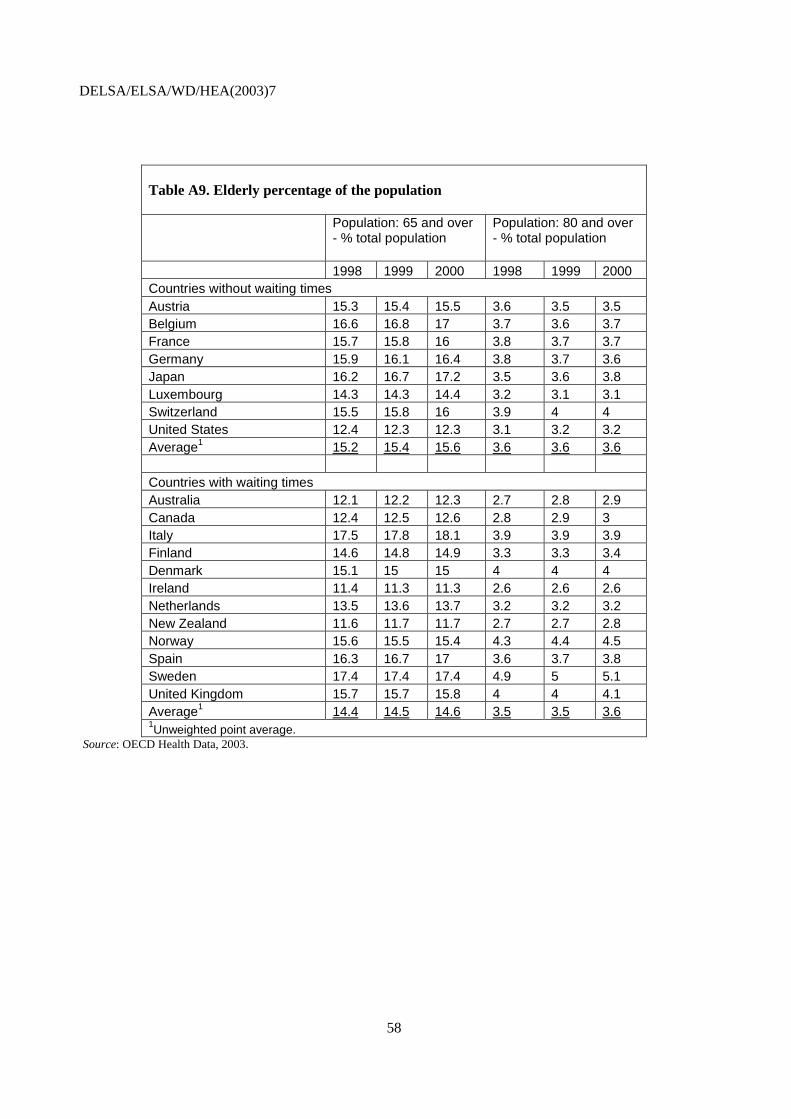
DELSA/ELSA/WD/HEA(2003)7
58
Table A9. Elderly percentage of the population
Population: 65 and over - % total population
Population: 80 and over - % total population
1998 1999 2000 1998 1999 2000 Countries without waiting times Austria 15.3 15.4 15.5 3.6 3.5 3.5 Belgium 16.6 16.8 17 3.7 3.6 3.7 France 15.7 15.8 16 3.8 3.7 3.7 Germany 15.9 16.1 16.4 3.8 3.7 3.6 Japan 16.2 16.7 17.2 3.5 3.6 3.8 Luxembourg 14.3 14.3 14.4 3.2 3.1 3.1 Switzerland 15.5 15.8 16 3.9 4 4 United States 12.4 12.3 12.3 3.1 3.2 3.2 Average1 15.2 15.4 15.6 3.6 3.6 3.6 Countries with waiting times Australia 12.1 12.2 12.3 2.7 2.8 2.9 Canada 12.4 12.5 12.6 2.8 2.9 3 Italy 17.5 17.8 18.1 3.9 3.9 3.9 Finland 14.6 14.8 14.9 3.3 3.3 3.4 Denmark 15.1 15 15 4 4 4 Ireland 11.4 11.3 11.3 2.6 2.6 2.6 Netherlands 13.5 13.6 13.7 3.2 3.2 3.2 New Zealand 11.6 11.7 11.7 2.7 2.7 2.8 Norway 15.6 15.5 15.4 4.3 4.4 4.5 Spain 16.3 16.7 17 3.6 3.7 3.8 Sweden 17.4 17.4 17.4 4.9 5 5.1 United Kingdom 15.7 15.7 15.8 4 4 4.1 Average1 14.4 14.5 14.6 3.5 3.5 3.6 1Unweighted point average.
Source: OECD Health Data, 2003.

DELSA/ELSA/WD/HEA(2003)7
59
Table A10. Deaths (all causes) – per 100 000 population
1998 1999 2000 Countries without waiting times Austria 653.6 643 621 Belgium France 598.5 Germany 672.9 657.8 Japan 496.9 502.6 Luxembourg 671.4 632.8 628.4 Switzerland United States 696.1 Average 632 609 625 Countries with waiting times Australia 580.5 566.4 Canada Italy 604.4 Finland 690.2 679.6 Denmark 743 Ireland 787.6 Netherlands 666 669.5 New Zealand 627.2 Norway 639.3 Spain 617.3 Sweden 589.2 United Kingdom 698.6 695 Average 658 653 1Unweighted point average. Not valid for comparisons over time.
Source: OECD Health Data, 2003.
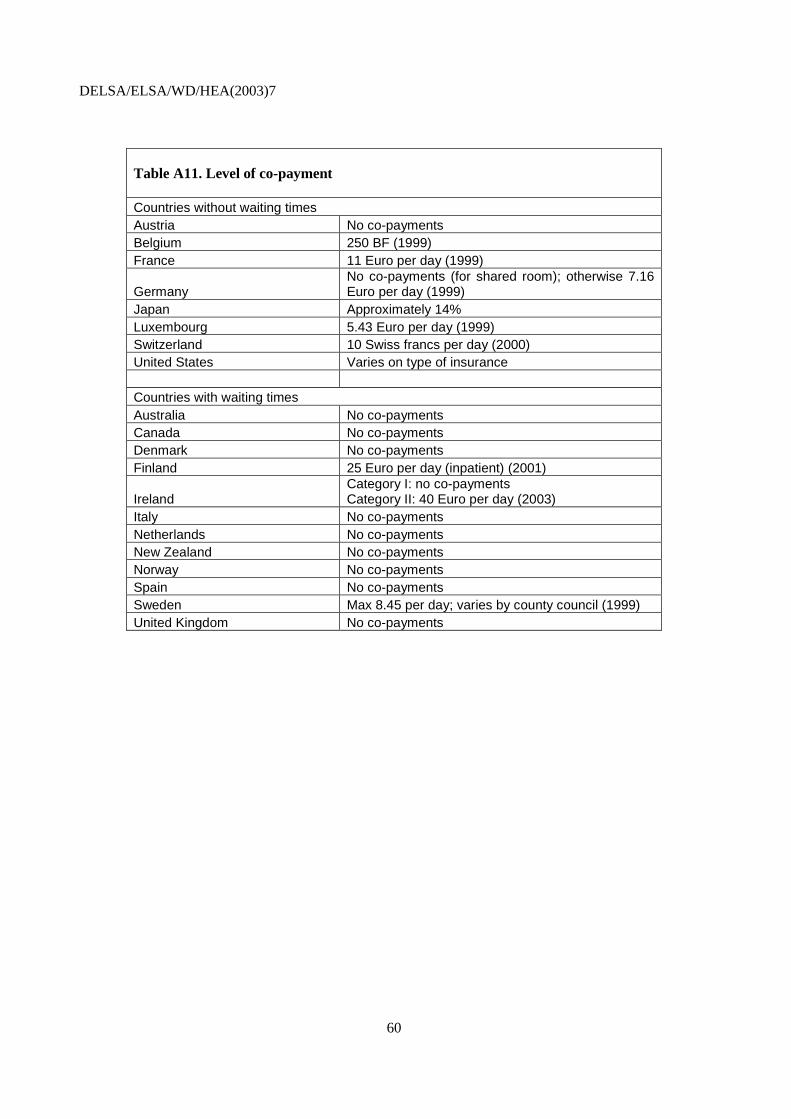
DELSA/ELSA/WD/HEA(2003)7
60
Table A11. Level of co-payment
Countries without waiting times Austria No co-payments Belgium 250 BF (1999) France 11 Euro per day (1999)
Germany No co-payments (for shared room); otherwise 7.16 Euro per day (1999)
Japan Approximately 14% Luxembourg 5.43 Euro per day (1999) Switzerland 10 Swiss francs per day (2000) United States Varies on type of insurance Countries with waiting times Australia No co-payments Canada No co-payments Denmark No co-payments Finland 25 Euro per day (inpatient) (2001)
Ireland Category I: no co-payments Category II: 40 Euro per day (2003)
Italy No co-payments Netherlands No co-payments New Zealand No co-payments Norway No co-payments Spain No co-payments Sweden Max 8.45 per day; varies by county council (1999) United Kingdom No co-payments
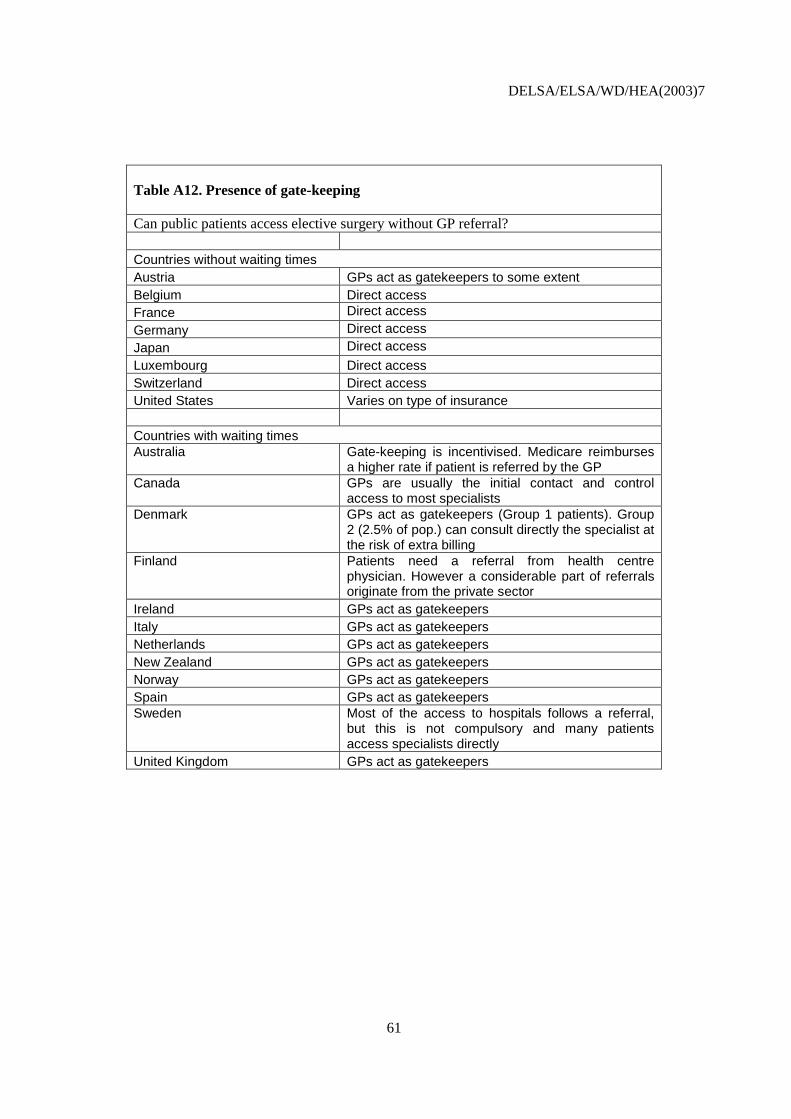
DELSA/ELSA/WD/HEA(2003)7
61
Table A12. Presence of gate-keeping
Can public patients access elective surgery without GP referral? Countries without waiting times Austria GPs act as gatekeepers to some extent Belgium Direct access France Direct access Germany Direct access Japan Direct access Luxembourg Direct access Switzerland Direct access United States Varies on type of insurance Countries with waiting times Australia
Gate-keeping is incentivised. Medicare reimburses a higher rate if patient is referred by the GP
Canada
GPs are usually the initial contact and control access to most specialists
Denmark
GPs act as gatekeepers (Group 1 patients). Group 2 (2.5% of pop.) can consult directly the specialist at the risk of extra billing
Finland
Patients need a referral from health centre physician. However a considerable part of referrals originate from the private sector
Ireland GPs act as gatekeepers Italy GPs act as gatekeepers Netherlands GPs act as gatekeepers New Zealand GPs act as gatekeepers Norway GPs act as gatekeepers Spain GPs act as gatekeepers Sweden
Most of the access to hospitals follows a referral, but this is not compulsory and many patients access specialists directly
United Kingdom GPs act as gatekeepers
DELSA/ELSA/WD/HEA(2003)7
62
ANNEX 2. SOURCES AND METHODS
136. Waiting times data and other variables were collected through a questionnaire submitted to 12 countries involved in the OECD Waiting Time Project. They are based on administrative databases regularly collected by participating countries. The main advantage of using administrative databases in an international context is that the sample used covers a large share or the entirety of the patient population of interest. The main challenge is to identify a common definition which allows comparisons of waiting times across countries.
137. The variables collected successfully included the following:
- the mean and median waiting time of the patients admitted for selected surgical procedures - the age of patients waiting for selected surgical procedures - the percentage of the patients waiting who were female for selected surgical procedures - the percentage of elective treatments carried out in day surgery - the number of surgical procedure rates (per 1 000 population)
138. Other variables, including the number of surgeons, were also included in the questionnaire but there were few responses and such variables were finally excluded from the analysis.
Definitions of waiting times and data availability
139. The data questionnaire requested the “inpatient waiting time for patients admitted for treatment”. The main reason for choosing this measure was that it is the most widely available in OECD countries. Alternative measures are discussed below (see also Hurst and Siciliani, 2003). The waiting time of the patients admitted is defined as “The time elapsed for a patient on the non-emergency (elective) surgery waiting list from the date they were added to the waiting list for the procedure (after specialist assessment) to the date they were admitted to an inpatient or day-case surgical unit for the procedure”. This definition does not include “the time elapsed from the date of referral of the general practitioner to the date of specialist assessment”, also known as the ‘outpatient waiting time’.
140. The “inpatient waiting time of patients admitted for treatment” also includes all surgery performed either with ‘at least an overnight stay’ or as ‘same-day surgery’. This distinction is relevant only for the procedures that can be performed on both bases (for example, cataract surgery). The inpatient waiting times was collected for 11 main surgical procedures classified according to the international classification system ICD-9-CM:
PROCEDURES ICD-9-CM CODES - Cataract surgery 13.1-13.7 - Percutaneous transluminal coronary angioplasty (PTCA) 36.0 - Coronary bypass 36.1 - Cholecystectomy 51.2 (includes laparascopic cholecystectomy) - Inguinal and femorial hernia 53.0-53.3 (includes both unilateral and bilateral)

DELSA/ELSA/WD/HEA(2003)7
63
- Prostatectomy 60.2-60.6 - Vaginal hysterectomy 68.5 - Knee arthroscopy 80.26,80.6 - Total and partial hip replacement 81.51-81.53 - Knee replacement 81.54-81.55 - Ligation and stripping of varicose veins 38.5 141. Finally, the inpatient waiting times should include all “publicly-funded patients” who received the treatment either by publicly or privately (non-profit and for-profit) owned surgical providers.
142. Data availability varies widely across countries. Eight countries were able to provide the mean waiting time according to the proposed definitions for one or more surgical procedures (Australia, Denmark, the United Kingdom (England), Finland, Norway, the Netherlands, Spain (Insalud) and Sweden). The median waiting time was available for six countries (Australia, Canada, Denmark, the United Kingdom (England), Finland and Norway). While most of the countries report both the mean and the median, Canada reports the median, while the Netherlands, Spain and Sweden report only the mean.
143. Countries differed in the number of years for which data were available: Australia (2 years), Denmark (5 years), the United Kingdom (England; 10 years), Finland (6 years), Norway (2 years), Netherlands (2 years), Spain (Insalud; 1 year) and Sweden (5 years, but only for cataract surgery).
144. The mean and median waiting times data for patients admitted are reported in Tables 4 and 5 of the main text.
Country notes
Australia
145. Comparable data are available for years 1999-00 and 2000-01 and include only three jurisdictions (Queensland, South Australia and Western Australia), which count for approximately 36% (1999-00) and 35% (2000-01) of all admissions from waiting lists reported to the National Elective Surgery Waiting Times Data Collection (NESWTDC). The NESWTDC covers public acute hospitals only. Private hospitals are not generally included. Some public patients treated under contract in private hospitals are included. Only publicly-funded patients are included in the data provided. “Inguinal and femoral hernia” includes only inguinal hernia. “Hysterectomy” includes all hysterectomies. Sources: National Elective Surgery Waiting Times Data Collection linked to the National Hospital Morbidity Database.
Canada
146. Manitoba (MN): Joint replacement: the database includes only Winnipeg and captures 60-65% of the total surgical volume performed. Data include partial knee replacement. Saskatchewan (SK): cardiac wait list data reported has the following limitations: 1. patients who have made a personal choice to delay surgery are included; 2. data do not include all “emergent” cases; 3. difficulty in distinguishing isolated, uncomplicated cases; 4. difficulty with ascertaining the date of cardiac catheterization. Hip and knee replacement: the median waiting times represent only non-emergent surgery for total hip or total knee replacement. British Columbia (BC): median waiting times can be obtained from the following website: http://www.healthservices.gov.bc.ca/waitlist .
DELSA/ELSA/WD/HEA(2003)7
64
Denmark
147. The national statistics record the waiting time from the GP referral to the date of admission for the operation. The inpatient waiting time according to the OECD definition was estimated from the national statistics by pairing patients in the stationary register and the ambulatory register through the Personal ID-number and diagnosis. The waiting time is computed as the time between the day of the specialist visit (obtained through the ambulatory register) and the day on which the patient is operated upon (stationary register). The data covers the years 1996-2001, since the ambulatory register only contains data from 1996. Source: Danish National Register of Patients.
England
148. The data covers the years 1990-91 to 2000-01. Source: Hospital Episode Statistics.
Finland
149. The data covers the years 1997-2001. Sources: The National Hospital Discharge Register, Stakes.
The Netherlands
150. The data covers the years 2000 and 2001. Source: Prismant.
Norway
151. The national statistics record the waiting time from the GP referral to the date of admission for the operation. The inpatient waiting time according to the OECD definition was estimated from the national statistics using as the starting date the “date of the first specialist visit”. Data were available for years 2000 and 2001. Source: Norwegian Patient Register.
Spain
152. Data include only INSALUD (Instituto Nacional de la Salud), which provided health services to more than 15 million people. Data are available for year 2001. Source: Waiting List Central Register in INSALUD.
Sweden
153. Comparable data are available only for cataract surgery for the years 1997-2001. Source: The Swedish National Cataract Register.
Alternative definitions of waiting times
154. There are alternative measures to the waiting times of the patients admitted, which include the “waiting time of the patients on the list” and “total waiting” (inpatient plus outpatient waiting).
155. Measures of the inpatient waiting time of the patients on the list were available for Spain (mean), Ireland and Sweden (percentage of patients waiting longer than 12 months; see Table 13). Measures of total waiting (from GP referral to treatment) were available in Denmark and Norway (Table 14).
156. There is no consensus on the best way to measure waiting times. Every measure is likely to have advantages and disadvantages, and to capture different aspects of waiting (for a more detailed discussion

DELSA/ELSA/WD/HEA(2003)7
65
see Hurst and Siciliani, 2003; Annex 2). For example, it may be argued that the waiting time of the patient on the list is desirable as it includes all the patients waiting, both the patients that will receive the treatments and the ones which will not (because of alternative treatment, decision to opt for the private sector or to give up the treatment). However this measure may include also patients with very low need whom doctors add to the list to exert pressure for more resources. These patients may never be included in the waiting time of the patients admitted. The waiting time of the patients admitted has the advantage of providing a measure of the completed waiting (as opposed to the uncompleted waiting of the patients on the list).
157. Depending on their level of need, patients can experience very different waiting times for given procedures. Waiting times statistics have become increasingly available on Internet websites. However, it is important for policy makers to provide explanatory notes pointing out how mean and median waiting times should be interpreted as reference numbers only. They may also want to consider the introduction of some dispersion indicators (for example the standard deviation; Cromwell et al., 2002).
Table A13. Inpatient waiting times of patients on the list by surgical procedure.
Hip replace-ment
Knee Repla- Cement
Cataract surgery
Varicose veins
Hyste-rectomy
Prosta-tectomy
Cholecy-stectomy
Inguinal and femoral hernia CABG PTCA
Spain (Insalud) (mean, days) Year 2000
60
63
48
51
53
43
54
48
21
Ireland (% of the patients waiting longer than 12 months) Year 2000
50%
40%
24%
67%
Sweden (% of the patients waiting longer than 12 months) Year 2002
11%
17%
6%
38%
2%
24%
29%
0%
0%
Table A14. Waiting time from GP referral to treatment. Denmark (year 2000) and Norway (year 2001).
Hip
rep
lace
men
t
Kne
e re
plac
emen
t
Cat
arac
t sur
gery
Var
icos
e ve
ins
Hys
tere
ctom
y
Pro
stat
ecto
my
Cho
lecy
stec
tom
y
Ingu
inal
and
fe
mor
al h
erni
a
CA
BG
PT
CA
Denmark Mean 150 166 195 211 81 88 89 111 Norway Mean 211 267 192 263 112 146 129 151 71 69
Denmark Median 123 137 177 149 56 62 70 84 Norway Median 160 208 145 199 65 92 88 101 38 49

DELSA/ELSA/WD/HEA(2003)7
66
Future work on data collection at international level
158. The OECD Waiting Times project has made a first step in the collection of comparable international data on waiting times for elective surgery. As waiting times differ markedly according to the type of condition (cataract rather than heart disease), data were collected at surgical procedure level.
159. An alternative possibility would be to collect data at speciality level (for example ophthalmology, orthopaedics). However, as speciality denominations differ markedly across countries and no international mapping of different specialities exists, this would be a difficult task. Nevertheless, the collection of this type of data may still be possible for a subset of countries (for example the European Union) as collection of data at speciality level has already started (for example Eurostat (2003) provides number of doctors broken down by speciality).
160. The present analysis focuses on the waiting time of the patients admitted for treatment. Future work might include collecting comparable information on the waiting time of the patients on the list, as the two figures may differ remarkably.
161. Finally, the present analysis has focused on the “inpatient” waiting time (from “specialist visit to treatment”). However, another significant part of ‘total’ waiting is the “outpatient” waiting time (from “GP referral to the specialist visit”). Some preliminary evidence for three countries is presented in Annex 3.
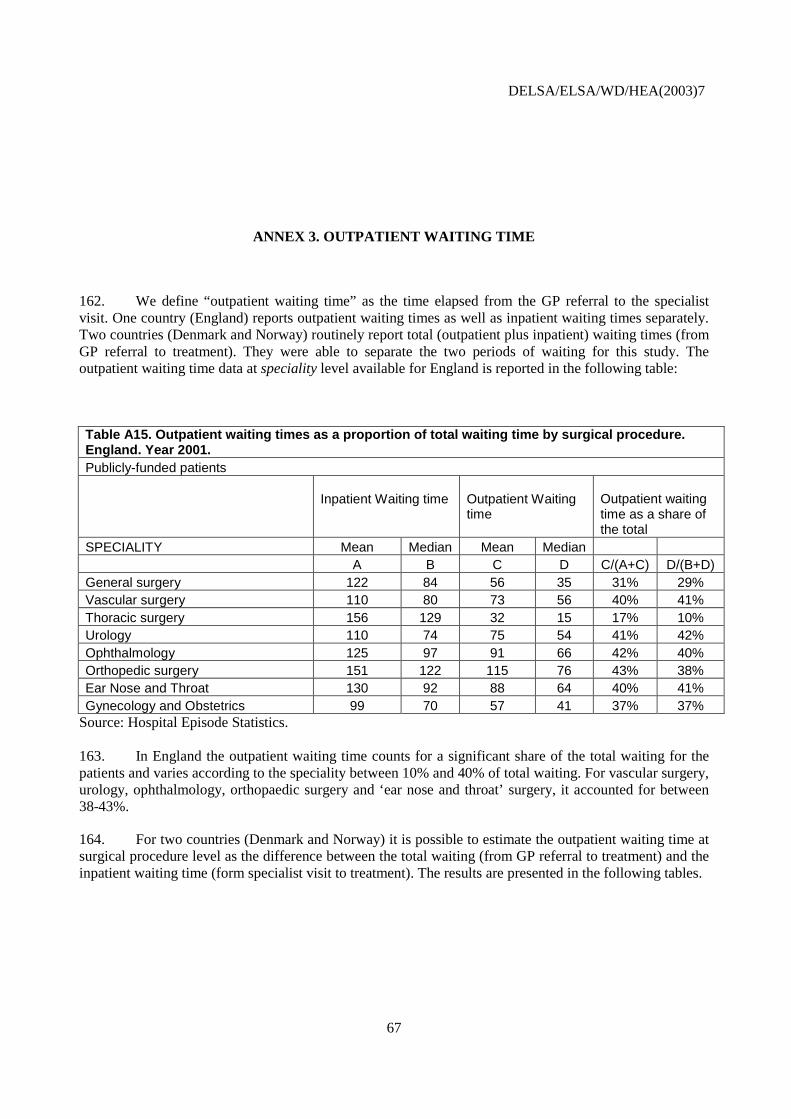
DELSA/ELSA/WD/HEA(2003)7
67
ANNEX 3. OUTPATIENT WAITING TIME
162. We define “outpatient waiting time” as the time elapsed from the GP referral to the specialist visit. One country (England) reports outpatient waiting times as well as inpatient waiting times separately. Two countries (Denmark and Norway) routinely report total (outpatient plus inpatient) waiting times (from GP referral to treatment). They were able to separate the two periods of waiting for this study. The outpatient waiting time data at speciality level available for England is reported in the following table:
Table A15. Outpatient waiting times as a proportion of total waiting time by surgical procedure. England. Year 2001. Publicly-funded patients
Inpatient Waiting time
Outpatient Waiting time
Outpatient waiting time as a share of the total
SPECIALITY Mean Median Mean Median A B C D C/(A+C) D/(B+D) General surgery 122 84 56 35 31% 29% Vascular surgery 110 80 73 56 40% 41% Thoracic surgery 156 129 32 15 17% 10% Urology 110 74 75 54 41% 42% Ophthalmology 125 97 91 66 42% 40% Orthopedic surgery 151 122 115 76 43% 38% Ear Nose and Throat 130 92 88 64 40% 41% Gynecology and Obstetrics 99 70 57 41 37% 37%
Source: Hospital Episode Statistics. 163. In England the outpatient waiting time counts for a significant share of the total waiting for the patients and varies according to the speciality between 10% and 40% of total waiting. For vascular surgery, urology, ophthalmology, orthopaedic surgery and ‘ear nose and throat’ surgery, it accounted for between 38-43%.
164. For two countries (Denmark and Norway) it is possible to estimate the outpatient waiting time at surgical procedure level as the difference between the total waiting (from GP referral to treatment) and the inpatient waiting time (form specialist visit to treatment). The results are presented in the following tables.

DELSA/ELSA/WD/HEA(2003)7
68
Table A16. Outpatient waiting times as a proportion of total waiting time by surgical procedure. Norway. Year 2001.
Total
Total
Inpatient
Inpatient
Outpatient waiting time as a share of the total
Mean Median Mean Median
A B C D (A-C)/A (B-D)/B
Total and partial hip replacement 211 160 126 93 40% 42%
Knee replacement 267 208 152 126 43% 39%
Ligation/stripping of varicose veins 263 199 141 108 46% 46%
Vaginal hysterectomy 112 65 62 36 45% 45%
Prostatectomy 146 92 76 46 48% 50%
Cholecystectomy 129 88 76 54 41% 39%
Coronary bypass 71 38 46 27 35% 29% Table A17. Outpatient waiting times as a proportion of total waiting time by surgical procedure. Denmark. Year 2000.
Total
Total
Inpatient
Inpatient
Estimate of the share of outpatient waiting time
A B C D (A-C)/A (B-D)/B
Mean Median Mean Median
Total and partial hip replacement 150 123 112 87 25% 29%
Knee replacement 166 137 112 90 33% 34%
Ligation/stripping of varicose veins 211 149 99 69 53% 54%
Cholecystectomy 89 70 75 57 15% 19%
Inguinal and femoral hernia 111 84 73 46 34% 45% 165. For Norway the outpatient waiting time counts for a significant share of the total waiting for the patients and varies according to the surgical procedure between 29% and 50% of total waiting. For Denmark it varies between 15% and 54% of the total waiting.

DELSA/ELSA/WD/HEA(2003)7
69
ANNEX 4. WHAT EXPLAINS LOW WAITING TIMES IN FRANCE, GERMANY AND THE UNITED STATES?
France
166. The French health care system is based on a health insurance system composed by a basic compulsory public insurance and a supplementary insurance provided by private insurers and mutuelles. It is also characterised by almost total freedom for people to choose and use private and public health care services without a referral system.
167. Evidence. Imai, Jacobzone and Lenain (2000; p.2) report that “the health system in France is regarded as delivering high quality services, with freedom of choice and generally no waiting lists for treatments”.
168. Institutions. About 70% of beds are in public hospitals, which account for two-thirds of hospital spending. Public hospital employees have the status of civil servants and are salaried. Public hospitals deal with most of the emergency treatments, the bulk of major operations, including the life-threatening conditions. Private clinics are often smaller and handle the bulk of minor surgery, for which their market share can be very high, especially in the area of elective surgery.
169. Public hospitals are funded through global budgets which are set annually by the authorities and allocated every month by the health insurance funds. Modest payments by patients top up these budgets. Until recently, hospital budgets have been determined on the basis of the historic operating costs, with a modest allowance made for their actual level of activity, the average case-mix specific costs of treating certain diseases or expensive drugs. Private clinics are paid on a fee-for-service basis (both for doctors and hospitals). Similarly, ambulatory care is provided primarily by doctors in private practice on a fee-for-service basis. The authorities set official schedules of reimbursement which in a number of cases correspond to the actual prices imposed on service providers. The system of ambulatory care provides easy access to a specialist, in contrast to many other OECD countries, where a patient can consult a specialist only through an out-patient consultation in a hospital, often with long waiting lists (Imai, Jacobzone and Lenain, 2000).
170. Capacity. Table A2 shows how hospital acute care beds availability is among the highest in OECD countries with 6.7 beds (per 1 000 population) in 2000, as opposed to 3.2 beds for the countries with waiting times. Similarly, the number of practising physicians (per 1 000 population) is 3.3, as opposed to 2.8 for countries with waiting times. The number of practising specialists is also higher than in countries with waiting times but the difference is small (1.7 as opposed to 1.5; Table A3). Total and public health expenditure per capita in year 2000 were respectively $2387 and $1810, as opposed to $2092 and $1585 in countries with waiting times (Table A1).
171. Activity. Activity is also correspondingly higher. Table A5 shows how the number of total discharges was equal to 250 (per 1 000 population) as opposed to 155 in countries with waiting times. Table A6 also shows how the number of surgical procedure rates (per 100 000 population) in year 2000 was significantly higher for most of the procedures considered (with the exception of hysterectomy and CABG).
172. Conclusion. The high capacity available in the hospital sector, combined with free access to private hospitals (30% of beds) under public health insurance, together with fee-for-service remuneration of the specialists and activity-related funding in private hospitals, explain the absence of significant waiting
DELSA/ELSA/WD/HEA(2003)7
70
times in the French health care system. Private hospitals provide high volumes of minor elective surgery and act as safety valve if queues build up for public hospitals.
Germany
173. The German health care system is characterised by a mixture of compulsory and voluntary health insurance. In 1997 75% of the population had mandatory health insurance (for people whose income was below a fixed level or unemployed). 13% had voluntary insurance through statutory sickness funds while 10%, in general civil servants, were covered by their employers. Most of the remaining population (mainly high-income earners) had private health insurance. Less than 0.5% of the population were uninsured (WHO, 2000).
174. Evidence. In Germany “Waiting lists and explicit rationing decisions are virtually unknown” (WHO, 2000). A survey for cataract surgery based on self-reported mean waiting times suggested a value equal to 35 days in 2000 (Wenzel, Reuscher, Aral, 2001; survey based on 450 institutions and 926 operating ophthalmologists).
175. Institutions. The health care delivery system is characterised by a clear institutional separation between hospital care (inpatient), and primary and secondary ambulatory care administered through office-based physicians. This separation has been recently lessened by allowing day-surgery in hospitals and a limited amount of ambulatory pre- and post-inpatient care. Germany has no gate-keeping system, and patients are free to select a sickness-fund-affiliated doctor of their choice. Of the 2030 general hospitals, around 790 hospitals are in public ownership, 820 have private non-profit status and 420 are private for-profit hospitals, with bed shares of 55%, 38% and 7% respectively.
176. Hospital budgets are established during negotiations between the sickness funds and the hospitals. The budget specifies targets in terms of activity as well as per diems to be reached by the end of the financial year. Activity above the target is only reimbursed at 25% for the fees and 10–15% for the activity. If actual activity is lower than the target then it receives 40% of the difference (WHO, 2000). Since 1993, hospitals have been allowed to offer surgery on an ambulatory or day-case basis.
177. However, minor surgery has been provided in the ambulatory sector under fee-for-service arrangements in private practice for a long time (especially by ophthalmologists, orthopaedic surgeons and other specialists). In 1991, day surgery accounted for almost 2% of sickness funds expenditure in the ambulatory care sector. All ambulatory care, primary and outpatient secondary care, is provided by office-based physicians (most of them working in solo practice).
178. Capacity. Table A2 shows how hospital acute care beds availability is among the highest in OECD countries with 6.4 beds (per 1 000 population) in 2000, as opposed to 3.2 beds for the countries with waiting times. Similarly, the number of practising physicians (per 1 000 population) is 3.3, as opposed to 2.8 for countries with waiting times. The number of practising specialists is 2.2, as opposed to 1.5. (Table A3). Total and public health expenditure per capita in year 2000 were respectively $2780 and $2086, as opposed to $2092 and $1585 in countries with waiting times (Table A1).
179. Activity. Activity is also correspondingly higher. Table A5 shows how the number of total discharges was equal to 197 (per 1 000 population) in 1999 as opposed to 155 in countries with waiting times. Table A6 also shows how the number of surgical procedure rates (per 100 000 population) in 2000 was significantly higher for most of the procedures considered (with the exception of cataract).
180. Conclusion. Virtually universal health insurance combined with high hospital capacity and extensive ambulatory day surgery (the latter remunerated with a fee-for-service mechanism), are likely explanations for the lack of significant waiting times in the German health care system.
DELSA/ELSA/WD/HEA(2003)7
71
The United States
181. About 86% of the U.S. population is covered by health insurance. About 14% of the population has no insurance coverage, although subsidised programmes facilitate access for the 40 million uninsured (Docteur et al., 2003). Most of the working-age population and their family are covered by employer-provided insurance plans. Medicare, a publicly-funded program, covers the older population and some of the disabled. Medicaid covers the poorest part of the population.
182. Evidence. Survey data suggest that there are very low waiting times for elective surgery in the U.S. Blendon et al. (2002) reported the percentage of respondents to a phone survey in 2001, who had experienced elective surgery in the last two years and who said they had waited longer than four months for elective surgery. It was found that 5% of patients had been waiting for at least 4 months in the United States, as opposed to 23% in Australia, 26% in New Zealand, 27% in Canada and 38% in the United Kingdom. Carroll et al. (1995) found that the percentage of the respondents in need of elective coronary bypass who had been waiting for more than three months was 0% in U.S., 18.2% in Sweden, 46.7% in Canada, and 88.9% in the United Kingdom. Similarly, Coyte et al. (1994) found that surveyed patients in need of knee replacement had a median waiting time of three weeks in the United States and eight weeks in Canada (Ontario).
183. Institutions. Most health care facilities are privately owned. Hospitals are run either on a not-for-profit or a for-profit basis. Under the Medicare programme, payments to hospitals, physicians and other providers are determined by complex prospective payment systems. These systems provide the programme with a high level of control over the price component of total spending, but not much leverage over the volume of services.
184. The number of hospitals has fallen by 14% in the last decade (Docteur et al., 2003). Table A2 shows that the number of acute care beds was only 2.9 (per 1 000 population) as opposed to 5.5 for other countries which do not report waiting times. This may be explained by the spread of managed care in the private sector and by the use (note – Medicare PPS was introduced more than a decade ago) of prospective payment systems by Medicare and some other payers, which furnish incentives to reduce the length of stay and to increase the use of ambulatory care. Physician payment methods vary widely by payer and type of practice from fee for service to capitation.
185. Capacity. Table A2 shows that hospital acute care bed availability is among the lowest in OECD countries with 2.9 beds (per 1 000 population) in 2000, as opposed to 3.2 beds for the countries with waiting times. The number of practising physicians (per 1 000 population) was 2.7 in 1999, the same as for countries with waiting times. The number of practising specialists was 1.4, also very similar to the average country with waiting times (Table A3). On the contrary, total and public health expenditure per capita in 2000 were much higher than in countries with waiting times. Total and public health expenditure were respectively $4540 and $2005, as opposed to $2092 and $1585 in countries with waiting times (Table A1).
186. Activity. Table A5 shows that the number of total discharges was equal to 115 (per 1 000 population) in 1999 as opposed to 155 in countries with waiting times. However, this figure does not include day cases. A 1996 survey suggested that about half of surgical procedures in the U.S. were carried out as day cases. Table A4 suggests that such a share was only reached in waiting times countries in 2000 and that the share may have been considerably lower in 1996. Table A6 also shows that the number of surgical procedure rates (per 100 000 population) in 2000 was significantly higher for knee replacement, hysterectomy and CABG, but not for prostatectomy and hip replacement.
187. Conclusion. The United States spends much more on health care compared to all other OECD countries. Although bed capacity is lower compared with countries without waiting times, day surgery capacity is probably comparable or higher. The majority of providers of surgery is private and is highly incentivised to meet demand by activity-related payments.

DELSA/ELSA/WD/HEA(2003)7
72
OECD HEALTH WORKING PAPERS
Most recent releases are:
No. 6 TACKLING EXCESSIVE WAITING TIMES FOR ELECTIVE SURGERY: A COMPARISON OF POLICIES IN 12 OECD COUNTRIES (2003) Jeremy Hurst and Luigi Siciliani
No. 5 STROKE CARE IN OECD COUNTRIES: A COMPARISON OF TREATMENT, COSTS AND OUTCOMES IN 17 COUNTRIES (2003) Lynelle Moon, Pierre Moïse, Stéphane Jacobzone and the ARD-Stroke Experts Group
No. 4 SURVEY OF PHARMACOECONOMIC ASSESSMENT ACTIVITY IN ELEVEN COUNTRIES (2003) Michael Dickson, Jeremy Hurst and Stéphane Jacobzone
No. 3 OECD STUDY OF CROSS-NATIONAL DIFFERENCES IN THE TREATMENT, COSTS AND OUTCOMES OF ISCHAEMIC HEART DISEASE (2003) Pierre Moise, Stéphane Jacobzone and the ARD-IHD Experts Group
No. 2 INVESTMENT IN POPULATION HEALTH IN FIVE OECD COUNTRIES (2003) Jan Bennet
No. 1 PHARMACEUTICAL U.S.E AND EXPENDITURE FOR CARDIOVASCULAR DISEASE AND STROKE: A STUDY OF 12 OECD COUNTRIES (2003) Michael Dickson and Stéphane Jacobzone
Other series of working papers available from the OECD include:
OECD SOCIAL, EMPLOYMENT AND MIGRATION WORKING PAPERS
Most recent releases are:
No. 14 NATIONAL VERSU.S. REGIONAL FINANCING AND MANAGEMENT OF UNEMPLOYMENT AND RELATED BENEFITS: THE CASE OF CANADA (2003) David Gray
No. 13 THE COMPETITIVE MARKET FOR EMPLOYMENT SERVICES IN THE NETHERLANDS (2003) Ludo Struyven and Geert Steurs
No. 12 TOWARDS SU.S.TAINABLE DEVELOPMENT: THE ROLE OF SOCIAL PROTECTION (2003) Marco Mira d'Ercole and Andrea Salvini
No. 11 INDIVIDUAL CHOICE IN SOCIAL PROTECTION: THE CASE OF SWISS PENSIONS (2003) Monika Queisser and Edward Whitehouse
No. 10 IMPROVING WORKERS’ SKILLS: ANALYTICAL EVIDENCE AND THE ROLE OF THE SOCIAL PARTNERS (2003) Wooseok Ok and Peter Tergeist
No. 9 THE VALUE OF PENSION ENTITLEMENTS: A MODEL OF NINE OECD COUNTRIES (2003) Edward Whitehouse
No. 8 FINANCIAL RESOURCES AND RETIREMENT IN NINE OECD COUNTRIES: THE ROLE OF THE TAX SYSTEM (2003) Edward Whitehouse and Gordon Keenay
No. 7 THE IMPACT OF PARENTAL LEAVE ON MATERNAL RETURN TO WORK AFTER CHILDBIRTH IN THE UNITED STATES (2003) Sandra L. Hofferth and Sally C. Curtin
No. 6 SOCIAL POLICIES, FAMILY TYPES AND CHILD OUTCOMES IN SELECTED OECD COUNTRIES (2003) Sheila B. Kamerman, Michelle Neuman, Jane Waldfogel and Jeanne Brooks-Gunn
No. 5 CHILD LABOUR IN SOUTH ASIA (2003) Eric V. Edmonds
No. 4 CHILD LABOUR IN AFRICA (2003) Sonia Bhalotra
No. 3 LE TRAVAIL DES ENFANTS EN AMÉRIQUE LATINE (2003) Pierre-Emmanuel Couralet
No. 2 THE DETERMINANTS OF CHILD LABOUR: THEORY AND EVIDENCE (2003) Drusilla K. Brown, Alan V. Deardorff and Robert M. Stern
Recent available working papers can be found on the OECD website: www.oecd.org.

DELSA/ELSA/WD/HEA(2003)7
73
RECENT RELATED OECD PUBLICATIONS:
AGEING AND EMPLOYMENT POLICIES – SWEDEN (2003)
AGEING AND EMPLOYMENT POLICIES – BELGIUM (2003) (French version only with Executive summary in English)
A DISEASE-BASED COMPARISON OF HEALTH SYSTEMS What is Best and at What Cost? (2003)
OECD REVIEWS OF HEALTH CARE SYSTEMS – KOREA (2003)
TRANSFORMING DISABILITY INTO ABILITY: Policies to Promote Work and Income Security for Disabled People (2003)
BABIES AND BOSSES:Reconciling Work and Family Life (2003)
OECD HEALTH DATA (2003) available in English, French, Spanish and German on CD-ROM (Windows 95, 98, 2000, NT or Me)
SOCIETY AT A GLANCE: OECD Social Indicators (2002)
TOWARDS ASIA’S SU.S.TAINABLE DEVELOPMENT – The Role of Social Protection (2002)
MEASURING UP: IMPROVING HEALTH SYSTEMS PERFORMANCE IN OECD COUNTRIES (2002)
BENEFITS AND WAGES – OECD Indicators (2002)
KNOWLEDGE AND SKILLS FOR LIFE: First Results from PISA 2000 (2001)
AGEING AND INCOME: Financial Resources and Retirement in 9 OECD Countries (2001)
HEALTH AT A GLANCE (2001)
SOCIETY AT A GLANCE: OECD Social Indicators (2001)
INNOVATIONS IN LABOUR MARKET POLICIES: The Australian Way (2001)
OECD EMPLOYMENT OUTLOOK July 2002 (published annually)
LABOUR MARKET POLICIES AND THE PUBLIC EMPLOYMENT SERVICE (Prague Conference) (2001)
TRENDS IN INTERNATIONAL MIGRATION: SOPEMI 2000 Edition (2001)
REFORMS FOR AN AGEING SOCIETY (2000)
PU.S.HING AHEAD WITH REFORM IN KOREA: Labour Market And Social Safety-Net Policies (2000)
A SYSTEM OF HEALTH ACCOUNTS (2000)
OECD ECONOMIC STUDIES No. 31, 2000/2 (Special issue on “Making Work Pay”) (2000)
OECD SOCIAL EXPENDITURE DATABASE, 1980-1998 (2001) Third edition - Available in English and French on CD-ROM
For a full list, consult the OECD On-Line Bookstore at www.oecd.org, or write for a free written catalogue to the following address:
OECD Publications Service 2, rue André-Pascal, 75775 PARIS CEDEX 16
or to the OECD Distributor in your country