470 Final Report
37
Executive Summary The concept of ‘Super Shops’ has not been too old in the context of Bangladesh. Even in the late 1990’s we hardly have any super shops in our country like we have today. At that time ‘Kaacha Bazaars’ were the only source where people could buy their necessary household items. Nowadays, we have so many ‘super shops’ in our country especially in the Dhaka city which have made life easier, faster and less time consuming. Four of the main super shops that exist now in the city are ‘Nandon’, ‘Meena Bazar’, Agora and ‘Shopno’. These shops have their own blends of offerings to attract segments of consumers. Our research project’s main objective was to find out the underlying reasons which make working moms or housewives prefer one super shop over another. Since women do most of the household shopping of a family, our target sample was housewives, working moms and other women. We emphasized on four main factors that might be responsible for the preference of a super shop over another. Those were, price, proximity from residence, convenience for shopping, value added services and varieties. Apart from these main factors we inquired about some other factors such as Behavior of employees, Parking facility, Membership facility and Returns and compensations. We did not carry out our research for any particular above mentioned shop. But any of these shops can use the result of this research to have a better understanding of consumer behavior and also as to what problems they might have, so that they can work on them and increase the number of their buyers and also increase their satisfaction and loyalty. Our sample size was 100 as determined by our course instructor. We chose our sample units conveniently on the basis of non- probability sampling. We tried to have access to as much of the
-
Upload
khan-iftezar-sayeed -
Category
Documents
-
view
115 -
download
2
Transcript of 470 Final Report

Executive Summary
The concept of ‘Super Shops’ has not been too old in the context of Bangladesh. Even in the late 1990’s we hardly have any super shops in our country like we have today. At that time ‘Kaacha Bazaars’ were the only source where people could buy their necessary household items. Nowadays, we have so many ‘super shops’ in our country especially in the Dhaka city which have made life easier, faster and less time consuming. Four of the main super shops that exist now in the city are ‘Nandon’, ‘Meena Bazar’, Agora and ‘Shopno’. These shops have their own blends of offerings to attract segments of consumers.
Our research project’s main objective was to find out the underlying reasons which make working moms or housewives prefer one super shop over another. Since women do most of the household shopping of a family, our target sample was housewives, working moms and other women. We emphasized on four main factors that might be responsible for the preference of a super shop over another. Those were, price, proximity from residence, convenience for shopping, value added services and varieties. Apart from these main factors we inquired about some other factors such as Behavior of employees, Parking facility, Membership facility and Returns and compensations.
We did not carry out our research for any particular above mentioned shop. But any of these shops can use the result of this research to have a better understanding of consumer behavior and also as to what problems they might have, so that they can work on them and increase the number of their buyers and also increase their satisfaction and loyalty.
Our sample size was 100 as determined by our course instructor. We chose our sample units conveniently on the basis of non-probability sampling. We tried to have access to as much of the actual target sample as possible. In some cases questionnaires were provided to people so that they could complete them at their home.
We used a blend of different types of questions in our research like Simple Attitude Scale, Category Scale, Likert Scale, Paired comparisons and open ended questions.
As a summarized recommendation, we would state that people have a negative perception on Shopno because of its low price and not so clean environment. Agora has a problem regarding its high price which a lot of people complained about. So Shopno has to decide on its value proposition. Although it adopts a low cost strategy, it should focus on what customers want and then customize its offering accordingly.

Background
The concept of super shops in Bangladesh has been a revolutionary one since its inception in the late 1990s. Earlier, when there were no such shops available, Kaacha Bazars were the only means of household shopping for people. Shopping there meant a lot of hassle, bargaining and not to mention the untidy and unhealthy environment. After the super shops were introduced, things became so much easy for the consumers. They could get varieties of things, all under the same roof, at a price that is not too much more than the usual Kacha Bazar price. People’s attitude toward shopping changed drastically and more and people became interested in these shops.
Superstores are set to boom in the country as the current market players are planning to open several hundred more outlets in the next few years to cope with the rising demand from the consumers.With a strong 15-20 per cent annual sales growth, about 30 companies with more than 200 outlets have already made foray into the industry since Rahimafrooz, one of the largest business groups in Bangladesh, introduced Agora, a chain superstore, in the capital a decade ago. The annual turnover of the superstores now stands at around Tk 15.0 billion (1500 crore), according to Bangladesh Supermarket Owners Association (BSOA).
According to the super store employees, hassle-free shopping environment, hygienic commodities, fresh vegetables, meat and fish at the supermarkets are earning appreciation of the customers. The supermarket biggies have attempted the massive expansion drive to attract the shoppers, who still depend on unplanned wet markets to buy their daily essentials.
The first super shop to be established in Dhaka city was ‘Agora’ in the year 2000. Agora is a super shop that offers a wide variety of food and household merchandise. It is larger in size and has a wider selection than a traditional grocery store. Agora comprises meat, produce, dairy and baked goods departments along with shelf space reserved for canned and packaged goods as well as for various nonfood items such as household cleaners, pharmacy products, and pet supplies. Agora is reported to provide quality service to the consumers but the price level is complained to be high. The outlets of Agora are found in the posh areas of the city which suggests its differentiation strategy.
Nandan Megashop and Meena Bazar are other two super shops of the city that focus on differentiation strategy. They try to provide quality products to the consumers and as a result the price charged is a bit high.
Shopno, a relatively new player in the market, focuses on a different strategy. It claims that it offers ‘Everyday Low Price’ policy to consumers and believes that in this way they will be able to attract significant market share within a short span of time. The locations of Shopno’s outlets

symbolize this strategy. They are located in the ‘not so posh’ areas of the city so that they can cover for the low prices offered.
Exploratory Research
For initial study, we went through the exploratory research by doing survey on a group of 100 people. This sample size was determined by our course instructor Mr. Nurul Hasan Khan. We selected mostly adult females as our respondents as they mostly shop for the household. We also studied through the secondary data we collected from the website and booklets provided by the super shops.
Problem Definition
Basically we wanted to find out the underlying factors that cause women (the largest group of household shoppers) to choose one super shop over another. The problems of a particular shop can well be found out by the results of this research as to why the shop is not being chosen.
Research Hypothesis
Actually we had a number of hypotheses which we tried to assess through the survey results.
Hypothesis 1: There is significant association between the income level and the shop being chosen.
Hypothesis 2: Price is not the decisive factor for choosing a super shop.
Hypothesis 3: Convenience of shopping is an important factor for the selection.
Hypothesis 4: Behavior of employees is seen as an important factor for the selection.
Hypothesis 5: Agora is the top choice of consumers considering all the factors.
Hypothesis 6: The low cost strategy of Shopno doesn’t work well for them.
Hypothesis 7: Consumers are not loyal to their now preferred shop and will switch if there is a better offering.
Research Objective
To find out what income level has to do with the selection of a shop. To find out the most important factors for choosing a shop including Price, Proximity,
Convenience and Varieties. To find out supplementary factors that aids in the decision making including Behavior of
employees, Parking facility, Membership facility and Returns and compensations. To find out the shop that attracts the maximum number of consumers.

To find out the loyalty level of consumers.
Research Methodology
We chose our respondents on the basis of non-probability sampling. Mostly the convenience method was used. Since our research was based on the buying behavior of household goods, adult females were our target sample. We went to different super shops for our respondents. Some of them were helpful while others were not. We couldn’t manage to fill all the questionnaires there. So we gave some questionnaires to our friends so that they could be filled in by their moms. The sample size was 100 and it was determined by our course instructor. After the data had been collected, we input them in SPSS software and carried out some analyses based on pre-determined hypotheses.
Operational Definition
We tried to make our sample as diversified as possible. So we selected respondents from different parts of Dhaka city. As our report states, the respondents were chosen from over 17 different areas of the city. Also, since the super shops are situated all over Dhaka city, a diverse sample was necessary for more reliable results.
Research Design
As explained earlier, the design of the research is basically based on exploratory research. Primary research is the main mode of collecting raw data. Collecting raw data from various sources was required to process, tabulate, edit for the purpose of the study. After processing the data, we applied few statistical tools, wherever required we came up with meaningful results. Besides, some graphical presentations such as pie chart, bar chart and so on were used. At last we gave some recommendations.
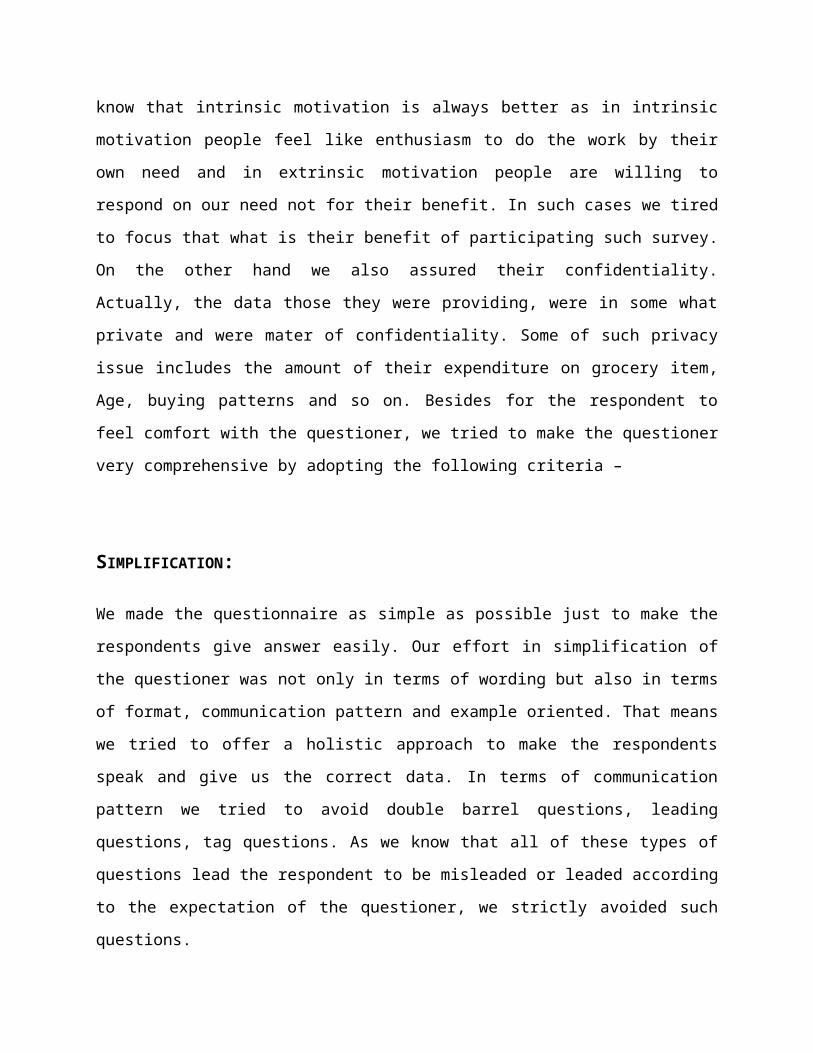
No. Process DescriptionDuration
in days
01 Pre research study and
design process
Questionnaire prepared and tested in the field
level.04
02 Survey For survey approximately 105 questionnaires
conducted. A questionnaire has around 17
12

questions.
03 Data processing Crosschecking and data processing of survey
conducted with key information.02
04 Data analysis and report
writing and Submission
of report
Data processed and analyzed 05
Measurement Scales
We used 17 questions in the questionnaire to have a pretty good idea about consumer’s thoughts regarding choosing a super shop. We used both open ended and closed ended questions. In the closed ended ones we used a blend of different types of questions in our research like Simple Attitude Scale, Category Scale, Likert Scale, Paired comparisons etc. As for the underlying factors for choosing a particular shop we used options of price, proximity from residence, convenience and varieties. As supporting options we had Behavior of employees, parking facility, Membership facility and Returns and compensations. The choices of answers a,b,c,d were assigned with numerical values, as in 1 for a, 2 for b, 3 for c and so on.
Design of Recording Forms
We designed our questionnaire which have eighteen multiple choice questions. At first we
included simple question just to have idea about the respondents. Among those we had some
time, frequency and risk specific questions. While designing our questionnaire we focused on
criteria like- simple, straightforward, concise and easily understandable. We tried to make the
respondents as convenient as possible. This helped us to minimize the error while gathering data.

RESPONSE INCENTIVES:
In general we did not provide any significant incentives. The incentives we provided were
mostly intangible to be precise; it is either intrinsic or extrinsic benefits. In other words we did
not provide any tangible incentives to the respondents, but we provided them intangible
incentives, such as; motivation, appreciation, thankfulness and so on psychological reward. As
we know that intrinsic motivation is always better as in intrinsic motivation people feel like
enthusiasm to do the work by their own need and in extrinsic motivation people are willing to
respond on our need not for their benefit. In such cases we tired to focus that what is their benefit
of participating such survey. On the other hand we also assured their confidentiality. Actually,
the data those they were providing, were in some what private and were mater of confidentiality.
Some of such privacy issue includes the amount of their expenditure on grocery item, Age,
buying patterns and so on. Besides for the respondent to feel comfort with the questioner, we
tried to make the questioner very comprehensive by adopting the following criteria –
SIMPLIFICATION:
We made the questionnaire as simple as possible just to make the respondents give answer
easily. Our effort in simplification of the questioner was not only in terms of wording but also in
terms of format, communication pattern and example oriented. That means we tried to offer a
holistic approach to make the respondents speak and give us the correct data. In terms of
communication pattern we tried to avoid double barrel questions, leading questions, tag
questions. As we know that all of these types of questions lead the respondent to be misleaded or
leaded according to the expectation of the questioner, we strictly avoided such questions.
DEMONSTRATION OF POSITIVE ATTITUDE:
Actually the attitude that we were suppose to demonstrate, was situational. Sometimes we had to
dominate the respondent and sometimes we had to lose the ground and let the respondent to
dominate the session. But in all situations we tried to have some kind of control, otherwise the
respondent would go out of the tangent. In most cases we asked the respondents gently and
politely to fill the questionnaire, when they were done we thanked them and told them that the
importance of their time that are taking form them to fill out the questioner. In this case our
motive was to let them fill the questioner in a relax mood and have a good impression about their
work after the questioner has been filled out. They felt good about themselves about involving
such survey by giving their motivation. In some cases they asked us the result of the survey
because if it is positive then they might go for such business.
MAINTENANCE OF PRIVACY:
In terms of privacy it was quite problematic in some cases. Most cases we think they did not give
accurate information about expenditure. As we know that the upper middle class people have
tendency to count themselves in upper lower class and similarly the upper-upper class has
tendency to count themselves with the upper-middle class. Apart from such private questions
they respond well in the other part of the questions. In most of the cases we assured them by
words that their privacy would be maintained with proper emphasize and in appropriate manner
even in further.
Sampling Method
Actually our sampling method depended on the expectation of the direction of the faculty. We
were expected to have one hundred samples. In a sense we took respondents conveniently and
relationally. Although there are different stoical methods of doing sampling but to keep the
research with the scope of academic purpose we had to use this method. We did not have any
refusal.
Sample Size:
We had a sample size of hundred people with different age, race marital status, occupation and
so on. Actually our target was to take one the respondent, who are relevant to the topic and who

is suppose to respond on the topic or the questioner. So, before asking anyone to fill out the
questioner we had and kind of good observation about the subject or the respondent. It really
helped us to have a efficient survey and savings of time. Instead of sorting the questioner we had
sorted the respondent as a result none of they filled out questioner we found irrelevant. Still we
know and believe that this sort of research requires a huge sample size, but because of various
limitations we could not consider a huge sample.
In terms of the marital status and age most of them are married women and young women. We
asked them to respond like they think or feel. As we know that sampling is a crucial part of any
research, we tried to give proper emphasize on selecting the sample. Without a relevant and
proper sample the whole research may head to a totally different direction. On the other hand we
kept in mind that not only due to the proper sampling but also due to the proper response of the
response the whole research may lead to a wrong conclusion.
Editing and Cleaning Survey Data
We edited and cleared data on the basis of completeness, legibility and consistency to make the
data ready for coding and transfer to storage. As usual, we edited data after we finished our
survey. We edited and cleaned respondent’s answers. We edited and sorted data / questioners
from different dimensions. First we checked the consistency of the responses in different
questions.
Secondly, tired to figure out the attitude of the person, whether she is doing it in a hurry or not.
Sometimes they did not understand some of the questions in such cases we explained them the
questions.
Similarly we did these kinds of editing for different reasons. We have edited and cleaned data
because of the following reasons:
Consistency:
We attuned the inconsistent or contradictory response so that the answers would not create
problem during data coding. The interdependency and interrelatedness is a big time issue in
terms of regression like analysis. Beside the proper definition of the variables never gives any
meaning to the research out come. The biggest disaster appears, when people do not respond
according to their opinion. We have also checked for the adherence to the data collection
framework. As we had one filter question which was the first question of the questionnaire it was
very important for us to verify data. Besides, each of the answers was verified so that the
answers are rationally consistent for the other related questions and the expected outcome of the
research may not get hampered and at the same time it may be get biased. Finally, we tried to
keep in mind that consistency does not mean the respond what we deserve rather it is what
exactly the respondent mean, so we always tried to give freedom of controlled flow of
information into the research, so that it may neither get biased nor ambiguous.
Completeness:
“Non-response” was a crucial problem. As we know the non-response is a technical term means
for an unanswered on an otherwise complete questionnaire. In such cases it was quite tough to
give meaning to the answers, which are kept blank. Usually the open ended questions were kept
blank. So, we coded this non-response by “missing value” or blank as the response. In open
ended question sometimes the answers were fulfilled but those did not make any sense. In some
cases the answers gave both sided biased answers. In such cases we completed the questioners by
thorough analysis of the remaining answers of the questioners.
Methods used:
One of the methods which we used for editing was pre-testing editing. Although it is not a very
efficient method but it helped us to have a overall fitness of data.
Pre-testing Edit:
Pre testing helped us to figure out and edit few major mistakes with some very minor mistakes.
So, we edited the questionnaire after the pre-test was complete.
Pattern of the Questions
1) Where do you reside?
Labeled Values 1.00 lalmatia 4 5.0%
2.00 mohammadpur 5 6.3%
3.00 dhanmondi 21 26.3%
4.00 basundhara 6 7.5%
5.00 motijheel 4 5.0%
6.00 shagunbagicha 1 1.3%
7.00 old town 5 6.3%
8.00 uttara 6 7.5%
9.00 bonoshree 4 5.0%
10.00 banani 4 5.0%
11.00 baily road 2 2.5%
12.00 ghulshan 7 8.8%
13.00 eskatan 1 1.3%
14.00 shantinagar 4 5.0%
15.00 pantapath 3 3.8%
16.00 mirpur 2 2.5%
17.00 cantonment 1 1.3%
2) What is your monthly family income?
Labeled Values 1.00 10000-25000 7 8.8%
2.00 25001-40000 9 11.3%
3.00 40001-60000 16 20.0%
4.00 Over 60000 48 60.0%
3) How many members does your family have?
Labeled Values 1.00 2 12 15.0%
2.00 3-5 51 63.8%
3.00 Over 5 17 21.3%
4) Where do you usually go for buying your household goods?

Labeled Values 1.00 Kacha bazaar 12 15.0%
2.00 Super shops 16 20.0%
3.00 Both 52 65.0%
6) Which of the following super shops have you been to?
Labeled Values 1.00 Agora 52 65.0%
2.00 Meena Bazaar 7 8.8%
3.00 Nandan 9 11.3%
4.00 Shopno 6 7.5%
5.00 Other 3 3.8%
6.00 Agora and a
few other
2 2.5%
7.00 Several but not
Agora
0 .0%
7) Which factors do you consider while choosing a family shop/super shop?
Labeled Values 1.00 Price 28 35.0%
2.00 Proximity from
residence
13 16.3%
3.00 Convenience of
shopping
23 28.8%
4.00 Value added
services
4 5.0%
5.00 Varieties 9 11.3%
8) Do you think Dhaka city has sufficient number of family shops?
Labeled Values 1.00 Sufficient 20 25.0%
2.00 About right 23 28.8%
3.00 Very few 24 30.0%
4.00 Don’t know 13 16.3%
10) What other factors, apart from those of Q7, do you think affect your decision to
choose a particular super shop?
Labeled Values 1.00 Behavior of
employees
36 45.0%

2.00 Parking facility 10 12.5%
3.00 Membership
facility
19 23.8%
4.00 Returns and
compensations
15 18.8%
11) Tick the one that you think as the best to serve the provided criterion:
Price
Labeled Values 1.00 Shopno 25 31.3%
2.00 Meena Bazar 18 22.5%
3.00 Agora 13 16.3%
4.00 Nandan 14 17.5%
5.00 Don’t know 10 12.5%
Quality
Labeled Values 1.00 Shopno 0 .0%
2.00 Meena Bazar 11 13.8%
3.00 Agora 44 55.0%
4.00 Nandan 16 20.0%
5.00 Don’t know 8 10.0%
Convenience
Labeled Values 1.00 Shopno 7 8.8%
2.00 Meena Bazar 21 26.3%
3.00 Agora 31 38.8%
4.00 Nandan 12 15.0%
5.00 Don’t know 9 11.3%
Proximity
Labeled Values 1.00 Shopno 12 15.0%
2.00 Meena Bazar 21 26.3%
3.00 Agora 17 21.3%
4.00 Nandan 20 25.0%
5.00 Don’t know 10 12.5%
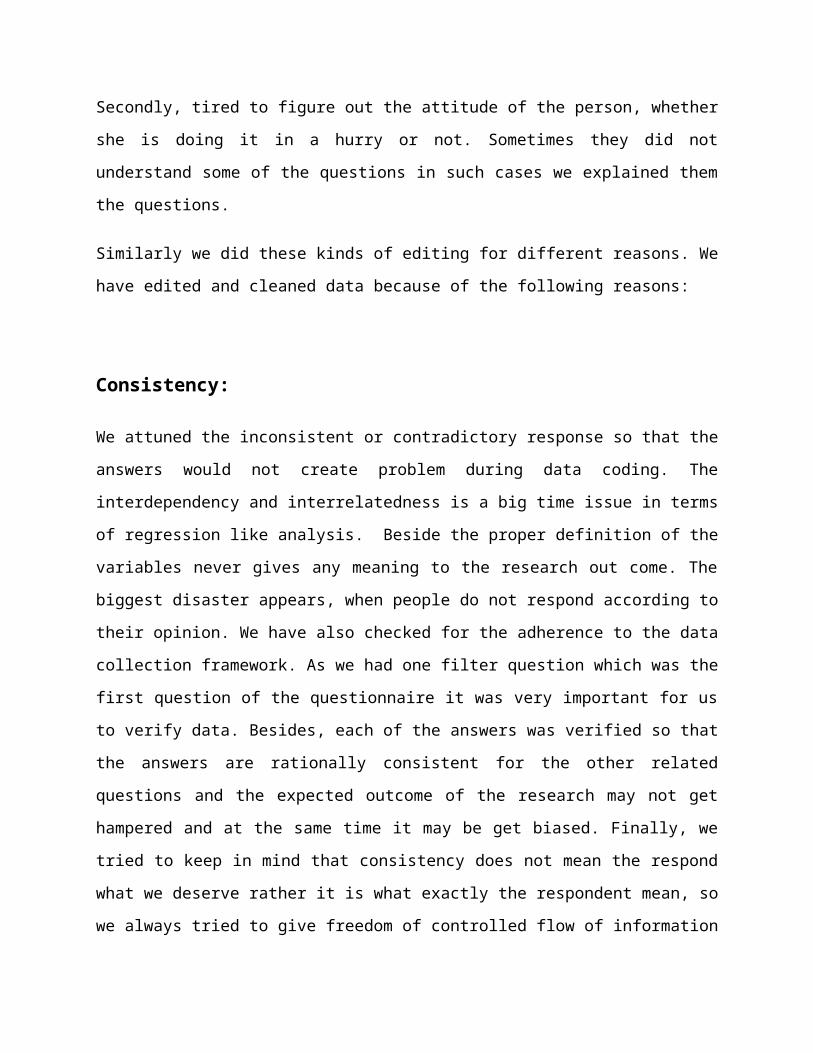
Varieties
Labeled Values 1.00 Shopno 5 6.3%
2.00 Meena Baza 16 20.0%
3.00 Agora 33 41.3%
4.00 Nandan 13 16.3%
5.00 Don’t know 13 16.3%
12) Currently which super shop is of your number one preference?
Labeled Values 1.00 Agora 38 47.5%
2.00 Meena Bazaar 18 22.5%
3.00 Nandan 16 20.0%
4.00 Shopno 6 7.5%
5.00 Other 2 2.5%
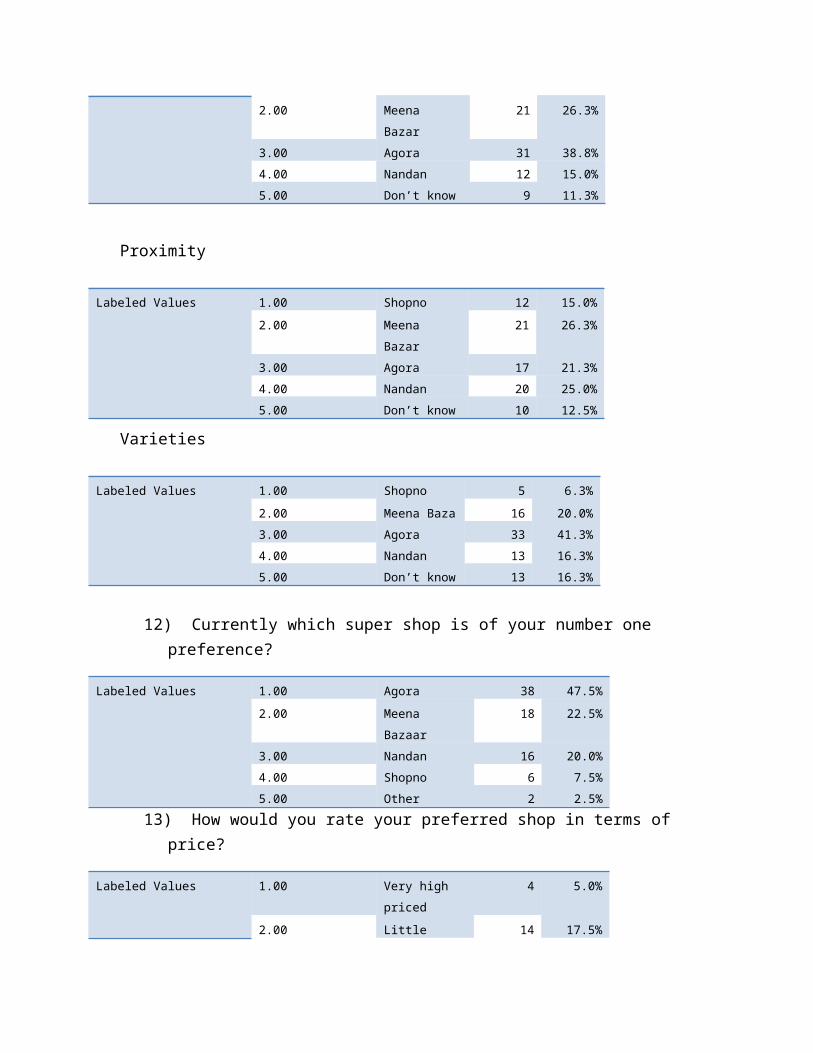
13) How would you rate your preferred shop in terms of price?
Labeled Values 1.00 Very high
priced
4 5.0%
2.00 Little
overpriced
14 17.5%
3.00 Moderately
priced
41 51.3%
4.00 Very
reasonable
13 16.3%
5.00 Best buy 8 10.0%
14) How would you rate your preferred shop in terms of convenience of shopping?
Labeled Values 1.00 Very
inconvenient
10 12.5%
2.00 A little
inconvenient
6 7.5%
3.00 Okay 24 30.0%
4.00 Convenient 34 42.5%
5.00 Very much
convenient
6 7.5%
15) How would you rate your preferred shop in terms of value added services?
Labeled Values 1.00 No services
added
1 1.3%

whatsoever
2.00 A few services
added
25 31.3%
3.00 Moderate
number of
services added
22 27.5%
4.00 Satisfactory
number of
services added
20 25.0%
5.00 Excellent
services added
12 15.0%
17) Are you so much loyal to your now preferred shop that better offers by others will not make you change your choice?
Labeled Values 1.00 Yes 23 28.8%
2.00 No 32 40.0%
3.00 Don’t know 25 31.3%
Open ended questions
Q) If you have to shop somewhere other than your preferred shop, what generally is the reason (s)?
Ans)………………………………………………………………………………………………………………………………………………………………………………………………………………………………………………………………………………………………………………………………………………………………………………………………………………………………………………………
Q) What recommendations would you like to give for the overall improvement of your super shop?
Ans)……………………………………………………………………………………………………………………………………………………………………………………………………………………………………………………………………………………………………………………………………………………………………………………………………………………………………………………………………………………………………………………………………………………………………………………………………………

DATA SUMMARIZATION
We have used some analysis techniques in order to fulfill the objectives of the report. The
techniques which we have used are described below:
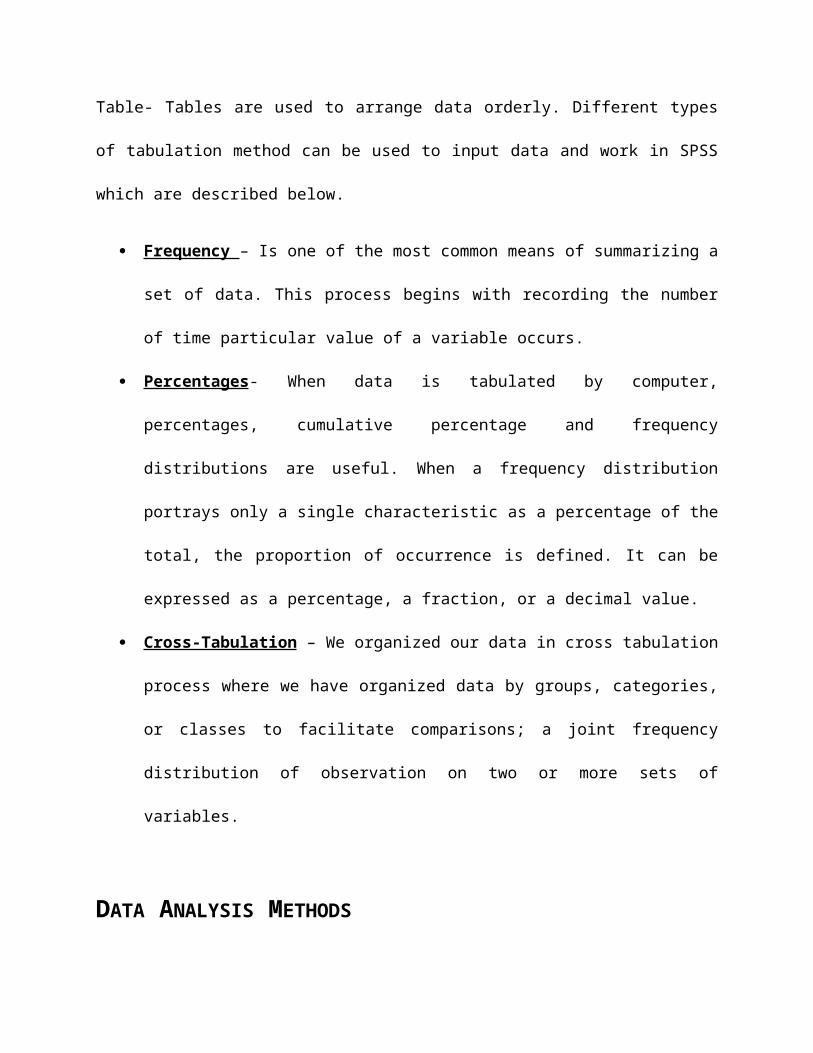
Table- Tables are used to arrange data orderly. Different types of tabulation method can be used
to input data and work in SPSS which are described below.
Frequency – Is one of the most common means of summarizing a set of data. This
process begins with recording the number of time particular value of a variable occurs.
Percentages - When data is tabulated by computer, percentages, cumulative percentage
and frequency distributions are useful. When a frequency distribution portrays only a
single characteristic as a percentage of the total, the proportion of occurrence is defined.
It can be expressed as a percentage, a fraction, or a decimal value.
Cross-Tabulation – We organized our data in cross tabulation process where we have
organized data by groups, categories, or classes to facilitate comparisons; a joint
frequency distribution of observation on two or more sets of variables.
DATA ANALYSIS METHODS
We used quantitative way to analyze data. At first we collected primary data from the
questionnaires we used for survey. After that we coded the alternatives of the questionnaire
along with the variables with SPSS. We entered all our responses by using SPSS to make a
database. This database became the source of further analysis. With the help of the data sheets
we analyze data using various methods like frequency, percentage count and cross tabulation.
DEVELOPING THE DATA ANALYSIS:

Coding: Each question was being coded to a computer readable form for using in the SPSS.
Then the data were entered from the questionnaires. This was time consuming and needed much
skill.
Data entry : After entering all the responses from each question, the data entering part was done.
Then we proceeded forward for the final job, which was analysis. Manually we entered data.
Data Analysis: By using SPSS, we put the formula, and then the software automatically gave us
the result. We could get a number of tables, charts by this process. Then we proceeded for the
data conversion and interpretation part.
Data conversion: All the SPSS result sheets had to be converted into managerially
understandable form. We converted them to word documents, made tables, graphs and wrote the
analysis.
ETHICAL CONSIDERATION
In every step of the research we tried our best to ensure privacy of each and every respondent.
Protecting confidential information is the obligation on the part of the researcher not to reveal the
identity of an individual in a research design .Our respondents waived their right to answer a
researcher’s questions. So it is our duty to keep their answers and identity remains confidential.
Closely related to the notion of voluntary participation is the requirement of informed consent.
Because we believe that the respondents have the right to be informed of all the aspects of
research. We told everything about the research purpose to the respondents. The argument for the
researcher’s obligation to protect its right is based on the academic tradition for informing and
enlightening the public. We also know that ethical standards also require that researchers not put

participants in a situation where they might be at risk of harm as a result of their participation.
Harm can be defined as both physical and psychological.
We have tried to represent our research as correctly as possible. We tried to maintain high
standards to ensure that our data are accurate. There is no intentional or deliberate
misrepresentation of research methods or results. Adequate descriptions of the methods have
been provided in the report. We have analyzed those data honestly and reported these actual data
collection method correctly. These data are actual data we know that distortion of actual data is a
blatant breach of the researchers responsibilities.
Survey Research Result
Statistics
What is your monthly family income
N Valid 80
Missing 0
This shows the income distribution of the sample. Apparently majority of the sample belong to the ‘over 60000’ category. This might be true or even can be an example of social desirability bias.
Statistics
Who generally does the most of shopping for your family?
N Valid 80
Missing 0
Who generally does the most of shopping for your family?
Frequency Percent Valid Percent
Cumulative
Percent
Valid You 38 47.5 47.5 47.5
Your husband 24 30.0 30.0 77.5
Children 2 2.5 2.5 80.0
Paid worker 16 20.0 20.0 100.0
Total 80 100.0 100.0
This part is aimed to find out the fragment that carries out the most of shopping. It states that the woman of the family is most likely to carry out the act as suggested by the value 47.5%.

Statistics
Currently which super shop is of your number one preference?
N Valid 80
Missing 0
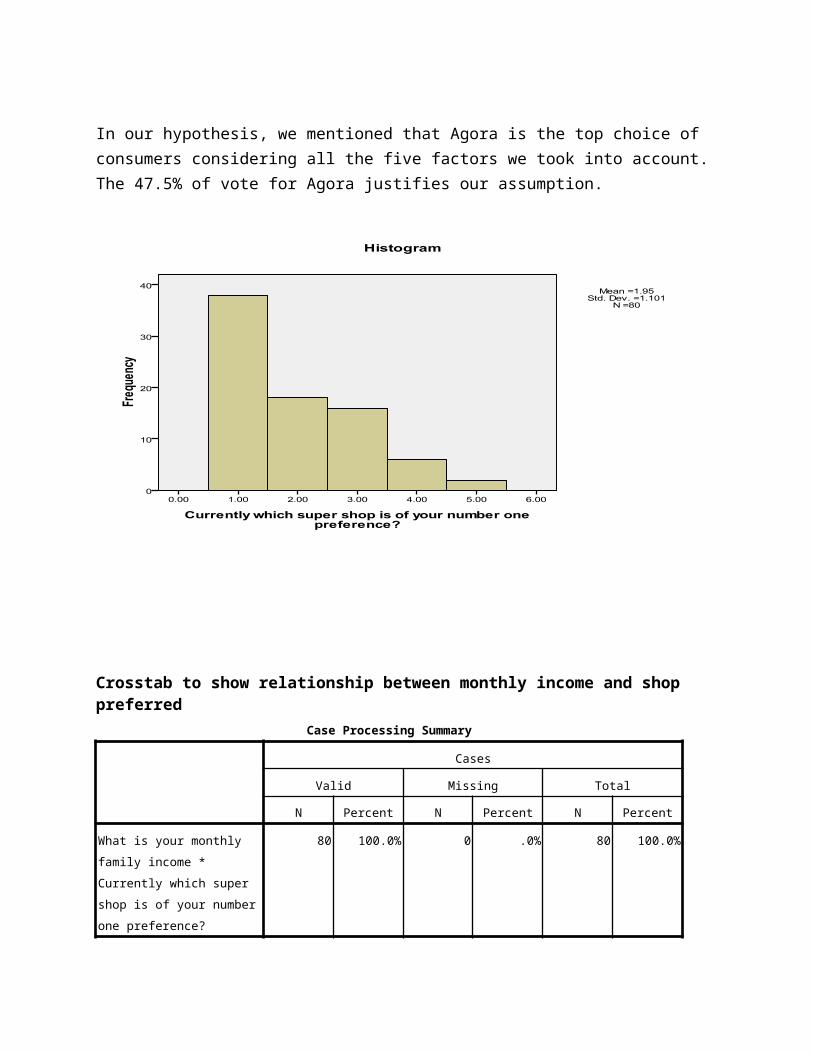
Currently which super shop is of your number one preference?
Frequency Percent Valid Percent
Cumulative
Percent
Valid Agora 38 47.5 47.5 47.5
Meena Bazaar 18 22.5 22.5 70.0
Nandan 16 20.0 20.0 90.0
Shopno 6 7.5 7.5 97.5
Other 2 2.5 2.5 100.0
Total 80 100.0 100.0
In our hypothesis, we mentioned that Agora is the top choice of consumers considering all the five factors we took into account. The 47.5% of vote for Agora justifies our assumption.
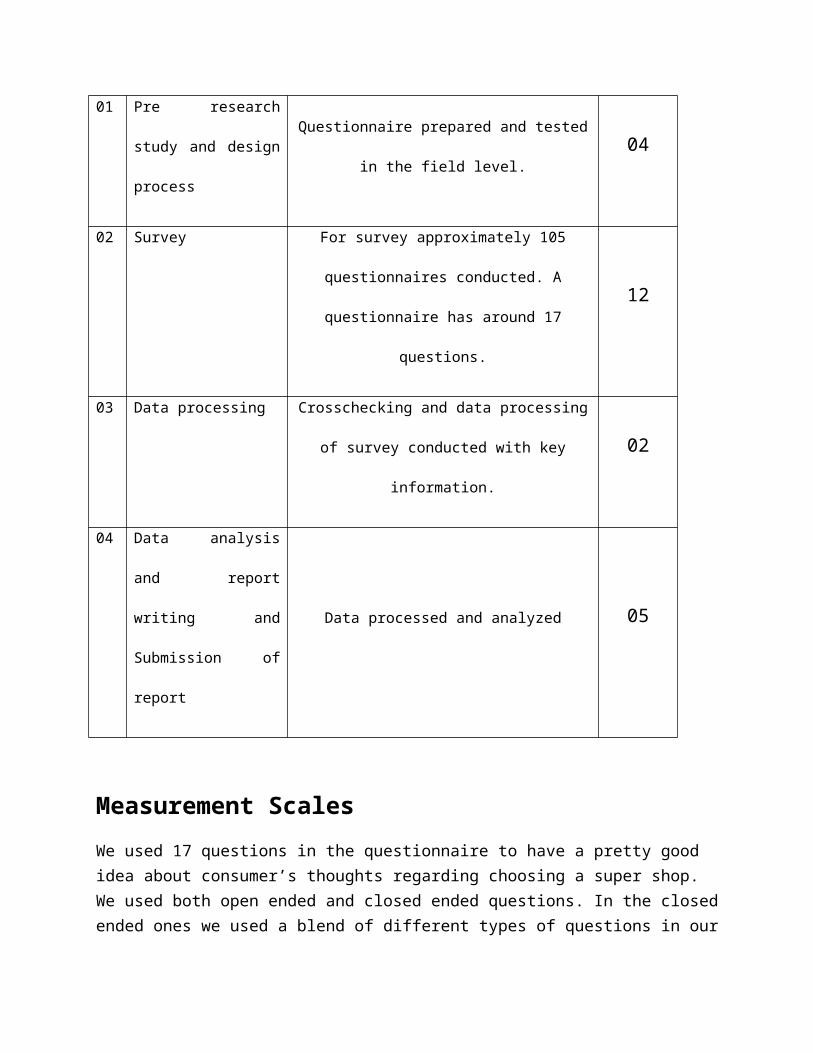
Crosstab to show relationship between monthly income and shop preferred
Case Processing Summary
Cases
Valid Missing Total
N Percent N Percent N Percent
What is your monthly family
income * Currently which
super shop is of your number
one preference?
80 100.0% 0 .0% 80 100.0%
What is your monthly family income * Currently which super shop is of your number one preference? Crosstabulation
Count
Currently which super shop is of your number one preference?
TotalAgora Meena Bazaar Nandan Shopno Other
What is your monthly family
income
10000-
25000
1 2 1 3 0 7
25001-
40000
5 1 1 1 1 9
40001-
60000
6 4 4 2 0 16
Over
60000
26 11 10 0 1 48
Total 38 18 16 6 2 80
This is for our first hypothesis of finding relationship between income level and shop being
chosen. We can see that the high income families are more likely to choose Agora, which is
known as the comparatively superior of the 4 considered in the research. Also, in the lower

income range, more people choose Shopno, which is considered as the value shop. So it
indicates a positive relationship between income and the shop being chosen.
Regression: Monthly family income and preferred shop
Variables Entered/Removedb
Model
Variables
Entered
Variables
Removed Method
1 What is your
monthly family
incomea
. Enter
a. All requested variables entered.
b. Dependent Variable: Currently which super shop is of
your number one preference?
Model Summary
Model R R Square
Adjusted R
Square
Std. Error of the
Estimate
1 .288a .083 .071 1.06135
a. Predictors: (Constant), What is your monthly family income
ANOVAb
Model Sum of Squares df Mean Square F Sig.
1 Regression 7.936 1 7.936 7.045 .010a
Residual 87.864 78 1.126
Total 95.800 79
a. Predictors: (Constant), What is your monthly family income
b. Dependent Variable: Currently which super shop is of your number one preference?

Coefficientsa
Model
Unstandardized Coefficients
Standardized
Coefficients
t Sig.B Std. Error Beta
1 (Constant) 3.012 .417 7.217 .000
What is your monthly family
income
-.321 .121 -.288 -2.654 .010
a. Dependent Variable: Currently which super shop is of your number one preference?
Here we can write the regression equation as: Preferred shop= 3.012-0.321Monthly family
income
Frequencies
Statistics
Are you so much loyal to your now
preferred shop that better offers by
others will not make you change
your choice?
N Valid 80
Missing 0

Are you so much loyal to your now preferred shop that better offers by others will not
make you change your choice?
Frequency Percent Valid Percent Cumulative Percent
Valid Yes 23 28.8 28.8 28.8
No 32 40.0 40.0 68.8
Don’t know 25 31.3 31.3 100.0
Total 80 100.0 100.0
This is to see whether customers are loyal to their preferred shop. The frequency table shows that majority of the customers are not loyal to their now preferred shop and will shift if there is a better offering. So the stores need to look for alternatives such as long term relationship building in order to reduce the customer defection rate.
Frequencies
Statistics
What other factors, apart from those
of Q7, do you think affect your
decision to choose a particular super
shop?
N Valid 80
Missing 0
What other factors, apart from those of Q7, do you think affect your decision to choose a particular super
shop?
Frequency Percent Valid Percent Cumulative Percent
Valid Behavior of employees 36 45.0 45.0 45.0
Parking facility 10 12.5 12.5 57.5
Membership facility 19 23.8 23.8 81.3
Returns and compensations 15 18.8 18.8 100.0
Total 80 100.0 100.0

This part shows that after the main decisive factors of price, convenience, proximity, and value added services, behavior of the employees is the most important factor for choosing a shop. This suggests that many super shops suffer from this problem and need to improve on this matter.
T-Test
Paired Samples Statistics
Mean N Std. Deviation Std. Error Mean
Pair 1 Price 2.5750 80 1.41220 .15789
Currently which super shop is of
your number one preference?
1.9500 80 1.10121 .12312
Paired Samples Correlations
N Correlation Sig.
Pair 1 Price & Currently which super
shop is of your number one
preference?
80 -.168 .135
Paired Samples Test
Paired Differences t df Sig. (2-tailed)
Mean Std.
Deviation
Std. Error
Mean
95% Confidence Interval of the
Difference
Lower Upper
Pair 1 Price -
Currently
which
super
shop is of
your
.62500 1.93158 .21596 .19515 1.05485 2.894 79 .005

number
one
preferenc
e?
Here we see that the correlation is -0.168. So it can be assumed that there is a negative correlation between the price and the preferred shop. It also proves our hypothesis.
Frequencies
Consumers’ perception on pricing:
Statistics
Price
N Valid 80
Missing 0
Price
Frequency Percent Valid Percent
Cumulative
Percent
Valid Shopno 25 31.3 31.3 31.3
Meena Bazar 18 22.5 22.5 53.8
Agora 13 16.3 16.3 70.0
Nandan 14 17.5 17.5 87.5
Don’t know 10 12.5 12.5 100.0
Total 80 100.0 100.0
This shows that Shopno is the best choice among customers when it comes about low price.
More specifically it has an impression among the consumers that it is a price deal offerer.

Findings
Most of the people interviewed had a family income of over 60000 BDT per month. This might be an example of social desirability bias.
Females do the most of the family shopping. Agora is the number one super shop to majority of the high income consumers. Customers are not very much loyal to the shop that they are buying from now. They will
switch if better offering is found. Behavior of the employees is a very vital factor for choosing a shop. Shopno is seen as the low priced provider but it is unable to attract sufficient number of
customers. Price is an important factor while choosing a shop but not the decisive factor.
Recommendations
Make more promotions targeted to females. Agora needs to lessen its price a little bit. Shopno needs to improve its quality. A lot of people complain about its unclean
environment. Low price is not the ultimate solution. Behavior of employees needs to be strictly monitored as it is an important factor while
choosing a shop. Customers are not very loyal to the now preferred shop. Look for long-term relationships
with them.
Conclusion
Agora is the current market leader because of its quality products and convenient shopping environment. Shopno is on the other end of the competition with a different pricing strategy. But people do not choose just based on price or quality. They make their decision on the basis of a number of factors. Shops should be too much focused on low pricing that quality and environment is degraded. They should not focus too much on quality either as it may be the cause of customer resentment.