4.7 Three Options for a New International Container...
128
MASTER PLAN STUDY ON PORT DEVELOPMENT AND LOGISTICS IN GREATER JAKARTA METROPOLITAN AREA (JIC) FINAL REPORT 81 4.7 Three Options for a New International Container Terminal (1) Development Fully Concentrated at off North Kalibaru (Option-1) In this section, long-term development plan for Tanjung Priok Terminal has been studied. In this study off North Kalibaru has been considered only space for further expansion for Tanjung Priok Terminal so as to meet increasing demand of international containers towards the target year 2030. 1) Target Container Volume for the New Terminal at North Kalibaru According to the result of cargo demand forecast, the total volume of international containers in the target year of 2030 has been estimated as 13.4 million TEUs. The capacity of the existing facilities of Tanjung Priok Terminal has been estimate as 4.9 million TEUs and the volume is forecast to reach by mid 2010’s. Based on the above assumption, and taking account of the conversion of JICT II and MTI currently used for international containers into domestic container terminals, the required capacity for the new terminal has been estimated as 9.4 million TEUs in 2030. million TEUs –4.0 million TEUs = 9.4 million TEUs per annum 2) Required Berth Length Taking account of possible configuration of North Kalibaru container berth and phased implementation, the berth has been proposed as so-called continuous berth with the same water depth in the condition that various types of container ships will berth at various places rather than fixed places according to their various LOAs. To simplify the calculation of required length of its berth by avoiding complicated berthing assumption, actual unit productivity per unit berth length achieved by JICT North in 2009, viz. 1,600 TEUs/m/year, has been applied. The resulting figure is 5,800 m as shown below: Required berth length: 9,400,000 TEUs/year /(1,600 TEUs/m/year) = 5,800 m 3) Facility Components and Layout Plans of North Kalibaru Terminal of Option-1 The three alternative layout plans satisfying facility requirements to the new terminal at off North Kalibaru in the stage of the Master Plan have been made (see Figure 4.7-1). The main components of each alternative are shown in Table 4.7-1.
-
Upload
vuongnguyet -
Category
Documents
-
view
214 -
download
0
Transcript of 4.7 Three Options for a New International Container...
MASTER PLAN STUDY ON PORT DEVELOPMENT AND LOGISTICS IN GREATER JAKARTA METROPOLITAN AREA (JIC) FINAL REPORT
81
4.7 Three Options for a New International Container Terminal
(1) Development Fully Concentrated at off North Kalibaru (Option-1)
In this section, long-term development plan for Tanjung Priok Terminal has been studied. In this study off North Kalibaru has been considered only space for further expansion for Tanjung Priok Terminal so as to meet increasing demand of international containers towards the target year 2030.
1) Target Container Volume for the New Terminal at North Kalibaru
According to the result of cargo demand forecast, the total volume of international containers in the target year of 2030 has been estimated as 13.4 million TEUs. The capacity of the existing facilities of Tanjung Priok Terminal has been estimate as 4.9 million TEUs and the volume is forecast to reach by mid 2010’s.
Based on the above assumption, and taking account of the conversion of JICT II and MTI currently used for international containers into domestic container terminals, the required capacity for the new terminal has been estimated as 9.4 million TEUs in 2030.
million TEUs –4.0 million TEUs = 9.4 million TEUs per annum
2) Required Berth Length
Taking account of possible configuration of North Kalibaru container berth and phased implementation, the berth has been proposed as so-called continuous berth with the same water depth in the condition that various types of container ships will berth at various places rather than fixed places according to their various LOAs.
To simplify the calculation of required length of its berth by avoiding complicated berthing assumption, actual unit productivity per unit berth length achieved by JICT North in 2009, viz. 1,600 TEUs/m/year, has been applied. The resulting figure is 5,800 m as shown below:
Required berth length: 9,400,000 TEUs/year /(1,600 TEUs/m/year) = 5,800 m
3) Facility Components and Layout Plans of North Kalibaru Terminal of Option-1
The three alternative layout plans satisfying facility requirements to the new terminal at off North Kalibaru in the stage of the Master Plan have been made (see Figure 4.7-1). The main components of each alternative are shown in Table 4.7-1.

MASTER PLAN STUDY ON PORT DEVELOPMENT AND LOGISTICS IN GREATER JAKARTA METROPOLITAN AREA (JIC) FINAL REPORT
82
Table 4.7-1 Facility Components of Alternative Plans at North Kalibaru (Option-1)
Source: Made by the Study Team
Figure 4.7-1 Facility Layout Plan of North Kalibaru Expansion in 2030 (Alternatives-1~3)
Industrial Area
To Cikampek
Planned newport terminal
New portaccess road
JORR2
Source: Made by the Study Team
Figure 4.7-2 Access Road to North Kalibaru (Option-1)
Component Alternative - 1 Alternative - 2 Alternative - 3
Access Channels
West Bottom width (m) 310 310 310
Water depth (m) 15.5 15.5 15.5
Basins Northwest Water depth (m) 15.5 15.5 15.5
South Water depth (m) 15.5 15.5 15.5
New Breakwaters
West Length (m) 2,640 2,640 2,640
North Length (m) 2,790 70 2,300
Seawalls (Open Sea) Length (m) 620 2,840 1,420
Revetment Length (m) 2,050 2,210 2,670
Container Terminal
Phases (I~III)
Berth length (m) 5,800 5,800 5,800
Water depth (m) 15.5 15.5 15.5
Container yard (ha) 400 440 450
Land use area (ha) Terminal area total 420 470 460
North-South Access Road
Bridge Length (m) 1,100 670 1,090
Land road Length (m) 950 600 420
Eastbound Access Road
Coastal Bridge Length (m) 10,300 11,020 9,700
Land road Length (m) 26,400 26,400 26,400
Source: JICA Study Team

MASTER PLAN STUDY ON PORT DEVELOPMENT AND LOGISTICS IN GREATER JAKARTA METROPOLITAN AREA (JIC) FINAL REPORT
83
(2) Development Split to off North Kalibaru and Cilamaya (Option-2)
Option-2 with the two terminals has been planned; one terminal has been planned at off North Kalibaru and the other terminal at Cilamaya. The former terminal coincides with North Kalibaru Phase I Plan 1 as a part of entire Option-1 plan described in the previous Clause “(1)”.
1) North Kalibaru Phase I Terminal of Option-2
North Kalibaru Phase I Terminal Plan has the three alternatives, viz. Alternative-1, Alternative-2 and Alternative-3 by partly succeeding Option-1 plan. Facility layout plans are shown in Figure 4.7-3.
Source: Made by the Study Team
Figure 4.7-3 Facility Layout Plan of North Kalibaru Expansion in Phase I (Option- 2:Alternatives-1~3)
2) Cilamaya Terminal
a. Target Container Volume for the New Terminal at Cilamaya
The required capacity to Kalibaru Phases II~III have been estimated as 7.5 million TEUs in total in the stage of Master Plan with the target year of 2030. The same target volume has been applied for Cilamaya Terminal.
b. Facility Components and a Layout Plan of Cilamaya Terminal
Main components and a facility layout plan of Phases II~III of Cilamaya Terminal are summarized in Table 4.7-2 (see Figure 4.7-4). An access channel to the new terminal at Cilamaya is shown in Figure 4.9-3. An access road to the new terminal at Cilamaya is shown in Figure 4.7-5

MASTER PLAN STUDY ON PORT DEVELOPMENT AND LOGISTICS IN GREATER JAKARTA METROPOLITAN AREA (JIC) FINAL REPORT
84
Table 4.7-2 Facility Components of Option-2 (Phases II ~ III at Cilamaya)
Component Amount
Access channel Bottom width (m) 310
Water depth (m) 15.5
Breakwaters
West Length (m) 360
Northwest Length (m) 720
Northeast Length (m) 680
East Length (m) 360
Seawalls(Open Sea) Length (m) 4,680
Revetment Length (m) 1,630
Container Terminal
No.1 ~ No.6Quay
Berth number (unit) 16
Berth length (m) 4,320
Water depth (m) 12.5~15.5
Container yard (sq. m) 1,728,000
Multi- purpose Terminal
No.7 Quay
Berth number (unit) 3
Berth length (m) 590
Water depth (m) 9
Open yard (sq. m) 147,500
Port service boats basin No.8 Quay Berth length (m) 1,000
Water depth (m) 4
Land use area (ha) Terminal area total 290
Access Road
North-South Bridge Length (m) 800
East-West Bridge Length (m) 150
Land road Length (m) 30,600Source: Made by the Study Team
Source: Made by the Study Team
Figure 4.7-4 Facility Layout Plan of a New Cilamaya Terminal in Phases II and III (2030)

MASTER PLAN STUDY ON PORT DEVELOPMENT AND LOGISTICS IN GREATER JAKARTA METROPOLITAN AREA (JIC) FINAL REPORT
85
Cilamay a Terminal
Access Road
Junction
Railway
KawarangBarat IC
KawarangTimur IC
Dawuan JCT
SA
SA
IC
National road
Source: Made by the Study Team
Figure 4.7-5 Access Road to a New Cilamaya Terminal
(3) Development Split to off North Kalibaru and Tangerang (Option-3)
Option-3 with the two terminals has been planned; one terminal has been planned at off North Kalibaru and the other terminal at Tangerang.
1) North Kalibaru Terminal
The North Kalibaru Terminal of Option-3 is composed of the three phased plans, viz. Phases I, II and III. Phases I and II of Option-3 are the same as those of Option-1. Phase III of Option-1 has been curtailed by 2 million TEUs in terms of container-handling capacity per annum. Then the curtailed portion has been allocated to Tangerang Terminal so as to keep the same capacity of 9.4 million TEUs per annum in Option-3 in total.
The Kalibaru Terminal plan of Option-3 has the three alternatives, viz. Alternative-1, Alternative-2 and Alternative-3 by partly succeeding Option-1 plan. The respective facility layout plans are shown in Figure 4.7-6.
Source: Made by the Study Team
Figure 4.7-6 Facility Layout Plan of North Kalibaru Expansion in 2030 (Alternatives-1~3)

MASTER PLAN STUDY ON PORT DEVELOPMENT AND LOGISTICS IN GREATER JAKARTA METROPOLITAN AREA (JIC) FINAL REPORT
86
2) Tangerang Terminal
a. Target Container Volume
As mentioned in the clause “(1)” of this section, an amount of two million TEUs per annum has been allocated to Tangerang Terminal in 2030.
b. Facility Components and a Layout Plan
Main components and a facility layout plan of Tangerang Terminal are summarized in Table 4.7-3 (see Figure 4.7-7). An access road to the new terminal at Tangerang is shown in Figure 4.7-8
Table 4.7-3 Facility Components of Tangerang Terminal (Option-3)
Component Amount
Access channel Bottom width (m) 310
Water depth (m) 15.5
Breakwaters
West Length (m) 630
Northwest Length (m) 510Northeast Length (m) 470East Length (m) 640
Seawalls(Open Sea) Length (m) 1,860
Revetment Length (m) 2,460
Container Terminal No.1~No.4 Quay
Berth number (unit) 4
Berth length (m) 1,200
Water depth (m) 12.5~15.5
Container yard (ha) 60
Multi- purpose Terminal
No.5 Quay
Berth number (unit) 1
Berth length (m) 320
Water depth (m) 9
Open yard (sq. m) 10
Land use area (ha) Terminal area total 100
Access Road North-South Bridge Length (m) 420
Land road Length (m) 4,600
Source: Made by the Study Team
Figure 4.7-7 Facility Layout Plan of Tangerang Terminal in 2030 (Option-3)
Figure 4.7-8 Access Road to a New Container Terminal at Tangerang

MASTER PLAN STUDY ON PORT DEVELOPMENT AND LOGISTICS IN GREATER JAKARTA METROPOLITAN AREA (JIC) FINAL REPORT
87
(4) Comparison of the three Options and Selection of the Optimum Option
A comparison matrix on a quantitative basis by scoring each item has been made to facilitate the comparison (see Table 4.7-4 ~ Table 4.7-6).
So as to evaluate comparison items quantitatively, the respective quantitative indices have been used as well as weights by comparison item. Then scores have been given to the respective options by comparison item. In the evaluation by item and option, scores in the range from “1” to “3” have been given. “3”, “2” and “1” mean high, medium and low. Each score has been given according to the quantitative index shown in the tables.
Then, each score has been multiplied the corresponding weight of which summation has been adjusted to be 100%. Thus, the maximum possible score should be “3”.
In putting weights, the three cases have been examined. The first one is the case in which solving the current overconcentration to the JABODETABEK area and simultaneously narrowing the socio-economic disparity between the area and its periphery areas through the regional development are given priority. The weights of the items contributing to the solution to the problems mentioned above (Economic items) have been given 70% in total, whereas the remaining items (Natural items), 30% in total as shown in Table 4.7-4. As shown in the table, Option-2 has obtained the highest score of “2.5”, followed by Option-1 with the score of “1.8” and Option-3 with the score of 1.6.
Although the Option-2 with the highest score in the former case has some negative impacts on the natural environment at its project site, it has been judged that the supposed impacts could be mitigated by adequate measures to the extent that the activities relating to the new port, and human livings and natural environment including fauna and flora peripheral to the project site could co-exist. The necessary mitigation measures, if any, will be revealed through the EIA in the feasibility study to be implemented after this.
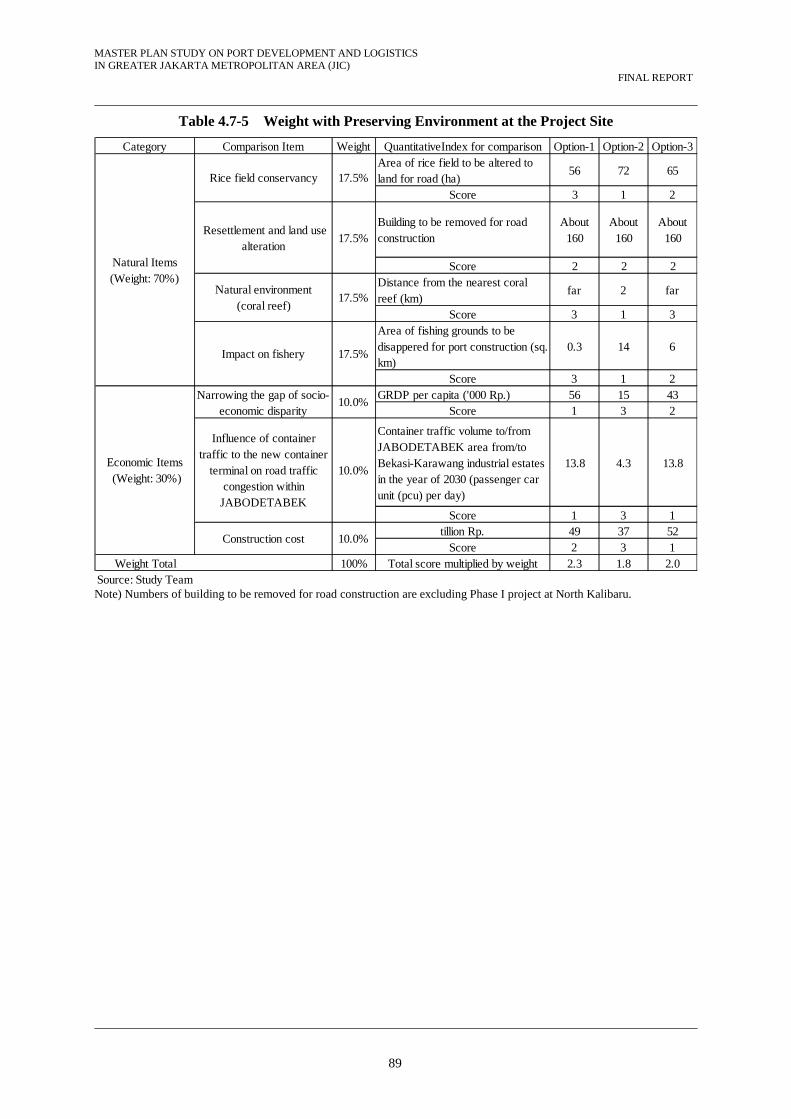
The second one is the case in which merely preserving environment at the project site disregarding the problems of the overconcentration to the JABODETABEK area and regional disparity is given priority. The weights of the items contributing to the environmental preservation mentioned above (Natural items) have been given 70% in total, whereas the remaining items (Economic items), 30% in total as shown in Table 4.7-5. As shown in the table, Option-1 has obtained the highest score of “2.3”, followed by Option-3 with the score of “2.0” and Option-2 with the score of 1.8.”.
The third one is the case in which equal weights are put on the Natural Items and Economic Items mentioned above. (Natural items) have been given 50% in total, whereas the remaining items (Economic items), 50% in total as shown in Table 4.7-6. As shown in the table, Option-2 has obtained the highest score of “2.1”, followed by Option-1 with the score of “2.0” and Option-2 with the score of 1.8.”.
Through the measurement of the sensitivity of weights of the category, viz. economic items and natural items, Option-2 obtained the highest scores twice, viz. in the first case and the third case among the above three cases. In the second case, although Option-2 obtained the lowest score, it has been judged that its anticipated negative impacts on the natural environment at its project site could be mitigated by adequate measures as mentioned above. From the above, Option-2 has been selected as the optimum plan.

MASTER PLAN STUDY ON PORT DEVELOPMENT AND LOGISTICS IN GREATER JAKARTA METROPOLITAN AREA (JIC) FINAL REPORT
88
Table 4.7-4 Weight with Solving Overconcentration to JABODETABEK and Contributing Regional Development
Category Comparison Item Weight QuantitativeIndex for comparison Option-1 Option-2 Option-3GRDP per capita ('000 Rp.) 56 15 43
Score 1 3 2
Container traffic volume to/fromJABODETABEK area from/toBekasi-Karawang industrial estatesin the year of 2030 (passenger carunit (pcu) per day)
13.8 4.3 13.8
Score 1 3 1tillion Rp. 49 37 52
Score 2 3 1Area of rice field to be altered toland for road (ha)
56 72 65
Score 3 1 2
Building to be removed for roadconstruction
About160
About160
About160
Score 2 2 2Distance from the nearest coralreef (km)
far 2 far
Score 3 1 3Area of fishing grounds to bedisappered for port construction (sq.km)
0.3 14 6
Score 3 1 2Weight Total 100.0% Total score multiplied by weight 1.8 2.5 1.6
Source: Study Team
23.3%
Economic Items (Weight: 70%)
Natural Items (Weight: 30%)
Rice field conservancy 7.5%
Resettlement and land usealteration
7.5%
Natural environment(coral reef)
7.5%
Impact on fishery 7.5%
Construction cost
Narrowing the gap of socio-economic disparity
23.3%
Influence of containertraffic to the new container
terminal on road trafficcongestion within
JABODETABEK
23.3%
Note) Numbers of building to be removed for road construction are excluding Phase I project at North Kalibaru.
MASTER PLAN STUDY ON PORT DEVELOPMENT AND LOGISTICS IN GREATER JAKARTA METROPOLITAN AREA (JIC) FINAL REPORT
89
Table 4.7-5 Weight with Preserving Environment at the Project Site
Category Comparison Item Weight QuantitativeIndex for comparison Option-1 Option-2 Option-3Area of rice field to be altered toland for road (ha)
56 72 65
Score 3 1 2
Building to be removed for roadconstruction
About160
About160
About160
Score 2 2 2Distance from the nearest coralreef (km)
far 2 far
Score 3 1 3Area of fishing grounds to bedisappered for port construction (sq.km)
0.3 14 6
Score 3 1 2GRDP per capita ('000 Rp.) 56 15 43
Score 1 3 2
Container traffic volume to/fromJABODETABEK area from/toBekasi-Karawang industrial estatesin the year of 2030 (passenger carunit (pcu) per day)
13.8 4.3 13.8
Score 1 3 1tillion Rp. 49 37 52
Score 2 3 1Weight Total 100% Total score multiplied by weight 2.3 1.8 2.0
Source: Study Team
Economic Items (Weight: 30%)
Narrowing the gap of socio-economic disparity
10.0%
Influence of containertraffic to the new container
terminal on road trafficcongestion within
JABODETABEK
10.0%
Construction cost 10.0%
Natural Items(Weight: 70%)
Rice field conservancy 17.5%
Resettlement and land usealteration
17.5%
Natural environment(coral reef)
17.5%
Impact on fishery 17.5%
Note) Numbers of building to be removed for road construction are excluding Phase I project at North Kalibaru.

MASTER PLAN STUDY ON PORT DEVELOPMENT AND LOGISTICS IN GREATER JAKARTA METROPOLITAN AREA (JIC) FINAL REPORT
90
Table 4.7-6 Equal Weights on Economic Items and Natural Items
Category Comparison Item Weight QuantitativeIndex for comparison Option-1 Option-2 Option-3GRDP per capita ('000 Rp.) 56 15 43
Score 1 3 2
Container traffic volume to/fromJABODETABEK area from/toBekasi-Karawang industrial estatesin the year of 2030 (passenger carunit (pcu) per day)
13.8 4.3 13.8
Score 1 3 1tillion Rp. 49 37 52
Score 2 3 1Area of rice field to be altered toland for road (ha)
56 72 65
Score 3 1 2
Building to be removed for roadconstruction
About160
About160
About160
Score 2 2 2Distance from the nearest coralreef (km)
far 2 far
Score 3 1 3Area of fishing grounds to bedisappered for port construction (sq.km)
0.3 14 6
Score 3 1 2Weight Total 100.0% Total score multiplied by weight 2.0 2.1 1.8
Source: Study Team
Natural Items (Weight: 50%)
Rice field conservancy 12.5%
Resettlement and land usealteration
12.5%
Natural environment(coral reef)
12.5%
Impact on fishery 12.5%
Economic Items (Weight: 50%)
Narrowing the gap of socio-economic disparity
16.7%
Influence of containertraffic to the new container
terminal on road trafficcongestion within
JABODETABEK
16.7%
Construction cost 16.7%
Note) Numbers of building to be removed for road construction are excluding Phase I project at North Kalibaru.
(5) Comparison of the three Alternatives of Option-2 Selected as the Optimum Option and the Selection of the Optimum Alternative
The selected Option-2 is divided into the three phased plans, viz. Phase I planned at North Kalibaru with three alternatives and Phase II and III planned at Cilamaya without alternatives. Hence, the three alternatives of North Kalibaru Phase I of Option-2 have been compared with each other from the various points.
The Alternatives have been compared by using comparison matrix on a quantitative basis (see Table 4.7-7).
As shown in the table, alternative-1 has obtained the highest score of “2.5”, followed by Alternative-2 with the score of “2.4”. Thus, Alternative-1 has been selected as the optimum plan. In this regard, there are no decisive differences between Alternative 1 and Alternative 2 in scores and Alternative 2 has an advantage over Alternative 1 in Involuntary Resettlement.

MASTER PLAN STUDY ON PORT DEVELOPMENT AND LOGISTICS IN GREATER JAKARTA METROPOLITAN AREA (JIC) FINAL REPORT
91
Table 4.7-7 Summary of Quantitative Evaluation on Alternatives
4.8 Development of Terminals for Domestic Containers and Conventional cargoes
In this section, long-term development plan for handling domestic containers and conventional cargoes at Tanjung Priok Terminal has been studied so as to meet the increasing demand for those cargoes towards the future and also the requirement of transfer of petroleum as typical dangerous cargoes and dusty bulk cargoes such as coal, sand and clinker from the existing terminal areas in the vicinity of urban areas to off the existing terminal areas.
Berth allocation plan for domestic containers and conventional cargoes at Tanjung Priok Terminal is shown below.
(1) Petroleum Products to be Allocated off North Kalibaru
The volumes of petroleum products to be transferred to a new petroleum terminal in 2030 have been estimated as 4.4 million MT. Its breakdown is shown as follows:
To handle the above volume for PERTAMINA, two berths are sufficient. It is said that petroleum dealers other than PERTAMINA are requesting to set up their terminals. Taking account of the request, four berths have been planned as follows:
- Total berth length 270 m/berth x 4 berths = 1,080 m - Water depth -15.5m
(2) Dry Bulk Cargoes Allocated off Kalibaru
The volumes of dusty dry bulk cargoes to be transferred to a new dry bulk terminal in 2030 have been estimated as 18.4 million MT.
Assessment Items Alternative-1 Alternative-2 Alternative-3
Navigational Safety 3 1 1
Necessity of the mainenance dredging in the second channel
3 1 3
Consistency with Urgent Rehabilitation Project 3 3 1
Strategic Environmental
Assessment
Obstacle to navigation of fishing boats
3 2 1
Elimination of fishing ground 3 3 1
Impact on water quality within the port basins
3 3 1
Impact on smell within the port area 2 3 1
Involuntary resettlement 1 3 1
Impact on noise, vibration and safety along port access road at Kalibaru
1 3 1
Project cost 3 2 1
Weight Total 2.5 2.4 1.2
Source: Made by the Study Team

MASTER PLAN STUDY ON PORT DEVELOPMENT AND LOGISTICS IN GREATER JAKARTA METROPOLITAN AREA (JIC) FINAL REPORT
92
To handle the above volume, a total berth length has been estimated to be 915 m. To ensure flexible berthing, dry bulk berth has been planned as a continuous berth with the same water depth.
Taking account of that petroleum terminal and container terminal have been planned to be located on the west and on the east of the bulk terminal respectively with the same water depth of 15.5m, so as to facilitate possible maintenance dredging and ensure safe maneuvering operations of vessels, the same water depth of 15.5 m has been adopted in the bulk terminal planning throughout the berth line.
(3) Domestic Containers Allocated within the Existing Conventional Wharves
The volume of domestic containers has been estimated to be 4.4 million TEUs in 2030.
To handle a large amount of domestic containers in 2030, the Third Wharf of Tanjung Priok Terminal has been redeveloped for a container terminal specialized for domestic containers except for MAL terminal in addition to convert MTI and JICT II to domestic container terminals.
Berth length for domestic containers is shown as follows
- The third Wharf: 1,800m (West: 750m, East: 1,050m) - MTI: 410m - JICT II: 520m Total 2,730m
To ensure efficient container handling, two units of container gantry cranes per berth have been
planned to be introduced, totaling 18 units of the quayside cranes. Conventional Cargoes Allocated at the Existing Conventional Wharves
(4) Conventional Cargoes Allocated at the Existing Conventional Wharves
The total volume of conventional cargoes to be handled at the First Wharf, the Second wharf and Island (Nusantara) Wharf excluding dusty cargoes to be transferred to a new berth off North Kalibaru has been estimated as 16.3 million MT. To ensure efficient cargo handling, sufficient units of mobile harbor cranes (tower cranes) have been planned to be introduced. For handling conventional general cargoes, the following berths are recognized to be available (Japat River Wharf has not been counted):
- Island Wharf: 14 berths, - First Wharf: 13 berths (MTI berths are excluded) - Second Wharf: 12 berths (JICT II berths are
(5) Cargoes handled at Berths for Exclusive Use for Specified Cargoes
The total volume of conventional cargoes to be handled at exclusive use for specified cargoes has been estimated as 10.1 million MT. Main berths are as follows:
- Bogasari (Sarpindo) berths for wheat and wheat bran - Pertamina berth for LPG - Car Terminal berth - Bulk cement berth at the West Side of the Second Wharf - MEDCO berth for High Speed Oil - DKP berth for Chemical Products

MASTER PLAN STUDY ON PORT DEVELOPMENT AND LOGISTICS IN GREATER JAKARTA METROPOLITAN AREA (JIC) FINAL REPORT
93
(6) Imported and Exported Vehicles
Imported and exported vehicles are currently handled at the Car Terminal at the east end of the existing terminal. To meet the future demand two berths and car storage yards with around 128,000 sq. m have been estimated to be required. Currently one berth with a length of 220m and a yard of 156,000 sq. m are available. Thus one berth with a length of 240m and a yard with an area of 28,000 sq. m will be additionally required in the stage of 2030.
4.9 Master Plan of Tanjung Priok Port
(1) Requirements for the Master Plan by Law No. 17
Tanjung Priok Port as a public port is administrated by its port authority which was established in December of 2010 by Law of Republic of Indonesia No.17 Year 2008. Its jurisdictional area is located along the northern coast extending from Banten Province, DKI Jakarta and West Java Province.
Tanjung Priok Port must have its Port Master Plan stipulated by the Minister of Transport in compliance with the New Shipping Law No.17. The Master Plan of Tanjung Priok Port in compliance with the Law must fulfill the following requirements by the Law.
- National Territory Spatial Layout Plan, - Provincial Spatial Layout Plan - Regency Area Spatial Layout Plan - Harmony and Balance with other related activities at the port location - Technical, economic and environmental feasibility - Safety and secure of ship traffic
(2) Principal Port Development Plans
In this study, the two principal port development plans have been proposed at Tanjung Priok and at Cilamaya as shown in Sections 4.7 and 4.8. Facility layout plan of Tanjung Priok Terminal is shown in Figure 4.9-1. The figure includes the redevelopment plan for domestic containers and conventional cargoes within the existing Tanjung Priok Terminal and the development plan of the new petroleum and bulk terminals off North Kalibaru in the stage of Master Plan. International container terminals comprising JCT and the new terminal off North Kalibaru are also shown in the figure. On the other hand, Cilamaya Terminal is shown in Figure 4.7-4.

MASTER PLAN STUDY ON PORT DEVELOPMENT AND LOGISTICS IN GREATER JAKARTA METROPOLITAN AREA (JIC) FINAL REPORT
94
Figure 4.9-1 Facility Layout Plan of Tanjung Priok Terminal in the Stage of Master
(3) Directions of Marine Terminals under Tanjung Priok Port other than Tanjung Priok Terminal and Cilamaya Terminal
1) Public Terminals other than Tanjung Priok Terminal and Cilamaya Terminal
In addition to Tanjung Priok Terminal and the newly proposed Cilamaya Terminal, the following public terminals are also under the umbrella of Tanjung Priok Port:
- Sunda Kelapa Terminal in DKI Jakarta - Patimban Terminal in Kabupaten Indramayu (to be constructed) - Bojonegara Terminal in Banten Province
In addition to the above three existing terminals, the following potential terminals might join as
public terminals:
- Marunda in DKI Jakarta
Legend
Domestic Containers
Public Use for Conventional Cargoes (Existing Wharves and North Kalibaru
Exclusive Use for Specified Cargoes (Bogasari Terminal and Car Terminal)
Exclusive Use for Specified Cargoes (DKP, MEDCO, Petroleum Terminal at North Kalibaru)
International Containers (JICT, KOJA, MAL, North Kalibaru)
Source: Made by the Study Team

MASTER PLAN STUDY ON PORT DEVELOPMENT AND LOGISTICS IN GREATER JAKARTA METROPOLITAN AREA (JIC) FINAL REPORT
95
- Marunda in Kabupaten Bekesi - Tarumajaya in Kabupaten Bekesi
2) Proposed Principle When Making Port Development Plan
From the standpoints mentioned in the above Paragraphs “(2)” and “(3), the following principles when making a port development plan have been proposed:
To make the most of spatial resources
The coastal area along the Greater Jakarta Metropolitan Area is already densely used and space is limited and valuable. Hence it is essential to make the most of such spatial resources.
To concentrate financial resources on a limited port development
It is essential to concentrate financial resources on limited port development so as to save financial resources and to avoid duplicated investment
To coordinate other activities to share limited spatial resources
It is essential to coordinate properly with other various activities to share limited space with each other so as to make the most of spatial resources
To make adequate functional allotment among marine terminal under the umbrella of Tanjung Priok Port
It is essential to make adequate functional allotment among marine terminal under the umbrella of Tanjung Priok Port so as to avoid duplicated port investment and to ensure smooth coordination with non-port related activities as a whole in the port field.
3) Development Directions of Marine Terminals under Tanjung Priok Port
The following development directions of marine terminals under Tanjung Priok Port have been proposed:
a. Sunda Kelapa Terminal in DKI Jakarta
It is recommendable to convert it to a recreation terminal with some marine museum to exhibit its history.
b. Bojonegara Terminal in Banten Province
The conversion of the terminal to a petroleum terminal and the usage of the existing berth for multi-purpose terminal are considered to be adequate to serve the west of Banten Province rather than to serve for Jakarta Metropolis taking account of the geographical location having a distance from there.
c. Marunda in DKI Jakarta, Marunda and Tarumajaya in Kabupaten Bekesi
These three potential terminals will be suitable to be set up as shallow terminals rather than deep-sea terminals. They are expected to serve for barges having a sea-transport network involving Tanjung Priok Terminal.
As to dry bulk cargoes such as coal and sand, these potential terminals are expected to alleviate the current congestion in Tanjung Priok Terminal by receiving the cargoes. As to containers, it is considered that to transport containers by barge between Tanjung Priok Terminal and these potential shallow terminals could be viable by taking account of serious road congestion in the JABODETABEK area. Needless to say, it is essential to develop road network behind their hinterland as a precondition of these shallow terminal development.

MASTER PLAN STUDY ON PORT DEVELOPMENT AND LOGISTICS IN GREATER JAKARTA METROPOLITAN AREA (JIC) FINAL REPORT
96
(4) Port-Related Waters Area Use Plan of Tanjung Priok Port
1) Waters Area Use Plan in Jakarta Bay
Port-related waters use plan in Jakarta Bay has been drafted based on the development plan of Tanjung Priok Terminal and taking account of the three potential public terminals along the coast of Marunda and Tarumajaya as shown in Figure 4.9-2.
When drafting the waters use plan, the harmonization with JABODETABEK spatial plan based on the Presidential Regulation No 54/2008 has been considered.

MASTER PLAN STUDY ON PORT DEVELOPMENT AND LOGISTICS IN GREATER JAKARTA METROPOLITAN AREA (JIC) FINAL REPORT
97
Source: Made by the Study Team
Figure 4.9-2 Port-Related Waters Area Use Plan in Jakarta Bay
-7 m
-1 m
-2 m
-3 m
-4 m
-5 m
-6 m
-7 m
-8 m
-8 m
-7 m
-6 m
-5 m
-4 m
-3 m
-2 m
-5 m
-5 m
-6 m
-6 m
-6 m
-6 m
-6 m
-6 m
-2 m
-8 m
-8 m -8
m-8 m
-5 m
-5 m
-12m
-10m
-11m
-12m
-12m -12m -1
2m
-10m
-10m
-10m-10m
-10m-10m
-10m
-10m
-11m-11m
-11m
-11m
-11m
-10m
JL. S
TA
SIU
N T
AN
JUN
G P
RIO
K
JL. PENJALAI
JL.
LA
KS
. R
E M
AR
TAD
INA
TA
J L. P
ELA
BUH
AN
RA
YA
JL. PANAITAN
JL. PADAMARANG
JL. A
NG
IN P
RAH
ARA
STA.
KER
ETA
API
PT P
ELI
ND
O I
I
KO
MP
LE
KT
NI-
AL
KO
MP
LE
KA
IRU
D
PERTAMINA
4.5h
a5.
8ha
0' 0
'' L
S
933
1000
5'0'
'
4'0'
'
3'30
''
3'0'
'
P
-18m
-20m
-15m
-20m
-10m
-10m
-5m
K. B
aru
K. Pal
S. Mati
Ci
Kar
ang
S. T
awar
S
S. Tiram
K. Cakun
2
2
2
1
1 1
1
1
1
4
1
1
3
2
1 1
1
2
1
2
3
2
1
2
1 2
3 1
1
1
1
2
2
2 2
2
2
2
2
2
2
2
1
1
1
1
3 2
2
1
1
2
1
2
3
2
1
2
2
1
1
2
2
1
2
2
2
1
2
2
Pela
buh
an M
arun
da
SE
GA
RA
JAY
A
PA
NT
AIH
AR
AP
AN
JAY
A
PA
NT
AIM
EK
AR
DE
SA
PA
NT
AIS
ED
ER
HA
NA
DE
SA
DE
SA
DE
SA
HU
RIP
JAY
A
DE
SA
DE
SA
PA
NT
AIM
AK
MU
R
DE
SA
SE
GA
RA
MA
KM
UR
KE
LU
RA
HA
N M
AR
UN
DA
BA
BE
LA
N
KE
CA
MA
TA
N M
UA
RA
GE
MB
ON
G
KE
CA
MA
TA
N
KE
C.C
ILIN
CIN
G
KA
BU
PAT
EN
BEK
ASI
Mua
rape
cah
Mua
rage
mbo
ng
Ceg
er
Pan
taim
akm
ur
Mu
arat
awar
Sun
gaita
war
Ben
dung
an
Pal
ama
Bul
ak
Tan
ahba
ru
Tew
el
Kep
u
Bul
aktu
ri
Dem
pul
Ble
nco
ngP
onco
l
Mar
unda
pulo
Bid
ara
Bam
buku
ning
B
ulak
cab
e
Keb
ante
nan
Keb
onke
lapa
Lan
geng
ong
TB
TB
TBTB
TB
TB
TB
TB
TB
TB
TB
TB
TB
TB
TB
TB
TB
TB
TB
TB
TB
TB
TB
TB
TB
RW
RW
RW
RW
RW
AT
AT
AT
AT
AT
AT
AT
AT
AT
AT
AT
AT
AT
AT
AT
AT
AT
AT
ATAT
AT
AT
AT
AT
AT
AT
AT
AT
AT
AT
AT
AT
S
P
P
S
P
P
P
P
P
P
P
P
P
P
P
TB
S
S
S
R
R
R
RW
TB
TB
TB
TB
TB
TBT
B
TB
TB
TB
R
R R
R
R
R
R
R
S
S
S
S
S
S
S
S
S
S
P
P
R
R
P P
P
P
P
P
P
P
P
P
P
P
P
RW BB
R
R
R
P
R
P
R
R
P
P
P
R
R
R
P
P
P
P
P
P
S
S
S
S
P
P
P
P
P
P P
P
P
R
R
R
R
R
P
S
R
AT
R
AL
R
S
P
P
S
BB
BB
BB
HR
HR
HR
HR
HR
HR
HR
R
R
R
R
R
R
R
R
R
R
R
R
R
R
R
R
R
R
R
R
R
R
R
R
R
R
R
R
R
R
R
R
R
R
R
R
R
R
R
R R
R
R
R
R
R
R
R
R
R
R
R
R
R
R
R
R
R
R
R
R
R
R
R
R
R
R
R
S
S
S
S
S
S
S
S
S
S
S
S
S
S
S
S
S
S
S
S
S
S
S
S
S
S
S
S
S
S
S
S
S
S
S
S
S
S
S
S
S
S
S
S
S
AP
P
P
P
P
P
P
P
P
P
P
P
P
P
P
P
P
P P
P
P
P
P
P
P
P
P
P
P
P
P
P
P P
P
P
P P
P
P
P
P
P
P
P
P
P
P
P P
P
P P
P
P
P
P
P
P
P
P
P
P
P
P
P
P
P
P
P
P
P P
P
P
P
P
P
P
P
P
P
P
P
P
P
P
P
P
P P
P
P P
P
P
P
P
P
P
P
P
P
P
P
P
P
P
P
P P
P
P
P
P
P P
P
P
P
P
P
P
P
P
P
P
P
P
P
P
P
P
P
P
P
P
P
P
P
P
P
P
P
P
P
P
P
P
P
P
P
P
P
P P
P
P
P
P
P
P
P
P
P
P
P P
P
P
P
P
P
P
P
GD
GD
GD
GD
GD
GD
GD
GD
GD
GD
GD
GD
GD
GD
GD
GD
GD
GD
GD
GD
GD
GD G
D
GD
GD
GD
GD
GD
GD
GDGD
GD
GD
GD
GD
GD
GD
GD
GD
GD
GD
GD
GD
GD
GD
GD
GD
GD
GD
GD
GD
GD
GD
GD GD
GD
GD
GD GD
GD
GD
GD
GD
PLT
GU
MU
AR
A T
AWAR
MUARA
PAN
TAIM
EKA
R D
ESA
Mua
rage
mbo
ng
6
‹06'
11.0
4000
"S
106‹58'43.87390"E
720000 E
6
‹00'4
5.5
6859
"S
R3000m
Port Access Bridge
Mar
und a
i n D
KI
Of f
Ma r
u nd a
Cen
ter
Tar
umaj
aya
in B
eke s
i
2 nd
Out
er R
ing
Roa
d (J
OR
R)
O640m
1 02m
Bas
in -
15.5
m
Submerged Breakwater
Dra
inag
e O
utle
tr
Co n
tain
er B
erth
L =
1,2
00m
(15.
5m)
Inner Channel (-15.5m)
199m
West Access Channel (-15.5m)
407m
629mP
etro
leum
Ber
th L
=1,
080m
(-1
5.5m
)
255m
Bas
i n -
15.5
m
Con
tain
er T
erm
inal
(
Ph a
se I
)P
etro
leum
Ter
min
al
(109
ha)
(77
ha)
3,53
5m
Bul
k B
e rth
L=
915m
(-1
5.5 m
)
O460m
Bul
k T
erm
inal
(1 8
ha)
Lo n
g-T
erm
Spa
ce f
or R
ecla
imed
t Lan
d
Lon
g-T
e rm
Spa
ce f
o r B
asin
s
Conventional Cargo Terminal
Conventional Cargo Terminal
Car
Ber
th L
=46 0
m (
-11
m)
Domestic Container terminal
Conventional Cargo Terminal
-5-5
-6
-6
-6
-15m
Anc
hora
ge f
o r Q
uara
ntin
e
An c
hora
ge f
or B
arge
s an
d T
ugbo
ats
Anc
hora
g e f
or C
omm
erci
al S
hip s
Anc
hora
ge f
or P
etyr
oleu
m T
anke
rs
Long-Term Space for Anchorage
Long-Term Space for Access Channel
Anchorage for Hazardous C
argo Ships
Boundary for Non-anchorage
Anc
hora
ge
Sub
- mer
ged
Pip
elin
eS
MB
Sub-
mer
ged
Pipe
line
Wat
ers
Are
a fo
r S
u ppo
rtin
g A
c tiv
itie
s of
Cos
tal T
erm
i nal
s
20m

MASTER PLAN STUDY ON PORT DEVELOPMENT AND LOGISTICS IN GREATER JAKARTA METROPOLITAN AREA (JIC) FINAL REPORT
98
Waters Area Use Plan off Karawan Coast
Port-related waters use plan off Karawan Coast in the vicinity of the planned new container terminal at Cilamaya is shown in Figure 4.9-3.
Figure 4.9-3 Port-Related Waters Area Use Plan in Karawan Coast
As to the harmonization with the spatial plans of local governments containing those of the West Java Province and Regency of Karawan, any waters use plans have not been made.
On the other hand, waters area in front of “Zone of Protected Forest” designated by the Ministry of Forestry corresponding to Zone N1 in case of JABODETABEK spatial plan in the range of several hundred meters, development activities are prohibited in principle. On the coast in the vicinity of Cilamaya Terminal “Zone of Protected Forest” is not designated.
According to the regulation stipulated by DGST, port-related activities such as installation of access channel and anchorage, at least one km needs to be kept from submerged pipelines of oil and gas. The regulation has been taken into account when drafting the waters area use plan of off Cilamaya Terminal.

MASTER PLAN STUDY ON PORT DEVELOPMENT AND LOGISTICS IN GREATER JAKARTA METROPOLITAN AREA (JICA) FINAL REPORT
99
5. PRELIMINARY DESIGN, COST ESTIMATE AND DEVELOPMENT SCHEDULE
5.1 New Container Terminal Development
(1) Breakwater Construction
1) Design Criteria for Breakwater
Harbour Calmness Analysis for Breakwater Layout Determination
Breakwater layouts are designed so that the probability percentage of non-exceeding occurrences of the threshold wave height for cargo handling for basins in front of mooring facilities shall be achieved for 97.5% or more of the days of the year. The threshold wave height is determined as 0.5m considering reference values of threshold wave height for cargo handling works not affected by swell, or long period waves. For verification of the above mentioned conditions inside the harbour, harbour calmness analysis is conducted for ordinary wave conditions.
Design Waves for Breakwater Design
For verification of the structure's stability, analysis is based on 100-year return period waves (defined as low-occurrence waves). Design deepwater waves off Tanjung Priok were estimated based on the yearly peak waves of 22 years of data from 1980 to 2001. Wave transformation during the propagation of waves as they move from deepwater off Tanjung Priok toward the proposed location of the breakwater construction is calculated using the Energy Balance Equation Model Method. Design waves are determined based on the extraction of the maximum waves near the breakwater to be designed.
For breakwater performance evaluations, 1-year return period waves (defined as high-occurrence waves) are employed. Design waves for this purpose are set by referring to the results of the JICA Study 2003.
Tides
Mean sea level at Tanjung Priok port is used to define Zero Level (MSL=0.0m) for planning and designing of roads and railways in this Project. However, for the port facilities, lowest low water level (LLWL) at Tanjung Priok port is defined as the Datum Level as follows. To avoid confusion, both elevations are described as follows.
HHWL (Highest high water level) + 1.05 m (0.57 m +MSL) MHWS (Mean high water spring) +0.91 m (MSL + 0.43 m) MSL (Mean sea level) +0.48 m (0.00 m) MLLWS (Mean low water spring) +0.09 m (MSL - 0.39 m) DL (Datum level) 0.00 m (MSL - 0.48 m) (Defined as DL = LLWL: Lowest low water level)
2) Estimation of the Design Deep water Waves at off Tanjung Priok
Base data
Wave data off Tanjung Priok are obtained by SMB method based on the five (5) year wind information during 1997 to 2001 observed at Cengkareng Meteorological Station of BMKG (Badan Meteorologi Klimatologi dan Geofisika).
Yearly peak waves off Tanjung Priok

MASTER PLAN STUDY ON PORT DEVELOPMENT AND LOGISTICS IN GREATER JAKARTA METROPOLITAN AREA (JICA) FINAL REPORT
100
The extreme high deep water waves off Tanjung Priok port are estimated based on the existing information of yearly peak waves for the 18 years from 1980 to 1997 (1980-1997; wave hindcast by ITB, July 2000) and hindcast data from 1997 to 2001 which was estimated in the Study for Development of the Greater Jakarta Metropolitan Ports, December 2003 (hereinafter called “the 2003 JICA Study”).
Design Deepwater Waves off Tanjung Priok
a. Low-occurrence waves
Considering the 50 year life time of the facilities and less than 40% encounter probability, the following 100-year return period waves are chosen for the design deepwater waves off Tanjung Priok.
Table 5.1-1 Design Deepwater Waves (100 year return period) Direction
Wave
Height (m) 2.84 3.56 3.32 3.11 4.13 4.24Period (s) 6.48 8.73 8.70 6.46 10.47 11.01
W NW N NE E Max
b. High-occurrence waves
Referring to the results of the JICA Study 2003, the following 1 year return period waves are given as the high occurrence design wave.
Table 5.1-2 Design Deepwater Waves (High Occurrence, 1 year return period)
Direction
Wave
Height (m) 1.78 1.98 1.68 1.45 1.70Period (s) 5.92 6.30 5.96 5.59 6.04
W NW N NE E
3) Harbour Calmness Analysis
Analysis method
Wave transformation as they move from deep water off Tanjung Priok to the port entrance at each candidate site is calculated by the Energy Balance Equation Model Method, and calmness analysis inside the harbour is calculated by Takayama’s Method.
Calmness is evaluated in front of berths, turning and port basins, port entrance and the access channel about 1km off the port entrance.
Harbor Calmness of North Kalibaru in Tanjung Priok
Alternative-1
For Alternative-1 development plan the following two cases of analysis are considered.
Case 1: after completion of Phase 1 and 2 Case 2: after completion of Phase 3
Based on the results in Table 5.1.3(1), the harbour area is sufficiently calm through the year as shown in the following table. Therefore, the breakwater layout is sufficient.
Alternative-2
Calmness Analysis for Alternative-2 is conducted for the following three cases.
Case 1: after completion of Phase 1 Case 2: after completion of Phase 2

MASTER PLAN STUDY ON PORT DEVELOPMENT AND LOGISTICS IN GREATER JAKARTA METROPOLITAN AREA (JICA) FINAL REPORT
101
Case-3 after completion of Phase 3
Calculation results are as shown in Table 5.1-3 (2). Harbour area is sufficiently calm through the year. Breakwater layout is sufficient.
Alternative-3
Calmness Analysis for Alternative-3 is represented by the results of Alternative-1 since the port layout is similar to Alternative-1.
Table 5.1-3 Summary of Non-exceeding Percentage of 0.5 m Height Waves
(1) North Kalibaru New Terminal (Alternative-1) Location Non-exceeding Percentage Phase 1 & 2 Quay No.1 100% ≧ 97.50%
Quay No.2 100% ≧ 97.50% Turning Basin No.1 100% ≧ 97.50% Turning Basin No.2 100% ≧ 97.50% Port Entrance 95.0% Access channel 1km off
95.4%
Phase 3
Quay No.3 98.5% ≧ 97.50% Quay No.4 99.6% ≧ 97.50% Port Basin 99.5% ≧ 97.50% Port Entrance No.1 94.6% Port Entrance No.2 93.7%
Access channel 1km off
94.8%
(2) North Kalibaru New Terminal (Alternative-2) Location Non-exceeding Percentage Phase 1 Quay No.1 100% ≧ 97.50%
Port Basin 100% ≧ 97.50% Port Entrance No.1 94.0%
Phase 2 Quay No.1 98.6% ≧ 97.50% Quay No.2 98.6% ≧ 97.50% Quay No.3 98.5% ≧ 97.50% Port Basin 99.5% ≧ 97.50% Port Entrance No.1 94.4%
Phase 3 Quay No. 3 98.8% ≧ 97.50% Quay No. 4 100% ≧ 97.50% Quay No. 5 99.9% ≧ 97.50% Port Basin 100% ≧ 97.50%
Harbour Calmness of Cilamaya Terminal
Calmness analysis is conducted taking into account the new terminal layout plan. Inside of the harbour is sufficiently calm according to the results as shown in Table 5.1-4 below.

MASTER PLAN STUDY ON PORT DEVELOPMENT AND LOGISTICS IN GREATER JAKARTA METROPOLITAN AREA (JICA) FINAL REPORT
102
Table 5.1-4 Summary of Non-exceeding Percentage of 0.5 m Height Waves
Location Non-exceeding Percentage Quay No.1 97.50% ≧ 97.50%Quay No.2-1 97.60% ≧ 97.50%Quay No.2-2 97.60% ≧ 97.50%Quay No.3 98.40% ≧ 97.50%Quay No.4 97.80% ≧ 97.50%Quay No.5-1 97.60% ≧ 97.50%Quay No.5-2 98.00% ≧ 97.50%Quay No.6 99.50% ≧ 97.50%Quay No.7 98.00% ≧ 97.50%Access channel 1km off 92.30% Port Entrance 93.10% Turning Basin No.1 97.40% Turning Basin No.2 98.20%
Harbour Calmness of Tangerang Terminal
Inside of the harbour is sufficiently calm according to the results of calmness analysis as shown in Table 5.1-5.
Table 5.1-5 Summary of Non-exceeding Percentage of 0.5 m Height Waves
Location Non-exceeding Percentage Quay No.1 97.60% ≧ 97.50%Quay No.2 98.40% ≧ 97.50%Quay No.3 97.80% ≧ 97.50%Quay No.4 98.60% ≧ 97.50%Quay No.5 98.10% ≧ 97.50%Revetment No.1 97.60% Revetment No.2 97.30% Access channel 1km off 94.70% Port Entrance 94.70% Turning Basin No.1 97.20% Turning Basin No.1 98.30%
4) Breakwater Design for Low and High Occurrence Design Waves
Design Waves at Each Site
Extraction of Maximum Waves in front of the Breakwater
Equivalent deepwater waves at each site are estimated by the wave transformation of deepwater waves off Tanjung Priok as they move toward the shallow water area at the new terminal candidate site. Wave transformation by refraction and shoaling effect due to bathymetry is calculated by the Energy Balance Equation Model. Design waves are determined by the extractions of maximum waves in front of the new terminal facilities to be designed at each site.
Design waves for north seawall to be constructed in Phase 1 and 2 Development in North Kalibaru

MASTER PLAN STUDY ON PORT DEVELOPMENT AND LOGISTICS IN GREATER JAKARTA METROPOLITAN AREA (JICA) FINAL REPORT
103
It is decided that the design waves chosen for Dam Tenggah breakwater rehabilitation be applied for the north seawall design.
Design waves for east breakwater planned in Alternative-2
For the design of the land side east breakwater in Alternative-2, the same design wave (low occurrence higher wave) was chosen as the one chosen for the Dam Tengah breakwater rehabilitation under the Urgent Rehabilitation Project.
Summary of design waves for breakwater design
Low-occurrence design waves for verification of structural stability are as follows.
Table 5.1-6 Low-occurrence Design Waves
Site Wave Height (m) Wave Period
Tanjung Priok (other than north seawall) 3.7 8.8 Tanjung Priok (for west breakwater Alt.2) 2.5 7.5 Cilamaya 2.8 8.7 Tangerang (for N and E side breakwater) 2.1 8.8 Tangerang (for West side breakwater) 1.1 6.5
High-occurrence design waves for performance evaluation such as estimation of over-topping
wave amounts and calculation of transmitted wave height are as follows.
Table 5.1-7 High-occurrence Design Waves
Site Wave Height (m) Wave Period
Tanjung Priok (other than north seawall) 2.0 6.3 Tanjung Priok (north seawall) 1.5 6.0 Cilamaya 2.0 6.3 Tangerang (for N and E side breakwater) 2.0 6.3 Tangerang (for West side breakwater) 1.0 6.3
At North Kalibaru Area
Considering the 2003 JICA Study and sections determined based on the comparison study on the Urgent Rehabilitation Project of Tanjung Priok Port, rubble mound slope type breakwater is applied.
The crown height is set as DL +3.50m which is 0.6 times higher than the significant wave height (H1/3). Estimated over-topping wave rate is smaller than 0.01 m3/m/s.
Required mass of armour is determined by Huddson’s formula. Wave height inside of the breakwater is assumed using the refraction coefficient of Kr= 0.6. Necessary armour weight is reduced considering the approximately 60 degree wave incident angle to the east and west breakwaters. Armour types of the breakwaters are summarized in the Table below.
Table 5.1-8 Summary of Breakwater Armour Layers
Type Sea Side Armour Harbor Side Armour Location A Tetrapod 6.3t type Concrete Cube 0.9m North Breakwater B Tetrapod 3.2t type Concrete Cube 0.7m West & East Breakwaters C Tetrapod 2.0t type Concrete Cube 0.7m West Breakwater (Alt.2)

MASTER PLAN STUDY ON PORT DEVELOPMENT AND LOGISTICS IN GREATER JAKARTA METROPOLITAN AREA (JICA) FINAL REPORT
104
For the layer under the armour material, rubble stones are used which are approximately 1/10 to 1/15 of the armour unit weight or more.
Coping concrete is provided to reduce the transmitted wave height behind the breakwater. Provision must be made to prevent sliding and overturning of the coping concrete from the wave pressure that acts on the concrete. The estimated transmitted wave is less than 0.5m which is the threshold wave height for cargo handling operations.
Silt and clay (fine materials) are deposited under the seabed in a layer about 8 to 10 m thickness, therefore, the unsuitable materials are to be improved by PVD and the upper part of the drain is to be replaced with sand considering the settlement of the under layer of fine materials. Typical sections of breakwaters are as shown in Figure 5.1-1.
Figure 5.1-1 Typical Section of Breakwater in North Kalibaru New Terminal
At Cilamaya Area
Structure type and design method is the same as the North Kalibaru terminal. Type and size of armour materials are as summarized in Table 5.1-9. A layer of loose materials of about 5 m thickness lies under the seabed and must be improved by PVD. Typical section of the breakwater is as shown in Figure 5.1-2.
Table 5.1-9 Summary of Breakwater Armour Layers
Type Sea Side Armour Harbor Side Armour Location A Tetrapod 3.2t type Concrete Cube 0.7m North Breakwater B Concrete Cube 0.9m Concrete Cube 0.5m West & East Breakwaters

MASTER PLAN STUDY ON PORT DEVELOPMENT AND LOGISTICS IN GREATER JAKARTA METROPOLITAN AREA (JICA) FINAL REPORT
105
Figure 5.1-2 Typical Section of Breakwater in Cilamaya New Terminal
At Tangerang Area
Structure type and design method is the same as North Kalibaru and Cilamaya terminal. Crown height is D.L.+3.0m, which is +0.5m higher than the elevation of 0.6 times the significant wave height (H1/3), DL +2.5, since over topping rate is more than the 0.01 m3/m/s.
Type and size of armour materials are as summarized in Table 5.1-10. A layer of loose materials of about 5 m thickness lies under the seabed and must be improved by PVD. Typical section of the breakwater is as shown in Figure 5.1-3.
Table 5.1-10 Summary of Breakwater Armour Layers
Type Sea Side Armour Harbor Side Armour Location A Tetrapod 2.0t type Concrete Cube 0.7m Other than West BreakwaterB Concrete Cube 0.7m Concrete Cube 0.7m West Breakwater
Figure 5.1-3 Typical Section of Breakwater in Tangerang New Terminal
MASTER PLAN STUDY ON PORT DEVELOPMENT AND LOGISTICS IN GREATER JAKARTA METROPOLITAN AREA (JICA) FINAL REPORT
106
(2) New Container Terminal Development at North Kalibaru
1) Requirement of Existing Access Channel and Turning Basin Improvement
Nautical and Operational Aspects of Existing Port
The near-shore waves off the Terminal at North Kalibaru are comparatively mild throughout the year. The predominant directions of waves to the terminals are in the range of 310 degrees N to 30 degrees N.
The existing breakwaters protect the Terminals against those waves, except in its eastern part, where parts of the breakwater are almost submerged during high tides due to settlement/collapse of the structure. The currents in and around the Terminals entrance are rather weak, resulting in no significant maneuvering problem for incoming/outgoing ships.
The Terminals of Tanjung Priok has two entrances, which are a western entrance and an eastern entrance. The eastern entrance is heavily silted and very shallow (around -5 m) and only small ships like fishing boats and tug boats are using for sailing in and out.
The western entrance with the water depth of 14 m and the channel width of 150 m serves as a main entrance of the Terminals of Tanjung Priok. Through the western entrance two ways traffic is permitted to vessels shorter than 150 m in LOA equivalent to 15.000 DWT in size.
In principle less than 300m in LOA is allowed to enter the Tanjung Priok Terminals. However, the maximum ship size ever recorded to call in the Port was 325 m in LOA.
The present outer and inner channels are planned to be improved by widening to 300m and deepening to -14.0m for allowing two way traffic of 50,000 DWT under the Urgent Rehabilitation Project of Tanjung Priok Port (URPT) by JICA finance (Ex-JBIC).
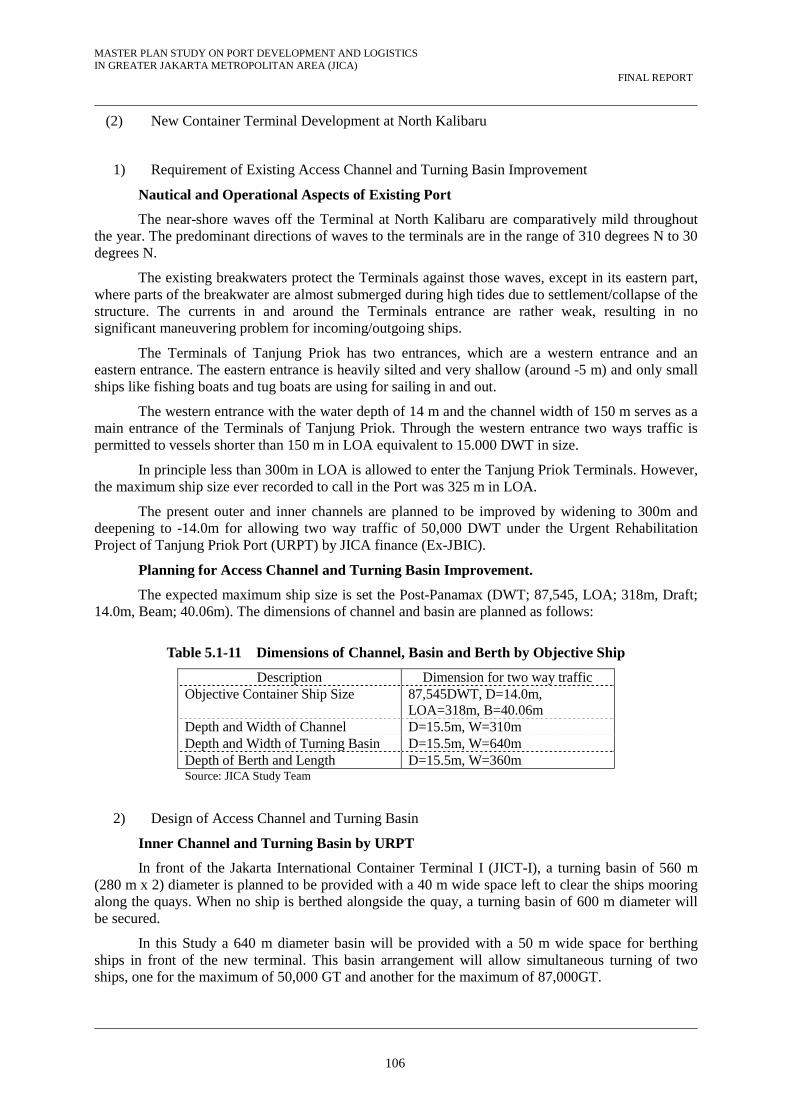
Planning for Access Channel and Turning Basin Improvement.
The expected maximum ship size is set the Post-Panamax (DWT; 87,545, LOA; 318m, Draft; 14.0m, Beam; 40.06m). The dimensions of channel and basin are planned as follows:
Table 5.1-11 Dimensions of Channel, Basin and Berth by Objective Ship
Description Dimension for two way traffic Objective Container Ship Size 87,545DWT, D=14.0m,
LOA=318m, B=40.06m Depth and Width of Channel D=15.5m, W=310m Depth and Width of Turning Basin D=15.5m, W=640m Depth of Berth and Length D=15.5m, W=360m Source: JICA Study Team
2) Design of Access Channel and Turning Basin
Inner Channel and Turning Basin by URPT
In front of the Jakarta International Container Terminal I (JICT-I), a turning basin of 560 m (280 m x 2) diameter is planned to be provided with a 40 m wide space left to clear the ships mooring along the quays. When no ship is berthed alongside the quay, a turning basin of 600 m diameter will be secured.
In this Study a 640 m diameter basin will be provided with a 50 m wide space for berthing ships in front of the new terminal. This basin arrangement will allow simultaneous turning of two ships, one for the maximum of 50,000 GT and another for the maximum of 87,000GT.

MASTER PLAN STUDY ON PORT DEVELOPMENT AND LOGISTICS IN GREATER JAKARTA METROPOLITAN AREA (JICA) FINAL REPORT
107
It is proposed that the remaining portion of the existing breakwater “Dam CITRA” which is located about 330m away from face line of JICT be removed for securing 740m (Turning basin 640m + 50m of berthing area on both sides) between the berth of JICT/KOJA and the new terminal berth.
3) Scope of Access Channel and Turning Basin Improvement Works
Dredging Requirements for Navigation Channel
The dredging requirement is calculated by the water depth at -15.5 m at the channel and turning basin and side slope to be 1 to 5.
The net volume of dredging requirements for the long term plan is summarized in Table below.
Table 5.1-12 Dredging Volume Requirement in Long Term Plan
Location Design Depth Dredging Volume (m3) Phase 1 Phase 2 Phase 3
Total Volume -15.5 m 16,184,400 2,134,400 19,701,300 Source: JICA Study Team
Length of breakwater, seawall and revetment for New Terminal for Phase 1
Table 5.1-13 Planned length of New Breakwater, Seawall & Revetment
Location Length West and East sides of reclamation 1,200mNorth side of reclamation land 1,320 mDam Citra re-named as New Dam CITRA breakwater 633 mTotal length to be constructed as Phase 1 3,609.8mSource: JICA Study Team Removal of the portion of Dam Citra Left over under URPT
The existing breakwater with a length of 1,548 m is planned to be removed under URPT for widening the turning basin and inner channel and deepening from 12m to 14.0m. A new Dam Tengah breakwater will be constructed opposite of JICT.
The temporary breakwater about 314m for closing the gap between the new Dam Tengah and existing Dam Citra is planned. Under the proposed project it is recommends that this temporary breakwater be extended in the east direction perpendicular from the new Dam Tengah 1 alignment to obtain the clear water way along the berths of new container terminals.
Demolish Existing Remaining Breakwater for New Terminal
The length of about 3,268 m, which is the remaining portion of the existing breakwater will be removed for widening and deepening the water way from JICT/KOJA terminals for the new terminal. These materials are planned to be recycled for use in the construction of a revetment/seawall.

MASTER PLAN STUDY ON PORT DEVELOPMENT AND LOGISTICS IN GREATER JAKARTA METROPOLITAN AREA (JICA) FINAL REPORT
108
Table 5.1-14 Plan of Demolish of Existing Breakwater and Recycle
Removal Breakwater
Present Location
Length of removal
Recycled place after demolish
Dam CITRA In front of KOJA Terminal
1,548m Material of 1,148m length will be recycled for construction of new breakwater “New DAM CITRA”
Dam PERTAMINA East
Car Terminal area
713m Material removed will be recycled for construction of revetment /seawall
Dam PERTAMINA West
Products Terminal area
1,007m* Material removed will be recycled for construction of revetment/seawall.
Total length of Breakwater to Remove
3,268m Total required length of revetment/seawall is estimated about 2,450 m.
Source: JICA Study Team
New Berth Alignment with co-existence of New Dam Tengah 1 Breakwater
The berth alignment of new container terminal is planned about 50m from the edge of the concrete head of the breakwater in the water area, so that in future the newly constructed breakwater by URPT will be utilized by forming parts of retaining wall of the reclamation of the new container terminal.
Construction of breakwater for the long term development plan
Long term development of Tg Priok Terminal under the Alternative 1 case is planned toward the off shore beyond the Phase I container terminal. In order to protect the Terminal facilities it is planned that a new breakwater is constructed for Phase 3 development at the depth of around 10 m and distance of about 3.6-4.0km away from the existing berthing facilities of JICT/KOJA.
Construction of new breakwater for Urgent Terminal Development at North Kalibaru
The existing breakwater in front of the JICT/KOJA is planned to be demolished and a new breakwater named New Dam Tengah under URPT will be constructed to protect the existing port facilities and cargo handling operation along the berth of JICT/KOJA.
The new breakwater is planned to be constructed at the depth of around 4 m and distance of about 640m away between the planned new off shore container terminal and New Dam Tengah breakwater of URPT under the Phase 1 Project of North Kalibaru development Project.
The design wave has been determined as follows;.
- The high-frequency design wave; H1/3 = 1.5 m, T = 6.0s, Direction of Incident Wave: North (1 year return)
- The low frequency design wave: H1/3 =:2.5 m, T = 7.5s, Direction of Incident Wave: North (50 years return)
Considering the soil conditions at North Kalibaru area and to minimize environmental impacts, the rubble mound type with PVD for improvement of soft soil foundation is planned.
4) Preliminary Design of Quay wall Structure
Design Criteria
The adopted design criteria for design of container terminal facilities are as follows.
Objective Ship Size
The same type of container ship will use the Cilamaya new terminal and Tangerang new terminal.

MASTER PLAN STUDY ON PORT DEVELOPMENT AND LOGISTICS IN GREATER JAKARTA METROPOLITAN AREA (JICA) FINAL REPORT
109
Tide, Current and Wave Conditions and Design Wind
The tide level, current, and design wind of Tanjung Priok Terminal are summarized below.
Table 5.1-15 Tide, Current and Wave Conditions of Tanjung Priok Terminal
Tanjung Priok Port Tide (cm)1 High Water Level (HWL) +91.00 Mean Sea Level (MSL) +48.00 Design Low Tide Level (DLT) 0.0 Current (m/sec)2 Maximum velocity 0.50 Wave at Berth, Significant Wave Height H1/3(m) 0.50 m Significant Wave Period T1/3 Less than 2 sec Wave at Revetment Design Wave Height (m) Design Wave Period (sec) Wave at Breakwater
1.5 m
Less than 2 sec
Significant Wave Height H1/3 (m) 3.0m Significant Wave Period T1/3 Around 8 sec Source 1,2: Dinas Hidro-Oseanografi, Indonesia
Subsoil Condition
The soil investigation at the planned site of the new container terminal at North Kalibaru was carried out in November/December 2010. The preliminary design is carried out by the following soil data obtained.
Borehole No.3 at the Noth Kalibaru for new berthing area
-5.0 m Silty Clay N = 0, = 0
-13.0 m Sandy Silt N= 6 – 38, γt = 1.53 tf/m3, γ’ = 0.53 tf/m3
-24.0 m Silty Clay, N = 38 - 52 c = 30 kPa, = 30°, ’ = 0.9 tf/m3
-30.0 m Dense to very dense sand N = more than 50 c = 0 kPa, = 35°, ’ = 1.5 tf/m3
Crown Height
The crown height of the berth is set as follows.
HWL + 2.0 m + H1/3 = + 3.5 m
This crown height of the quay wall is applied for the case of Cilamaya and Tangerang new terminal facilities.
Seismic Coefficient
The seismic coefficient for the proposed port facility and access road structure at North Kalibaru area are computed as follow:
Kh = K x C x I = 1.0 x 0.05 x 1.5 = 0.075
Kv = not considered = 0

MASTER PLAN STUDY ON PORT DEVELOPMENT AND LOGISTICS IN GREATER JAKARTA METROPOLITAN AREA (JICA) FINAL REPORT
110
It is therefore recommended to adopt 0.1 for Kh for the Port facilities. This seismic coefficient is applied for preliminary design of Cilamaya and Tangerang facilities.
Loads on the Wharf
Quay wall structure of container terminal is designed to sustain quay container cranes. The berth dimension for objective ship is set as Length 360m, Depth -15.5m DL Crown height +3.50 DL. The following loads of container cranes is taken
Quay crane Rail Gauge : 30 m Overall Weight : approximately: 1,300 tf/unit Nominal rated capacity: 41 tf under spreader Live load and load conditions of QGC (Quay Gantry Crane); 35 kN/m2 Live load of container yards and Road in the terminal; 45 kN/m2
The following wheel loads are considered:
Standard Truck (H22 - 44) : 8.0 tf/wheel Tractor Trailer (40’) : 5.8 tf/wheel
The above wheel load and live loads for preliminary design of the new terminal is also applied for Cilamaya and Tangerang.
Mooring Force and Fender System
Tractive force acting on mooring bitts is set at 100 tf per unit. The spacing is set at 30 m intervals under the assumption that the berthing speed of vessels with assistance is assumed to be 0.10 m/sec. The berthing angle to the face line is taken as 10 degrees. Reaction by fender is 157-160 ton, absorbing energy by fender is 95.85 t-m.
The above tractive and mooring forces are applied for the quay wall of 87,000 DWT in the new terminal of Cilamaya and Tangerang.
Selection of Suitable Type Quay wall Structure
The optimum type of quay wall structure is selected from 5 alternatives i.e. 1) Concrete Block type, 2) Caisson type, 3) Steel Sheet Pile type, 4) Steel Frame Structure type, 5) Concrete Deck on Open Steel Pipe Pile type by evaluating each type with the following aspects:
- Soil Conditions, Construction Materials, Construction Methods, Construction Period
- Experience on Similar Projects Maintenance Costs
The studied types of structure are commonly adopted for deep-water quay walls.
detailed comparison of the selected three structural types is analyzed and as a result of the comparison study, "Concrete deck on Steel Pipe Pile type" is considered suitable for the new container terminal at the three candidate sites
The particulars of quay wall are shown in the table below.

MASTER PLAN STUDY ON PORT DEVELOPMENT AND LOGISTICS IN GREATER JAKARTA METROPOLITAN AREA (JICA) FINAL REPORT
111
Table 5.1-16 Selected Type of Quay wall Structure for New Terminal at North Kalibaru Phase 1
Location North Kalibaru New Terminal in Tajung Priok Target Throughput 1,900,000 TEU Berth Length 1,200m Berth Water Depth CDL-15.5m Number of Berths for Urgent Plan 4 Target Vessel Size 87,545 DWT Quay wall Structure Concrete Deck on Open Steel Pipe Pile
Ø1200,t=20mm, driven up to - 32.50m DL (N-,50), with retaining wall by concrete blocks on top of
rubble mound Crown Height of Quay wall CD+3.50m Terminal Yard Length 600 m Quay Cranes and Yard Cranes 12 QGC + 32 RTG, 60 units of Yard Tractors Fender Rubber Fender 1150H, @12m Bollard 100 tons @ 30m Source: JICA Study Team
5) Container Yard Planning and Container Cargo Handling Equipment
Planned layout of the new container terminal at North Kalibaru Phase�consists of two (2) terminals having 600m length of berth each and 6 quay cranes and 4,100 ground slots at each terminal. The concept of one terminal layout is planned in terms of 2 berths (300m*2) by one terminal operator.
Required Number of Cargo handling Equipment
Design Condition of Handling Capacity by 1 berth (300m) and quantity of cargo handling equipment is set as follow.
Estimate Handling Capacity by 1 berth
Capacity (TEUs/Year・berth) 480,000 Av. Days of Stock 3.3
Stacking efficiency 0.75 Peak ratio 1.3
Feeder ratio 0.02 Yard Capacity(TEUs) 7,375
Tier 4 Calculated Ground slots(TEUs) 1,844
Cargo handling equipment per 1 terminal (600m)
QGC 6Yard tractor 36Yard chassis 38RTG 15Top lifter 3Forklift 5t 6Forklift 10t 6
Long term Planned Cargo Handling Equipment
The required cargo handling equipment for the new container terminal development at North Kalibaru is worked out below.
MASTER PLAN STUDY ON PORT DEVELOPMENT AND LOGISTICS IN GREATER JAKARTA METROPOLITAN AREA (JICA) FINAL REPORT
112
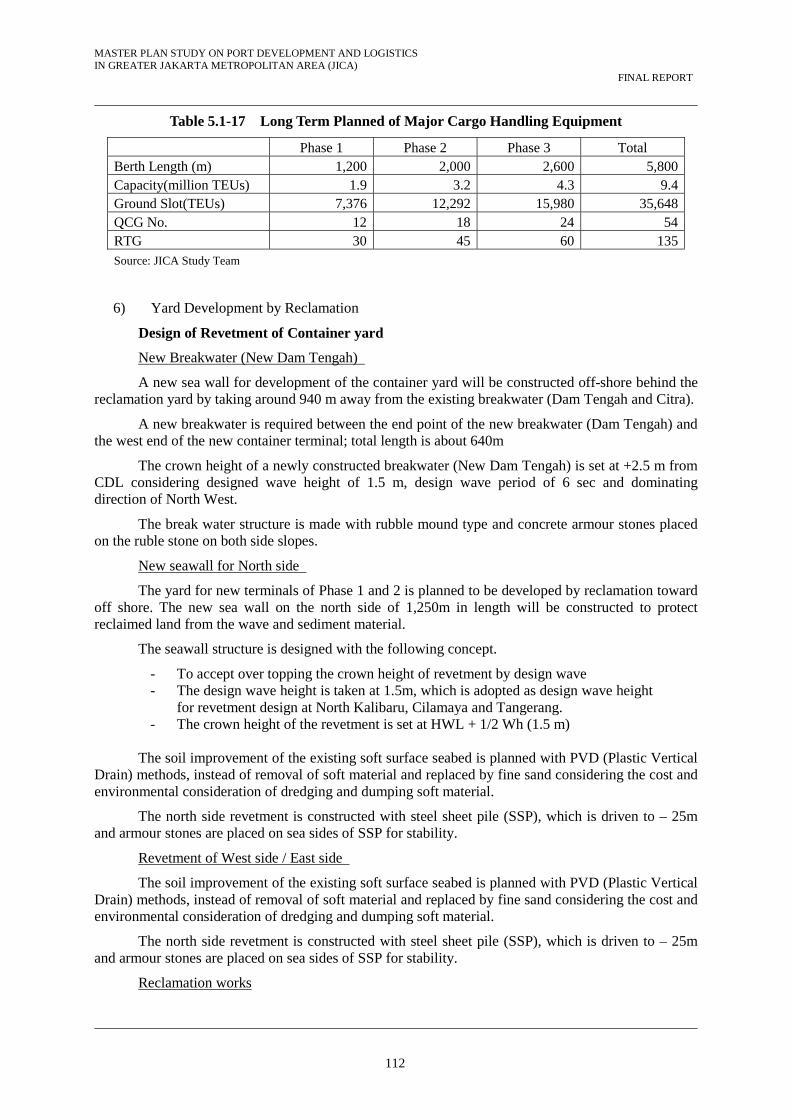
Table 5.1-17 Long Term Planned of Major Cargo Handling Equipment
Phase 1 Phase 2 Phase 3 Total Berth Length (m) 1,200 2,000 2,600 5,800Capacity(million TEUs) 1.9 3.2 4.3 9.4Ground Slot(TEUs) 7,376 12,292 15,980 35,648QCG No. 12 18 24 54RTG 30 45 60 135Source: JICA Study Team
6) Yard Development by Reclamation
Design of Revetment of Container yard
New Breakwater (New Dam Tengah)
A new sea wall for development of the container yard will be constructed off-shore behind the reclamation yard by taking around 940 m away from the existing breakwater (Dam Tengah and Citra).
A new breakwater is required between the end point of the new breakwater (Dam Tengah) and the west end of the new container terminal; total length is about 640m
The crown height of a newly constructed breakwater (New Dam Tengah) is set at +2.5 m from CDL considering designed wave height of 1.5 m, design wave period of 6 sec and dominating direction of North West.
The break water structure is made with rubble mound type and concrete armour stones placed on the ruble stone on both side slopes.
New seawall for North side
The yard for new terminals of Phase 1 and 2 is planned to be developed by reclamation toward off shore. The new sea wall on the north side of 1,250m in length will be constructed to protect reclaimed land from the wave and sediment material.
The seawall structure is designed with the following concept.
- To accept over topping the crown height of revetment by design wave - The design wave height is taken at 1.5m, which is adopted as design wave height
for revetment design at North Kalibaru, Cilamaya and Tangerang. - The crown height of the revetment is set at HWL + 1/2 Wh (1.5 m)
The soil improvement of the existing soft surface seabed is planned with PVD (Plastic Vertical
Drain) methods, instead of removal of soft material and replaced by fine sand considering the cost and environmental consideration of dredging and dumping soft material.
The north side revetment is constructed with steel sheet pile (SSP), which is driven to – 25m and armour stones are placed on sea sides of SSP for stability.
Revetment of West side / East side
The soil improvement of the existing soft surface seabed is planned with PVD (Plastic Vertical Drain) methods, instead of removal of soft material and replaced by fine sand considering the cost and environmental consideration of dredging and dumping soft material.
The north side revetment is constructed with steel sheet pile (SSP), which is driven to – 25m and armour stones are placed on sea sides of SSP for stability.
Reclamation works

MASTER PLAN STUDY ON PORT DEVELOPMENT AND LOGISTICS IN GREATER JAKARTA METROPOLITAN AREA (JICA) FINAL REPORT
113
Reclamation material will be brought in from the quarry around the project sites. The in fill materials are transported by dump trucks to the project site. The infill material should be filled from the existing sea bed up to +2.0 m from CDL. Average thickness of reclamation will be 6 to 7 m. The estimated volume for respective phases will be as follows. Average elevation of the planned yard is set at +3.5 m (MSL+3.0m).
Table 5.1-18 Reclamation Volume (m3) by Phases at North Kalibaru Development
Phase 1 Phase 2 Phase 3 Total Total (m3) 8,290,000 15,605,500 39,032,000 62,927,500 Source: JICA Study Team
Soil Improvement
The soil improvement for the reclamation area is considered necessary. Tentatively the PVD Method is considered at the foundation of stock yard, terminal inner roads and building areas.
During the reclamation works, the silt protector shall be placed in the water area in order to prevent the proliferation of water pollution.
Yard Pavement and Drainage in New Terminal Area
Pavement
Based on the operation planning of the yard, the pavement type to be adopted for the usage of respective areas is selected with drainage system. The designs of the pavement depending on the usage of terminal area are conducted
7) Road for Terminal Development
Access Road between Kalibaru Terminal and New Terminal
The access road is planned by extending from the Kalibaru Terminal by bridge on the sea water area to the west end of the reclaimed land of North Kalibaru. The construction of this access road shall be implemented at the same time as parts of the new terminal development works.
For the Phase 2 development, the access road is planned along the coastal area to connect from the North Kalibaru terminal to Tarmajaya in the Bekasi region through DKI Marunda terminal and Marunda Center terminal. This planned access road will function mainly as port oriented traffic services road by connecting from the Tanjung Priok Terminal to Karawan Industrial Region in the west Jakarta directly.
Terminal inner Road
The terminal related traffic from the western regions mainly enters and exits from the port area through the exclusive gate of a new container terminal, which is planned at the western end of the terminal yard, where the access road from Kalibaru Terminal area will be joined.
The terminal inner road in a new terminal is planned to have 3 lanes (2 lanes for through traffic and 1 lane for gate queue) surrounding the reclaimed land outside the container yards.
The terminal inner road is planned to have 12 m width for 3 lanes and concrete pavement (t=20cm) with gravel coarse foundation (t=30cm) to sustain the standard truck’s (H22-44) wheel load of 8.0 ton/wheel.
8) Utility Supply, Buildings, Environmental facilities and Security System Facilities
Water Supply
The water source should be from the main supply line of the public water of the Water Supply Works Department of the DKI.

MASTER PLAN STUDY ON PORT DEVELOPMENT AND LOGISTICS IN GREATER JAKARTA METROPOLITAN AREA (JICA) FINAL REPORT
114
Power Supply
Electric power demand for the container terminal is 15 MVA
The electric power requirement will be taken from the National Electric Cooperation (PLN). A standby generator set for emergency purposes will be installed.
Environmental Treatment Facilities
The following environmental treatment facilities are planned for the new container terminal.
- Drainage/sewerage outfall facilities - Solid wastes management facilities - Ballast and Bilge Waste Treatment System
Building works
All the buildings inside the container terminal, car terminal, passenger terminal and multipurpose berth will be designed in conformity with relevant national codes and standards, such as National Structural Code for Buildings, National Plumbing Code of the Indonesia, Indonesia Electrical Code, Fire Code of the Indonesia, etc.
Security System Facilities,
The security system facilities are designed so as to satisfactorily comply with SOLAS amendments and ISPS Code entered into force on 1st July 2004.
The cargo container X-ray inspection system, CCTV system, gate control and fences are considered to meet the requirements of SOLAS and ISPS code. The fences around the terminal area should be 8 feet high (= 2.44m) based on the requirements of SOLAS and ISPS.
(3) New Container Terminal Development at Cilamaya Site
1) Requirement of Access Channel and Turning Basin Development
Nautical and Operational Aspects of candidate site of new terminal
The near-shore waves off the planned new terminal are comparatively mild throughout the year. The predominant directions of waves to the shore at Cilamaya / Ciparage are north-east direction. Wave conditions at site are summarized as follows;
- The wave from west is sheltered geographically. - N & E waves are directly approach to the planned terminal area. - 95.9 % of the wave height at -10m depth is less than 0.5 m height.
The currents in and along the coast of planned area are rather weak, resulting in no significant
maneuvering problem for incoming/outgoing ships.
The seabed is very gentle slope and the contour lines are mostly parallel to the beach. The shore is stable, in which erosion and sedimentation are not observed. Distances of -10 m and -15 m depth are about 5 km and 10 km from the shoreline respectively. Seabed slope is about 1/500 up to about -10 m depth contour line, and between -10 m to -15 m is 1/1000. The area is muddy beach and seabed deposits are mud and fine particles.
Oil rig platforms are observed in the off shore area in front of the candidate site of the Cilamaya terminal, which had been developed by PERTAMINA for oil and gas exploration. They installed 20” to 24” submerged pipe lines to connect between the oil rigs at a depth of more than 20m. The area submerged pipeline is installed cannot be used as an anchorage of ships.

MASTER PLAN STUDY ON PORT DEVELOPMENT AND LOGISTICS IN GREATER JAKARTA METROPOLITAN AREA (JICA) FINAL REPORT
115
According to DINAS PERIKANAN, KELANTAN PETERNAKAN, Kabupaten, Karawang (Karawang Branch Office of Marine Affairs and Fisheries), they identified that the irregular shallower parts in the hydrographic chart of planned terminal site is the coral reef. The provincial government plans to develop this coral reef area as tourist spots.
Regarding shore changing in this area the obvious backward shoreline change is observed in this area (1940 ~ 1993: -130 ~ -380 m). The yearly rate of shoreline change is estimated around -3 ~ -7 m/year.
Planning Criteria for Development of Access Channel/Basin
To receive the design size of vessel the shallow parts less than 16m depth, which is about 5-6km away the new terminal is required to be dredged to -15.5m. The total length of the access channel is estimated around 47 km from the entrance of the new terminal in order not to disturb existing oil rigs operation.
The entrance of the access channel is located at the depth of -39m and the alignment is selected between oil rigs of Pertamina and coral reef area.
The basic space requirements and bending of the navigation channel and basin were determined in accordance with the international standards including PIANC.
2) Scope of Access Channel and Turning Basin Development
Dredging Requirements for Navigation Channel
The net volume of dredging requirements for Phase 1 and Phase 2 is 27.725 mil m3 and 0.205 mil m3 respectively and in total 27.93 mil m3.
Construction of breakwater for the long term development plan
The terminal facilities are planned to be protected by constructing a breakwater with a length of 2,130m and seawall with a length of 4,680m for development of reclamation at about 3.6-4.0km away from the existing shore line of Cilamaya.
3) Preliminary Design of Quay wall Structure
Phased Development of New Terminal Facilities at Cilamaya
The new container terminal at Cilamaya is planned to be developed after the development of the first phase of North Kalibaru terminal, assuming that the urgent new terminal development at North Kalibaru in Tanjung Priok will meet the traffic demands by 2019.
Design Criteria for Preliminary Design of Quay wall
The same design criteria of marine and civil works as described in chapter 5.1(2) is applied, except the objective ship size, soil and wave conditions of Cilamaya site.
Objective ship size
The following two different sizes of container ships are planned to call the new terminal. The dimensions of the container ships used for the new terminal are summarized below.

MASTER PLAN STUDY ON PORT DEVELOPMENT AND LOGISTICS IN GREATER JAKARTA METROPOLITAN AREA (JICA) FINAL REPORT
116
Table 5.1-19 Objective Container Ship Size
Objective Container Ship Post-Panamax Medium Size Dead Weight Ton (DWT) 87,545 33,750 Loading Volume (TEU) 5,648 2,550 LOA (m) 318 207 Beam (m) 40.06 29.84 Draft (m) 14.0 11.4 Source: Containerization International
Tide and wave conditions at Cilamaya
Table 5.1-20 Tide, Current and Wave Conditions of Cilamaya site
Cilamaya site Tide (cm)1 High Water Level (HWL) +107.00 CDL (MSL +59.0) Mean Sea Level (MSL) +59.00 DL(MSL +0.00) Design Low Tide Level (DLT) 0.0 DL(MSL – 48.0) Wave at Berth, Significant Wave Height H1/3(m) 0.50 m Significant Wave Period T1/3 Less than 2 sec Wave at Revetment/Seawall Design Wave Height (m) Design Wave Period (sec) Wave at Breakwater
1.5 m
Around 6 sec
Significant Wave Height H1/3 (m) 3.00m Significant Wave Period T1/3 Around 9 sec Source: JICA Study Team by site observation record in 2010 May/June
Subsoil Condition
The following parameters of soil conditions are taken based on the geotechnical investigation of Cilamaya site.
Table 5.1-21 Soil Profile of Cilamaya site for Preliminary Design
Depth from Existing sea bed
Elevation from DL 0.00 Soil Profile
- 4.0 m to 8.0 m
-9.0 to -13.0m Silty Clay to sandy clay very soft
grey in color N= 0 ~ 2
- 8.0m-12.0m
-13.0 to-17.0mClay or clayer silt mixed with fragmented shell, stiff
consistency N= 8 ~18, = 30°, ’ = 1.37 tf/m3
-12.0 m-20.0m
-17.0m Sandy Clay hard consistency
N= 18 ~- <60 = 30°, ’ = 1.79 tf/m3
-20.0 m
-25.0m Clayer silt very stiff consistency, N = <60 = 30°, ’ = 1.86 tf/m3
-30.0 m
-35.0m Sandy Clay hard consistency
N = more than 50, = 35°, ’ = 1.77 tf/m3
Crown Height of Quay wall

MASTER PLAN STUDY ON PORT DEVELOPMENT AND LOGISTICS IN GREATER JAKARTA METROPOLITAN AREA (JICA) FINAL REPORT
117
The crown height of Quay wall is set at 3.5m from DL (+3.0m from MSL)
Selection of Quay wall structures
Considering the similar site condition and soil conditions, same seismic coefficient zone, live loads of cranes, vehicles of the Cilamaya sites, the same type of quay wall structures i.e.; “Concrete Deck on Open Steel Pipe Pile type” as designed for North Kalibaru in Tanjung Priok is applied for the new quay wall structure at Cilamaya.
The corresponding dimensions of berthing facilities and turning basin for the objective ship size are set as follows:
Table 5.1-22 Berth Dimension Corresponding Ship Size
Objective Ship Size Berth Dimension Diameter of Turning Basin (m) Depth (m) Length (m)
Medium Size ((33,750DWT) 12.5 240 420 Post- Panamax (87,545DWT) 15.5 360 640 Small Size 9.0 200 -
The quay wall for medium size is designed considering the following elements, although dead
and live load on the quay wall is the same as 87,000 DWT.
- The berthing reaction of 33,750 DWT by fenders is about 120 to 130 ton - The water depth in front of berth is set at -12.5m, shallower than Post panamax
and - The hard layer is encountered at the depth of around -25 m of the site soil
condition. - As a result of stability checking the foundation pile (SPP) size is reduced to
Ø900mm, t=16mm from the case of Post Panamax and penetration length is estimated up to-28 m (MSL -28.5m)
The cross section of Quay wall for Post-Panamax (-15.5m) is the same as applied for North
Kalibaru.
4) Container Yard Planning and Container Cargo Handling Equipment
Layout Plan of Container Terminal
The layout plan of the container terminal is 240m per one berth, which involves building quays with a total length of 4,910m by Phase II and Phase III. The space in the back up area is 480m with the exception of the bank space.
Design Conditions for Required Number of Container Handling Equipment
Design condition to estimate required container handling equipment for 1 berth is shown below.
Capacity(TEUs/Year/berth) 384,000Av. Days of Stock 3.3Stacking Efficiency 0.75Peak Ratio 1.3Feeder Ratio 0.02Yard Capacity(TEUs) 5,900Tier 4Calculated Ground Slots(TEUs) 1,475

MASTER PLAN STUDY ON PORT DEVELOPMENT AND LOGISTICS IN GREATER JAKARTA METROPOLITAN AREA (JICA) FINAL REPORT
118
And required quantity and type of major cargo handling equipment of one terminal (720m) are listed below.
CGC 6Yard tractor 36Yard chassis 38RTG 15Top Lifter 3Forklift 5t 6Forklift 10t 6
The composition of berth depth and length by the receiving of different-sized ships is indicated
in the table below. The total number of berths and length of Phase 2 and 3 are 8 and 11 respectively in total 19 and the length 2,160m and 2,750m respectively in total 4,910 m.
Long term Cargo Handling Equipment of Phased Development of Terminal Area
Corresponding required major cargo handling equipment of the new container terminal at Cilamaya for phase 2 and 3 stages are worked out and listed below.
Table 5.1-23 Proposed Type and Quantity of Major Container Handling Equipment
Phase 2 Phase 3 Total Berth Length (m) 2,160 2,750 4,910 Depth (m) 12.5~15.5 9.0~15.5
Capacity(million TEUs) 3.2 4.3 7.5 Ground Slot(TEUs) 10,202 15,255 25,427 QGC No. 24 30 54 RTG 60 75 135
5) Yard Development by Reclamation
Seawall and Revetment construction
The new sea wall of east and west sides for 2,340 m x 2 =4,680m length will be constructed.
The soil condition of the foundation is clay at the upper layer of depth -4.5m, where soft and loose grey sand is encountered. The revetment foundation is reinforced by PVD and upper structure is designed by Gravity Type.
The crown height of the seawall/revetment is set at +2.5 m from CDL considering designed wave height of 1.5 m, design wave period of 6 sec and dominating direction of North East.
Both sides of the seawall are constructed with rubble mound with armor stones and concrete block to be placed on the top of the stone mound as planned for the North Kalibaru terminal.
Revetment construction on the south side of reclaimed land
The revetment on the south side facing to the coast area is planned for reclamation works of off shore island.
Reclamation works
The soil conditions from the seabed indicate that the dredged material is not suitable to use for the reclamation material. It is planned to obtain such reclamation material from outside of the project area.
Average depth of reclamation will be 6 to 7 m. The estimated volume for respective phases will be shown in the Table below. Average elevation of the planned yard after pavement will be +3.5

MASTER PLAN STUDY ON PORT DEVELOPMENT AND LOGISTICS IN GREATER JAKARTA METROPOLITAN AREA (JICA) FINAL REPORT
119
m (MST+3.0m). The total reclamation volume of Phase 2 and Phase 3 are estimated at 13.64 mil m3 and 15.73 mil m3 respectively and in total 29.36 mil m3.
Soil Improvement
The existing surface of sea bed at the foundation area of seawall/breakwater foundation, stock yard, roads and building area of the shore area is sandy stiff and hard layer around the depth of -12 to 14 m from the existing sea bed level of -5 .0m. The foundation soil is reinforced by the PVD Method.
Yard Pavement and drainage in new terminal area
Since the operation planning inside the container terminal at the Cilamaya new terminal will be same as North Kalibaru, the pavement type for the usage of respective areas are selected according to the same type and quality as adopted for North Kalibaru case. The drainage system will be planned together with the pavement works.
6) Terminal inner road development
Access Road Connection from the Toll way to the Port
The new access road connecting from the regional industrial complex to the planned new terminal is required for operating the Cilamaya new terminal. The detailed planning of alignment from the existing toll way of Jakarta and Cikanpek and design of access road structure are described in Chapter 5.3 “Access Road Development”.
Terminal inner Road
The terminal inner road is planned from the exclusive gate of a new container terminal at the eastern end of the terminal and will be connected by a 800 m long bridge from off shore terminal.
The terminal inner road will accommodate about 7.5 mil truck chassis in 2030 annually. The terminal inner road is planned to have 3 lanes (2 lanes for through traffic and 1 lane for gate queue) surrounding the reclaimed land outside the container yards.
The terminal inner road is designed with 12 m width for 3 lanes and concrete pavement (t=20cm) with gravel coarse foundation (t=30cm) to sustain the standard trucks (H22-44) wheel load 8.0 ton/wheel.
The terminal inner road is planned on east sides L= 2,340 m for Phase II and on west side L=2,340 m for Phase III project. The terminal inner road on the south side of the terminal service area L=1,140m is constructed for Phase II project and L= 660 m is constructed as Phase III project.
7) Utility supply, Buildings, Environmental Facilities and Security System Facilities
Water Supply
Water supply system will consist of water reservoir, pump house, elevated water tank and distribution system for general purpose of the office, ship, hydrant, and fire fighting inside of the terminal area. The same volume of water demand as North Kalibaru terminal Phase 1 will be required for each phase of development of Cilamaya new terminal.
The water source should be arranged from the main supply line of the public water of the Water Supply Works Department of the Karawang Regency.
Power Supply
The same electric power demands for new container terminals as provided at North Kalibaru will be required for each phase of development of Cilamaya new terminal.

MASTER PLAN STUDY ON PORT DEVELOPMENT AND LOGISTICS IN GREATER JAKARTA METROPOLITAN AREA (JICA) FINAL REPORT
120
The electric power requirement of the new terminal at Cilamaya should be arranged from the regional power supply station of National Electric Cooperation (PLN). A standby generator set for emergency purpose of the office use in the new terminal will be installed.
Environmental Treatment Facilities
The environmental treatment facilities as planned for North Kalibaru will be provided for the new container terminal at Cilamaya.
Building works
The same size of floor area for each building as planned for North Kalibaru is planned for a new container terminal at Cilamaya.
Security System Facilities
The same security system facilities as planned for the new terminal at North Kalibaru is planned for the new terminal at Cilamaya to comply with SOLAS amendments and ISPS Code in order to function as an international container terminal.
(4) New Container Terminal Development at Tangerang Site
1) Requirement of Access Channel and Turning Basin Development
Nautical and Operational Aspects of candidate site of new terminal
Topographic conditions
The topographic condition of the planned site is low and flat area with muddy beach. There are many fishing grounds off the coast. The area of the candidate site is the coast between Tanjung Kait and Tanjung Burung. Between these two capes, rivers such as Ci Rarab and Ci Tuis and S. Apuran flow into the sea.
The Sugai Cisadane is the largest river and its estuary is Tanjung Burung and Tanjung Pepuloa in the candidate site. The area is mostly flat between Tanjung Kait to Ci Rarab. Some villages are developed close to the coast from Ci Rarab to Tanjung Burung. There are marshy and fish ponds down close to the beach. There are fairly high trees near the coastal area.
Hydrographic condition
The depth of -10 m and -15 m is located about 4 km and 7.5km away from the shore respectively. The sea bed is generally gentle with its slope of 1/400. The soil conditions of the area are muddy beach and seabed deposits are mud and fine particles.
However, a number of islands are scatted about 10 to 18 km away in the north from the candidate site of a new terminal at depth of about 20 m and 33m respectively.
The near-shore waves off the new terminal area are comparatively mild throughout the year. The predominant directions of waves to the port are from North West.
Wave conditions at site are summarized as follows;
- The wave from east is sheltered geographically. - N & W waves are directly approach to the port area. - 95.9 % of the wave height at -10m depth is less than 0.5 m height.
The currents in and around the terminal are rather weak, resulting in no significant
maneuvering problem for incoming/outgoing ships.
- Shore line changes

MASTER PLAN STUDY ON PORT DEVELOPMENT AND LOGISTICS IN GREATER JAKARTA METROPOLITAN AREA (JICA) FINAL REPORT
121
A shoreline change is observed in this coast around the river-mouth area of Ci Sadane (1940 ~ 1993: 500 ~ 1,050 m; 1993 ~ 2009: 480 ~900 m). The yearly rate of shoreline change is estimated as 10 ~ 20 m/year from 1940 - 1993 and 30 ~ 56 m/year from 1993 - 2009. The shoreline change is still progressing and getting bigger in recent years. The change width was 200 to 300 m in the 50 to 60-year period. The yearly rate of shoreline change is estimated at about 4 m/year.
Planning he Development o Access Channel and and Turning Basin
The access channel alignment is planned based on the sea charts to reach the water depth more than 16 m depth without interference of the scattering small islands. The distance of the access channel is planned at the depth of -20m to the west of the Lancang Islands area. The total length of the access channel is estimated at around 11 km from the entrance of the new terminal.
This shallow parts of the planned access channel will be dredged to -15.5m CDL (MSL -16.0m).
The basic space requirements and bending of the navigation channel and basin is determined in accordance with the international standards including PIANC.
The expected maximum ship size to call the terminal is set as the same size as planned for North Kalibaru and Cilamaya Terminals. To receive this size of vessel the basic space requirements of the navigation channel and basin are the same as planned for North Kalibaru Terminal.
2) Scope of Access Channel and Turning Basin Development
Dredging Requirements for Navigation Channel
The net volume of dredging requirements for the long term plan is summarized below.
Table 5.1-24 Dredging Volume Requirement in Long Term Plan
Location Design Depth Dredging Volume (m3) Access Channel -15.5m 20,167,950 Harbor Turning Basin Outer Basin 1 -15.5m 9,711,824 Inner Basin 2 -15.5m 1,647,360 Inner Basin 3 -12.5m 929,280 Total Volume 32,456,414
Construction of breakwater for the long term development plan
The new terminal at Tangerang is planned to be developed in the off shore island. In order to protect the terminal facilities it will be constructed about 420m away from the existing shore line.
The off shore terminal is protected by a new north west breakwater with a length of 510m and northeast breakwater with a length of 470m. The length of west and east breakwater is 640 m x 2 = 1,280m.
3) Preliminary Design of Quay wall Structure
Design Criteria
The design criteria of marine and civil works adopts the same design standards and reference as applied for North Kalibaru new terminal development described in Chapter 5.1.2, except the objective ship size, soil and wave conditions of construction site.
Objective ship size
The following two different sizes of container ships are planned to call the new terminal.

MASTER PLAN STUDY ON PORT DEVELOPMENT AND LOGISTICS IN GREATER JAKARTA METROPOLITAN AREA (JICA) FINAL REPORT
122
Table 5.1-25 Objective Container Ship Size for planning Quay wall Structure
Type of Container Ship Post-Panamax Medium Size Dead Weight Ton (DWT) 87,545 33,750 Loading Volume (TEU) 5,648 2,550 LOA (m) 318 207 Beam (m) 40.06 29.84 Draft (m) 14.0 11.4 Source: Containerization International
Tide and wave conditions at Tangerang site
The tide level and wave conditions at Tangerang site are summarized below.
Table 5.1-26 Tide, Current and Wave Conditions of Tangerang site
Tangerang site Tide (cm)1 High Water Level (HWL) +108.00 CDL (MSL +59.0) Mean Sea Level (MSL) +59.00 DL(MSL +0.00) Design Low Tide Level (DLT) 0.0 DL(MSL – 48.0) Wave at Berth, Significant Wave Height H1/3(m) 0.50 m Significant Wave Period T1/3 Less than 2 sec Wave at Revetment Design Wave Height (m) Design Wave Period (sec) Wave at Breakwater
1.5 m
Around 6 sec
Significant Wave Height H1/3 (m) 2.50m Significant Wave Period T1/3 Around 9 sec Source: JICA Study team by site observation record in 2010 May/June
Subsoil Condition
The following soil conditions are taken from the soil investigation at the exact location of developing breakwater of off shore terminal for the preliminary design for the new terminal facilities.

MASTER PLAN STUDY ON PORT DEVELOPMENT AND LOGISTICS IN GREATER JAKARTA METROPOLITAN AREA (JICA) FINAL REPORT
123
Table 5.1-27 Soil Profile for Preliminary Design
BH01 - BH02 Off shore of Tangerang Site
Depth from Existing sea bed
(0.8 ~-5.0m)
Elevation from DL 0.00 Soil Profile
- 4.5 m
-12.0m Silty Clay to silty clay mixed with small parts of
organic, very soft grey in color N= 0
- 8.0m
-16.5 m Sandy silt mixed fragmentak shell to silty sand,
hard to very dense condition consistency N= 13 ~18 , = 30°, ’ = 1.37 tf/m3
-14.0 m
-22.5m Silty clay to Sandy Clayer silt, stiff to very stiff, light grey N= 18 ~27, = 30°, ’ = 1.79 tf/m3
-25.5 m
-34.0m Silty Sandy mixed with small part of gravel,
dense to very dense condition, N =20 ~>60, = 30°, ’ = 1.86 tf/m3
-30.0 m
-39.5m Sandy Clayer silt, hard consistency, dark grey in color N = more than 50
= 35°, ’ = 1.77 tf/m3
Crown Height of Quay wall
The crown height is set at the same level as at North Kalibaru and Cilamaya: 3.5m from DL (+3.0m from MSL) considering the ship size and tidal condition.
Selection of Quay wall structures
Considering the similar site condition and soil conditions, same seismic coefficient zone, live loads of cranes, vehicles of the Tangerang sites, the same type of quay wall structures i.e. “Concrete Deck on Open Steel Pipe Pile type” as designed for North Kalibaru in Tanjung Priok Port is applied for the new terminal at Tangerang.
The corresponding dimensions of berthing facilities for the objective ship size are set as shown in Table 5.1-28.
Table 5.1-28 Berth Dimension Corresponding Ship Size
Objective Ship Size Berth Dimension Diameter of Turning Basin (m) Depth (m) Length (m)
Small Size 9.0 200 - Medium Size ((33,750DWT) 12.5 240 420 Post- Panamax (87,545DWT) 15.5 360 640
The medium-sized quay wall is designed considering the following factors.
- The berthing reaction by ship of 33,750 DWT is about 120-130 ton
The dimensions of pile foundation between medium and Post Panamaz ship are shown below.
Table 5.1-29 Dimension of Berth Foundation Corresponding Ship Size
Objective Ship Size Water depth(m) Pile depth Diameter of SPPBerth Sea bed From sea bed
Medium Size ((33,750DWT) -12.5 -4.0/-5.0 -28.0 Ø900mm, t=16mm
Post- Panamax (87,545DWT) -15.5 -4.0/-5.0 -37.0 Ø1200mm, t=20mm

MASTER PLAN STUDY ON PORT DEVELOPMENT AND LOGISTICS IN GREATER JAKARTA METROPOLITAN AREA (JICA) FINAL REPORT
124
The Quay wall for designed depth of -12.5m for medium size container ship is the same type as
adopted for the Cilamaya site.
Container Yard Planning and Container Cargo Handling Equipment Layout Plan of Container Terminal
The layout plan of the container terminal consists of two berths having 360m and 240m, which involves building quays of 1,520m in total length by Phase II and Phase III. The space in the back up area is 480m with the exception of the bank space.
Design Conditions for Required Number of Container Handling Equipment
Design condition to estimate required container handling equipment for 240m berth is shown
Capacity(TEUs/Year/berth) 560,000Av. Days of Stock 3.3Stacking Efficiency 0.75Peak Ratio 1.3Feeder Ratio 0.02Yard Capacity(TEUs) 8,604Tier 4Calculated Ground Slots(TEUs) 2,151
The required quantity and type of cargo handling equipment of one terminal (600m) are shown below.
CGC 6Yard tractor 36Yard chassis 38
RTG 15Top Lifter 3Forklift 5t 6
Forklift 10t 6
The composition of berth depth and length by receiving different-sized ships is indicated in the table below. The total number of berths is 5 and the total length is 1,520m.
Table 5.1-30 Planned Berth Composition (Tangerang)
Water depth (m) Length (m) Berth Subtotal (m) No.1,No.3 15.5 360 2 720 No2,No.4 12.5 240 2 480
No.5 9.0 320 1 320
Total (m) 5 1,520
Long term Cargo Handling Equipment of Phased Development of Terminal Area
Corresponding required major cargo handling equipment of new container terminal at Tangeran is listed below.
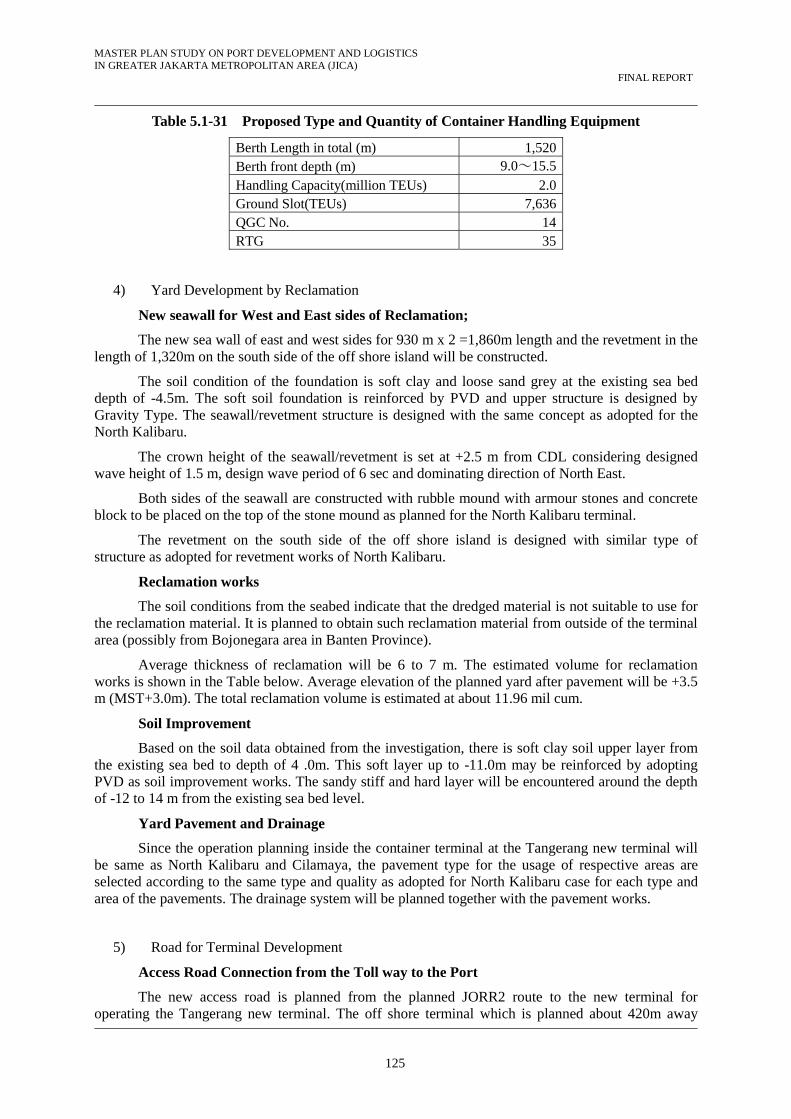
MASTER PLAN STUDY ON PORT DEVELOPMENT AND LOGISTICS IN GREATER JAKARTA METROPOLITAN AREA (JICA) FINAL REPORT
125
Table 5.1-31 Proposed Type and Quantity of Container Handling Equipment
Berth Length in total (m) 1,520Berth front depth (m) 9.0~15.5Handling Capacity(million TEUs) 2.0Ground Slot(TEUs) 7,636QGC No. 14RTG 35
4) Yard Development by Reclamation
New seawall for West and East sides of Reclamation;
The new sea wall of east and west sides for 930 m x 2 =1,860m length and the revetment in the length of 1,320m on the south side of the off shore island will be constructed.
The soil condition of the foundation is soft clay and loose sand grey at the existing sea bed depth of -4.5m. The soft soil foundation is reinforced by PVD and upper structure is designed by Gravity Type. The seawall/revetment structure is designed with the same concept as adopted for the North Kalibaru.
The crown height of the seawall/revetment is set at +2.5 m from CDL considering designed wave height of 1.5 m, design wave period of 6 sec and dominating direction of North East.
Both sides of the seawall are constructed with rubble mound with armour stones and concrete block to be placed on the top of the stone mound as planned for the North Kalibaru terminal.
The revetment on the south side of the off shore island is designed with similar type of structure as adopted for revetment works of North Kalibaru.
Reclamation works
The soil conditions from the seabed indicate that the dredged material is not suitable to use for the reclamation material. It is planned to obtain such reclamation material from outside of the terminal area (possibly from Bojonegara area in Banten Province).
Average thickness of reclamation will be 6 to 7 m. The estimated volume for reclamation works is shown in the Table below. Average elevation of the planned yard after pavement will be +3.5 m (MST+3.0m). The total reclamation volume is estimated at about 11.96 mil cum.
Soil Improvement
Based on the soil data obtained from the investigation, there is soft clay soil upper layer from the existing sea bed to depth of 4 .0m. This soft layer up to -11.0m may be reinforced by adopting PVD as soil improvement works. The sandy stiff and hard layer will be encountered around the depth of -12 to 14 m from the existing sea bed level.
Yard Pavement and Drainage
Since the operation planning inside the container terminal at the Tangerang new terminal will be same as North Kalibaru and Cilamaya, the pavement type for the usage of respective areas are selected according to the same type and quality as adopted for North Kalibaru case for each type and area of the pavements. The drainage system will be planned together with the pavement works.
5) Road for Terminal Development
Access Road Connection from the Toll way to the Port
The new access road is planned from the planned JORR2 route to the new terminal for operating the Tangerang new terminal. The off shore terminal which is planned about 420m away

MASTER PLAN STUDY ON PORT DEVELOPMENT AND LOGISTICS IN GREATER JAKARTA METROPOLITAN AREA (JICA) FINAL REPORT
126
from the existing shore line is connected by a PC girder bridge from the shore. The detailed planning of alignment of the access road from the planned JORR 2 route and design of access road structure are described in Chapter 5.3 “Access Road Development”
Terminal inner Road
The terminal inner road is planned to be constructed between the sea wall / revetment and the edge of container yards on the east side in the length of 1,480m (930 +550m) and on the west side of 1,480m (930 +550m). The port inner road on the south side of the terminal service area in the length of 1,420m is constructed.
The Tangerang new terminal will accommodate about 2.0 mil truck chassis in 2030 annually. The terminal inner road is planned to have 3 lanes (2 lanes for through traffic and 1 lane for gate queue) surrounding the reclaimed land outside the container yards.
The terminal inner road in the new terminal is planned to have 3 lanes (2 lanes for through traffic and 1 lane for gate queue) surrounding the reclaimed land outside the container yards.
The terminal inner road is planned to have 12 m width for 3 lanes and concrete pavement (t=20cm) with gravel coarse foundation (t=30cm) to sustain the standard trucks (H22-44) wheel load 8.0 ton/wheel.
6) Utility supply, Buildings, Environmental Facilities and Security System Facilities
Utility Supply
Water Supply
Water supply system consists of water reservoir, pump house, elevated water tank and distribution system for general purpose of the office, ship, hydrant, and fire fighting inside of the terminal area. The water supply to the vessels, fire fighting and buildings are provided. The same volume of water demand as planned for North Kalibaru terminal Phase 1 will be required for Tangerang new terminal.
It is assumed that the water source should be arranged from the main supply line of the public water of the Water Supply Works Department of the Tangerang Regency.
Power Supply
The same electric power demands for new container terminals as planned for North Kalibaru Phase 1 will be required for Tangerang new terminal since the same number of Quay cranes will be used. The electric power supply of new terminal at Tangerang should be arranged from the regional power supply station of National Electric Cooperation (PLN). A standby generator set for emergency purpose of the office use in the new terminal will be installed.
Environmental Treatment Facilities
The environmental treatment facilities as planned for the North Kalibaru will be provided for the new container terminal at Tangerang.
Building works
The same size of floor area for each building as planned for North Kalibaru Phase 1 is provided for the new container terminal at Tangerang terminal.
Security System
The security system facilities as planned for North Kalibaru new terminal are provided for new terminal at Tangerang to comply with SOLAS amendments and ISPS Code in order to function as an international container terminal.

MASTER PLAN STUDY ON PORT DEVELOPMENT AND LOGISTICS IN GREATER JAKARTA METROPOLITAN AREA (JICA) FINAL REPORT
127
(5) Implementation Schedule of Master Plan
1) Option-1 (Concentrated development at North Kalibaru)
The first development scenario consists of three phased container terminal developments fully concentrated at offshore Tanjung Priok Port (North Kalibaru). The sequence of development as Scenario 1 (North Kalibaru) is assumed as follows.
North Kalibaru Phase I
Planned quay wall length in the development of North Kalibaru Phase I is 1,200 m having two terminals in operation; the construction period for the quay wall construction is estimated as roughly 34 months at least
The dredging volume to deepen the channel and harbor basins up to -15.5 m in the development of North Kalibaru Phase I amounts to 16 million m3. Assuming the use of cutter suction dredger and considering busy port operation and ship traffic in the port area of Tanjung Priok, the work period is estimated at a minimum of 40 months by deploying three (3) fleets of dredger vessels.
In order for the container terminal to be operational in the 5th year after L/A (4th year after implementation of construction), the staged development of the container terminal Phase I should be taken into consideration.
Phase I development of the North Kalibaru Container Terminal is targeting container throughput of 1.9 million TEU/year as the capacity to accommodate by quay wall length: 1,200 m). The construction process of the terminal is divided into two stages by the length of quay wall (600 m + 600 m). It is assumed to implement the construction works in each stage as follows.
Stage 1 (2nd – 4th Year)
The following works will be carried out; Dredging of channel and basins, demolition of the existing breakwaters, re-construction of breakwaters, construction of protective facilities (seawalls, revetments), quay wall 600 m, reclamation and development of container terminal yard.
Stage 2 (4th – 5th Year)
Quay wall 600 m, reclamation and development of container terminal yard.
North Kalibaru Phase II
Construction works of Phase II development of North Kalibaru consists of (i) demolition of the existing breakwater (Dam Barat) sheltering western entrance of Tanjung Priok Port, (ii) additional dredging of the basin (around 4.3 million m3) in front of Phase II terminal, (iii) reclamation and development of Container Terminal Phase II (129 ha).
Construction period is estimated four years for construction works of North Kalibaru Phase II development. The first 2 berths (quay wall: 600 m) will be operational in the 4th year of construction in line with the requirement of demand forecast of container throughput.
North Kalibaru Phase III
Construction works of Phase III development of North Kalibaru consists of (i) extension of the breakwater (2,637 m) to shelter the channel and basin in front of Phase III terminal, (ii) dredging of the channel and basin (around 17.6 million m3) in front of Phase III terminal, (iii) reclamation and development of Container Terminal Phase III (190 ha).
Five years period is estimated for construction works of North Kalibaru Phase III development.
The first terminal (2 berths@350 m; quay wall length 700 m) will be enabled to start operation in the 4th year of construction in line with the requirement of demand forecast. Terminal 2 (3 berths@300; quay wall 900 m) and Terminal 3 (2berths@350 m and 1 berth@300 m; quay wall 1,000
MASTER PLAN STUDY ON PORT DEVELOPMENT AND LOGISTICS IN GREATER JAKARTA METROPOLITAN AREA (JICA) FINAL REPORT
128
m) will be enabled to start operation in the 5th and 6th year after implementation of the construction. Implementation schedule of Scenario 1 is shown in Table 5.1.32.
2) Option-2 (North Kalibaru Phase I and Cilamaya Phases II ~III)
Cilamaya New Terminal Phase II
Construction works of Phase I development of Cilamaya container terminal will start with (i) construction of port access road (30.6 km) to connect the Cilamaya site with Cikampek Toll Road. The early stage of the port access road will be used as temporary road for transportation of laborers, materials and equipment of construction works.
(ii) Construction of the Protective facilities will start with;
Breakwaters: Northwest 726 m, West 356 m Northeast 684 m, East 356 m Seawalls West 2,340 m, East 2,340 m
followed by (iii) Dredging of the channel and basin (around 28 million m3) to the design depth -15.5 m, and (iv) Reclamation and development of Container Terminal Phase II (80 ha).
Quay No.1 2 berths@360 m (MSL-16 m), 1.4 million TEU Quay No.2 4 berths@240 m (MSL-13 m), 1.4 million TEU Quay No.3 2 berths@240 m (MSL-16 m), 0.7 million TEU
Four year period is estimated for construction works of Cilamaya Phase I development.
Quays No.1 and No.3 will be ready for operation in the 4th year after implementation of construction in line with the requirement of demand forecast. Quay No.2 will start operation in the 5th year after construction.
Cilamaya New Terminal Phase III
Construction works of Cilamaya Phase III development consists of (i) reclamation and development of Container Terminal Phase III (190 ha), and (ii) development of Multi-purpose berth and Terminal Service area.
Quay No.4 2 berths@360 m (MSL-16 m), 1.4 million TEU Quay No.5 4 berths@240 m (MSL-13 m), 1.4 million TEU Quay No.6 2 berths@240 m (MSL-16 m), 0.7 million TEU Quay No.7 3 berths@200 m (MSL-9.5 m), 1.1 million TEU
The development target of Cilamaya Phase III amounts to 4.3 million TEU/year of container
throughput. Three year period is estimated for construction works of Cilamaya Phase III development.
Quays No.4 and No.6 will start operation in the 3rd year after implementation of construction in line with the requirement of demand forecast. Quay No.5 will start operation in the 4th year after construction. Implementation schedule of Scenario 2 is shown in Table 5.1-33.
3) Option-3 (North Kalibaru Phases I ~ III and Tangerang Phase III)
Tangerang New Terminal Phase III
Construction works of Tangerang container terminal will start with (i) construction of terminal access road (4.9 km) to connect the Tangerang site with JORR2 at Teluknaga. The early stage of the terminal access road will be used as temporary road for transportation and construction works.
(ii) Construction of the Protective facilities will start with;

MASTER PLAN STUDY ON PORT DEVELOPMENT AND LOGISTICS IN GREATER JAKARTA METROPOLITAN AREA (JICA) FINAL REPORT
129
Breakwaters: Northwest 510 m, West 640 m Northeast 470 m East 640 m Seawalls West 930 m East 930 m
followed by (iii) Dredging of the channel and basin (around 32 million m3) to the design depth
-15.5 m, and (iv) Reclamation and development of Container Terminals (58 ha).
Quay No.1: 1 berth@360 m (MSL-16 m), 0.7 million TEU Quay No.2: 1 berth@240 m (MSL-13 m), 0.3 million TEU Quay No.3: 1 berth@360 m (MSL-16 m), 0.7 million TEU Quay No.4: 1 berth@240 m (MSL-13 m), 0.3 million TEU Quay No.5: 1 berth@320 m (MSL-9.5 m), Multi-purpose
The development target of Tangerang container terminal amounts to 2.0 million TEU/year of
container throughput. Four-year period is estimated for construction works of Tangerang development. .
Quays No.1 and No.2 will start operation in the 4th year after implementation of construction in line with the requirement of demand forecast. Quays No.3 and No.4 will commence operation in the 5th year after implementation of the construction.
Implementation schedule of Scenario 3 is shown in Table 5.1-34.

MASTER PLAN STUDY ON PORT DEVELOPMENT AND LOGISTICS IN GREATER JAKARTA METROPOLITAN AREA (JICA) FINAL REPORT
130
Table 5.1-32 Implementation schedule of Development Option-1
Ist Year 2nd Year 3rd Year 4th Year 5th Year 6th Year 7th Year
After L/A
North Kalibaru Phase I
1. Administration Procedure
2. Construction Stage
2.1 Access Road and Bridge
2.2 Stage 1 of Container Terminal
Breakwaters and Seawalls
Dredging of Channel and Basin
Container Terminal Stage 1
Terminal Buildings
Container Handling Equipment
Security and Utility
Start of Terminal Operation Stage 1
2.3 Stage 2 of Container Terminal
Container Terminal Stage 2
Terminal Buildings
Container Handling Equipment
Utility Facilities
Start of Terminal Operation Stage 2
2015 2016 2017 2018 2019 2020 2021
North Kalibaru Phase II
1. Administration Procedure
2. Construction Stage
2.1 Offshore Road and Bridge; 11.6 km
2.2 Container Terminal
Demolition of Dam Barat
Seawalls and Revetment
Dredging of Channel and Basin
Quay Wall Construction (2,000 m)
Container Terminal II-1 (2 berth@300 m)
Container Handling Equipment
Start of Terminal Operation Tereminal 1
Container Terminal II-2 (2 x 2 berths @350 m)
Container Handling Equipment
Security and Utility
Start of Terminal Operation Tereminal 2
2020 2021 2022 2023 2024 2025 2026
North Kalibaru Phase III
1. Administration Procedure
2. Construction Stage
Breakwaters
Construction
Demolition of Dam Barat
Seawalls and Revetment
Dredging of Channel and Basin
Quay Wall Construction (2,600 m)
Reclamation of Container Yard
Container Terminal III-1 (2 berth@350 m)
Container Handling Equipment
Start of Operation Tereminal III-1
Container Terminal III-2 (3 berth@300 m)
Container Handling Equipment
Start of Operation Tereminal III-2
Container Terminal III-3 (2 berth@350 m + 1berth@300 m)
Container Handling Equipment
Start of Operation Tereminal III-3
Description
Description
Description

MASTER PLAN STUDY ON PORT DEVELOPMENT AND LOGISTICS IN GREATER JAKARTA METROPOLITAN AREA (JICA) FINAL REPORT
131
Table 5.1-33 Implementation schedule of Development Option-2
Ist Year 2nd Year 3rd Year 4th Year 5th Year 6th Year 7th Year
After L/A
North Kalibaru Phase I
1. Administration Procedure
2. Construction Stage
2.1 Access Road and Bridge
2.2 Stage 1 of Container Terminal
Breakwaters and Seawalls
Dredging of Channel and Basin
Container Terminal Stage 1
Terminal Buildings
Container Handling Equipment
Security and Utility
Start of Terminal Operation Stage 1
2.3 Stage 2 of Container Terminal
Container Terminal Stage 2
Terminal Buildings
Container Handling Equipment
Utility Facilities
Start of Terminal Operation Stage 2
2015 2016 2017 2018 2019 2020 2021
Cilamaya Phase I
1. Administration Procedure
2. Construction Stage
2.1 Access Road and Bridge
2.2 Container Terminal
Breakwaters
Seawalls and Revetment
Dredging of Channel and Basin
Berth No.1; Quay Wall and Reclamation
Yard Pavement and Buliding
Container Handling Equipment
Start of Terminal Operation Berth No.1
Berth No.2; Quay Wall and Reclamation
Yard Pavement and Buliding
Container Handling Equipment
Start of Terminal Operation Berth No.2
Quay No.3
Terminal Service Area; Reclamation
Container Handling Equipment
2021 2022 2023 2024 2025 2026 2027
Cilamaya Phase II
1. Administration Procedure
2. Construction Stage
Berth No.4; Quay Wall and Reclamation
Yard Pavement and Buliding
Container Handling Equipment
Start of Terminal Operation Berth No.4
Berth No.5; Quay Wall and Reclamation
Yard Pavement and Buliding
Container Handling Equipment
Start of Terminal Operation Berth No.5
Quay No.6
Multi-purpose Berth; Reclamation
Yard Pavement and Buliding
Start of Terminal Operation Multi-purpose
Terminal Service Area; Reclamation
Yard Pavement and Buliding
Security and Utility
Description
Description
Description

MASTER PLAN STUDY ON PORT DEVELOPMENT AND LOGISTICS IN GREATER JAKARTA METROPOLITAN AREA (JICA) FINAL REPORT
132
Table 5.1-34 Implementation schedule of Development Option-3
Ist Year 2nd Year 3rd Year 4th Year 5th Year 6th Year 7th Year
After L/A
North Kalibaru Phase I1. Administration Procedure
2. Construction Stage2.1 Access Road and Bridge2.2 Stage 1 of Container Terminal
Breakwaters and SeawallsDredging of Channel and BasinContainer Terminal Stage 1Terminal BuildingsContainer Handling EquipmentSecurity and UtilityStart of Terminal Operation Stage 1
2.3 Stage 2 of Container TerminalContainer Terminal Stage 2Terminal BuildingsContainer Handling EquipmentStart of Terminal Operation Stage 2Utility Facilities
2015 2016 2017 2018 2019 2020 2021
North Kalibaru Phase II1. Administration Procedure
2. Construction Stage2.1 Offshore Road and Bridge; 11.6 km2.2 Container Terminal
Demolition of Dam BaratSeawalls and RevetmentDredging of Channel and BasinQuay Wall Construction (2,000 m)Container Terminal II-1 (2 berth@300 m)Container Handling EquipmentStart of Operation Tereminal II-1Container Terminal II-2 (2 x 2 berths @350 m)Container Handling EquipmentStart of Operation Tereminal II-2Security and Utility
2020 2021 2022 2023 2024 2025 2026
North Kalibaru Phase III (2.3 million TEU)1. Administration Procedure
2. Construction StageBreakwaters
ConstructionDemolition of Dam BaratSeawalls and Revetment
Dredging of Channel and BasinQuay Wall Construction (1,600 m)Reclamation of Container YardContainer Terminal III-1 (2 berth@350 m)Start of Operation Tereminal III-1Container Terminal III-2 (3 berth@300 m)Start of Operation Tereminal III-2
Tangerang3. Construction Stage
3.1 Access Road and Bridge3.2 Container Terminal
BreakwatersSeawalls and RevetmentDredging of Channel and BasinBerth No.1 and No.2; 600 m
Container Handling EquipmentStart of West Terminal Operation
Berth No.3 and No.4; 600 mContainer Handling EquipmentStart of East Terminal Operation
Security FacilitiesSeervice Area and Utility Facilities
Description
Description
Description

MASTER PLAN STUDY ON PORT DEVELOPMENT AND LOGISTICS IN GREATER JAKARTA METROPOLITAN AREA (JICA) FINAL REPORT
133
(6) Construction Methods and Schedule
1) Dredging Work
Selection of Dredger Type
The total dredging volume for widening and deepening of the channel and basin of Tanjung Priok Port is estimated at over 20 million cubic meters in the stage of Phase I development of North Kalibaru. In order to complete the required dredging works in the limited work period, the best dredging method needs to be selected.
In the case of capital dredging of channel and basin, the deposit material is consolidated after compaction. The Cutter Suction Dredger is thus considered more suitable than TSHD.
Therefore, the combination of Cutter Suction Dredger and hopper barge is applied in the port development project as an economical dredging method with high productivity.
Use of Grab bucket dredger will be effective in the dredging works of deepening and expansion of the harbour basins and channel at the limited area.
Disposal Plan of Dredged Material
Tanjung Priok
The water area designated by ADPEL as the dumping site for the dredged material from Java Bay area in Tanjung Priok has been located in the area called Muara Gembong and was defined by the following coordinates.
05º 56’ 09”S, 106º 59’ 24”E ~ 06º 00’ 42”S, 106º 58’ 30”E
According to a recent instruction by ADPEL (Adpel Utama Tanjung Priok, 10th February 2010), the new dumping site is designated at a new location in the water area offshore Karawang, where the water depth is around 30 meters. Distance between the new dumping site and Tanjung Priok Port is around 26 km (14 nautical miles). The geographical location is given by the coordinates as follows.
1. 05º 51’ 54”S 106º 58’ 24”E 2 05º 51’ 04”S, 107º 00’ 40”E 3. 05º 51’ 56”S, 107º 01’ 09”E 4. 05º 53’ 02”S, 106º 58’ 47”E
Proposed Dumping Site for Cilamaya and Tangerang Development
In the construction planning of this study, new locations of the dumping site for the container terminal development projects are planned at offshore Cilamaya and Tangerang at a water depth of over 30 meters..
The distance between the site of Cilamaya Container Terminal and the proposed dumping site is 22 km (around 12 nautical miles).
The distance between the site of Tangerang Container Terminal and the proposed dumping site is 18 km (around 10 nautical miles).
Productivity of Dredging Plans
Proposed Dredger Fleet
Dredger fleet for the dredging works of channel and basin at Tanjung Priok Port and other development site as well is planned by employing Cutter suction dredgers operated by PT RUKINDO, a state-owned dredging company, instead of mobilizing such type of dredger from Singapore or Europe.
Two hopper barges are to be deployed for transportation and dumping of the dredged material.

MASTER PLAN STUDY ON PORT DEVELOPMENT AND LOGISTICS IN GREATER JAKARTA METROPOLITAN AREA (JICA) FINAL REPORT
134
- Cutter Suction Dredger equivalent to Batang Anai - Dredging depth: 24 m, - Dredging capacity 1,200 m3/hour - Base Port Tanjung Priok - Anchor Boat 65 GT Class, 150 HP - Hopper Barge Capacity: 2,000 m3 x 2 - Tug Boat Pusher 200 GT Class (1,600 HP) x 2
Productivity of Dredging
Productivity of the proposed dredging system is examined for Tanjung Priok Port (North Kalibaru development; Phase I and II) as follows (refer to Table 5.1-35).
- Dredging Performance The concentration of the dredged material is assumed as 40 % in the hopper. The dredged soil volume in the hopper barge is calculated as follows.
2,000 m3 x 40 % = 800 m3 (Dredging Performance per cycle) - Time to fill the capacity of 2,000 m3 hopper barge
Dredging capacity of the dredger is 1,200 m3/hour as above-mentioned. The time to fill the capacity of the barge is calculated as 0.67 hour (= 800/1,200).
- Sailing time (loaded) inside the harbor basin where port operations are busy; Sailing speed (loaded) is assumed as 3 knots; 3 (miles) / 3 (knots) = 1.0 hours
- Sailing time (loaded) from the dredging site to the disposal site Sailing speed (loaded) is assumed as 6 knots; 14 (miles) / 6 (knots) = 2.33 hours
- Dumping time at the disposal site: 0.25 hours (15 minutes) - Sailing time (empty) from the disposal site to the dredging site
Sailing speed (empty) is assumed as 8 knots; 14 (miles) / 8 (knots) = 1.75 hours
- Working Cycle Time: 0.67 + 1.0 + 2.33 + 0.25 + 1.75 +1.0 = 7.0 hours - Dredging and disposal cycles per day
Effective Working Time is assumed as 21 hours/day 21 (hours/day) / 7.0 (hours) = 3 cycles/day
- Productivity of dredging and disposal by two barges per day is calculated as follows. 3 (cycles/day) x 800 (m3/barge) x 2 (barges) = 4,800 m3/day
- Working-day is assumed as 28 days per month. 4,800 (m3/day) x 28 (days/month) = 134,400 m3/month
Over-dredging
It is empirically necessary to consider an over-dredging depth of 0.5 m in the dredging volume in order to achieve the design depth of the channel and basin. As the total dredging area for the proposed dredging work is about 1,750,000 m2, the assumed over-dredging volume amounts to 875,000 m3 (0.5 m x 1,750,000 m2), which is equivalent to about 10 % of the total design volume of dredging.
Productivity of the dredging work is also examined assuming the conditions of Cilamaya and Tangerang, which are presented in Table 5.1-36.

MASTER PLAN STUDY ON PORT DEVELOPMENT AND LOGISTICS IN GREATER JAKARTA METROPOLITAN AREA (JICA) FINAL REPORT
135
Table 5.1-35 Productivity of Dredging Work (North Kalibaru)
Description Calculation Dredging Performance per cycle 800 m3 per cycle Working Cycle Time 5.0 hours
Time to fill 2,000 m3 barge 0.67 hour; (2,000 x 40%)/1,200 m3/hour Sailing Time (inside the harbor) 2 x 1.0 hour (3 miles / speed: 3 knots)
Sailing Time (loaded; to dumping site) 2.33 hours (14 miles / speed: 6 knots) Dumping Time 0.25 hour
Sailing Time (empty) 1.75 hours (14 miles / speed: 8 knots) Effective Working Time per Day 21 hours/day Dredging Cycle per Day 3.0 cycles/day Production per Day 4,800 m3/day (2 x 3 (cycles/day) x 800 m3) per month 130,000 m3/month; 28 days/month
Table 5.1-36 Productivity of Dredging Work
(1) Cilamaya (Dumping site: 12 nautical miles distant) Description Calculation
Dredging Performance per cycle 800 m3 per cycle Working Cycle Time 5.0 hours
Time to fill 2,000 m3 barge 0.67 hour; (2,000 x 40%)/1,200 m3/hour Sailing Time (loaded; to dumping site) 2.0 hours (12 miles / speed: 6 knots)
Dumping Time 0.25 hour Sailing Time (empty) 1.5 hours (12 miles / speed: 8 knots)
Effective Working Time per Day 21 hours/day Dredging Cycle per Day 4.75 cycles/day (4.42 hours/cycle) Production per Day 7,500 m3/day (2 x 4.7 (cycles/day) x 800 m3) per month 210,000 m3/month; 28 days/month
(2) Tangerang (Dumping site: 10 nautical miles distant) Description Calculation
Dredging Performance per cycle 800 m3 per cycle Working Cycle Time 5.0 hours
Time to fill 2,000 m3 barge 0.67 hour; (2,000 x 40%)/1,200 m3/hour Sailing Time (loaded; to dumping site) 1.67 hours (10 miles / speed: 6 knots)
Dumping Time 0.25 hour Sailing Time (empty) 1.25 hours (10 miles / speed: 8 knots)
Effective Working Time per Day 21 hours/day Dredging Cycle per Day 5.5 cycles/day (3.84 hours/cycle) Production per Day 8,800 m3/day (2 x 5.5 (cycles/day) x 800 m3) per month 240,000 m3/month; 28 days/month
2) Reclamation and Soil Improvement
Procurement of Reclamation Material
A number of sources for procurement of reclamation material have been examined carefully not only in the area of West Java but also in neighbour regions such as the following candidate sites, Bojonegara (Banten Province, around 100km from Jakarta), Lampung (South Sumatra, around 200 km from Jakarta), and Bangka and Belitung Islands (Bangka-Belitung Province, around 350 km from Jakarta) are named as the candidate sources.
Sea sand mining has been strictly regulated on the coast of Tangerang and West Java considering beach erosion control and environmental conservation.

MASTER PLAN STUDY ON PORT DEVELOPMENT AND LOGISTICS IN GREATER JAKARTA METROPOLITAN AREA (JICA) FINAL REPORT
136
Average prices of reclamation material were advised as for mountain sand from Bojonegara as “20,000 Rp/ m3 + transportation: 85,000 Rp/ m3”, and as for procurement from Bangka / belitung Islands as “170,000 Rp/ m3 including Transportation cost”.
The source in the Bojonegra area closest to Jakarta among the candidate sites is assumed for procurement of reclamation material, where the required quality will be satisfied for the reclamation works planned in the projects of North Kalibaru, Cilamaya and Tangerang.
It is observed that the providing capacity of a provider is on the level of 5,000 m3 per day if it is equipped with belt conveyer system from mining point of the sand to the shipping point, and 20-ton class wheel loader and 40-ton class bulldozer with rippers. In order to secure safe and constant procurement of the material, two or three providers of this scale are necessary.
Transportation of Reclamation Material
Considering the environment of the development sites and the source area of reclamation material, transportation by floating barge is recommendable for smooth procurement of the material. Due to the following three main reasons, sea transport is selected over land transport.
- The first is, in case of on land transportation by dump trucks, heavy traffic congestion and disturbing urban traffic in and around Jakarta city will directly affect the construction schedule.
- The second is, a dump truck can carry only 10 tons of sand, and work efficiency will be very difficult to reach the target of the completion.
- The third is, dump truck transportation of a large volume material requires a large stockyard with a jetty for transhipment to the destination.
Due to the above reasons, sea transportation by floating barges is effective for the projects.
In order to secure safe and constant sea transportation of the material, and considering the distance from Bojonegara to the terminal construction sites on the north coast of West Java, the 2,000 - 5,000 tons capacity of hopper barge will be required.
For the Cilamaya project, a candidate source of reclamation material is located at Cipatat, around 25 km northwest of Bandung, where sufficient quantity and satisfactory quality of reclamation material for the project will be expected.
The quarry site is located inland 75km southwest from Cilamaya, and on land transportation by dump trucks will be applied in this case. The existing road condition of the route except toll highway is narrow and poor for heavy loaded vehicles, therefore construction of a temporary working road should be considered in the construction schedule connecting the existing highway junction with the development site of the Cilamaya terminal.
Recycle of Dredged Material
Considering tight construction schedule and the large reclamation volume, recycling of dredged material of the channel and basin should be examined.
As the result of Subsoil Conditions Survey in the development areas, the upper layers of the seabed consist of clay and silt with N value 0 – 2. The average depth of these very soft layers is from 8 to 10 meters in Tanjung Priok.
A possible way to make use of fine material from reclamation work is by applying the method of cement soil improvement. In case of using fluid mud, there are two methods of cement soil improvement. The first is a conventional method, in which cement soil improvement is done after reclamation by a pump dredger. The second is a new technology invented in Japan called “pipe-mixing method”.

MASTER PLAN STUDY ON PORT DEVELOPMENT AND LOGISTICS IN GREATER JAKARTA METROPOLITAN AREA (JICA) FINAL REPORT
137
The basic principle of the method is that dredged soft material is mixed with cement mortar and treated in the process of conveying in dredging pipe. In case of using this “pipe-mixing method”, the special purpose working barge and related devices for the system must be mobilized from Japan. The procurement cost of this system is considerably more expensive than conventional soil improvement method, i.e., vertical drain method, PVD, etc.
A preliminary cost estimate is carried out for applying “Pipe-mixing Method” for treatment of soft material in Jakarta Bay and to recycle the dredged material. Consequently the cost will range from 200,000 – 400,000 Rupiah for a cubic meter of treatment of soil. Thus by making use of recycled soft material, the cost will be double that of using mountain sand from quarries in the Bojonegara area.
Although applying the “pipe-mixing method” has a big merit in which the work period for reclamation can be shortened, its disadvantages are the higher construction cost and the inability to apply the recycling method.
Reclamation Works
Planned reclamation area for the projects are quite large (i.e., North Kalibaru Project Phase I: 77 ha, Phase II: 129 ha, and Phase III: 190 ha). Hence enclosure revetments should be constructed in advance of land reclamation. This is the method called “Section Landfill method” and is applied for the North Kalibaru Project.
Assuming required reclamation volume as 10,000~15,000 m3 per day, one segmented area can be planned to have around 25 ha. To divide the reclamation area into sections, partition dykes are constructed with rubble stone mound structure.
According to the subsoil conditions survey in the offshore area of North Kalibaru, the very soft layers with SPT-N value less than 10 has a 10 meters thickness from the seabed. The vertical drain method (PVD = Plastic Vertical Drain for example with 1 meter interval) will be applied in the reclamation area to accelerate consolidation of the soft layer and to acquire required foundation strength. Immediately after this work, pre-loading of surcharge soil method using imported mountain sand of good quality is placed on the PVD ground.
Based on experience in placing reclamation material in the water area of Tanjung Priok Port, ground is expected to settle with 3 meters thickness by consolidation of the soft layers and resulting subsidence. Therefore 3 meters thickness of mountain sand will be taken into consideration in the estimate of reclamation volume.
Soil Improvement
Vertical Drain Method
The foundation of breakwater was originally designed as sand replacement method. Sand Replacement, which is to replace soft layers with good quality sand, will not be applied due to the following reasons.
The existing soft layer has thickness of more than 5 m, and the volume to be removed is so great that the dredging volume and infill volume would raise costs considerably.
On the other hand, based on the soil characteristics, combination of Preloading and Vertical Drain methods will be appropriate and effective for compaction process of the poor soil layer and for accelerating the consolidation up to 90%.The project cost is estimated assuming that this method is applied for the reclamation works.
Sand Compaction / Deep Soil Mixing
For the construction of breakwater and revetment, Sand Compaction Pile method or Deep Soil Mixing method on the existing sea bed should be examined. In the case of applying Sand Compaction method, a huge amount of fine sand is required. However, considering environmental aspect and the surroundings in/ around the North Kalibaru area, it might be difficult to acquire such volume and quality of sand.

MASTER PLAN STUDY ON PORT DEVELOPMENT AND LOGISTICS IN GREATER JAKARTA METROPOLITAN AREA (JICA) FINAL REPORT
138
In the case of Deep Soil Mixing method, cement as main material seems to be easily procured and work quality seems to be controlled easier. The residual settlement is serenely generated in case that improvement is done by bearing layer. However, it must be noted that the cost of the method is relatively higher and that such an advanced method has never been applied before in Indonesia.
Compaction/Jet Grouting
As another option, Compaction/Jet Grouting method can be considered to increase the rate of consolidation and reduce the total amount of settlement.
In terms of reuse of dredged soft material as reclamation material, Pipe Mixing method, which is to improve soft soil characteristics by adding sprayed cement during the process of soil conveying into dredging pipe, seem to be effective. Cemented soil is relatively lightweight and it contributes to decreasing overburden loading by reclaimed.
Considering the advantages/disadvantages of the above applicable methods, combination of PVD with preloading is considered more practical among other methods; moreover, this method has been employed in Indonesia in the past.
As another option, Compaction/Jet Grouting method was considered to increase rate of consolidation and reduce total amount of settlement.
3) Quay Wall Construction
The structure of quay wall of the container terminal is designed as steel pipe piles foundation (D: 900 - 1,200 mm, L: 28 – 40 m) with upper RC (reinforced concrete) deck. The whole Quay Wall is comprised of divided blocks and the planned size of unit block is 30 m x 35 m. Estimated concrete volume is 500 m3 per block.
Piling Works
The foundation of the quay walls is planned as vertical steel pipe pile structure (D: 1200 mm, L: 40 m for North Kalibaru and Tangerang project; D: 900 mm, L: 28m for Cilamaya project). The steel pipe piles will be procured domestically from Indonesian local manufacturers.
The pile foundation will be constructed with battering method of piles by pile hammer. Considering the pile dimensions, the length and the sub soil conditions in each site, as long as using natural drop method by diesel hammer or hydraulic hammer, it is assumed that the ram weight of 8-ton hammer will be needed. The hammer is equipped to an appropriate capacity of piling barge.
Concrete Works on Upper Deck
The upper part of the quay wall is planned as In-situ RC structure. After completion of the piling works, temporary scaffolding at the bottom to support the loads of upper RC structure will be fabricated.
Fresh ready-mixed concrete for the projects will be considered for hot weather concrete in which daily average temperature is 25ºC or higher. The concrete for North Kalibaru project will be procured from several concrete plants located in the Jakarta area. Considering heavy traffic congestion through the Jakarta metropolitan region during the daytime, concrete should be transported at night time. To decrease the risk mentioned above, it is recommended that the contractor set up a concrete plant facility at each site.
Concrete Placing will be carried out with concrete pump(s) having appropriate pressure and working range. Considering planar dimensions of a unit block as 30 m x 35 m, concrete volume of a unit block and concrete leveling and finishing speed, the minimum requirement of a concrete pump truck should be 22-ton class (50 – 120 m3/hour, piston type) equipped with minimum 40 m working range including extension hose.

MASTER PLAN STUDY ON PORT DEVELOPMENT AND LOGISTICS IN GREATER JAKARTA METROPOLITAN AREA (JICA) FINAL REPORT
139
4) Breakwater and Seawall Constructions
Breakwater will be constructed to provide shelter not only to the port basin but also the working area of the construction from wave actions particularly during stormy conditions and northwest monsoon season. The construction schedule of those protective facilities should be placed as the forerunner of the implementation schedule.
Foundation and Soil Improvement
The foundation of breakwater was originally designed as sand replacement method. Considering the tight construction schedule and high price of good quality sand, it is recommended that combined use of Vertical Drain Method and Pre-loading of surcharge load (mountain sand) at the foundation be adopted instead of sand replacement method aiming at compaction of the layers of soft material and enhancement of the shear strength.
The Vertical Drain Method will be applied up to the depth of the layers where SPT-N value is less than 10, and placement of mountain sand (surcharge load) follows to accelerate consolidation and compaction of the soft layers.
The basic structure of breakwater is planned as rubble-mound type and wave dissipating concrete blocks (6.3-ton, 2-ton types of Tetrapod, for example) and concrete blocks (0.9 - 0.7m cube) will be used for the armour layers.
In the case of North Kalibaru Project, the materials from the existing breakwater (planned to be demolished or relocated) will be recycled for the construction of the new breakwater and revetment for the purposes of saving construction cost and reducing environmental risks by dumping.
Rubble Stone Mound
Rubble stone will be procured from several sources mainly around Bojonegara area and stones will be transported on the sea by floating barge. As the first step of rubble mound construction, the rubble stones will be loaded on the flat barge by wheel loader (20-ton class) and excavator (2 m3 class) to gain assumed daily-required volume as 4,000 m3.
According to the Consultant’s field studies, existing providers around the Bojonegara area work on a relatively small scale, that is, average capacity of their own equipment is the level of excavator (1.2 m3 class) and wheel loader (2.2 m3 class). Hence, in order to gain the required volume, material should be procured from a number of sources or new additional investment to enhance the equipment capacity will be required.
Barges having size of 2,000 – 5,000-ton class are assumed to be employed for the works schedule planning
Wave Dissipating Concrete Blocks and Cube Blocks
Fabrication of Blocks
Fabrication of concrete blocks for the projects will be executed in and around the contractor’ s construction site on land. For North Kalibaru projects, two potential candidate yards will be available in Marunda area behind Marunda Harbor located within 10 km distance from Tanjung Priok Port. The cost estimate of these works is based on the fabrication around these sites
Ready-mixed Concrete
There are many concrete mixing plants commercially operated in the Jakarta area. Supply capacity is approximately 300 m3 per day in average by each plant and generally their quality control is stable.
Installation
Considering the weight of one wave dissipating block (6.3-ton or 2-ton), the installation equipment will be a crane barge (80~50-ton class crane outfitted properly on 1,000-ton ~ 1,500-ton class barge).

MASTER PLAN STUDY ON PORT DEVELOPMENT AND LOGISTICS IN GREATER JAKARTA METROPOLITAN AREA (JICA) FINAL REPORT
140
Crown Concrete
Crown concrete is placed by in-situ method. Considering the sectional shape, Expansion joint will be installed usually every 10 m in longitudinal direction.
Ready mix concrete transported by concrete agitating trucks will be carried to the placing point on the sea by using flat barge.
5) Revetment
Foundation and Soil Improvement
The revetment structure is designed with rubble-mound type with coping concrete, except the north revetment of North Kalibaru site that has steel sheet piles (L=25m) foundation behind of rubble mound and under coping concrete.
Soil improvement works by Vertical Drain Method will be applied at the foundation aiming at compaction of the layers of soft material and enhancement of the shear strength. Soil improvement is designed up to the depth of the layers where SPT-N value is less than 10, and placement of mountain sand (surcharge load) follows to accelerate consolidation and compaction of the soft layers.
Rubble mound
Rubble stones of revetment/seawall for each project will be procured from Bojonegara by barge transportation on the sea. After rubble mound is piled up, geo-textile sheets, which prevent diffluence of reclamation material, should be carefully placed.
Armor Stone
Armor stones of revetment for all projects as well are assumed to be procured mainly from Bojonegara. Installation of armour stones is executed by crane (50-ton class) from reclaimed land or by crane barge (50-ton class) on the sea.
Coping Concrete
Ready-mixed concrete suitable for hot weather is procured from concrete plants nearby each project site considering mixing capacity and transportation time. Material of Formworks is basically woody comprised plywood, 4 x 4, and 2 x 4 square timber. Concrete placing will be done by using crane barge (50-ton class) equipped with hopper. Concrete blocks will be fabricated in temporary fabrication yard prepared for each project.
6) Maintenance Dredging at Tanjung Priok Port
Sedimentation in Tanjung Priok Port
Sedimentation at Tanjung Priok Port and maintenance dredging of the navigation channels and harbor basins have been studied in the previous JICA Study (2002 – 2003). Reviews on the previous studies and the findings of the progress of latest 5 years are presented in this section.
Port Location
Tanjung Priok Port is located on the northeastern coastline at the outskirts of DKI Jakarta. The surrounding area of the port is flat with the elevation of approximately 2 m (MSL), and the coastline runs nearly in the east-west direction. According to the navigation chart of the Jakarta Bay area, the seabed slope is about 1/500 and the depth contour lines are seen parallel with the coastline of the bay.
Many rivers and drainage canals run in the south-north direction through the flat terrain surrounding the port. The following three rivers or drainage canals flow into the waters of Tanjung Priok Port.
- Kali Sunter Baru flows into Pelabuhan Minyak (Pertamina) at the eastern end of

MASTER PLAN STUDY ON PORT DEVELOPMENT AND LOGISTICS IN GREATER JAKARTA METROPOLITAN AREA (JICA) FINAL REPORT
141
the port - Terusan Lagoa flows into the water area between JICT and TPK Koja - Kali Ancor flows into Pelabuhan Nusantara at the western end of the port
The areas surrounding Tanjung Priok Port have been rapidly urbanized through 1950s to 1980s.
Thus the harbor basins of Tanjung Priok Port accept the rain water drainage from the urbanized Jakarta with their carrying solid wastes.
Sedimentation in the Water Areas of Tanjung Priok Port
The sounding surveys for the purpose of Pre- and Post-Dredging of the harbor basins and channels have been carried out several times a year by PELINDO II (Cabang Tanjung Priok). Those existing sounding data (1991 - 2001) were analyzed in the previous JICA Study to study the seabed changes in the water areas of Tanjung Priok Port. The following features were verified by the study.
- In the west access channel to the Tanjung Priok Port (Ambang Luar Barat), the seabed had risen for about +0.5 m per year in average at the channel center. The seabed rise presents smaller with respect to the distance from the entrance of the harbor (Pintu Masuk).
- The outlet area of Kali Sunter Baru at Pelabuhan Minyak presented the highest value of seabed rise, which was evaluated about +7.0 m per year. The second highest was about +2.0 m per year at the middle of Pertamina berth.
- The seabed rise at the harbor basins Pelabuhan I, II and III was evaluated very small and estimated at less than +10 cm per year.
- While the seabed rises at the harbor basins and the water areas inside the breakwater were evaluated higher, it was evaluated lower at the channel outside the breakwater. The seabed rises along the approach channel (Ambang Luar Barat; around 3 km) were evaluated 0.1 m to 0.5 m per year.
The main source of the seabed rise at the water areas inside the breakwater is considered due to
sedimentation of the materials carried by the drainage canals such as Kali Sunter Baru, Terusan Lagoa and Kali Japat, into the harbor basins of Tanjung Priok.
Maintenance Dredging
Maintenance dredging in Tanjung Priok Port has been carried out regularly and maintained at the designed depth at major channels and basins.
Summary of Maintenance Dredging Volume at Tanjung Priok Port
The records of maintenance dredging volume are presented in the following table.
Table 5.1-37Average Annual Dredging Volume for 2005 - 2009
Year Dredging at
Channels Dredging at
Harbor Basins Total Contract
Volume 2005 300,000 305,592 605,592 2006 474,455 156,955 631,410 2007 430,231 37,618 467,849 2008 553,165 247,521 800,686 2009 241,942 117,958 359,900
Average 399,959 173,129 573,087 (Source: PELINDO II, Cabang Tanjung Priok, Technical Division; Unit: m3/year)
According to the average maintenance dredging at each part of the channel and harbour basin
in Tanjung Priok Port, the following findings are noted.

MASTER PLAN STUDY ON PORT DEVELOPMENT AND LOGISTICS IN GREATER JAKARTA METROPOLITAN AREA (JICA) FINAL REPORT
142
Dredging in Channels
The annual volume is around 400,000 m3/year in the navigation channels, and the east – west channel from the eastern innermost of the port (DKP) to the west entrance (Alur DKP s/d Pintu Masuk; depth: -14 m, length: 3,530 m) shows the largest maintenance dredging volume, accounting for over 50 % of the volume (181,000 m3/year + around 55,000 m3/year at Dermaga TPK Koja and Dermaga JICT).
The access channel to the west entrance of the port (Ambang Luar Barat; -14 m, 3 km) accounts for around 25 % of the volume (105,000 m3/year).
Dredging in Harbor Basins
As for the harbor basins, the annual volume is around 180,000 m3/year, and the basin Pelabuhan Mynyak accounts for the most portion of the volume (113,000 m3/year). The smaller basins of Pelabuhan I, II and III account for around 25 % of the volume (45,000 m3/year).
The sedimentation in the harbor basins of Tanjung Priok is largely affected by the materials transported by the drainage canals such as Kali Sunter Baru, Terusan Lagoa and Kali Japat, flowing into the harbor of Tanjung Priok Port. That is the reason why the sedimentation volume in the areas of Pelabuhan Minyak and Alur DKP s/d Masuk Barat shows larger figures.
Meanwhile, as for the channel inside and outside the east entrance, no maintenance dredging has been executed in the last 20 years. This section of the channel is neither maintained nor used by any outgoing or entering vessels except some small boats.
As mentioned and discussed in the previous sub-section, the major reason of the maintenance dredging in the port area of Tanjung Priok is due to sedimentation of the materials carried by the drainage canals such as Kali Sunter Baru, Terusan Lagoa and Kali Japat, into the harbor basins of Tanjung Priok.
Table 5.1-38 presents the characteristic factor for the average volume of yearly sedimentation as the parameter of horizontal projection area of the channel or basin.
The sedimentation in the approach channel (outside the breakwater) due to wave actions and longshore current can be considered not large in Jakarta Bay and the surrounding area of Tanjung Priok, which accounts for around 20 % of the total volume of maintenance dredging at Tanjung Priok Port (Amabng Luar Barat 2000 – 2009: 105,000 m3/year, and Total Contract Volume 2005 – 2009: 575,000 m3/year).
The sedimentation in the approach channel (outside the breakwater) due to wave actions and longshore current can be considered not large in Jakarta Bay. The average sedimentation per year is evaluated as 0.22 m3/year/m2.
As for the harbor basin (inside the breakwater), where not largely affected by the river effluence and materials, the average sedimentation per year is evaluated as 0.15 m3/year/m2.

MASTER PLAN STUDY ON PORT DEVELOPMENT AND LOGISTICS IN GREATER JAKARTA METROPOLITAN AREA (JICA) FINAL REPORT
143
Table 5.1-38 Records of Maintenance Dredging Volume at Tanjung Priok Port (Average 2000 - 2009)
Division of Channel / Basin
Depth (m) A: Maintenance Dredging Volume
(2000 - 2009)
B: Horizontal Area of
Channel / Basin
Average Sedimentation
per Year (A / B)
Width (m) Length (m) Side Slope
Alur DKP s/d Pintu Masuk Barat
-14 m 181,000
(m3/year) 353,000 m2
0.51 m3/year/m2
100 m 3,530 m
1:4.0
Alur Utara Pelabuhan I
s/d Pintu Masuk
-14 m 28,000
(m3/year) 192,500 m2
0.15 m3/year/m2
100 m 1,925 m
1:4.0
Ambang Luar Barat
-14 m 105,000
(m3/year) 483,000 m2
0.22 m3/year/m2
100~150 m 3,000 m 1:4.0
Source: JICA Study Team based on data from PELINDO II (Cabang Tanjung Priok)
Dumping Site of Dredged Soils
The dumping site of the dredged material from Tanjung Priok Port has been designated in the water area called Muara Gembong which is located at the water area offshore Karawang at a depth of around 30 meters. Distance between the new dumping site and Tanjung Priok Port is around 26 km (14 nautical miles).
(7) Preliminary Cost Estimate
1) Construction Procurement
Construction Materials
Almost all the construction materials are produced domestically in Indonesia and can be procured in the market. The prices have been relatively stable in the recent years.
Construction Equipment
There exists a well-developed leasing market of construction equipment in Indonesia. According to the hearings from the major construction companies, most of the general-purpose construction equipment (such as bulldozers, backhoes, shovel loaders, concrete mixers, etc.) mobilized in the large-scale construction of public works can be procured from the leasing market.
Capability of Construction Companies
The fields of construction where the Indonesian local companies have experience are mainly building and housing development, road construction, water supply and sewerage construction, irrigation, etc. They also have relatively sufficient experience in marine construction.
2) Basis of Construction Cost
Unit price of labour / material / equipment
Unit price of each element such as labour, construction material and construction equipment are to be determined on the basis of the information collected in the field study (Jakarta and Bandung, July and October 2010).

MASTER PLAN STUDY ON PORT DEVELOPMENT AND LOGISTICS IN GREATER JAKARTA METROPOLITAN AREA (JICA) FINAL REPORT
144
Exchange Rate of Currencies
The basic prices are as of July and October 2010 and the foreign exchange rate is given as follows considering the current trend at the end of 2010.
1 USD = 9,000 Rupiah, 100 Yen = 11,000 Rupiah
Foreign and Local Portion in Prices
Each unit price was split into foreign currency and local currency portions, both indicated in Rupiah, estimated in the following classifications;
The foreign currency component consists of:
- Imported construction materials - Foreign components of depreciation and operation/maintenance cost for
construction equipment and plant - Foreign component of domestic materials - Salaries and costs of foreign personnel
The local currency component consists of:
- Local construction materials - Local components of depreciation and operation /maintenance cost for
construction equipment and plant - Salaries and costs of local personnel - Import duty on imported materials - Indonesian taxes
3) Basic Cost of Project Works
Construction Works
The breakdown of unit costs of the construction works are to be prepared by accumulating costs of labour, materials, equipment and also the indirect costs such as general temporary works, overheads profit and so on.
The combined cost for major construction works is estimated from the costs of labour, required materials, required construction equipment, and the site expense of labour and equipment. The utilities cost of such as water, electric power and drainage refers to the other projects in the equivalent scale.
In addition to the construction cost and procurement cost, the engineering fee for the detail design and construction supervision, physical contingency and VAT are estimated in this study. The engineering cost for survey, detailed design and construction supervision is assumed as about 3 % of the direct construction cost in this case of port development. The physical contingency is assumed as 10 % for the construction cost.
Unit Cost of Container Handling Equipment
The unit cost of container handling equipment will include the costs of design, manufacturing, workshop tests, delivery and installation. Procurement Cost for the major equipment is given as follows for the preliminary engineering study (as of October 2010).
Price of imported products such as cargo handling equipment, computer systems and navigation aids are to be estimated based on the CIF Jakarta price and some transportation cost to the development site is considered. Japan or China is assumed as the place of manufacturing.
Maintenance Cost (Facility, Equipment, Dredging)

MASTER PLAN STUDY ON PORT DEVELOPMENT AND LOGISTICS IN GREATER JAKARTA METROPOLITAN AREA (JICA) FINAL REPORT
145
The yearly maintenance cost for civil works is set out as 1 % of the facility construction cost based on the annual maintenance fee of the facilities. Also, 3 to 5 % of the procurement cost of the equipment is adopted as the maintenance cost for the equipment.
Access channels and basins of Tanjung Priok Port are maintained by periodical maintenance dredging, which is financed by PELINDO II and carried out by P.T RUKINDO. The average annual volume of maintenance dredging is about 550,000 m3/year based on average from 2005 - 2009.
The unit price of maintenance dredging is estimated as follows based on the actual contract record of 2008 between PELINDO II and PT RUKINDO. The yearly rate of inflation is assumed as 5 % for the period 2008 to 2010 (IMF, World Economic Outlook Database, September 2010 for Indonesia).
- Grab Dredging Rp. 31,000/m3 (Rp 28,000/m3 as 2008 price) - Hopper Dredging Rp. 21,000/m3 (Rp 19,000/m3 as 2008 price)
5.2 New Bulk Terminal Development
(1) New Bulk Terminal Development at North Kalibaru
1) Petroleum Terminal
The volumes of petroleum products to be transferred to a new petroleum terminal in 2030 have been estimated as 4.4 million MT. To handle the above volume for PERTAMINA and additional volumes for the potential dealers other than Pertamina, four berths in total have been planned as follows:
- Total berth length: 270 m/berth x 4 berths = 1,080 m - Water depth: -15.5m
2) Dry Bulk Terminal
The volumes of dusty dry bulk cargoes to be transferred to a new dry bulk terminal in 2030 have been estimated as 18.4 million MT. To handle the above volume, total berth length has been estimated to be 915 m. The same water depth of 15.5 m has been adopted in the bulk terminal planning throughout the berth line.
(2) Implementation Schedule of Master Plan
1) Petroleum Terminal
It is planned to implement the Petroleum Terminal in the latter half of the third phased implementation stage in the period from 2020 to 2030.
2) Dry Bulk Terminal
It is planned to implement the Petroleum Terminal in the latter half of the third phased implementation stage in the period from 2020 to 2030.

MASTER PLAN STUDY ON PORT DEVELOPMENT AND LOGISTICS IN GREATER JAKARTA METROPOLITAN AREA (JICA) FINAL REPORT
146
(3) Preliminary Design and Cost Estimate
1) Facility Plan of dry bulk terminal and petroleum products Terminal
Dry Bulk Terminal
- Quay wall ; Length 915m, Depth -15.5m - Stock Yard development by Reclamation, Revetment;
Yard Area; Backup distance 200 m, length 900 m along the berth, Area 18 ha. Concrete pavement with drainage system
- Terminal Inner Road; The terminal inner road is planned to have 12 m width for 3 lanes with two-way traffic and concrete pavement (t=20cm) with gravel coarse foundation (t=30cm) to sustain the standard trucks (H22-44) wheel load of 8.0 ton/wheel. The road is planned to be constructed between the revetment wall and edge of bulk cargo stock yards on the north sides with a length of 1,010m.
Petroleum Product storage terminal
It is assumed that the following facilities of petroleum yard will be developed.
- Quay wall is planned as dolphin detached type structure, which shall be designed by the users according to their usage and type of tankers to call. Tentatively the necessary water front distance is planned to develop 4 berths. There will be a breakwater (New Dam Tengah) on the inner channel side, which will be developed under URPT and can be used as revetment of the reclaimed land for petroleum products storage yard.
- Storage yard will be developed by reclamation and construction of seawall and revetment; Yard Area is planned to have a backup distance of 600 m and water front length of 1,080 m along the berthing facilities, Area; about 60 ha. The yard pavement is not planned, which shall be determined the specified areas and type by users.
- Terminal inner road will be developed with drainage system
2) Design Criteria
All the applicable design criteria of the above facilities except the following is the same criteria as described in Chapter 5.1.2, since its construction site is located adjacent to the new container terminal berth at North Kalibaru.
Objective ship size is as shown in 2) above for dry bulk carrier.
Loading conditions such as surcharge on the dry bulk berth is set at 25 kN/m2 considering the type of bulk cargo handling equipment, while it is set at 35 kN/m2 on the dry bulk stock yard.
The design criteria for preliminary design of petroleum tanker berthing facilities will be decided by users
3) Design of Quay wall structure of bulk cargo
As a result of the comparison study, "Concrete deck on Steel Pipe Pile type" is considered suitable as the selected quay wall type for the new bulk cargo terminal due to similar soil conditions, seismic conditions at site, which is located adjacent to the new container terminal. The quay wall structure is planned to be constructed in front of the rubble mound type breakwater (Dam CITRA), which is required as part of the new container terminal development at North Kalibaru.

MASTER PLAN STUDY ON PORT DEVELOPMENT AND LOGISTICS IN GREATER JAKARTA METROPOLITAN AREA (JICA) FINAL REPORT
147
The retaining wall between the back up yard reclamation and quay wall is planned by steel sheet pile to protect the channel as dredged up to -15.5m and from sliding this breakwater and the reclaimed material for storage area.
The new bulk berth is planned on the same line as the new container berths
Table 5.2-1 Particulars of Quay wall of Bulk Cargo
Location North Kalibaru New Terminal in Tajung Priok Target Throughput 18, 395,000 Ton/year Berth Length 915m Berth Water Depth CDL-15.5m Number of Berths 1 for Panamax, 2 for coal barge, 4 for sand barge Target Vessel Size 80,000 DWT Quay wall Structure Concrete Deck on Open Steel Pipe Pile
Ø1200,t=20mm, driven up to - 32.50m DL (N-,50), with retaining wall by concrete blocks on top of rubble mound
Crown Height of Quay wall CD+3.50m Terminal Yard Backup Length 200 m Bulk handling cranes Movable cranes lifting and grab type Fender Rubber Fender 1150H, @12m Bollard 100 tons @ 30m Source: JICA Study Team
4) Yard Development by Reclamation for dry bulk terminal
New seawall on the north side and east side revetment of reclaimed land
The yard for new bulk terminals is planned to be developed by reclamation to the west of the new container terminal at North Kalibaru. The new sea wall on the north side (L=1,200m) will be constructed to protect reclaimed land from the wave and sediment material carried by the current with rubble stones piled up and armour stones thereon.
The soil condition of the foundation at the upper layer of depth -4.5m is soft and loose sand grey. The same type of seawall structure for reclamation as adopted for the new container terminal at North Kalibaru is selected due to the location on the extension of such container berth.
The seawall structure is designed with the same concept as planned for the new container terminal at North Kalibaru.
The revetment on the east side as boundary of the petrochemical products storage area is planned by the same type (rubble stone mound type with PVD for sea bed soil improvement) as planned for the new container terminal at North Kalibaru.
For development of the petroleum yard, the seawall for petroleum storage yard on the north side and revetment on the east side are required for development of the reclamation. Under this Study the same type of seawall and revetment structures of the bulk terminal are applied for petroleum storage yard protection.
Reclamation works
Reclamation works will be carried out by filling material such as quarry run and rubble stones taken from the quarry around the project sites. The infill materials will be transported by dump trucks from the existing quarry near the project site.

MASTER PLAN STUDY ON PORT DEVELOPMENT AND LOGISTICS IN GREATER JAKARTA METROPOLITAN AREA (JICA) FINAL REPORT
148
The infill material should be filled from the existing sea bed up to +2.0 m from CDL. Average thickness of reclamation will be 6 to 7 m. Average elevation of the planned yard after pavement will be +3.5 m (MSL+3.0m).
The soil improvement for the reclamation area is considered by the Plastic vertical drain (PVD) method at the foundation of the seawall, revetment and terminal inner roads areas. This method is one of the most practical methods of compaction for granular material.
Yard Pavement
Based on the operation planning inside the bulk cargo storage area and petroleum storage area, the pavement type shall be planned and selected by users according to their usage of respective areas. The pavement of the terminal inner road will be planned and developed by the Land developer (Port Authority), which shall be sustaining the following wheel loads as the critical condition for each type and area of the pavements.
5) Cargo handling equipment for dry bulk cargo
For loading and unloading clinker (export) and gypsum (import) on the berth the following type of handling equipment is tentatively considered for preliminary design of berthing facilities. Required number and type of such equipment shall be determined depending on the progress of demands and user’s requirement.
Table 5.2-2Applicable Typical Handling equipment for Dry Bulk
Crane lifting capacity 20 ton x 21.5 m working radial Grab lifting capacity 25 ton x 18.8 m working radial Loading arm length About 30m Height of crane, width About 25 m, control room height; about 13-15m,
Width between wheel on both sides; 9.0 m
The suitable unloading equipment of petroleum products on the working platform and dolphins at each berthing facilities will be determined by each user’s own choice.
(4) Preliminary Cost Estimate of Bulk Terminal Development
Preliminary project cost estimate is carried out for the Bulk Terminal development in Tanjung Priok. The development is assumed to be implemented following Container Terminal development at North Kalibaru (Phase I of Alternative-1) targeting the bulk cargo and petroleum cargo demands in 2030.
The following work items are taken into account in the preliminary cost estimate of the terminal development.
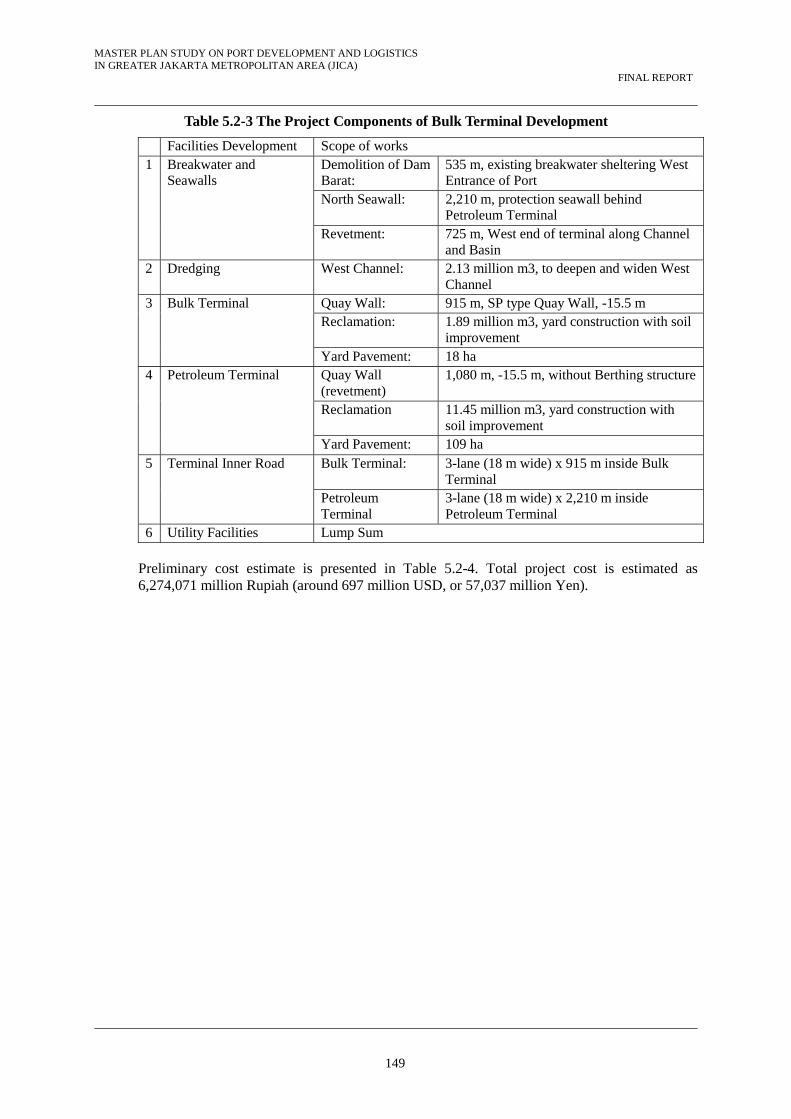
MASTER PLAN STUDY ON PORT DEVELOPMENT AND LOGISTICS IN GREATER JAKARTA METROPOLITAN AREA (JICA) FINAL REPORT
149
Table 5.2-3 The Project Components of Bulk Terminal Development
Facilities Development Scope of works 1 Breakwater and
Seawalls Demolition of Dam Barat:
535 m, existing breakwater sheltering West Entrance of Port
North Seawall: 2,210 m, protection seawall behind Petroleum Terminal
Revetment: 725 m, West end of terminal along Channel and Basin
2 Dredging West Channel: 2.13 million m3, to deepen and widen West Channel
3 Bulk Terminal Quay Wall: 915 m, SP type Quay Wall, -15.5 m Reclamation: 1.89 million m3, yard construction with soil
improvement Yard Pavement: 18 ha
4 Petroleum Terminal
Quay Wall (revetment)
1,080 m, -15.5 m, without Berthing structure
Reclamation 11.45 million m3, yard construction with soil improvement
Yard Pavement: 109 ha 5 Terminal Inner Road Bulk Terminal: 3-lane (18 m wide) x 915 m inside Bulk
Terminal Petroleum Terminal
3-lane (18 m wide) x 2,210 m inside Petroleum Terminal
6 Utility Facilities Lump Sum
Preliminary cost estimate is presented in Table 5.2-4. Total project cost is estimated as 6,274,071 million Rupiah (around 697 million USD, or 57,037 million Yen).

MASTER PLAN STUDY ON PORT DEVELOPMENT AND LOGISTICS IN GREATER JAKARTA METROPOLITAN AREA (JICA) FINAL REPORT
150
Table 5.2-4 Preliminary Cost Estimate of Bulk Terminal / Petroleum Terminal
(1,000 Rupiah) (1,000 Rupiah)
1. General Cost 155,530,618 84,120,710 239,651,328
2. Direct Construction Cost
(1) Breakwaters
Demolition of Dam Barat m 535 7,490,000 11,235,000 18,725,000
(2) Seawalls
North Seawall m 2,210 140,803,994 101,375,881 242,179,875
Revetment m 725 23,762,588 4,065,416 27,828,003
(3) Port Inner Road m 3,150
(4) Dredging Channel and Basin
Deepening (-15.5 m) 2,134,306 69,900,250 92,332,045 162,232,295
(5) Bulk Terminal
Quay Wall m 915 354,239,089 213,728,537 567,967,625
Yard Construction ha 18
Reclamation (DL+3.5 m) m3 1,350,000 132,285,682 53,493,982 185,779,664
Reclamation (Surcharge 3 m m3 540,000 52,914,273 21,397,593 74,311,865
Soil Improvement m2 180,000 21,668,790 9,286,624 30,955,414
Passage Pavement m2 180,000 68,040,000 45,360,000 113,400,000
(6) Petrol Terminal
Revetment (Quay Wall) m 1,080 230,217,451 172,593,454 402,810,905
Yard Construction ha 109
Reclamation (DL+3.5 m) m3 8,175,000 801,063,297 323,935,778 1,124,999,075
Reclamation (Surcharge 3 m m3 3,270,000 320,425,319 129,574,311 449,999,630
Soil Improvement m2 1,090,000 131,216,561 56,235,669 187,452,229
Passage Pavement m2 1,090,000 412,020,000 274,680,000 686,700,000
(7) Utility Faclities
Utility Faclities l.s. 1 252,409,046 130,028,595 382,437,641
Sub-total of Direct Cost (DC) 3,110,612,355 1,682,414,207 4,793,026,562
3. Project Related Expenses (PE) 435,485,730 235,537,989 671,023,719
(1) Engineering Services l.s. 1 93,318,371 50,472,426 143,790,797
(2) Contingency l.s. 1 311,061,236 168,241,421 479,302,656
(3) Administration Cost l.s. 1 31,106,124 16,824,142 47,930,266
4. Total Construction Cost 3,701,628,703 2,002,072,906 5,703,701,609
VAT 370,162,870 200,207,291 570,370,161
Grand Total of Bulk and Petroleum Tertminals Develo 4,071,791,573 2,202,280,197 6,274,071,770
1 USD = 9,000 Rupiah 697,119 *1,000 USD
1 Yen = 11,000 Rupiah 57,037,016 *1,000 Yen
Unit QuantityDescriptionLocal
PortionForeignPortion Summation
MASTER PLAN STUDY ON PORT DEVELOPMENT AND LOGISTICS IN GREATER JAKARTA METROPOLITAN AREA (JICA) FINAL REPORT
151
5.3 Access Road Development
(1) Access Road Development for the Master Plan at North Kalibaru
1) Summary of access road
The project of North Kalibaru is the expansion of the existing Tanjung Priok Terminal. The proposed terminal will be constructed on the land reclamation area off shore of Jakarta bay.
Two alternatives for the layout of the new terminal of North Kalibaru are proposed by the Study Team. An access road is also designed for each layout. In order for traffic on the new access road to avoid the current congested road network in Jakarta Metropolitan Area, the access road will connect the new terminal to the East Metropolitan Region through the off shore area.
2) Traffic demand forecast
The development of North Kalibaru is divided into three phases based on future cargo demand and the construction schedule. The targeted annual capacity of North Kalibaru will reach 1.9 million TEU in Phase 1, 3.2 million TEU in Phase 2 and 4.3 million TEU in Phase 3. The total cargo capacity of North Kalibaru will reach 9.4 million TEU. Total cargo handing capacity of Tanjung Priok Terminal will reach 13.4 million TEU including the existing capacity of 4.0 million TEU.
Phase 1 of North Kalibaru terminal will start operation with a handling capacity of 1.9 million TEU. The traffic volume for phase 1 of North Kalibaru is 16,304 pcu/day.
The terminal of North Kalibaru will be expanded in 2019 for Phase 2 and in 2024 for Phase 3. Planned additional handling capacity of North Kalibaru in Phase 2 is 3.2 million TEU and 4.3 million TEU in Phase 3. Total capacity of North Kalibaru will reach 9.4 million TEU including that of Phase 1. The traffic volumes for phase 2 and 3 of North Kalibaru are 43,780 pcu/day and 80,680 pcu/day respectively.
After Phase 2 is completed, there will be two access roads available, one is the arterial road to southward and the other is the dedicated road eastward.
According to the result of the traffic survey, 65% of traffic shall pass through the dedicated access road (to East) and 35% of traffic shall pass through the arterial road (to South and West). The estimated traffic volume in 2030 is 52,442 PCU/day on the dedicated road and 28,238 PCU/day on the arterial road.
3) Preliminary design of access road
A four-lane road is sufficient for the access road to North Kalibaru.
The access road connects the new terminal facility with JORR2, passing through the coastal area in front of the development area of Marunda and Bekasi. The total length of the access road is 19.3 km, consisting of 9.0 km inland and 10.2 km along the coast.

MASTER PLAN STUDY ON PORT DEVELOPMENT AND LOGISTICS IN GREATER JAKARTA METROPOLITAN AREA (JICA) FINAL REPORT
152
Source: JICA Study Team
Figure 5.3-1 Plan for access road for North Kalibaru
While the road level on the inland section is almost the same as the ground level, a certain vertical clearance must be secured in the coastal section. In addition, it is necessary to secure a certain horizontal and vertical clearance for the car carrying vessel plying the east access channel of North Kalibaru for alternative 2.
4) Implementation schedule
The construction of Access Road for Alternative 1 will require for three years. - To integrate environmental and social consideration into evaluating and
prioritizing development alternatives for a new container terminal. - To contribute to decision making on formulating the master plan.
- Road: 4-lane, L=9.0km, 2 bridge, 1 Interchange - Overpass bridge: 2 places - Port Access Bridge: 4-lane, L=10.3km
The construction of Access Road for Alternative 2 will require for four years.
- Road: 4-lane, L=9.0km, 2 bridges, 1 Interchange - Overpass bridge: 2 places - Approach from Extra dosed
bridge to harbor facilities: 4-lane, L=0.5km - Port Access Bridge: 4-lane, L=13.3km - Extra dosed bridge: 4-lane, L=0.3km
5) Preliminary Cost Estimate
The construction cost of Alternative 1 “Access Road” is estimated at Rp 11,940,860 million.
Access Road
JORR2(NE)
North Kalibaru Port
Development area
Karang River
Power Plant
To Karawang
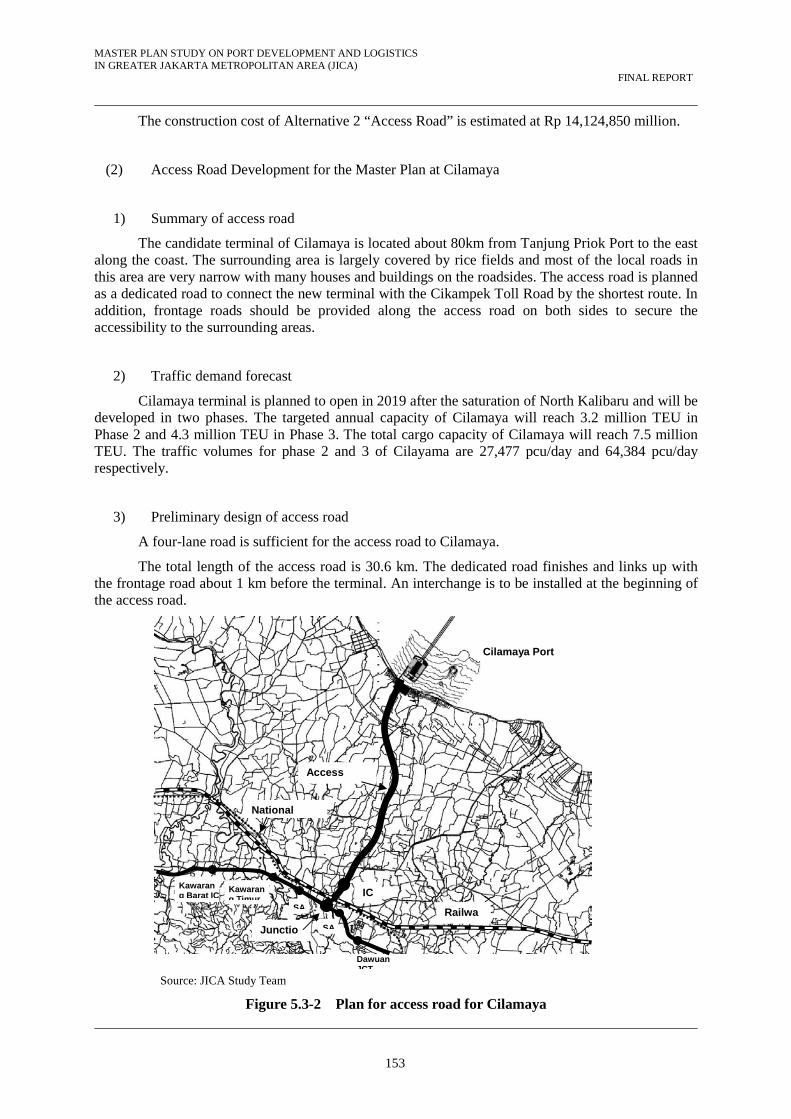
MASTER PLAN STUDY ON PORT DEVELOPMENT AND LOGISTICS IN GREATER JAKARTA METROPOLITAN AREA (JICA) FINAL REPORT
153
The construction cost of Alternative 2 “Access Road” is estimated at Rp 14,124,850 million.
(2) Access Road Development for the Master Plan at Cilamaya
1) Summary of access road
The candidate terminal of Cilamaya is located about 80km from Tanjung Priok Port to the east along the coast. The surrounding area is largely covered by rice fields and most of the local roads in this area are very narrow with many houses and buildings on the roadsides. The access road is planned as a dedicated road to connect the new terminal with the Cikampek Toll Road by the shortest route. In addition, frontage roads should be provided along the access road on both sides to secure the accessibility to the surrounding areas.
2) Traffic demand forecast
Cilamaya terminal is planned to open in 2019 after the saturation of North Kalibaru and will be developed in two phases. The targeted annual capacity of Cilamaya will reach 3.2 million TEU in Phase 2 and 4.3 million TEU in Phase 3. The total cargo capacity of Cilamaya will reach 7.5 million TEU. The traffic volumes for phase 2 and 3 of Cilayama are 27,477 pcu/day and 64,384 pcu/day respectively.
3) Preliminary design of access road
A four-lane road is sufficient for the access road to Cilamaya.
The total length of the access road is 30.6 km. The dedicated road finishes and links up with the frontage road about 1 km before the terminal. An interchange is to be installed at the beginning of the access road.
Source: JICA Study Team
Figure 5.3-2 Plan for access road for Cilamaya
Cilamaya Port
Access
JunctioRailwa
Kawarang Barat IC
Kawarang Timur
Dawuan JCT
SA
SA
IC
National

MASTER PLAN STUDY ON PORT DEVELOPMENT AND LOGISTICS IN GREATER JAKARTA METROPOLITAN AREA (JICA) FINAL REPORT
154
The topography in the area of the proposed road is low and flat while the ground elevation is 30 to 40 m around the area of the interchange and railway. The road height should be basically almost the same as the existing ground level.
4) Implementation schedule
Project implementation period will be 48 months including project preparation and 36 months of construction works.
Access Road Development of Cilamaya:
- Road: 4-lane, L=29.8km, 6 bridges - Interchange: 1 place - Overpass bridge: 1 place - Access Bridge: 4-lane, L=0.8km
5) Preliminary Cost Estimate
The construction cost of Cilamaya Access Road Development is estimated at Rp 2,663,586 million.
(3) Access Road Development for the Master Plan at Tangerang
1) Summary of access road
Tangerang terminal is planned about 30km west along the coast from Tanjung Priok Port. The access road shall be the arterial road as the estimated traffic volume is low at the time of terminal opening. The access road shall connect the terminal with JORR2 through the interchange which is planned by Bina Marga.
2) Traffic demand forecast
Tangerang terminal is planned to open in 2025. The targeted capacity of Tangerang will reach 2.0 million TEU. The traffic volume for phase 3 of Tangerang is 17,894 pcu/day.
3) Preliminary design of access road
A two-lane road is sufficient for the access road of Tangerang.
The total length of the access road is 5.0 km

MASTER PLAN STUDY ON PORT DEVELOPMENT AND LOGISTICS IN GREATER JAKARTA METROPOLITAN AREA (JICA) FINAL REPORT
155
Source: JICA Study Team
Figure 5.3-3 Plan for access road for Tangerang
The area around the access road is low and flat. The road height should be basically almost the same as the existing ground level. The vertical alignment is raised only for the crossing with JORR2. For the bridge to the terminal, the vertical clearance is 5.0 m from HWL.
4) Implementation Schedule
Project implementation period will be 30 months including project preparation and 18 months of construction works.
Access Road Development of Tangerang:
- Road: 2-lane, L=4.5km, 1 bridge - Interchange: 1 place - Port Access Bridge: 2-lane, L=0.5km
5) Preliminary Cost Estimate
The construction cost of Tangerang Access Road Development is estimated at Rp 404,071million.
(4) Access Road Development for Urgently Required Terminal at North Kalibaru
1) Summary of access road
The development of North Kalibaru consists of 3 phases. The access road connecting the new terminal with the existing road needs to be provided for phase 1, which is a so called “Urgent Project”. The concept of the access road is as follows.
To Tanjung Priok
ToTomang
Interchange
JORR2
International airport
Access Road

MASTER PLAN STUDY ON PORT DEVELOPMENT AND LOGISTICS IN GREATER JAKARTA METROPOLITAN AREA (JICA) FINAL REPORT
156
- To be the arterial road due to the need for prompt construction - To utilize the existing road to minimize resettlement - To construct the bridge between the land and terminal - To install a signalized intersection for connecting with the existing road
2) Preliminary design of access road
At least a two-lane road is required for the access road, and four-lane road is proposed for Alternative-2. The route of access road on land for Alternative-1, -2 are considered as below.
Alt. 2
Alt. 1
To Port To Port
Jl. Cilincing Raya
Jl.D
Igul
Signalized Intersection
Privateroad
Source: JICA Study Team
Figure 5.3-4 Plan for access road for Tangerang
The road height should be almost the same as the ground level, about 1.5 to 3.0 m above M.S.L. For the bridge section, the road is raised to secure the vertical clearance of 16.0m above HHWL for tugboats passing under the bridge for Alternative-2.
PC girders (PC-I, PC-U) bridge with 35-40 m span, which is the same type of standard span bridge as North Kalibaru, is applied for the access bridge. The length of access road is 2.1 km for both Alternative-1 and Alternative-2.
3) Construction method of bridge
The main bridge portion has a number of piers in the sea. Therefore steel pile with 1.0m diameter is used for the foundation of the piers in the sea.
For the excavation of the riverbed material (sand and gravel), the hammer grab excavation and the reverse circulation method can be considered. However, for the rock excavation under the riverbed material, only the reverse circulation method with rock roller bit is applicable.
The bridge pile driving will be done from the deck of a temporary jetty constructed out to the pile locations in the sea.
MASTER PLAN STUDY ON PORT DEVELOPMENT AND LOGISTICS IN GREATER JAKARTA METROPOLITAN AREA (JICA) FINAL REPORT
157
After completion of the pier structure, the superstructure will be started from the land side according to the Contractor’s construction program.
4) Implementation schedule
Project implementation period will be 2.5 years including project preparation (1.0 year) and construction works (1.5 years).
a) Alternative-1 Road : 2-lane, L=0.90 km Port Access Bridge on land : 2-lane, L=0.47 km Port Access Bridge in the sea : 2-lane, L=0.73 km Total : 2-lane, L=2.10 km
b) Alternative-2 Road : 4-lane, L=0.33 km Port Access Bridge on land : 4-lane, L=1.04 km Port Access Bridge in the sea : 4-lane, L=0.73 km Total : 4-lane, L=2.10 km
5) Preliminary Cost Estimate
The total project cost of Alternative-1 is estimated at 514 billion including VAT of 10%, and the total project cost of Alternative-2 is estimated at 1,045 billion including VAT of 10%.
5.4 Summary of Total Project Cost of Master Plan of Three Sites
Total project cost of the container terminal development in conjunction with Port Access Road Construction is presented in line with the phased development plan for each proposed project site, North Kalibaru, Cilamaya and Tangerang.
(1) North Kalibaru
Summary of the project cost estimate for the Phase I development through Phase III under Alternative 1 is presented in the following Table 5.4-1.
Construction cost for at-grade road (0.95 km, 2-lane) and an access bridge (1.2 km) are added to the project cost of Phase I.
As for Phase II development, construction of road (9.0 km, 4-lane) along the river bank including 2 flyovers, access bridge (10.3 km), etc. is considered in the project cost. The figures include VAT (10 % of the estimated project cost).

MASTER PLAN STUDY ON PORT DEVELOPMENT AND LOGISTICS IN GREATER JAKARTA METROPOLITAN AREA (JICA) FINAL REPORT
158
Table 5.4-1 Total Project Cost of Development Option 1
North Kalibaru Project Cost
(Million Rupiah) Project Cost (1,000 USD)
Project Cost (Million Yen)
Phase I (1.9 million TEU)
Port 8,230,382 914,487 74,822 Road 513,692 57,077 4,670
Phase II (3.2 million TEU)
Port 10,875,477 1,208,386 98,868 Road 11,940,860 1,326,762 108,553
Phase III (4.3 million TEU)
Port 17,913,623 1,990,404 162,851
Total 49,474,034894 5,497,115 449,764
(2) North Kalibaru and Cilamaya
Summary of the project cost estimate for the second development scenario is presented in Table 5.4-2.
Port access road (around 31.4 km) connecting the new container terminal with a new junction at Cikampek Toll Road at Karawang is considered in the project cost.
The port access road consists of road construction (30.6 km, 4-lane) including 6 flyovers, access bridge (800 m, 4-lane) and interchange construction. The figures include VAT (10 % of the estimated project cost).
Table 5.4-2 Total Project Cost of Development Option 2
North Kalibaru Phase I and Cilamaya
Project Cost (Million Rupiah)
Project Cost (1,000 USD)
Project Cost (Million Yen)
Kalibaru: Phase I (1.9 million TEU)
Port 8,230,382 914,487 74,822 Road 513,692 57,077 4,670
Cilamaya: Phase II (3.2 million TEU)
Port 13,072,629 1,452,514 118,842 Road 2,663,586 295,954 24,214
Cilamaya: Phase III (4.3 million TEU)
Port 12,811,356 1,423,484 116,467
Total 37,291,645 4,143,516 339,015
(3) North Kalibaru and Tangerang
Summary of the project cost estimate for the third development scenario is presented in Table 5.4-3. Port access road (around 5 km) connecting the new container terminal with a new junction on
JORR2 is considered in the project cost.
The port access road consists of at-grade road (4.5 km, 2-lane) including flyovers, access bridge (500 m, 2-lane) and an interchange construction. The figures include VAT (10 % of the estimated project cost).

MASTER PLAN STUDY ON PORT DEVELOPMENT AND LOGISTICS IN GREATER JAKARTA METROPOLITAN AREA (JICA) FINAL REPORT
159
Table 5.4-3 Total Project Cost of Development Option 3
North Kalibaru and Tangerang
Project Cost (1,000 Rupiah)
Project Cost (1,000 USD)
Project Cost (Million Yen)
Kalibaru: Phase I (1.9 million TEU)
Port 8,230,382 914,487 74,822Road 513,692 57,077 4,670
Kalibaru: Phase II (3.2 million TEU)
Port 10,875,477 1,208,386 98,868Road 11,940,860 1,326,762 108,553
Kalibaru: Phase III(2.3 million TEU)
Port 11,353,928 1,261,548 103,218
Tangerang (2.0 million TEU)
Port 8,815,333 979,481 80,139Road 404,071 44,897 3,673
Total 52,133,743 5,792,638 473,943

MASTER PLAN STUDY ON PORT DEVELOPMENT AND LOGISTICS IN GREATER JAKARTA METROPOLITAN AREA (JICA)
FINAL REPORT
160
6. EVALUATION ROAD MAP TOWARD INTERNATIONAL CONTAINER TERMINAL DEVELOPMENT IN GREATER JAKARTA METROPOLITAN AREA
6.1 Economic Feasibility
(1) Development Options
Following three (3) development options for the new container terminals for 2030 have been proposed in this study so far, hence their economic feasibility is evaluated in this section:
Option 1 North Kalibaru Phase II and III Option 2 Cilamaya Phase II and III Option 3 Tangerang with North Kalibaru II and part of III
It is assumed for all options that new container terminals with 1,200 m in length alongside berth have been in operation at North Kalibaru prior to realization of these development options.
(2) Methodology Employed in this Economic Feasibility Analysis
Two-step methodology is applied in this economic feasibility. For the first step Cost Minimization method is applied for ranking the project options and selecting the least cost one. Cost Minimization method is a useful analytical tool to select the least cost project from mutually exclusive projects if the project benefits are almost identical among the options. Unfortunately, however, the Cost Minimization method does not say about the economic viability of the project; it is unknown whether earnings from the project are higher than the costs necessary for the project. Therefore, for the second step, EIRR method is applied in this study to the best option selected in the first step for evaluation of the economic feasibility of the project.
(3) Cost Minimization Analysis
In the Cost Minimization analysis, “Construction costs of terminals and access roads” and “Land transportation cost” are summed up as the cost of each development option.
Construction costs basically consist of costs for breakwaters and seawalls, channel and basin, container terminals (quay wall, yard pavement, and terminal buildings), cargo handling equipment, security and utility, and the project related indirect costs. The cost for the port access road is also one of the important cost components of the project. The construction cost is firstly estimated by market price. After transfer items are removed, the costs expressed by market price are converted into economic pricing using conversion factors. Integrated conversion factor of this category is set at 0.96 taking the cost component of construction costs into consideration.
Land transportation costs for every option between the new terminal and shippers/consigners are estimated taking trucking distance and congestion level into consideration. In this estimation, it is assumed that the 2nd JORR road networks have been constructed and in operation. Port access road which is proposed in each development option is operational, too. Land transportation costs are estimated in economic price.
Cash flow and Present Value of combined construction cost and transportation cost of each development option are summarized in Table 6.1-1 in economic pricing. In expressing the Index of the Present Value, Option 1 is 125.0 and Option 3 is 129.9 while Option 2 serves as the base (=100). As having the minimum cost, Option 2 is selected as the best choice from the economic view point, based on the cost minimization approach.
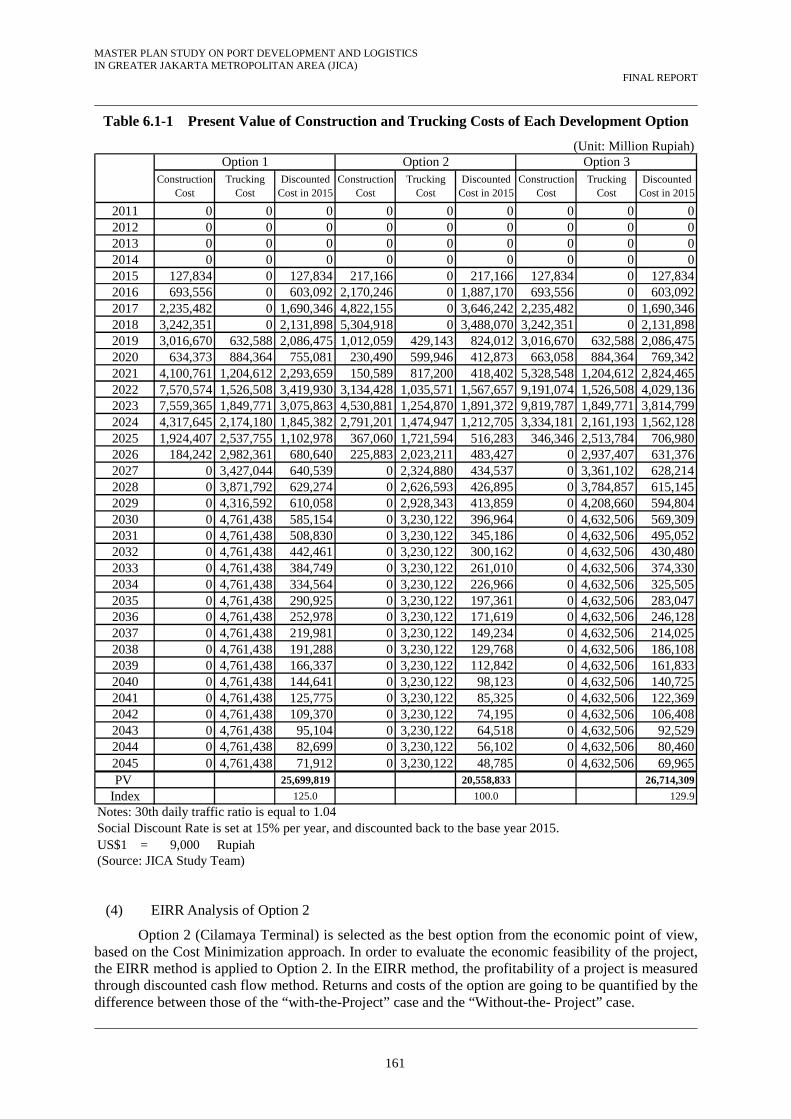
MASTER PLAN STUDY ON PORT DEVELOPMENT AND LOGISTICS IN GREATER JAKARTA METROPOLITAN AREA (JICA)
FINAL REPORT
161
Table 6.1-1 Present Value of Construction and Trucking Costs of Each Development Option
(Unit: Million Rupiah)
2011 0 0 0 0 0 0 0 0 02012 0 0 0 0 0 0 0 0 02013 0 0 0 0 0 0 0 0 02014 0 0 0 0 0 0 0 0 02015 127,834 0 127,834 217,166 0 217,166 127,834 0 127,8342016 693,556 0 603,092 2,170,246 0 1,887,170 693,556 0 603,0922017 2,235,482 0 1,690,346 4,822,155 0 3,646,242 2,235,482 0 1,690,3462018 3,242,351 0 2,131,898 5,304,918 0 3,488,070 3,242,351 0 2,131,8982019 3,016,670 632,588 2,086,475 1,012,059 429,143 824,012 3,016,670 632,588 2,086,4752020 634,373 884,364 755,081 230,490 599,946 412,873 663,058 884,364 769,3422021 4,100,761 1,204,612 2,293,659 150,589 817,200 418,402 5,328,548 1,204,612 2,824,4652022 7,570,574 1,526,508 3,419,930 3,134,428 1,035,571 1,567,657 9,191,074 1,526,508 4,029,1362023 7,559,365 1,849,771 3,075,863 4,530,881 1,254,870 1,891,372 9,819,787 1,849,771 3,814,7992024 4,317,645 2,174,180 1,845,382 2,791,201 1,474,947 1,212,705 3,334,181 2,161,193 1,562,1282025 1,924,407 2,537,755 1,102,978 367,060 1,721,594 516,283 346,346 2,513,784 706,9802026 184,242 2,982,361 680,640 225,883 2,023,211 483,427 0 2,937,407 631,3762027 0 3,427,044 640,539 0 2,324,880 434,537 0 3,361,102 628,2142028 0 3,871,792 629,274 0 2,626,593 426,895 0 3,784,857 615,1452029 0 4,316,592 610,058 0 2,928,343 413,859 0 4,208,660 594,8042030 0 4,761,438 585,154 0 3,230,122 396,964 0 4,632,506 569,3092031 0 4,761,438 508,830 0 3,230,122 345,186 0 4,632,506 495,0522032 0 4,761,438 442,461 0 3,230,122 300,162 0 4,632,506 430,4802033 0 4,761,438 384,749 0 3,230,122 261,010 0 4,632,506 374,3302034 0 4,761,438 334,564 0 3,230,122 226,966 0 4,632,506 325,5052035 0 4,761,438 290,925 0 3,230,122 197,361 0 4,632,506 283,0472036 0 4,761,438 252,978 0 3,230,122 171,619 0 4,632,506 246,1282037 0 4,761,438 219,981 0 3,230,122 149,234 0 4,632,506 214,0252038 0 4,761,438 191,288 0 3,230,122 129,768 0 4,632,506 186,1082039 0 4,761,438 166,337 0 3,230,122 112,842 0 4,632,506 161,8332040 0 4,761,438 144,641 0 3,230,122 98,123 0 4,632,506 140,7252041 0 4,761,438 125,775 0 3,230,122 85,325 0 4,632,506 122,3692042 0 4,761,438 109,370 0 3,230,122 74,195 0 4,632,506 106,4082043 0 4,761,438 95,104 0 3,230,122 64,518 0 4,632,506 92,5292044 0 4,761,438 82,699 0 3,230,122 56,102 0 4,632,506 80,4602045 0 4,761,438 71,912 0 3,230,122 48,785 0 4,632,506 69,965PV 25,699,819 20,558,833 26,714,309
Index 125.0 100.0 129.9
US$1 = 9,000 Rupiah
Option 1 Option 3Construction
CostTrucking
CostDiscounted
Cost in 2015Construction
CostTrucking
CostDiscounted
Cost in 2015
Notes: 30th daily traffic ratio is equal to 1.04Social Discount Rate is set at 15% per year, and discounted back to the base year 2015.
(Source: JICA Study Team)
Option 2Construction
CostTrucking
CostDiscounted
Cost in 2015
(4) EIRR Analysis of Option 2
Option 2 (Cilamaya Terminal) is selected as the best option from the economic point of view, based on the Cost Minimization approach. In order to evaluate the economic feasibility of the project, the EIRR method is applied to Option 2. In the EIRR method, the profitability of a project is measured through discounted cash flow method. Returns and costs of the option are going to be quantified by the difference between those of the “with-the-Project” case and the “Without-the- Project” case.

MASTER PLAN STUDY ON PORT DEVELOPMENT AND LOGISTICS IN GREATER JAKARTA METROPOLITAN AREA (JICA)
FINAL REPORT
162
In the “Without” case, no port facility development projects are carried out in the Greater Jakarta Metropolitan area, hence 7.5 million TEUs of international containers will overflow from the terminal. Consequently, Indonesian economy will lose corresponding amount of foreign earnings.
Following items are counted as the cost components of the project:
- Construction cost of port facilities and access road - Management and operation cost - Maintenance cost - Replacement cost of cargo handling equipment
Methodology to estimate the construction cost has already been explained above. The annual
costs for maintaining the port facilities are estimated as a fixed rate of the initial investment, specifically 0.2% for port infrastructure (breakwaters, seawalls, quay walls, yard pavement, and buildings) and 5% of the original construction costs of the port access road. Annual maintenance costs for cargo handling equipment are estimated at 1% of their initial procurement cost. It is expected that maintenance dredging will be required every five years but its volume will be minimal. Conversion factor of this category is set at 0.95 taking the cost component into consideration.
Personnel costs for management and operation of the terminals are estimated based on information obtained through interviews with the port management body and terminal operators. Utility costs including electricity are estimated at 2% of the initial equipment procurement costs. It is assumed that 50 % of the total work force is skilled labour and the rest is unskilled. Conversion factor of this category is set at 0.91 taking the composition of the work force into consideration.
Cargo handling equipment will be replaced after its service life expires. Service life of the equipment is set individually by types of equipment: 25 years for quay cranes and 4 years for yard vehicles, and so on. Conversion factor of this category is set at 0.97 taking the cost component into consideration.
Value added of exporting commodities which will be handled at the Cilamaya Container Terminal is counted as the benefit of the project. Although both export commodities and import commodities contribute to generating value added in Indonesia, only value added generated from export commodities are counted in this EIRR analysis to simplify the calculation, This assumption will yield less than the actual benefits, and thus can be considered a conservative estimate.
Based on two independent data sources, i.e., Indonesian Customs statistics on Tanjung Priok port and study results on Indonesian container export to Japan, value of exporting commodities is estimated at US$30,000/Laden Export TEU for this economic analysis
Percentage of operating income of individual firm varies widely from a few percentages up to 20 percent. Average percentage of the operating income of the about 30 samples is in the vicinity of 7 percent, which is adopted to estimate the value added in this economic analysis.
Resultant EIRR of the Cilamaya Terminal Development Project is calculated at 46.2% as shown in Table 6.1-2.
A sensitivity analysis is implemented in order to see whether the project is still feasible when some conditions change. Even when both cost increases by 10% and benefit decreases by 10%, EIRR is 41.2%, which is much higher than the opportunity cost of capital in Indonesia. This means that the planned project is economically feasible.
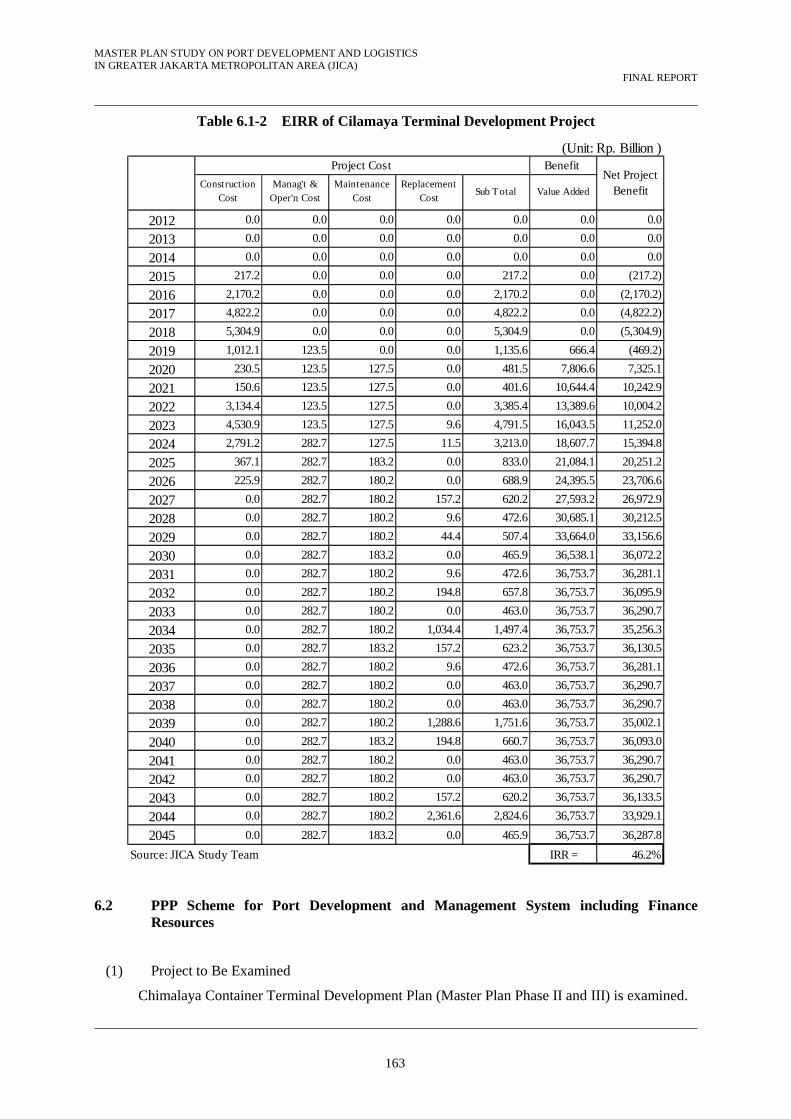
MASTER PLAN STUDY ON PORT DEVELOPMENT AND LOGISTICS IN GREATER JAKARTA METROPOLITAN AREA (JICA)
FINAL REPORT
163
Table 6.1-2 EIRR of Cilamaya Terminal Development Project
(Unit: Rp. Billion )Benefit
2012 0.0 0.0 0.0 0.0 0.0 0.0 0.0
2013 0.0 0.0 0.0 0.0 0.0 0.0 0.0
2014 0.0 0.0 0.0 0.0 0.0 0.0 0.0
2015 217.2 0.0 0.0 0.0 217.2 0.0 (217.2)
2016 2,170.2 0.0 0.0 0.0 2,170.2 0.0 (2,170.2)
2017 4,822.2 0.0 0.0 0.0 4,822.2 0.0 (4,822.2)
2018 5,304.9 0.0 0.0 0.0 5,304.9 0.0 (5,304.9)
2019 1,012.1 123.5 0.0 0.0 1,135.6 666.4 (469.2)
2020 230.5 123.5 127.5 0.0 481.5 7,806.6 7,325.1
2021 150.6 123.5 127.5 0.0 401.6 10,644.4 10,242.9
2022 3,134.4 123.5 127.5 0.0 3,385.4 13,389.6 10,004.2
2023 4,530.9 123.5 127.5 9.6 4,791.5 16,043.5 11,252.0
2024 2,791.2 282.7 127.5 11.5 3,213.0 18,607.7 15,394.8
2025 367.1 282.7 183.2 0.0 833.0 21,084.1 20,251.2
2026 225.9 282.7 180.2 0.0 688.9 24,395.5 23,706.6
2027 0.0 282.7 180.2 157.2 620.2 27,593.2 26,972.9
2028 0.0 282.7 180.2 9.6 472.6 30,685.1 30,212.5
2029 0.0 282.7 180.2 44.4 507.4 33,664.0 33,156.6
2030 0.0 282.7 183.2 0.0 465.9 36,538.1 36,072.2
2031 0.0 282.7 180.2 9.6 472.6 36,753.7 36,281.1
2032 0.0 282.7 180.2 194.8 657.8 36,753.7 36,095.9
2033 0.0 282.7 180.2 0.0 463.0 36,753.7 36,290.7
2034 0.0 282.7 180.2 1,034.4 1,497.4 36,753.7 35,256.3
2035 0.0 282.7 183.2 157.2 623.2 36,753.7 36,130.5
2036 0.0 282.7 180.2 9.6 472.6 36,753.7 36,281.1
2037 0.0 282.7 180.2 0.0 463.0 36,753.7 36,290.7
2038 0.0 282.7 180.2 0.0 463.0 36,753.7 36,290.7
2039 0.0 282.7 180.2 1,288.6 1,751.6 36,753.7 35,002.1
2040 0.0 282.7 183.2 194.8 660.7 36,753.7 36,093.0
2041 0.0 282.7 180.2 0.0 463.0 36,753.7 36,290.7
2042 0.0 282.7 180.2 0.0 463.0 36,753.7 36,290.7
2043 0.0 282.7 180.2 157.2 620.2 36,753.7 36,133.5
2044 0.0 282.7 180.2 2,361.6 2,824.6 36,753.7 33,929.1
2045 0.0 282.7 183.2 0.0 465.9 36,753.7 36,287.8
Source: JICA Study Team IRR = 46.2%
Project Cost
Value Added
Net ProjectBenefit
ConstructionCost
Manag't &Oper'n Cost
MaintenanceCost
ReplacementCost
Sub Total
6.2 PPP Scheme for Port Development and Management System including Finance Resources
(1) Project to Be Examined
Chimalaya Container Terminal Development Plan (Master Plan Phase II and III) is examined.

MASTER PLAN STUDY ON PORT DEVELOPMENT AND LOGISTICS IN GREATER JAKARTA METROPOLITAN AREA (JICA)
FINAL REPORT
164
Table 6.2-1 shows major characteristics of Phase II and III.
Table 6.2-1 Major Characteristics of Phase II and III of Master Plan
Phase II, III Terminal Cilamaya Quay Length 4,920 m Capacity 7.5 million TEU Estimated Cost* 2,876 million US$
25,884 billion IRP *: Cost does not include an expenditure for access road.
(2) Preliminary Financial Analysis for Evaluation of PPP Scheme
Since FIRR can provide sufficient information to analyse the preferable PPP scheme, other statements and indexes including cash flow statement, profitability, operational efficiency and loan payment capacity, will not be analyzed.
In this section, FIRR of chosen project is to be calculated to evaluate the PPP schemes. Financial analysis could be divided into the following 3 cases;
Base Case
In the Base Case, public entities including port authority are assumed to implement whole projects. Corporate tax is not taken into account in FIRR calculation. FIRR of this case provides a general idea on long-term project viability from the viewpoint of financial soundness.
PPP Scheme (1): Case-1
In Case-1, the port authority procures major facilities and conducts major works including breakwater, seawalls, channel/water basin, land reclamation, soil improvement, direct access road/bridge to port, power/water supply, drainage, lighting and basic facilities for safety/security.
Private business entities procure container terminal facilities including quay walls, yard pavement, terminal buildings, container handling equipment including quay-side gantry cranes, RTG and other machineries, and operation system.
PPP Scheme (2): Case-2
In Case-2, port authority procures only fundamental port facilities including breakwater and channel/water basin.
Private business entities procure not only container terminal facilities including quay walls, yard pavement, terminal buildings, container handling equipment including quay-side gantry cranes, RTG and other machineries, and operation system but also other major facilities which were provided by port authority in PPP scheme (1), Case-1.
FIRR is summarized in Table 6.2-2.
Table 6.2-2 FIRR of Option 2 by case (Phase II, III)
Items Base Case Case 1 Case 2 Public Private Public Private
FIRR 10.9 % 2.9 % 14.1 % 14.3 % 8.2 % Source: JICA Study Team
(3) PPP Scheme from the Viewpoint of FIRR
Based on the above analysis, following items are recommended;

MASTER PLAN STUDY ON PORT DEVELOPMENT AND LOGISTICS IN GREATER JAKARTA METROPOLITAN AREA (JICA)
FINAL REPORT
165
- Public sector should play a significant role in the procurement of infrastructure. For example. public sector should basically procure major facilities and conduct major works including breakwater, seawalls, channel/water basin, land reclamation, soil improvement, direct access road/bridge to port, power/water supply, drainage, lighting and basic facilities for safety/security.
- Public sector should utilize low interest fund including foreign assistance as much as possible.
- Private sector should increase port investment drastically when the proposed master plan will be implemented.
6.3 Road Map toward International Container Terminal Development
(1) Approval and Notification of Master Plan
Since there is no Port Master Plan stipulated by the New Shipping Law (N0.17/2008), Master Plan should be authorized as soon as possible. The following actions are required.
- Recommended Master Plan is authorized as a draft Master Plan of port authority. - Port authority submits the draft Master Plan to the Ministry of Transport for approval
as the Master Plan. - Port authority/the Ministry acquires the recommendation from Governor of the
Province. - The Minister approves the draft Master plan as the Master Plan of Tg. Priok Port. - The Ministry notifies the result.
(2) Implementation of the Master Plan
There are a lot of procedures and activities to do, documents to be prepared and Ministerial/Organization interactions. These issues should be dealt with in a timely and precise manner. Table 6.3-1 illustrates phased procedures stipulated by the National Development Planning Agency Regulation (No.4/2010). Figure 6.3-1 illustrates a flowchart of the regulation. And Table 6.3-2 shows required activities of MOT/Port Authority stipulated by regulations concerned.
Based on these Figure and Tables, a roadmap for the implementation of Master Plan (Phase II, Cilamaya international container terminal development projects) is illustrated in Figure 6.3-2

MASTER PLAN STUDY ON PORT DEVELOPMENT AND LOGISTICS IN GREATER JAKARTA METROPOLITAN AREA (JICA)
FINAL REPORT
166
Table 6.3-1 Phased procedures stipulated by Bappenas Regulation
STAG
E I:
STAG
E IV
:
PAR
TNER
SHIP
PR
OJE
CT
PLAN
NIN
GM
ANAG
EMEN
T FO
RIM
PLEM
ENTA
TIO
N O
FPA
RTN
ERSH
IP P
RO
JEC
T
Par
tner
ship
Pro
ject
Iden
tific
atio
nM
anag
emen
t Pla
nnin
g fo
rIm
plem
enta
tion
of P
artn
ersh
ipA
gree
men
t
Par
tner
ship
Pro
ject
Sel
ectio
nM
anag
emen
t for
Impl
emen
tatio
n of
Par
tner
ship
Agr
eem
ent
Dec
isio
n fo
r Prio
rity
of P
artn
ersh
ip P
roje
ct
Out
put:
List
of P
riorit
ies
for P
artn
ersh
ipP
roje
ct a
nd D
ocum
ent o
f Pre
para
tory
Stu
dy
Out
put:
Doc
umen
t of R
epor
t on
Man
agem
ent f
or Im
plem
enta
tion
ofP
artn
ersh
ip A
gree
men
t
Par
tner
ship
Pro
ject
Res
pons
ible
Par
ty(P
JPK
) / N
atio
nal D
evel
opm
ent P
lann
ing
Age
ncy
(BA
PP
EN
AS
)
PP
JK, P
PR
F/B
UP
I, B
KP
M,
BA
PP
EN
AS
Pub
lic C
onsu
ltatio
n:
Info
rmat
ion
Dis
sem
inat
ion
Pre
para
tion
byB
asic
Ass
essm
ent
of F
easi
bilit
y P
re-
Stu
dy o
fP
artn
ersh
ip P
roje
ct
Pre
para
tion
byA
sses
smen
t on
Rea
dine
ss o
fP
artn
ersh
ip P
roje
ct
Com
plet
ion
byFi
nal A
sses
smen
tof
Fea
sibi
lity
Pre
-S
tudy
of
Par
tner
ship
Pro
ject
List
of P
lann
ed P
artn
ersh
ip P
roje
cts
Pub
lic C
onsu
ltatio
n:
Con
sulta
tive
Inte
ract
ion
Pub
lic C
onsu
ltatio
n:
Mar
ket S
ound
ing
LAN
D P
RO
CU
RE
ME
NT
PR
OC
ES
S
INV
OLV
EM
EN
T O
F G
OV
ER
NM
EN
T A
GE
NC
IES
/INS
TITU
TIO
NS
PJP
K, K
KP
PI,
BK
PM
, BA
PP
EN
AS
, Min
istry
of F
inan
ce(P
PR
F/B
UP
I)P
JPK
, KK
PP
I, P
PR
F/B
UP
I, B
KP
M,
BA
PP
EN
AS
Out
put:
Sig
natu
re o
f Par
tner
ship
Agr
eem
ent
Out
put:
Doc
umen
t of F
easi
bilit
y P
re-S
tudy
of P
artn
ersh
ipP
roje
ct
Pro
cess
of A
pplic
atio
n fo
r Nee
ds
Gov
ernm
ent S
uppo
rt (D
P) &
Gov
ernm
ent G
uara
ntee
(JP
)
Con
firm
atio
n of
Gov
ernm
ent G
uara
ntee
by
PP
RF/
BU
PI
Bus
ines
s E
ntity
Pro
cure
men
t Pla
n
Impl
emen
tatio
n fo
r Bus
ines
s E
ntity
Pro
cure
men
t
Sig
natu
re o
f Par
tner
ship
Agr
eem
ent
STAG
E II:
PREP
ARAT
ION
FO
R F
EASI
BIL
ITY
PRE-
STU
DY
OF
PAR
TNER
SHIP
PR
OJE
CT
STAG
E III
:
TRAN
SAC
TIO
N F
OR
PAR
TNER
SHIP
PRO
JEC
T

MASTER PLAN STUDY ON PORT DEVELOPMENT AND LOGISTICS IN GREATER JAKARTA METROPOLITAN AREA (JICA)
FINAL REPORT
167
Figure 6.3-1 Flowchart of Implementation for National Partnership Project
STA
GE I
STA
GE II
STA
GE III
STA
GE IV
List
of P
artn
ersh
ipPr
ojec
ts (P
K) w
ithin
Sec
tor S
cope
sele
cted
byA
MK
Pre
para
tion
for
Feas
ibili
ty P
re-s
tudy
of P
artn
ersh
ipP
roje
ct
Prep
arat
ion,
Impl
emen
tatio
n fo
rBU
Pro
cure
men
t &Si
gnat
ure
ofP
K
Man
agem
ent f
orIm
plem
enta
tion
ofP
K
PJP
K
List
of P
artn
ersh
ipPr
ojec
ts (P
K) w
ithin
Sec
tor S
cope
sele
cted
byA
MK
The
Min
istry
prop
oses
Par
tner
ship
Pro
ject
ithi
St
S
Min
istry
of
Rel
evan
t Sec
tor
&K
PS
Nod
e
List
of P
lann
edP
artn
ersh
ipP
roje
cts
Pre
limin
ary
Con
sulta
tion
List
of P
artn
ersh
ipP
roje
cts
from
Nat
iona
l Sel
ectio
n
Eva
luat
ion
& R
evie
wto
DP
/JP
for
appr
oval
by
the
Min
iste
rof
Mar
ket S
ound
ing
Bus
ines
s Fo
rum
KK
PP
I & K
PS
Cen
ter
Min
istry
of
Fina
nce
&P
PR
F / B
UP
I
BU
Form
atio
n
List
of P
roje
cts
of N
on-K
PS
Non
-KP
S
Prio
rity
for P
K w
ithin
sub-
sect
or s
cope
(I.2
)
Prio
rity
for P
Kw
ithin
sec
tor
scop
e(I.
4)N
on-K
PS
Pot
entia
l Pro
ject
(I.5
)
Req
uest
for D
P/J
P (I
I.1)
DP
/JP
is n
otre
quire
d (II
.2)
Impl
emen
tatio
n of
PK
III.1
DP
/JP
is re
quire
d (II
.3)
Rep
ort (
III.3
)R
epor
t (IV
.1)
Rep
ort (
III.4
)R
epor
t (IV
.2)
Req
uire
add
ition
al a
sses
smen
ton
proj
ectr
eadi
ness
(II5)
Con
sulta
tion
(II.4
)
Rec
omm
enda
tion
of D
P/J
P
Con
sulta
tion
(II.7
)
Pub
lic C
onsu
ltatio
n
Prio
rity
Pro
ject
Rep
ort t
o M
inis
try (I
I.9)
Pro
ject
Rea
dy fo
r Bid
ding
Too
Hig
h D
P/J
P, i
nfea
sibl
e P
K (I
I.9)
Impl
emen
tatio
n of
PK
III.2
App
rova
l of D
P/J
P(II
.10)
NO
TES
:K
PS
: Pub
lic &
Priv
ate
Par
tner
ship
PK
: Par
tner
ship
Pro
ject
AM
K: M
ulti-
crite
ria A
naly
sis
DP
: Gov
ernm
ent S
uppo
rtJP
: Gov
ernm
ent G
uara
ntee
SK
PD
: Loc
al G
over
nmen
tW
ork
Uni
tB
U: B
usin
ess
Ent
ity
PP
RF:
Fis
cal R
isk
Res
earc
h C
ente
rB
UP
I: In
sura
nce
Com
pany
for
Infra
stru
ctur
esS
tage
I: P
K P
lann
ing
Sta
ge II
: Pre
para
tion
for F
easi
bilit
y P
re-S
tudy
of P
KS
tage
III:
Tran
sact
ion
for P
KS
tage
IV: S
uper
visi
on &
con
trol t
o P
KA
PB
N: S
tate
Bud
get
mai
n ro
ute;
op
tiona
l rou
te
SUB-SECTORSUBSCOPE
SECTORSCOPE
NATIONALLEVEL

MASTER PLAN STUDY ON PORT DEVELOPMENT AND LOGISTICS IN GREATER JAKARTA METROPOLITAN AREA (JICA)
FINAL REPORT
168
Table 6.3-2 Activities of MOT/Port Authority
Port Master Plan
Stage Internal
Inter-MinisterialMajor Activities
Institutional Studies Documents
I
-Identification and Selection of PP -Public Consultation
-Unit in charge of PP
-Pre-feasibility Study (which could be utilized in a later stage as a Feasibility Pre-Study referred in National Development Planning Agency Regulation No.4, Year 2010
-Report of Pre-feasibility Study -Priority List of PP
-Submission of Priority List to Ministry of Planning (the Ministry evaluates the list)
II
-Basic Assessment -Assessment in Readiness -Final Assessment -Public Consultation
-Executive Team/PP Management Board
-Feasibility Pre-Study (if necessary) (Environmental Assessment is IEE) -Study on EIA (If necessary)
-Report of Feasibility Pre-Study -Report of Basic Assessment -Report of Basic Assessment in Readiness -Report of Final Assessment
-Request for Government’s Support/Guarantee (if necessary) -Submission of PP to KKPPI (KKPPI evaluate PP)
III
-Market Sounding -PQ Announcement -PQ Evaluation and -Announcement of Results -Procurement Briefing -Bidding Evaluation and Announcement of Results -Signing of P.A. -Public Consultation
-Procurement Committee -Managing Unit of PP
-HPS (Self-Calculated Price) -PQ Document Procurement (Tender) Document -PQ Criteria PQ Evaluation Report -Bidding Evaluation Criteria
IV
-Procurement of Budget and Fund -Public Consultation
-Team for Assets Transfer
-Management Plan -Report of Implementation -Report of Activity -Report of Monitoring -Report of Assets Appraisal

MASTER PLAN STUDY ON PORT DEVELOPMENT AND LOGISTICS IN GREATER JAKARTA METROPOLITAN AREA (JICA)
FINAL REPORT
169
I.
Ciram
aya
Cont
ainer
Term
inal
(M
aste
r P
lan P
has
e II)
1. P
ort
Mas
ter
Pla
n◆
2. S
election o
f P
P
(1)
Mas
ter
Pla
n S
tudy/
Pre
-fe
asib
ility
Stu
dy
(2)
Priority
Lis
t◆
(3)
Feas
ibili
ty P
re-Stu
dy (
If, neces
sary
)
(4)
Env
ironm
enta
l S
tudy
(EIA
) (If, n
eces
sary
)
(5)
bas
ic A
ssess
ment
(6)
Ass
ess
ment
in R
ead
iness
(7)
Fin
al A
ssess
ment
3. P
roje
ct
reso
lution b
y G
ove
rnm
ent
(1)
Subm
issi
on o
f P
P t
o K
KP
PI
(2)
Requ
est
for
Gove
rnm
ent
Supp
ort
/G
uara
nte
e
4.T
ransa
ction (
Pro
cur
em
ent)
of P
P
(1)
Mar
ket
Soundi
ng
◆
(2)
Docum
ents
for
PQ
/ P
rocure
ment
(Ten
dering)
(3)
PQ
(4)
Pro
cure
men
t (T
ender
ing)
(5)
Cont
ract
Nego
tiat
ion
(6)
Sig
ning
of
PA
◆
5. P
ublic
Cons
ultat
ion
◆◆
◆◆
6. Fin
anci
al S
our
ce A
rran
gem
ent
7. D
eta
iled D
esig
n
8. C
onst
ruction
9. O
per
atio
n
II. C
hila
may
a A
ccess
Road
(M
aste
r P
lan P
has
e II)
1. C
oord
inat
ion A
mong
MO
T, M
PW
, M
OA
, M
OE a
nd W
est
Jaw
a P
rovi
nce
2. S
election o
f P
P A
s sa
me
as t
he
cas
e o
f P
ort
3. P
roje
ct
reso
lution b
y G
ove
rnm
ent
As
sam
e as
the
cas
e o
f P
ort
4.T
ransa
ction (
Pro
cur
em
ent)
of P
P A
s sa
me
as t
he
cas
e o
f P
ort
5. P
ublic
Cons
ultat
ion
As
sam
e as
the
cas
e o
f P
ort
6. Fin
anci
al S
our
ce A
rran
gem
ent
(If, n
eces
sary
) A
s sa
me
as t
he
cas
e o
f P
ort
7. Lan
d A
cquis
itio
n
8. D
eta
iled D
esig
n
9. C
onst
ruction
10. O
pera
tion
Note
: P
P, P
artn
ers
hip
Pro
ject
Sourc
e: JIC
A S
tudy
Team
2030
201
92020
2025
201
12012
201
32014
201
52016
201
72018
Figure 6.3-2 Road Map for Cilamaya Container Terminal (Master Plan Phase II)

MASTER PLAN STUDY ON PORT DEVELOPMENT AND LOGISTICS IN GREATER JAKARTA METROPOLITAN AREA (JICA)
FINAL REPORT
170
7. STRATEGIC ENVIRONMENTAL ASSESSMENT
7.1 Objectives
In accordance with Law No.32/2009, Strategic Environmental Assessment (SEA) was conducted in this master plan study. The objectives of the SEA study are described as follows aiming to make wise decision for sustainable development on formulating the master plan.
Objectives of the SEA Study
- To integrate environmental and social consideration into evaluating and prioritizing development alternatives for a new container terminal.
- To contribute to decision making on formulating the master plan.
7.2 Methodology of SEA
The flow chart of the SEA is shown in Figure 7.2-1. For public consultation, two meetings (Focus Group Discussion and Stakeholder Meeting) were held during the study period.
Source: JICA Study Team
Figure 7.2-1 Flow Chart of the SEA
7.3 Selecting Several Alternatives
Considering the results of the preliminary review and the analysis of natural condition and traffic capacity, criteria shown in Table 7.3-1 were selected to screen the nine candidate sites for the new container terminal in terms of environmental and social considerations. The results of screening by the criteria were shown in Table 7.3-2.
Combined with the other evaluation results apart from the environmental viewpoints, the candidate sites for the new container terminal were narrowed down to the three: (1) North Kalibaru, (2) Cilamaya and (3) Tangeran as shown in the Chapter 4.
Review of the Existing Upper Level Plans
Review of the Environmental Conditions
Selecting Several Alternatives
Scoping
Evaluation
Recommendation to the Master Plan
IEE on each of the selected alternatives
Mas
ter
Pla
n on
Por
t Dev
elop
men
t
Public Consultation (Stakeholder Meeting in Oct. 2010)
Environmental Survey
Public Consultation (Stakeholder meeting in Jan. 2011 and May 2011)

MASTER PLAN STUDY ON PORT DEVELOPMENT AND LOGISTICS IN GREATER JAKARTA METROPOLITAN AREA (JICA)
FINAL REPORT
171
Table 7.3-1 Criteria for Selecting Alternatives from the Nine Candidate Sites in Terms of Environmental and Social Considerations
Criteria Items Explanation Natural Environment
Regulated Forest Area (Protected Forest)
Some sites are located in the regulated forest area designated by the Ministry of Forestry for conservation of the forest function. The protected forest is also described in the spatial plans of local governments; therefore, obedience to the spatial plans was also evaluated together with the designation by the Ministry.
Ecological Importance
In terms of ecological conservation, developmental projects need to avoid ecologically important areas, such as bird habitats.
Coastal Line Changes
Coastal line changes caused by natural erosion and sedimentation indicate instability of the coastal environment. Areas with large amount of changes are concerned about a risk of environmental balance change when the port structure is constructed.
Social Environment
Traffic Congestion
Since JABODETABEK area has already suffered from serious traffic congestion, the sites which alleviate the problem are desirable in terms of social environment.
Source) JICA Study Team
Table 7.3-2 Selecting Alternatives in Terms of Environmental and Social Considerations
Criteria Items SocialEnvironment
Sites
Regulationby the
Ministry ofForestry
Spatial Planof ProvincialGovernment
Spatial Planof the
Governmentof Regent
1 North Kalibaru Acceleration2 Marunda
(Jakarta)Acceleration
3 MarundaCenter
Acceleration
4 TarumajayaDisobedience Excessive Acceleration
5 MuaraGembong
Disobedience Disobedience DisobedienceImportantfor birds
Unstable Acceleration
KarawangRegent
6 CilamayaAlleviation
SubangRegent
7 CiasemDisobedience Disobedience Disobedience Alleviation
TangerangRegent
8 TangerangAcceleration
SerangRegent
9 BojonegaraAcceleration
: Negative evaluation results for the new container terminal.
DKI Jakarta
WestJava
BekasiRegent
Banten
Natural Environment
Regulated Forest Area (Protected Forest) EcologicalImportance
CoastalLine
Changes
JABODETABEK TrafficCongestion
Area
Source) JICA Study Team
7.4 Scoping
In order to decide an appropriate site for the new terminal in terms of environmental aspects, possible environmental consequences shown in Table 7.4-1 were evaluated for each of the three selected alternatives

MASTER PLAN STUDY ON PORT DEVELOPMENT AND LOGISTICS IN GREATER JAKARTA METROPOLITAN AREA (JICA)
FINAL REPORT
172
Table 7.4-1 Possible Consequences to be Evaluated in the Stage of Site Selection (Scoping for SEA level)
No. Possible Consequences (Evaluation Items)
Brief Description
Social environment 1 Impact on rice field In Indonesia, agricultural land is conserved for securing food
production. New access road may cause impact on the rice field.
2 Socio-economic effects The new terminal is expected to bring positive effects on socio-economic condition such as increasing opportunities for employment.
3 Traffic congestion The new terminal may accelerate traffic congestion of JABODETABEK area.
4 Involuntary resettlement and alteration of land use
Involuntary resettlement will be required for the new access road.
5 Impact on fishery Fishing ground may be eliminated by the reclamation and the channel dredging. Fishing activity may be affected by appearance of the new terminal.
6 Impact on existing infrastructures and services
New access road may split the existing road and communities.
Natural environment 7 Impact on mangrove,
coral reefs and tidal flats Mangrove, coral reefs and tidal flats in/around the project site may be affected by construction of the new terminal.
8 Impact on fauna and flora Aquatic/terrestrial flora and fauna in/around the project site may be affected by construction of the new terminal and the new road.
Source) JICA Study Team
7.5 Evaluation
In accordance with the scoping results, possible consequences in each option for the new terminal (Table 7.5-1) were discussed and the summarized in Table 7.5-2. In addition, comparison between three alternatives in the case of Kalibaru is summarized in Table 7.3-1.
Table 7.5-1 Outline of Each Option
Option Outline Option-1 North Kalibaru Phase II-III
Fully concentration to the existing Tanjung Priok Terminal with North Kalibaru Phase I-III. There are three alternatives for the layout of the new terminal: alternative 1, 2 and 3.
Option-2 Cilamaya
Split to the existing Tanjung Priok Terminal and Cilamaya with North Kalibaru Phase I. New terminal is constructed in Cilamaya.
Option-3 North Kalibaru Phase II-III and Tangerang
Split to the existing Tanjung Priok Terminal and Tangerang with North Kalibaru Phase I-III. New terminal is constructed in Kalibaru and Tangerang.
Without project No infrastructure is prepared for increased port cargo. Overflowed cargo is handled in Marunda Port using barges.
Source) JICA Study Team

MASTER PLAN STUDY ON PORT DEVELOPMENT AND LOGISTICS IN GREATER JAKARTA METROPOLITAN AREA (JICA)
FINAL REPORT
173
Table 7.5-2 Summary of Evaluation for SEA
Alternatives Items
Op.1 Kalibaru Op. 2 Cilamaya Op. 3 Kalibaru & Tangerang
Without Project (zero-option)
1 Impact on rice field [Area of rice field to be altered to land for road (ha)]
[56 ha] [72 ha] [65 ha] -
Some of the rice field needs to be altered for the access road.
Some of the rice field needs to be altered for the access road.
Some of the rice field needs to be altered for the access road.
2 Socio-economic effects on narrowing the regional economic gaps [GRDP per capita of the regions of the project area]
[56,000 Rp.] [15,000 Rp.] [43,000 Rp.]* - No effect on narrowing the regional economic gap.
Socio-economic gap against DKI Jakarta will be narrower by investment to Karawang.
Socio-economic gap against DKI Jakarta will be narrower by investment to Tangerang; however the effect is small because the planned cargo capacity of the new terminal in Tangerang is relatively small.
No effect on narrowing the regional economic gap
3 Traffic congestion in JABODETABEK area [Container traffic volume to/from JABODETABEK area from/to Bekesi ~ Carawan industrial estates in the year of 2030]
[101,000pcu/day] [29,000pcu/day] [101,000pcu/day] [101,000pcu/day] Congestion will be accelerated although new access road is prepared.
Congestion will be alleviated since part of the port traffic will move out of JABODETABEK area.
Congestion will be accelerated although new access road is prepared.
Congestion will be accelerated due to traffic increase in JABODETABEK area.
4 Involuntary resettlement [Building to be removed for road construction]
[About 160houses] [About 170houses] [About 160houses] -
Middle-classed inhabitants’ houses, shops, offices and warehouses are required to be resettled for the access road.
Middle-classed inhabitants’ houses, shops, offices and warehouses are required to be resettled for the access road.
Middle-classed inhabitants’ houses, shops, offices and warehouses are required to be resettled for the access road.
5 Impact on fishery [Area of fishing grounds to be disappeared for port construction]
[0.3 sq.km] [14 sq.km] [6 sq.km] - Reclamation area is outside of the fishing ground.
Part of the fishing ground will be eliminated by the new terminal.
Part of the fishing ground in Tangerang will be eliminated by the new terminal.
6 Impact on existing infrastructures and services
(The impact needs to be assessed in detail when the detailed route alignment is discussed.)
-
New access road will split existing communities.
New access road will split existing communities.
New access road will split existing communities.
7 Impact on [far] [2km] [far] -

MASTER PLAN STUDY ON PORT DEVELOPMENT AND LOGISTICS IN GREATER JAKARTA METROPOLITAN AREA (JICA)
FINAL REPORT
174
mangrove , coral reefs and tidal flats [Distance from the nearest coral reef]
No large scale mangrove, coral reefs and tidal flats around the site.
Consideration is required to protect coral reefs near the site. Impact on the tidal flat is reduced since the reclamation area is offshore.
Impact on the tidal flat is minimized since the reclamation area is offshore.
8 Impact on fauna and flora
(Further study is required in EIA) - No rare species have been found around the site.
No rare species have been found around the site.
No rare species have been found around the site.
Table 7.5-3 Comparison between Alternatives for Kalibaru
Alternative-1 Alternative-2 Alternative-3
Involuntary resettlement
Tens of residentialhouses are required tobe resettled for theaccess road.
Resettlement is notrequired for utilizing theexisting road.
Warehouses and tens ofresidential houses arerequired to be resettledfor the access road.
Impact on noise, vibrationand safety along port accessroad at Kalibaru
Residents along theacsess road will beaffected.
No residents along theplaned acsess road
Residents along theacsess road will beaffected.
Obstacle to navigation offishing boats
No obstacle to the existingnavigation.
No obstacle to the existingnavigation.
Fishing boats have to goaround due to the newterminal.
Elimination of fishingground
Fishing ground will besecured.
Fishing ground will besecured.
A part of shallow fishingground for shellacuaculture will beeliminated.
Impact on water qualitywithin the port basins
Water exchange will besecured to prevent waterquality degradation.
Water exchange will besecured to prevent waterquality degradation.
Water stagnation maycause degradation ofwater quality.
Impact on smell within theport area
Reclamation for newterminal will not causewater quality degradation,which may cause badsmell.
Reclamation for newterminal will not causewater quality degradation,which may cause badsmell.
Water qualitydegradation may causebad smell.
Note: Negative factor
Impact onthe
Residents
Impact onFishery
Impact onWaterQuality
Source) JICA Study Team
7.6 Recommendation
Considering the results of the evaluation, Option-2, which consists of Phase I at North Kalobaru and Phase II-III at Cilamaya, was selected as the new terminal project.
The SEA study has been basically focused on the site selection from a broad perspective; therefore, the details of the impacts and the mitigation measures need to be discussed in the next study phase. Based on the information obtained through the SEA study, following recommendations are made for the next study phase.
(1) It is necessary to implement EIA study properly to assess the impacts and develop necessary measures for mitigation and management. Specific recommendation for the EIA study was extracted in this study.
(2) Especially for the phase II & III at Cilamaya, necessary information for assessing impacts on the coral reef and fishery is limited at this moment. It is necessary to conduct studies to comprehend the detailed current condition and

MASTER PLAN STUDY ON PORT DEVELOPMENT AND LOGISTICS IN GREATER JAKARTA METROPOLITAN AREA (JICA)
FINAL REPORT
175
assess the impact carefully in cooperation with the local government, communities, researchers and NGO.
(3) In the stage of discussing the detailed route alignment of the access road for phase II & III at Cilamaya, the impacts on rice fields and communities (e.g. relocation of houses) need to be minimized.
(4) Dialogue and coordination with local communities are indispensable for minimizing the negative impacts and enhancing the benefits of the project.

MASTER PLAN STUDY ON PORT DEVELOPMENT AND LOGISTICS IN GREATER JAKARTA METROPOLITAN AREA (JICA) FINAL REPORT
176
8. FORMULATION OF IMPROVEMENT PLAN FOR RAIL ACCESS TRANSPORT CONNECTING TG. PRIOK PORT WITH ITS HINTERLAND
8.1 Preliminary Railway Access Plans Corresponding the Respective Port Plans
(1) Candidate Sites for Marine Container Terminals
In accordance with the port development projects proposed by authorities and private entities in Indonesia, the Team studied preliminary plans for railway access to the following locations.
Table 8.1-1 Candidate Sites for Marine Container Terminals
Province Port Development Projects DKI Jakarta Off Kalibaru at Tanjung Priok Terminal West Java Province Cilamaya Coast in Regent Karawan (Kabupaten Karawan) Banten Province Tangeran Coast in Regent Tangeran (Kabupaten Tangeran)
(2) Operational Route Plans
Brief profiles of each operational route are summarized below:
Table 8.1-2 Proposed Operational Routes
Route Total Route Length (km)
Existing (km)
New (km)
Proposed Freight Corridors Direct Access to Tanjung Priok Terminal Tpk-Cikampek-Bandung-Gedebage Dryport Alt-1: Cilamaya New Terminal Cilamaya-Cikampek-Bandung-Gedebage Cilamaya-Karawang-Cikarang Dryport Alt-2: Tangerang New Terminal Tangerang-Jatinegara-Cikampek-Bandung-Gedebage Tangerang-Jatinegara-Bekasi-Cikarang Dryport
187.5
132.1 63.2
208.4 86.3
187.0
95.5 26.6
183.7 61.7
0.5
36.6 36.6
24.7 24.7
Source: Study Team
1) Alternative-1: Access to Cilamaya New Terminal
36.6-kilometer of new access to Cilamaya Terminal with single track at grade level is proposed. The access will be connected with existing rail network nearby Klari Station.
Train operation plan is indicated below.
Table 8.1-3 Train Operation Plan (Railway Access to Cilamaya New Terminal)
Section
No. of TEU by railway per day
Operation Plan In 2030
Inbound Outbound No. of Trains/day
Adjusted
Cilamaya Terminal - Gedebage 130 130 5 5 Cilamaya Terminal - Cikarang 1210 1210 19 23

MASTER PLAN STUDY ON PORT DEVELOPMENT AND LOGISTICS IN GREATER JAKARTA METROPOLITAN AREA (JICA) FINAL REPORT
177
(3) Alternative-2: Access to Tangerang New Terminal
24.7-kilometer new access route to Tangerang Terminal with single track at grade level is proposed. The access will be connected with existing rail network nearby Batuceper Station. The route immediately north of existing Tangerang Line is broad enough to accommodate single railway track on surface level.
Table 8.1-4 Train Operation Plan (Railway Access to Cilamaya New Terminal)
Section
No. of TEU by railway per day
Operation Plan In 2030
Inbound Outbound No. of Trains/day
Adjusted
Tangerang Terminal - Gedebage 130 130 5 5 Tangerang Terminal - Cikarang 1210 1210 19 23
8.2 Freight Transportation Development Scenario
(1) Existing Railway Freight Capacity for Port Cargo
Existing rail services for container traffic, between Tanjung Priok Terminal, Pasoso (POO) and Gedebage (GDB), comprise 4 trains, 2 trains each way over a 24 hour period. This accounts for an annual transport capacity of 11,680 TEU, but actual volume of the container traffic is 4,891 TEU with an estimated loading rate of 41.8 %.
Table 8.2-1 Existing Railway Freight Capacity for Port Cargo
Distance
(km)
Ave. Trip Time (min)
Trips per day
Wagonsper train
Annual Capacity (TEU)
Actual Volume (TEU)
Estimated
Loading Rate (%)
Pasoso - Gedebage
187 278 (one way)
4 trains (2 r-trips)
16 11,680 4,891 (*1)
41.8
Source: Based on PT.KA Annual Report (*1) Assumed that 1 TEU = 25 ton
Following figure indicates the route of existing container transportation.
Manggar
Tanjun Priok
GedebageDry Port
Bandung
Cikampe
Kota
Pasoso
Jatinegar
Figure 8.2-1 Existing railway transportation of port container

MASTER PLAN STUDY ON PORT DEVELOPMENT AND LOGISTICS IN GREATER JAKARTA METROPOLITAN AREA (JICA) FINAL REPORT
178
(2) Current and Future Operational Bottlenecks
Train running times between Tanjung Priok Terminal, POO and GDB, at present, are generally within the range of 5 hours to 5 hours and 30 minutes. The travel time from TPK Terminal and POO accounts for 30 minutes to 1 hour depending on the road traffic congestion.
It is perceived that current railway freight tariff has little or no advantages largely due to the cost of feeder trucking charge from/to GDB.
Following figure indicates line capacity of railway route and number of train in current diagram.
Legend Line Capacity Commuter Train
Long Distance Train
Line Capacity
TanjungPriok Kemayoran
Pasar SenenJati Negara
Bekasi Karawan Cikampek Padaralan Bandung GedebageKampungBandan
108
288 288 288 288
216 216 216 216
96
Figure 8.2-2 Line Capacity of Railway Route
(3) Container Transportation Demand Forecast
As presented in Chapter 5, Throughput at Tanjung Priok Terminal will grow from the current 2.7 million TEU in 2009 to 4.0 million TEU in 2020 and onwards, whilst the same at New Terminal will account for 9.4 million TEU in 2030.
(4) Current Construction and Planning Efforts
- Direct Access to JICT Terminal (in Progress) - Cikarang as New Destination for Railway Freight - Location of the New Terminal
Among candidate sites for the New Terminal, the Team selected the Cimalaya Terminal as the
most suitable site.
(5) Future Railway Freight Capacity for Port Cargo
Two Cases are considered for Origin.
Case I Tanjung Priok as Origin Case II : Cilmalaya Terminal as Origin
Route map of each case is indicated below.
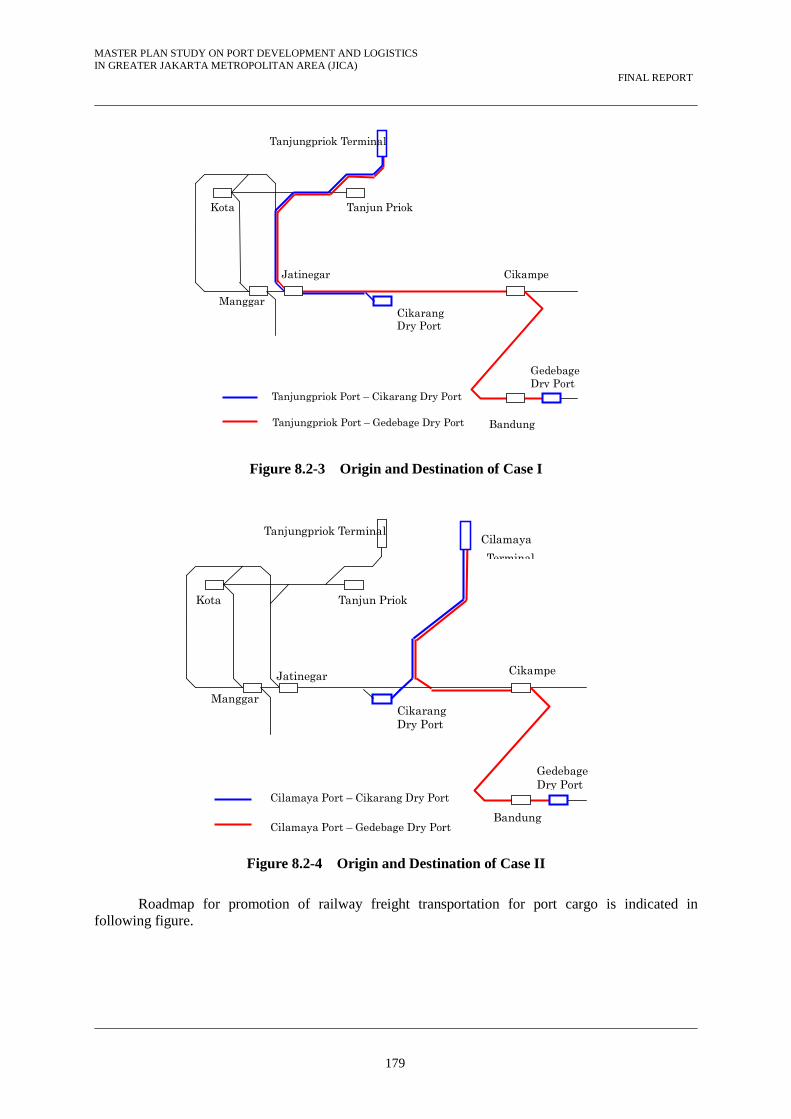
MASTER PLAN STUDY ON PORT DEVELOPMENT AND LOGISTICS IN GREATER JAKARTA METROPOLITAN AREA (JICA) FINAL REPORT
179
Cikarang Dry Port
Manggar
Tanjun Priok
Gedebage Dry Port
Bandung
Cikampe
Kota
Tanjungpriok Terminal
Jatinegar
Tanjungpriok Port – Cikarang Dry Port
Tanjungpriok Port – Gedebage Dry Port
Figure 8.2-3 Origin and Destination of Case I
CikarangDry Port
Manggar
Tanjun Priok
Gedebage Dry Port
Bandung
Cikampe
Kota
Jatinegar
Cilamaya Port – Cikarang Dry Port
Cilamaya Terminal
Cilamaya Port – Gedebage Dry Port
Tanjungpriok Terminal
Figure 8.2-4 Origin and Destination of Case II
Roadmap for promotion of railway freight transportation for port cargo is indicated in following figure.
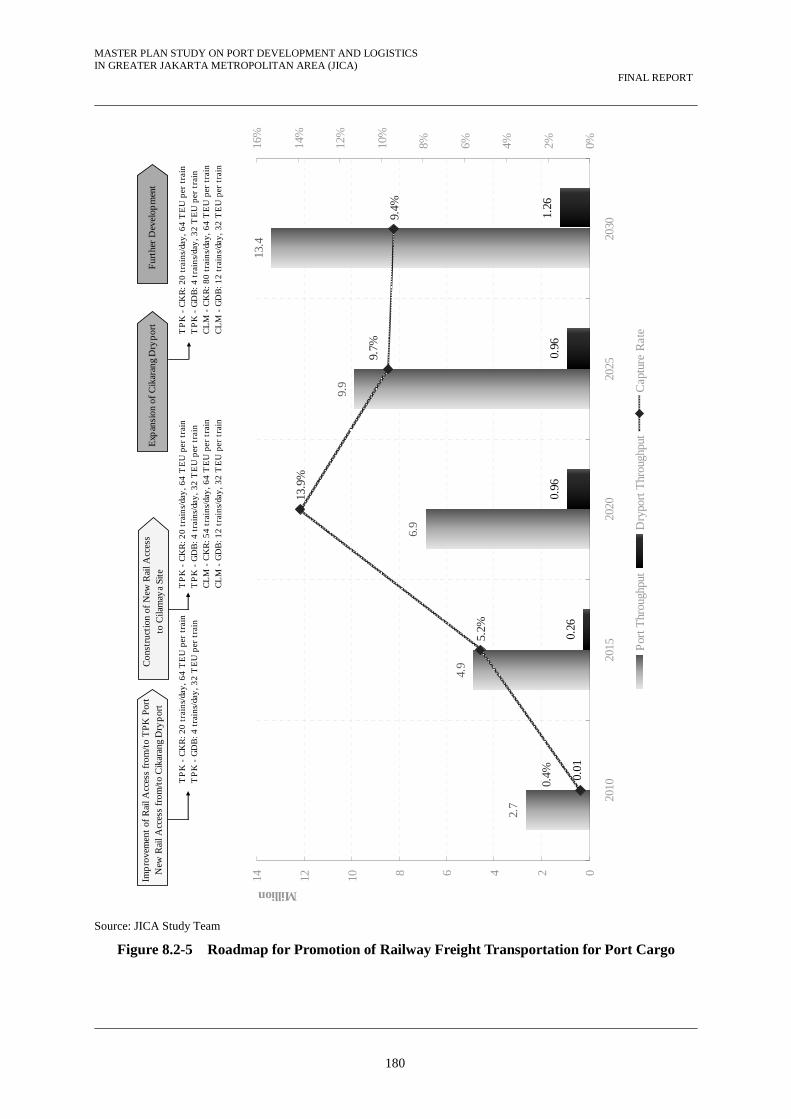
MASTER PLAN STUDY ON PORT DEVELOPMENT AND LOGISTICS IN GREATER JAKARTA METROPOLITAN AREA (JICA) FINAL REPORT
180
2.7
4.9
6.9
9.9
13.4
0.01
0.26
0.96
0.96
1.26
5.2%
13.9
%
9.4%
9.7%
0.4%
02468101214
2010
2015
2020
2025
2030
Million
0%2%4%6%8%10%
12%
14%
16%
Por
t Thr
ough
put
Dry
port
Thr
ough
put
Cap
ture
Rat
e
Fur
ther
Dev
elop
men
t
TP
K -
CK
R:
20 t
rain
s/da
y, 6
4 T
EU
per
tra
inT
PK
- G
DB
: 4
trai
ns/d
ay, 3
2 T
EU
per
tra
inT
PK
- C
KR
: 20
tra
ins/
day,
64
TE
U p
er t
rain
TP
K -
GD
B:
4 tr
ains
/day
, 32
TE
U p
er t
rain
CL
M -
CK
R:
80 t
rain
s/da
y, 6
4 T
EU
per
tra
inC
LM
- G
DB
: 12
tra
ins/
day,
32
TE
U p
er t
rain
Con
stru
ctio
n of
New
Rai
l Acc
ess
to C
ilam
aya
Site
Exp
ansi
on o
f C
ikar
ang
Dry
por
tIm
pro
vem
ent
of R
ail A
cces
s fr
om/t
o T
PK
Por
tN
ew R
ail A
cces
s fr
om/t
o C
ikar
ang
Dry
por
t
TP
K -
CK
R: 2
0 tr
ain
s/da
y, 6
4 T
EU
per
tra
inT
PK
- G
DB
: 4 t
rain
s/da
y, 3
2 T
EU
per
tra
inC
LM
- C
KR
: 54
trai
ns/d
ay, 6
4 T
EU
per
tra
inC
LM
- G
DB
: 12
trai
ns/d
ay, 3
2 T
EU
per
tra
in
Source: JICA Study Team
Figure 8.2-5 Roadmap for Promotion of Railway Freight Transportation for Port Cargo

MASTER PLAN STUDY ON PORT DEVELOPMENT AND LOGISTICS IN GREATER JAKARTA METROPOLITAN AREA (JICA) FINAL REPORT
181
8.3 Railway Freight Facilities Improvement Plan
(1) Formulation of Improvement Plan of Railway Freight from/to Tanjung Priok Terminal (Phase I)
1) Initial Stage after access railway to Tanjung Priok is connected
As the Stage1 of Case I development, following works are required to achieve the target throughput.
- Direct rail access to Tanjung Priok Terminal - Improvement of Gedebage Dryport - Construction of Cikarang Dryport and the access from main line - Procurement of rolling stock
Operation plan of this stage is indicated in following table.
Table 8.3-1 Operation Plan for Railway Freight from/to Tanjung Priok
Distance (km)
Trip Time (min)
Trips Per day
Wagons per train
Throughput(TEU)
Tg. Priok - Gedebage 191.5 278 2 16 23,360 Tg. Priok – Cikarang 52.0 61 10 32 233,600
Study Team Estimate
Following figure indicates loading/unloading track at Tanjung Priok Terminal and stabling track at Pasoso.
Figure 8.3-1 Proposed Loading Track of Tanjung Priok and Stabling Track of Pasoso

MASTER PLAN STUDY ON PORT DEVELOPMENT AND LOGISTICS IN GREATER JAKARTA METROPOLITAN AREA (JICA) FINAL REPORT
182
Proposed track layout of Cikarang Dryport is as follows.
Figure 8.3-2 Proposed Track Layout of Cikarang Dryport
Rolling stock procurement plan of this stage is indicated in following table.
These works are likely be carried out by 2015
2) Second stage when Jabodetabek Network is improved
Jabodetabek network will be improved to transport 3 million passengers per day from the current 0.7 million. To synchronize with this improvement, a 50% increase in the number of trains is required. Following works are required to achieve the target throughput.
- Construction of stabling yard at Tanjung Priok - Procurement of rolling stock
Operation plan of this stage is indicated in the following table.
Table 8.3-2 Operation Plan for Railway Freight from/to Tanjung Priok
Distance
(km) Trip Time
(min) Trips
Per day Wagons per train
Throughput(TEU)
Tg. Priok - Gedebage 191.5 278 3 16 35,040 Tg. Priok – Cikarang 52.0 61 15 32 350,400
Source: Study Team Estimate
These works are likely be carried out by 2020.
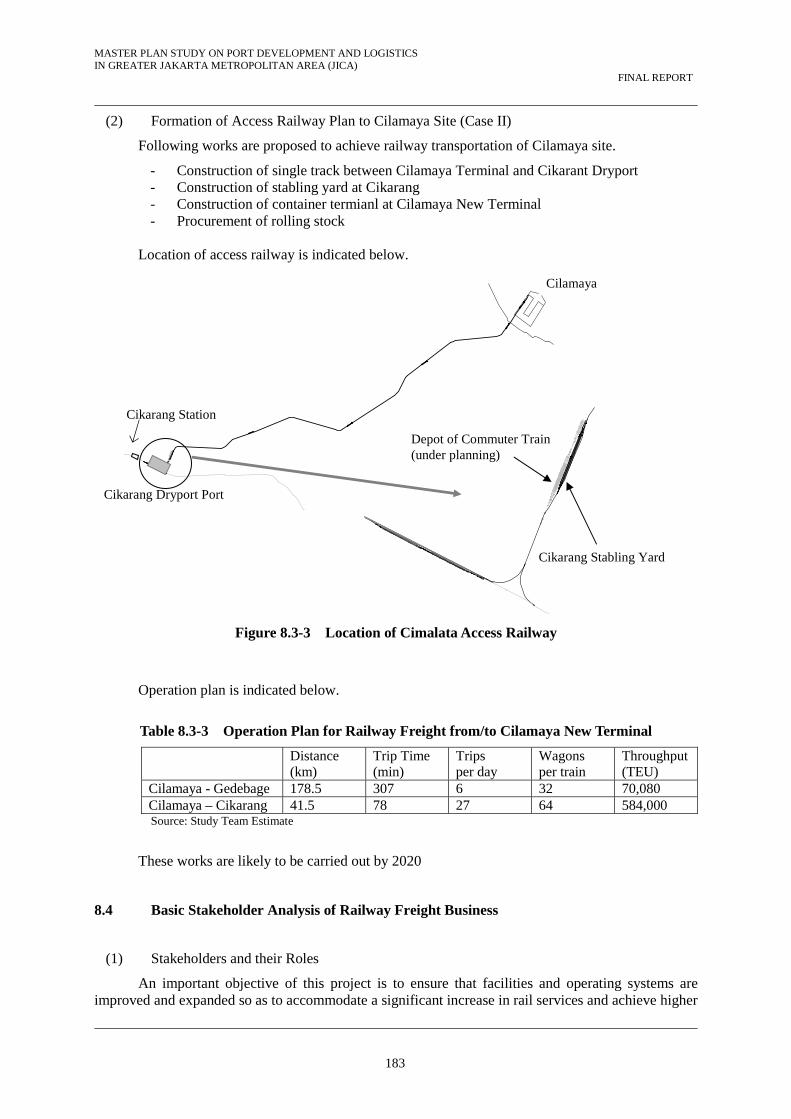
MASTER PLAN STUDY ON PORT DEVELOPMENT AND LOGISTICS IN GREATER JAKARTA METROPOLITAN AREA (JICA) FINAL REPORT
183
(2) Formation of Access Railway Plan to Cilamaya Site (Case II)
Following works are proposed to achieve railway transportation of Cilamaya site.
- Construction of single track between Cilamaya Terminal and Cikarant Dryport - Construction of stabling yard at Cikarang - Construction of container termianl at Cilamaya New Terminal - Procurement of rolling stock
Location of access railway is indicated below.
Figure 8.3-3 Location of Cimalata Access Railway
Operation plan is indicated below.
Table 8.3-3 Operation Plan for Railway Freight from/to Cilamaya New Terminal
Distance (km)
Trip Time (min)
Trips per day
Wagons per train
Throughput(TEU)
Cilamaya - Gedebage 178.5 307 6 32 70,080 Cilamaya – Cikarang 41.5 78 27 64 584,000 Source: Study Team Estimate
These works are likely to be carried out by 2020
8.4 Basic Stakeholder Analysis of Railway Freight Business
(1) Stakeholders and their Roles
An important objective of this project is to ensure that facilities and operating systems are improved and expanded so as to accommodate a significant increase in rail services and achieve higher
Cilamaya
Cikarang Dryport Port
Cikarang Station
Depot of Commuter Train (under planning)
Cikarang Stabling Yard

MASTER PLAN STUDY ON PORT DEVELOPMENT AND LOGISTICS IN GREATER JAKARTA METROPOLITAN AREA (JICA) FINAL REPORT
184
quality performance. The operation and maintenance of the railway cargo would be done by PT KA, while at Cilamaya, loading and unloading of trains is to be undertaken by assumed newly appointed terminal operator. Similarly, an independent operator would be in charge of handling containers at Cikarang Dry-Port.
A brief description of the roles, costs, and revenues of the main stakeholders in the container business is stated in Table 8.4-1.
Table 8.4-1 Stakeholder Analysis: Roles, Costs, and Revenues
Stakeholder Role Cost & Revenue
Container Yard Operator (Pelindo, MTI)
Handling TEU at port yard, Lo/Lo, depot management.
Capital investment of handling facilities O&M costs of handling facilities and equipment Revenue for handling, hauling, Lo/Lo, storage.
Central Government Directorate General of Railways
Acquiring ROW, infrastructure, rolling stock
Capital investment of infrastructure, rolling stock, and ROW Revenue : TAC.
Railway Freight Operator (PT. KA)
Transport of TEU by train from port to dry-port.
Capital investment of station facilities O&M costs of all railway facilities and equipment Revenue for transportation by train.
Dry-port Operator Handling TEU at dry-port yard, Lo/Lo, depot management.
Capital investment of dry-port facilities O&M costs of dry-port handling facilities and equipment Revenue for handling, Lo/Lo, storage.
Truck Feeder Transport by truck from dry-port to factory, stuffing & unloading.
O&M costs of trucks Revenue for transportation by truck
(2) Revenue Model
The revenue model for this project is assumed taking into consideration the current pattern of pricing for truck and train cargo transportation. The competitiveness of railway freight business was compared with the transport of containers by trucks. In this case, the price estimated is from “door-to-door”, i.e., from port yard to factory. The competitiveness of the railway freight business was confirmed to have a lower price tag than its competitor, trucks.
In case of railway cargo, in the current model, most of the TEU are moved one way empty to the factory to be loaded, and then moved full to the port for export, or vice versa in case of import.
We assume that the direct access project to Tanjung Priok from Pasoso station will be executed and therefore the current expenses of handling fee and hauling from port container depot to/from Pasoso station will not be considered.
In order to determine the revenue scheme, each individual stakeholder’s revenue stream was indentified.
The Return on Investment of Operator (ROI2) is determined from the viewpoint of the railway operator. For the use of the infrastructure and rolling stock, the railway operator (PT. KA) is obliged to pay a fee to the Government (DGR) called Track Access Charge (TAC).

MASTER PLAN STUDY ON PORT DEVELOPMENT AND LOGISTICS IN GREATER JAKARTA METROPOLITAN AREA (JICA) FINAL REPORT
185
Then, the unit price for railway freight was calculated and it is shown in Table 8.5-2 for ROI1 and Table 8.5-3 for ROI2.
8.5 Feasibility Analysis of Railway Freight Business
The main parameter to evaluate for the feasibility of the project is the Internal Rate of Return (IRR). In our case two different IRR are studied: One is the common Return on Investment (ROI1) considering the entire project, regardless of the ownership of the portions of the revenue, as it is divided into several stakeholders, as indicated in Section 8.4(1). The other is Return on Investment (ROI2) from the view point of the investment of Railway stakeholder, PT KA, which is assumed to be the operator of the railway portion of the freight business.
There are two cases to be studied:
a) Case 1: Freight from Tanjung Priok to Cikarang (only cost of railway facilities is included) and from Tanjung Priok to Gedebage, assuming completion of direct access from Pasoso station to JICT. The implementation timeline is from 2011 to 2015, including acquisition of rolling stock.
b) Case 2: Freight from Cilamaya to Cikarang (only cost of railway facilities is included) and from Cilamaya to Gedebage. The implementation timeline is from 2015 to 2020, including acquisition of rolling stock and ROW.
(1) Total Investment Project Cost
The cost estimation is compiled on a single currency, US Dollars, at an FX rate of 1US$=9000 Rp and 1US$=82 JPY. The construction unit cost is settled based on unit costs of similar projects in Indonesia and other South East Asian countries.
The cost is shown for later use on estimation of Return on Investment (ROI). ROI1 considers total investment cost of the entire project, regardless of the source of funds. On the other hand, ROI2 considers only investment cost borne by the railway freight operator.
(2) Project Revenue Estimate
The revenue is estimated separately for both IRRs, on project (ROI1) and on operator’s investment (ROI2).
In case of ROI, all revenue acquired due to infrastructure built under this project is considered as project revenue. Thus, the revenue would not only be the freight fee of rail, but also the handling fee at Cilamaya (Case 2). Trucking feeders’ fee is not included.
Since the facilities of Tanjung Priok, Gede Bage, and Cikarang are not part of this project, the revenue generated there is not considered.
Summary of revenues for FIRR on Project (ROI1) is shown in Table 8.5-2. In case of IRR on Investment of operator (ROI2), the price of transportation of the train (empty and full) only is considered as revenue of the operator. Summary of revenues for ROI2 is shown in Table 8.5-3.

MASTER PLAN STUDY ON PORT DEVELOPMENT AND LOGISTICS IN GREATER JAKARTA METROPOLITAN AREA (JICA) FINAL REPORT
186
Table 8.5-1 Construction Cost Estimate for Case 1 and Case 2 Project
Case 2 Case 1 Case 2US$ US$ US$ US$ US$
Stage 1 Stage 2
1. Civil Works 125,730,200
2. Building Works 2,430,000 12,110,000 2,430,000 12,110,000
3. Track Works 1,380,000 5,280,000 44,700,000
4. Signalling Works 24,000,000 21,000,000
5. Telecom Works 6,830,000
6. Maintenance Facilities 4,500,000 4,500,000
7. Container Handling 3,600,000 14,400,000
8. Rolling StockDiesel Locomotives 36,000,000 9,000,000 48,000,000 0 0
Freight Wagons 45,300,000 7,500,000 58,050,000 0 081,300,000 16,500,000 106,050,000 0 0
9. Land Acquisition 13,806,000 0
88,710,000 45,780,000 349,126,200 2,430,000 16,610,000
Engineering Cost (6%) 5,322,600 2,746,800 20,119,212 145,800 996,600
Contingency Cost (7%) 6,209,700 3,204,600 24,438,834 170,100 1,162,700
Taxes and Duties (10%) 8,871,000 4,578,000 33,532,020 243,000 1,661,000
Item
Total Investment Cost 109,113,300 427,216,266
Subtotal
Construction Cost
Case 1
56,309,400
Cost (ROI2)
2,988,900 20,430,300
Cost (ROI1)
SSource: Study Team Estimate
Table 8.5-2 Revenue Estimate for of Total Project (ROI1)
Unit Price Quantityround trip per section
from/to to/from Rp/TEU TEU/year Million $/y
Tanjung Priok Gede Bage 991,950 23,360 23,172Tanjung Priok Cikarang 392,100 233,600 91,595Tanjung Priok Gede Bage 991,950 35,040 34,758Tanjung Priok Cikarang 392,100 350,400 137,392Cilamaya Gede Bage 954,550 70,080 66,895Cilamaya Cikarang 365,450 584,000 213,423
280,318Case 2 31.15
114,767 12.75
Case 1(2020)
172,150 19.13
Options
Case 1(2015)
Revenueper Case
Million Rp/year
Source: Study Team Estimate
Table 8.5-3 Revenue Estimate for Investment of Operator (ROI2)
Unit Price Quantityround trip per section
from/to to/from Rp/TEU TEU/year Million $/y
Tanjung Priok Gede Bage 823,450 23,360 19,236Tanjung Priok Cikarang 223,600 233,600 52,233Tanjung Priok Gede Bage 823,450 35,040 28,854Tanjung Priok Cikarang 223,600 350,400 78,349Cilamaya Gede Bage 767,550 70,080 53,790Cilamaya Cikarang 178,450 584,000 104,215
OptionsRevenue
per Case
Case 2 158,005 17.56
Million Rp/year
Case 1(2015)
71,469 7.94
Case 1(2020)
107,203 11.91
Source: Study Team Estimate

MASTER PLAN STUDY ON PORT DEVELOPMENT AND LOGISTICS IN GREATER JAKARTA METROPOLITAN AREA (JICA) FINAL REPORT
187
(3) Operation and Maintenance Costs
Operation and maintenance costs for the railway operator are as shown in the Table 8.5-4.
Table 8.5-4 Annual Operation and Maintenance Costs
Million USD / year
Case 1 (2015) Case 1 (2020) Case 2
Energy Cost
Fuel Cost 1.786 2.679 4.195
Power for facilities 0.002 0.002 0.013
Personnel Cost 0.204 0.312 0.312
Maintenance Material Cost 0.000
Civil Infrastructure 0.240 0.360 0.836
Track Work 0.610 0.914 2.124
E&M 0.137 0.205 0.476
Rolling Stock Maintenance 1.173 1.428 1.541
Overhead Cost (15%) 0.623 0.885 1.425
TAC (25%) 1.194 1.696 2.730
Total Cost 5.969 8.481 13.652
Item
Source: Study Team Estimate
The O&M expenses mentioned before in Table 8.5-6 correspond to those expenses of the railway operator only, i.e., from the view point of investment of PT KA (ROI2). The O&M Cost for the whole project (ROI1) shall include the costs of the Tanjung Priok and Climaya handling facilities for Case 1 and case 2, respectively. The total O&M costs for (ROI1) are shown in Table 8.5-5 below.
Table 8.5-5 Annual Operation and Maintenance Costs (ROI1)
Million USD / year
Case 1 (2015) Case 1 (2020) Case 2
Railway O&M Cost (ROI2) 5.969 8.481 13.652Ports Handling O&M Costs 0.991 0.991 1.322Total O&M Cost (ROI1) 6.960 9.472 14.974
Item
Source: Study Team Estimate
(4) Financial Returns
The purpose of the financial analysis is to verify the feasibility of the freight railway transport from Cilamaya New terminal to the Cikarang dry port project from viewpoint of business enterprise and as project investment. As mentioned above, the FIRR on ROI1 of the project and on investment of the operator (ROI2) are calculated.
The financial analysis as FIRR of each case for the Cilamaya port and railway facilities is estimated as shown Table 8.5-6.
Table 8.5-6 Financial Returns of the Project
FIRR ROI1 ROI2 Case 1 3.59% 55.76% Case 2 0.79% 16.83%
Source: Study Team Estimate

MASTER PLAN STUDY ON PORT DEVELOPMENT AND LOGISTICS IN GREATER JAKARTA METROPOLITAN AREA (JICA) FINAL REPORT
188
8.6 Recommendation
The return on investment of the project for both cases, Case 1 and Case 2, is not high enough to make them financially feasible as the increase in revenue due to the project is very limited by the lack of capacity of the main line, and on the other hand, a considerable capital investment is required on rolling stock. On the other hand, considering only the return on investment of the operator, the result is financially feasible (55.76% for Case 1 and 16.83% for Case 2), yielding good profit to the train operator.
The return on investment of operator is acceptable and there is no doubt that the railway cargo business is attractive for the possible railway operators. However, there are question marks concerning the feasibility of the entire investment seen from the view point of the country as a whole.
However, there are some issues that should be considered as they expect to deliver advantage and social benefits by introducing the railway transport of the harbour freight.
There is a typical and successful example of collaboration of railway and truck transport of port cargo in Thailand at the Laem Chabang Port (LCP). This case is very similar in technical and background matters with the case of the development of Cilamaya port, where the traffic is between the new constructed port and a Railway Inland Container Depot (ICD) at the Lard Krabang area, about 100km north for LCP.
In this endeavor the port developers also had the strong support from the central government through the Directorate General of Railway of Thailand (DGR) and State Railway of Thailand (SRT). This has been a success for all stakeholders, port authorities, truck companies, and railway operator.
Case 1: Recommending Improvement of Railway Freight to Tanjung Priok
The lack of capacity of roads and the large number of small inland container depots (ICD) in the hinterland of the Tanjung Priok Port is creating enormous traffic congestion for the transport of cargo, and beyond that, to non-cargo users in the vicinity of Tanjung Priok and along the expressway of Jakarta.
It is therefore clear that even with an internal return on the investment of only 4%, the benefits brought by the project are remarkable. The most important part is to materialize the direct connection between railway and JICT, by extending the tracks from Pasoso station to the yard of JICT. This will avoid additional transport by truck (hauling) double handling (loading/unloading) of containers, and thus will reduce the congestion of container yard.
Case 2: Recommending railway transport access to the new Cilamaya terminal
The railway transport is expected to create considerable advantages, particularly enhancement of handling capacities of the terminal with the limited terminal facilities and at the same time the railway transport will form basic social infrastructure for regional development.
The railway transport will help to reduce the dwelling time of containers in the terminal in cooperation with truck transport by quick dispatch of cargo from the terminal. Subsequently the stock area in the yards will be provided for the next cargoes unloaded from the ships. As a result, the railway transport will contribute to enhance the handling capacity of the terminal.
Moreover, the lower return on investment should not prevent this project from going forward; in addition, this project should be considered beyond the time frame for the Master Plan and beyond the geographic area now covered. This is because railway freight services might open opportunities for new dry-port along the route or beyond to the east, which will lead to increased capacity and social development of this area.

MASTER PLAN STUDY ON PORT DEVELOPMENT AND LOGISTICS IN GREATER JAKARTA METROPOLITAN AREA (JICA) FINAL REPORT
189
9. PRE-FEASIBILITY STUDY
9.1. Extraction of the Urgent Development Project
The following urgent development project has been extracted from the first phased implementation plan in the proposed Master Plan (see 4.7.2 (3) of Chapter 4):
Construction Project of North Kalibaru Container Terminal
The outlines of the project are shown in the following sections.
9.2. Construction of a Container Terminal
(1) Project Site
The Project site for development of a new container terminal is located at the North Kalibaru area in the Tanjung Priok Port. The scope and site location is shown in the Figure 9.2-1.
(2) Project Components
The project is planned to be executed by PPP (Public Private Partnership) scheme by sharing the following components between the public and private sectors.
Table 9.2-1 Project Components of Urgent Development Project
Components of Off shore Container Terminal Responsible of Implementation1. Development of New Container Terminal Facilities Public sector Private sector 2. Dredging works for Channel and Turning Basin Depth -15.5m, W=320m Diameter =740m
2. Demolishing Existing Breakwater L=3,308m 3. Construction of new Breakwater by recycle of demolished breakwater material L=633m
4. Construction of Seawall (L=1,935m) and Revetment (L=820m) for Reclamation works
5. Reclamation works (DL+3.5m) for 2-terminals 6. Soil Improvement works By public; Seawall; Revetment; Terminal inner road; Stock yard & Public security area.
7. Quay wall construction for 87,000DWT Length=600 m x 2 terminals and Depth -15.5m
8. Procurement of Cargo Handling Equipment 6 units of QGC, 16 units of RTG x 2 terminals and others
9. Yard Pavement works with Drainage system 10. Terminal Inner Road, (3 lanes, 12m width and concrete pavement for heavy loaded trucks)
11. Utility Supply (Power supply and water supply) 12. Building works 13. Environmental Treatment Facilities 14. Security System Facilities Access Road /Bridge Development 1. Access Road and bridge Construction Road (L=0.95 km, 2 lanes) and Bridge (L= 1.1 km, 2 lanes)
Consulting Services; DD, Tender Assist, Construction supervisory

MASTER PLAN STUDY ON PORT DEVELOPMENT AND LOGISTICS IN GREATER JAKARTA METROPOLITAN AREA (JICA) FINAL REPORT
190
Figure 9.2-1 Project site for development of new container terminal at North Kalibaru

MASTER PLAN STUDY ON PORT DEVELOPMENT AND LOGISTICS IN GREATER JAKARTA METROPOLITAN AREA (JICA) FINAL REPORT
191
(3) Design of Project Facilities
1) Offshore Terminal Facilities
Channel and Turning Basin Development
The expected maximum ship size is Post-Panamax (DWT; 87,545, LOA; 318m, Draft; 14.0m, Beam; 40.06m). To allow two-way traffic of vessels of above-mentioned type, the new navigation channel will have a width of 310 m and depth of 15.5 m.
The water depth for dredging the channel and turning basin has been set at -15.5 m and side slope of the dredging section is assumed to be 1 to 5.The total dredging volume under Phase I project is estimated as 16.184 mil cum.
The existing breakwaters are removed for development of Phase 1 new terminals at NKB. Parts of the new breakwater (section totalling 3,609.8m in length) will be constructed by recycling demolished material.
A new rubble mound type breakwater with PVD foundation soil improvement is planned at the depth of around 4 m between the planned new off shore container terminal and the New Dam Tengah breakwater to be constructed by Tanjung Priok Urgent Rehabilitation Project (URPT) under the Phase 1 Project.
Preliminary Design of Quay wall Structure
Adopting the design criteria as described in 5.1.2 (2) the quay wall structure is designed with concrete deck on steel pipe pile at the design depth of -15.5 m and crown height of +3.50m in the length of 600m x 2 terminals and in the width of 35m.
Container Yard Development by Seawall and Revetment
Adopting design criteria and concept of accepting overtopping local waves as described in 5.1.2 (4) the seawall and revetment to protect reclamation land is designed with steel sheet piles driven to -25m and gravity type (Concrete blocks wall placed on the rubble mound) at the slope of 1:4/3 ~ 2 and to the crown height of +2.50m with Plastic Vertical Drain (PVD) Method for soil improvement.
Reclamation works
Reclamation works will be carried out by filling material of quarry run and rubble stones taken from the quarry around the project sites. The infill material should be placed from the existing sea bed up to +2.0 m from CDL. Average thickness of reclamation will be 6 to 7 m. The estimated volume for respective phases is 8.29 mil cum. Average elevation of the planned yard after pavement will be +3.5 m (MSL+3.0m).
Yard Pavement and Drainage in new terminal area
Based on the operation planning of the yard area and corresponding to critical wheel load, 4 different types of pavement structure (RO concrete, RC concrete block + asphalt, asphalt concrete, Interlocking concrete block) are designed.
Terminal Inner Road
The new Kalibaru terminal is expected to handle about 1.9mil TEUs of container in future. The Terminal road is planned to have 12 m width for 3 lanes (2 lanes for through traffic and 1 lane for gate queue) and concrete pavement with gravel foundation to sustain truck wheel load of H22-44. The inner road will surround the reclaimed land outside the container yards.

MASTER PLAN STUDY ON PORT DEVELOPMENT AND LOGISTICS IN GREATER JAKARTA METROPOLITAN AREA (JICA) FINAL REPORT
192
(4) Design Concept of Access Road
The access road was planned to connect the off shore new terminal at North Kalibaru from the existing arterial road as the Urgent Project of new Container terminal development considering following aspects.
- To be the arterial road - To utilize the existing road to minimize resettlement - To construct a bridge between land and the terminal - To install a signalized intersection for connecting with the existing road
1) Cross Section of Access road
The estimated traffic volume for the access road is 28,238 PCU/day in 2030. According to the design standards in Indonesian, a lane has a capacity of 20,000 PCU/day. Therefore, a two-lane road is planned for the access road having 7m width for each lane (14 m width in total); pavement type is cement concrete.
2) Plan and Profile
Horizontal alignment
Three routes were examined for the horizontal alignment of the access road on the land section. Although the land around the proposed area is administrated by PERINDO 2, the area is occupied by houses, shops, warehouses and a market. As a result of an evaluation of alternative routes and Route 1” Existing access road to Kalibaru port” is selected. The total length of the access road is 2.1 km; road sections comprise 950 m and bridge sections 1,100m.
Vertical alignment
The road height should be almost the same as the ground level, about 1.5 to 3.0 m above M.S.L. For the bridge section, the road is raised to secure the vertical clearance of 5.0m above M.S.L for fishing boats passing under the bridge.
Bridge Structure
A PC- I shape-girder bridge with a 35m span, which is the same type of standard span bridge as North Kalibaru, is applied for the bridge parts of the planned access road. The section of bridge has 14 m width for two lanes with concrete slab on the PC girder. The length of the bridge is 1,100m.
It is planned that the RC concrete pier structure supported by cast-in site concrete piles to be driven to -20 m-25m depth from the RC footing structure is constructed at every 35 m as the foundation of girder bridge.
(5) Cost Estimates of Urgent Development of Container Terminal at North Kalibaru
1) The Cost Estimate of Off shore Terminal Development
The work items and their quantities, construction costs are detailed in the Table 9.2-3.
Total Project Cost of the new terminal (including indirect cost of construction, contingency, cost for engineering services and administration, VAT) is estimated as 8,230,382 million Rupiah (around 914 .5 million USD, or 74,822 million Yen).
In line with the proposed sharing project cost between Public Sector and Private Sector, Table 9.2-2 presents following shares of each investment. The detailed breakdown is shown in Table 9.2-7

MASTER PLAN STUDY ON PORT DEVELOPMENT AND LOGISTICS IN GREATER JAKARTA METROPOLITAN AREA (JICA) FINAL REPORT
193
Table 9.2-2 Project Cost Share by Public and Private Sectors for Urgent Project
at North Kalibaru ( unit; million Rupiah)
Works Public Private Total 1 Construction Cost: Stage 1 of
Kalibaru Terminal 2,535,371 1,584,617 4,119,988
(62%) (38%) 2 Construction Cost: Stage 2 of
Kalibaru Terminal 582,929 1,584,617 2,167,546 (27%) (73%)
3 General Cost of Terminal Construction works, Mob/Demob etc
155,914 158,461 314,375 (44%) (56%)
4 Project Related Cost, ES cost, Contingency etc
563,331 363,461 926,792 (61%) (39%)
5 Total Construction cost of Terminal Development
3,837,546 3,644,619 7,482,165 (48%) (52%)
6 Construction Cost of Access Road and Bridge at North Kalibaru
466,994 None 466,994 (100%) (0%)
7 Total Construction Cost by Terminals and Access road
4,300,165 3,644,619 7,945,234 (53%) (47%)
8 Total Project Cost including VAT
4,730,677 4,009,081 8,739,758 (55%) (45%)
In term of USD (million) 525.0 445.5 971.1 In term of Japan yen (million) 43,006 36,446 79,452

MASTER PLAN STUDY ON PORT DEVELOPMENT AND LOGISTICS IN GREATER JAKARTA METROPOLITAN AREA (JICA) FINAL REPORT
194
Table 9.2-3 Project Cost Estimate of North Kalibaru Phase I (Stage 1 development)
Project Cost (1,000 Rupiah)
1. General Cost 137,642,116 176,734,572 314,376,688
2. Direct Construction Cost
2.1 Stage 1 of Construction
(1) Breakwaters
Construction
Dam Tengah Extension m 640 15,625,390 39,326,760 54,952,150
Demolition
Dam Citra m 1,548 21,672,000 32,508,000 54,180,000
Dam Pertamina m 1,760 31,680,000 47,520,000 79,200,000
(2) Seawalls
North Seawall m 1,305 83,144,440 59,862,228 143,006,668
Revetment (West) m 620 28,013,751 2,402,540 30,416,291
East Seawall m 630 27,582,414 2,395,968 29,978,382
Revetment (-3 m) m 200 7,005,414 6,680,543 13,685,957
(3) Port Inner Road m 1,335 36,700,317 17,293,350 53,993,667
(4) Dredging of Channel and Basin
Deepening (-14 m ~ -15.5 m) m3 4,479,362 146,702,717 193,781,308 340,484,025
Basin in front of New Terminal m3 7,701,183 252,219,961 333,160,251 585,380,212
Basin in front of Koja Terminal m3 4,003,986 131,133,779 173,216,118 304,349,897
(5) Container Terminal Stage 1
Quay Wall (-15.5 m) m 600 190,843,236 89,192,554 280,035,791
Yard Construction
Reclamation (DL+3.5 m) m3 2,475,000 242,523,750 98,072,300 340,596,050
Reclamation (Surcharge 3 m m3 990,000 97,009,500 39,228,920 136,238,420
Soil Improvement m2 330,000 39,726,115 17,025,478 56,751,592
Stacking Yard Pavement m2 134,750 76,807,500 51,205,000 128,012,500
Passage Pavement m2 195,250 73,804,500 49,203,000 123,007,500
Terminal Buildings m2 6,000 17,568,000 4,392,000 21,960,000
Container Handling Equipment and Operation System 92,294,100 830,646,900 922,941,000
(6) Security and Utility
Reclamation (DL+3.5 m) m3 810,980 79,467,439 32,135,222 111,602,660
Soil Improvement m2 70,520 8,489,350 3,638,293 12,127,643
Ground Pavement m2 70,520 26,656,560 17,771,040 44,427,600
X -ray Inspection House l.s. 1 14,400,000 129,600,000 144,000,000
Utility Faclities of Stage 1 l.s. 1 73,828,260 34,831,925 108,660,185
Sub-total of Direct Cost (Stage 1) 1,814,898,494 2,305,089,697 4,119,988,192
Description Unit QuantitySummationLocal Portion Foreign Portion

MASTER PLAN STUDY ON PORT DEVELOPMENT AND LOGISTICS IN GREATER JAKARTA METROPOLITAN AREA (JICA) FINAL REPORT
195
Table 9.2-4 Project Cost Estimate of North Kalibaru Phase I (Stage 2 development)
Project Cost (1,000 Rupiah)
2.2 Stage 2 of Construction
(7) Port Inner Road m 1,220
Road Pavement m2 21,960 8,300,880 5,533,920 13,834,800
Reclamation (DL+3.5 m) m3 164,700 16,138,853 6,526,266 22,665,119
Reclamation (Surcharge 3 m) m3 65,880 6,455,541 2,610,506 9,066,048
Soil Improvement m2 21,960 2,643,592 1,132,968 3,776,561
(8) Container Terminal 2
Quay Wall m 600 190,843,236 89,192,554 280,035,791
Yard Construction
Reclamation (DL+3.5 m) m3 2,475,000 242,523,750 98,072,300 340,596,050
Reclamation (Surcharge 3 m m3 990,000 97,009,500 39,228,920 136,238,420
Soil Improvement m2 330,000 39,726,115 17,025,478 56,751,592
Stacking Yard Pavement m2 134,750 76,807,500 51,205,000 128,012,500
Passage Pavement m2 195,250 73,804,500 49,203,000 123,007,500
Terminal Buildings m2 6,000 17,568,000 4,392,000 21,960,000
Container Handling Equipment and Operation System 92,294,100 830,646,900 922,941,000
(9) Utility Facility of Stage 2
Utility Faclities l.s. 1 73,828,260 34,831,925 108,660,185
Sub-total of Direct Cost (Stage 2) 937,943,828 1,229,601,737 2,167,545,565
Direct Construction Cost (DC; Stage 1 + Stage 2) 2,752,842,323 3,534,691,434 6,287,533,757
3. Project Related Expenses (PE) 385,397,925 494,856,801 880,254,726
(1) Engineering Service l.s. 1 82,585,270 106,040,743 188,626,013
(2) Contingency l.s. 1 275,284,232 353,469,143 628,753,376
(3) Administration Cost l.s. 1 27,528,423 35,346,914 62,875,338
4. Total Construction Cost 3,275,882,364 4,206,282,807 7,482,165,171
VAT 327,588,236 420,628,281 748,216,517
Grand Total of Phase I Development 3,603,470,601 4,626,911,088 8,230,381,688
1 USD = 9,000 Rupiah 914.5 million USD
100 Yen = 11,000 Rupiah 74,822 million Yen
Foreign Portion SummationDescription Unit Quantity
Local Portion
2) Cost Estimate of Access road construction
The construction cost of Access Road Development of Urgent Required Terminal was estimated at Rp 513,692 million as shown in Table 9.2-5.

MASTER PLAN STUDY ON PORT DEVELOPMENT AND LOGISTICS IN GREATER JAKARTA METROPOLITAN AREA (JICA) FINAL REPORT
196
Table 9.2-5 Construction cost of access road for North Kalibaru Phase 1
Description Unit Unit Cost Quantity(RP.) Local Portion Foreign Portion Summation
1 GENERAL l.s 1 19,229 392 19,622
2
Road
a:Earthwork m3 60,000 5,611 337 337
b:Pavement m2 500,000 14,425 7,068 144 7,213
c:Drainage m 1,000,000 1,916 1,877 38 1,916
d:Miscellaneous l.s 250,000,000 1 212 38 250
m2 4,000,000 630 2,469 50 2,520
11,963 270 12,235
Bridge
l.s 110,000,000,000 1 88,000 22,000 110,000
m2 5,000,000 18,346 73,384 18,346 91,730
m2 8,000,000 18,346 117,414 29,354 146,768
m2 700,000 14,912 10,229 209 10,438
m 1,000,000 2,260 1,808 452 2,260
l.s 19,000,000,000 1 16,150 2,850 19,000
306,985 73,210 380,196
318,948 73,481 392,432
3
a l.s 1 31,894 7,348 39,243
b l.s 1 7,063 4,710 11,773
c. 3,924 3,924
d 42,882 12,058 54,940
l.s 381,058 85,931 466,993
5 38,105 8,593 46,699
l.s 419,163 94,524 513,6926. Total Project Cost
Administration Cost
Sub Total
4. Construction Cost
Engineering Service
VAT
f:Miscellaneous
Subtotal
Direct CostructionCostTotal
Contingency
Project RelatedExpensise
b:Sub-structureworks
c:Super-structure
d:Pavement
e:Drainage
Direct ConstructionCost
e:Pile Slab
Subtotal
a:Preparation works
Cost Estimate(million Rp)

MASTER PLAN STUDY ON PORT DEVELOPMENT AND LOGISTICS IN GREATER JAKARTA METROPOLITAN AREA (JICA) FINAL REPORT
197
Table 9.2-6 Proposed Sharing Plan of Project Cost between Public and Private Sectors (1/2)
Project Cost (1,000 Rupiah)
1. General Cost 155,914,990 158,461,698 314,376,688
2. Direct Construction Cost
2.1 Stage 1 of Construction
(1) Breakwaters
Construction
Dam Tengah Extension m 640 54,952,150
Demolition
Dam Citra m 1,548 54,180,000
Dam Pertamina m 1,760 79,200,000
(2) Seawalls
North Seawall m 1,305 143,006,668
Revetment (West) m 620 30,416,291
East Seawall m 630 29,978,382
Revetment (-3 m) m 200 13,685,957
(3) Port Inner Road m 1,335 53,993,667
(4) Dredging of Channel and Basin 1,230,214,134
(5) Container Terminal Stage 1
Quay Wall (-15.5 m) m 600 280,035,791
Yard Construction
Reclamation (DL+3.5 m) m3 2,475,000 340,596,050
Reclamation (Surcharge 3 m m3 990,000 136,238,420
Soil Improvement m2 330,000 56,751,592
Stacking Yard Pavement m2 134,750 128,012,500
Passage Pavement m2 195,250 123,007,500
Terminal Buildings m2 6,000 21,960,000
Container Handling Equipment and Operation System 922,941,000
(6) Security and Utility
Reclamation (DL+3.5 m) m3 810,980 111,602,660
Soil Improvement m2 70,520 12,127,643
Ground Pavement m2 70,520 44,427,600
X -ray Inspection House l.s. 1 144,000,000
Utility Faclities of Stage 1 l.s. 1 108,660,185
Sub-total of Direct Cost (Stage 1) 2,535,371,216 1,584,616,976 4,119,988,192
62% 38% 100%
2.2 Stage 2 of Construction
(7) Port Inner Road m 1,220 49,342,527
(8) Container Terminal 2
Quay Wall m 600 280,035,791
Yard Construction
Reclamation (DL+3.5 m) m3 2,475,000 340,596,050
Reclamation (Surcharge 3 m m3 990,000 136,238,420
Soil Improvement m2 330,000 56,751,592
Stacking Yard Pavement m2 134,750 128,012,500
Passage Pavement m2 195,250 123,007,500
Description Unit QuantitySummation
PublicInvestment
PrivateInvestment

MASTER PLAN STUDY ON PORT DEVELOPMENT AND LOGISTICS IN GREATER JAKARTA METROPOLITAN AREA (JICA) FINAL REPORT
198
Table 9.2-7 Proposed Sharing Plan of Project Cost between Public and Private Sectors (2/2)
Project Cost (1,000 Rupiah)
Terminal Buildings m2 6,000 21,960,000
Container Handling Equipment and Operation System 922,941,000
(9) Utility Facility of Stage 2
Utility Faclities l.s. 1 108,660,185
Sub-total of Direct Cost (Stage 2) 582,928,590 1,584,616,976 2,167,545,565
27% 73% 100%
Direct Construction Cost (DC; Stage 1 + Stage 2) 3,118,299,806 3,169,233,952 6,287,533,757
49.6% 50.4% 100%
3. Project Related Expenses (PE) 563,331,331 316,923,395 880,254,726
(1) Engineering Service l.s. 1 188,626,013 188,626,013
(2) Contingency l.s. 1 311,829,981 316,923,395 628,753,376
(3) Administration Cost l.s. 1 62,875,338 62,875,338
4. Total Construction Cost of Container Terminals 3,837,546,127 3,644,619,044 7,482,165,171
VAT 383,754,613 364,461,904 748,216,517
5. Access Road Construction at North Kalibaru
5.1 Genneral 58,864,734 58,864,734
5.2 Direct Construction Cost
(1) Road m 12,235,160 12,235,160
(2) Bridge 380,196,400 380,196,400
Sub-total of Direct Construction Cost 392,431,560 392,431,560
5.3 Contingency 39,243,156 39,243,156
5.4 Engineering Service 49,054,000 49,054,000
5.5 Total Construction Cost of Access Road 539,593,450 539,593,450
VAT (10%) 53,959,345 53,959,345
6. Total of Project Cost (Container Terminal and Road)
6.1 Construction Cost (1.+ 2.+ 5.1+ 5.2) 3,725,511,090 3,327,695,649 7,053,206,739
6.2 Engineering Service 237,680,013 237,680,013
6.3 Contingency 351,073,137 316,923,395 667,996,532
6.4 Administration Cost 62,875,338 62,875,338
Total Project Cost 4,377,139,577 3,644,619,044 8,021,758,621
VAT (10%) 437,713,958 364,461,904 802,175,862
Grand Total (1,000 Rupiah) 4,814,853,534 4,009,080,949 8,823,934,483
Grand Total in million USD 535.0 445.5 980.4in million Yen 43,771 36,446 80,218
55% 45% 100%
1 USD = 9,000 Rupiah
100 Yen = 11,000 Rupiah
PrivateInvestment
SummationDescription Unit Quantity Public
Investment

MASTER PLAN STUDY ON PORT DEVELOPMENT AND LOGISTICS IN GREATER JAKARTA METROPOLITAN AREA (JICA) FINAL REPORT
199
(6) Implementation Schedule Urgent Development Project of New Container Terminal for Phase 1Terminal Development Project
Considering urgency of each project component and step-by-step development, Implementation schedule is made taking into consideration the time of the administration procedures and in accordance with construction capability.
Urgent Development Scenario at North Kalibaru is presented as follows.
Planned extension of quay wall in the development of North Kalibaru Phase I is 1,200 m for two terminals and the planned dredging volume to deepen the channel and turning basins up to -15.5 m in the development of North Kalibaru Phase I amounts to 16 million m3.
In order for the planned container terminal to be operational in the 5th year after L/A (4th year after implementation of construction), the staged development of the container terminal Phase I is taken into consideration.
Phase I development of the North Kalibaru Container Terminal is targeting container throughput of 1.9 million TEU/year (quay wall length: 1,200 m). The construction works are divided into two stages along the length of quay wall (600 m + 600 m). The construction works managed in each stage are assumed as follows.
Stage 1 (2nd – 4th Year)
Dredging of channel and basins, demolition of the existing breakwaters, re-construction of breakwaters, construction of protective facilities (seawalls, revetments), construction of quay wall 600 m, reclamation and development of container terminal yard with on land facilities.
Stage 2 (4th – 5th Year)
Construction of Quay wall 600 m, reclamation terminal yard and development of container terminal on land facilities.
Implementation schedule of North Kalibaru Phase I is presented in Table 9.2-8.
Table 9.2-8 Implementation Schedule of Urgent Development Project at North Kalibaru
Ist Year 2nd Year 3rd Year 4th Year 5th Year 6th Year 7th Year
After L/A
North Kalibaru Phase I
1. Administration Procedure
2. Construction Stage
2.1 Access Road and Bridge
2.2 Stage 1 of Container Terminal
Breakwaters and Seawalls
Dredging of Channel and Basin
Container Terminal Stage 1
Terminal Buildings
Container Handling Equipment
Security and Utility
Start of Terminal Operation Stage 1
2.3 Stage 2 of Container Terminal
Container Terminal Stage 2
Terminal Buildings
Container Handling Equipment
Utility Facilities
Start of Terminal Operation Stage 2
Description
MASTER PLAN STUDY ON PORT DEVELOPMENT AND LOGISTICS IN GREATER JAKARTA METROPOLITAN AREA (JICA) FINAL REPORT
200
Access Road and Bridge Construction
The construction of the access road is scheduled to take about 3.5 years including project preparations.
Access Road construction for Urgent Terminal Development Project will be started in second year after the project finance is completed and completed in the middle of the third year.
9.3. Economic Analysis
(1) Purpose and Methodology of Economic Analysis
The economic analysis is carried out to study economic benefits as well as economic costs arising from the project, and to evaluate whether the benefits of the project exceed those that could be obtained from other investment opportunities in Indonesia.
In the economic analysis the development plan, namely “With the project” case, will be compared to the “Without the project” case. All of the benefit and cost differences between the “With” case and “Without” case will be calculated in market price, then they will be converted to economic price.
In this study, the Economic Internal Rate of Return (EIRR) method is used to evaluate and appraise the economic feasibility of the project. Sensitivity analysis is also conducted.
(2) “Without” Case
In the “With” case, the new container terminals at North Kalibaru 1st Phase will accommodate up to 1.9 million TEUs of international containers.
In the “Without” case, international containers will overflow after the existing terminals are saturated. Extra space is not available at Tanjung Priok Terminal for loading and unloading international containers. It is assumed in this Economic Analysis that in the “Without” case, a total of 400,000 TEUs of international containers are loaded/unloaded at Ciwandan Port and Merakmas Port in the Banten province and transported by trucks over land to/from consignees and exporters. However, 1.5 million TEUs of international containers still cannot pass through the port. Consequently, Indonesian economy will lose corresponding amount of foreign earnings. Container throughputs for “With” and “Without” case are summarized in Table 9.3-1.

MASTER PLAN STUDY ON PORT DEVELOPMENT AND LOGISTICS IN GREATER JAKARTA METROPOLITAN AREA (JICA) FINAL REPORT
201
Table 9.3-1 Container Throughput for “With” and “Without” Case
(Unit: '000 TEUs)
"With"
1st Year 4,029 4,0292nd Year 4,460 4,4603rd Year 4,850 4,8504th Year 4,850 4,8505th Year 4,850 858 400 458 5,7086th Year 4,850 1,245 400 845 6,0957th Year 4,850 1,632 400 1,232 6,4828th Year 4,850 1,900 400 1,500 6,8699th Year 4,000 1,900 400 1,500 7,255
10th Year 4,000 1,900 400 1,500 7,777----- ----- ----- ----- ----- -----
NorthKalibaru I
Source: Estimated by the Study Team
Note: Jakarta Container Terminal containing JICT, KOJA and MAL at Tanjung PriokTerminal
Year (afterLA) JCT Missed
Throughput
"Without"Estimated Throughput for International Container
TotalPorts inBanten
(3) Benefits of the Projects
Following items are identified as economic returns brought about by the implementation of container terminal development project at North Kalibaru Phase I..
- Value added of exporting commodities - Savings in land transportation cost between terminals and factories/warehouses
Value added of export commodities which will be handled at the North Kalibaru Phase I. Container Terminal is counted as the benefit of the project. Although both export commodities and import commodities contribute to generate value added in Indonesia, only value added generated from export commodities are counted in this EIRR analysis.
Based on the two independent data sources, i.e., Indonesian Customs statistics on Tanjung Priok port and study results on Indonesian container export to Japan, value of exporting commodities is estimated at US$30,000/Laden Export TEU. Percentage of operating income of individual firm varies widely from a few percentages up to 20 percent. Average percentage of the operating income of the about 30 samples is in the vicinity of 7 percent, which is adopted to estimate the value added in this economic analysis.
Land transportation costs for 400,000 TEUs between the North Kalibaru and shippers /consigners are estimated taking trucking distance and congestion level into consideration, and compared with that of the “Without” case, i.e., alternatively using Ciwandan/Merakmas Ports. Land transportation cost difference between them is counted as one of the benefits of the project. Land transportation costs are estimated in economic price.
(4) Costs of the Projects
Following items are counted as the cost components of the project:

MASTER PLAN STUDY ON PORT DEVELOPMENT AND LOGISTICS IN GREATER JAKARTA METROPOLITAN AREA (JICA) FINAL REPORT
202
- Construction cost of port facilities and access road - Management and operation cost - Maintenance cost - Replacement cost of cargo handling equipment
Construction costs basically consist of costs for breakwaters and seawalls, channel and basin, container terminals (quay wall, yard pavement, and terminal buildings), cargo handling equipment, security and utility, and the project related indirect costs. The cost for the port access road is also one of the important cost components of the project. The construction cost is firstly estimated by market price. After transfer costs such as VAT are removed, the costs expressed by market price are converted into economic pricing using conversion factors.
Personnel costs for management and operation of the terminals are estimated for both “With” case and “Without” case. Utility costs including electricity are estimated at 2% of the initial equipment procurement costs.
The annual costs for maintaining the port facilities are estimated as a fixed rate of the initial investment, specifically 0.2% for port infrastructure (breakwaters, seawalls, quay walls, yard pavement, and buildings) and 5% of the original construction costs of the port access road. Annual maintenance costs for cargo handling equipment are estimated at 1% of their initial procurement cost. It is expected that maintenance dredging will be required every five years but its volume will be minimal.
Cargo handling equipment will be replaced after its service life expires. Service life of the equipment is set individually by type of equipment: 25 years for quay cranes and 4 years for yard vehicles.
(5) EIRR and Economic Feasibility
The Economic Internal Rate of Return (EIRR) is the discount rate which makes the costs and benefits of a project during the project life equal. As shown in Table 9.3-2, EIRR of Kalibaru Phase I project is estimated at 53%.
In order to see whether the project is still feasible when some conditions change, a sensitivity analysis is also conducted. Even if in the case in which both the costs increase by 10% and the benefits decrease by 10%, the EIRR of this scenario is estimated at 46.5%.
An EIRR of the project is compared with the opportunity cost of capital in the project country, and if the former is higher than the latter, then it can be said that the project is economically feasible. Even under the worst scenario the EIRR of the project is much higher than the opportunity cost in Indonesia.
This means that the planned project is economically feasible.

MASTER PLAN STUDY ON PORT DEVELOPMENT AND LOGISTICS IN GREATER JAKARTA METROPOLITAN AREA (JICA) FINAL REPORT
203
Table 9.3-2 IRR of Kalibaru Phase I Project
(Unit: Rp. Billion )
1st Year 124.8 0.0 0.0 0.0 124.8 0.0 0.0 0.0 0.0 (124.8)2nd Year 1,589.0 0.0 0.0 0.0 1,589.0 0.0 0.0 0.0 0.0 (1,589.0)3rd Year 1,669.0 0.0 0.0 0.0 1,669.0 0.0 0.0 0.0 0.0 (1,669.0)4th Year 2,624.4 0.0 0.0 0.0 2,624.4 0.0 0.0 0.0 0.0 (2,624.4)5th Year 1,690.1 36.4 27.4 0.0 1,753.9 2,768.7 19.7 170.8 2,959.1 1,205.16th Year 144.9 72.9 42.3 0.0 260.0 4,980.1 19.7 170.8 5,170.5 4,910.57th Year 0.0 72.9 42.3 0.0 115.2 7,078.2 19.7 170.8 7,268.6 7,153.48th Year 0.0 72.9 42.3 11.5 126.7 8,400.1 19.7 170.8 8,590.5 8,463.99th Year 0.0 72.9 42.3 14.6 129.8 8,642.0 19.7 170.8 8,832.4 8,702.610th Year 0.0 72.9 44.7 3.2 120.8 8,506.5 19.7 170.8 8,696.9 8,576.111th Year 0.0 72.9 42.3 0.0 115.2 8,372.0 19.7 170.8 8,562.4 8,447.212th Year 0.0 72.9 42.3 58.2 173.4 8,238.7 19.7 170.8 8,429.1 8,255.713th Year 0.0 72.9 42.3 58.2 173.4 8,106.8 19.7 170.8 8,297.2 8,123.814th Year 0.0 72.9 42.3 14.7 129.9 7,976.3 19.7 170.8 8,166.8 8,036.915th Year 0.0 72.9 44.7 14.7 132.3 7,847.6 19.7 170.8 8,038.0 7,905.716th Year 0.0 72.9 42.3 11.5 126.7 7,720.5 19.7 170.8 7,910.9 7,784.317th Year 0.0 72.9 42.3 11.5 126.7 7,595.3 19.7 170.8 7,785.7 7,659.118th Year 0.0 72.9 42.3 0.0 115.2 7,472.0 19.7 170.8 7,662.4 7,547.319th Year 0.0 72.9 42.3 249.7 364.9 7,350.7 19.7 170.8 7,541.2 7,176.320th Year 0.0 72.9 44.7 307.9 425.5 7,350.7 19.7 170.8 7,541.2 7,115.721st Year 0.0 72.9 42.3 58.2 173.4 7,350.7 19.7 170.8 7,541.2 7,367.822nd Year 0.0 72.9 42.3 0.0 115.2 7,350.7 19.7 170.8 7,541.2 7,426.023rd Year 0.0 72.9 42.3 0.0 115.2 7,350.7 19.7 170.8 7,541.2 7,426.024th Year 0.0 72.9 42.3 26.2 141.3 7,350.7 19.7 170.8 7,541.2 7,399.825th Year 0.0 72.9 44.7 26.2 143.8 7,350.7 19.7 170.8 7,541.2 7,397.426th Year 0.0 72.9 42.3 0.0 115.2 7,350.7 19.7 170.8 7,541.2 7,426.027th Year 0.0 72.9 42.3 0.0 115.2 7,350.7 19.7 170.8 7,541.2 7,426.028th Year 0.0 72.9 42.3 58.2 173.4 7,350.7 19.7 170.8 7,541.2 7,367.829th Year 0.0 72.9 42.3 637.0 752.2 7,350.7 19.7 170.8 7,541.2 6,789.030th Year 0.0 72.9 44.7 578.8 696.4 7,350.7 19.7 170.8 7,541.2 6,844.731st Year 0.0 72.9 42.3 0.0 115.2 7,350.7 19.7 170.8 7,541.2 7,426.032nd Year 0.0 72.9 42.3 11.5 126.7 7,350.7 19.7 170.8 7,541.2 7,414.533rd Year 0.0 72.9 42.3 11.5 126.7 7,350.7 19.7 170.8 7,541.2 7,414.534th Year 0.0 72.9 42.3 261.2 376.4 7,350.7 19.7 170.8 7,541.2 7,164.8
35th Year 0.0 72.9 44.7 261.2 378.8 7,350.7 19.7 170.8 7,541.2 7,162.3
Source: JICA Study Team IRR = 53.0%
YearProject Cost Project Benefit
Value AddedOperation Cost
SavingLand Trans'nCost Saving
Sub Total
Net ProjectBenefit
ConstructionCost
Manag't &Oper'n Cost
MaintenanceCost
ReplacementCost
Sub Total
9.4. PPP Scheme and Financial Analysis
(1) Regulatory Framework of PPP for Port Development
Principal laws and regulations governing PPP project in port sector are Presidential Regulation No.42 and No.67, year 2005, (concerning establishment of KKPPI and PPP utilization in infrastructure provision), Ministry of Finance Regulation No.38/PMK.01/2006 (concerning government support and compensation on PPP implementation), BAPPENAS Regulation No.4/2010 and new shipping law and its government regulation No. 61/2009.
Among these laws and regulations, MOF regulation No.38/PMK.01/2006 stipulates necessary documents to apply PPP project as pre-feasibility study report, plan of cooperation form, plan for project financing and source of funds, plan for offering of cooperation project, including schedule, process and evaluation method and documentation of the results of the public consultation.
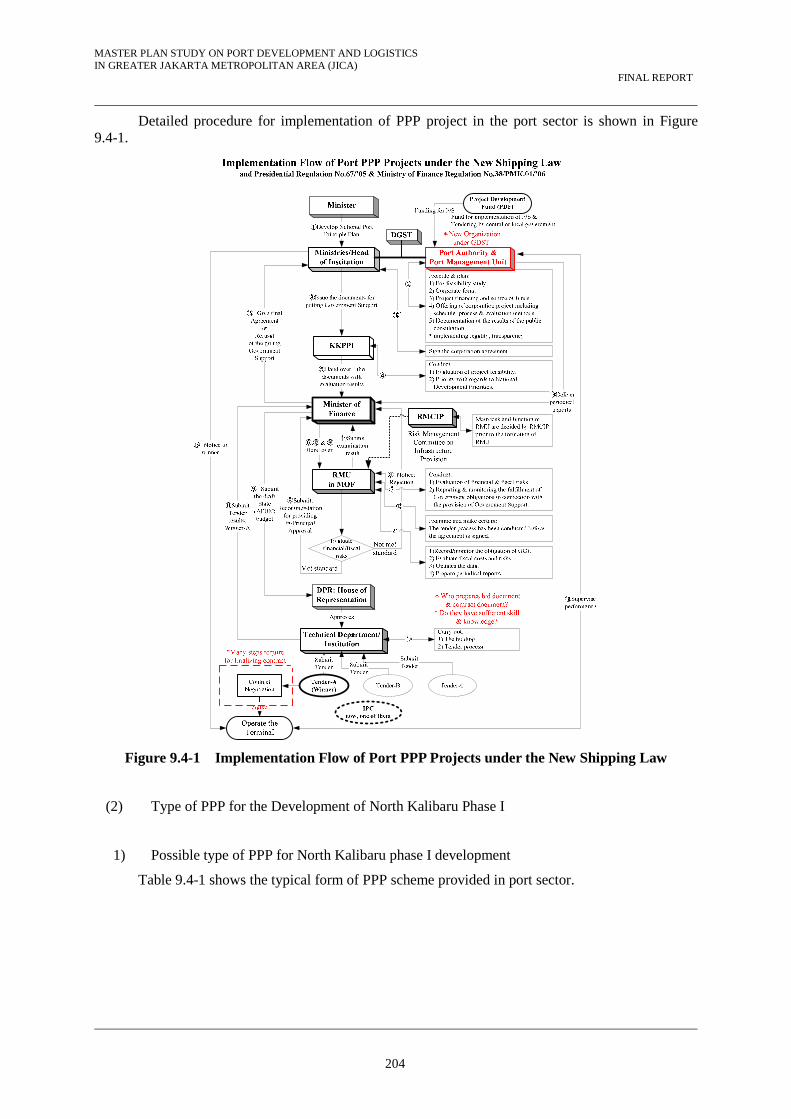
MASTER PLAN STUDY ON PORT DEVELOPMENT AND LOGISTICS IN GREATER JAKARTA METROPOLITAN AREA (JICA) FINAL REPORT
204
Detailed procedure for implementation of PPP project in the port sector is shown in Figure 9.4-1.
Figure 9.4-1 Implementation Flow of Port PPP Projects under the New Shipping Law
(2) Type of PPP for the Development of North Kalibaru Phase I
1) Possible type of PPP for North Kalibaru phase I development
Table 9.4-1 shows the typical form of PPP scheme provided in port sector.

MASTER PLAN STUDY ON PORT DEVELOPMENT AND LOGISTICS IN GREATER JAKARTA METROPOLITAN AREA (JICA) FINAL REPORT
205
Table 9.4-1 Possible PPP Scheme
Authority Type Description Agreement Port-related services provided on port property Concession Agreement Commercial use of state property, long-term
agreements, typically 30+years Lease Fixed term leases typically 10-15 years Order Port infrastructure (streets, sewers, etc.) permit
with public agencies. Revocable Permit Leases that may be revoked with 13-120 days
notice. Typically of indeterminate length Source: JICA Study Team
Shipping law stipulates that provision of breakwater, channel and navigation aid is the
obligation of the Port Authority and hence Port Business Entity is expected to provide mainly terminal and other ancillary facilities and services when it is expected to be commercially viable.
Hence, PPP scheme to be applied to the development of North Kalibaru phase I should be based on these possible PPP schemes.
For the development of Phase I, required investment cost is rather high and IPC2 seems incapable of raising all the necessary funds on its own and hence the following two PPP schemes will be considered for Phase I development.
- Case 1: Port Authority invests in breakwater, channel and reclamation with soft loan and Private Terminal Operator invests in terminal
- Case 2: Port Authority invests in breakwater, channel with soft loan and Private Terminal Operator invests in reclamation and terminal
Under these cost sharing schemes, it is considered to be reasonable and rational to set the concession fees with fixed fee at an amount sufficient for the public sector to recover its own initial investment cost including the amount to be paid for interest (if any) for land reclamation (breakwater and road which is commonly used by all the port users, and variable fee which is the revenue share to be paid as a royalty.
In this scheme, variable fee can be adjustable and negotiable with the profitability of each operating year of the concessionaire.
2) Assumption for the development of North Kalibaru Phase I
Planned capacity of the terminal is set as 1.9 million TEUs with 1200mx-15.5m quay wall.
Considering the estimated vessel size to use the terminal, one unit of terminal to be conceded to the operator is set as 600m (2berths) as is shown in Figure 9.4-2.

MASTER PLAN STUDY ON PORT DEVELOPMENT AND LOGISTICS IN GREATER JAKARTA METROPOLITAN AREA (JICA) FINAL REPORT
206
CenterOfficeBuildingTerminal Gate
CFS
Maintenance Shop
Container Inspection Area
Container Repair / Cleaning Facillity
TRUCK PASSAGE 7
16 155 16 155245.1 16 105245.1
600
25
525
525
525
525
525
525
525
525
528
60
160
325
0
18132
20FT 38BAYS × 6 20FT 38BAYS × 6
20FT 38BAYS × 6
20FT 38BAYS × 6S O S
20FT 38BAYS × 6
20FT 38BAYS × 6
20FT 38BAYS × 6
20FT 38BAYS × 6SLOTS
20FT 38BAYS × 6
20FT 38BAYS × 6
20FT 38BAYS × 6S O S
20FT 38BAYS × 6
20FT 38BAYS × 6
20FT 38BAYS ×6 SLOTS
REEFR 40FT
REEFR 40FT
REEFR 40FT
REEFR 40FT
20FT 38BAYS × 6 20FT 38BAYS × 6255
270
20FT 38BAYS × 6 20FT 38BAYS × 6
20FT 38BAYS × 6
25
5
60
600
300 300
SecurityOffice
CarParking
X-Ray scannerCheckPost
TransfomerSubstation
FuelStation
Figure 9.4-2 Container Yard Layout (360m and 240m)
Operation cost for Port Authority is estimated based only on the necessary staffs for concession management and excluding other cost for general management and operation of Port Authority. Number of required personnel is assumed to be 31 persons.
Operation cost for terminal operator for the operation of 2 berths is estimated based on the number of required personnel for terminal management office and operation office, 36 persons and 357 persons respectively.
(3) Financial Analysis on Proposed PPP Scheme
1) Assumptions for Financial Analysis
Concession Term and Fees
Concession Fees consist of fixed part and variable part. Fixed part is set as necessary investment cost and repayment of interest by the Port Authority on the initial investment excluding

MASTER PLAN STUDY ON PORT DEVELOPMENT AND LOGISTICS IN GREATER JAKARTA METROPOLITAN AREA (JICA) FINAL REPORT
207
those for breakwater and channel. Variable part is set as 10% of the revenue of terminal operator as a base case.
Variable part of concession fee can be adjusted to balance the financial conditions of TOC and PA throughout the concession period.
Concession period is set as 30 years after operation of the terminal for each of the two operators. (It is assumed that one operator operates two berths (600m) as one unit of terminal.)
Revenues of Port Authority and Terminal Operator
Revenue of Port Authority is concession fees from two operators and light due and harbor due for the use of channel and navigation aids from vessels using North Kalibaru Terminal.
Revenue of Terminal Operator is wharfage, charges for mooring and unmooring, hatch opening and closing, container handling charge, container storage charge, charge for PTI (pre-trip investigation) on reefer container and lift on lift off charge at yard
Financial Resources
Investment cost of the Port Authority is financed by soft loan with 0.3% interest, loan term of 30 years and grace period of 3 years (considering the average preparation period for tender of construction work after loan agreement) on initial investment excluding VAT and administration cost.
Investment cost of the Terminal Operating Company (Concessionaire) is from its capital cost (30%/40%) and loan from the bank (13% interest, repayment 10 years after completion of construction for 70%/60% of total investment cost.
2) Cases of Financial Analysis
For the purpose of financial analysis and sensitivity analysis, initial investment cost sharing between PA and TOC is assumed to be as follows;
PA : breakwater, channel, inner port road, security and utility and (reclamation) TOC : terminal facilities and equipment including quay wall and (reclamation)
Reclamation is conducted either by PA or TOC
Evaluation of cases are conducted using financial indicators of FIRR (financial internal rate of return), profitability (rate of return on net fixed assets), operating ratio, working ratio, debt service covering ratio and retained earnings at the end of concession period.
Possible scheme is firstly selected by evaluating FIRR of both PA and TOC; results are shown in Table 9.4-2.1
From this table, the most desirable scheme is considered to be the case where PMB bears investment cost for reclamation and TOC provides the financial resource with debt/equity of 60/40 (case-9).
If investment cost for reclamation is borne by TOC (case-8), it is rather difficult to expect a reasonable return on investment and TOC will suffer from serious deficit in the initial years of operation.
1 In evaluating financial viability, it is generally considered to be feasible if FIRR is over the average
interest rate, but in this case it is considered that equity should also return to shareholders with a rate at
least similar to the interest rate.

MASTER PLAN STUDY ON PORT DEVELOPMENT AND LOGISTICS IN GREATER JAKARTA METROPOLITAN AREA (JICA) FINAL REPORT
208
Table 9.4-2 FIRRs of Both PA and TOC
Finance Condition
Reclamation Accounting 70/30(13%) 60/40(13%) 70/30(5%)*
TOC Base Case
PA 4.89% 4.89% 4.89% TOC 12.94% 13.16% 13.98%
PA PA 4.27% 4.27% 4.27%
TOC 16.92% 17.17% 18.07%
TOC Demand
-10%
PA 4.76% 4.76% 4.76% TOC 12.27% 12.48% 13.25%
PA PA 4.19% 4.19% 4.19%
TOC 15.89% 16.12% 16.94%
TOC Cost +10%
PA 4.47% 4.47% 4.47% TOC 12.22% 12.43% 13.22%
PA PA 4.02% 4.02% 4.02%
TOC 16.15% 16.39% 17.26% *: Reference only Source: JICA Study Team
Under 10% variable fee condition, retained earnings at the end of concession period are
considerably imbalanced (TOC=$756million, PA=$390 million)
If the variable portion of concession fee is raised to 15% after 5 years of initial operation, imbalance would be greatly improved (TOC=$685mill, PA=$568million) without causing any serious problem to TOC.
3) Recommended PPP Scheme
Considering the stipulation of Government Regulation No.61 year 2009 and results of financial analysis, following scheme is recommended to be applied to the development of Kalibaru Phase I urgent project.
In many cases of concession, concessionaire is often obligated to maintain debt/equity ratio of 60/40 for the terminal operation avoid serious financial risk and to ensure that the terminal remains public use.
Furthermore, it is reasonable to reserve the proprietorship of terminal land by the public sector considering the concession condition set forth in ii) of Article 71 of Government Regulation No. 61.
In order to balance profitability between TOC and PA and considering the rather unfavorable demand in the initial years of operation, variable portion of concession fee is better to be set as 10% for the first 5 years and 15% thereafter.
Summarizing above, recommended PPP scheme is as follows;
Investment Demarcation : PA invests in breakwater, channel and basin, inner road, security and utility facilities and reclamation
TOC invests in quay wall and equipment Financial Scheme : PA request soft loan similar to STEP of JICA TOC prepares 40% by its own equity and 60% from
commercial bank Concession Period : 30 years after commencement of operation with fixed fee of
about $5.4mil/year and variable fee of 10% of revenue for the first 5 years and 15% of revenue thereafter.