45 times stronger - cbq.qa
178
Annual Report 2020 45 years old 45 times stronger
Transcript of 45 times stronger - cbq.qa

Annual Report 2020
45 years old45 times stronger


His HighnessSheikh Hamad Bin Khalifa Al Thani
Father Amir
His HighnessSheikh Tamim Bin Hamad Al Thani
Amir of the State of Qatar

4
Contents
About Commercial Bank 10
Business at a glance 12
Forward looking statements 16
Financial highlights 20
Key highlights 21
Chairman’s message 24
Board of Directors 26
Vice Chairman’s message 30
Group Chief Executive Officer’s message 32
Management review of operations 36
Annual Corporate Governance Report 2019 60
Independent Auditors’ Report 64
Consolidated Statement of Financial Position 69
Consolidated Income Statement 70
Consolidated Statement of Comprehensive Income 71
Consolidated Statement of Changes in Equity 72
Consolidated Statement of Cash Flows 76
Notes to the Consolidated Financial Statements 78
Supplementary Information 171
5
Rising up to the ChallengeCommercial Bank acted quickly and decisively to the challenge of COVID-19, remaining fully operational and enabling our customers to bank safely, simply and securely under pandemic conditions.
Our innovative, digitally-driven response reflects a strong continuing focus on the Five Cs we implemented in 2016:
• Corporate Earnings Quality• Client Experience • Creativity and Innovation • Culture• Compliance
Commercial Bank’s technological and service innovations have always been driven by human values and customer need. We continued to demonstrate our leadership in digital banking during the pandemic and we are proud to have helped make everyday life safer and easier for our customers.
In 2020, Commercial Bank celebrated its 45th anniversary and by working collaboratively together as ‘One Bank, One Team’, we have shown that anything is possible even in the most challenging of times.
6
7
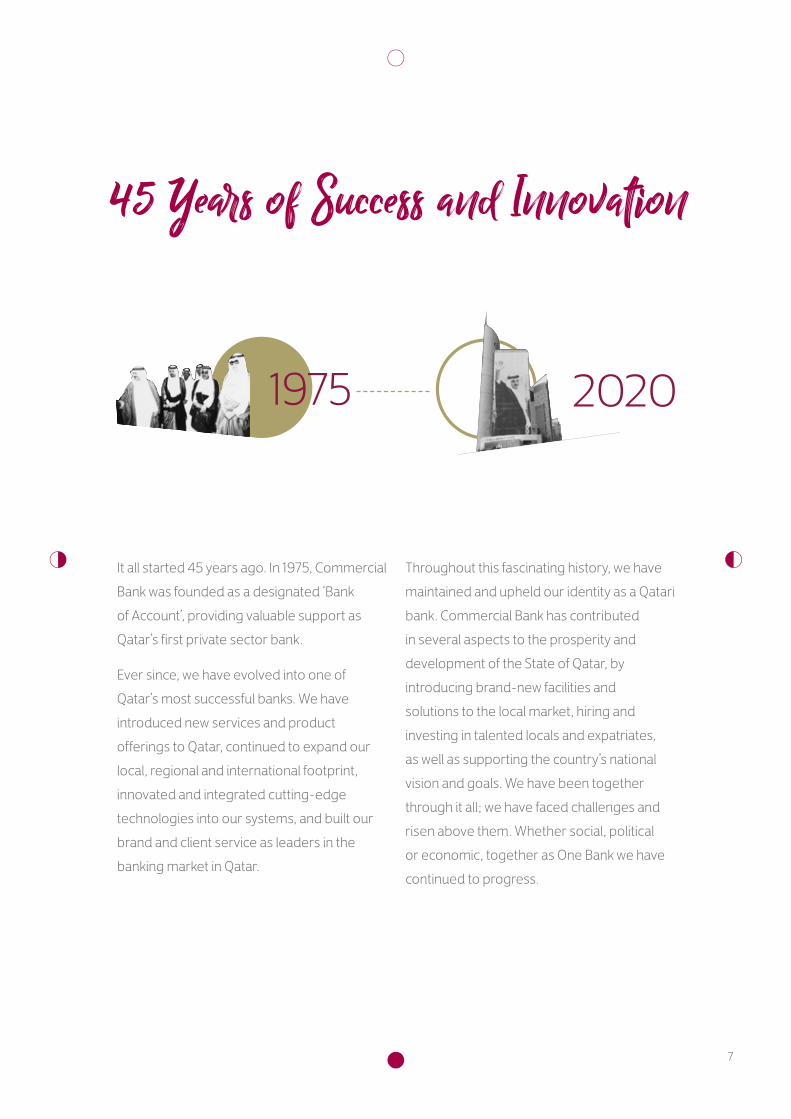
45 Years of Success and Innovation
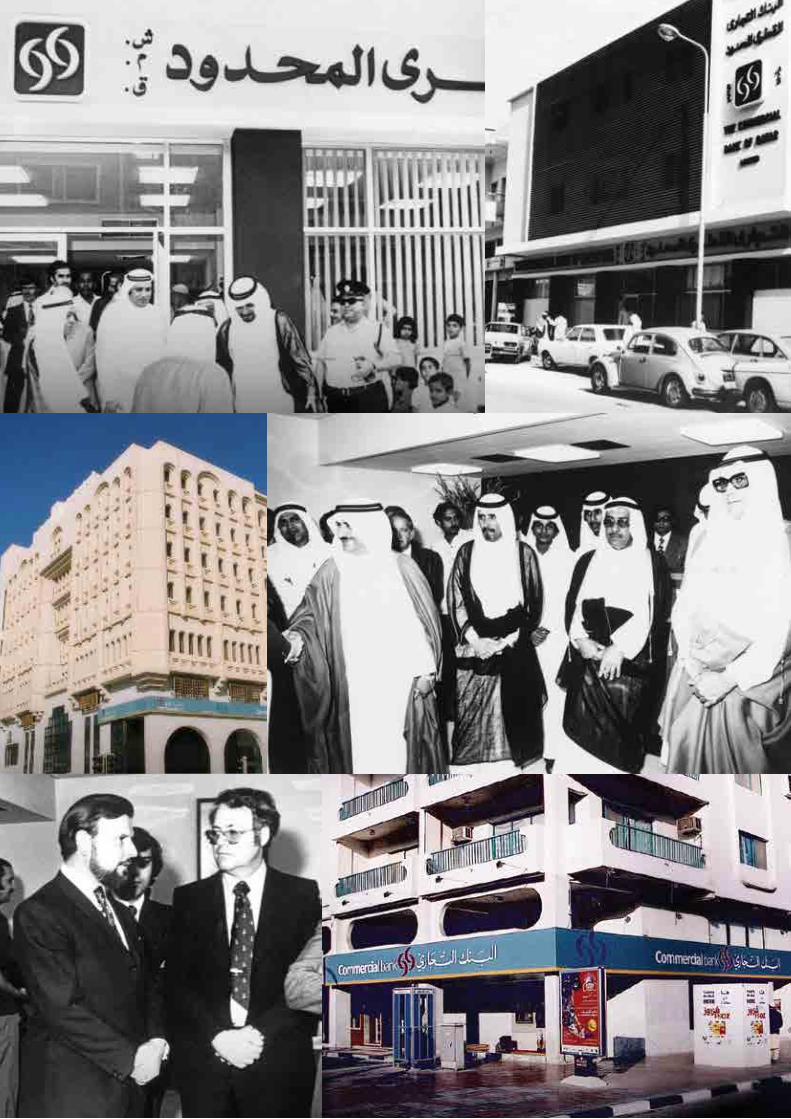
It all started 45 years ago. In 1975, Commercial Bank was founded as a designated ‘Bank of Account’, providing valuable support as Qatar’s first private sector bank.
Ever since, we have evolved into one of Qatar’s most successful banks. We have introduced new services and product offerings to Qatar, continued to expand our local, regional and international footprint, innovated and integrated cutting-edge technologies into our systems, and built our brand and client service as leaders in the banking market in Qatar.
Throughout this fascinating history, we have maintained and upheld our identity as a Qatari bank. Commercial Bank has contributed in several aspects to the prosperity and development of the State of Qatar, by introducing brand-new facilities and solutions to the local market, hiring and investing in talented locals and expatriates, as well as supporting the country’s national vision and goals. We have been together through it all; we have faced challenges and risen above them. Whether social, political or economic, together as One Bank we have continued to progress.

8
Ever since, we have evolved into Qatar’s most successful,
innovative, anddigitally-driven bank.
It all started 45 years ago.

9

10
Incorporated in 1974 as the first private bank in the country, Commercial Bank is today one of the leading financial institutions in Qatar with a profitable track record since inception. We continue to play an important role in driving innovation and raising service standards in banking across the region through our investment in new technology, a clear focus on customers and prudent management.
Our country-wide network includes 28 full-service branches and 172 ATMs, and we also own and operate the exclusive ‘Diners Club’ franchise in Qatar and Turkey. We are listed on the Qatar Exchange and were the first Qatari bank to list its Global Depository Receipts on the London Stock Exchange. Commercial Bank’s bonds issuances are listed on the Irish Stock Exchange and the Swiss Exchange (SIX).
Expanding its geographical footprint, Commercial Bank is 100% owner of Alternatif Bank in Turkey and has strategic partnerships with the National Bank of Oman (S.A.O.G.) and United Arab Bank (P.J.S.C.).
These strategic alliances enable Commercial Bank to offer integrated services across the region, including cross-border services for corporate banking and capital markets, trade services for corporate banking customers, private banking services and syndicated loans in our alliance markets.
Our continual investment in technology and people, together with our strong capital base, provides a solid foundation for further growth. Commercial Bank has a robust financial position, with total assets of QAR 153.6 billion as at 31 December 2020 and a capital adequacy ratio of 17.8%. The Bank enjoys strong credit ratings of (A3) from Moody’s, (A) from Fitch, and (BBB+) from Standard & Poor’s.
True to our pioneering origins and history of success, we are dedicated to supporting Qatar’s economic development and social infrastructure through Corporate Social Responsibility programmes and sponsorship of various events which help to raise Qatar’s profile internationally.
Our business segments
Wholesale Banking Provides a range of conventional commercial and investment banking services and products to large, medium and small enterprises, including corporate lending, trade finance, syndicated loans, deposits, letter of credit and guarantees.
Retail Banking Provides a full suite of conventional retail banking services and products to retail customers in Qatar, including current and deposit accounts, wealth management, mortgage lending, personal and vehicle loans and credit card and other card services.
About Commercial Bank

11
Subsidiaries
Alternatif Bank A fully owned subsidiary in Turkey that operates through a network of 44 branches.
Commercial Bank Financial Services LLC A fully owned subsidiary that provides direct access to the Qatar Exchange, online trading and brokerage services.
Orient 1 Limited A fully owned subsidiary incorporated in Bermuda that owns an exclusive ‘Diners Club’ franchise in Turkey.
CBQ Finance Limited A fully owned subsidiary incorporated in Bermuda and organised as a special purpose entity established to raise capital for Commercial Bank by issue of debt instruments.
CB Global Trading Limited A fully owned subsidiary incorporated in Cayman Islands, an issuing vehicle for derivatives.
CB Innovation Services L.L.C. A fully owned subsidiary incorporated in Qatar under the Qatar Financial Centre Authority providing the Bank with Operations management services.
CB Asset Management L.L.C. A fully owned subsidiary incorporated in Qatar under the Qatar Financial Centre Authority established to provide asset management services.
CB Real Estate Properties L.L.C. A fully owned subsidiary incorporated in Qatar under the Qatar Financial Centre Authority providing the Bank with advisory services in relation to property.
CB Leasing Company L.L.C. A fully owned subsidiary incorporated in Qatar under the Qatar Financial Centre Authority that leases and subleases properties in Qatar.
Associates
National Bank of Oman (S.A.O.G.) An associate entity that operates through 60 conventional branches and 6 Islamic branches in Oman, and one branch each in Egypt, Abu Dhabi and Dubai.
United Arab Bank (P.J.S.C.) An associate entity that operates through 7 conventional branches in the United Arab Emirates.
Massoun Insurance Services L.L.C. A joint arrangement entity that provides tailored corporate and personal insurance products to the Bank’s customers.

12
Business at a GlanceOur voyages
1974 Commercial Bank is incorporated as Qatar’s first private sector bank
1975 The Bank begins operations under a management services contract with Chase Manhattan Bank
1981 The contract with Chase Manhattan Bank officially ends and Commercial Bank is fully independent
1987 A new Commercial Bank 1987 head office opens on Grand Hamad Street
1990 ATMs are introduced in Qatar by Commercial Bank
1991 Commercial Bank acquires the Diners Club franchise for Qatar
1992 Point-of-sale machines are introduced in Qatar by Commercial Bank
1997 A dedicated Customer Call Centre is established2005 Commercial Bank forms a strategic alliance with
National Bank of Oman2006 Commercial Bank signs an agreement to
become the Title Sponsor for the Qatar Masters Golf Tournament
2008 First Qatari bank to list GDRs on the London Stock Exchange
2009 Commercial Bank Plaza, the new headquarters of Commercial Bank, is opened on 13 May 2009 by H E Sheikh Hamad bin Jassim bin Jaber Al-Thani, Prime Minister and Minister for Foreign Affairs of Qatar
2011 Incorporates Commercial Bank Investment Services (re-branded to become Commercial Bank Financial Services)
2013 Commercial Bank acquires 74.24% shareholding in Alternatif Bank in Turkey
2015 Commercial Bank celebrates its 40th anniversary milestone as Qatar’s first private bank
2016 Commercial Bank signs a debut USD 166 million 3-year Ninja loan facility – the first Ninja loan for a GCC financial institution Commercial Bank successfully completes the acquisition of the remaining 25% shareholding in Alternatif Bank
2017 Commercial Bank incorporates CB Innovation Services LLC, a management operation services captive entity that has successfully on-shored previously outsourced activities
2018 Commercial Bank receives ‘Best Bank in Qatar’ award from Global Finance, ‘Best Remittance Service’ and ‘Best Cash Management Bank’ in the Middle East from The Asian Banker
2019 Commercial Bank embraces a new era of digitization by launching ‘CB Fawri’, ‘CB Wallet’, and ‘SWIFT GPI’. Commercial Bank successfully upgrades its Mobile App and widens its digital infrastructure
2020 Commercial Bank launches a number of digital firsts such as CB Household Worker PayCard; CB Smart Payroll; CB Pay; and CB Pay for Merchants. The Bank also receives more than 12 prestigious awards from international and regional awarding bodies and shines in innovation and digital banking

13

14

15
Throughout our history, we have maintained and
upheld our identity as a Qatari Bank.

16
This document contains certain forward-looking statements with respect to certain plans and current goals and expectations of Commercial Bank and its associated companies relating to their future financial condition and performance.
These forward-looking statements do not relate only to historical or current facts. By their nature forward-looking statements involve risk and uncertainty because they relate to future events and circumstances including a number of factors which are beyond Commercial Bank’s control.
As a result, Commercial Bank’s actual future results may differ materially from the plans, goals and expectations set forth in Commercial Bank’s forward-looking statements.
Net Profit
Earnings per Share
Loans and Advances
Customer Deposits
Total Assets
QAR 1,301 million QAR 0.27 QAR 96.7 bn QAR 75.8 bn QAR 153.6 bn
Any forward-looking statements made by or on behalf of Commercial Bank are made in the context of the time of publication of this report. Commercial Bank does not undertake to update forward looking statements to reflect any changes in Commercial Bank’s expectations with regard to any changes in events, conditions or circumstances on which any such statement is based.
The information, statements and opinions contained in this presentation do not constitute a public offer under any applicable legislation, or an offer to sell or solicitation of an offer to buy any securities or financial instruments or any advice, or recommendation with respect to such securities or other financial instruments.
1,301NET PROFIT (QAR MILLION)
Forward Looking Statements

17
-1%
2%
7%
19%
73%
Net Operating Income
Investment & Dividend Income
Net Fee Income
Net Interest Income
Foreign Exchange Income
Other Income

18
Funding Mix
Shareholders’ Equity
Other Liabilities
Risk Reserve
Other Reserves
Shareholders’ Funds
Share Capital
Customer Deposits
Legal Reserve
Due to Banks and Financial Institutions
Retained Earnings
Other Borrowed Funds
Additional Tier 1 Note
6%
7%3%
13%
9%
14%
18%
18%
18%
49%
45%
19
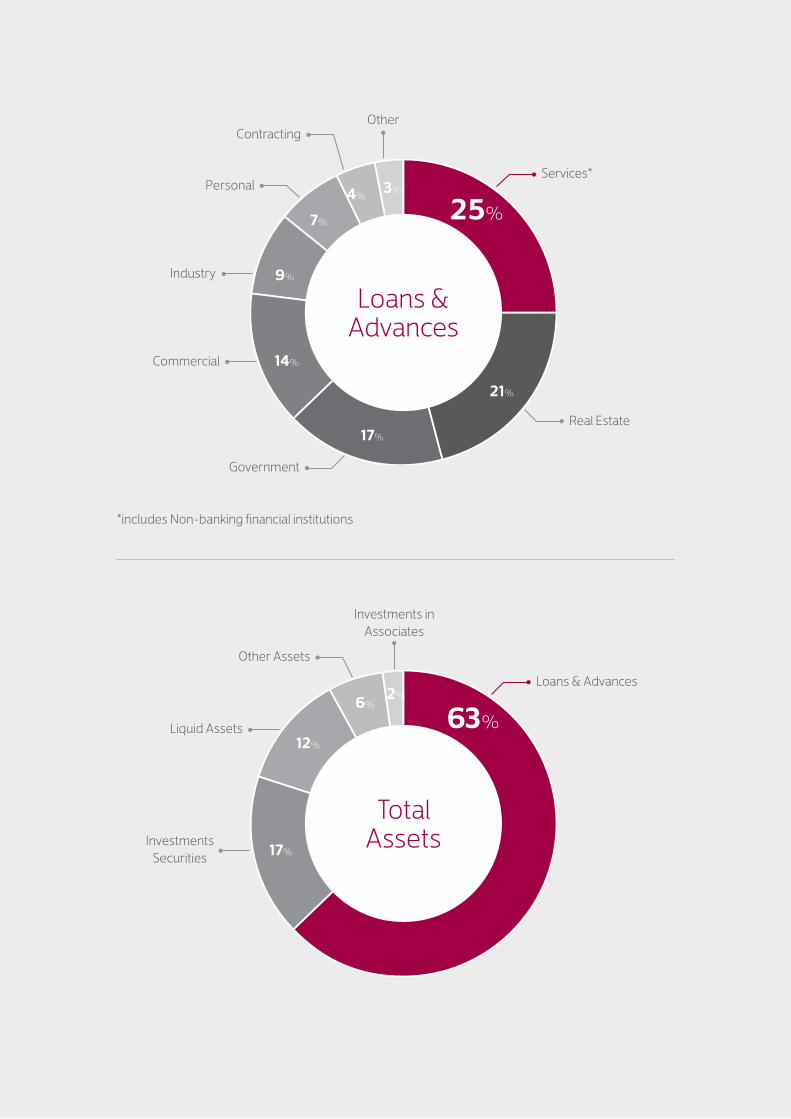
Loans & Advances
Total Assets
Contracting
Government
Other
Investments in Associates
Commercial
Industry
Liquid Assets
Investments Securities
Services*
*includes Non-banking financial institutions
Loans & Advances
Personal
Other Assets
Real Estate
4% 3%
6%2%
7%
9%
12%
21%
17%
14%
17%
25%
63%
20
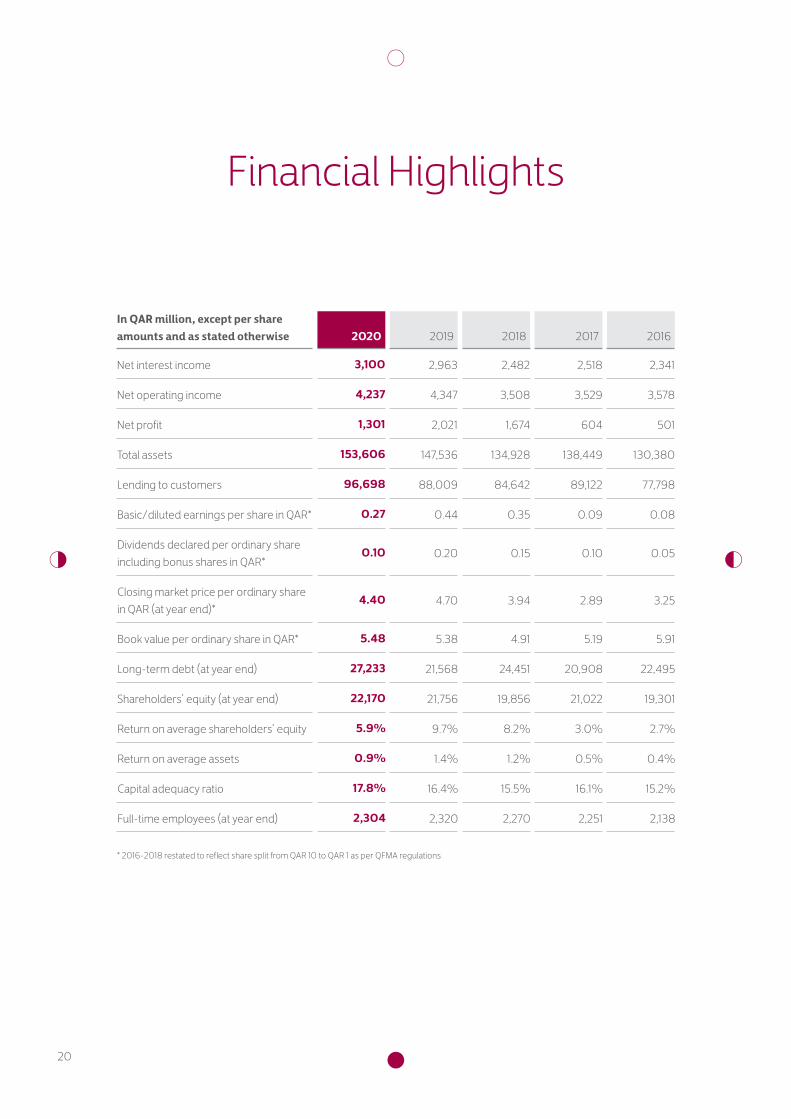
In QAR million, except per share amounts and as stated otherwise 2020 2019 2018 2017 2016
Net interest income 3,100 2,963 2,482 2,518 2,341
Net operating income 4,237 4,347 3,508 3,529 3,578
Net profit 1,301 2,021 1,674 604 501
Total assets 153,606 147,536 134,928 138,449 130,380
Lending to customers 96,698 88,009 84,642 89,122 77,798
Basic/diluted earnings per share in QAR* 0.27 0.44 0.35 0.09 0.08
Dividends declared per ordinary share including bonus shares in QAR*
0.10 0.20 0.15 0.10 0.05
Closing market price per ordinary share in QAR (at year end)*
4.40 4.70 3.94 2.89 3.25
Book value per ordinary share in QAR* 5.48 5.38 4.91 5.19 5.91
Long-term debt (at year end) 27,233 21,568 24,451 20,908 22,495
Shareholders’ equity (at year end) 22,170 21,756 19,856 21,022 19,301
Return on average shareholders’ equity 5.9% 9.7% 8.2% 3.0% 2.7%
Return on average assets 0.9% 1.4% 1.2% 0.5% 0.4%
Capital adequacy ratio 17.8% 16.4% 15.5% 16.1% 15.2%
Full-time employees (at year end) 2,304 2,320 2,270 2,251 2,138
* 2016-2018 restated to reflect share split from QAR 10 to QAR 1 as per QFMA regulations
Financial Highlights

21
Other key financial highlights
• Operating profit of QAR 3,140.8 million, up by 0.7% (+14.1% on normalized basis).
• Cost to income ratio of 25.9% (normalized 26.0%), reduced from 28.3% (normalized 28.7%).
• Strong capital adequacy ratio of 17.8% compared to 16.4% in 2019.
• Gross loan provisions of QAR 1,236.4 million, up by 51.6% primarily due to COVID-19 related model increases in ECL. This was offset by recoveries resulting in net provisions on loans and advances to customers at QAR 836.4 million, up by 40.7%.
• Total assets of QAR 153.6 billion, up by 4.1%.
• Customer loans and advances of QAR 96.7 billion, up by 9.9%.
• Successfully launched a senior unsecured five-year bond for USD 500 million. The issuance was oversubscribed 3.8 times and
had one of the lowest prices by a Qatari FI issuer on a public transaction.
• Best Cash Management and Transaction Bank in Qatar for 2020 from the “Asian Banker”.
• Social Responsibility Award from “Arab Media Forum”.
• Best Performing Bank in Qatar for 2020 from “The Banker”.
• Most Innovative Digital Bank and Best Mobile Banking Application for 2020 from “International Finance Magazine”.
• Excellence in Leadership in the Middle East award for 2020 from “Euromoney”.
• Best Retail Bank in Qatar award for the fourth year in a row and the Best Digital Deposit Product in Asia Pacific, Middle East and Africa for 2020 from “The Asian Banker”.
35.6% 2.5%
NET PROFIT OF QAR 1,301.2 MILLION,
DOWN BY 35.6%
OPERATING INCOME OF QAR 4,237.1 MILLION, DOWN BY 2.5%
(however, up by 9.9% on normalized basis)
Key Highlights

22
Today, we take pride in leading the
digital era in Qatar and guiding our customers on their
life journey.

23CBQ Mobile App

24
On behalf of the Board of Directors, I am pleased to present Commercial Bank’s Annual Report for the year ended on 31 December 2020.
2020 was dominated by the COVID-19 pandemic, which has infected millions of people around the world and caused economic and social disruption in every nation. At the global level, COVID-19 has inflicted a major recession, with the IMF forecasting global growth to be -4.4%. However, the impact of COVID-19 has been far from equal across different countries. Due to strong
Abdulla Bin Ali Bin Jabor Al ThaniChairman
leadership and decisive action on both health and the economy, Qatar has thankfully been less affected by COVID-19 than other parts of the world.
Qatar reacted quickly to the pandemic and took effective steps to control the spread of infection. As a result of preventative measures, health policies and long-term investment, Qatar’s health system has proven its reliability in dealing with the pandemic and ensured the wellbeing of citizens and residents. The government also intervened to support the economy, with the Qatar
Chairman’s Message

25
Central Bank declaring a QAR 75 billion stimulus package for the private sector.
Qatar’s strong economic fundamentals and financial buffers have been able to withstand the twin shocks of low energy prices and COVID-19. This resilience has been recognized by the major rating agencies and Qatar has maintained strong sovereign ratings of Aa3, AA- and AA- from Moody’s, S&P and Fitch respectively. Qatar’s Planning and Statistics Authority expects the country’s GDP growth to be around -2.6% for 2020 but the economy is forecast to rebound in 2021 to 2022 with an average GDP growth rate of 1.85%.
Qatar’s budget deficit in the first half of the year was lower than early projections due to the rationalisation of government spending and increased public sector efficiency. Despite budget cuts, the government continues to concentrate spending on health, education, and major infrastructure projects which gives us confidence in the immediate years ahead. Qatar remains the world’s leading LNG exporter and expansion of development in the North Field will help to secure Qatar’s economic future in combination with diversification efforts.
Commercial Bank has a clear five-year strategic plan initiated in 2016 to transform the Bank. Within that plan, key areas have been strengthening our risk culture, increasing our capital, reducing our cost to income ratio and continuing to build the Bank’s 45-year-old franchise in terms of new technology and innovation. Actions taken under this strategic plan enabled Commercial Bank to respond effectively to COVID-19, remaining fully operational while protecting the health and safety of our staff and customers.
As a leading Qatari bank, Commercial Bank recognizes our responsibilities towards supporting our customers and the economy following COVID-19. Banks are key enablers for the government’s economic stimulus measures and Commercial Bank is one of the largest providers of loans to SMEs and sectors particularly affected by COVID-19 under the National Response Guarantee Programme. This Programme is guaranteed by the Qatar Development Bank and allows loans to be taken by companies for rental and wage payments. Working in collaboration with the Qatar Central Bank, which acted as the apex controlling institution, we have deferred principal and interest payments for a number of months for customers in affected sectors
such as hospitality, tourism, and retail, together with fee removals and reductions on remittances and other transaction fees.
On behalf of the Board of Directors, I would like to express our thankfulness and gratitude for the visionary leadership of His Highness The Amir Sheikh Tamim Bin Hamad Al Thani. Under the leadership of His Highness, Qatar has experienced far less adverse impacts as a result of COVID-19 compared to other countries and continued to achieve its objectives in accordance with the Qatar National Vision 2030. Commercial Bank is fully aligned with, and contributes towards Qatar’s national development objectives. I also want to convey our appreciation for the guidance and support we have received from His Excellency the Prime Minister and Minister of the Interior, His Excellency the Minister of Finance, His Excellency the Minister of Commerce and Industry, and His Excellency the Governor of Qatar Central Bank.
Progress in reshaping our business under our five-year strategic plan has delivered strong revenue momentum despite the pandemic. Commercial Bank, its subsidiaries and associates announced its financial results for the full year ended on 31 December 2020, and the Board of Directors has recommended, for approval at the Annual General Assembly on 10 March 2021, a cash dividend payout of QAR 0.1 per share. I would like to thank the Board of Directors for its continued guidance, our employees for their hard work, our customers for their loyalty, and our shareholders for their support.
2020 has been an unusual year due to COVID-19 but the pandemic has strengthened our belief in our five-year strategic plan and we are optimistic about 2021 as we continue on our transformation journey.
Abdulla Bin Ali Bin Jabor Al ThaniChairman

26
Board of Directors

27
1. Sheikh Abdulla Bin Ali bin Jabor Al Thani Chairman
2. Mr. Hussain Ibrahim Alfardan Vice Chairman (Representing Alfardan Investment Company)
3. HE Mr. Abdul Rahman Bin Hamad Al Attiyah Member
4. Mr. Omar Hussain Alfardan Managing Director
5. HE Mr. Bader Omar Al Dafa Member
6. Sheikh Faisal Bin Fahad bin Jassim Al Thani Member
7. Mr. Mohd Ismail Mandani Al Emadi Member
8. HE Mr. Khalaf Ahmed Al Mannai Member (Representing Qatar Insurance Company)
9. HE Mr. Saleh Abdulla Mohamed Al Ibrahim Al Mannai Member
1 2 3
4 5 6
7 8 9

28
From launching the first
contactless payment to the first mobile wallet in Qatar, we innovate and strive towards
digital and banking excellence.

29
Throughout our history, we have maintained and
upheld our identity as a Qatari Bank.
CBPay Merchants App

30
In 2020, Commercial Bank affirmed its role as a source of stability against the disruption caused by COVID-19 and continued to support its customers and the Qatari community. Thanks to our five-year strategic plan and the investment we have made in our business over the past four years, Commercial Bank demonstrated resilience at the business and operating level in challenging market conditions.
Mr. Hussain Ibrahim AlfardanVice Chairman
Operating profit was stable despite reduced commercial activity and the Bank’s participation in COVID-19 related economic stimulus schemes with concessionary interest rates and payment deferrals. The Bank delivered a consolidated operating profit of QAR 3.1 billion up by 0.7% (+14.1% on normalized basis) compared to the previous year. Consolidated net profit declined 35.6% to QAR 1.3 billion, impacted by impairments
Vice Chairman’s Message

31
to our associate UAB and increased provisioning due to the COVID-19 pandemic, as well as difficult market conditions in Turkey which impacted Alternatif Bank. Domestically, the Bank reported a net profit of QAR 2.1 billion, representing a 20.4% decrease over the same period last year.
Despite the low interest rate environment, consolidated net interest income for 2020 increased by 4.6% to QAR 3.1 billion compared to the same period last year. Adjusting for the impact of IFRS 2, net interest income increased 17.7%. The improvement was driven by the effective management of our cost of funding to ensure that our cost of deposits declined faster than our asset yields. Operating income for 2020 was QAR 4.2 billion compared with QAR 4.3 billion (normalized QAR 3.9 billion) in the previous year, impacted by a reduction in total fees and other income due to lower spends on credit cards as a result of reduced international travel.
Our strategic focus on Transaction Banking and fee-based services such as remittances, cash management and wealth management support sustainable growth in the long-term as it builds fee income that is not purely based on lending. Total fees and other income declined 17.8% to QAR 1.1 billion (-6.8% on normalized basis) in 2020 compared to the previous year due to reduced card spending related to COVID-19 and a reduction in investment income as a result of unprecedented volatility in the global markets. The decline in investment income was partially offset by gains in FX and trading income as our remittance and trade services continued to expand.
Supported by the success of Transaction Banking and cash management services, consolidated low-cost deposits grew 24.8% in 2020, contributing to an improvement in NIMs. Group customer deposits decreased to QAR 75.8 billion, marginally down by 0.7% compared to the previous year. Group loans and advances were QAR 96.7 billion at the end of 2020, up 9.9% compared to the previous year supported by strong services, commercial and public sector borrowings. Under the five-year strategic plan, our strategic intent is to de-risk and re-shape our balance sheet. In terms of re-shaping, the Bank’s exposure to government and public sector loans increased by 14.9% in 2020.
Net provisioning in 2020 increased 40.7% compared to the previous year, in addition to strong recoveries, reflecting our prudent approach of factoring in the impact of COVID-19 into our ECL models. With increased COVID-19 model impacts, cost of risk was 95bps higher than the previous year of 68bps. Our NPL ratio improved to 4.3% in 2020 compared to 4.9% in the previous year due to resolution of certain cases.
In line with our strategy to drive operational efficiencies across the business through investment in digitization and eliminating waste, the Bank’s cost to income ratio improved to 25.9% (26.0% on normalized basis) in 2020 from 28.3% (28.7% on normalized basis) in the previous year.
Our subsidiary Alternatif Bank’s performance in 2020 was impacted by the softening of the Turkish economy and an 18.5% depreciation of the Turkish lira during the period. Despite these challenges, Alternatif Bank reported a profit of QAR 57.5 million during the year supported by a 11.0% improvement in operating expenses as the bank focused on driving efficiency. The impact from our share of associates in 2020 was negative as we recorded an impairment in the carrying value of UAB in line with our guidance to bring the book value of the asset closer to its fair value.
On behalf of the Board of Directors, I would like to convey our sincere gratitude for the visionary and gracious leadership of His Highness The Amir, His Excellency the Prime Minister and Minister of the Interior, His Excellency the Minister of Finance, His Excellency the Minister of Commerce and Industry, and His Excellency the Governor of the Qatar Central Bank for their wisdom in guidance and support, which we continue to greatly appreciate.
Mr. Hussain Ibrahim AlfardanVice Chairman

32
The arrival of COVID-19 in 2020 has affected everyone’s lives and caused dramatic changes to the way we work, bank, socialize and travel. For Commercial Bank, the pandemic has presented both a challenge and an opportunity to demonstrate resilience and provide our clients with world-class banking services, particularly in the digital field.
Our five-year strategic plan is based on the 5 Cs of Commercial Bank: Corporate earnings quality; Client experience; Creativity and innovation (Digital Creativity);
Joseph AbrahamGroup Chief Executive Officer
Culture; and Compliance, together with a focus on best-in-class Transaction Banking. 2020 marked the fourth full year of strong execution our strategic plan, with all elements being even more relevant today as a result of the pandemic. The actions we have taken to execute against the 5 Cs over the last four years have laid the essential foundations that have made Commercial Bank resilient to the shock of COVID-19 and given us the ability to quickly adapt, positioning us well for the future.
Group Chief Executive Officer’s Message

33
Corporate earnings quality showed some effects of COVID-19 in 2020 but at the same time resilience. We continued to conservatively provision and take impairments for our associates but our strong risk culture and work to clean up our legacy loan book has limited some of the impacts of the pandemic. We have reshaped and diversified our loan book by proactively exiting high risk names, decreased our concentration in real estate and increased our share of high-quality government and public sector loans. We increased our capital to 12.2% to exceed our CET1 target range of 11-11.5% a year early and we continued to improve our cost to income ratio, moving down from the highest in the market four years ago at 45% to 25.9%, much closer to the market average. Costs have been reduced by cutting out waste and unproductive parts of the business, while we have continued to invest significantly in our people, processes, technology, brand and premises.
This investment over four years means that we are well placed to capture the changes in customer behaviour that have been accelerated by COVID-19. The pandemic has fundamentally shifted the way we interact with our customers, with more and more Transaction Banking performed digitally through internet, mobile and self-service channels. Digital is a core part of our 5 Cs and continued investment under our strategic plan means that that we have the right capabilities to be successful in our new world where Client experience, Creativity, innovation, digital and technology all mix together.
Our collaborative “One Bank” culture is one of our strengths and this was demonstrated in 2020 with teams across Commercial Bank working together to maintain full banking operations during the pandemic and by rapidly executing large, complex cross-departmental projects. Compliance continues to be a key focus area for the Bank under our strategic plan and we made good progress in 2020.
Commercial Bank’s achievements in 2020 have been recognised by a number a publications and industry bodies and we have received several awards including many repeat awards: “Excellence in Leadership in the Middle East” for our swift and innovative response to the pandemic that ensured business continuity while continuing to support customers and staff to protect their health and safety; “Best Digital Bank in Qatar”; “Most Innovative Digital Bank”; “Best Cash Management Bank in Qatar”; and “Best Retail Bank in Qatar.” These awards
are testament to all our staff in Commercial Bank and our subsidiary and associates for their hard work and dedication during this unusual and unique year.
In support of our customers and Qatar’s economy, we are one of the largest providers of loans to SMEs and sectors particularly affected by COVID-19 under Qatar Development Bank’s National Response Guarantee Programme, and we have implemented further stimulus measures in collaboration with the Qatar Central Bank, such as loan postponements and concessionary interest rates for SMEs and corporates in affected sectors, together with fee removals and reductions on other transaction fees.
Today we are more integrated with our subsidiary and associates than at the start of our five-year plan and we will continue to deepen our collaboration with our subsidiary Alternatif Bank in Turkey and our associates National Bank of Oman and United Arab Bank. Alternatif Bank has a good management team and despite a softening of the Turkish economy and the depreciation of the Turkish lira, delivered positive returns and reported a net profit of QAR 57.5 million. National Bank of Oman was impacted by the economic climate and we took an impairment on the carrying value of United Arab Bank in line with our prudent approach, meaning the overall impact from our share of associates during 2020 was negative.
Our five-year strategic plan and the investment we have made in our business have given us the capabilities and confidence to meet the challenges of COVID-19. Building on this foundation, the continued support and guidance of our Board and the commitment of our staff working together across the whole Bank means that we will end 2020 in a strong position and we are well positioned for a resumption of growth in 2021.
Joseph AbrahamGroup Chief Executive Officer

34

35
We have been together through it all. We have faced
challenges and risen above them.

36
Rehan Khan EGM, Chief Financial Officer
Financial ResultsIn 2020, Commercial Bank delivered a net profit of QAR 1,301 million, a decrease of 35.6% compared to the QAR 2,021 million achieved in 2019.
Loans and advances to customers increased by 9.9% to QAR 96.7 billion at 31 December 2020, compared with QAR 88.0 billion in 2019. The increase was mainly in the commercial and government public sectors.
Our deposits decreased by 0.7%, to QAR 75.8 billion at 31 December 2020 compared with QAR 76.3 billion in 2019, the decrease is mainly in time deposits however, current and savings deposits have increased by 24.8% due to the various cash management initiatives and digital products that the bank offers.
Investment securities decreased by 4.0% to QAR 25.8 billion as at 31 December 2020 compared with QAR 26.8 billion at the end of December 2019. The decrease is mainly due to maturities in Government bonds.
Financial Results (QAR million) 2020 2019
Net interest income 3,100 2,963
Non-interest income 1,137 1,384
Net operating income 4,237 4,347
Operating expenses (1,096) (1,228)
Impairment on loans & financial assets
(1,024) (654)
Impairment on Associate (591) (414)
Share of results of associates (210) (7)
Income tax expense (15) (23)
Net profit for the year 1,301 2,021
Operating Expenses (QAR million) 2020 2019Staff costs 633 796
General and administrative expenses 264 227
Depreciation and amortization 199 205
Total operating expenses 1,096 1,228
Net Operating IncomeCommercial Bank’s net operating income reached QAR 4,237 million for the year ended 31 December 2020, a decrease of 2.5% compared with QAR 4,347 million achieved in 2019. Net operating income for the Bank in Qatar increased by 1.5% to QAR 3,804 million compared to the same period in 2019.
Net interest income for the group increased by 4.6% to QAR 3,100 for the year ended 31 December 2020 compared with QAR 2,963 in 2019. On normalized basis, net interest margin increased to 2.4% for the year ended 31 December 2020 compared to 2.3% (reported 2.5%) achieved in the same period in 2019. Although asset yields have reduced, the increase in margins is mainly due to proactive management of the cost of funding.
Non-interest income decreased by 17.8% to QAR 1,137 million for the year ended 31 December 2020 compared with QAR 1,384 million in 2019. The overall decrease in non-interest income was mainly due to an adverse unrealized mark to market movement in investment and trading income as a result of the unprecedented volatility in the global markets in H1 2020.
Management Review of Operations

37
Operating ExpensesTotal operating expenses decreased at a group level by 10.7% to QAR 1,096 million for the year ended 31 December 2020 compared with QAR 1,228 million in 2019. The decrease was primarily driven by our continued productivity enhancements.
Provisions for Impairment LossesProvisions for loans and advances for the group increased by 40.7% to QAR 836 million for the year ended 31 December 2020, compared to QAR 594 million provided in 2019. The non-performing loan ratio decreased to 4.3% in December 2020 compared to 4.9% in 2019, the loan coverage ratio increased to 101.6% as at December 2020 compared to 82.1% in December 2019.
The bank sets aside a risk reserve against its lending as part of shareholders’ equity. At 31 December 2020, the risk reserve was QAR 2,037 million.
In addition, the group impaired its associate United Arab Bank by QAR 591 million in 2020.
Total Assets and FundingCommercial Bank balance sheet increased by 4.1% in 2020, with total assets at QAR 153.6 billion compared to QAR 147.5 billion in 2019.
Balance sheet increase was driven by QAR 8.7 billion increase in loans and advances, and partially offset by decrease of QAR 1.1 billion in investment securities and a decrease of QAR 2.0 billion in due from banks.
Customers’ deposits slightly decreased by 0.7% to QAR 75.8 billion at 31 December 2020, compared with QAR 76.3 billion in 2019, a decrease of QAR 0.5 billion. Low-cost deposits grew by 24.8% in 2020, contributing to the improvement in NIMs.
CapitalCommercial Bank’s capital position remains strong, the capital adequacy ratio increased to 17.8% as at
31 December 2020 compared to 16.4% at the end of 2019. The capital adequacy ratio is above the Qatar Central Bank’s required minimum level of 14.0%.
Subsidiaries
Alternatif BankAlternatif Bank delivered a net profit of TL 58 million for the year ended 31 December 2020, with total assets of TL 36.9 billion and lending of TL 23.6 billion.
Alternatif Bank provides its customers in the corporate, commercial and retail banking segments with high value products, services and solutions. Alternatif Bank has 44 branches widely distributed around Turkey. In 2020, Alternatif Bank continued to work closely with its counterparts in Commercial Bank to implement best international practice and continue to realise synergies.
Commercial Bank Financial Services (L.L.C.)Commercial Bank Financial Services (CBFS) is a fully owned subsidiary of Commercial Bank. CBFS provides direct access to the Qatar Exchange and offers seamless online trading capabilities for individuals, institutions, corporate and foreign counterparties. In addition to its electronic trading platform, CBFS is also licensed by Qatar Financial Markets Authority to act as Liquidity Provider for certain securities at Qatar Exchange. In 2020, CBFS delivered a net profit of QAR 10.7 million.
Orient 1 LimitedA fully owned subsidiary that owns and manages an exclusive Diners Club franchise in Turkey.
CBQ Finance LimitedA fully owned subsidiary incorporated in Bermuda and organised as a special purpose entity established to raise capital for Commercial Bank by issue of debt instruments.
Net Operating Income
Other IncomeInvestment &
Dividend Income
Net Fee Income
Net Interest Income
Foreign Exchange Income 2%
-1%
7%
19%
73%
Shareholder’s Equity
Risk Reserve
Other Reserves
Share Capital
Legal Reserve
Retained Earnings
Additional Tier 1 Note
3%7%
9%
18%
18%
45%

38
Raju Buddhiraju EGM, Wholesale Banking
Wholesale BankingCommercial Bank’s Wholesale Banking department offers a comprehensive range of financial services to corporate businesses in Qatar, international companies trading or implementing projects in Qatar, and corporate relationships across the Bank’s strategic markets in Turkey, the GCC and other target geographies with high-growth potentials. These services include commercial banking, treasury, investment banking, cash management, trade, transaction banking, corporate finance and advisory services across different industries.
Wholesale Banking comprises Domestic Corporate Banking and Transaction Banking, and has strong and longstanding banking relationships with leading Qatari businesses, nurtured over the years through excellent customer service, tailored financial solutions, and the application of innovative technologies.
Business performanceIn 2020, Wholesale Banking’s business represented the growth of most of the Bank’s total loan book and generated over half of the Bank’s total revenues. In line with the Bank’s five-year strategic plan, Wholesale Banking proactively initiated several new measures, such as:
• Growing the balance sheet in line with the market, primarily within the government and public sector;
CB Global Trading Limited A fully owned subsidiary incorporated in Cayman Islands, an intermediary vehicle for Derivatives.
CB Innovation Services (L.L.C.)A fully owned subsidiary incorporated in Qatar under the Qatar Financial Centre Authority providing the Bank with operations management services.
CB Asset Management L.L.C. A fully owned subsidiary incorporated in Qatar under the Qatar Financial Centre Authority established to provide asset management services.
CB Real Estate Properties L.L.C. A fully owned subsidiary incorporated in Qatar under the Qatar Financial Centre Authority providing the Bank with advisory services in relation to property.
CB Leasing Company L.L.C. A fully owned subsidiary incorporated in Qatar under the Qatar Financial Centre Authority that leases and subleases properties in Qatar.
Associates
National Bank of Oman (S.A.O.G.)National Bank of Oman (NBO) achieved net profit of OMR 18 million, compared with OMR 51 million in 2019. Operating income decreased to OMR 117 million, compared with OMR 128 million in 2019.
During 2020, NBO loans and advances increased by 3.1% to OMR 2.9 billion.
United Arab Bank (P.J.S.C.)We have taken a goodwill charge of QAR 591 million for United Arab Bank in 2020 and continuously working to ensure that UAB achieves improved results through implementation of a new strategic plan.
Massoun Insurance Services (L.L.C.)Massoun Insurance Services is a Qatari incorporated joint venture company between Commercial Bank and Qatar Insurance Company. The company provides a range of insurance products which have been tailored to meet the specific needs of the Bank’s retail and corporate customers.
Management Review of Operations continued
39
• Strategically re-shaping the composition of the balance sheet to reflect the market;
• Proactively de-risking the balance sheet for sustainable growth;
• Building a strong pipeline of the right customers, with the right risk profile and the right quality of assets;
• Focusing on Transaction Banking;
• Diversifying revenue streams;
• Working closely with Alliance banks.
Growing the government and public sector balance sheetAsset growth in the government and public sector balance sheet during 2020 was over 25%. The growth of this sector in Commercial Bank’s book is estimated to be significantly faster than the market growth. We have identified more than 35 new public sector customers to focus on, targeting cash management, FX opportunities, and trade facilities apart from lending.
Re-shaping Wholesale Banking’s balance sheetThe composition of the balance sheet has been reshaped in two key areas to reflect stresses in the market and to ensure a quality mix of assets, which are:
• Growth of government and public sector lending from 21% of Wholesale Banking’s portfolio in YTD 2019 to 29% in YTD 2020;
• Rationalisation of real estate exposure with a significant reduction in Wholesale Banking portfolio in line with bank’s Strategic plan.
Growth of government and public sector Lending and rationalisation of real estate exposure remains a strategic aim, with a five-year target of 21% and 25% composition of the Wholesale Banking book respectively.
De-risking selected exposuresAs part of prudent risk management, Wholesale Banking identified certain clients with exposure to be either partially or fully reduced to ensure Commercial Bank does not have very large exposure towards any client. In 2020, the total amount of intentionally de-risked assets was more than QAR 1.45 billion, with an additional de-risking of over QAR 1.0 billion by 2021, for an optimized balance sheet containing high-quality customers and assets.
Growth and strong lending pipelineWholesale Banking’s lending book grew by approximately 11% in 2020, most of it in the Public Sector segment. Wholesale Banking’s focus in 2020
was to grow its lending book with the right risk profile and the right quality, in conjunction with the strategic aims of reshaping and de-risking to maintain growth and ensure a sustainable revenue stream in the future. The lending pipeline originating from the public sector represents over 50% of the total lending pipeline.
Cross-sellingDiversification of the revenue, primarily an increase of the fee income that is not lending-based, is one of the major strategic aims of Wholesale Banking. Fee income was above 15% of Wholesale Banking’s total operating income, resulting in part from cross-selling innovative new services to customers across Domestic, Corporate Banking, and Transaction Banking.
Working with Alliance banksWholesale Banking contributes to the efforts of enhancing synergies with our Alliance banks, Alternatif Bank and National Bank of Oman, through cross-selling activities, supporting Turkish companies as well as Qatari business in Oman. We have been very active in this area.
Domestic Corporate BankingDomestic Corporate Banking provides a comprehensive range of cross-product banking solutions to corporate clients operating in Qatar. This unit services client relationships across the following sectors: large corporates, mid-market corporates, contracting, ultrahigh net worth, government and public sector.
Domestic Corporate Banking was active in arranging large financings in the domestic syndicated and club loan markets, and was associated with a number of the successful transactions in 2020, including key arterial highways connecting stadiums being built for the 2022 World Cup, and supporting district cooling in the Lusail area.
In 2020, Domestic Corporate Banking continued to focus on organic growth of operations by delivering the best client experience and service quality through innovative banking solutions with state-of-the-art technologies. This includes introducing host-to-host connectivity and providing a direct link with our customers to enhance the client experience.
Wholesale Banking continues to work very closely with Retail Banking through the successful Banking at Work unit, where a key strategic focus has been to enhance the total relationship value for each customer across all business portfolios.

40
Transaction BankingCommercial Bank has been continuously enhancing products and services to maintain its leadership position in Transaction Banking in Qatar. In 2020, the Bank rolled out new services and strengthened the product suite. Customer adoption of digital channels has improved substantially - 85% of payments, 98% of salaries and 50% of trade transactions are now conducted digitally. The Bank’s efforts with regards to digitization are also recognized by Global Finance and the Bank has been rewarded the “Best Trade Finance Services, Corporate Digital Banking” award and the “Best Online Cash Management Bank” in Qatar award.
Following a meticulous study by qualified research organizations that look into the nominated institutions, talent, leadership skills, industry net worth and capability, this year has been very successful for the Transaction Banking Team of the Bank as we have by far secured the following prestigious awards:
• Best Cash Management Bank • Best Mobile Banking App • Best Trade Finance Service
Some of other significant initiatives are as follows:
• Automated insurance service for trade finance customers;
• Postdated cheque Management solution for the benefit of Real Estate sector that provides control of data, remote submission of cheques and custody;
• Corporate Mobile App with rich features to conduct all payments and inquiries of bank accounts;
• Updated CB Smart Trade solution that helps ease transaction flow, faster turnaround time and real-time status updates;
• Corporate Mobile application enriched with seamless retrieval and approval of Salary and bulk payments initiated on line (Corporate Internet Banking);
• Swift GPI for corporates through CIB and mobile for online tracking customer transactions on real time basis;
• Multiple structured trade solutions for leading automobile Dealers and other commodity traders that assisted imports in Qatar on an extended credit period;
• Implemented customized B2B solutions for large public sector conglomerates engaged in Transportation, Aviation and Exports;
• International remittances have seen significant growth of 49% and exports share has moved up to 19% from 16%.
Transaction Banking has worked closely with international Block Chain initiatives for Trade Finance conducted by Voltron and Marco Polo along with many international banks and in 2021 will move to testing phase from the current design phase. This would be a significant innovation which will add value to our customers.
Management Review of Operations continued

41
Fahad Badar EGM, International Banking
International BankingInternational Banking at Commercial Bank is responsible for providing correspondent banking services, corporate cross-border loans and other Wholesale Banking products to financial institutions, large corporates, sovereigns, non-bank financial institutions, and high to ultra-high net worth family offices based outside of Qatar. In 2020, the Bank’s international corporate lending strategy focused mostly on diversified sectors with strong Qatari angles.
The corporate lending business maintained its strategic drive towards diversification, targeting landmark opportunities both on direct balance sheet transactions and cross-selling activities such as FX and derivatives.
Commercial Bank’s cross-border business strategy remains cautious and focused on portfolio diversification and revenues from trade finance flows and banks, and strategic relationships with large corporates in the EMEA region, Turkey, and selectively across the North American, Asia Pacific and Sub-Saharan African markets.
The lower risk and mostly short-term trade finance book saw prudent activity in 2020. Another key pillar of our strategy was to collaborate more closely on correspondent banking services, credit products and other cross-border business activities of Commercial Bank with our Alliance bank partners to benefit from synergistic growth across the Commercial Bank Group.
Diversifying fundingThe International Banking department also plays a key role in supporting the Bank’s funding needs by leveraging its global relationships and supporting the Treasury Department in diversifying the Bank’s funding. This is achieved by arranging bilateral and syndicated loans for the Bank and expanding treasury and corporate deposit relationships with regional and Asian sovereign wealth funds, asset managers, and other nonbank financial institutions.
Supporting business initiativesSupporting major business initiatives that are relevant to the Qatari banking sector remains a key pillar of the International Banking business. In 2020, the Bank sponsored and participated in several major banking industry events and conferences. These included:
• The Annual Meetings of the International Monetary Fund (IMF) and the Institute of International Finance (IIF).
• SIBOS, a major industry event for banks and financial institutions around the world.
Commercial Bank continues to support its financing and services network with global trade and development institutions such as the ICC Banking Commission, SWIFT, the Institute of International Finance, the International Finance Corporation, IMF, Arab Trade Finance Program, ISDA and other development institutions.
2021 prioritiesMoving forward, our strategic priorities in 2021 and beyond will be to manage and expand the business along the following lines:• Focus on opportunistic growth in the network
countries of our Alliance banks, with a view to strengthening the client proposition and create synergies in these markets;
• Diversify cautiously into Asia and Africa as trade and investment flows pick up and also grow into developed markets like the US, UK and select OECD countries for portfolio diversification and risk management purposes;
• Enhance the value proposition by developing structured finance, distribution, trade, and treasury capabilities, which lead to increased cross-selling and improve International Banking’s portfolio returns;
• Maintain a well-diversified portfolio with no large concentrations in line with regulatory and the Bank’s governance standards, focusing on tangible collateral and security support for risk mitigation to withstand credit event downturns;
• Support the Commercial Bank Group’s funding initiatives and balance sheet growth by leveraging Commercial Bank’s international corporate network.
42
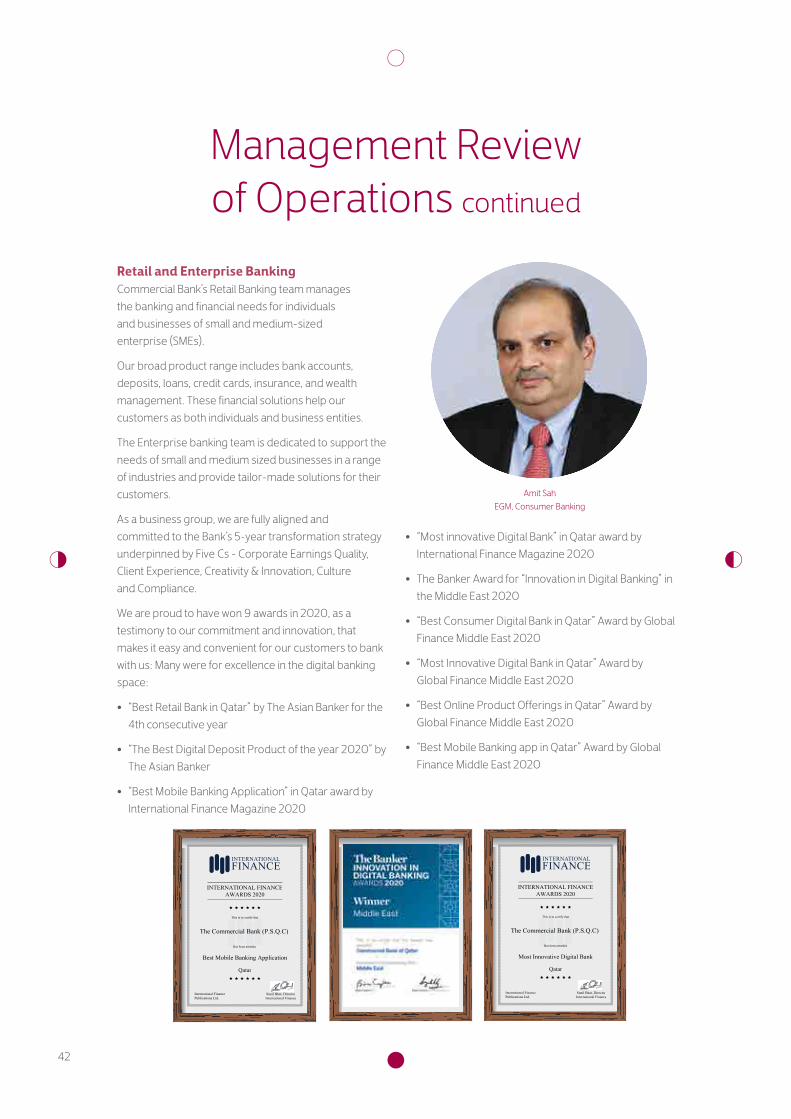
Amit SahEGM, Consumer Banking
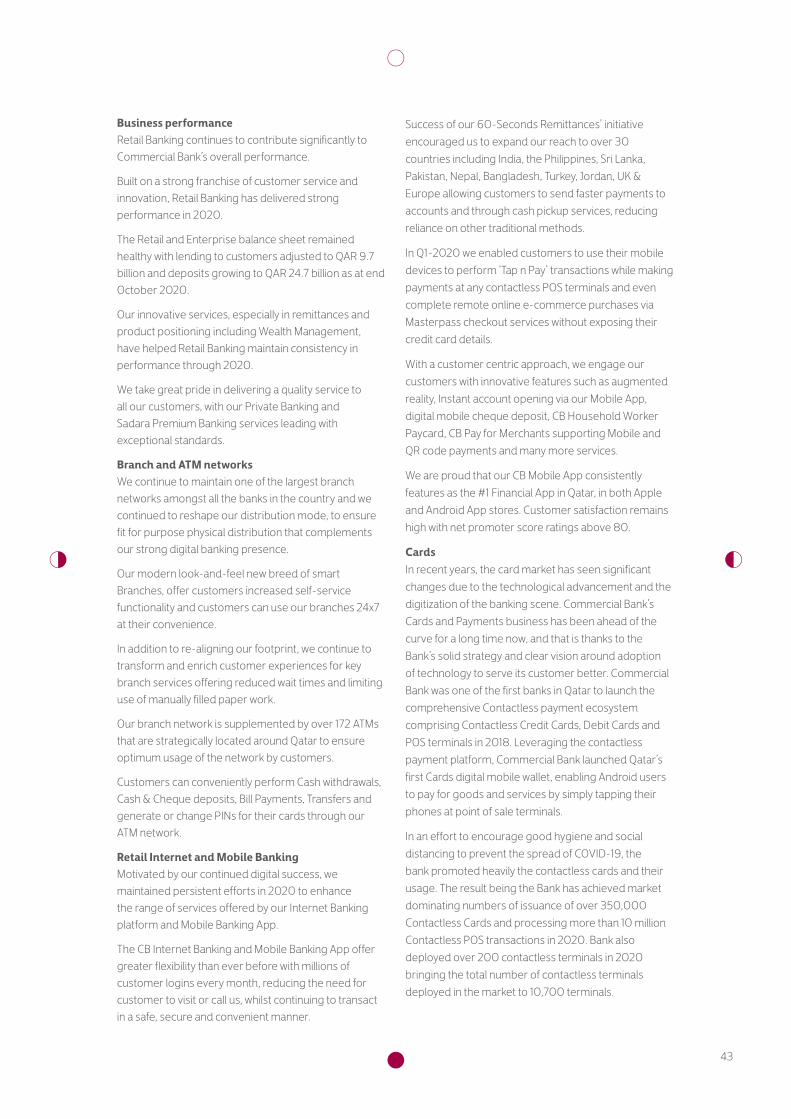
• “Most innovative Digital Bank” in Qatar award by International Finance Magazine 2020
• The Banker Award for “Innovation in Digital Banking” in the Middle East 2020
• “Best Consumer Digital Bank in Qatar” Award by Global Finance Middle East 2020
• “Most Innovative Digital Bank in Qatar” Award by Global Finance Middle East 2020
• “Best Online Product Offerings in Qatar” Award by Global Finance Middle East 2020
• “Best Mobile Banking app in Qatar” Award by Global Finance Middle East 2020
Retail and Enterprise Banking Commercial Bank’s Retail Banking team manages the banking and financial needs for individuals and businesses of small and medium-sized enterprise (SMEs).
Our broad product range includes bank accounts, deposits, loans, credit cards, insurance, and wealth management. These financial solutions help our customers as both individuals and business entities.
The Enterprise banking team is dedicated to support the needs of small and medium sized businesses in a range of industries and provide tailor-made solutions for their customers.
As a business group, we are fully aligned and committed to the Bank’s 5-year transformation strategy underpinned by Five Cs - Corporate Earnings Quality, Client Experience, Creativity & Innovation, Culture and Compliance.
We are proud to have won 9 awards in 2020, as a testimony to our commitment and innovation, that makes it easy and convenient for our customers to bank with us: Many were for excellence in the digital banking space:
• “Best Retail Bank in Qatar” by The Asian Banker for the 4th consecutive year
• “The Best Digital Deposit Product of the year 2020” by The Asian Banker
• “Best Mobile Banking Application” in Qatar award by International Finance Magazine 2020
Management Review of Operations continued
INTERNATIONAL FINANCEAWARDS 2020
International FinancePublications Ltd.
Sunil Bhat, DirectorInternational Finance
This is to certify that
Has been awarded
The Commercial Bank (P.S.Q.C)
Best Mobile Banking Application
Qatar
INTERNATIONAL FINANCEAWARDS 2020
International FinancePublications Ltd.
Sunil Bhat, DirectorInternational Finance
This is to certify that
Has been awarded
The Commercial Bank (P.S.Q.C)
Most Innovative Digital Bank
Qatar
43
Success of our 60-Seconds Remittances’ initiative encouraged us to expand our reach to over 30 countries including India, the Philippines, Sri Lanka, Pakistan, Nepal, Bangladesh, Turkey, Jordan, UK & Europe allowing customers to send faster payments to accounts and through cash pickup services, reducing reliance on other traditional methods.
In Q1-2020 we enabled customers to use their mobile devices to perform ‘Tap n Pay’ transactions while making payments at any contactless POS terminals and even complete remote online e-commerce purchases via Masterpass checkout services without exposing their credit card details.
With a customer centric approach, we engage our customers with innovative features such as augmented reality, Instant account opening via our Mobile App, digital mobile cheque deposit, CB Household Worker Paycard, CB Pay for Merchants supporting Mobile and QR code payments and many more services.
We are proud that our CB Mobile App consistently features as the #1 Financial App in Qatar, in both Apple and Android App stores. Customer satisfaction remains high with net promoter score ratings above 80.
CardsIn recent years, the card market has seen significant changes due to the technological advancement and the digitization of the banking scene. Commercial Bank’s Cards and Payments business has been ahead of the curve for a long time now, and that is thanks to the Bank’s solid strategy and clear vision around adoption of technology to serve its customer better. Commercial Bank was one of the first banks in Qatar to launch the comprehensive Contactless payment ecosystem comprising Contactless Credit Cards, Debit Cards and POS terminals in 2018. Leveraging the contactless payment platform, Commercial Bank launched Qatar’s first Cards digital mobile wallet, enabling Android users to pay for goods and services by simply tapping their phones at point of sale terminals.
In an effort to encourage good hygiene and social distancing to prevent the spread of COVID-19, the bank promoted heavily the contactless cards and their usage. The result being the Bank has achieved market dominating numbers of issuance of over 350,000 Contactless Cards and processing more than 10 million Contactless POS transactions in 2020. Bank also deployed over 200 contactless terminals in 2020 bringing the total number of contactless terminals deployed in the market to 10,700 terminals.
Business performanceRetail Banking continues to contribute significantly to Commercial Bank’s overall performance.
Built on a strong franchise of customer service and innovation, Retail Banking has delivered strong performance in 2020.
The Retail and Enterprise balance sheet remained healthy with lending to customers adjusted to QAR 9.7 billion and deposits growing to QAR 24.7 billion as at end October 2020.
Our innovative services, especially in remittances and product positioning including Wealth Management, have helped Retail Banking maintain consistency in performance through 2020.
We take great pride in delivering a quality service to all our customers, with our Private Banking and Sadara Premium Banking services leading with exceptional standards.
Branch and ATM networksWe continue to maintain one of the largest branch networks amongst all the banks in the country and we continued to reshape our distribution mode, to ensure fit for purpose physical distribution that complements our strong digital banking presence.
Our modern look-and-feel new breed of smart Branches, offer customers increased self-service functionality and customers can use our branches 24x7 at their convenience.
In addition to re-aligning our footprint, we continue to transform and enrich customer experiences for key branch services offering reduced wait times and limiting use of manually filled paper work.
Our branch network is supplemented by over 172 ATMs that are strategically located around Qatar to ensure optimum usage of the network by customers.
Customers can conveniently perform Cash withdrawals, Cash & Cheque deposits, Bill Payments, Transfers and generate or change PINs for their cards through our ATM network.
Retail Internet and Mobile BankingMotivated by our continued digital success, we maintained persistent efforts in 2020 to enhance the range of services offered by our Internet Banking platform and Mobile Banking App.
The CB Internet Banking and Mobile Banking App offer greater flexibility than ever before with millions of customer logins every month, reducing the need for customer to visit or call us, whilst continuing to transact in a safe, secure and convenient manner.
44
Qatar has one of the highest per capita income in the world and given the fact that affluent consumers tend to use their Credit cards frequently, we continue to invest in our flagship portfolio of the Limited-Edition Cards. The Metal World Elite MasterCard Credit Card for Limited Edition Customers, a brand-new metal card offering contactless payment functionality unlocks a universe of world-class privileges for its holders, and offers an unparalleled array of specially selected travel, lifestyle and rewards.
CB Fawri the instant discount at POS terminals, without customer having to ask for the discount continues to grow.
Commercial Bank continues to play a key role in Qatar’s merchant acquiring business and has forged ahead with fully integrated ECR payment system with retailers. Commercial Bank also launched “CB Pay for Merchants” a unique QR code-based payments acceptance solution to help merchants with remote payments acceptance.
During Corona virus lockdown, domestic workers were restricted in their options to send money home. The Household Worker Paycard product was launched in this context and provides a solution for domestic workers who could otherwise had trouble to send remittances.
Wealth ManagementOur Wealth Management themes today continue to revolve around utilizing our competitive strengths of size, AUMs, and operating capabilities.
We continue to increase our developments in our people, process, products and systems. We focus on building on strong foundations and provide the diversified portfolios and wealth solutions based on our customers’ needs and objectives. As part of providing Wealth Management Products to our customers as a competitive advantage, we focused on enhancing our wealth product account opening process and facilitating our customers’ journey. Looking ahead we will continue automating the operational processes and introduce a wider range of wealth products, enabling our customers to diversify their portfolios.
Customer AcquisitionWe developed numerous methods to enable new customers to join the Bank, in easy to apply and digitally enhanced account applications.
Digital Account Opening was made available across frontline channels to make account opening quick and easy. Customers walk out from CB branches with an active account, details including the IBAN are all provided in a welcome letter. A personalized debit card can be instantly printed too.
CB Instant Account was launched for new customers wishing to open a Commercial Bank account. Customers can simply download the Bank’s award-winning mobile application, “CBQ Mobile”, complete the application on their mobile device after uploading the QID, Passport and Salary Certificate and receive their bank account number in less than 5 minutes. A staff member ultimately meets the customer to assist in providing debit cards and cheque books as part of the welcome experience.
Whilst the COVID-19 pandemic caused a temporary disruption in the arrivals of new working expats to Qatar, our Life in Qatar innovative offer continued to be available to welcome them again and allow to open a bank account quickly. Customers can have their account numbers ready as soon as they apply, even before arriving in the country. A dedicated team who speaks their language welcomes them the minute they land in Qatar with their debit and credit cards. The partnership
Management Review of Operations continued
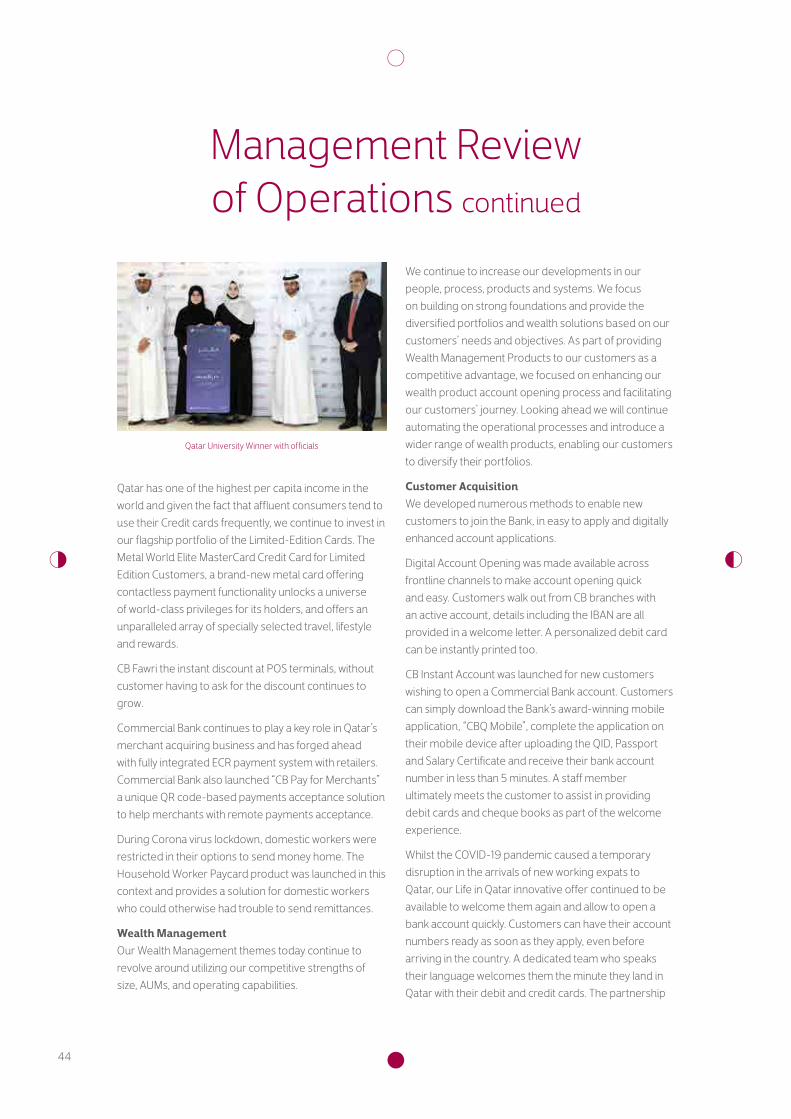
Qatar University Winner with officials
45
with Qatar Visa Centres in selected overseas locations also enables inbound expat customers to resolve banking needs even before stepping foot in the country.
Focus on the Youth Sadara Youth, is a digital product designed to fit the needs and lifestyles of young Qatari customers aged between 18 and 25 years. A year after the Sadara Youth package delivered the 1st Mobile Banking application in Qatar that educates and rewards young customers and issued the 1st vertical design Credit Card in Qatar, the proposition lead the launch of another 1st in Qatar.
The 1st ever Commercial Bank and Qatar University Design competition was launched to allow Qatar University students to create their own space at the CB Metro Station branch. Students were engaged to propose their ideas on how they want their Sadara Youth space in this modern new branch in order to suit the needs of the modern young society. The QU partnership has been a huge success in terms of honing the skills and developing talents of the youth. This is only the beginning of future collaborations that will assist in the advancement of current and future generations.
SME - Small and Medium Enterprise bankingWe remain committed to the empowerment of the SME sector in line with the Qatar National Vision 2030. Commercial Bank was at the forefront of the recent government initiatives to support the SME sector, playing a significant role in disbursing the National Response Guarantee Program loans created as a result of the pandemic’s financial impact on business. We were able to quickly provide technology solutions to facilitate safer and more efficient transactions for customers during this challenging period.
Building upon the 360-degree view of our customers, we have revamped our relationship management model and successfully launched industry specific cash management and digital banking solutions. Commercial Bank introduced a new and innovative product, CB Pay for Merchants, a dedicated mobile application to support businesses to initiate, receive and track payments seamlessly from their customers.
We continue to educate and migrate our customers to self-service digital banking services. The digital channels have given SMEs better control over cash flows and provided flexibility to securely transact from the comfort of their offices.
Response to COVID-19Our customer feedback on how we handled and responded during the peak of the COVID-19 pandemic was most reassuring. We acted with pace and took decisive actions to keep our customers safe and their banking needs catered for digitally.
Branches were made safe with distancing, cleansing, digital appointment booking. Digital development happened constantly with products launched to help customers remit funds, transact online, increase contactless payments and minimize the need to handle cash. Communications were 24/7 with a variety of messages keeping customers well informed with the changing scenarios through lockdowns and restricted working hours.
Treasury and InvestmentsThe Commercial Bank’s Treasury and Investments Department is responsible for asset-liability management, capital and financial market investments, trading, and treasury sales. The department manages the overall funding and liquidity requirements of the Bank. This includes management of operational and strategic liquidity requirements, as well as accessing the international debt capital markets for funding needs.
Departmental functionsProactive management allows the Bank to manage its funding base in a cost-efficient manner while ensuring its balance sheet is managed in accordance with the expectations of rating agencies, regulators, the Board of Directors and shareholders. The department’s treasury function has been instrumental in maintaining a stable cost of funding, managing the duration of the Bank’s liabilities in a volatile interest rate environment, seeking diversification of funding channels, and maintaining key liquidity ratios and related business regulatory ratios as required by the Qatar Central Bank.
The department’s investments function is engaged in managing the Bank’s investments in capital markets to achieve superior and stable returns. It continued to provide strong revenue generation in 2020 whilst ensuring a liquidity buffer for the Bank by focusing on liquid and diversified investments. Its goal in 2021 is to maintain returns momentum in a challenging geopolitical and monetary policy environment aggravated by the COVID- 19. The investment emphasis remains on active portfolio management to optimize returns and ensure effective risk management by flexible asset allocation, hedging, and duration management.
46
Treasury SalesThe Treasury Sales unit provides a full suite of products to the Bank’s customers, supporting their needs with regards to managing and hedging their foreign exchange, interest rate exposures and other asset classes. Commercial Bank Treasury and Investments department continues to grow its footprint as a leading market-maker in the regional rates, fixed income, treasury securities, and FX markets, and in providing market access to corporates and institutions.
In 2020, Commercial Bank Treasury and Investments expanded its capacity to support client needs by adding digital execution capabilities and risk management solutions, both domestically as well as cross-border, demonstrating its ability to provide seamless client solutions across multiple geographies.
Treasury is also actively engaged with Commercial Bank’s subsidiary in Turkey – Alternatif Bank to provide end-to end origination, structuring, negotiation, and execution.
Risk ManagementManaging risk is a fundamental part of Commercial Bank’s day-to-day business activities. As part of the overall corporate governance framework, the Board of Directors is responsible for overseeing a strong risk governance framework, including a strong risk culture, a well-developed risk appetite – articulated through the Bank’s Risk Appetite Statement – and well-defined responsibilities for risk management and control functions. The keystone of the Bank’s risk governance framework is the three lines of defense, namely:
1. The first line of defense consisting of frontline business units and functions that create risk. These groups are the Bank’s primary risk-takers, responsible for implementing effective internal controls and maintaining processes for identifying, assessing, controlling, and mitigating the risks associated with their activities, consistent with the Bank’s Risk Appetite Statement and risk limits.
2. The second line of defense consisting of independent risk management, which oversees risk-taking and assesses risks independent of frontline business units and functions that create risk. Independent risk management complements the frontline units’ risk-taking activities through its monitoring and reporting responsibilities, including compliance with the Bank’s risk appetite, and is responsible for identifying, measuring, monitoring, and controlling aggregate and emerging risks enterprise-wide.
3. The third line of defense consisting of internal audit, which provides independent assurance to the Board on the effectiveness of governance, risk management, and internal controls.
During 2020, Commercial Bank continued to enhance its risk systems infrastructure platforms, including enhancements in retail customer scorecards, improvements in credit approval workflow, among others. The Bank also implemented improvements in ICAAP and IRRBB, and Internal Controls over Financial Reporting in accordance with Qatar Financial Markets Authority.
Management Review of Operations continued
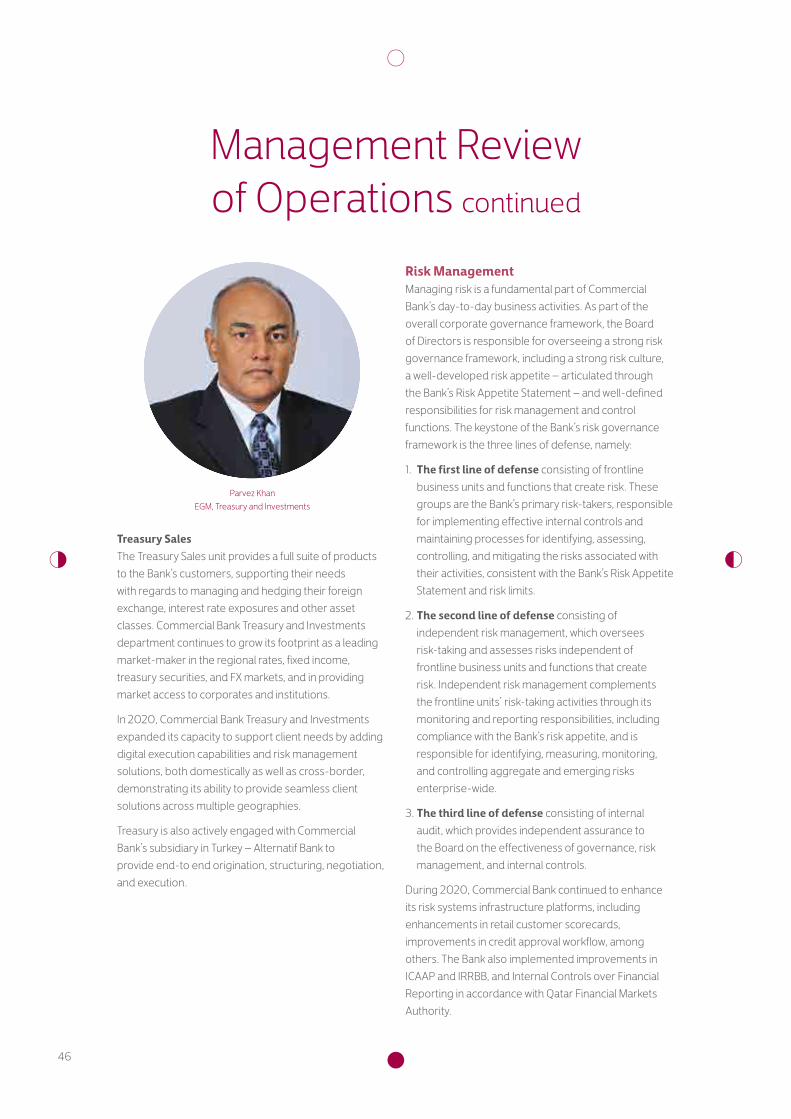
Parvez KhanEGM, Treasury and Investments

47
Paul Gossiaux EGM, Chief Risk Officer
In 2021, Commercial Bank will continue to employ clear risk management objectives and well-established strategies through core risk management processes.
Credit RiskCommercial Bank has clearly defined credit policies for the approval and management of credit risk. Formal credit standards apply to all credit risks decisions, with specific portfolio standards applying to all major lending areas. These incorporate obligor quality, income capacity, repayment sources, acceptable terms and security, and loan documentation tests.
The Bank assesses the integrity and ability of debtors or counterparties to meet their contracted financial obligations for repayment. Collateral security such as real estate, charge over income or assets, and financial securities is generally taken for business credit, except for government, major banks and corporate counterparties that are externally risk-rated and of strong financial standing.
Operational RiskOperational risk is the risk of loss resulting from inadequate or failed internal processes, people and systems, or from external events. It includes legal risk but excludes strategic and reputational risk.
The Operational Risk Management (‘ORM’) unit supports the achievement of Commercial Bank’s financial and business goals. ORM manages operational risk using industry standard operational risk tools. The primary objectives of the ORM Department are:
• Maintenance of an effective internal control environment and system of internal control;
• Demonstration of effective governance, including a consistent approach to operational risk management across the Bank;
• Transparency, escalation and resolution of risk and control incidents and issues.
Market RiskMarket Risk is the potential loss in value or earnings arising from changes in market factors, and is managed by the Bank’s Market Risk Department with oversight by the Asset and Liability Committee (‘ALCO’), which provides specific guidelines for market risk management.
Commercial Bank uses value-at-risk (‘VaR’) as one of the measures for Market Risk. VaR measures potential loss using historically observed market volatility. Stressed VaR is used at the Bank to measure the potential for economic loss from extreme market events.
For assessing interest rate risk, metrics include earnings-at-risk (EaR), change in yield (‘DV01’) and economic value of equity (‘EVE’).
The results of these measures are reported to the ALCO and the Management Risk Committee on a regular basis.
Liquidity and Funding ManagementCommercial Bank follows a balanced liquidity management strategy through the combined use of liquid asset holdings and borrowed liquidity to meet its liquidity needs. The Bank’s funding policies provide that:
• Liquidity requirements be measured using several approaches including sources and uses, structure of funds, and liquidity indicators;
• An appropriate level of assets is retained in highly liquid form;
• The level of liquid assets complies with stressed scenario assumptions to provide for the risk of the Bank’s committed but undrawn lending obligations;
• Establishment of credit lines.
Board Risk-related CommitteesThe two Board Committees that have primary responsibility and oversight for risk are:
1. The Board Risk Committee (‘BRC’), which is responsible for all aspects of enterprise wide risk management including, but not limited to, credit risk, market risk, liquidity risk and operational risk. The BRC reviews policy on all risk issues and maintains oversight of all Bank risks.
2. The Board Executive Committee (‘BEC’) which is responsible for evaluating and granting credit facilities within authorised limits as per Qatar Central Bank and Board guidelines.

48
The Board of Directors or its subcommittees are regularly updated on any potential risk that the Bank may face.
Risk Management continues to be very well positioned to manage risk resulting from the increasing sophistication, scope and diversity of the Bank’s business and operations.
In summary, the governance framework, policies and administrative procedures and practices relating to risk management in Commercial Bank align well with global best practice, the recommendations of the Basel Committee and the guidelines of Qatar Central Bank.
Marketing The Marketing Department of Commercial Bank establishes and promotes the Bank’s reputation and brand identity to stakeholders and customers through effective communication using both traditional and digital media channels.
Marketing works closely with the Bank’s main business units and supports functions to develop integrated marketing campaigns targeting different customer segments with diverse products and services based on ongoing research, consumer insight and return on investment analysis. Marketing also runs the Bank’s sponsorships and key events, as well as its Corporate Social Responsibility (CSR) programmes.
Commercial Bank is proud of its leading position as a digital bank. Through exemplary thought leadership in digital marketing – alongside our proactive approach to digital media, introduction of first-to market technologies, quality content offering, and customer engagement on and through social media – Commercial Bank continues to dominate Qatar’s digital banking spaces.
Following a national vision Commercial Bank’s successes and achievements this year emerged from the Bank’s commitment towards Qatar National Vision 2030, which inspired us to achieve results, in alignment with the country’s key strategic messages and fulfilment of the Qatar National Vision 2030.
For 2020, our theme was “Qatar, my Home.” It represents much in just two words; Home is where we are happy, dedicated, at ease, and in our comfort zone. Inspired by that, we created a social media campaign to celebrate QND by creating a tile with each letter of the word Qatar in Arabic. And, to commemorate this special occasion, we decided this year to launch an original poem written by us. The poem, which was praised by many, was featured in an eye-catching hero video that showcases a falcon’s journey around Qatar’s most prominent sites, cultural elements, foods, and most importantly, HH the Amir. The falcon lands on a Qatari guy’s shoulder at the end of the video as a symbol of continuity of the journey that Qatar has started years ago, and has succeeded in achieving against all the odds.
Corporate Social Responsibility (CSR) Since its inception over forty-five years ago, Commercial Bank has been committed to supporting Qatar’s national development by giving back to the wider community through a comprehensive range of meaningful corporate social responsibility programmes formulated and implemented by the Bank’s Marketing Department.
As part of Commercial Bank CSR, and given the precautionary measures imposed by the State, the Bank launched a donation campaign among its employees, whereby every employee donated the amount of a food box that contains dates, rice, and other essential foods during the holy month of Ramadan. The aim of this campaign was for everybody to participate and take part in the Bank’s CSR agenda by helping impoverished families amidst these tough times. The participation of the Bank’s employees in this campaign during Ramadan reflects our commitment to the “one bank, one team” culture.
In 2020, Commercial Bank shone in Kuwait with the bank’s creative agency, DotSpace, receiving the Social Responsibility Award at the Arab Media Forum’s 8th Kuwait Creativity Award, for the awareness campaign launched by the Bank during the COVID-19 pandemic. “For you Qatar” is a production video Commercial Bank launched months ago in collaboration with DotSpace, to
Management Review of Operations continued
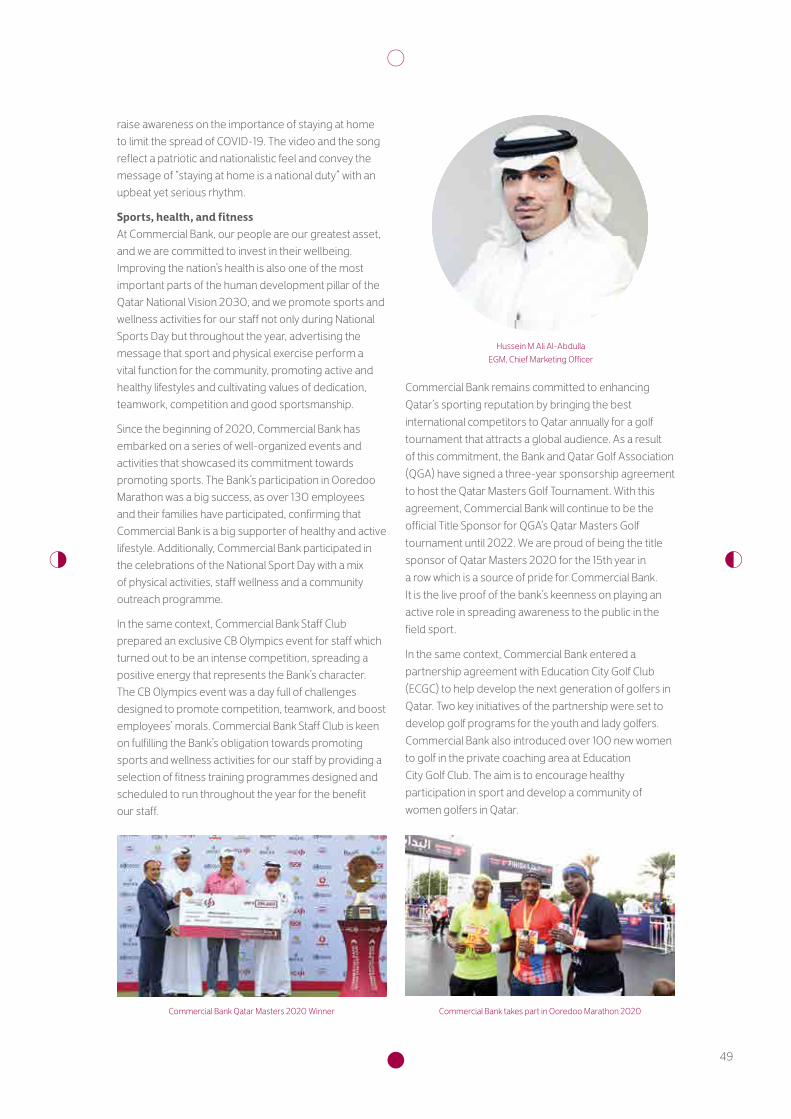
49
raise awareness on the importance of staying at home to limit the spread of COVID-19. The video and the song reflect a patriotic and nationalistic feel and convey the message of “staying at home is a national duty” with an upbeat yet serious rhythm.
Sports, health, and fitness At Commercial Bank, our people are our greatest asset, and we are committed to invest in their wellbeing. Improving the nation’s health is also one of the most important parts of the human development pillar of the Qatar National Vision 2030, and we promote sports and wellness activities for our staff not only during National Sports Day but throughout the year, advertising the message that sport and physical exercise perform a vital function for the community, promoting active and healthy lifestyles and cultivating values of dedication, teamwork, competition and good sportsmanship.
Since the beginning of 2020, Commercial Bank has embarked on a series of well-organized events and activities that showcased its commitment towards promoting sports. The Bank’s participation in Ooredoo Marathon was a big success, as over 130 employees and their families have participated, confirming that Commercial Bank is a big supporter of healthy and active lifestyle. Additionally, Commercial Bank participated in the celebrations of the National Sport Day with a mix of physical activities, staff wellness and a community outreach programme.
In the same context, Commercial Bank Staff Club prepared an exclusive CB Olympics event for staff which turned out to be an intense competition, spreading a positive energy that represents the Bank’s character. The CB Olympics event was a day full of challenges designed to promote competition, teamwork, and boost employees’ morals. Commercial Bank Staff Club is keen on fulfilling the Bank’s obligation towards promoting sports and wellness activities for our staff by providing a selection of fitness training programmes designed and scheduled to run throughout the year for the benefit our staff.
Hussein M Ali Al-Abdulla EGM, Chief Marketing Officer
Commercial Bank remains committed to enhancing Qatar’s sporting reputation by bringing the best international competitors to Qatar annually for a golf tournament that attracts a global audience. As a result of this commitment, the Bank and Qatar Golf Association (QGA) have signed a three-year sponsorship agreement to host the Qatar Masters Golf Tournament. With this agreement, Commercial Bank will continue to be the official Title Sponsor for QGA’s Qatar Masters Golf tournament until 2022. We are proud of being the title sponsor of Qatar Masters 2020 for the 15th year in a row which is a source of pride for Commercial Bank. It is the live proof of the bank’s keenness on playing an active role in spreading awareness to the public in the field sport.
In the same context, Commercial Bank entered a partnership agreement with Education City Golf Club (ECGC) to help develop the next generation of golfers in Qatar. Two key initiatives of the partnership were set to develop golf programs for the youth and lady golfers. Commercial Bank also introduced over 100 new women to golf in the private coaching area at Education City Golf Club. The aim is to encourage healthy participation in sport and develop a community of women golfers in Qatar.
Commercial Bank Qatar Masters 2020 Winner Commercial Bank takes part in Ooredoo Marathon 2020

50
In 2020, Commercial Bank and Al Shaqab, member of Qatar Foundation, entered for the first time into a three-year partnership, making the largest private bank in Qatar the title sponsor of the country’s premier equestrian competition – CHI AL SHAQAB. Commercial Bank CHI AL SHAQAB Presented by Longines took place from 27 to 29 February at the Longines Arena at Al Shaqab. The three-day event will saw top-ranking local and international riders compete in the Olympic disciplines of showjumping, dressage, and para dressage. The Bank’s sponsorship of the equestrian event reflects its commitment to supporting and promoting Qatar’s heritage and legacy.
In its efforts to enhance awareness of key health issues in Qatar in 2020, and in light of the restrictions due to COVID-19, Commercial Bank launched a digital campaign among its female employees and customers to raise awareness on breast cancer early detection. Under the slogan “You are strong,” Commercial Bank urged its staff and customers to get themselves checked through a comprehensive awareness campaign.
Educating the public and spreading awareness Due to Covid-19 and the lockdown imposed by the State of Qatar to flatten the curve of the pandemic,
Commercial Bank took its operations digital more than ever. The Marketing Department went even further by strengthening its social media and digital presence. In addition to launching a set of digital products and services that granted customers access to their banking needs from home, we took to social media with employee-led videos under the hashtag #Qatar_is_Calling_StayHome, offering step-by-step, multi-lingual guidance to all customers. Our communications covered general health and government advice, new branch guidance, mobile options for SMEs and corporate customers, and retail digital services ranging from international transfers to mobile app contactless and school-fee payments, and more. We left no social stone unturned in the quest to ensure that our customers stayed healthy, informed and empowered – but not overwhelmed – in six languages.
As a result, the Bank has seen the greatest rate of engagement, number of posts and fan growth rates on its social channels in comparison to other banks. To crown its unparalleled efforts and success, Commercial Bank received the “Best in Social Media Marketing and Services” award from Global Finance, Middle East.
Commercial Bank won prestigious awards in 2020
Management Review of Operations continued

51
2020 AwardsAs we celebrate 45 years of success and innovation, Commercial Bank has garnered this year more than 12 prestigious awards:
• From Global Finance, Middle East “Best Consumer Digital Bank” Award “Best Online Product Offerings” Award “Most Innovative Digital Bank” Award “Best Online Product Offerings” Award “Best Online Cash Management Services” Award “Best Trade Finance services” Award “Best Mobile Banking App” Award “Best in Social Media Marketing and Services” Award
• Euromoney’s “Excellence in Leadership” Award in the Middle East
• The Banker’s “Innovation in Digital Banking” Award in the Middle East
• The Banker’s “Best Performing Bank” Award in Qatar
• Finance Monthly Magazine’s CFO Award
• The Asian Banker’s “Best Retail Bank” Award in Qatar
• International Finance’s “Most Innovative Digital Bank” Award in Qatar and Asiamoney’s “Best Digital Bank” Award in Qatar
• The Asian Banker’s “Best Cash Management and Transaction Bank” Award in Qatar
• Arab Media Forum’s “Social Responsibility Award”
Human CapitalIn 2020, Commercial Bank continued to invest in its entrepreneurial and performance culture. Driven with the agility of the management teams and despite the exceptional situation with the global pandemic, Commercial Bank applied immediate measures to ensure business continuity, safety and care for our customers and employees alike including:
- Working from home measures. As our services and technology infrastructure were ready to handle the requirement to work remotely, managing and reducing active branches allowed availability of our service.
- Gradual phasing approach to ensure business continuity and team abilities to work remotely. In alignment with the state-wide phases, our approach was more reserved than the mandated, taking into consideration the safety of everybody.
- Communications, internal communications and updates on measures, changes and support shared with all employees and customers alike, enhancing the culture change and provide assurances to conduct.
• Continuing with our performance management system and putting more focus on people, conversations and development; despite the challenging economics in 2020, the business delivered well and reflected with quality improvements towards our strategy and shareholders commitment;
• Leaders development, setting new, challenging performance standards for our leaders and teams;
• Despite the new limitations on sourcing, we have continued to attract and recruit the right talent that will contribute further in delivering on the Bank’s strategic plan;
• In addition, the care extended with staff club activities during the quarantine period, talking the emotional and physical wellbeing;
• Partnering with the ministries and educational institutions; in partnership with the Ministry of Labour to source national talent and provide them with career opportunities within the Bank Nationalization plans, the bank contributes to education and development in collaboration with universities and schools through events and training programs. Delivered virtually and on campus, student engagement events held in 2020 provided students with key insight on how to transfer academic excellence into performance;
Jassim Al Thani Chief Human Capital Officer

52
• Restructuring concept to all nationalization themes, from internal development initiatives, mentorship, top talent program and enhanced development programs to attract, retain and motivate the right candidates;
• Continuing on our e-learning approaches, developed with the business expertise in Commercial Bank. Story-based e-learning courses, built on real life sceneries and cases, enhancing and delivering compliances and on demand learning.
Enhanced career experiencesIn 2020, we went strong with our nationalization programs by building towards inner focused development, progressing our talents to higher positions and enabling them to take significant roles in business, supported by the newly introduced Head of National development team NDT, into re-establishing our strategic target to achieve 60% Nationalization.
Learning and developmentWe invest in making Commercial Bank a great place for learning. We target our development resources toward our people who are skilled in sharing knowledge and training others through leader-led training. This strengthens our creative and innovative culture.
With on-demand learning portal, we have provided all compliance courses through e-learning. With other development initiatives, we are pursuing our study support initiative for staff working towards full- or part-time study programs, focused on Qatari nationals and endorsed by the NDT.
Compensation and benefitsThe Board of Directors regularly reviews compensation and benefits to ensure we pay fairly and competitively, reward high performers, and link incentive payments to the overall performance of the Bank. The Board of Directors also focuses on risk management by considering:
• The split between salary and incentives;
• The balance between profit, risk and the time horizons associated with those risks.
We disclose our remuneration policies and practices in our financial reports.
Human Capital operationsNewly intake in 2020: Commercial Bank has successfully attracted skilled and competent new graduate nationals across various strategic business units. These employees have been able to contribute significantly and successfully towards the Bank’s strategic goals.
Moreover, focusing on world-class and uplifting experiences, Commercial Bank successfully attracted global new key talents and leaders to accelerate its strategic vision, with technology and customer focus in mind.
Developing our nationals is one of our strategic pillars. Through experience and knowledge transfer, we have promoted new national leaders from our talent pool.
OperationsIn 2020, the impact of coronavirus has been highly disruptive for businesses across the globe. Many have had their business models stressed, and demand for remote services has led to a permanent shift in the way businesses interact with customers. At Commercial Bank, the flexibility of our operating model allowed us to mobilize quickly to work remotely during the lockdown period, assuring client service outcomes and ensuring minimal disruption to the business.
Digitalization accelerated during COVID-19 restrictionsThe COVID-19 related restrictions such as closure of malls, restaurants, exchange houses, and branches led to a spike in digital transactions. Biometric registrations increased by 35% and active digital users increased by 16% during the period. The trend of using mobile phones continued with mobile usage representing 90% of all digital transactions. Furthermore, the increase in digital activity is expected to be permanent with 80% of customers using more digital services and 70% expected to use branches less.
Management Review of Operations continued

53
The Digital payment market is changing rapidlyDigital solutions provide the customer with convenient, fast and efficient products and services, while allowing Commercial Bank to automate processing end-to-end. Globally, the market for digital payment solutions is evolving rapidly. Entrants such as mobile network operators, social networking and messaging companies like Facebook, WhatsApp, and Google have all launched their own digital wallets and payment transfer applications. At Commercial Bank, we are cognizant of market changes and opportunities and have assembled a world-class, agile technology capability with the ability to deliver digital innovation at speed.
Key components to the strategy include:
• A highly capable diverse team;
• An agile delivery process;
• Leveraging from an open architecture;
• Proactive adoption of global Fintech solutions;
• Enhanced data and analytics capability: This year’s client centric advancement in technology includes not only new products but also an increase in client engagement and client centricity;
• Enhanced personalization through the use of the new customer relationship management system, and improvement in booking systems and branch processes;
• CB Pay digital wallet, making Commercial Bank the first bank in Qatar to release a digital wallet;
• Household Paycard, granting many workers a remote digital access and allowing them to send remittances to their families during lockdown.
Investment in key infrastructure has provided the ability to scale and the flexibility to adapt to new technologiesThis year has seen investment in key infrastructure and upgrading of core applications which is an important enabler to provide customer centric digital solutions, including;
• Upgrade to data hardware giving ability to scale, flexibility, speed, and storage;
• Enhanced cybersecurity, protecting customer personal information;
• Capitalizing on data acquisition and management through data analytics and smart technologies (Artificial Intelligence & Algorithms);
• Core Banking Engine Upgrade, providing greater flexibility to interface with new applications;
• Customer Relation Management System Upgrade, which is a key system to drive customer sales, self-service and digitization;
• New Fraud detection system that leverages of smart technologies to detect fraudulent or suspicious transactions safeguarding customers assets.
Despite the everchanging landscape, be it from a pandemic, new entrants or changing technologies, Commercial Bank has strong flexible infrastructure and agile, innovative technology capability to remain dominant in transaction banking for years to come.
Leonie Ruth Lethbridge EGM, Chief Operating Officer

54
Internet Banking vs. Mobile Banking
Internet Mobile
56%
44%
2014
50% 50%
2015
43%
57%
2016
30%
70%
2017
17%
83%
2018
12%
88%
2019
10%
90%
2020
Biometric Registrations (in thousands)
2017 2018 2019 2020
25%
58%
35%
Registrations (in thousands) Y-o-Y increase
Management Review of Operations continued

55
Digital Active Users vs Mobile Users (in thousands)
RIB UsersMobile Users Y-o-Y increase
50%
33%13%
27%
17%
14%
16%
2013 2014 2015 2016 2017 2019 20202018

56
Management Review of Operations continued
Corporate Mobile Transactions
Jan Feb Mar Apr May Jun Jul Aug Sept Oct Nov Dec
2016 2017 2018 2019 2020
0
5000
10000
15000
20000
25000
30000
Corporate Mobile - easy to access accounts
Jan Feb Mar Apr May Jun Jul Aug Sept Oct Nov Dec
2016 2017 2018 2019 2020
0
6000
8000
4000
2000
10000
12000
14000
16000
18000
20000

57
AcknowledgementCommercial Bank’s successful business performance in 2020 has only been possible through the dedication and hard work of our valued employees and the leadership team. We are also extremely grateful for the ongoing support and guidance provided by the Chairman, Vice Chairman and Managing Director and Members of the Board. Under their leadership, we have continued to achieve growth and have maintained our reputation of being one of Qatar’s oldest and most successful banks for more than four decades.
In conclusion, we would like to express our sincere gratitude to His Highness Sheikh Tamim Bin Hamad Al Thani, Amir of the State of Qatar, for his visionary leadership of Qatar. We would also like to thank His Excellency the Prime Minister and Minister of the Interior, His Excellency the Minister of Finance, the Qatar Central Bank and the Ministry of Commerce and Industry for their continued guidance and support of the Bank throughout this past year.
The Qatar Central Bank, under the leadership of His Excellency the Governor Sheikh Abdullah Bin Saud Al Thani, has shown prudence with clear and consistent leadership of the banking industry enabling Qatar’s financial sector to prosper. We are very proud of our success over the years and are optimistic about what the future will bring for Commercial Bank and for Qatar.

58
Hand-in-hand we made it
possible to overcome
everything and achieve the
impossible.

59

60
Corporate Governance
COMMERCIAL BANK’S CORPORATE GOVERNANCE REFLECTS OUR COMMITMENT TO COMPLY WITH LOCAL REGULATIONS AND INTERNATIONALLY ACCEPTED STANDARDS INCLUDING TRANSPARENT DISCLOSURE FOR THE BEST INTERESTS OF OUR STAKEHOLDERS.
Effective governance is, at its core, simply about doing the right things for stakeholders. It is enabled by having the right checks and balances throughout the organization to ensure that the right things are always done. It comprises the processes and structures which affect the way an organization is directed, managed and monitored and its activities are reported, including: the elements of internal control, ethics, various risk functions, policies and procedures, internal audit, external audit and formal committees that promote greater transparency and facilitate efficient and effective management for the best interests of stakeholders.
The Board of Directors firmly believes that good corporate governance is fundamental in ensuring the proper management of Commercial Bank in the interests of all of our stakeholders. We recognise that the way we interact with stakeholders is key for the success of our business and the transparent disclosure of our governance assists investors in their investment decisions.
Corporate Governance developmentsFollowing the election of the Board of Directors at the AGM on 23 March 2020, the Board welcomed a newly elected Member, HE. Mr. Bader Omar Al Dafa, whose skills and experience are an asset to the Board and Commercial Bank. During 2020, we continued to enhance our corporate governance practices as the Bank’s business evolves and regulatory requirements change. Commercial Bank’s Corporate Governance Charter and Board Committees Charter were reviewed an updated for increased alignment with applicable regulation and changes to the Bank’s business. In response to QCB Circular No. 25 of 2020, the Board of Directors and senior management underwent a disclosure exercise regarding identification of any first-degree relatives with a direct or indirect interest with the Bank.
During 2020, we participated in two new digital initiatives: the XBRL-based reporting system covering financial statements and non-financial disclosures (a joint initiative of the Qatar Stock Exchange and QFMA); and the QCB’s F2F digital financial sector correspondence system. We also participated in the Qatar Stock Exchange’s voluntary Environment Social Governance (“ESG”) disclosure initiative and our MSCI ESG rating was upgraded to “A”.

61
The Board of Directors and Board Committees continued to operate as normal during lockdown restrictions as a result of COVID-19, with the Board fully embracing remote working technologies to allow for virtual meetings and the digital distribution and signature of documents
Corporate Governance frameworkThe Board understands that sound corporate governance principles and practices are fundamental to maintaining the trust of its stakeholders, which is also critical in business growth, sustainability and profitability.
The Board is committed to implement the corporate governance principles of justice, equality among stakeholders without discrimination, transparency and disclosure, while upholding the values of corporate social responsibility and acting in the public interest of Commercial Bank and stakeholders over their personal interests, as well as performing their duties, tasks and functions in good faith, integrity, honour and sincerity.
The implementation of these principles is driven by a qualified Board aided by a seasoned and experienced Executive Management team. The Board ensures that the Bank adheres to these corporate governance principles in its day-to-day activities at all times.
Refer to “Board of Directors” section in the Annual Corporate Governance Report for further information.
Commercial Bank’s Code of Conduct provides a clear statement of our conduct expectations and ethical values, supported by our conduct and ethics standards.
Refer to “Governance Framework” section in the Annual Corporate Governance Report for further information
Our governance includes a committee structure and a comprehensive set of corporate policies which are developed, reviewed and approved by the Board, the respective Board Committees, the Group CEO, CRO, and the board of directors of the Bank’s subsidiaries, in accordance with their respective responsibilities and levels of authority.
Refer to “Board of Directors” and “Board Committees” sections in the Annual Corporate Governance Report for further information.
62
Corporate Governance continued
The main rules, procedures and practical application of Commercial Bank’s governance are contained in the Bank’s Corporate Governance Charter, Board of Directors Charter and Board Committees Charter. These charters reflect Commercial Bank’s long-standing ethical governance practices and the regulatory requirements mandated by:
• guidelines and instructions issued by the Qatar Central Bank on 26 July 2015 by virtue of Circular No. 68/2015 (QCB Corporate Governance Guidelines);
• the Commercial Companies Law promulgated by Law No. 11 of 2015 (CCL); and
• the Governance Code for Companies and Legal Entities Listed on the Main Market issued by Qatar Financial Markets Authority pursuant to Decision No. 5 of 2016 (QFMA Corporate Governance Code).
These charters also follow the recommendations of international best practice for corporate governance developed by leading international frameworks.
Complying with rules and regulationsWe fully adhere to the principles set out in the QCB Corporate Governance Guidelines and to the provisions of the QFMA Corporate Governance Code as at 31 December 2020.
The detailed Annual Corporate Governance Report 2020 is an attachment to this Annual Report, forms an integral part of it, and is presented to shareholders for approval at the Bank’s AGM in 2021. The Annual Corporate Governance Report 2020 can also be viewed on Commercial Bank’s website at www.cbq.qa

63
Consolidated Financial Statements31 December 2020

64
Independent Auditor’s ReportTo the Shareholders of The Commercial Bank (P.S.Q.C.)
Report on the Audit of the Consolidated Financial Statements
OpinionWe have audited the consolidated financial statements of The Commercial Bank (P.S.Q.C.) (the “Bank”) and its subsidiaries (together referred to as the “Group”), which comprise the consolidated statement of financial position as at 31 December 2020, and the consolidated income statement, consolidated statement of comprehensive income, consolidated statement of changes in equity and consolidated statement of cash flows for the year then ended, and notes to the consolidated financial statements, including a summary of significant accounting policies.
In our opinion, the accompanying consolidated financial statements present fairly, in all material respects, the consolidated financial position of the Group as at 31 December 2020, and its consolidated financial performance and its consolidated cash flows for the year then ended in accordance with International Financial Reporting Standards (IFRSs) and the applicable provisions of Qatar Central Bank regulations.
Basis for opinionWe conducted our audit in accordance with International Standards on Auditing (ISAs). Our responsibilities under those standards are further described in the Auditor’s responsibilities for the audit of the consolidated financial statements section of our report. We are independent of the Group in accordance with the International Code of Ethics for Professional Accountants (including International Independence Standards) (IESBA Code) together with the ethical requirements that are relevant to our audit of the consolidated financial statements in the State of Qatar, and we have fulfilled our other ethical responsibilities in accordance with these requirements and the IESBA Code. We believe that the audit evidence we have obtained is sufficient and appropriate to provide a basis for our opinion.
Key audit mattersKey audit matters are those matters that, in our professional judgment, were of most significance in our audit of the consolidated financial statements of the current year. These matters where addressed in the context of our audit of the consolidated financial statements as a whole, and in forming our opinion thereon, and we do not provide a separate opinion on these matters. For each matter below, our description of how our audit addressed the matter is provided in that context.
We have fulfilled the responsibilities described in the Auditor’s responsibilities for the audit of the consolidated financial statements section of our report, including in relation to these matters. Accordingly, our audit included the performance of procedures designed to respond to our assessment of the risks of material misstatement of the consolidated financial statements. The results of our audit procedures, including the procedures performed to address the matters below, provide the basis for our audit opinion on the accompanying consolidated financial statements.

65
Report on the Audit of the Consolidated Financial Statements (continued)
Key audit matters (continued)
Key audit matter How our audit addressed the key audit matter
1. Impairment of loans and advances to customers
The process of estimating Expected Credit Losses (ECL) on credit risk associated with loans and advances in accordance with IFRS 9 Financial instruments (IFRS 9) involves complexity and significant judgement.
COVID-19 pandemic and the regulatory payment holidays associated with it have impacted the management determination of the ECL as they increased the level of uncertainty associated with the management judgement, which may result in outputs significantly different from the future credit losses and staging of the customers.
IFRS 9 requires use of the ECL model for the purposes of calculating impairment provision. Due to the complexity of requirements under IFRS 9, significance of judgements applied and the Group’s exposure to loans and advances forming a major portion of the Group’s assets, the audit of ECL for loans and advances is a key audit matter.
As at 31 December 2020, the Group’s gross loans and advances amounted to QR 100,008 million and the related allowances for impairment amounted to QR 4,397 million, comprising QR 1,521 million of ECL against Stage 1 and 2 exposures and QR 2,876 million against exposures classified under Stage 3.
The basis of calculation of ECL is presented in the summary of significant accounting policies and notes 4(b) and 10 to the consolidated financial statements.
Our audit approach included testing the controls associated with the relevant processes for estimating the ECL and performing substantive procedures on such estimates. We involved our internal specialist where their specific expertise was required. Our key audit procedures were as follows:
• We obtained understanding of the Group’s ECL policy and the design of the controls and tested the operating effectiveness of relevant controls and governance around it.
• We have checked the completeness of the data used as input for the ECL model and the mathematical accuracy through the model processes.
• We assessed:
• the Group’s ECL policy including the criteria of staging and significant increase in credit risk with the requirements of IFRS 9, considering the regulatory guidelines to address the COVID-19 pandemic;
• the Group’s forward-looking economic variables by comparing them on a sample basis against supporting evidences, where applicable;
• the reasonableness of changes made to the economic scenarios to reflect the effect of COVID-19; and
• the basis of determination of the management overlays considering the impact of the COVID-19 global pandemic against the requirements of the Group’s ECL policy and guidance issued by the regulator.
• For a sample of exposures, we performed procedures to evaluate:
• appropriateness of exposure at default, probability of default and loss given default in the calculation of ECL;
• timely identification of exposures with a significant increase in credit risk and appropriateness of the Group’s staging; and
• the ECL calculation.
66
Report on the Audit of the Consolidated Financial Statements (continued)
Key audit matters (continued)
Key audit matter How our audit addressed the key audit matter
1. Impairment of loans and advances to customers (continued)
• Assessed the impairment allowance for individually impaired loans and advances (stage 3) in accordance with IFRS 9.
• Assessing the adequacy of the Group’s disclosures in relation to IFRS 9 by reference to the requirements of the relevant financial reporting standards and QCB regulations.
2. Impairment of investments in associates
The determination of recoverable amounts of the Group’s investments in associates relies on management’s estimates of future cash flows and their judgment with respect to the associates’ performance. Due to the uncertainty of forecasting and discounting future cash flows, the level of management’s judgement involved and the significance of the Group’s investment in associates, this audit area is considered as a key audit matter.
As at 31 December 2020, the Group’s investment in associates amounted to QR 3,109 million. Refer to the significant accounting policies and note 12 to the consolidated financial statements.
Our audit procedures focused on the following key areas:
• We obtained the calculation of recoverable amounts of the Group’s investments in associates.
• With the assistance of our own specialists, we assessed the assumptions and compared the estimates used to externally available industry, economic and financial data and methodologies used by the management to determine the recoverable amount of the investments in associates.
• We assessed the forecasts of future cash flows prepared by management.
• Discussions with management on the performance of the associates and their future outlook.
Other informationOther information consists of the information included in the Group’s annual report (the “Annual Report”), other than the Group’s consolidated financial statements and our auditor’s report thereon. Management is responsible for the other information. The Group’s 2020 Annual Report is expected to be made available to us after the date of this auditor’s report. Our opinion on the consolidated financial statements does not cover the other information and we do not express any form of assurance conclusion thereon.
In connection with our audit of the consolidated financial statements, our responsibility is to read the other information and, in doing so, consider whether the other information is materially inconsistent with the consolidated financial statements or our knowledge obtained in the audit, or otherwise appears to be materially misstated.
Independent Auditor’s Report continued

67
Report on the Audit of the Consolidated Financial Statements (continued)
Responsibilities of the management and the Board of Directors for the consolidated financial statementsManagement is responsible for the preparation and fair presentation of the consolidated financial statements in accordance with IFRSs and the applicable provisions of Qatar Central Bank regulations, and for such internal control as the management determines is necessary to enable the preparation of the consolidated financial statements that are free from material misstatement, whether due to fraud or error.
In preparing the consolidated financial statements, management is responsible for assessing the Group’s ability to continue as a going concern, disclosing, as applicable, matters related to going concern and using the going concern basis of accounting unless management either intends to liquidate the Group or to cease operations, or has no realistic alternative but to do so.
The Board of Directors are responsible for overseeing the Group’s financial reporting process.
Auditor’s responsibilities for the audit of the consolidated financial statementsOur objectives are to obtain reasonable assurance about whether the consolidated financial statements as a whole are free from material misstatement, whether due to fraud or error, and to issue an auditor’s report that includes our opinion. Reasonable assurance is a high level of assurance, but is not guarantee that an audit conducted in accordance with ISAs will always detect a material misstatement when it exists. Misstatements can arise from fraud or error and considered material if, individually or in the aggregate, they could reasonably be expected to influence the economic decisions of user taken on the basis of these consolidated financial statements.
As part of an audit in accordance with ISAs, we exercise professional judgement and maintain professional skepticism throughout the audit. We also:
• Identify and assess the risk of material misstatement of the consolidated financial statements, whether due to fraud or error, design and perform audit procedures responsive to those risks, and obtain audit evidence that is sufficient and appropriate to provide a basis for our opinion. The risk of not detecting a material misstatement resulting from fraud is higher than for one resulting from error, as fraud may involve collusion, forgery, intentional omissions, misrepresentations, or override of internal control.
• Obtain an understanding of internal control relevant to the audit in order to design audit procedures that are appropriate in the circumstances, but not for the purpose of expressing an opinion on the effectiveness of the Group’s internal control.
• Evaluate the appropriateness of accounting policies used and reasonableness of accounting estimates and related disclosures made by management.
• Conclude on the appropriateness of management’s use of the going concern basis of accounting and, based on the audit evidence obtained, whether a material uncertainty exists related to events or conditions that may cast significant doubt on the Group’s ability to continue as a going concern. If we conclude that a material uncertainty exists, we are required to draw attention in auditor’s report to the related disclosures in the consolidated financial statements or, if such disclosure is inadequate, to modify our opinion. Our conclusions are based on the audit evidence obtained up to the date of our auditor’s report. However, future events or conditions may cause the Group to cease to continue as a going concern.
• Evaluate the overall presentation, structure and content of the consolidated financial statements, including the disclosures, and whether the consolidated financial statements represent the underlying transactions and events in a manner that achieves fair presentation.

68
Report on the Audit of the Consolidated Financial Statements (continued)
Auditor’s responsibilities for the audit of the consolidated financial statements (continued)• Obtain sufficient appropriate audit evidence regarding the financial information of the entities or business activities within
the Group to express an opinion on the consolidated financial statements. We are responsible for the direction, supervision and performance of the group audit. We remain solely responsible for our audit opinion.
We communicate with the Board of Directors regarding, among other matters, the planned scope and timing of the audit and significant audit findings, including any significant deficiencies in internal control that we identify during our audit.
We also provide the Board of Directors with a statement that we have complied with relevant ethical requirements regarding independence, and communicate with them all relationships and other matters that may reasonably be thought to bear on our independence, and where applicable, actions taken to eliminate threats or safeguards applied.
From the matters communicated with the Board of Directors, we determine those matters that were of most significance in the audit of the consolidated financial statements of the current year and are therefore the key audit matters. We describe these matters in our auditor’s report unless law or regulation precludes public disclosures about the matter or when, in extremely rare circumstances, we determine that a matter should not be communicated in our report because the adverse consequences of doing so would reasonably be expected to outweigh the public interest benefits of such communication.
Report on other legal and regulatory requirementsWe have obtained all the information and explanations, which we considered necessary for the purpose of our audit. We confirm that we are not aware of any contraventions by the Bank of its Articles of Association and the amendments thereto, the applicable provisions of Qatar Central Bank Law No. 13 of 2012 and of the Qatar Commercial Companies Law No. 11 of 2015, during the financial year that would have had a material adverse effect on the Group’s consolidated financial position or performance as at and for the year ended 31 December 2020.
Ahmed Sayedof Ernst & YoungQatar Auditors Registry Number 326
Doha - State of QatarDate: 15 February 2021
Independent Auditor’s Report continued

69
Consolidated Statement of Financial Position
QAR ‘000s
As at 31 December Notes 2020 2019
ASSETSCash and balances with central banks 8 8,278,537 6,075,044Due from banks 9 10,401,014 12,396,433Loans and advances to customers 10 96,698,098 88,009,448Investment securities 11 25,778,211 26,844,226Investment in associates and a joint arrangement 12 3,116,557 4,021,239Property and equipment 13 3,158,264 2,853,712Intangible assets 14 174,830 236,377Other assets 15 6,000,204 7,100,005TOTAL ASSETS 153,605,715 147,536,484
LIABILITIESDue to banks 16 20,006,985 22,530,782Customer deposits 17 75,789,543 76,296,592Debt securities 18 13,107,134 9,524,590Other borrowings 19 14,125,676 12,043,167Other liabilities 20 8,405,896 5,385,126TOTAL LIABILITIES 131,435,234 125,780,257
EQUITYShare capital 21 4,047,254 4,047,254Legal reserve 21 9,871,972 9,841,333General reserve 21 26,500 26,500Risk reserve 21 2,037,236 1,421,236Fair value reserve 21 1,000,301 600,094Treasury shares 21 - (38,860)Foreign currency translation reserve 21 (2,235,107) (1,946,677)Other reserves 21 557,273 859,893Revaluation reserve 21 1,287,569 1,283,920Retained earnings 1,577,474 1,661,524TOTAL EQUITY ATTRIBUTABLE TO EQUITY HOLDERS OF THE BANK 18,170,472 17,756,217Non-controlling interests 9 10Instruments eligible for additional capital 21 4,000,000 4,000,000TOTAL EQUITY 22,170,481 21,756,227TOTAL LIABILITIES AND EQUITY 153,605,715 147,536,484
The consolidated financial statements were approved by the Board of Directors on 27 January 2021 and were signed on its behalf by:
Sheikh Abdulla Bin Ali Bin Jabor Al Thani Mr. Omar Hussain Alfardan Mr. Joseph AbrahamChairman Managing Director Group Chief Executive Officer
The attached notes 1 to 39 form an integral part of these consolidated financial statements.

70
QAR ‘000s
For the year ended 31 December Notes 2020 2019
Interest income 24 5,671,377 6,795,410
Interest expense 25 (2,571,242) (3,832,227)
Net interest income 3,100,135 2,963,183
Fee and commission income 26 1,110,095 1,289,220
Fee and commission expense 27 (299,246) (374,374)
Net fee and commission income 810,849 914,846
Net foreign exchange gain 28 296,351 281,045
Net (loss) / income from investment securities 29 (23,447) 68,993
Other operating income 30 53,245 118,578
Net operating income 4,237,133 4,346,645
Staff costs 31 (632,599) (796,352)
Depreciation 13 (140,345) (149,994)
Amortization of intangible assets 14 (58,395) (55,023)
Net impairment (losses) / reversals on investment securities (32,041) 6,797
Net impairment losses on loans and advances to customers 10 (836,386) (594,427)
Net impairment losses on other financial assets (115,124) (66,108)
Impairment on investment in an associate (591,242) (413,881)
Other provisions (40,177) -
Other expenses 32 (265,038) (226,644)
Profit before share of results of associates and a joint arrangement 1,525,786 2,051,013
Share of results of associates and a joint arrangement 12 (210,006) (6,799)
Profit before tax 1,315,780 2,044,214
Income tax expense (14,566) (23,173)
Profit for the year 1,301,214 2,021,041
Attributable to:
Equity holders of the bank 1,301,213 2,021,040
Non-controlling interests 1 1
Profit for the year 1,301,214 2,021,041
Earnings per share
Basic/diluted earnings per share (QAR) 33 0.27 0.44
The attached notes 1 to 39 form an integral part of these consolidated financial statements.
Consolidated Statement of Income

71
QAR ‘000s
For the year ended 31 December Note 2020 2019
Profit for the year 1,301,214 2,021,041
Other comprehensive income for the year:
Items that are, or may be subsequently reclassified to profit or loss:
Foreign currency translation differences from foreign operation 22 (288,430) (129,811)Share of other comprehensive income of investment in associates and a joint arrangement 22 1,214 28,059
Net movement in cash flow hedges-effective portion of changes in fair value 22 59,634 9,053
Net change in fair value of investments in debt securities designated at FVOCI: 22
Net change in fair value 443,081 663,769
Net amount transferred to consolidated statement of income (3,519) (9,091)
Items that may not be subsequently reclassified to profit or loss:
Net change in fair value of equity investments designated at FVOCI 22 43,104 (34,072)
Foreign currency translation differences 22 (131,272) -Share of other comprehensive income of investment in associates and a joint arrangement 22 (12,035) (6,008)
Other comprehensive income for the year 111,777 521,899
Total comprehensive income for the year 1,412,991 2,542,940
Attributable to:
Equity holders of the bank 1,412,990 2,542,939
Non-controlling interests 1 1
Total comprehensive income for the year 1,412,991 2,542,940
The attached notes 1 to 39 form an integral part of these consolidated financial statements.
Consolidated Statement of Comprehensive Income

72
QAR ‘000s
For the year ended 31 December 2020 NotesShare
capitalLegal
reserveGeneral reserve
Risk reserve
Fair value reserve
Treasury shares
Foreign currency
translation reserve
Other reserves
Revaluation reserve
Retained earnings
Total equity attributable
to equity holders of
the Bank
Non-controlling
interests
Instruments eligible for additional
capital Total equity
Balance as at 1 January 2020 4,047,254 9,841,333 26,500 1,421,236 600,094 (38,860) (1,946,677) 859,893 1,283,920 1,661,524 17,756,217 10 4,000,000 21,756,227
Profit for the year - - - - - - - - - 1,301,213 1,301,213 1 - 1,301,214
Other comprehensive income 21 - - - - 400,207 - (288,430) - - - 111,777 - - 111,777
Total comprehensive income for the year - - - - 400,207 - (288,430) - - 1,301,213 1,412,990 1 - 1,412,991
Transfer to legal reserve 21 - 6,717 - - - - - - - (6,717) - - - -
Transfer to risk reserve - - - 616,000 - - - - - (616,000) - - - -
FVOCI instrument loss transferred to Retained earnings
21 - - - - - - - - - - - - - -
Dividend for instruments eligible for additional capital
21 - - - - - - - - - (223,000) (223,000) - - (223,000)
Net movement in revaluation and other reserves
- - - - - - - (302,620) 3,649 302,620 3,649 - - 3,649
Provision for Sports and Social Activities Support Fund
23 - - - - - - - - - (32,530) (32,530) - - (32,530)
Movement in treasury shares 21 - 23,922 - - - 38,860 - - - - 62,782 - - 62,782
Tax Adjustment - - - - - - - - - (185) (185) - - (185)
Transactions with equity holders, recognised directly in equity
Contributions by and distributions to equity holders of the bank:
Dividends for the year 2019 21 - - - - - - - - - (809,451) (809,451) - - (809,451)
Total contributions by and distributions to equity holders of the bank
- - - - - - - - - (809,451) (809,451) - - (809,451)
Net movement in non-controlling interests - - - - - - - - - - - (2) - (2)
Balance as at 31 December 2020 4,047,254 9,871,972 26,500 2,037,236 1,000,301 - (2,235,107) 557,273 1,287,569 1,577,474 18,170,472 9 4,000,000 22,170,481
The attached notes 1 to 39 form an integral part of these consolidated financial statements.
Consolidated Statement of Changes in Equity
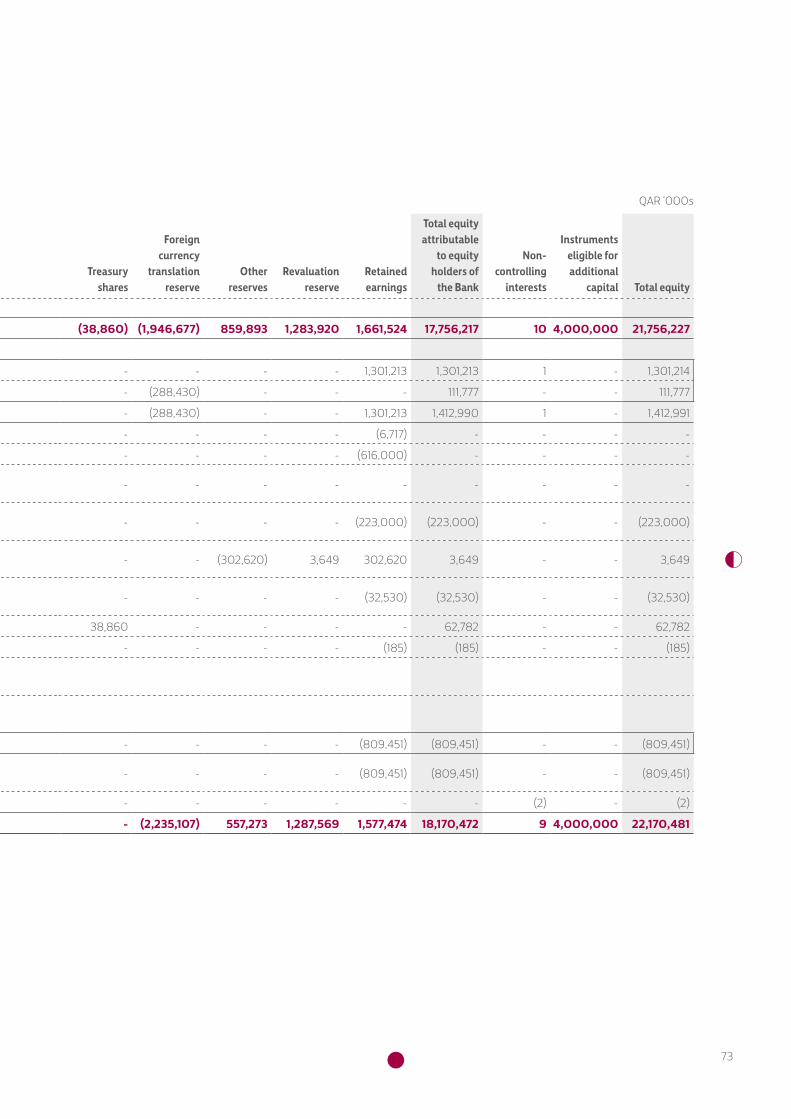
73
QAR ‘000s
For the year ended 31 December 2020 NotesShare
capitalLegal
reserveGeneral reserve
Risk reserve
Fair value reserve
Treasury shares
Foreign currency
translation reserve
Other reserves
Revaluation reserve
Retained earnings
Total equity attributable
to equity holders of
the Bank
Non-controlling
interests
Instruments eligible for additional
capital Total equity
Balance as at 1 January 2020 4,047,254 9,841,333 26,500 1,421,236 600,094 (38,860) (1,946,677) 859,893 1,283,920 1,661,524 17,756,217 10 4,000,000 21,756,227
Profit for the year - - - - - - - - - 1,301,213 1,301,213 1 - 1,301,214
Other comprehensive income 21 - - - - 400,207 - (288,430) - - - 111,777 - - 111,777
Total comprehensive income for the year - - - - 400,207 - (288,430) - - 1,301,213 1,412,990 1 - 1,412,991
Transfer to legal reserve 21 - 6,717 - - - - - - - (6,717) - - - -
Transfer to risk reserve - - - 616,000 - - - - - (616,000) - - - -
FVOCI instrument loss transferred to Retained earnings
21 - - - - - - - - - - - - - -
Dividend for instruments eligible for additional capital
21 - - - - - - - - - (223,000) (223,000) - - (223,000)
Net movement in revaluation and other reserves
- - - - - - - (302,620) 3,649 302,620 3,649 - - 3,649
Provision for Sports and Social Activities Support Fund
23 - - - - - - - - - (32,530) (32,530) - - (32,530)
Movement in treasury shares 21 - 23,922 - - - 38,860 - - - - 62,782 - - 62,782
Tax Adjustment - - - - - - - - - (185) (185) - - (185)
Transactions with equity holders, recognised directly in equity
Contributions by and distributions to equity holders of the bank:
Dividends for the year 2019 21 - - - - - - - - - (809,451) (809,451) - - (809,451)
Total contributions by and distributions to equity holders of the bank
- - - - - - - - - (809,451) (809,451) - - (809,451)
Net movement in non-controlling interests - - - - - - - - - - - (2) - (2)
Balance as at 31 December 2020 4,047,254 9,871,972 26,500 2,037,236 1,000,301 - (2,235,107) 557,273 1,287,569 1,577,474 18,170,472 9 4,000,000 22,170,481
The attached notes 1 to 39 form an integral part of these consolidated financial statements.

74
QAR ‘000s
For the year ended 31 December 2019 NotesShare
capitalLegal
reserveGeneral reserve
Risk reserve
Fair value reserve
Treasury shares
Foreign currency
translation reserve
Other reserves
Revaluation reserve
Retained earnings
Total equity attributable to equity holders
of the Bank
Non-controlling
interests
Instruments eligible for additional
capital Total equity
Balance as at 1 January 2019 4,047,254 9,745,152 26,500 886,151 (96,333) (179,507) (1,816,866) 959,764 1,283,920 1,000,413 15,856,448 11 4,000,000 19,856,459
Profit for the year - - - - - - - - - 2,021,040 2,021,040 1 - 2,021,041
Other comprehensive income 21 - - - - 651,710 - (129,811) - - - 521,899 - - 521,899
Total comprehensive income for the year - - - - 651,710 - (129,811) - - 2,021,040 2,542,939 1 - 2,542,940
Transfer to legal reserve 21 - 8,803 - - - - - - - (8,803) - - - -
Transfer to risk reserve - - - 535,085 - - - - - (525,000) 10,085 - - 10,085
FVOCI instrument loss transferred to Retained earnings
21 - - - - 44,717 - - - - (44,717) - - - -
Dividend for Instruments eligible for additional capital
21 - - - - - - - - - (240,000) (240,000) - - (240,000)
Net movement in other reserve - - - - - - - (99,871) - 99,871 - - - -
Provision for Sports and Social Activities Support Fund
23 - - - - - - - - - (50,526) (50,526) - - (50,526)
Movement in treasury shares 21 - 87,378 - - - 140,647 - - - 16,334 244,359 - - 244,359
Transactions with equity holders, recognised directly in equity
Contributions by and distributions to equity holders of the bank:
Dividends for the year 2018 21 - - - - - - - - - (607,088) (607,088) - - (607,088)
Total contributions by and distributions to equity holders of the bank
- - - - - - - - - (607,088) (607,088) - - (607,088)
Net movement in non-controlling interests - - - - - - - - - - - (2) - (2)
Balance as at 31 December 2019 4,047,254 9,841,333 26,500 1,421,236 600,094 (38,860) (1,946,677) 859,893 1,283,920 1,661,524 17,756,217 10 4,000,000 21,756,227
The attached notes 1 to 39 form an integral part of these consolidated financial statements.
Consolidated Statement of Changes in Equity continued

75
QAR ‘000s
For the year ended 31 December 2019 NotesShare
capitalLegal
reserveGeneral reserve
Risk reserve
Fair value reserve
Treasury shares
Foreign currency
translation reserve
Other reserves
Revaluation reserve
Retained earnings
Total equity attributable to equity holders
of the Bank
Non-controlling
interests
Instruments eligible for additional
capital Total equity
Balance as at 1 January 2019 4,047,254 9,745,152 26,500 886,151 (96,333) (179,507) (1,816,866) 959,764 1,283,920 1,000,413 15,856,448 11 4,000,000 19,856,459
Profit for the year - - - - - - - - - 2,021,040 2,021,040 1 - 2,021,041
Other comprehensive income 21 - - - - 651,710 - (129,811) - - - 521,899 - - 521,899
Total comprehensive income for the year - - - - 651,710 - (129,811) - - 2,021,040 2,542,939 1 - 2,542,940
Transfer to legal reserve 21 - 8,803 - - - - - - - (8,803) - - - -
Transfer to risk reserve - - - 535,085 - - - - - (525,000) 10,085 - - 10,085
FVOCI instrument loss transferred to Retained earnings
21 - - - - 44,717 - - - - (44,717) - - - -
Dividend for Instruments eligible for additional capital
21 - - - - - - - - - (240,000) (240,000) - - (240,000)
Net movement in other reserve - - - - - - - (99,871) - 99,871 - - - -
Provision for Sports and Social Activities Support Fund
23 - - - - - - - - - (50,526) (50,526) - - (50,526)
Movement in treasury shares 21 - 87,378 - - - 140,647 - - - 16,334 244,359 - - 244,359
Transactions with equity holders, recognised directly in equity
Contributions by and distributions to equity holders of the bank:
Dividends for the year 2018 21 - - - - - - - - - (607,088) (607,088) - - (607,088)
Total contributions by and distributions to equity holders of the bank
- - - - - - - - - (607,088) (607,088) - - (607,088)
Net movement in non-controlling interests - - - - - - - - - - - (2) - (2)
Balance as at 31 December 2019 4,047,254 9,841,333 26,500 1,421,236 600,094 (38,860) (1,946,677) 859,893 1,283,920 1,661,524 17,756,217 10 4,000,000 21,756,227
The attached notes 1 to 39 form an integral part of these consolidated financial statements.

76
QAR ‘000s
For the year ended 31 December Notes 2020 2019
Cash flows from operating activities
Profit before tax 1,315,780 2,044,214
Adjustments for:
Net impairment losses on loans and advances to customers 836,386 594,427
Net impairment losses / (reversal) on investment securities 32,041 (6,797)
Net impairment losses on other financial assets 115,124 66,108
Depreciation 13 140,345 149,994
Amortization of intangible assets and transaction costs 87,904 90,926
Gain on sale of treasury shares (23,922) (87,378)
Net loss / (income) from investment securities 29 27,111 (64,642)
Other provisions 40,177 -
Gain on disposal of property and equipment - 3,902
Impairment on investment in an associate 591,242 413,881
Share of results of associates and a joint arrangement 210,006 6,799
Operating profit before working capital changes 3,372,194 3,211,434
Working capital changes
Change in due from banks 213,462 (3,845,259)
Change in loans and advances to customers (11,710,184) (5,821,742)
Change in other assets 1,016,089 (2,341,566)
Change in due to banks (2,635,334) 10,167,792
Change in customer deposits 1,430,497 5,702,956
Change in other liabilities 2,745,022 490,037
Contribution to social and sports fund (50,526) (41,580)
Net cash flows (used in) / from operating activities (5,618,780) 7,522,072
Cash flows from investing activities
Acquisition of investment securities (4,725,866) (8,620,481)
Proceeds from sale of treasury shares 62,782 228,025
Dividend received from associates and a joint arrangement 12 92,614 93,072
Proceeds from sale/maturity of investment securities 5,567,499 4,255,059
Acquisition of property and equipment and intangible assets 14&15 (125,311) (157,359)
Proceeds from the sale of property and equipment and other assets 150 6,801
Net cash flows from / (used in) investing activities 871,868 (4,194,883)
The attached notes 1 to 39 form an integral part of these consolidated financial statements.
Consolidated Statement of Cash Flows

77
The attached notes 1 to 39 form an integral part of these consolidated financial statements.
QAR ‘000s
For the year ended 31 December Notes 2020 2019
Cash flows from financing activities
Proceeds from issue of debt securities 18 5,452,640 3,486,978
Repayment of debt securities 18 (2,157,982) (9,932,780)
Repayment of other borrowings 19 (6,073,532) (3,735,723)
Proceeds from other borrowings 19 8,922,233 7,793,321
Payment of Lease Liability (34,074) (39,499)
Payment on Coupon of instrument eligible for additional Tier 1 Capital (223,000) (240,000)
Dividends paid (809,451) (607,088)
Net cash flows from / (used in) financing activities 5,076,834 (3,274,791)
Net increase in cash and cash equivalents 329,922 52,398
Effect of exchange rate fluctuation 136,073 19,027
Cash and cash equivalents as at 1 January 10,055,971 9,984,546
Cash and cash equivalents at the end of the year 35 10,521,966 10,055,971
Net cash flows from interest and dividend from operating activities:
Interest paid 2,808,966 3,829,417
Interest received 5,355,351 6,916,197
Dividend received 3,664 4,350
Consolidated Statement of Cash Flows continued

78
1. REPORTING ENTITY The Commercial Bank (P.S.Q.C.) (the “Bank”) is an entity domiciled in the State of Qatar and was incorporated in 1974 as a
public shareholding company under Emiri Decree No.73 of 1974. The commercial registration number of the Bank is 150. The address of the Bank’s registered office is PO Box 3232, Doha, State of Qatar. The consolidated financial statements of the Bank comprise the Bank and its subsidiaries (together referred to as the “Group”). The Group is primarily engaged in conventional banking, brokerage services and the credit card business and operates through its head office, branches and subsidiaries.
The principal subsidiaries of the Group are as follows:
Name of subsidiary Country of incorporation
Capital of the subsidiary
Activity of the subsidiary
Percentage of ownership
2020 2019
Alternatifbank A.S. Turkey TRY 2,038,390,000 Banking services 100% 100%
Commercial Bank Financial Services L.L.C.
Qatar QAR 100,000,000 Brokerage services
100% 100%
CBQ Finance Limited Bermuda US$ 1,000 Debt issuance for the Bank
100% 100%
2. BASIS OF PREPARATION
(a) Statement of compliance The consolidated financial statements have been prepared in accordance with International Financial Reporting Standards
(“IFRS”) issued by the International Accounting Standards Board (“IASB”) and the applicable provisions of the Qatar Central Bank (“QCB”) regulations.
The Group presents its consolidated statement of financial position broadly in the order of liquidity. An analysis regarding recovery or settlement of assets/liabilities within twelve months after the end of the reporting date (“current”) and more than twelve months after the reporting date (“non-current”) is presented in Note 4(c) (iii).
(b) Basis of measurement The consolidated financial statements have been prepared on the historical cost basis except for the following assets and
liabilities that are measured at fair value:
• derivative financial instruments; • investments measured at fair value through profit or loss (‘FVTPL’); • other financial assets designated at fair value through profit or loss (‘FVTPL’); • financial investment measured at fair value through other comprehensive income (‘FVOCI’); • land and buildings; and • the carrying values of recognized assets and liabilities that are hedged items in quantifying fair value hedges, and
otherwise carried at amortized cost, are adjusted to record changes in fair value attributable to the risks that are being hedged.
Notes to the Consolidated Financial StatementsAs at and for the year ended 31 December 2020 QAR ‘000s

79
Notes to the Consolidated Financial Statements continuedAs at and for the year ended 31 December 2020 QAR ‘000s
2. BASIS OF PREPARATION (continued)
(c) Functional and presentation currency These consolidated financial statements are presented in Qatari Riyals (“QAR”), which is the Bank’s functional and
presentation currency. Except as otherwise indicated, financial information presented in QAR has been rounded to the nearest thousand.
(d) Use of estimates and judgments The preparation of the consolidated financial statements in conformity with IFRS and QCB regulations requires management
to make judgements, estimates and assumptions that affect the application of accounting policies and the reported amounts of assets, liabilities, income and expenses. Actual results may differ from these estimates.
Estimates and underlying assumptions are reviewed on an ongoing basis. Revisions to accounting estimates are recognized in the period in which the estimate is revised and in any future periods affected.
Information about significant areas of estimation uncertainty and critical judgements in applying accounting policies that have the most significant effect on the amounts recognized in the consolidated financial statements are described in Note 5.
3. SIGNIFICANT ACCOUNTING POLICIES The accounting policies set out below have been applied consistently to all periods presented in these consolidated
financial statements, and have been applied consistently by the Group entities.
(a) New standards, amendments and interpretations
New standards, amendments and interpretations effective from 1 January 2020 The following standards, amendments and interpretations, which became effective as of 1 January 2020, are relevant to
the Group:
Amendments to References to Conceptual Framework in IFRS Standards 1 January 2020 Definition of Material (Amendments to IAS 1 and IAS 8) 1 January 2020 Definition of a Business (Amendments to IFRS 3) 1 January 2020 Interest Rate Benchmark Reform - Phase 1 (Amendments to IFRS 9, IAS 39 and IFRS 7) 1 January 2020
Standards issued but not yet effective A number of standards and amendments to standards are issued but not yet effective and the Group has not adopted
these in the preparation of these consolidated financial statements. The below standards may have a significant impact on the Group’s consolidated financial statements, however, the Group is currently evaluating the impact of these new standards. The Group will adopt these new standards on the respective effective dates.
COVID-19-Related Rent Concessions (Amendment to IFRS 16) 1 January 2021 Interest Rate Benchmark Reform – Phase 2 (Amendments to IFRS 4, IFRS 7, IFRS 9, IFRS 16 and IAS 39) 1 January 2021 Onerous Contracts – Cost of Fulfilling a Contract (Amendments to IAS 37) 1 January 2022 Annual Improvements to IFRS Standards 2018 – 2020 1 January 2022 Property, Plant and Equipment: Proceeds before Intended Use (Amendments to IAS 16) 1 January 2022 Reference to the Conceptual Framework (Amendments to IFRS 3) 1 January 2022 Classification of Liabilities as Current or Non-current (Amendments to IAS 1) 1 January 2023 IFRS 17 Insurance Contracts and amendments to IFRS 17 Insurance Contracts 1 January 2023

80
Notes to the Consolidated Financial Statements continuedAs at and for the year ended 31 December 2020 QAR ‘000s
3. SIGNIFICANT ACCOUNTING POLICIES (continued)
(b) Basis of consolidation
(i) Business combination The Group applies the acquisition method to account for business combinations. The consideration transferred for
the acquisition of a subsidiary is the fair value of the assets transferred, the liabilities incurred to the former owners of the acquiree and the equity interests issued by the Group. The consideration transferred includes the fair value of any asset or liability resulting from a contingent consideration arrangement. Identifiable assets acquired and liabilities and contingent liabilities assumed in a business combination are measured initially at their fair values at the acquisition date.
If the business combination is achieved in stages, the acquisition date carrying value of the acquirer’s previously held equity interest in the acquiree is re-measured to fair value at the acquisition date; any gains or losses arising from such re-measurement are recognised in profit or loss.
Any contingent consideration to be transferred by the Group is recognised at fair value at the acquisition date. Subsequent changes to the fair value of the contingent consideration that is deemed to be an asset or liability is recognised in accordance with IFRS 9 either in profit or loss or as a change to other comprehensive income. Contingent consideration that is classified as equity is not re-measured, and its subsequent settlement is accounted for within equity.
The excess of the consideration transferred of any non-controlling interest and the acquisition-date fair value of any previous equity interest over the fair value of the identifiable net assets acquired is recorded as goodwill. If the total of consideration transferred, non-controlling interest recognised and previously held interest measured is less than the fair value of the net assets of the subsidiary acquired in the case of a bargain purchase, the difference is recognised directly in the statement of income.
Transaction costs are expensed as incurred, except if they are related to the issue of debt or equity securities.
(ii) Non-controlling interests (NCI) In accordance with IFRS 3R, for each business combination, the acquirer can measure, at the acquisition date,
components of NCI in the acquired business that represent ownership interests and entitle its holders to a proportionate share of the entity’s net assets in the event of liquidation at either:
(a) fair value on the acquisition date; or (b) the present ownership instruments’ proportionate share in the recognised amounts of the acquiree’s identifiable
net assets.
NCI is measured only on initial recognition. The Group measures the NCI at fair value, including its share of goodwill.
(iii) Subsidiaries Subsidiaries are entities controlled by the Group. The Group ‘controls’ an investee if it is exposed to, or has rights to,
variable returns from its involvement with the investee and has the ability to affect those returns through its power over the investee. The financial statements of subsidiaries are included in the consolidated financial statements from the date on which control commences until the date when control ceases.
The accounting policies of subsidiaries are consistent with the accounting policies adopted by the Group.

81
Notes to the Consolidated Financial Statements continuedAs at and for the year ended 31 December 2020 QAR ‘000s
3. SIGNIFICANT ACCOUNTING POLICIES (continued)
(b) Basis of consolidation (continued)
(iv) Transactions eliminated on consolidation Intra-group balances, and income and expenses arising from intra-group transactions, are eliminated in preparing
the consolidated financial statements.
(v) Associates and joint arrangements Associates and joint arrangements are entities over which the Group has significant influence but not control,
generally accompanying a shareholding of between 20% and 50% of the voting rights.
Investments in associates and joint arrangements are accounted for by the equity method of accounting and are initially recognised at cost (including transaction costs directly related to acquisition of investment in associates and joint arrangement). The Group’s investment in associates and joint arrangements includes goodwill (net of any accumulated impairment loss) identified on acquisition.
The Group’s share of its associates’ and joint arrangement’s post-acquisition profits or losses is recognised in the consolidated income statement; its share of post-acquisition reserve movements is recognised in reserves. The cumulative post-acquisition movements are adjusted against the carrying amount of the investment. When the Group’s share of losses in an associates and joint arrangements equals or exceeds its interest in the associates and joint arrangements, including any other unsecured receivables, the Group does not recognise further losses, unless it has incurred obligations or made payments on behalf of the associates and joint arrangement.
The Bank performs impairment assessment of investment in associates on an annual basis, or changes in circumstances indicate a potential impairment. Impairment testing involves calculating the value in use (VIU) by estimating the present values of future cash flows based on management’s estimates of future earnings available to ordinary shareholders and observable market inputs. Where the carrying amount exceeds the VIU, an impairment would be recognized in the statement of income and the carrying amount will be reduced.
Intergroup gains on transactions between the Group and its associates and joint arrangement are eliminated to the extent of the Group’s interest in the associates and joint arrangements. Intergroup losses are also eliminated unless the transaction provides evidence of an impairment of the asset transferred.
Associates’ financial statements are being prepared using similar accounting policies and period end as the parent.
(vi) Funds management The Group manages and administers assets held in unit trusts and other investment vehicles on behalf of investors.
The financial statements of these entities are not included in these consolidated financial statements except when the Group controls the entity. Information about the Group’s funds management is set out in Note 37.
82
Notes to the Consolidated Financial Statements continuedAs at and for the year ended 31 December 2020 QAR ‘000s
3. SIGNIFICANT ACCOUNTING POLICIES (continued)
(c) Foreign currency
(i) Foreign currency transactions and balances Foreign currency transactions that require settlement in a foreign currency are translated into the respective
functional currencies of the operations at the spot exchange rates at the date of the transactions.
Monetary assets and liabilities denominated in foreign currencies at the reporting date are translated into the functional currency at the spot exchange rate at that date. Non-monetary assets and liabilities denominated in foreign currencies that are measured at fair value are retranslated into the functional currency at the spot exchange rate at the date that the fair value was determined. Non-monetary assets and liabilities that are measured in terms of historical cost in a foreign currency are translated using the exchange rate at the date of the transaction.
Foreign currency differences resulting from the settlement of foreign currency transactions and arising on translation at period end exchange rates of monetary assets and liabilities denominated in foreign currencies are recognised in profit or loss.
(ii) Foreign operations The results and financial position of all the Group’s entities that have a functional currency different from the
presentation currency are translated into the presentation currency as follows:
- Assets and liabilities for each statement of financial position presented are translated at the closing rate at the reporting date;
- Income and expenses for each income statement are translated at average exchange rates (unless this average is not a reasonable approximation of the cumulative effect of the rates prevailing on the transaction dates, in which case income and expenses are translated at the dates of the transactions); and
- All resulting exchange differences are recognised in other comprehensive income.
Exchange differences arising from the above process are reported in equity and NCI as ‘foreign currency translation reserve’.
When the Group has any foreign operation that is disposed of, or partially disposed of, such exchange differences are recognised in the consolidated income statement as part of the gain or loss on sale. Goodwill and fair value adjustments arising on the acquisition of a foreign entity are treated as assets and liabilities of the foreign entity and translated at the closing rate.
When the settlement of a monetary item receivable from or payable to a foreign operation is neither planned nor likely in the foreseeable future, foreign exchange gains and losses arising from such a monetary item are considered to form part of the net investment in the foreign operation and are recognised in other comprehensive income, and presented in the foreign exchange translation reserve in equity.
(d) Financial assets and financial liabilities
(i) Recognition and initial measurement The Group initially recognises loans and advances to customers, due from / to banks, customer deposits, debt
securities and other borrowings on the date at which they are originated. All other financial assets and liabilities are initially recognised on the trade date at which the Group becomes a party to the contractual provisions of the instrument.
83
Notes to the Consolidated Financial Statements continuedAs at and for the year ended 31 December 2020 QAR ‘000s
3. SIGNIFICANT ACCOUNTING POLICIES (continued)
(d) Financial assets and financial liabilities (continued)
(ii) Classification
Financial assets On initial recognition, a financial asset is classified as measured at: amortised cost, FVOCI or FVTPL.
A financial asset is measured at amortised cost if it meets both of the following conditions and is not designated as at FVTPL:
• The asset is held within a business model whose objective is to hold assets to collect contractual cash flows; and • The contractual terms of the financial asset give rise on specified dates to cash flows that are solely payments of
principal and interest on the principal amount outstanding.
A debt instrument is measured at FVOCI only if it meets both of the following conditions and is not designated as at FVTPL:
• The asset is held within a business model whose objective is achieved by both collecting contractual cash flows and selling financial assets; and
• The contractual terms of the financial asset give rise on specified dates to cash flows that are solely payments of principal and interest on the principal amount outstanding.
On initial recognition of an equity investment that is not held for trading, the Group may irrevocably elect to present subsequent changes in fair value in OCI. This election is made on an investment-by-investment basis.
All other financial assets are classified as measured at FVTPL.
In addition, on initial recognition, the Group may irrevocably designate a financial asset that otherwise meets the requirements to be measured at amortised cost or at FVOCI or at FVTPL if doing so eliminates or significantly reduces an accounting mismatch that would otherwise arise.
Business model assessment The Group makes an assessment of the objective of a business model in which an asset is held at a portfolio level
because this best reflects the way the business is managed and information is provided to management. The information considered includes:
• The stated policies and objectives for the portfolio and the operation of those policies in practice. • How the performance of the portfolio is evaluated and reported to the Group’s management; • The risks that affect the performance of the business model (and the financial assets held within that business
model) and how those risks are managed; • How managers of the business are compensated.
The frequency, volume and timing of sales in prior periods, the reasons for such sales and its expectations about future sales activity.

84
Notes to the Consolidated Financial Statements continuedAs at and for the year ended 31 December 2020 QAR ‘000s
3. SIGNIFICANT ACCOUNTING POLICIES (continued)
(d) Financial assets and financial liabilities (continued)
(ii) Classification (continued) Financial assets that are held for trading or managed and whose performance is evaluated on a fair value basis are
measured at FVTPL because they are neither held to collect contractual cash flows nor held both to collect contractual cash flows and to sell financial assets.
Assessment whether contractual cash flows are solely payments of principal and interest For the purposes of this assessment, ‘principal’ is defined as the fair value of the financial asset on initial recognition.
‘Interest’ is defined as consideration for the time value of money and for the credit risk associated with the principal amount outstanding during a particular period of time and for other basic lending risks and costs (e.g. liquidity risk and administrative costs), as well as profit margin.
In assessing whether the contractual cash flows are solely payments of principal and interest (“the SPPI test”), the Group considers the contractual terms of the instrument. This includes assessing whether the financial asset contains a contractual term that could change the timing or amount of contractual cash flows such that it would not meet this condition. In making the assessment, the Group considers contingent events that would change the amount and timing of cash flows, prepayment and extension terms, terms that limit the Group’s claim to cash flows from specified assets and features that modify consideration of the time value of money.
Reclassifications Financial assets are not reclassified subsequent to their initial recognition, except in the period after the Group
changes its business model for managing financial assets. The reclassification takes place from the start of the first reporting period following the change.
Financial liabilities The Group has classified and measured its financial liabilities at amortized cost.
(iii) Derecognition The Group derecognises a financial asset when the contractual rights to the cash flows from the financial asset expire,
or when it transfers the financial asset in a transaction in which substantially all the risks and rewards of ownership of the financial asset are transferred or in which the Group neither transfers nor retains substantially all the risks and rewards of ownership and it does not retain control of the financial asset. Any interest in transferred financial assets that qualify for derecognition that is created or retained by the Group is recognised as a separate asset or liability. On derecognition of a financial asset, the difference between the carrying amount of the asset (or the carrying amount allocated to the portion of the asset transferred), and consideration received (including any new asset obtained less any new liability assumed) is recognised in profit or loss.
Any cumulative gain/loss recognised in OCI in respect of equity investment securities designated as at FVOCI is not recognised in the consolidated income statement on derecognition of such securities.
85
Notes to the Consolidated Financial Statements continuedAs at and for the year ended 31 December 2020 QAR ‘000s
3. SIGNIFICANT ACCOUNTING POLICIES (continued)
(d) Financial assets and financial liabilities (continued)
(iii) Derecognition (continued)
A financial asset (in whole or in part) is derecognised where:
- the rights to receive cash flows from the asset have expired; - the Group has transferred its rights to receive cash flows from the asset or has assumed an obligation to pay the
received cash flows in full without material delay to a third party under a ‘pass-through’ arrangement; and either (a) the Group has transferred substantially all the risks and rewards of ownership or (b) when it has neither transferred or retained substantially all the risks and rewards and when it no longer has control over the financial asset, but has transferred control of the asset.
The Group enters into transactions whereby it transfers assets recognised, but retains either all or substantially all of the risks and rewards of the transferred assets or a portion of them. If all or substantially all risks and rewards are retained, then the transferred assets are not derecognised. Transfers of assets with retention of all or substantially all risks and rewards include, for example, securities lending and repurchase transactions.
The Group derecognises a financial liability when its contractual obligations are discharged, cancelled or expired.
(iv) Modification of financial assets and liabilities
Financial Assets If the terms of a financial asset are modified, the Group evaluates whether the cash flows of the modified asset are
substantially different. If the cash flows are substantially different, then the contractual rights to cash flows from the original financial asset are deemed to have expired. In this case, the original financial asset is derecognised and a new financial asset is recognised at fair value, and recalculates a new effective interest rate for the asset. The date of renegotiation is consequently considered to be the date of initial recognition for impairment calculation purpose, including for the purpose of determining whether a significant increase in credit risk has occurred.
If the cash flows of the modified asset carried at amortised cost are not substantially different, then the modification does not result in derecognition of the financial asset. In this case, the Group recalculates the gross carrying amount of the financial asset based on the revised cash flows of the financial assets and recognises the amount arising from adjusting the gross carrying amount as a modification gain or loss in the consolidated income statement. If such a modification is carried out because of financial difficulties of the borrower, then the gain or loss is presented together with impairment losses. In other cases, it is presented as interest income.
Financial Liabilities The Group derecognises a financial liability when its terms are modified and the cash flows of the modified liability are
substantially different. In this case, a new financial liability based on the modified terms is recognised at fair value. The difference between the carrying amount of the financial liability extinguished and the new financial liability with modified terms is recognised in the consolidated income statement.

86
Notes to the Consolidated Financial Statements continuedAs at and for the year ended 31 December 2020 QAR ‘000s
3. SIGNIFICANT ACCOUNTING POLICIES (continued)
(d) Financial assets and financial liabilities (continued)
(v) Offsetting Financial assets and liabilities are offset and the net amount presented in the consolidated statement of financial
position when, and only when, the Group has a legal right to set off the recognised amounts and it intends either to settle on a net basis or to realise the asset and settle the liability simultaneously.
Income and expenses are presented on a net basis only when permitted under IFRS, or for gains and losses arising from a group of similar transactions such as in the Group’s trading activity.
(vi) Measurement principles
• Amortized cost measurement The amortised cost of a financial asset or liability is the amount at which the financial asset or liability is measured
at initial recognition, minus principal repayments, plus or minus the cumulative amortisation using the effective interest method of any difference between the initial amount recognised and the maturity amount, minus any reduction for impairment loss. The calculation of effective interest rate includes all fees paid or received that are an integral part of the effective interest rate (EIR).
• Fair value measurement ‘Fair value’ is the price that would be received to sell an asset or paid to transfer a liability in an orderly transaction
between market participants at the measurement date in the principal or, in its absence, the most advantageous market to which the Group has access at that date. The fair value of a liability reflects its non-performance risk.
When available, the Group measures the fair value of an instrument using the quoted price in an active market for that instrument. A market is regarded as active if transactions for the asset or liability take place with sufficient frequency and volume to provide pricing information on an ongoing basis.
If there is no quoted price in an active market, then the Group uses valuation techniques that maximise the use of relevant observable inputs and minimise the use of unobservable inputs. The chosen valuation technique incorporates all of the factors that market participants would take into account in pricing a transaction.
The best evidence of the fair value of a financial instrument at initial recognition is normally the transaction price – i.e. the fair value of the consideration given or received. If the Group determines that the fair value at initial recognition differs from the transaction price and the fair value is evidenced neither by a quoted price in an active market for an identical asset or liability nor based on a valuation technique that uses only data from observable markets, then the financial instrument is initially measured at fair value, adjusted to defer the difference between the fair value at initial recognition and the transaction price. Subsequently, that difference is recognized in profit or loss on an appropriate basis over the life of the instrument but no later than when the valuation is wholly supported by observable market data or the transaction is closed out.
If an asset or a liability measured at fair value has a bid price and an ask price, then the Group measures assets and long positions at a bid price and liabilities and short positions at an ask price.

87
Notes to the Consolidated Financial Statements continuedAs at and for the year ended 31 December 2020 QAR ‘000s
3. SIGNIFICANT ACCOUNTING POLICIES (continued)
(d) Financial assets and financial liabilities (continued)
(vi) Measurement principles (continued)
• Fair value measurement (continued) Portfolios of financial assets and financial liabilities that are exposed to market risk and credit risk that are
managed by the Group on the basis of the net exposure to either market or credit risk are measured on the basis of a price that would be received to sell a net long position (or paid to transfer a net short position) for a particular risk exposure. Those portfolio-level adjustments are allocated to the individual assets and liabilities on the basis of the relative risk adjustment of each of the individual instruments in the portfolio.
The fair value of a demand deposit is not less than the amount payable on demand, discounted from the first date on which the amount could be required to be paid.
The Group recognises transfers between levels of the fair value hierarchy as of the end of the reporting period during which the change has occurred.
(vii) Impairment The Group recognises loss allowances for expected credit losses (ECL) on the following financial instruments that are
not measured at FVTPL:
- Financial assets that are debt instruments; and - Loan commitments and financial guarantee contracts.
No impairment loss is recognised on equity investments.
The Group measures loss allowances at an amount equal to lifetime ECL, except for the following, for which they are measured as 12-month ECL:
- debt investment securities that are determined to have low credit risk at the reporting date; and - other financial instruments on which credit risk has not increased significantly since their initial recognition
12-month ECL are the portion of ECL that result from default events on financial instruments that are possible with the 12 months after the reporting date.
The Group applies three-stage approach to measure expected credit losses (ECL) on financial assets carried at amortised cost and debt instruments classified as FVOCI. Assets migrate through the following three stages based on the change in credit quality since initial recognition.
Stage 1: 12 months ECL - not credit impaired Stage 1 includes financial assets on initial recognition and that do not have a significant increase in credit risk since the initial recognition or that have low credit risk. For these assets, ECL are recognised on the gross carrying amount of the asset based on the expected credit losses that result from default events that are possible within 12 months after the reporting date. Interest is computed on the gross carrying amount of the asset.

88
Notes to the Consolidated Financial Statements continuedAs at and for the year ended 31 December 2020 QAR ‘000s
3. SIGNIFICANT ACCOUNTING POLICIES (continued)
(d) Financial assets and financial liabilities (continued)
(vii) Impairment (continued) Stage 2: Lifetime ECL - not credit impaired Stage 2 includes financial assets that have had a significant increase in
credit risk (SICR) since initial recognition but that do not have objective evidence of impairment. For these assets, lifetime ECL are recognised, but interest is still calculated on the gross carrying amount of the asset. Lifetime ECL are the expected credit losses that result from all possible default events over the expected life of the financial instrument.
Stage 3: Lifetime ECL - credit impaired Stage 3 includes financial assets that have objective evidence of impairment at the reporting date. For these assets, lifetime ECL are recognised.
Measurement of ECL ECL are a probability-weighted estimate of credit losses. They are measured as follows:
- Financial assets that are not credit-impaired at the reporting date: as the present value of all cash shortfalls (i.e. the difference between the cash flows due to the entity in accordance with the contract and the cash flows that the Group expects to receive);
- Financial assets that are credit-impaired at the reporting date: as the difference between the gross carrying amount and the present value of estimated future cash flows;
- Undrawn loan commitments: as the present value of the difference between the contractual cash flows that are due to the Group if the commitment is drawn down and the cash flows that the Group expects to receive; and
- Financial guarantee contracts: the expected payments to reimburse the holder less any amounts that the Group expects to recover.
Restructured financial assets If the terms of a financial asset are renegotiated or modified or an existing financial asset is replaced with a new one
due to financial difficulties of the borrower, then an assessment is made of whether the financial asset should be derecognised and ECL are measured as follows.
- if the expected restructuring will not result in derecognition of the existing asset, then the expected cash flows arising from the modified financial asset are included in calculating the cash shortfalls from the existing asset.
- if the expected restructuring will result in derecognition of the existing asset, then the expected fair value of the new asset is treated as the final cash flow from the existing financial asset at the time of its derecognition. This amount is included in calculating the cash shortfalls from the existing financial asset that are discounted from the expected date of derecognition to the reporting date using the original effective interest rate of the existing financial asset.
Credit-impaired financial assets At each reporting date, the Group assesses whether financial assets carried at amortised cost and debt financial
assets carried at FVOCI are credit impaired. A financial asset is ‘credit-impaired’ when one or more events that have a detrimental impact on the estimated future cash flows of the financial asset have occurred.
Evidence that a financial asset is credit-impaired includes the following observable data:
- Significant financial difficulty of the borrower or issuer; - A breach of contract such as a default or past due event; - The restructuring of a loan or advance by the Group on terms that the Group would not consider otherwise; - It is becoming probable that the borrower will enter bankruptcy or other financial reorganisation; or - The disappearance of an active market for a security because of financial difficulties.

89
Notes to the Consolidated Financial Statements continuedAs at and for the year ended 31 December 2020 QAR ‘000s
3. SIGNIFICANT ACCOUNTING POLICIES (continued)
(e) Cash and cash equivalents Cash and cash equivalents include notes and coins on hand, unrestricted balances held with central banks and highly liquid
financial assets with original maturities of three months or less from the acquisition date that are subject to an insignificant risk of changes in their fair value and are used by the Group in the management of its short-term commitments. Cash and cash equivalents includes amounts due from banks and with an original maturity of 90 days or less.
(f) Loans and advances to customers Loans and advances to customers are non-derivative financial assets with fixed or determinable payments that are not
quoted in an active market and that the Group does not intend to sell immediately or in the near term.
Loans and advances to customers are initially measured at the transaction price, which is the fair value plus incremental direct transaction costs, and subsequently measured at their amortised cost using the effective interest rate method, except for the financial assets which are classified to be measured at FVTPL, which are measured at fair value with changes recognised immediately in the consolidated income statement.
(g) Investment Securities The investment securities includes:
- Debt investment securities measured at amortised cost; these are initially measured at fair value plus incremental direct transaction costs, and subsequently at their amortised cost using the effective interest method;
- Debt and equity investment securities mandatorily measured at FVTPL or designated as at FVTPL; these are at fair value with changes recognised immediately in profit or loss;
- Debt securities measured at FVOCI; and - Equity investment securities designated at FVOCI.
For debt securities measured at FVOCI, gains and losses are recognised in OCI, except for the following, which are recognised in profit or loss in the same manner as for financial assets measured at amortised cost:
- Interest income using the effective interest method; - Expected credit losses and reversals; and - Foreign exchange gains and losses
When a debt security measured at FVOCI is derecognised, the cumulative gain or loss previously recognised in OCI is reclassified from equity to consolidated income statement.
The Group elects to present in OCI changes in the fair value of certain investments in equity. The election is made on an instrument by instrument basis on initial recognition and is irrevocable. Gains and losses on such equity instruments are never subsequently reclassified to consolidated income statement, including on disposal. Impairment losses (and reversal of impairment losses) are not reported separately from other changes in fair value. Dividends, when representing a return on such investments, continue to be recognised in consolidated income statement, unless they clearly represent a recovery of part of the cost of the investment, in which case they are recognised in OCI. Cumulative gains and losses recognised in OCI are transferred to retained earnings on disposal of an investment.

90
Notes to the Consolidated Financial Statements continuedAs at and for the year ended 31 December 2020 QAR ‘000s
3. SIGNIFICANT ACCOUNTING POLICIES (continued)
(h) Derivatives
(i) Derivatives held for risk management purposes and hedge accounting Derivatives held for risk management purposes include all derivative assets and liabilities that are not classified as
trading assets or liabilities. Derivatives held for risk management purposes are measured at fair value. The Group designates certain derivatives held for risk management as well as certain non-derivative financial instruments as hedging instruments in qualifying hedging relationships.
The general hedge accounting requirements of IFRS 9 retain the three types of hedge accounting mechanisms in IAS 39. However, greater flexibility has been introduced to the types of transactions eligible for hedge accounting, specifically broadening the types of instruments that qualify as hedging instruments and the types of risk components of non-financial items that are eligible for hedge accounting. In addition, the effectiveness test has been overhauled and replaced with the principle of an ‘economic relationship’. Retrospective assessment of hedge effectiveness is no longer required.
The Group has also elected to continue to apply the hedge accounting requirements of IAS 39 on adoption of IFRS 9.
Fair value hedges When a derivative is designated as the hedging instrument in a hedge of the change in fair value of a recognised
asset or liability or a firm commitment that could affect profit or loss, changes in the fair value of the derivative are recognised immediately in profit or loss together with changes in the fair value of the hedged item that are attributable to the hedged risk. If the hedging derivative expires or is sold, terminated, or exercised, or the hedge no longer meets the criteria for fair value hedge accounting, or the hedge designation is revoked, then hedge accounting is discontinued prospectively. Any adjustment up to that point to a hedged item, for which the effective interest method is used, is amortised to profit or loss as part of the recalculated effective interest rate of the item over its remaining life.
Cash flow hedges When a derivative is designated as the hedging instrument in a hedge of the variability in cash flows attributable to a
particular risk associated with a recognised asset or liability or a highly probable forecast transaction that could affect profit or loss, the effective portion of changes in the fair value of the derivative is recognized in other comprehensive income in the hedging reserve. The amount recognised in other comprehensive income is reclassified to profit or loss as a reclassification adjustment in the same period as the hedged cash flows affect profit or loss, and in the same line item in the statement of comprehensive income. Any ineffective portion of changes in the fair value of the derivative is recognised immediately in profit or loss. If the hedging derivative expires or is sold, terminated, or exercised, or the hedge no longer meets the criteria for cash flow hedge accounting, or the hedge designation is revoked, then hedge accounting is discontinued prospectively. In a discontinued hedge of a forecast transaction the cumulative amount recognised in other comprehensive income from the period when the hedge was effective is reclassified from equity to profit or loss as a reclassification adjustment when the forecast transaction occurs and affects profit or loss. If the forecast transaction is no longer expected to occur, then the balance in other comprehensive income is reclassified immediately to profit or loss as a reclassification adjustment.
The effective portion of changes in the fair value of derivatives that are designated and qualify as cash flow hedges is recognised in other comprehensive income. The gain or loss relating to the ineffective portion is recognised immediately in the consolidated income statement.
Amounts accumulated in equity are reclassified to profit or loss in the periods when the hedged item affects profit or loss (for example, when the forecast sale that is hedged takes place).

91
Notes to the Consolidated Financial Statements continuedAs at and for the year ended 31 December 2020 QAR ‘000s
3. SIGNIFICANT ACCOUNTING POLICIES (continued)
(h) Derivatives (continued)
(i) Derivatives held for risk management purposes and hedge accounting (continued)
Cash flow hedge (continued) When a hedging instrument expires or is sold, or when a hedge no longer meets the criteria for hedge accounting,
any cumulative gain or loss existing in equity at that time remains in equity and is recognised when the forecast transaction is ultimately recognised in the consolidated income statement. When a forecast transaction is no longer expected to occur, the cumulative gain or loss that was reported in equity is immediately transferred to the consolidated income statement.
(ii) Derivatives held for trading purposes The Group’s derivative trading instruments includes, forward foreign exchange contracts and interest rate swaps. The
Group sells these derivatives to customers in order to enable them to transfer, modify or reduce current and future risks. These derivative instruments are fair valued as at the end of reporting date and the corresponding fair value changes is taken to the profit or loss.
(i) Property and equipment
(i) Recognition and measurement Items of property and equipment are initially measured at cost and subsequently at cost less accumulated
depreciation and accumulated impairment losses, if any, except for land and building which are subsequently measured at fair value.
Revaluations of freehold land and buildings are carried out by an independent valuer. Net surpluses arising on revaluation are credited to a revaluation reserve, except that a revaluation increase is recognised as income to the extent that it reverses a revaluation decrease of the same asset previously recognised as an expense. A decrease as a result of a revaluation is recognised as an expense, except that it is charged directly against any related revaluation surplus to the extent that the decrease does not exceed the amount held in the revaluation surplus in respect of that same asset. On disposal the related revaluation surplus is credited to retained earnings.
Cost includes expenditures that are directly attributable to the acquisition of the asset. The cost of self-constructed assets includes the cost of materials and direct labour, any other costs directly attributable to bringing the assets to a working condition for their intended use, the costs of dismantling and removing the items and restoring the site on which they are located and capitalised borrowing costs.
Purchased software that is integral to the functionality of the related equipment is capitalised as part of that equipment.
When parts of an item of property or equipment have different useful lives, they are accounted for as separate items (major components) of property and equipment.
The gain or loss on disposal of an item of property and equipment is determined by comparing the proceeds from disposal with the carrying amount of the item of property and equipment, and is recognised in other income/other expenses in profit or loss.

92
Notes to the Consolidated Financial Statements continuedAs at and for the year ended 31 December 2020 QAR ‘000s
3. SIGNIFICANT ACCOUNTING POLICIES (continued)
(i) Property and equipment (continued)
(ii) Subsequent costs The cost of replacing a component of an item of property or equipment is recognised in the carrying amount of the
item if it is probable that the future economic benefits embodied within the part will flow to the Group and its cost can be measured reliably. The carrying amount of the replaced part is derecognised. The costs of the day-to-day servicing of property and equipment are recognised in profit or loss as incurred.
(iii) Depreciation The depreciable amount is the cost of property and equipment, or other amount substituted for cost, less its residual
value.
Depreciation is recognised in profit or loss on a straight-line basis over the estimated useful lives of each part of an item of property and equipment since this most closely reflects the expected pattern of consumption of the future economic benefits embodied in the asset and is based on cost of the asset less its estimated residual value. Land and Capital work in progress are not depreciated.
The estimated useful lives for the current and comparative years are as follows:
Buildings 20 - 30 years Leasehold improvements 6 - 10 years Furniture and equipment 3 - 8 years Motor vehicles 5 years
(vi) Right-of-use assets (Leases) The Group assesses at contract inception whether a contract is, or contains, a lease. That is, if the contract conveys the
right to control the use of an identified asset for a period of time in exchange for consideration.
The Group applies a single recognition and measurement approach for all leases, except for short-term leases less than 12 months and leases of low-value assets (USD 5,000 or less). The Group recognises lease liabilities to make lease payments and right-of-use assets representing the right to use the underlying assets.
The Group recognises right-of-use assets at the commencement date of the lease (i.e., the date the underlying asset is available for use). Right-of-use assets are measured at cost, less any accumulated depreciation and impairment losses, and adjusted for any remeasurement of lease liabilities. The cost of right-of-use assets includes the amount of lease liabilities recognised, initial direct costs incurred, and lease payments made at or before the commencement date less any lease incentives received. Right-of-use assets are depreciated on a straight-line basis over the shorter of the lease term and the estimated useful lives of the assets, as follows:
Buildings 2 - 40 years
At the commencement date of the lease, the Group recognises lease liabilities measured at the present value of lease payments to be made over the lease term. In calculating the present value of lease payments, the Group uses its incremental borrowing rate at the lease commencement date. Right-of-use assets are subject to impairment in line with the policy for the impairment of non-financial assets.
The carrying amount of lease liabilities is remeasured if there is a modification, a change in the lease term, a change in the lease payments or a change in the assessment of an option to purchase the underlying asset.

93
Notes to the Consolidated Financial Statements continuedAs at and for the year ended 31 December 2020 QAR ‘000s
3. SIGNIFICANT ACCOUNTING POLICIES (continued)
( j) Impairment of goodwill and intangible assets
(i) Goodwill Goodwill arises on the acquisition of subsidiaries and represents the excess of the consideration transferred over the
Group’s interest in net fair value of the net identifiable assets, liabilities and contingent liabilities of the acquiree and the fair value of the non-controlling interest in the acquiree.
Goodwill impairment reviews are undertaken annually or more frequently if events or changes in circumstances indicate a potential impairment. The carrying value of goodwill is compared to the recoverable amount, which is the higher of value in use and the fair value less costs of disposal. Any impairment is recognised immediately as an expense and is not subsequently reversed.
(ii) Intangible assets The cost of intangible assets acquired in a business combination is their fair value at the date of acquisition. Following
initial recognition, intangible assets are carried at cost less any accumulated amortisation and accumulated impairment losses.
Internally generated intangibles, excluding capitalised development costs, are not capitalised and the related expenditure is reflected in profit or loss in the period in which the expenditure is incurred.
The useful lives of intangible assets are assessed as either finite or indefinite.
Intangible assets with finite lives are amortised over the useful economic life and assessed for impairment whenever there is an indication that the intangible asset may be impaired. The amortisation period and the amortisation method for an intangible asset with a finite useful life are reviewed at least at the end of each reporting period. Changes in the expected useful life or the expected pattern of consumption of future economic benefits embodied in the asset are considered to modify the amortisation period or method, as appropriate, and are treated as changes in accounting estimates. The amortisation expense on intangible assets with finite lives is recognised in the statement of profit or loss as the expense category that is consistent with the function of the intangible assets.
The estimated useful economic life of intangible assets with finite lives are; Brand 18 to 19 years, Customer relationship 11 to 12 years, Core deposit 13 to 16 years and Internally developed software and others 5 years.
Intangible assets with indefinite useful lives are not amortised, but are tested for impairment annually, either individually or at the cash-generating unit level. The assessment of indefinite life is reviewed annually to determine whether the indefinite life continues to be supportable. If not, the change in useful life from indefinite to finite is made on a prospective basis. Gains or losses arising from de-recognition of an intangible asset are measured as the difference between the net disposal proceeds and the carrying amount of the asset and are recognised in the statement of profit or loss when the asset is derecognised.
(k) Impairment of non-financial assets Assets that have an indefinite useful life are not subject to amortisation and are tested annually for impairment. An
impairment loss is recognised for the amount by which the asset’s carrying amount exceeds its recoverable amount. The recoverable amount is the higher of an asset’s fair value less costs to sell and value in use. For the purposes of assessing impairment, assets are grouped at the lowest levels for which there are separately identifiable cash flows (cash-generating units). Non-financial assets other than goodwill that suffered impairment are reviewed for possible reversal of the impairment at each reporting date.

94
Notes to the Consolidated Financial Statements continuedAs at and for the year ended 31 December 2020 QAR ‘000s
3. SIGNIFICANT ACCOUNTING POLICIES (continued)
(l) Provisions A provision is recognised if, as a result of a past event, the Group has a present legal or constructive obligation that can be
estimated reliably, and it is probable that an outflow of economic benefits will be required to settle the obligation. Provisions are determined by discounting the expected future cash flows at a pre-tax rate that reflects current market assessments of the time value of money and, where appropriate, the risks specific to the liability.
(m) Financial guarantee contract and loan commitments Financial guarantees are contracts that require the Group to make specified payments to reimburse the holder for a loss it
incurs because a specified debtor fails to make payment when due in accordance with the terms of a debt instrument and the guarantees may become payable on demand. Financial guarantee liabilities are recognised initially at their fair value, and this initial fair value is amortised over the life of the financial guarantee. The financial guarantee liability is subsequently carried at the higher of this amortised amount and the present value of any expected payment when a payment under the guarantee has become probable. Financial guarantees are included within other liabilities.
(n) Employee benefits
Defined contribution plans The Bank provides for its contribution to the State administered retirement fund for Qatari employees in accordance with
the retirement law, and the resulting charge is included in staff cost in the consolidated income statement. The Bank has no further payment obligations once the contributions have been paid. The contributions are recognised when they are due.
Defined benefit plan The Bank makes provision for end of service benefits payable to its expatriate employees on the basis of the employees’
length of service in accordance with the employment policy of the Bank and the applicable provisions of the Labour Law. This provision is included in other provisions as part of other liabilities in the consolidated statement of financial position. The expected costs of these benefits are accrued over the period of employment.
Alternatifbank, under Turkish Labour Law, is required to pay termination benefits to each employee who has completed at least one year of service and whose employment is terminated without due cause, is called up for military service, dies or who retires. There are certain transitional provisions relating to length of service prior to retirement. The amount payable consists of one month’s salary subject to a maximum threshold per employee for each year of service. There are no agreements for pension commitments other than the legal requirement as explained above. The liability is not funded, as there is no funding requirement.
Short-term employee benefits Short-term employee benefit obligations are measured on an undiscounted basis and are expensed as the related
service is provided. A liability is recognised for the amount expected to be paid under short-term cash bonus or profit-sharing plans if the Group has a present legal or constructive obligation to pay this amount as a result of past service provided by the employee and the obligation can be estimated reliably.
Share-based payments Employees (including senior management) of the Bank receive remuneration in the form of share-based payments,
whereby employees are granted share appreciation rights, which are settled in cash (cash settled transactions).

95
Notes to the Consolidated Financial Statements continuedAs at and for the year ended 31 December 2020 QAR ‘000s
3. SIGNIFICANT ACCOUNTING POLICIES (continued)
(n) Employee benefits (continued)
Cash settled transactions The cost of cash settled transactions is measured at fair value at the grant date using Black Scholes model, further details of which are given in Note 20. The fair value is measured initially and at each reporting date up to and including the settlement date, with changes in fair value recognised in employee benefits expense Note 31. The fair value is expensed over the period until the vesting date with recognition of a corresponding liability.
(o) Share capital and reserves
(i) Share issue costs Incremental costs directly attributable to the issue of an equity instrument are deducted from the initial measurement
of the equity instruments.
(ii) Dividends on ordinary shares Dividends on ordinary shares are recognised in equity in the period in which they are approved by the Bank’s equity
holders.
(p) Interest income and expense Interest income and expense are recognised in the consolidated income statement using the effective interest rate
method. The effective interest rate is the rate that exactly discounts the estimated future cash payments and receipts through the expected life of the financial asset or liability (or, where appropriate, a shorter period) to the carrying amount of the financial asset or liability. When calculating the effective interest rate, the Group estimates future cash flows considering all contractual terms of the financial instrument, but not future credit losses.
For the financial assets that have become credit-impaired subsequent to initial recognition, interest income is calculated by applying the effective interest rate to their amortised cost (i.e. net of the expected credit loss provision). If the asset is no longer credit-impaired, then the calculation of interest income reverts to the gross basis.
The calculation of the effective interest rate includes all transaction costs and fees paid or received that are an integral part of the effective interest rate.
Transaction costs include incremental costs that are directly attributable to the acquisition or issue of a financial asset or liability.
Interest income and expense include:
- Interest on financial assets and financial liabilities measured at amortised cost calculated on an effective interest rate basis;
- The effective portion of fair value changes in qualifying hedging derivatives designated in cash flow hedges of variability in interest cash flows, in the same period that the hedged cash flows affect interest income / expense;
- The ineffective portion of fair value changes in qualifying hedging derivatives designated in cash flow hedges of interest rate risk; and
- Fair value changes in qualifying derivatives, including hedge ineffectiveness, and related hedged items in fair value hedges of interest rate risk.
Interest income on investment (debt) securities measured at FVOCI and measured at amortised cost is calculated using effective interest rate method and is also included in interest income.
96
Notes to the Consolidated Financial Statements continuedAs at and for the year ended 31 December 2020 QAR ‘000s
3. SIGNIFICANT ACCOUNTING POLICIES (continued)
(q) Fee and commission income and expense Fees and commission income and expense that are integral to the effective interest rate on a financial asset or liability are
included in the measurement of the effective interest rate.
Other fees and commission income, including account servicing fees, investment management fees, sales commission, placement fees and syndication fees, are recognised as the related services are performed. When a loan commitment is not expected to result in the draw-down of a loan, the related loan commitment fees are recognised on a straight-line basis over the commitment period. Other fees and commission expense relate mainly to transaction and service fees, which are expensed as the services are received.
(r) Income from investment securities Gains or losses on the disposal of investment securities are recognised in profit or loss as the difference between fair value
of the consideration received and carrying amount of the investment securities.
Unrealised gains or losses on fair value changes from remeasurement of investment securities classified as held for trading or designated as fair value through profit or loss are recognised in profit or loss.
Any cumulative gain/loss recognised in OCI in respect of equity investment securities designated as at FVOCI is not recognised in the consolidated income statement on derecognition of such securities.
(s) Dividend income Dividend income is recognised when the right to receive dividend income is established.
(t) Income tax expenses Taxes are calculated based on tax laws and regulations in the countries in which the Group operates. Tax is recognized
based on an evaluation of the expected tax charge/credit. Income tax and deferred tax mainly arising from Alternatif bank operations.
Deferred tax is recognised in respect of temporary differences between the carrying amounts of assets and liabilities for financial reporting purposes and the amounts used for taxation purposes. Deferred tax is measured at the tax rates that are expected to apply to the period when the asset is realised or the liability is settled based on laws that have been enacted at the reporting date.
(u) Earnings per share The Bank presents basic and diluted earnings per share (EPS) data for its ordinary shares. Basic EPS is calculated by
dividing the profit or loss attributable to ordinary equity holders of the Bank, further adjusted for the dividend appropriation for instruments eligible for additional Tier 1 Capital, if any, by the weighted average number of ordinary shares outstanding during the period. Diluted EPS is determined by adjusting the profit or loss attributable to ordinary equity holders , further adjusted for the dividend appropriation for instruments eligible for additional Tier 1 Capital, if any, and the weighted average number of ordinary shares outstanding for the effects of all dilutive potential ordinary shares.

97
Notes to the Consolidated Financial Statements continuedAs at and for the year ended 31 December 2020 QAR ‘000s
3. SIGNIFICANT ACCOUNTING POLICIES (continued)
(v) Segment reporting Operating segments are reported in a manner consistent with the internal reporting provided to the chief operating
decision maker. The chief operating decision maker is the person or group that allocates resources to and assesses the performance of the operating segments of an entity. The Group has determined the Chief Executive Officer of the Bank as its chief operating decision maker.
All transactions between operating segments are conducted on an arm’s length basis directly associated with each segment are included in determining operating segment performance.
(w) Fiduciary activities The Group acts as fund manager and in other fiduciary capacities that result in the holding or placing of assets on behalf of
individuals, corporate and other institutions. These assets and income arising thereon are excluded from these consolidated financial statements, as they are not assets of the Group.
(x) Repossessed collateral Repossessed collaterals in settlement of customers’ debts are stated under “Other assets” at carrying value of debts or
fair value if lower. According to QCB instructions, the Group should dispose of any land and properties acquired in settlement of debts within a period not exceeding three years from the date of acquisition although this period can be extended with the approval of QCB.
(y) Appropriations for Instruments Eligible for Additional Capital Appropriations for Instruments Eligible for Additional Capital are treated as dividends.
(z) Comparatives Except when a standard or an interpretation permits or requires otherwise, all amounts are reported or disclosed with
comparative information.
4. FINANCIAL RISK MANAGEMENT
a) Introduction and overview The Group’s business involves taking risks in a targeted manner and managing them professionally. The core functions of
the Group’s risk management are to identify all key risks for the Group, measure these risks, manage the risk positions and determine capital allocations. The Group regularly reviews its risk management policies and systems to reflect changes in markets, products and best market practice.
The Group’s aim is to achieve an appropriate balance between risk and return and minimise potential adverse effects on the Group’s financial performance. The Group defines risk as the possibility of losses or profits foregone, which may be caused by internal or external factors.

98
Notes to the Consolidated Financial Statements continuedAs at and for the year ended 31 December 2020 QAR ‘000s
4. FINANCIAL RISK MANAGEMENT (continued)
a) Introduction and overview (continued)
Financial instruments Financial instruments comprise the Group’s financial assets and liabilities. Financial assets include cash and balances with
Central banks, due from banks, loans and advances, investment securities, derivative financial assets and certain other assets and financial liabilities include customer deposits, borrowings under repurchase agreements and interbank takings, debt issued and other borrowed funds, derivative financial liabilities and certain other liabilities. Financial instruments also include rights and commitments included in off- balance sheet items.
Note 3(d) describes the accounting policies followed by the Group in respect of recognition and measurement of the key financial instruments and their related income and expense.
Risk management The Group derives its revenue from assuming and managing customer risk for profit. Through a robust governance
structure, risk and return are evaluated to produce sustainable revenue, to reduce earnings volatility and increase shareholder value. The most important types of risk are credit risk, liquidity risk, market risk and operational risk. Credit risk reflects the possible inability of a customer to meet his/her repayment or delivery obligations. Market risk, which includes foreign currency, interest rate risks and other price risks, is the risk of fluctuation in asset and commodity values caused by changes in market prices and yields. Liquidity risk results in the inability to accommodate liability maturities and withdrawals, fund asset growth or otherwise meet contractual obligations at reasonable market rates. Operational risk is the potential for loss resulting from events involving people, processes, technology, legal issues, external events or execution or regulatory issues.
Risk and other committees The governance structure of the Group is headed by the Board of Directors. The Board of Directors evaluates risk by
engaging with the Group Chief Executive Officer and Chief Risk Officer alongwith the following Board and Management Committees:
1) Board Risk Committee is responsible for all aspects of Risk Management across the Group including but not restricted to credit risk, market risk, and operational risk. This committee sets the policy on all risk issues and maintains oversight of all Group risks through the Management Risk Committee.
2) Board Audit and Compliance Committee is responsible for setting the policy on all Audit issues and maintains oversight of all Bank audit issues through the Chief Internal Auditor. In addition, the committee is also responsible for Compliance & Anti-Money Laundering which is managed through the Chief Compliance Officer.
3) Board Executive Committee is responsible for evaluating and granting credit facilities and approval of the Group’s investment activities within authorized limits per Qatar Central Bank and Board of Directors’ guidelines. In addition, this committee is also responsible for all policies and strategies of the business and compliance of corporate governance.
4) Management Credit Committee (MCC) is the third highest-level authority on all Counterparty Credit Risk Exposures, after the Board of Directors and Board Executive Committee. The MCC also is responsible for watch list and non-performing assets to minimize risks, prevent losses, maximize recoveries and restore profits through rehabilitation, restructuring, workout, collection or legal actions. MCC exercises its credit authority as conferred upon them by the Delegation of Authority (“DoA”) as approved by the Board.

99
Notes to the Consolidated Financial Statements continuedAs at and for the year ended 31 December 2020 QAR ‘000s
4. FINANCIAL RISK MANAGEMENT (continued)
a) Introduction and overview (continued)
Risk and other committees (continued) 5) Management Risk Committee is the highest management authority on all risk related issues in the Group and its
subsidiaries and affiliates in which it has strategic investments. This committee provides recommendations on all risk policy and portfolio issues to the Board Risk Committee.
6) Asset and Liability Committee (ALCO) is a management committee which is a decision making body relating to Asset and Liability management. (i.e. balance sheet structure, funding, pricing, hedging, setting limits etc.) Under the overall risk management framework, ALCO is a key component of risk management within the Bank.
7) Investment Committee (ICO) is the decision making committee for Bank’s proprietary investment activities, with a view to optimize returns, ensuring that the investment book provides a liquidity buffer for the bank and mitigate market risk attached to the nature of targeted investment.
8) Crisis Management Committee (CMC) is the authority for management of a crisis, entailing business continuity, prevention, planning, testing, and evaluation. The CMC’s objective is to mitigate and minimize the consequences of crisis events.
(b) Credit risk Credit risk is defined as the potential that a borrower or counterparty will fail to meet its obligations in accordance with
agreed terms. The goal of credit risk management is to maximize the Group’s risk-adjusted rate of return by maintaining credit risk exposure within acceptable parameters. Loans and advances are the largest sources of credit risk for the Group. Other sources of credit risk exist throughout the activities of the Group, including investments in the banking book and in the trading book. The Group also faces credit risk (or counterparty risk) in various financial instruments other than loans, including: acceptances, interbank transactions, trade financing, foreign exchange transactions, derivative instruments, and in the extension of commitments and guarantees, as well as the settlement of transactions. The Group maintains well defined, written policies and procedures for identifying, measuring, monitoring, and controlling credit risk, governing credit-granting activities in conformance with the risk appetite and limits defined by the Board. All extensions of credit are made on an arm’s length basis in accordance with the Group’s credit-granting approval process by a combination of authorized individuals, groups or credit committees, depending on the size and nature of the credit, who have the experience, knowledge and background to exercise prudent judgement in assessing, approving and managing credit risks.
(i) Credit risk measurement
1. Loans and advances The Group’s aim is to maintain a sound asset portfolio by optimizing its loan mix. This is being achieved through
a strategy of reducing exposure to non-core client relationships while selectively targeting economic sectors that are core to the overall business strategy. In addition, the Group intends to diversify risk by increasing the size of the consumer portfolio comprising of consumer loans, vehicle loans, credit cards and residential mortgages. In measuring credit risk of loan and advances to customers and to banks, the Group reflects three components (i) the ‘probability of default’ by the client or counterparty on its contractual obligations; (ii) current exposures to the counterparty and its likely potential future exposure, from which the Group derive the ‘exposure at default’; and (iii) the likely recovery ratio on the defaulted obligations (the ‘loss given default’).

100
Notes to the Consolidated Financial Statements continuedAs at and for the year ended 31 December 2020 QAR ‘000s
4. FINANCIAL RISK MANAGEMENT (continued)
(b) Credit risk (continued)
(i) Credit risk measurement (continued)
1. Loans and advances (continued) (i) The Group assesses the probability of default of individual counterparties using internal rating tools tailored
to the various categories of counterparty. They combine statistical analysis along with the business relationship officers and credit risk officers assessment and are independently validated. Clients of the Group are segmented based on a 10-point rating scale (22 notches including modifiers) for the corporate book and product based application scores for the retail book. The Group’s rating scale reflects the range of default probabilities defined for each rating class. This means that, in principle, the probability of default changes with the migration of ratings. The rating tools are kept under review and upgraded as necessary.
The ratings of the major rating agency are mapped to Group’s rating grades based on the long-term average default rates for each external grade. The Group uses the external ratings where available to benchmark internal credit risk assessment. Observed defaults per rating category vary year on year, especially over an economic cycle.
(ii) Exposure at default is based on the amounts the Group expects to be owed at the time of default. For example, for a loan this is the carrying value. For a commitment, the Group includes any amount already drawn plus the further amount that may have been drawn by the time of default, should it occur. For undrawn facilities, the Group applies credit conversion factors that are prescribed by Qatar Central Bank and are aligned to Bank of International Settlements (BIS) guidelines.
(iii) Loss given default or loss severity represents the Group’s expectation of the extent of loss on a claim should default occur. It is expressed as percentage loss per unit of exposure and typically varies by type of counterparty, type and seniority of claim and availability of collateral or other credit mitigation.
2. Debt securities and other bills For debt securities and other bills, external ratings such as Standard & Poor’s and Moody’s ratings or their
equivalents are used by Treasury for managing the credit risk exposures. The investments in those securities and bills are viewed as a way to improve the overall asset quality, enhance yield and provide a readily available source to meet the funding requirement.
(ii) Risk limit control and mitigation policies
Portfolio diversification Portfolio diversification is an overriding principle, therefore, the credit policies are structured to ensure that the Group
is not over exposed to a given client, industry sector or geographic area. To avoid excessive losses if any single counter-party is unable to fulfil its payment obligations, large exposure limits have been established per credit policy following the local regulations. Limits are also in place to manage exposures to a particular country or sector. These risks are monitored on an ongoing basis and subject to an annual or more frequent review, when considered necessary.
101
Notes to the Consolidated Financial Statements continuedAs at and for the year ended 31 December 2020 QAR ‘000s
4. FINANCIAL RISK MANAGEMENT (continued)
(b) Credit risk (continued)
(ii) Risk limit control and mitigation policies (continued)
Collateral In order to proactively respond to credit deterioration, the Group employs a range of policies and practices to
mitigate credit risk.
The most traditional of these is the taking of security for funds advanced, which is common practice. The Group implements guidelines on the acceptability of specific classes of collateral or credit risk mitigation. The principal collateral types for loans and advances are:
• Mortgages over residential properties; • Lending against lien marked deposits; • Charges over business assets such as premises, inventory and accounts receivable; • Charges over financial instruments such as debt securities and equities.
Longer-term finance and lending to corporate entities are generally secured; working capital credit facilities are generally unsecured. In addition, in order to minimize the credit loss, the Group will seek additional collateral from the counterparty as soon as impairment indicators are noticed for the relevant individual loans and advances.
Collateral held as security for financial assets other than loans and advances is determined by the nature of the instrument. Debt securities, treasury and other eligible bills are generally unsecured, with the exception of asset-backed securities and similar instruments, which are secured by portfolios of financial instruments.
Credit-related commitments The primary purpose of these instruments is to ensure that funds are available to a customer as required. Guarantees
and standby letters of credit carry the same credit risk as loans. Documentary and commercial letters of credit – which are written undertakings by the Group on behalf of a customer authorizing a third party to draw drafts on the Group up to a stipulated amount under specific terms and conditions – are collateralized by the underlying shipments of goods to which they relate and therefore carry less risk than a direct loan.
Commitments to extend credit represent unused portions of authorizations to extend credit in the form of loans, guarantees or letters of credit. With respect to credit risk on commitments to extend credit, the Group is potentially exposed to loss in an amount equal to the total unused commitments. However, the likely amount of loss is less than the total unused commitments, as most commitments to extend credit are contingent upon customers maintaining specific credit standards. The Group monitors the term to maturity of credit commitments because longer-term commitments generally have a greater degree of credit risk than shorter-term commitments.
Credit risk arising from derivative financial instruments is, at any time, limited to those with positive fair values, as at the reporting date. With gross-settled derivatives, the Group is also exposed to a settlement risk, being the risk that the Group honors its obligation but the counterparty fails to deliver the counter-value.

102
Notes to the Consolidated Financial Statements continuedAs at and for the year ended 31 December 2020 QAR ‘000s
4. FINANCIAL RISK MANAGEMENT (continued)
(b) Credit risk (continued)
(iii) Maximum exposure to credit risk before collateral held or other credit enhancements
2020 2019
Credit risk exposures relating to assets recorded on the consolidated statement of financial position are as follows:Balances with central banks 5,851,972 5,250,971
Due from banks 10,401,014 12,396,433
Loans and advances to customers 96,698,098 88,009,448
Investment securities - debt 24,977,468 26,408,148
Other assets 2,486,722 1,690,200
Total as at 31 December 140,415,274 133,755,200
Other credit risk exposures are as follows:
Guarantees 17,788,756 21,353,539
Letters of credit 2,291,488 1,706,950
Unutilized credit facilities 4,465,134 4,287,871
Total as at 31 December 24,545,378 27,348,360
164,960,652 161,103,560
The above table represents a worse-case scenario of credit risk exposure to the Group, without taking account of any collateral held or other credit enhancements attached.

103
Notes to the Consolidated Financial Statements continuedAs at and for the year ended 31 December 2020 QAR ‘000s
4. FINANCIAL RISK MANAGEMENT (continued)
(b) Credit risk (continued)
(iv) Concentration of risks of financial assets with credit risk exposure
Geographical sectors The following table breaks down the Group’s credit exposure at their carrying amounts (without taking into account
any collateral held or other credit support), as categorized by geographical region. For this table, the Group has allocated exposures to regions based on the country of domicile of its counterparties.
2020 Qatar Other GCCOther
Middle eastRest of
the world Total
Balances with central banks 4,168,694 - 1,683,278 - 5,851,972
Due from banks 991,136 200,706 3,094,605 6,114,567 10,401,014
Loans and advances to customers 74,958,590 204,077 18,226,563 3,308,868 96,698,098
Investment securities - debt 18,935,247 446,275 4,280,798 1,315,148 24,977,468
Other assets 2,097,767 - 388,955 - 2,486,722
101,151,434 851,058 27,674,199 10,738,583 140,415,274
2019 Qatar Other GCCOther
Middle eastRest of
the world Total
Balances with central banks 3,698,747 - 1,552,224 - 5,250,971
Due from banks 4,275,094 675,608 4,089,664 3,356,067 12,396,433
Loans and advances to customers 73,308,248 474,138 13,491,026 736,036 88,009,448
Investment securities - debt 19,914,595 364,868 4,059,685 2,069,000 26,408,148
Other assets 1,302,765 516 276,834 110,085 1,690,200
102,499,449 1,515,130 23,469,433 6,271,188 133,755,200
2020 Qatar Other GCCOther
Middle eastRest of
the world Total
Guarantees 9,181,740 775,795 59,798 7,771,423 17,788,756
Letters of credit 1,196,565 463 38,465 1,055,995 2,291,488
Unutilized credit facilities 2,728,362 1,456,059 173 280,540 4,465,134
13,106,667 2,232,317 98,436 9,107,958 24,545,378
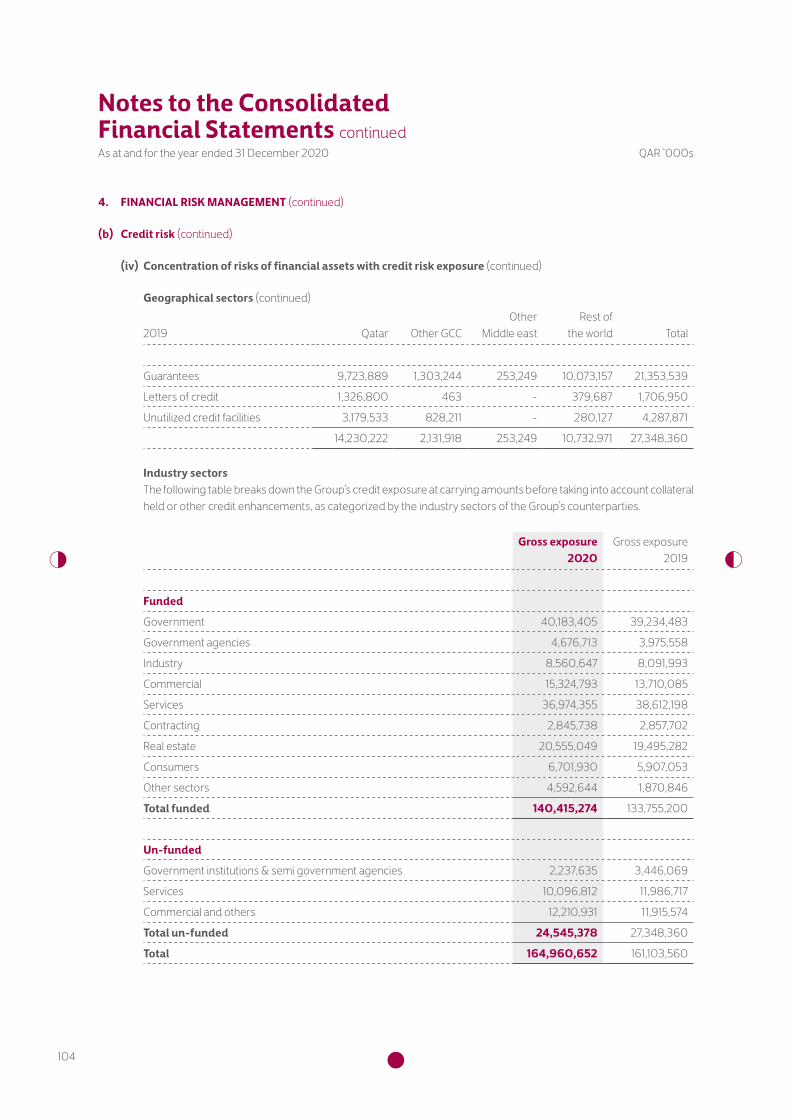
104
Notes to the Consolidated Financial Statements continuedAs at and for the year ended 31 December 2020 QAR ‘000s
4. FINANCIAL RISK MANAGEMENT (continued)
(b) Credit risk (continued)
(iv) Concentration of risks of financial assets with credit risk exposure (continued)
Geographical sectors (continued)
2019 Qatar Other GCCOther
Middle eastRest of
the world Total
Guarantees 9,723,889 1,303,244 253,249 10,073,157 21,353,539
Letters of credit 1,326,800 463 - 379,687 1,706,950
Unutilized credit facilities 3,179,533 828,211 - 280,127 4,287,871
14,230,222 2,131,918 253,249 10,732,971 27,348,360
Industry sectors The following table breaks down the Group’s credit exposure at carrying amounts before taking into account collateral
held or other credit enhancements, as categorized by the industry sectors of the Group’s counterparties.
Gross exposure 2020
Gross exposure 2019
Funded
Government 40,183,405 39,234,483
Government agencies 4,676,713 3,975,558
Industry 8,560,647 8,091,993
Commercial 15,324,793 13,710,085
Services 36,974,355 38,612,198
Contracting 2,845,738 2,857,702
Real estate 20,555,049 19,495,282
Consumers 6,701,930 5,907,053
Other sectors 4,592,644 1,870,846
Total funded 140,415,274 133,755,200
Un-funded
Government institutions & semi government agencies 2,237,635 3,446,069
Services 10,096,812 11,986,717
Commercial and others 12,210,931 11,915,574
Total un-funded 24,545,378 27,348,360
Total 164,960,652 161,103,560
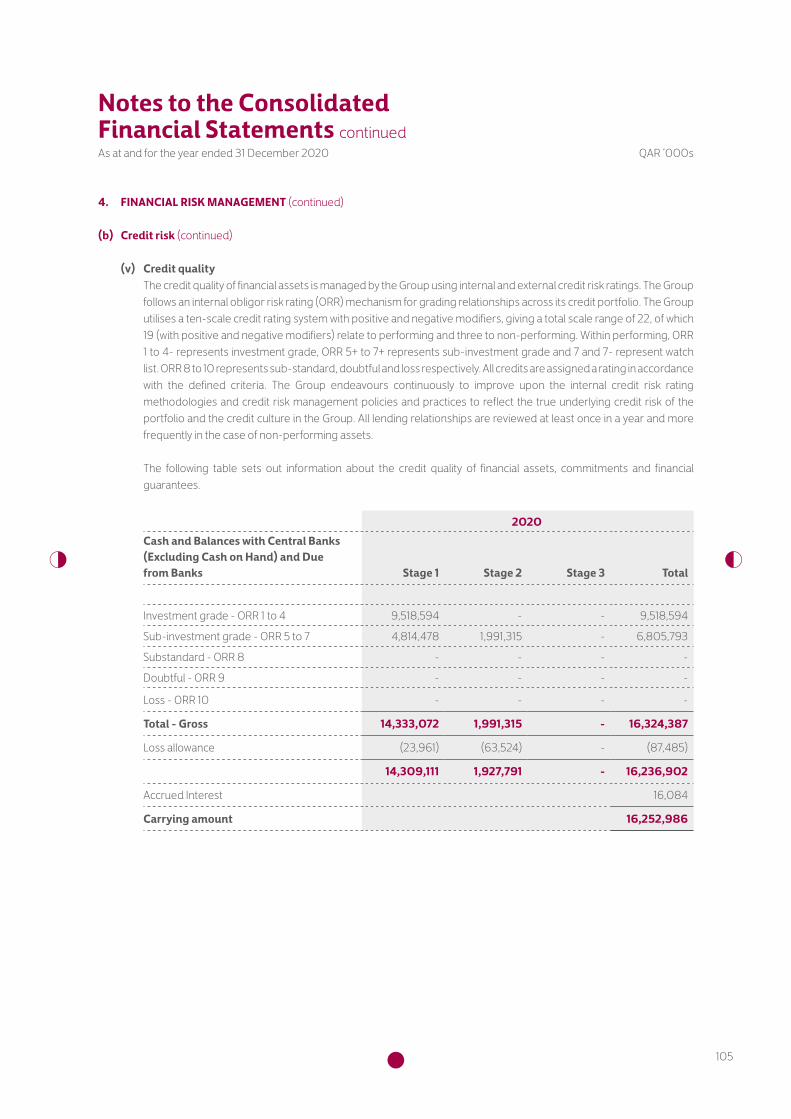
105
Notes to the Consolidated Financial Statements continuedAs at and for the year ended 31 December 2020 QAR ‘000s
4. FINANCIAL RISK MANAGEMENT (continued)
(b) Credit risk (continued)
(v) Credit quality The credit quality of financial assets is managed by the Group using internal and external credit risk ratings. The Group
follows an internal obligor risk rating (ORR) mechanism for grading relationships across its credit portfolio. The Group utilises a ten-scale credit rating system with positive and negative modifiers, giving a total scale range of 22, of which 19 (with positive and negative modifiers) relate to performing and three to non-performing. Within performing, ORR 1 to 4- represents investment grade, ORR 5+ to 7+ represents sub-investment grade and 7 and 7- represent watch list. ORR 8 to 10 represents sub-standard, doubtful and loss respectively. All credits are assigned a rating in accordance with the defined criteria. The Group endeavours continuously to improve upon the internal credit risk rating methodologies and credit risk management policies and practices to reflect the true underlying credit risk of the portfolio and the credit culture in the Group. All lending relationships are reviewed at least once in a year and more frequently in the case of non-performing assets.
The following table sets out information about the credit quality of financial assets, commitments and financial guarantees.
2020Cash and Balances with Central Banks (Excluding Cash on Hand) and Due from Banks Stage 1 Stage 2 Stage 3 Total
Investment grade - ORR 1 to 4 9,518,594 - - 9,518,594
Sub-investment grade - ORR 5 to 7 4,814,478 1,991,315 - 6,805,793
Substandard - ORR 8 - - - -
Doubtful - ORR 9 - - - -
Loss - ORR 10 - - - -
Total - Gross 14,333,072 1,991,315 - 16,324,387
Loss allowance (23,961) (63,524) - (87,485)
14,309,111 1,927,791 - 16,236,902
Accrued Interest 16,084
Carrying amount 16,252,986

106
Notes to the Consolidated Financial Statements continuedAs at and for the year ended 31 December 2020 QAR ‘000s
4. FINANCIAL RISK MANAGEMENT (continued)
(b) Credit risk (continued)
(v) Credit quality (continued)
2020Loans and advances to Customers Stage 1 Stage 2 Stage 3 Total
Investment grade - ORR 1 to 4 41,424,708 476,114 - 41,900,822
Sub-investment grade - ORR 5 to 7 38,296,983 15,478,765 - 53,775,748
Substandard - ORR 8 - - 741,024 741,024
Doubtful - ORR 9 - - 1,426,348 1,426,348
Loss - ORR 10 - - 2,159,756 2,159,756
Total - Gross 79,721,691 15,954,879 4,327,128 100,003,698
Loss allowance (281,049) (1,239,905) (2,875,668) (4,396,622)
79,440,642 14,714,974 1,451,460 95,607,076
Accrued Interest 1,091,022
Carrying amount 96,698,098
ORR = Obligatory Risk Rating
2020Investment Securities - Debt Stage 1 Stage 2 Stage 3 Total
Investment grade - ORR 1 to 4 19,296,219 282,620 - 19,578,839
Sub-investment grade - ORR 5 to 7 4,310,623 102,886 - 4,413,509
Substandard - ORR 8 - - - -
Doubtful ORR 9 - - - -
Loss - ORR 10 - - - -
Total - Gross 23,606,842 385,506 - 23,992,348
Loss allowance (35,166) (14,112) - (49,278)
23,571,676 371,394 - 23,943,070
Accrued interrest 141,519
Carrying amount 24,084,589

107
Notes to the Consolidated Financial Statements continuedAs at and for the year ended 31 December 2020 QAR ‘000s
4. FINANCIAL RISK MANAGEMENT (continued)
(b) Credit risk (continued)
(v) Credit quality (continued)
2020Loan Commitments and financial Guarantees Stage 1 Stage 2 Stage 3 Total
Investment grade - ORR 1 to 4 5,724,049 115,806 - 5,839,855
Sub-investment grade - ORR 5 to 7 14,945,312 3,472,303 - 18,417,615
Substandard - ORR 8 - 1,459 44,378 45,837
Doubtful ORR 9 - - 1,035 1,035
Loss - ORR 10 - - 241,036 241,036
Total - Gross 20,669,361 3,589,568 286,449 24,545,378
Loss allowance (89,665) (47,673) (23,545) (160,883)
Carrying amount 20,579,696 3,541,895 262,904 24,384,495
2019Cash and Balances with Central Banks (Excluding Cash on Hand) and Due from Banks Stage 1 Stage 2 Stage 3 Total
Investment grade - ORR 1 to 4 9,174,366 - - 9,174,366
Sub-investment grade - ORR 5 to 7 5,459,786 3,043,808 - 8,503,594
Substandard - ORR 8 - - - -
Doubtful - ORR 9 - - - -
Loss - ORR 10 - - - -
Total - Gross 14,634,152 3,043,808 - 17,677,960
Loss allowance (7,515) (33,037) - (40,552)
14,626,637 3,010,771 - 17,637,408
Accrued Interest 9,996
Carrying amount 17,647,404

108
Notes to the Consolidated Financial Statements continuedAs at and for the year ended 31 December 2020 QAR ‘000s
4. FINANCIAL RISK MANAGEMENT (continued)
(b) Credit risk (continued)
(v) Credit quality (continued)
2019Loans and advances to Customers Stage 1 Stage 2 Stage 3 Total
Investment grade - ORR 1 to 4 36,969,262 110,704 - 37,079,966
Sub-investment grade - ORR 5 to 7 34,143,968 15,204,195 - 49,348,163
Substandard - ORR 8 - 545 962,594 963,139
Doubtful - ORR 9 - - 1,345,136 1,345,136
Loss - ORR 10 - - 2,179,512 2,179,512
Total - Gross 71,113,230 15,315,444 4,487,242 90,915,916
Loss allowance (61,964) (872,666) (2,751,042) (3,685,672)
71,051,266 14,442,778 1,736,200 87,230,244
Accrued Interest 779,204
Carrying amount 88,009,448
ORR = Obligatory Risk Rating
2019Investment Securities - Debt Stage 1 Stage 2 Stage 3 Total
Investment grade - ORR 1 to 4 17,397,199 270,761 - 17,667,960
Sub-investment grade - ORR 5 to 7 6,947,653 295,715 - 7,243,368
Substandard - ORR 8 - - - -
Doubtful ORR 9 - - - -
Loss - ORR 10 - - - -
Total - Gross 24,344,852 566,476 - 24,911,328
Loss allowance (4,071) - - (4,071)
24,340,781 566,476 - 24,907,257
Accrued interrest 138,199
Carrying amount 25,045,456
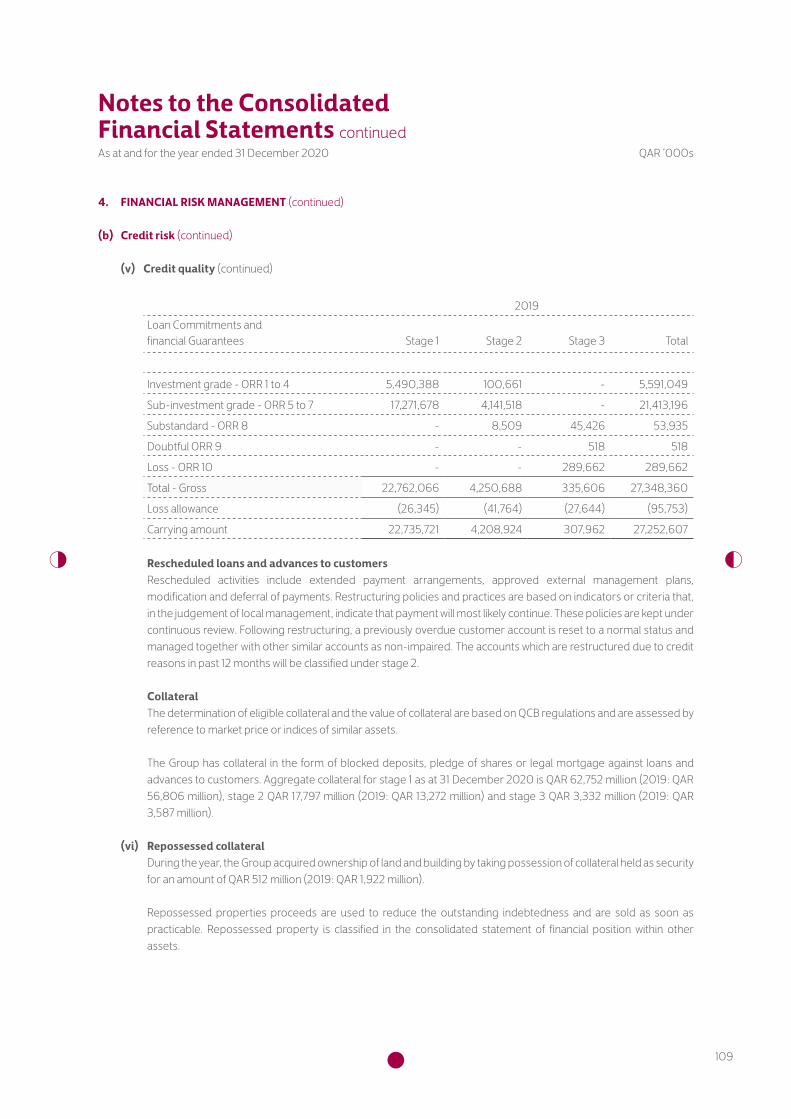
109
Notes to the Consolidated Financial Statements continuedAs at and for the year ended 31 December 2020 QAR ‘000s
4. FINANCIAL RISK MANAGEMENT (continued)
(b) Credit risk (continued)
(v) Credit quality (continued)
2019Loan Commitments and financial Guarantees Stage 1 Stage 2 Stage 3 Total
Investment grade - ORR 1 to 4 5,490,388 100,661 - 5,591,049
Sub-investment grade - ORR 5 to 7 17,271,678 4,141,518 - 21,413,196
Substandard - ORR 8 - 8,509 45,426 53,935
Doubtful ORR 9 - - 518 518
Loss - ORR 10 - - 289,662 289,662
Total - Gross 22,762,066 4,250,688 335,606 27,348,360
Loss allowance (26,345) (41,764) (27,644) (95,753)
Carrying amount 22,735,721 4,208,924 307,962 27,252,607
Rescheduled loans and advances to customers Rescheduled activities include extended payment arrangements, approved external management plans,
modification and deferral of payments. Restructuring policies and practices are based on indicators or criteria that, in the judgement of local management, indicate that payment will most likely continue. These policies are kept under continuous review. Following restructuring, a previously overdue customer account is reset to a normal status and managed together with other similar accounts as non-impaired. The accounts which are restructured due to credit reasons in past 12 months will be classified under stage 2.
Collateral The determination of eligible collateral and the value of collateral are based on QCB regulations and are assessed by
reference to market price or indices of similar assets.
The Group has collateral in the form of blocked deposits, pledge of shares or legal mortgage against loans and advances to customers. Aggregate collateral for stage 1 as at 31 December 2020 is QAR 62,752 million (2019: QAR 56,806 million), stage 2 QAR 17,797 million (2019: QAR 13,272 million) and stage 3 QAR 3,332 million (2019: QAR 3,587 million).
(vi) Repossessed collateral During the year, the Group acquired ownership of land and building by taking possession of collateral held as security
for an amount of QAR 512 million (2019: QAR 1,922 million).
Repossessed properties proceeds are used to reduce the outstanding indebtedness and are sold as soon as practicable. Repossessed property is classified in the consolidated statement of financial position within other assets.
110
Notes to the Consolidated Financial Statements continuedAs at and for the year ended 31 December 2020 QAR ‘000s
4. FINANCIAL RISK MANAGEMENT (continued)
(b) Credit risk (continued)
(vii) Write-off policy The Group writes off a loan or an investment in debt security balance, and any related allowances for impairment
losses, when the relevant Credit Committees determines that the loan or security is uncollectible. QCB approval is required for local write offs when the amount to be written off exceeds Qatar Riyal one hundred thousand.
This determination is made after considering information such as the occurrence of significant changes in the borrower’s/issuer’s financial position such that the borrower/issuer can no longer pay the obligation, or that proceeds from collateral will not be sufficient to pay back the entire exposure. For smaller balance standardized loans, write-off decisions generally are based on a product-specific past due status. The amount written off during the year was QAR 450 million (2019: QAR 1,035 million).
(viii) Inputs, assumptions and techniques used for estimating impairment
Significant increase in credit risk When determining whether the risk of default on a financial instrument has increased significantly since initial
recognition, the Group considers reasonable and supportable information that is relevant and available without undue cost or effort. This includes both quantitative and qualitative information and analysis including internal credit risk grading system, external risk ratings, where available, delinquency status of accounts, credit judgement and, where possible, relevant historical experience. The Group may also determine that an exposure has undergone a significant increase in credit risk based on particular Qualitative indicators that it considers are indicative of such and whose effect may not otherwise be fully reflected in its Quantitative analysis on a timely basis.
In determining whether credit risk has increased significantly since initial recognition following criteria are considered:
i) Two ‘absolute’ notches downgrade for ratings better than Rating Grade 5 at the time of origination and one ‘absolute’ notch rating downgrade for other rated customers.
ii) Facilities restructured during previous twelve months. iii) Facilities overdue by 30 days as at the reporting date in case of Retail Products and overdue by 60 days for
corporate customers.
Credit risk grades Credit risk grades are defined using qualitative and quantitative factors that are indicative of risk of default. These
factors vary depending on the nature of the exposure and the type of borrower. Exposures are subject to on-going monitoring, which may result in an exposure being moved to a different credit risk grade.
Generating the term structure of Probability of Default (PD) The Group uses its own database of default history to model estimates of PD for respective ratings that are used in
credit decision making. Yearly transition matrices are developed to capture the rating migration of borrowers and yearly PDs are calculated over 5 years to get the through-the-cycle (TTC) PD. In order the transform the TTC PD to point in time, a credit index for the last five historical years is calculated based upon minimizing the sum of the squared differences between the TTC PD and Point-in-time (PIT) PD matrix elements. This analysis includes the identification and calibration of relationships between changes in default rates and changes in key macro-economic factors, across various geographies in which the Group has exposures.

111
Notes to the Consolidated Financial Statements continuedAs at and for the year ended 31 December 2020 QAR ‘000s
4. FINANCIAL RISK MANAGEMENT (continued)
(b) Credit risk (continued)
(viii) Inputs, assumptions and techniques used for estimating impairment (continued)
Renegotiated financial assets The contractual terms of a loan may be modified for a number of reasons, including changing market conditions,
customer retention and other factors not related to a current or potential credit deterioration of the customer. This may involve extending the payment arrangements and documenting the agreement of new loan conditions. Management continuously reviews renegotiated loans to ensure that all criteria are met and that future payments are likely to occur.
The accounts which are restructured due to credit reasons in past 12 months will be classified under Stage 2.
Definition of default The Group considers a financial asset to be in default when: - the borrower is unlikely to pay its credit obligations to the Group in full, without recourse by the Group to actions
such as realising security (if any is held); or - the borrower is past due more than 90 days on any material credit obligation to the Group; or - the borrower is rated 9 (Doubtful) or 10 (Loss).
In assessing whether a borrower is in default, the Group also considers indicators that are: - quantitative – e.g. overdue status and non-payment on another obligation of the same issuer to the Group; and - based on data developed internally and obtained from external sources.
Inputs into the assessment of whether a financial instrument is in default and their significance may vary over time to reflect changes in circumstances. The definition of default largely aligns with that applied for regulatory capital purposes.
Measurement of ECL The key inputs into the measurement of ECL are the term structure of the following variables: - probability of default (PD); - loss given default (LGD); and - exposure at default (EAD).
These parameters are generally derived from internally developed statistical models and other historical data. They are adjusted to reflect forward-looking information as described above.
PD estimates are estimates at a certain date, which are calculated based on statistical rating models. These statistical models are primarily based on internally compiled data comprising both quantitative and qualitative factors.

112
Notes to the Consolidated Financial Statements continuedAs at and for the year ended 31 December 2020 QAR ‘000s
4. FINANCIAL RISK MANAGEMENT (continued)
(b) Credit risk (continued)
(viii) Inputs, assumptions and techniques used for estimating impairment (continued)
Measurement of ECL (continued) LGD is the magnitude of the likely loss if there is a default. The Group has applied LGD factors based on the type of
collateral available and has used the LGD floors that are prescribed by QCB for certain collateral types. LGD estimation includes:
1) Cure Rate: Defined as the ratio of accounts which have fallen to default and have managed to move backward to the performing accounts.
2) Recovery Rate: Defined as the ratio of liquidation value to market value of the underlying collateral at the time of default would also account for expected recovery rate from a general claim on the individual’s assets for the unsecured portion of the exposure.
Discounting Rate: Defined as the opportunity cost of the recovery value not being realized on the day of default adjusted for time value.
EAD represents the expected exposure in the event of a default. The Group derives the EAD from the current exposure to the counterparty and potential changes to the current amount allowed under the contract including amortization. The EAD of a financial asset is its gross carrying amount.
For lending commitments and financial guarantees, the EAD includes the amount drawn, as well as potential future amounts that may be drawn under the contract, which are estimated based on historical observations and forward-looking forecasts.
Incorporation of forward-looking information Incorporating forward-looking information increases the level of judgement as to how changes in these
macroeconomic factors will affect the Expected Credit Loss (ECL) applicable to the stage 1 and stage 2 exposures which are considered as performing. The methodologies and assumptions involved, including any forecasts of future economic conditions, are reviewed periodically.
The assessment of Significant Increase in Credit Risk (SICR) and the calculation of ECL both incorporate forward-looking information. The Group has performed historical analysis and identified the key economic variables impacting credit risk and expected credit losses for each portfolio.
The Group employs statistical models to incorporate macro-economic factors on historical default rates. In the case that none of the macro-economic parameters are statistically significant or the results of forecasted PDs are too deviated from the present forecast of the economic conditions, qualitative PD overlay is used by management based on portfolio analysis.
These economic variables and their associated impact on the PD, EAD and LGD vary by financial instrument. Expert judgement has also been applied in this process. Forecasts of these economic variables (the ‘base economic scenario’) are based on available information and include mean reversion approaches for long-term forecasts. The impact of these economic variables on the PD has been determined by performing statistical regression analysis.

113
Notes to the Consolidated Financial Statements continuedAs at and for the year ended 31 December 2020 QAR ‘000s
4. FINANCIAL RISK MANAGEMENT (continued)
(b) Credit risk (continued)
(viii) Inputs, assumptions and techniques used for estimating impairment (continued)
Incorporation of forward-looking information (continued) In addition to the base economic scenario, other possible scenarios are assessed along with scenario weightings.
The number of other scenarios used is set based on the analysis of each major product type to ensure non linearities are captured. At 31 December 2020, the Group concluded that three scenarios appropriately captured non linearities for all portfolios. The scenario weightings are determined by a combination of statistical analysis and expert credit judgement, taking account of the range of possible outcomes each chosen scenario is representative of. The assessment of SICR is performed using the lifetime PD under each of the base, and other scenarios, multiplied by the associated scenario weighting, along with qualitative and backstop indicators. This determines whether the whole financial instrument is in Stage 1, Stage 2 or Stage 3 and hence whether 12-month or lifetime ECL should be recorded. Following this assessment, the Group measures ECL as either a probability weighted 12 month ECL (Stage 1), or a probability weighted lifetime ECL (Stages 2 and 3).
These probability-weighted ECLs are determined by running each scenario through the relevant ECL model and multiplying it by the appropriate scenario weighting (as opposed to weighting the inputs). As with any economic forecasts, the projections and likelihoods of occurrence are subject to a high degree of inherent uncertainty and therefore the actual outcomes may be significantly different to those projected. The Group considers these forecasts to represent its best estimate of the possible outcomes.
Predicted relationships between the key indicators and default and loss rates on various portfolios of financial assets have been developed based on analyzing historically data estimate of expected credit losses. In reality there will be interdependencies between the various economic inputs and the exposure to sensitivity will vary across the economic scenarios.
On the backdrop of COVID-19, despite reaffirmation of Qatar’s strong fundamentals and stable outlook by international bond markets, and the extraordinary measures taken by the Qatar Government to alleviate the financial and economic impact of COVID-19 on affected sectors, the Bank has decided to take a conservative view for the purpose of estimating expected credit loss. These assumptions include: oil prices will range bound at around $43/bbl (31 December 2019: $58/bbl to $61/bbl); and, conservative real GDP growth estimates around -3.5% (31 December 2019: 2.8% to 3.1%) for 2020. The Bank also continues to review its Loss Given Default assumptions and has made adjustments to the same. The aforementioned values of macro-economic factors have been further overlaid by applying conservative scenario weightings of 55%, 45% and 0% for Base, Downside and Upside case scenarios, respectively, (31 December 2019: 70% to the Base Case, 15% to Downside and Upside Case) reflecting a possibility of flattening of the oil prices at current levels (and consequently government revenue) over the medium term. As the COVID-19 situation continues to evolve, these estimates may be reassessed and adjusted in future.
Other forward-looking considerations not otherwise incorporated within the above scenarios, such as the impact of any regulatory, legislative or political changes, have also been considered, but are not deemed to have a material impact and therefore no adjustment has been made to the ECL for such factors. This is reviewed and monitored for appropriateness on a quarterly basis.
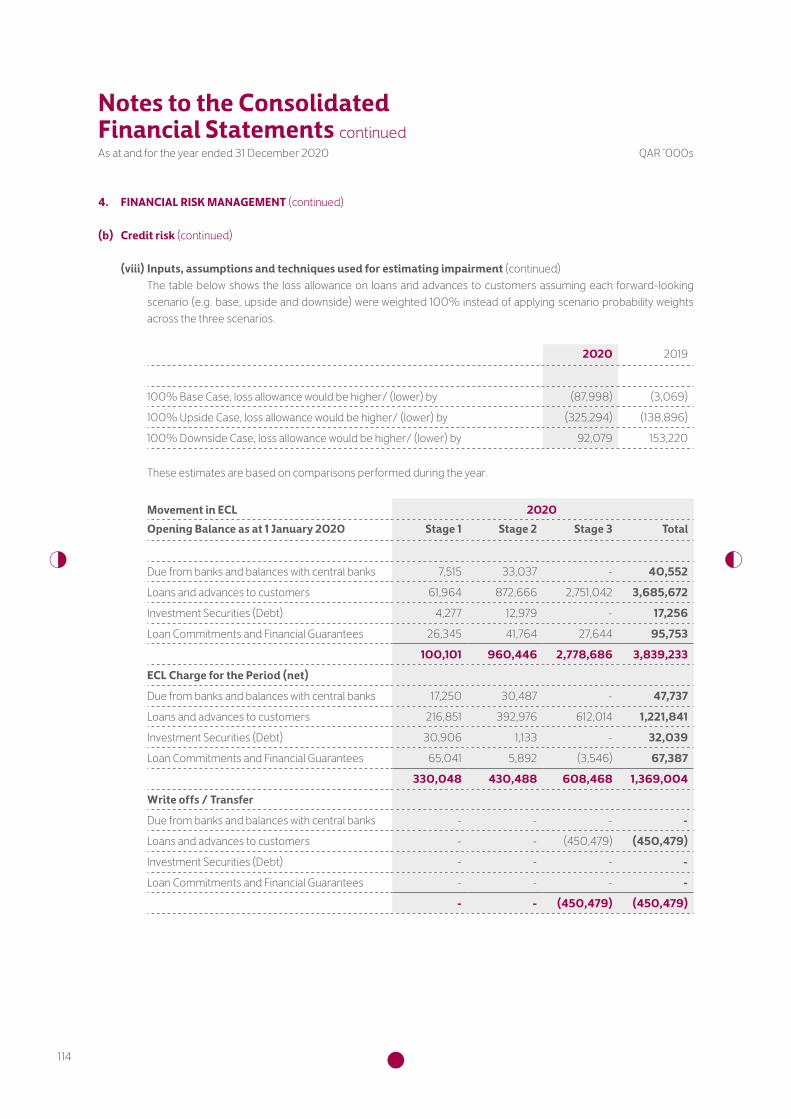
114
Notes to the Consolidated Financial Statements continuedAs at and for the year ended 31 December 2020 QAR ‘000s
4. FINANCIAL RISK MANAGEMENT (continued)
(b) Credit risk (continued)
(viii) Inputs, assumptions and techniques used for estimating impairment (continued) The table below shows the loss allowance on loans and advances to customers assuming each forward-looking
scenario (e.g. base, upside and downside) were weighted 100% instead of applying scenario probability weights across the three scenarios.
2020 2019
100% Base Case, loss allowance would be higher/ (lower) by (87,998) (3,069)
100% Upside Case, loss allowance would be higher/ (lower) by (325,294) (138,896)
100% Downside Case, loss allowance would be higher/ (lower) by 92,079 153,220
These estimates are based on comparisons performed during the year.
Movement in ECL 2020Opening Balance as at 1 January 2020 Stage 1 Stage 2 Stage 3 Total
Due from banks and balances with central banks 7,515 33,037 - 40,552
Loans and advances to customers 61,964 872,666 2,751,042 3,685,672
Investment Securities (Debt) 4,277 12,979 - 17,256
Loan Commitments and Financial Guarantees 26,345 41,764 27,644 95,753
100,101 960,446 2,778,686 3,839,233
ECL Charge for the Period (net)
Due from banks and balances with central banks 17,250 30,487 - 47,737
Loans and advances to customers 216,851 392,976 612,014 1,221,841
Investment Securities (Debt) 30,906 1,133 - 32,039
Loan Commitments and Financial Guarantees 65,041 5,892 (3,546) 67,387
330,048 430,488 608,468 1,369,004
Write offs / Transfer
Due from banks and balances with central banks - - - -
Loans and advances to customers - - (450,479) (450,479)
Investment Securities (Debt) - - - -
Loan Commitments and Financial Guarantees - - - -
- - (450,479) (450,479)

115
Notes to the Consolidated Financial Statements continuedAs at and for the year ended 31 December 2020 QAR ‘000s
4. FINANCIAL RISK MANAGEMENT (continued)
(b) Credit risk (continued)
(viii) Inputs, assumptions and techniques used for estimating impairment (continued)
2020Stage 1 Stage 2 Stage 3 Total
Exchange differences
Due from banks and balances with central banks (804) - - (804)
Loans and advances to customers 2,234 (25,737) (36,909) (60,412)
Investment Securities (Debt) (17) - - (17)
Loan Commitments and Financial Guarantees (1,721) 17 (553) (2,257)
(308) (25,720) (37,462) (63,490)
Closing Balance as at 31 December 2020
Due from banks and balances with central banks 23,961 63,524 - 87,485
Loans and Advances to Customers* 281,049 1,239,905 2,875,668 4,396,622
Investment Securities (Debt) 35,166 14,112 - 49,278
Loan Commitments and Financial Guarantees 89,665 47,673 23,545 160,883
429,841 1,365,214 2,899,213 4,694,268
* Allowances for impairment of loans and advances to customers includes QAR 892 million of interest in suspense (2019: QAR 711 million).
Movement in ECL 2019Opening Balance as at 1 January 2019 Stage 1 Stage 2 Stage 3 Total
Due from banks and balances with central banks 619 13,079 - 13,698
Loans and advances to customers 50,382 952,226 2,844,017 3,846,625
Investment Securities (Debt) 236 23,817 - 24,053
Loan Commitments and Financial Guarantees 25,711 76,308 1,953 103,972
76,948 1,065,430 2,845,970 3,988,348
ECL Charge for the Period (net)
Due from banks and balances with central banks 7,019 19,958 - 26,977
Loans and advances to customers 2,750 (39,394) 963,815 927,171
Investment Securities (Debt) 4,041 (10,838) - (6,797)
Loan Commitments and Financial Guarantees 6,122 (34,116) 67,125 39,131
19,932 (64,390) 1,030,940 986,482

116
Notes to the Consolidated Financial Statements continuedAs at and for the year ended 31 December 2020 QAR ‘000s
4. FINANCIAL RISK MANAGEMENT (continued)
(b) Credit risk (continued)
(viii) Inputs, assumptions and techniques used for estimating impairment (continued)
2019Stage 1 Stage 2 Stage 3 Total
Write offs / Transfer
Due from banks and balances with central banks - - - -
Loans and advances to customers - (10,084) (1,024,756) (1,034,840)
Investment Securities (Debt) - - - -
Loan Commitments and Financial Guarantees - - (41,198) (41,198)
- (10,084) (1,065,954) (1,076,038)
Exchange differences
Due from banks and balances with central banks (123) - - (123)
Loans and advances to customers 8,832 (30,082) (32,034) (53,284)
Investment Securities (Debt) - - - -
Loan Commitments and Financial Guarantees (5,488) (428) (236) (6,152)
3,221 (30,510) (32,270) (59,559)
Closing Balance as at 31 December 2019
Due from banks and balances with central banks 7,515 33,037 - 40,552
Loans and Advances to Customers 61,964 872,666 2,751,042 3,685,672
Investment Securities (Debt) 4,277 12,979 - 17,256
Loan Commitments and Financial Guarantees 26,345 41,764 27,644 95,753
100,101 960,446 2,778,686 3,839,233
(c) Liquidity risk Liquidity risk is the risk that the Group is unable to meet its obligations when they fall due as a result of e.g. customer
deposits being withdrawn, cash requirements from contractual commitments, or other cash outflows, such as debt maturities or margin calls for derivatives etc. Such outflows would deplete available cash resources for client lending, trading activities and investments. In extreme circumstances, lack of liquidity could result in reductions in the consolidated statement of financial position and sales of assets, or potentially an inability to fulfil lending commitments. The risk that the Group will be unable to do so is inherent in all banking operations and can be affected by a range of institution-specific and market-wide events including, but not limited to, credit events, merger and acquisition activity, systemic shocks and natural disasters.
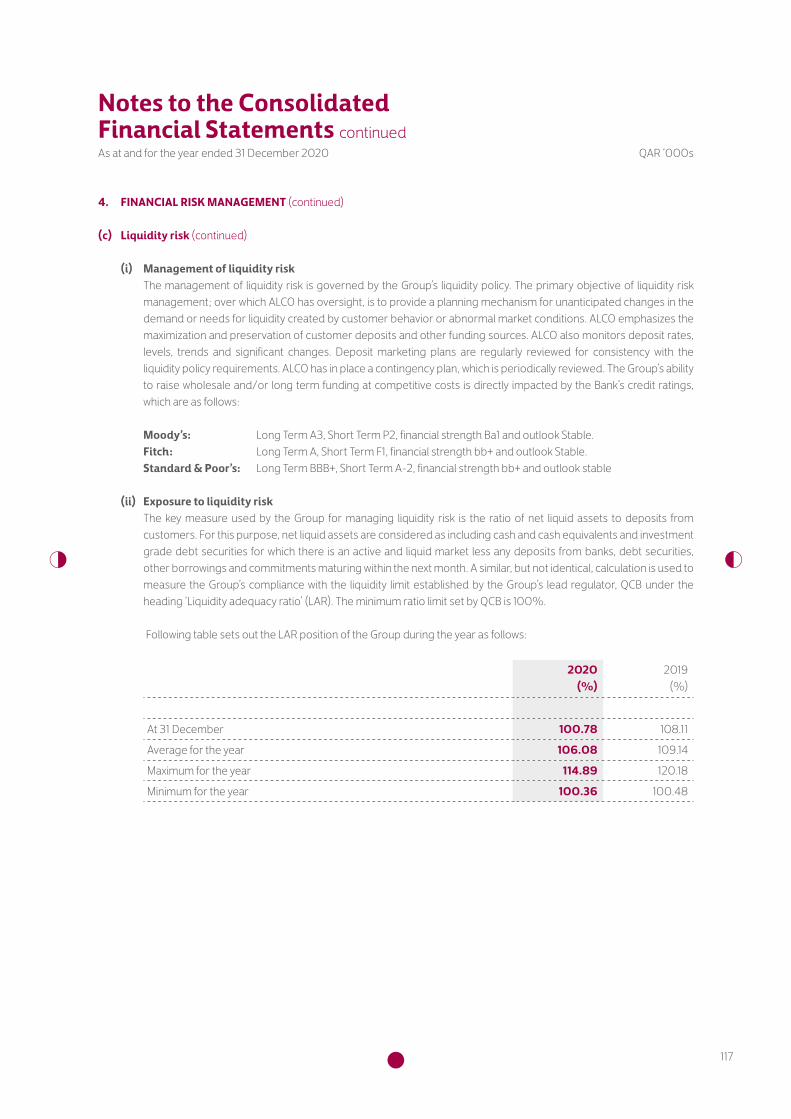
117
Notes to the Consolidated Financial Statements continuedAs at and for the year ended 31 December 2020 QAR ‘000s
4. FINANCIAL RISK MANAGEMENT (continued)
(c) Liquidity risk (continued)
(i) Management of liquidity risk The management of liquidity risk is governed by the Group’s liquidity policy. The primary objective of liquidity risk
management; over which ALCO has oversight, is to provide a planning mechanism for unanticipated changes in the demand or needs for liquidity created by customer behavior or abnormal market conditions. ALCO emphasizes the maximization and preservation of customer deposits and other funding sources. ALCO also monitors deposit rates, levels, trends and significant changes. Deposit marketing plans are regularly reviewed for consistency with the liquidity policy requirements. ALCO has in place a contingency plan, which is periodically reviewed. The Group’s ability to raise wholesale and/or long term funding at competitive costs is directly impacted by the Bank’s credit ratings, which are as follows:
Moody’s: Long Term A3, Short Term P2, financial strength Ba1 and outlook Stable. Fitch: Long Term A, Short Term F1, financial strength bb+ and outlook Stable. Standard & Poor’s: Long Term BBB+, Short Term A-2, financial strength bb+ and outlook stable
(ii) Exposure to liquidity risk The key measure used by the Group for managing liquidity risk is the ratio of net liquid assets to deposits from
customers. For this purpose, net liquid assets are considered as including cash and cash equivalents and investment grade debt securities for which there is an active and liquid market less any deposits from banks, debt securities, other borrowings and commitments maturing within the next month. A similar, but not identical, calculation is used to measure the Group’s compliance with the liquidity limit established by the Group’s lead regulator, QCB under the heading ‘Liquidity adequacy ratio’ (LAR). The minimum ratio limit set by QCB is 100%.
Following table sets out the LAR position of the Group during the year as follows:
2020(%)
2019(%)
At 31 December 100.78 108.11
Average for the year 106.08 109.14
Maximum for the year 114.89 120.18
Minimum for the year 100.36 100.48

118
Notes to the Consolidated Financial Statements continuedAs at and for the year ended 31 December 2020 QAR ‘000s
4. FINANCIAL RISK MANAGEMENT (continued)
(c) Liquidity risk (continued)
(iii) Maturity analysis The following table sets out the maturity profile of the Group’s assets and liabilities. The contractual maturities of
assets and liabilities have been determined on the basis of the remaining period at 31 December to the contractual maturity date and do not take account of the effective maturities as indicated by the Group’s deposit retention history and the availability of liquid funds. Management monitors the maturity profile to ensure that adequate liquidity is maintained.
Carrying amount
Demand / within
1 month 1-3 months3 months –
1 yearSubtotal
1 year 1-5 yearsMore than
5 years No Maturity
2020Cash and balances with central banks
8,278,537 2,890,659 - - 2,890,659 - - 5,387,878
Due from banks 10,401,014 5,564,842 1,458,600 2,962,451 9,985,893 415,121 - -
Loans and advances to customers
96,698,098 10,788,017 2,576,137 10,300,869 23,665,023 19,250,983 53,782,092 -
Investment securities
25,778,211 7,191 461,789 2,527,467 2,996,447 11,154,389 10,808,777 818,598
Investment in associates and a joint arrangement
3,116,557 - - - - - - 3,116,557
Property and equipment and all other assets
9,333,298 2,602,763 402,291 - 3,005,054 2,995,151 - 3,333,093
Total 153,605,715 21,853,472 4,898,817 15,790,787 42,543,076 33,815,644 64,590,869 12,656,126
Due to banks 20,006,985 9,806,955 4,469,548 5,274,050 19,550,553 203,048 253,384 -
Customer deposits 75,789,543 44,038,234 13,707,994 13,857,373 71,603,601 4,185,942 - -
Debt securities 13,107,134 182,463 2,040,317 3,490,996 5,713,776 6,030,537 1,362,821 -
Other borrowings 14,125,676 216,320 2,205,732 7,959,518 10,381,570 3,512,158 231,948 -
Other liabilities 8,405,896 4,321,852 953,528 2,315,979 7,591,359 814,537 - -
Total 131,435,234 58,565,824 23,377,119 32,897,916 114,840,859 14,746,222 1,848,153 -
Difference 22,170,481 (36,712,352) (18,478,302) (17,107,129) (72,297,783) 19,069,422 62,742,716 12,656,126
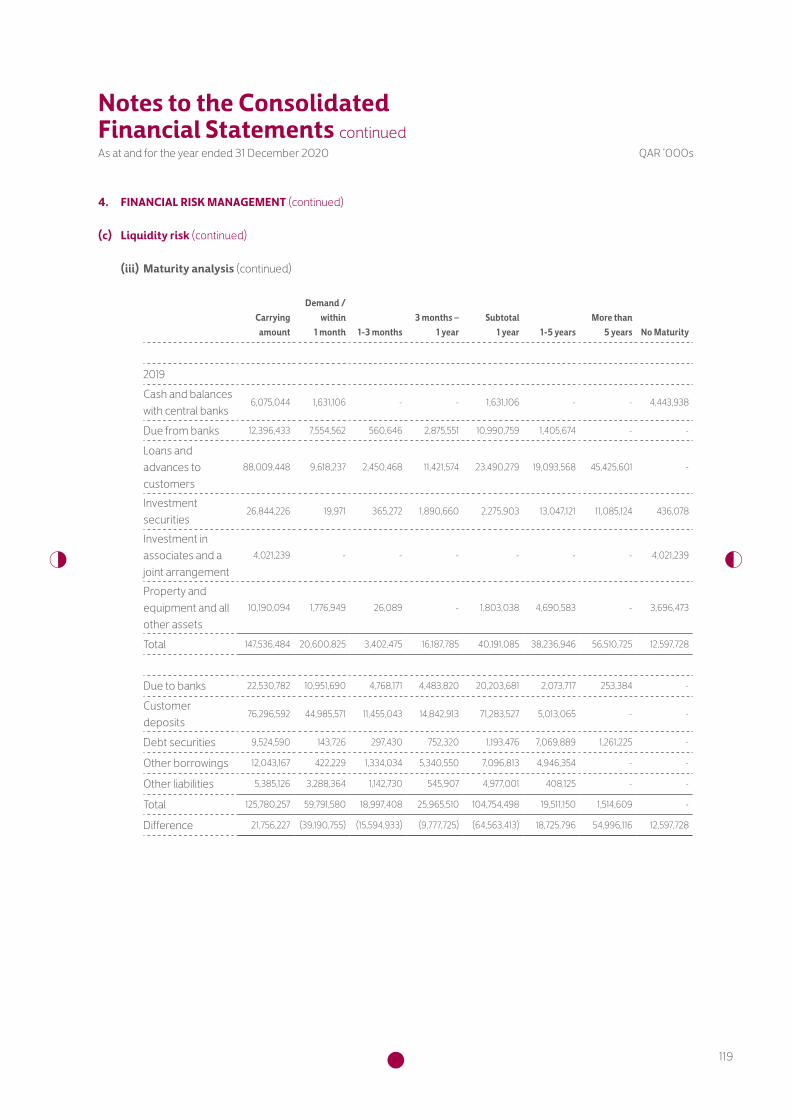
119
Notes to the Consolidated Financial Statements continuedAs at and for the year ended 31 December 2020 QAR ‘000s
4. FINANCIAL RISK MANAGEMENT (continued)
(c) Liquidity risk (continued)
(iii) Maturity analysis (continued)
Carrying amount
Demand / within
1 month 1-3 months3 months –
1 yearSubtotal
1 year 1-5 yearsMore than
5 years No Maturity
2019Cash and balances with central banks
6,075,044 1,631,106 - - 1,631,106 - - 4,443,938
Due from banks 12,396,433 7,554,562 560,646 2,875,551 10,990,759 1,405,674 - -
Loans and advances to customers
88,009,448 9,618,237 2,450,468 11,421,574 23,490,279 19,093,568 45,425,601 -
Investment securities
26,844,226 19,971 365,272 1,890,660 2,275,903 13,047,121 11,085,124 436,078
Investment in associates and a joint arrangement
4,021,239 - - - - - - 4,021,239
Property and equipment and all other assets
10,190,094 1,776,949 26,089 - 1,803,038 4,690,583 - 3,696,473
Total 147,536,484 20,600,825 3,402,475 16,187,785 40,191,085 38,236,946 56,510,725 12,597,728
Due to banks 22,530,782 10,951,690 4,768,171 4,483,820 20,203,681 2,073,717 253,384 -
Customer deposits
76,296,592 44,985,571 11,455,043 14,842,913 71,283,527 5,013,065 - -
Debt securities 9,524,590 143,726 297,430 752,320 1,193,476 7,069,889 1,261,225 -
Other borrowings 12,043,167 422,229 1,334,034 5,340,550 7,096,813 4,946,354 - -
Other liabilities 5,385,126 3,288,364 1,142,730 545,907 4,977,001 408,125 - -
Total 125,780,257 59,791,580 18,997,408 25,965,510 104,754,498 19,511,150 1,514,609 -
Difference 21,756,227 (39,190,755) (15,594,933) (9,777,725) (64,563,413) 18,725,796 54,996,116 12,597,728

120
Notes to the Consolidated Financial Statements continuedAs at and for the year ended 31 December 2020 QAR ‘000s
4. FINANCIAL RISK MANAGEMENT (continued)
(c) Liquidity risk (continued)
(iv) Maturity analysis (financial liabilities and derivatives) The table below summarizes the maturity profile of the Group’s financial liabilities at 31 December based on contractual
undiscounted repayment obligations.
2020Carrying
amount
Gross undiscounted
cash flowsLess than
1 month 1-3 months3 months –
1 year 1-5 yearsMore than
5 years
Non-derivative financial liabilitiesDue to banks 20,006,985 21,018,672 9,889,605 4,445,636 6,187,663 210,670 285,098
Customer deposits 75,789,543 76,685,385 44,535,786 13,880,596 14,031,635 4,237,368 -
Debt securities 13,107,134 14,907,263 187,103 2,055,339 4,800,641 6,953,485 910,695
Other borrowings 14,125,676 14,445,693 219,881 2,222,083 8,169,722 3,602,303 231,704
Total liabilities 123,029,338 127,057,013 54,832,375 22,603,654 33,189,661 15,003,826 1,427,497
2019Carrying amount
Gross undiscounted
cash flowsLess than
1 month 1-3 months3 months –
1 year 1-5 yearsMore than
5 years
Non-derivative financial liabilitiesDue to banks 22,530,782 24,001,339 11,148,211 4,851,681 5,542,683 2,164,738 294,026
Customer deposits 76,296,592 77,685,628 45,794,237 11,656,175 15,125,744 5,109,472 -
Debt securities 9,524,590 11,999,211 155,456 303,258 920,432 7,839,350 2,780,715
Other borrowings 12,043,167 12,639,842 432,450 1,481,117 5,471,222 5,255,053 -
Total liabilities 120,395,131 126,326,020 57,530,354 18,292,231 27,060,081 20,368,613 3,074,741

121
Notes to the Consolidated Financial Statements continuedAs at and for the year ended 31 December 2020 QAR ‘000s
4. FINANCIAL RISK MANAGEMENT (continued)
(c) Liquidity risk (continued)
(iv) Maturity analysis (financial liabilities and derivatives) (continued)
Derivative financial instruments: Generally, forward foreign exchange contracts are settled on a gross basis and interest rate swaps are settled on a net
basis.
2020 Total 1-3 months3 months –
1 year 1-5 yearsMore than 5
years
Derivatives Held for Trading:Forward foreign exchange contracts:
Outflow (24,726,645) (9,577,210) (2,863,279) (8,943,978) (3,342,178)
Inflow 24,273,283 9,350,891 2,855,802 8,724,013 3,342,577
Interest rate swaps:
Outflow (2,383,799) (3,735) (186,217) (1,375,220) (818,627)
Inflow 2,410,152 6,364 193,987 1,389,147 820,654Derivatives Held as Fair Value Hedges:Interest rate swaps:
Outflow (313,669) - (22,800) (99,005) (191,864)
Inflow 31,580 - 2,115 8,792 20,673Derivatives Held as Cash Flow Hedges:Forward foreign exchange contracts:
Outflow (4,664,191) (1,316,125) (460,683) (2,887,383) -
Inflow 4,800,575 1,384,472 424,242 2,991,861 -
Interest rate swaps:
Outflow (392,460) (7,352) (115,026) (270,082) -
Inflow 375,803 4,037 104,552 267,214 -
Total Outflows (32,480,764) (10,904,422) (3,648,005) (13,575,668) (4,352,669)
Total Inflows 31,891,393 10,745,764 3,580,698 13,381,027 4,183,904

122
Notes to the Consolidated Financial Statements continuedAs at and for the year ended 31 December 2020 QAR ‘000s
4. FINANCIAL RISK MANAGEMENT (continued)
(c) Liquidity risk (continued)
(iv) Maturity analysis (financial liabilities and derivatives) (continued)
Derivative financial instruments: Generally, forward foreign exchange contracts are settled on a gross basis and interest rate swaps are settled on a net
basis.
2019 Total 1-3 months3 months –
1 year 1-5 yearsMore than 5
years
Derivatives Held for Trading:Forward foreign exchange contracts
Outflow (23,838,530) (7,255,454) (2,133,677) (9,976,329) (4,473,070)
Inflow 23,884,092 7,327,951 2,135,873 9,947,720 4,472,548
Interest rate swaps:
Outflow (806,861) (159) (3,665) (267,615) (535,422)
Inflow 826,333 1,661 9,207 279,601 535,864Derivatives Held as Fair Value Hedges:Interest rate swaps:
Outflow (348,207) (3,902) (17,550) (89,924) (236,831)
Inflow 304,973 4,506 14,934 76,081 209,452Derivatives Held as Cash Flow Hedges:Forward foreign exchange contracts:
Outflow (2,399,405) - (87,966) (2,311,439) -
Inflow 2,233,481 - 15,137 2,218,344 -
Interest rate swaps:
Outflow (28,455) (9,111) (19,344) - -
Inflow 15,210 5,003 10,207 - -
Total Outflows (27,421,458) (7,268,626) (2,262,202) (12,645,307) (5,245,323)
Total Inflows 27,264,089 7,339,121 2,185,358 12,521,746 5,217,864

123
Notes to the Consolidated Financial Statements continuedAs at and for the year ended 31 December 2020 QAR ‘000s
4. FINANCIAL RISK MANAGEMENT (continued)
(c) Liquidity risk (continued)
(v) Off-balance sheet items The table below summarizes contractual expiry dates of the Group’s off - financial position financial instruments:
2020 Below 1 Year Above 1 Year Total
Loan commitments 1,914,115 2,551,019 4,465,134
Guarantees and other financial facilities 8,339,842 11,740,402 20,080,244
Capital commitments 127,548 - 127,548
Total liabilities 10,381,505 14,291,421 24,672,926
2019 Below 1 Year Above 1 Year Total
Loan commitments 1,854,247 2,433,624 4,287,871
Guarantees and other financial facilities 12,131,603 10,928,886 23,060,489
Capital commitments 421,352 - 421,352
Total liabilities 14,407,202 13,362,510 27,769,712
(d) Market risk The Group takes exposure to market risk, which is the risk that the fair value or future cash flows of a financial instrument
will fluctuate because of changes in market prices. Market risks arise from open positions in interest rate, currency and equity products, all of which are exposed to general and specific market movements and changes in the level of volatility of market rates or prices such as interest rates, credit spreads, foreign exchange rates and equity prices. The Group separates exposures to market risk into either trading or non-trading portfolios and by product type.
The market risks arising from trading and non-trading activities are concentrated in Group Treasury and monitored by two teams separately. Regular reports are submitted to the Board of Directors and heads of each business unit.
Trading portfolios include those positions arising from market-making transactions where the Group acts as principal with clients or with the market.
Non-trading portfolios primarily arise from the interest rate management of the entity’s retail and commercial banking assets and liabilities. Non-trading portfolios also consist of foreign exchange and sovereign bond investments.
124
Notes to the Consolidated Financial Statements continuedAs at and for the year ended 31 December 2020 QAR ‘000s
4. FINANCIAL RISK MANAGEMENT (continued)
(d) Market risks (continued)
(i) Management of market risks Overall authority for market risk is vested in ALCO. Group Market Risk is responsible for the development of detailed
risk management policies (subject to review and approval by ALCO) and for the day-to-day review of their implementation.
The Group’s proprietary investments are managed according to the Group’s internal investment policy, which has been approved by the Board of Directors and drafted in accordance with the Qatar Central Bank guidelines. The Group’s trading activities are conducted by Treasury and Investments Division. These activities are subject to business line guidelines and policies. The Group employs several techniques to measure and control activities including sensitivity analysis, position limits and risk based limits.
Investment proposals are approved at the Investment Committee and decisions driven by the investment strategy, which is developed by the business line under ALCO oversight and approved by the Board.
(ii) Exposure to interest rate risk – non – trading portfolio The principal risk to which non-trading portfolios are exposed is the risk of loss from fluctuations in the future cash
flows or fair values of financial instruments because of a change in market interest rates. Interest rate risk is managed principally through monitoring interest rate gaps and by having pre-approved limits for repricing bands. ALCO is the monitoring body for compliance with these limits and is assisted by Group Treasury in its day-to-day monitoring activities.
The Group takes on exposure to the effects of fluctuations in the prevailing levels of market interest rates on both its fair value and cash flow risks. Interest margins may increase as a result of such changes but may reduce losses in the event that unexpected movements arise. The Board sets limits on the level of mismatch of interest rate repricing that may be undertaken, which is monitored daily by Group Treasury.
The Asset and Liability Management (“ALM”) process, managed through ALCO, is used to manage interest rate risk associated with non-trading financial instruments. Interest rate risk represents the most significant market risk exposure to the Group’s non-trading financial instruments.
The Group’s goal is to manage interest rate sensitivity so that movements in interest rates do not adversely affect net interest income. Interest rate risk is measured as the potential volatility to the net interest rate income caused by changes in market interest rates. The Group typically manages the interest rate risk of its non-trading financial instruments by segmenting these assets and liabilities into two broad portfolios: non–discretionary and discretionary. The non-discretionary portfolio consists of the Group’s customer driven loans and deposit positions and securities required to support regulatory requirements. To manage the resulting interest rate sensitivity of the Group’s non-discretionary portfolio, the Group uses a discretionary portfolio of securities, long dated deposits, inter-bank takings and placements, and when warranted, derivatives. Strategically positioning the discretionary portfolio, the Group largely manages the interest rate sensitivity in the non-discretionary portfolio.
The following table summarizes the interest sensitivity position at year end, by reference to the re-pricing period or maturity of the Group’s assets and liabilities.

125
Notes to the Consolidated Financial Statements continuedAs at and for the year ended 31 December 2020 QAR ‘000s
4. FINANCIAL RISK MANAGEMENT (continued)
(d) Market risks (continued)
(ii) Exposure to interest rate risk – non – trading portfolio (continued) A summary of the Group’s interest rate gap position on non-trading balances are as follows:
Repricing in:Effective
interest rate %2020
Carrying amount
Less than 3 months 3-12 months 1-5 years
More than 5 years
Non- interest
sensitive
Cash and balances with central banks 8,278,537 2,796,073 - - - 5,482,464 -
Due from banks 10,401,014 7,003,679 3,397,335 - - - 1.79%Loans and advances to customers
96,698,098 40,328,884 49,004,989 3,140,173 835,460 3,388,592 4.91%
Investment securities 25,778,211 1,583,294 3,507,324 8,935,315 9,910,557 1,841,721 4.28%
Investment in associates and a joint arrangement
3,116,557 - - - - 3,116,557 -
Property and equipment and all other assets
9,333,298 - - - - 9,333,298 -
153,605,715 51,711,930 55,909,648 12,075,488 10,746,017 23,162,632 -
Due to banks (20,006,985) (14,276,504) (5,730,481) - - - 1.79%Customer deposits (75,789,543) (43,060,955) (13,857,373) (4,185,942) - (14,685,273) 2.42%
Debt securities (13,107,134) (1,422,763) (4,287,073) (6,033,550) (1,363,748) - 3.81%
Other borrowings (14,125,676) (2,182,560) (11,688,594) (190,619) (63,903) - 2.40%
Other liabilities (8,405,896) - - - - (8,405,896) -
Equity (22,170,481) - - - - (22,170,481) -
(153,605,715) (60,942,782) (35,563,521) (10,410,111) (1,427,651) (45,261,650) -Interest rate sensitivity gap - (9,230,852) 20,346,127 1,665,377 9,318,366 (22,099,018) -
Cumulative Interest rate sensitivity gap
- (9,230,852) 11,115,275 12,780,652 22,099,018 - -

126
Notes to the Consolidated Financial Statements continuedAs at and for the year ended 31 December 2020 QAR ‘000s
4. FINANCIAL RISK MANAGEMENT (continued)
(d) Market risks (continued)
(ii) Exposure to interest rate risk – non – trading portfolio (continued) A summary of the Group’s interest rate gap position on non-trading balances are as follows:
Repricing in:Effective
interest rate %2019
Carrying amount
Less than 3 months 3-12 months 1-5 years
More than 5 years
Non- interest
sensitive
Cash and balances with central banks 6,075,044 2,392,663 - - - 3,682,381 -
Due from banks 12,396,433 8,115,209 4,281,224 - - - 3.01%Loans and advances to customers
88,009,448 37,268,422 43,780,437 4,785,851 705,096 1,469,642 6.67%
Investment securities 26,844,226 1,621,866 2,895,737 11,659,216 10,231,329 436,078 4.73%
Investment in associates and a joint arrangement
4,021,239 - - - - 4,021,239 -
Property and equipment and all other assets
10,190,094 - - - - 10,190,094 -
147,536,484 49,398,160 50,957,398 16,445,067 10,936,425 19,799,434 -
Due to banks (22,530,782) (15,918,496) (6,612,286) - - - 3.61%Customer deposits (76,296,592) (44,590,651) (15,265,298) (5,013,065) - (11,427,578) 3.71%
Debt securities (9,524,590) (441,156) (1,064,513) (6,757,695) (1,261,226) - 3.95%
Other borrowings (12,043,167) (2,434,614) (9,529,003) (79,550) - - 3.84%
Other liabilities (5,385,126) (97,059) (30,449) (19,197) (65,236) (5,173,185) -
Equity (21,756,227) - - - - (21,756,227) -
(147,536,484) (63,481,976) (32,501,549) (11,869,507) (1,326,462) (38,356,990) -Interest rate sensitivity gap - (14,083,816) 18,455,849 4,575,560 9,609,963 (18,557,556) -
Cumulative Interest rate sensitivity gap
- (14,083,816) 4,372,033 8,947,593 18,557,556 - -

127
Notes to the Consolidated Financial Statements continuedAs at and for the year ended 31 December 2020 QAR ‘000s
4. FINANCIAL RISK MANAGEMENT (continued)
(d) Market risks (continued)
(ii) Exposure to interest rate risk – non – trading portfolio (continued)
Sensitivity analysis The management of interest rate risk against interest rate gap limits is supplemented by monitoring the sensitivity of
the Group’s financial assets and liabilities to various standard and non-standard interest rate scenarios. Standard scenarios that are considered on a monthly basis include a 25 basis point (bp) parallel fall or rise in all yield curves worldwide and a 25 bp rise or fall in the greater than 12-month portion of all yield curves. An analysis of the Group’s sensitivity to an increase or decrease in market interest rates, assuming no a symmetrical movement in yield curves and a constant financial position, is as follows:
Sensitivity of net interest income25 bp parallel
increase25 bp parallel
decrease
2020
At 31 December 82,764 (82,764)
Average for the year 46,964 (46,964)
2019
At 31 December 8,919 (8,919)
Average for the year 22,696 (22,696)
Sensitivity to reported Fair value reserve in equity of interest rate movements
25 bp parallel increase
25 bp parallel decrease
2020
At 31 December 757 (757)
Average for the year 464 (464)
2019
At 31 December 172 (172)
Average for the year 88 (88)
Interest rate movements affect reported equity in the following ways: • Retained earnings arising from increases or decreases in net interest income and the fair value changes reported
in profit or loss; and • Fair value reserves arising from increases or decreases in fair values of debt securities which are reported
directly in other comprehensive income.
Overall non-trading interest rate risk positions are managed by Group Treasury, which uses investment securities, advances to banks, deposits from banks and derivative instruments to manage the overall position arising from the Group’s non-trading activities.

128
Notes to the Consolidated Financial Statements continuedAs at and for the year ended 31 December 2020 QAR ‘000s
4. FINANCIAL RISK MANAGEMENT (continued)
(d) Market risks (continued)
(ii) Exposure to interest rate risk – non – trading portfolio (continued)
Inter Bank Offered Rate (IBOR) Reforms Effective from 1 January 2020, the Group has implemented amendments to IFRS 9 Financial Instruments, IAS 39
Financial Instruments: Recognition and Measurement and IFRS 7 Financial Instruments Disclosures relating to interest rate benchmark reforms. The amendments (referred as Phase I of IBOR transition project) provide temporary reliefs which enable hedge accounting to continue during the period of uncertainty before the replacement of an existing interest rate benchmark with an alternative nearly risk-free interest rate (an “RFR”). A hedging relationship is affected if interest rate benchmark reform gives rise to uncertainties about the timing and or amount of benchmark-based cash flows of the hedged item or the hedging instrument. Such uncertainty may impact the hedging relationship, for example its effectiveness assessment and highly probable assessment. The reliefs cease to apply once certain conditions are met. These include when the uncertainty arising from IBOR reform is no longer present with respect to the timing and amount of the benchmark-based cash flows of the hedged item, if the hedging relationship is discontinued or once amounts in the cash flow hedge reserve have been released.
The Bank has IBOR exposure to LIBOR linked contracts for Loans, Bank Borrowings, Repurchase agreements, Derivatives and Debt issuances that mature beyond the end of 2021 and are generally expected to transition to RFRs. The Bank has established a cross-functional IBOR steering committee sponsored by the Executive Management which is evaluating the IBORs related exposure, managing the transition activities to the alternative reference rates, engagement with various stakeholders to support an orderly transition and to mitigate the risks resulting from the transition. It provides periodic reports to ALCO and Central Treasury to support management of interest rate risk, and works closely with the Group Operational Risk Committee to identify operational risks arising from IBOR reform. The project is under the governance of the Chief Risk Officer.
The IBOR steering committee is in the process of establishing policies for amending the interbank offered rates on its existing floating-rate financial assets and liabilities indexed to IBORs that will be replaced as part of IBOR reforms. The Bank expects that certain exposures such as retail products, will be amended in a uniform way. However, the Bank expects to participate in bilateral negotiations with the counterparties in its bespoke products, such as Loans and Advances issued to corporates. The Bank expects to begin amending the contractual terms of its existing floating-rate assets in the 2021; however, the exact timing will vary depending on the extent to which standardized language can be applied across certain asset types and the extent of bilateral negotiations between the Bank and counterparties. Further, the IBOR Committee and the Bank’s treasury team are in discussions with the counterparties of our financial liabilities to amend the contractual terms in preparation for IBOR reform.
The Group holds derivatives for risk management purposes, some of which are designated in hedging relationships. The interest rate and foreign exchange derivative instruments have floating legs that are indexed to various IBORs. Currently, the desired substitute rates are the Sterling Overnight Index Average (SONIA) for GBP LIBOR and Secured Overnight Financing Rate (SOFR) for USD LIBOR.

129
Notes to the Consolidated Financial Statements continuedAs at and for the year ended 31 December 2020 QAR ‘000s
4. FINANCIAL RISK MANAGEMENT (continued)
(d) Market risks (continued)
(iii) Exposure to other market risks – non-trading portfolios
Foreign currency transactions The Group monitors any concentration risk in relation to any individual currency in regard to the translation of foreign
currency transactions and monetary assets and liabilities. The table shows the net foreign currency exposure by major currencies at the end of the reporting period along with the sensitivities if there were to be a change in the currency exchange rate.
Net foreign currency exposure: 2020 2019
Pound Sterling (297,932) (498,768)
Euro (2,283,393) (324,782)
USD (15,635,579) (8,241,260)
Other currencies (65,988) 2,058,159
Increase (decrease) in profit or loss
Increase (decrease) in fair value reserve
5% increase in currency exchange rate 2020 2019 2020 2019
Pound Sterling (14,897) (24,938) - -
Euro (114,170) (16,239) - -
USD (781,779) (412,063) - -
Other currencies (3,299) 102,908 32,153 - Open exchange position in other currencies represents Group’s investment in associates and a joint arrangement
denominated in OMR and AED.
Equity price risk Equity price risk is the risk that the fair value of equities decreases as a result of changes in the equity indices and
individual stocks. The non-trading equity price risk exposure arises from equity securities classified as fair value through other comprehensive income. A 10 per cent increase in the Qatar Exchange market index at 31 December 2020 would have increased equity by QAR Nil (2019: QAR Nil). An equivalent decrease would have resulted in an equivalent but opposite impact.

130
Notes to the Consolidated Financial Statements continuedAs at and for the year ended 31 December 2020 QAR ‘000s
4. FINANCIAL RISK MANAGEMENT (continued)
(d) Market risks (continued)
(iii) Exposure to other market risks – non-trading portfolios (continued)
Equity price risk (continued) The Group is also exposed to equity price risk and the sensitivity analysis there of is as follows:
2020 2019
Increase / (decrease) in other comprehensive income:
Qatar Exchange - -
The above analysis has been prepared on the assumption that all other variables such as interest rate, foreign exchange rate, etc. are held constant and is based on historical correlation of the equity securities to the relevant index. Actual movement may be different from the one stated above and is subject to impairment assessment at the end of each reporting period.
(e) Operational risks Operational risk is the risk of direct or indirect loss arising from a wide variety of causes associated with the Group’s
involvement with financial instruments, including processes, personnel, technology and infrastructure, and from external factors other than credit, market and liquidity risks such as those arising from legal and regulatory requirements and generally accepted standards of corporate behavior.
The Group’s objective is to manage operational risk so as to balance the avoidance of financial losses and damage to the Group’s reputation with overall cost effectiveness and to avoid Control procedures that restrict initiative and creativity.
The primary responsibility for the development and implementation of controls to address Operational risk is assigned to senior management within each business unit. This responsibility is supported by the development of overall Group standards for the management of operational risk in the following areas:
• requirements for appropriate segregation of duties, including the independent authorization of transactions; • requirements for the reconciliation and monitoring of transactions; • compliance with regulatory and other legal requirements; • documentation of controls and procedures; • requirements for the periodic assessment of operational risks faced, and the adequacy of controls and procedures
to address the risks identified; • requirements for the reporting of operational losses and proposed remedial action; • development of contingency plans; • training and professional development; • ethical and business standards; and • risk mitigation, including insurance where this is effective.
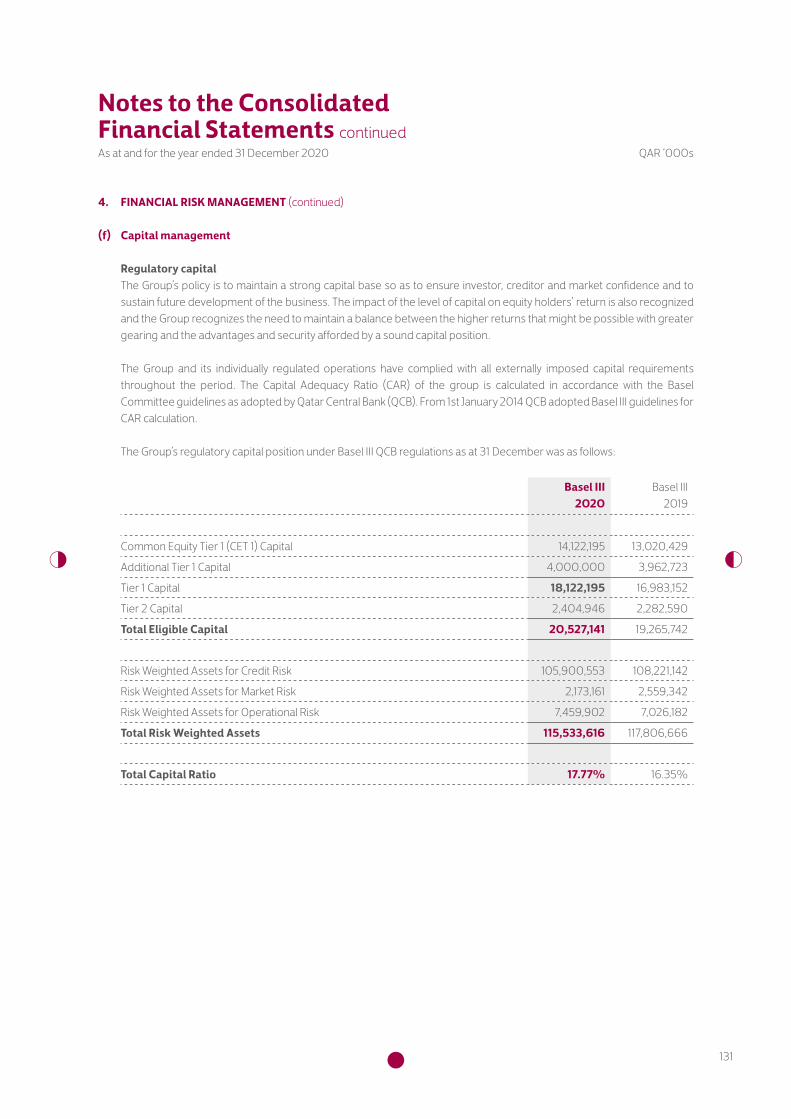
131
Notes to the Consolidated Financial Statements continuedAs at and for the year ended 31 December 2020 QAR ‘000s
4. FINANCIAL RISK MANAGEMENT (continued)
(f) Capital management
Regulatory capital The Group’s policy is to maintain a strong capital base so as to ensure investor, creditor and market confidence and to
sustain future development of the business. The impact of the level of capital on equity holders’ return is also recognized and the Group recognizes the need to maintain a balance between the higher returns that might be possible with greater gearing and the advantages and security afforded by a sound capital position.
The Group and its individually regulated operations have complied with all externally imposed capital requirements throughout the period. The Capital Adequacy Ratio (CAR) of the group is calculated in accordance with the Basel Committee guidelines as adopted by Qatar Central Bank (QCB). From 1st January 2014 QCB adopted Basel III guidelines for CAR calculation.
The Group’s regulatory capital position under Basel III QCB regulations as at 31 December was as follows:
Basel III2020
Basel III2019
Common Equity Tier 1 (CET 1) Capital 14,122,195 13,020,429
Additional Tier 1 Capital 4,000,000 3,962,723
Tier 1 Capital 18,122,195 16,983,152
Tier 2 Capital 2,404,946 2,282,590
Total Eligible Capital 20,527,141 19,265,742
Risk Weighted Assets for Credit Risk 105,900,553 108,221,142
Risk Weighted Assets for Market Risk 2,173,161 2,559,342
Risk Weighted Assets for Operational Risk 7,459,902 7,026,182
Total Risk Weighted Assets 115,533,616 117,806,666
Total Capital Ratio 17.77% 16.35%
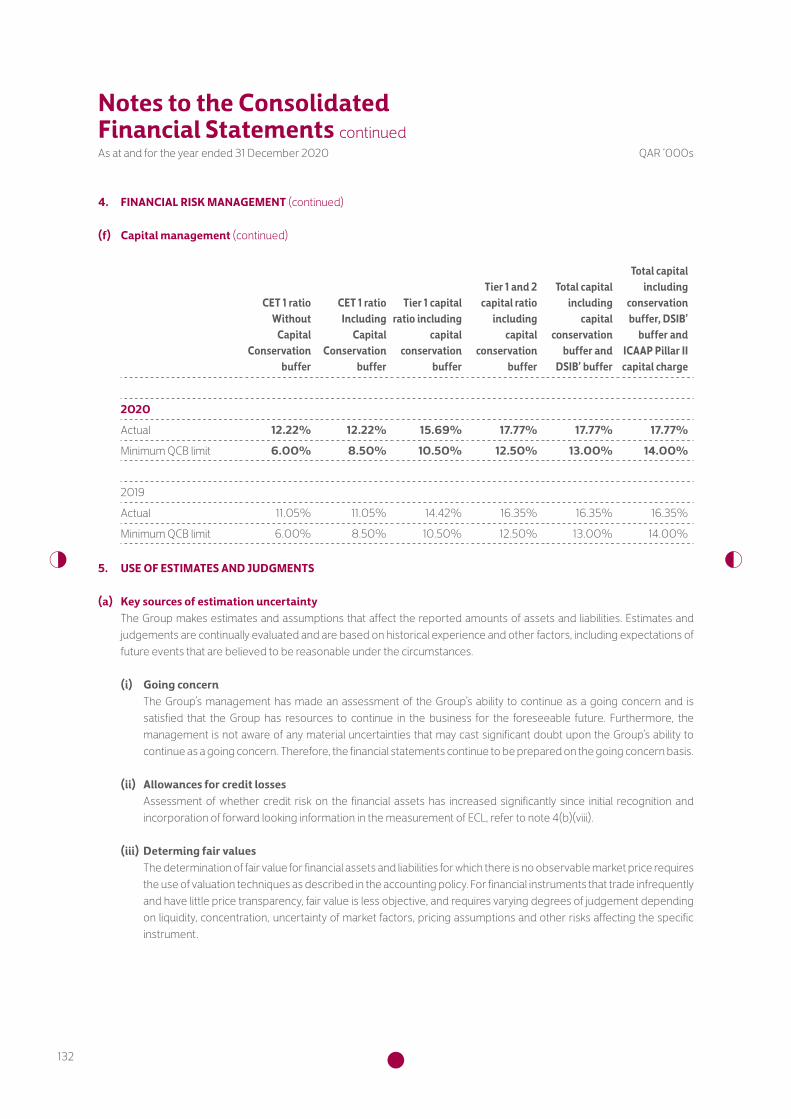
132
Notes to the Consolidated Financial Statements continuedAs at and for the year ended 31 December 2020 QAR ‘000s
4. FINANCIAL RISK MANAGEMENT (continued)
(f) Capital management (continued)
CET 1 ratio Without
Capital Conservation
buffer
CET 1 ratio Including
Capital Conservation
buffer
Tier 1 capital ratio including
capital conservation
buffer
Tier 1 and 2 capital ratio
including capital
conservation buffer
Total capital including
capital conservation
buffer and DSIB’ buffer
Total capital including
conservation buffer, DSIB’
buffer and ICAAP Pillar II capital charge
2020
Actual 12.22% 12.22% 15.69% 17.77% 17.77% 17.77%
Minimum QCB limit 6.00% 8.50% 10.50% 12.50% 13.00% 14.00%
2019
Actual 11.05% 11.05% 14.42% 16.35% 16.35% 16.35%
Minimum QCB limit 6.00% 8.50% 10.50% 12.50% 13.00% 14.00%
5. USE OF ESTIMATES AND JUDGMENTS
(a) Key sources of estimation uncertainty The Group makes estimates and assumptions that affect the reported amounts of assets and liabilities. Estimates and
judgements are continually evaluated and are based on historical experience and other factors, including expectations of future events that are believed to be reasonable under the circumstances.
(i) Going concern The Group’s management has made an assessment of the Group’s ability to continue as a going concern and is
satisfied that the Group has resources to continue in the business for the foreseeable future. Furthermore, the management is not aware of any material uncertainties that may cast significant doubt upon the Group’s ability to continue as a going concern. Therefore, the financial statements continue to be prepared on the going concern basis.
(ii) Allowances for credit losses Assessment of whether credit risk on the financial assets has increased significantly since initial recognition and
incorporation of forward looking information in the measurement of ECL, refer to note 4(b)(viii).
(iii) Determing fair values The determination of fair value for financial assets and liabilities for which there is no observable market price requires
the use of valuation techniques as described in the accounting policy. For financial instruments that trade infrequently and have little price transparency, fair value is less objective, and requires varying degrees of judgement depending on liquidity, concentration, uncertainty of market factors, pricing assumptions and other risks affecting the specific instrument.

133
Notes to the Consolidated Financial Statements continuedAs at and for the year ended 31 December 2020 QAR ‘000s
5. USE OF ESTIMATES AND JUDGMENTS (continued)
(a) Key sources of estimation uncertainty (continued)
(iii) Determing fair values (continued) Where the fair values of financial assets and financial liabilities cannot be derived from active markets, they are
determined using a variety of valuation techniques that include the use of mathematical models. The inputs to these models are taken from observable markets where possible, but where this is not feasible, a degree of judgment is required in establishing fair values. The judgments include considerations of liquidity and model inputs such as correlation and volatility for longer dated derivatives.
(iv) Goodwill impairment Goodwill is tested annually for impairment or more frequently if events or changes in circumstances indicate a
potential impairment; assets are grouped together into smallest group of assets that generates cash inflows from continuing use that is largely independent of the cash inflows of other assets or Cash Generating Units (CGUs). Goodwill arising from a business combination is allocated to the CGU which is expected to benefit from the synergies of the combination.
The ‘recoverable amount’ of an asset or CGU is the greater of its value in use and its fair value less costs to sell. ‘Value in use’ is based on the estimated future cash flows, discounted to their present value using a pre-tax discount rate that reflects current market assessments of the time value of money and the risks specific to the asset or CGU.
An impairment loss is recognized if the carrying amount of an asset or CGU exceeds its recoverable amount.
Impairment losses are recognized in profit or loss. They are allocated first to reduce the carrying amount of any goodwill allocated to the CGU, and then to reduce the carrying amounts of the other assets in the CGU on a pro rata basis.
(b) Critical accounting judgements in applying the Group’s accounting policies
(i) Valuation of financial instruments The Group’s accounting policy on fair value measurements is discussed in the significant accounting policies section.
The Group measures fair values using the following fair value hierarchy that reflects the significance of the inputs used in making the measurements.
• Level 1: Inputs that are quoted market prices (unadjusted) in active markets for identical instruments.
• Level 2: Inputs other than quoted prices included within Level1 that are observable either directly (i.e.as prices) or indirectly (i.e. derived from prices). This category includes instruments valued using: quoted market prices in active markets for similar instruments; quoted prices for identical or similar instruments in markets that are considered less than active; or other valuation techniques in which all significant inputs are directly or indirectly observable from market data.
• Level 3: Inputs that are unobservable. This category includes all instruments for which the valuation technique includes inputs not based on observable data and the unobservable inputs have a significant effect on the instrument’s valuation. This category includes instruments that are value based on quoted prices for similar instruments for which significant unobservable adjustments or assumptions are required to reflect differences between the instruments.

134
Notes to the Consolidated Financial Statements continuedAs at and for the year ended 31 December 2020 QAR ‘000s
5. USE OF ESTIMATES AND JUDGMENTS (continued)
(b) Critical accounting judgements in applying the Group’s accounting policies (continued)
(i) Valuation of financial instruments (continued) Fair values of financial assets and financial liabilities that are traded in active markets are based on quoted market
prices or dealer price quotations. For all other financial instruments, the Group determines fair values using valuation techniques. Valuation techniques include net present value and discounted cash flow models and comparison to similar instruments for which market observable prices exist.
The table below analyses financial instruments measured at fair value at the end of the reporting period, by the level in the fair value hierarchy into which the fair value measurement is categorised:
Level 1 Level 2 Level 3Carrying
amount
2020
Derivative assets - 1,621,501 - 1,621,501Investment securities 2,284,663 4,874,555 36,320 7,195,538
2,284,663 6,496,056 36,320 8,817,039Derivative liabilities - 1,059,829 - 1,059,829
- 1,059,829 - 1,059,829
2019
Derivative assets - 764,320 - 764,320
Investment securities 1,004,890 5,651,830 29,102 6,685,822
1,004,890 6,416,150 29,102 7,450,142
Derivative liabilities - 526,643 - 526,643
- 526,643 - 526,643
There have been no transfers between level 1 and level 2 Reconciliation of level 3 investments are as follows:
2020 2019
Balance at 1 January 29,102 164,951
Cost movement 26,729 (68,340)
Profit and loss movement (19,511) (16,934)
Fair value reserve movement - (50,575)
Balance at 31 December 36,320 29,102
135
Notes to the Consolidated Financial Statements continuedAs at and for the year ended 31 December 2020 QAR ‘000s
5. USE OF ESTIMATES AND JUDGMENTS (continued)
(b) Critical accounting judgements in applying the Group’s accounting policies (continued)
(ii) Financial asset and liability classification Assessment of the business model within which the assets are held and assessment of whether the contractual
terms of the financial asset are solely payments of principal and interest on the principal amount outstanding. Refer to note 3 (d) (ii) for further information.
(iii) Qualifying hedge relationships In designating financial instruments in qualifying hedge relationships, the Group has determined that it expects the
hedges to be highly effective over the period of the hedging relationship.
(iv) Impairment of investments in equity and debt securities Assessment of whether credit risk on the financial asset has increased significantly since initial recognition and
incorporation of forward –looking information in the measurement of ECL. Refer to note 4 (b) (viii) Inputs, assumptions and techniques used for estimating impairment of financial assets for more information.
(v) Useful life of intangible assets The Group’s management determines the estimated useful life of its intangible assets for calculating amortization.
This estimate is determined after considering the expected economic benefits from the use of intangible assets.
(vi) Fair value of land and buildings The fair value of land and building is determined by valuations from an external professional real estate valuer using
recognized valuation techniques and the principles of IFRS 13 “Fair Value Measurement”.
(vii) Leases - Estimating the incremental borrowing rate The Group uses its incremental borrowing rate (IBR) to measure lease liabilities. The IBR is the rate of interest that the
Group would have to pay to borrow over a similar term, and with a similar security, the funds necessary to obtain an asset of a similar value to the right-of-use asset in a similar economic environment. The IBR therefore reflects what the Group ‘would have to pay’, which requires estimation when no observable rates are available or when they need to be adjusted to reflect the terms and conditions of the lease. The Group estimates the IBR using observable inputs (such as market interest rates).

136
Notes to the Consolidated Financial Statements continuedAs at and for the year ended 31 December 2020 QAR ‘000s
6. OPERATING SEGMENTS For management purposes, the Group is divided into four operating segments, which are based on business lines,
together with its associates and a joint arrangement companies, as follows:
Qatar operations:
1. Wholesale Banking provides an extensive range of conventional funded and non-funded credit facilities, demand and time deposit services, currency exchange facilities, interest rate swaps and other derivative trading services, loan syndication and structured financing services to corporate, commercial and multinational customers. Money market funds and proprietary investment portfolio are also managed by this operating segment.
2. Retail Banking provides personal current, savings, time and investment account services, credit card and debit card services, consumer and vehicle loans, residential mortgage services, custodial services to retail and individual customers and brokerage services provided by Commercialbank Financial Services L.L.C. wholly owned subsidiary operating in Qatar.
3. Others include subsidiaries and joint arrangement operating in Qatar.
International: 4. Alternatif Bank: A subsidiary that provides banking services through its branch network in Turkey. Alternatif bank
also has its subsidiaries. The Group reported Abank group result under this operating segment.
5. Investment in associates includes strategic investments in the National Bank of Oman in the Sultanate of Oman, United Arab Bank in the United Arab Emirates.
All Associates and joint arrangement Companies are accounted for under the equity method.
Unallocated assets, liabilities and revenues are related to certain central functions and non-core business operations. (For example, Group headquarters, common property & equipment, cash functions and net of intra-group transactions).
Management monitors the results of the operating segments separately to make decisions about resource allocation and performance assessment. Transfer prices between operating segments are on an arm’s length basis.

137
Notes to the Consolidated Financial Statements continuedAs at and for the year ended 31 December 2020 QAR ‘000s
6. OPERATING SEGMENTS (continued)
(a) By operating segment Segment assets and liabilities comprise operating assets and liabilities which are directly handled by the operating
segment and income or expenses are attributed with the assets and liabilities’ ownership. The following table summarizes performance of the operating segments:
2020 Qatar Operations
Wholesale Banking
Retail Banking Others International
Unallocated and Intra-
group transactions Total
Net interest income 1,926,142 881,452 282 292,259 - 3,100,135Net fee, commission and other income 447,666 553,259 - 113,744 22,329 1,136,998
Segmental revenue 2,373,808 1,434,711 282 406,003 22,329 4,237,133Net Impairment losses on investment securities (31,899) - - (142) - (32,041)
Net impairment loss on loans and advances to customers and other financial assets
(984,886) 158,403 - (125,027) - (951,510)
Segmental profit 986,118 1,080,017 4,749 57,517 (25,939) 2,102,462Impairment for investment in an associate - - - (591,242) - (591,242)
Share of results of associates and a joint arrangement - - 2,528 (212,534) - (210,006)
Net profit for the period 986,118 1,080,017 7,277 (746,259) (25,939) 1,301,214
Other informationLoans and advances to customers 73,792,143 11,265,125 - 11,640,830 - 96,698,098
Investments in associates and a joint arrangement - - 7,952 3,108,605 - 3,116,557
Assets (other than above) 39,098,828 1,494,733 90,243 6,570,806 6,536,450 53,791,060
153,605,715
Customer deposits 41,774,265 25,075,689 - 8,939,589 - 75,789,543
Liabilities (other than above) 45,563,122 2,166,967 1,065 7,797,358 117,179 55,645,691
131,435,234
Contingent items 18,987,074 1,071,245 - 4,487,059 - 24,545,378
Intra-group transactions are eliminated from this segmental information (Assets: QAR 2,409 million, Liabilities: QAR 1,347 million).

138
Notes to the Consolidated Financial Statements continuedAs at and for the year ended 31 December 2020 QAR ‘000s
6. OPERATING SEGMENTS (continued)
(a) By operating segment (continued)
2019 Qatar Operations
Wholesale Banking Retail Banking Others International
Unallocated and Intra-
group transactions Total
Net interest income 1,658,244 987,991 158 383,831 (67,041) 2,963,183Net fee, commission and other income 671,412 578,031 1 189,876 (55,858) 1,383,462
Segmental revenue 2,329,656 1,566,022 159 573,707 (122,899) 4,346,645Net impairment reversals / (losses) on investment securities
6,856 - - (59) - 6,797
Net impairment loss on loans and advances to customers and other financial assets
(204,912) (240,822) 28 (214,829) - (660,535)
Segmental profit 1,788,776 809,248 4,144 100,126 (260,573) 2,441,721Impairment for investment in an associate - - - (413,881) - (413,881)
Share of results of associates and a joint arrangement - - 2,571 (9,370) - (6,799)
Net profit for the period 1,788,776 809,248 6,715 (323,125) (260,573) 2,021,041
Other informationLoans and advances to customers 58,349,751 18,125,456 - 11,534,241 - 88,009,448
Investments in associates and a joint arrangement - - 7,924 4,013,315 - 4,021,239
Assets (other than above) 41,446,278 1,389,525 297,193 4,434,806 7,937,995 55,505,797
147,536,484
Customer deposits 43,306,921 23,282,182 20,991 9,686,498 - 76,296,592
Liabilities (other than above) 41,202,171 868,859 30,321 7,278,368 103,946 49,483,665
125,780,257
Contingent items 22,080,759 224,543 560,000 4,483,058 - 27,348,360
Intra-group transactions are eliminated from this segmental information (Assets: QAR 2,789 million, Liabilities: QAR 1,262 million).

139
Notes to the Consolidated Financial Statements continuedAs at and for the year ended 31 December 2020 QAR ‘000s
6. OPERATING SEGMENTS (continued)
(b) By geography
Consolidated statement of financial position Qatar
Other GCC countries
Other Middle East Europe
North America
Rest of the world Total
2020
Cash and balances with central banks 6,503,599 - 1,774,938 - - - 8,278,537
Due from banks 989,234 200,843 3,095,675 2,796,577 2,639,510 679,175 10,401,014Loans and advances to customers 74,937,510 210,530 18,229,926 849,025 125,555 2,345,552 96,698,098
Investment securities 18,957,962 534,775 4,932,909 43,020 201,790 1,107,755 25,778,211Investment in associates and a joint arrangement 7,952 3,108,605 - - - - 3,116,557
Property and equipment and all other assets 8,177,819 - 1,155,346 - - 133 9,333,298
Total assets 109,574,076 4,054,753 29,188,794 3,688,622 2,966,855 4,132,615 153,605,715
Due to banks 6,137,077 1,851,087 738,059 10,003,894 56,470 1,220,398 20,006,985
Customer deposits 53,368,020 1,828,676 8,967,145 4,467,046 1,187,311 5,971,345 75,789,543
Debt securities - - 1,292,145 11,814,989 - - 13,107,134
Other borrowings 485,639 1,501,959 3,186,509 4,086,530 1,458,942 3,406,097 14,125,676
Other liabilities 7,337,001 - 1,067,831 - - 1,064 8,405,896
Equity 20,968,798 - 1,201,683 - - - 22,170,481Total liabilities and equity 88,296,535 5,181,722 16,453,372 30,372,459 2,702,723 10,598,904 153,605,715

140
Notes to the Consolidated Financial Statements continuedAs at and for the year ended 31 December 2020 QAR ‘000s
6. OPERATING SEGMENTS (continued)
(b) By geography (continued)
Consolidated statement of income Qatar
Other GCC countries
Other Middle East Europe
North America
Rest of the world Total
Year ended 31 December 2020Net interest income 3,093,161 (11,366) 658,626 (551,387) (39,893) (49,006) 3,100,135Net fee, commission and other income
922,504 99,338 144,013 (30,802) 232 1,713 1,136,998
Net operating income 4,015,665 87,972 802,639 (582,189) (39,661) (47,293) 4,237,133
Staff cost (518,432) - (114,167) - - - (632,599)
Depreciation (116,889) - (23,456) - - - (140,345)Amortization of intangible assets
(48,268) - (10,127) - - - (58,395)
Net impairment losses on investment securities
(31,899) - (142) - - - (32,041)
Net impairment loss on loans and advances to customers
(719,021) - (117,365) - - - (836,386)
Net impairment losses on other financial assets
(107,461) - (7,663) - - - (115,124)
Impairment on Investment in an Associate
- (591,242) - - - - (591,242)
Other Provision (40,177) - - - - - (40,177)
Other expenses (202,653) - (62,284) - - (101) (265,038)Profit before share of results of associates and a joint arrangement
2,230,865 (503,270) 467,435 (582,189) (39,661) (47,394) 1,525,786
Share of results of associates and a joint arrangement
2,528 (212,534) - - - - (210,006)
Profit for the year before tax 2,233,393 (715,804) 467,435 (582,189) (39,661) (47,394) 1,315,780
Income tax expenses (759) - (13,282) - - (525) (14,566)
Net profit for the year 2,232,634 (715,804) 454,153 (582,189) (39,661) (47,919) 1,301,214
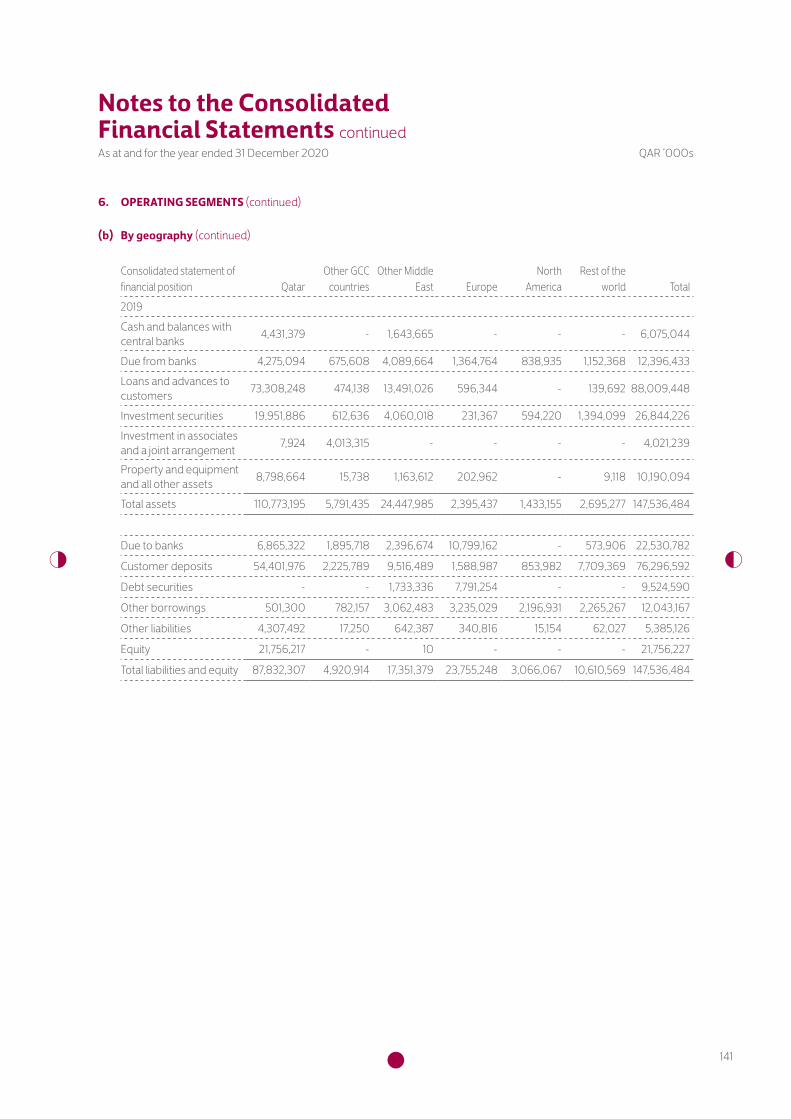
141
Notes to the Consolidated Financial Statements continuedAs at and for the year ended 31 December 2020 QAR ‘000s
6. OPERATING SEGMENTS (continued)
(b) By geography (continued)
Consolidated statement of financial position Qatar
Other GCC countries
Other Middle East Europe
North America
Rest of the world Total
2019Cash and balances with central banks 4,431,379 - 1,643,665 - - - 6,075,044
Due from banks 4,275,094 675,608 4,089,664 1,364,764 838,935 1,152,368 12,396,433Loans and advances to customers 73,308,248 474,138 13,491,026 596,344 - 139,692 88,009,448
Investment securities 19,951,886 612,636 4,060,018 231,367 594,220 1,394,099 26,844,226Investment in associates and a joint arrangement 7,924 4,013,315 - - - - 4,021,239
Property and equipment and all other assets 8,798,664 15,738 1,163,612 202,962 - 9,118 10,190,094
Total assets 110,773,195 5,791,435 24,447,985 2,395,437 1,433,155 2,695,277 147,536,484
Due to banks 6,865,322 1,895,718 2,396,674 10,799,162 - 573,906 22,530,782
Customer deposits 54,401,976 2,225,789 9,516,489 1,588,987 853,982 7,709,369 76,296,592
Debt securities - - 1,733,336 7,791,254 - - 9,524,590
Other borrowings 501,300 782,157 3,062,483 3,235,029 2,196,931 2,265,267 12,043,167
Other liabilities 4,307,492 17,250 642,387 340,816 15,154 62,027 5,385,126
Equity 21,756,217 - 10 - - - 21,756,227
Total liabilities and equity 87,832,307 4,920,914 17,351,379 23,755,248 3,066,067 10,610,569 147,536,484

142
Notes to the Consolidated Financial Statements continuedAs at and for the year ended 31 December 2020 QAR ‘000s
6. OPERATING SEGMENTS (continued)
(b) By geography (continued)
Consolidated statement of income Qatar Other GCC
countriesOther Middle
East Europe North America
Rest of the world Total
Year ended 31 December 2019Net interest income 3,464,077 (44,592) 534,091 (598,299) (47,543) (344,551) 2,963,183Net fee, commission and other income 1,054,288 68,913 228,124 10,141 - 21,996 1,383,462
Net operating income 4,518,365 24,321 762,215 (588,158) (47,543) (322,555) 4,346,645
Staff cost (663,231) - (133,112) - - (9) (796,352)
Depreciation (125,482) - (24,512) - - - (149,994)Amortization of intangible assets (46,268) - (8,755) - - - (55,023)
Net impairment (losses) / reversals on investment securities
6,856 - (59) - - - 6,797
Net impairment loss on loans and advances to customers
(377,030) 28 (217,425) - - - (594,427)
Net impairment losses on other financial assets (68,704) - 2,596 - - - (66,108)
Impairment on Investment in an Associate
- (413,881) - - - - (413,881)
Other expenses (156,899) - (69,517) - - (228) (226,644)Profit before share of results of associates and a joint arrangement
3,087,607 (389,532) 311,431 (588,158) (47,543) (322,792) 2,051,013
Share of results of associates and a joint arrangement
2,571 (9,370) - - - - (6,799)
Profit for the year before tax 3,090,178 (398,902) 311,431 (588,158) (47,543) (322,792) 2,044,214
Income tax expenses (377) - (22,796) - - - (23,173)
Net profit for the year 3,089,801 (398,902) 288,635 (588,158) (47,543) (322,792) 2,021,041
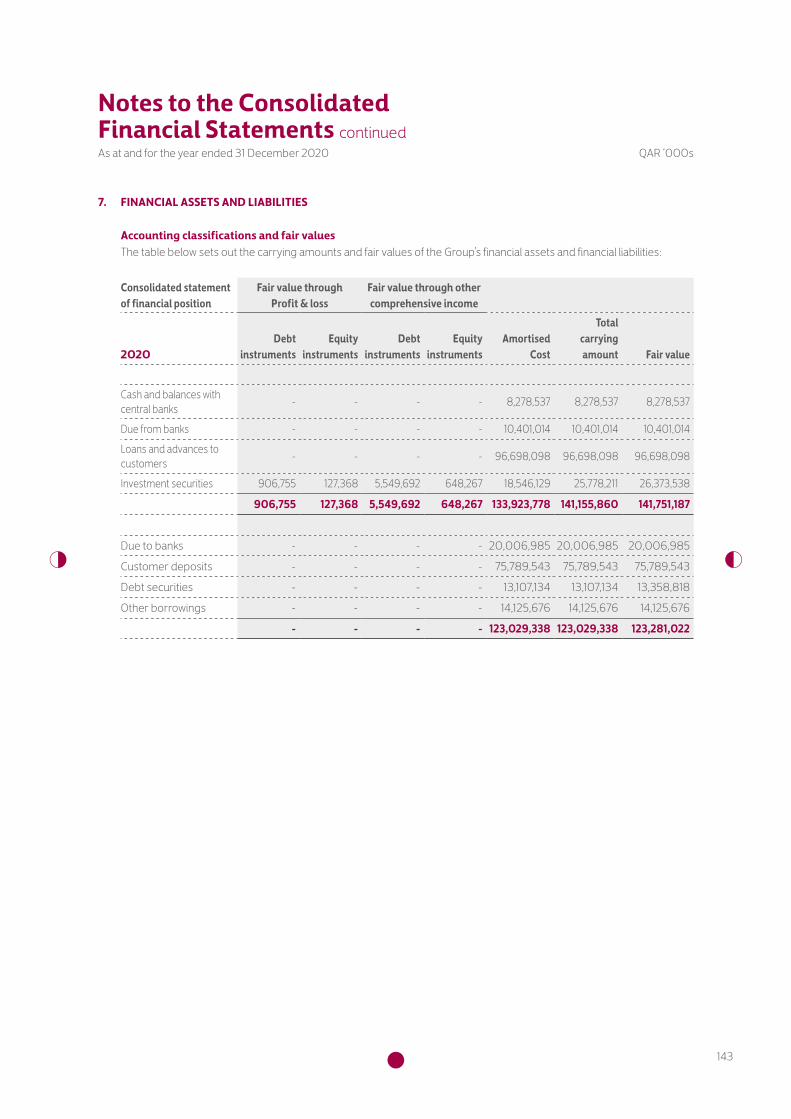
143
Notes to the Consolidated Financial Statements continuedAs at and for the year ended 31 December 2020 QAR ‘000s
7. FINANCIAL ASSETS AND LIABILITIES
Accounting classifications and fair values The table below sets out the carrying amounts and fair values of the Group’s financial assets and financial liabilities:
Consolidated statement of financial position
Fair value through Profit & loss
Fair value through other comprehensive income
2020Debt
instrumentsEquity
instrumentsDebt
instrumentsEquity
instrumentsAmortised
Cost
Total carrying amount Fair value
Cash and balances with central banks - - - - 8,278,537 8,278,537 8,278,537
Due from banks - - - - 10,401,014 10,401,014 10,401,014Loans and advances to customers - - - - 96,698,098 96,698,098 96,698,098
Investment securities 906,755 127,368 5,549,692 648,267 18,546,129 25,778,211 26,373,538
906,755 127,368 5,549,692 648,267 133,923,778 141,155,860 141,751,187
Due to banks - - - - 20,006,985 20,006,985 20,006,985
Customer deposits - - - - 75,789,543 75,789,543 75,789,543
Debt securities - - - - 13,107,134 13,107,134 13,358,818
Other borrowings - - - - 14,125,676 14,125,676 14,125,676
- - - - 123,029,338 123,029,338 123,281,022

144
Notes to the Consolidated Financial Statements continuedAs at and for the year ended 31 December 2020 QAR ‘000s
7. FINANCIAL ASSETS AND LIABILITIES (continued)
Accounting classifications and fair values (continued) The table below sets out the carrying amounts and fair values of the Group’s financial assets and financial liabilities:
Consolidated statement of financial position
Fair value through Profit & loss
Fair value through other comprehensive income
2019Debt
instrumentsEquity
instrumentsDebt
instrumentsEquity
instrumentsAmortised
CostTotal carrying
amount Fair value
Cash and balances with central banks - - - - 6,075,044 6,075,044 6,075,044
Due from banks - - - - 12,396,433 12,396,433 12,396,433Loans and advances to customers - - - - 88,009,448 88,009,448 88,009,448
Investment securities: 1,362,693 430,878 4,921,729 5,199 20,123,727 26,844,226 27,063,912
1,362,693 430,878 4,921,729 5,199 126,604,652 133,325,151 133,544,837
Due to banks - - - - 22,530,782 22,530,782 22,530,782
Customer deposits - - - - 76,296,592 76,296,592 76,296,592
Debt securities - - - - 9,524,590 9,524,590 9,736,064
Other borrowings - - - - 12,043,167 12,043,167 12,043,167
- - - - 120,395,131 120,395,131 120,606,605
8. CASH AND BALANCES WITH CENTRAL BANKS2020 2019
Cash 2,426,565 824,073
Cash reserve with central banks * 3,898,915 3,619,864
Other balances with central banks 1,950,130 1,629,546
8,275,610 6,073,483
Accrued interest 2,927 1,561
8,278,537 6,075,044
* The cash reserve with central banks is a mandatory reserve and is not available for use in the Group’s day to day operations.
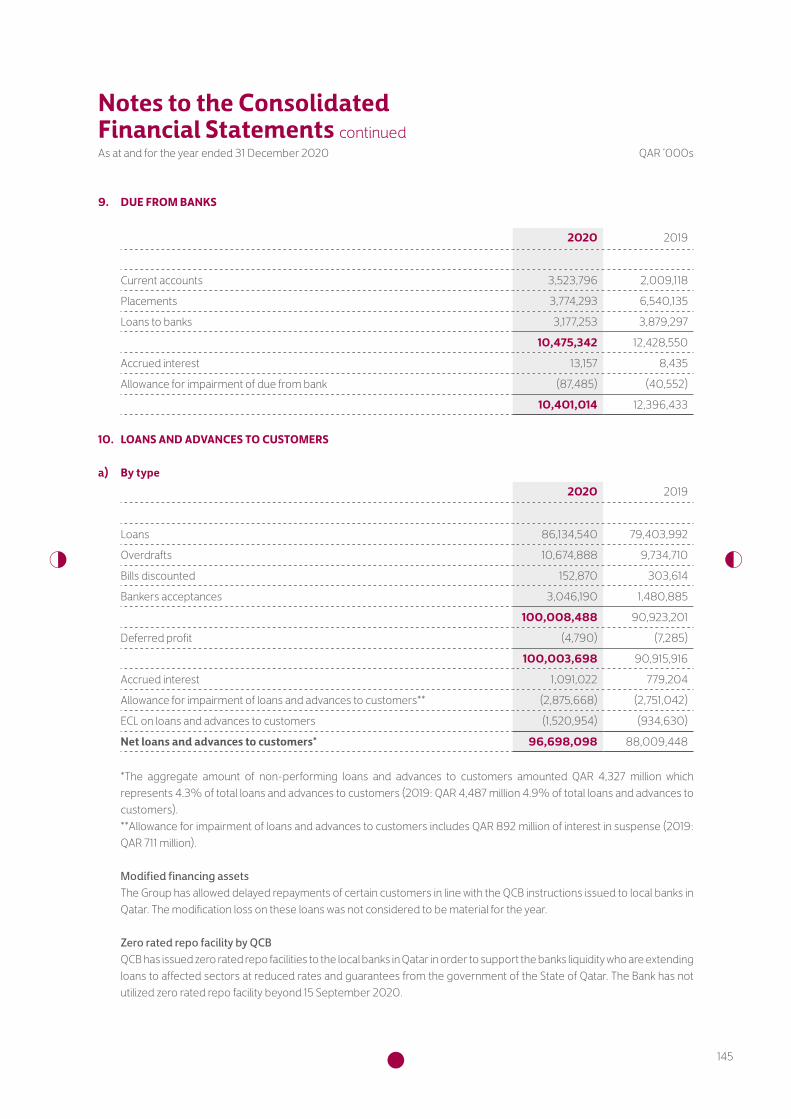
145
Notes to the Consolidated Financial Statements continuedAs at and for the year ended 31 December 2020 QAR ‘000s
9. DUE FROM BANKS
2020 2019
Current accounts 3,523,796 2,009,118
Placements 3,774,293 6,540,135
Loans to banks 3,177,253 3,879,297
10,475,342 12,428,550
Accrued interest 13,157 8,435
Allowance for impairment of due from bank (87,485) (40,552)
10,401,014 12,396,433
10. LOANS AND ADVANCES TO CUSTOMERS
a) By type2020 2019
Loans 86,134,540 79,403,992
Overdrafts 10,674,888 9,734,710
Bills discounted 152,870 303,614
Bankers acceptances 3,046,190 1,480,885
100,008,488 90,923,201
Deferred profit (4,790) (7,285)
100,003,698 90,915,916
Accrued interest 1,091,022 779,204
Allowance for impairment of loans and advances to customers** (2,875,668) (2,751,042)
ECL on loans and advances to customers (1,520,954) (934,630)
Net loans and advances to customers* 96,698,098 88,009,448
*The aggregate amount of non-performing loans and advances to customers amounted QAR 4,327 million which represents 4.3% of total loans and advances to customers (2019: QAR 4,487 million 4.9% of total loans and advances to customers).
**Allowance for impairment of loans and advances to customers includes QAR 892 million of interest in suspense (2019: QAR 711 million).
Modified financing assets The Group has allowed delayed repayments of certain customers in line with the QCB instructions issued to local banks in
Qatar. The modification loss on these loans was not considered to be material for the year.
Zero rated repo facility by QCB QCB has issued zero rated repo facilities to the local banks in Qatar in order to support the banks liquidity who are extending
loans to affected sectors at reduced rates and guarantees from the government of the State of Qatar. The Bank has not utilized zero rated repo facility beyond 15 September 2020.

146
Notes to the Consolidated Financial Statements continuedAs at and for the year ended 31 December 2020 QAR ‘000s
10. LOANS AND ADVANCES TO CUSTOMERS (continued)
b) By sector
2020 Loans OverdraftsBills
discountedBankers
acceptances Total
Government and related agencies 9,355,381 7,926,307 - - 17,281,688Non-banking financial institutions 921,067 10,876 - - 931,943Industry 8,728,538 8,445 3,204 4,002 8,744,189Commercial 12,029,839 356,887 12,086 1,689,140 14,087,952Services 23,043,631 411,085 68,142 971,699 24,494,557Contracting 2,789,230 470,797 69,438 379,298 3,708,763Real estate 20,453,442 50,455 - - 20,503,897Personal 6,014,864 1,401,803 - - 7,416,667Others 2,798,548 38,233 - 2,051 2,838,832
86,134,540 10,674,888 152,870 3,046,190 100,008,488Accrued interest 1,091,022
Less: Deferred profit (4,790)Allowance for impairment of loans and advances to customers (2,875,668)ECL on loans and advances to customers (1,520,954)
(3,310,390)Net loans and advances to customers 96,698,098
2019 Loans OverdraftsBills
discountedBankers
acceptances Total
Government and related agencies 9,194,619 5,845,271 - 4,049 15,043,939Non-banking financial institutions 847,212 29,475 12,618 - 889,305Industry 8,168,393 8,015 5,510 10,423 8,192,341Commercial 10,488,416 256,924 52,223 973,560 11,771,123Services 23,018,547 1,257,758 108,689 231,998 24,616,992Contracting 2,710,789 666,143 124,574 260,232 3,761,738Real estate 18,764,910 237,111 - - 19,002,021Personal 5,006,804 1,407,199 - - 6,414,003Others 1,204,302 26,814 - 623 1,231,739
79,403,992 9,734,710 303,614 1,480,885 90,923,201Accrued interest 779,204
Less: Deferred profit (7,285)Allowance for impairment of loans and advances to customers (2,751,042)ECL on loans and advances to customers (934,630)
(2,913,753)Net loans and advances to customers 88,009,448

147
Notes to the Consolidated Financial Statements continuedAs at and for the year ended 31 December 2020 QAR ‘000s
10. LOANS AND ADVANCES TO CUSTOMERS (continued)
c) Movement in allowance for impairment of loans and advances to customers
2020 2019
Balance at 1 January 3,685,672 3,846,625
Allowance made during the year 1,622,189 1,086,841
Recoveries / reversals during the year (400,348) (159,670)
Net allowance for impairment during the year * 1,221,841 927,171
Written off / transferred during the year (450,479) (1,034,840)
Exchange differences (60,412) (53,284)
Balance at 31 December 4,396,622 3,685,672
*This includes net interest suspended during the year QAR 244.5 million (2019: QAR 212.6 million) as per QCB regulations.
Net impairment losses on loans and advances to customers2020 2019
Gross allowance made during the year 1,622,189 1,086,841
Less: Recoveries / reversals during the year (400,348) (159,670)
1,221,841 927,171
Less: Interest suspended during the year (244,467) (212,595)
Less: Recoveries on previously written off loans (140,988) (120,149)
836,386 594,427

148
Notes to the Consolidated Financial Statements continuedAs at and for the year ended 31 December 2020 QAR ‘000s
10. LOANS AND ADVANCES TO CUSTOMERS (continued)
c) Movement in allowance for impairment of loans and advances to customers (continued)
Commercial Bank Subsidiaries
Stage 1 Stage 2 Stage 3 Stage 1 Stage 2 Stage 3 Stage 1 Stage 2 Stage 3
Wholesale Banking
Retail Banking
Wholesale Banking
Retail Banking
Wholesale Banking
Retail Banking
Total Commercial
Bank Alternatif bank
Total Alternatif
Bank Others Total
Balance at 1 January 2020 45,023 40,938 716,379 43,822 1,332,104 1,215,927 3,394,193 (23,997) 112,466 191,211 279,680 - - 11,799 3,685,672Adjustment due to reclassification between segments
- - - - - - - - - - - - - - -
Allowance made during the year 159,384 31,506 292,367 42,532 355,116 397,290 1,278,195 140,732 127,505 75,326 343,563 431 - - 1,622,189
Recoveries/reversal during the year - - - - (96,302) (99,265) (195,567) (115,202) (69,428) (20,151) (204,781) - - - (400,348)
Written off / transferred during the year - - - - (279,606) (168,800) (448,406) - - (2,073) (2,073) - - - (450,479)
Exchange differences - - - - - - - 2,234 (25,737) (36,909) (60,412) - - - (60,412)
Balance at 31 December 2020 204,407 72,444 1,008,746 86,354 1,311,312 1,345,152 4,028,415 3,767 144,806 207,404 355,977 431 - 11,799 4,396,622
Commercial Bank Subsidiaries
Stage 1 Stage 2 Stage 3 Stage 1 Stage 2 Stage 3 Stage 1 Stage 2 Stage 3
Wholesale Banking
Retail Banking
Wholesale Banking
Retail Banking
Wholesale Banking
Retail Banking
Total Commercial
Bank Alternatif bank
Total Alternatif
Bank Others Total
Balance at 1 January 2019 30,393 43,181 680,475 11,938 1,449,129 1,009,833 3,224,949 (23,192) 259,813 373,228 609,849 - - 11,827 3,846,625Adjustment due to reclassification between segments
481 (481) (41,060) 41,060 (59,756) 59,756 - - - - - - - - -
Allowance made during the year 14,149 (1,762) 87,048 (9,176) 250,230 446,077 786,566 54,931 100,991 144,353 300,275 - - - 1,086,841
Recoveries/reversal during the year - - - - (4,242) (72,550) (76,792) (64,568) (218,257) 199,975 (82,850) - - (28) (159,670)
Written off / transferred during the year - - (10,084) - (303,257) (227,189) (540,530) - - (494,310) (494,310) - - - (1,034,840)
Exchange differences - - - - - - - 8,832 (30,081) (32,035) (53,284) - - - (53,284)
Balance at 31 December 2019 45,023 40,938 716,379 43,822 1,332,104 1,215,927 3,394,193 (23,997) 112,466 191,211 279,680 - - 11,799 3,685,672

149
Notes to the Consolidated Financial Statements continuedAs at and for the year ended 31 December 2020 QAR ‘000s
10. LOANS AND ADVANCES TO CUSTOMERS (continued)
c) Movement in allowance for impairment of loans and advances to customers (continued)
Commercial Bank Subsidiaries
Stage 1 Stage 2 Stage 3 Stage 1 Stage 2 Stage 3 Stage 1 Stage 2 Stage 3
Wholesale Banking
Retail Banking
Wholesale Banking
Retail Banking
Wholesale Banking
Retail Banking
Total Commercial
Bank Alternatif bank
Total Alternatif
Bank Others Total
Balance at 1 January 2020 45,023 40,938 716,379 43,822 1,332,104 1,215,927 3,394,193 (23,997) 112,466 191,211 279,680 - - 11,799 3,685,672Adjustment due to reclassification between segments
- - - - - - - - - - - - - - -
Allowance made during the year 159,384 31,506 292,367 42,532 355,116 397,290 1,278,195 140,732 127,505 75,326 343,563 431 - - 1,622,189
Recoveries/reversal during the year - - - - (96,302) (99,265) (195,567) (115,202) (69,428) (20,151) (204,781) - - - (400,348)
Written off / transferred during the year - - - - (279,606) (168,800) (448,406) - - (2,073) (2,073) - - - (450,479)
Exchange differences - - - - - - - 2,234 (25,737) (36,909) (60,412) - - - (60,412)
Balance at 31 December 2020 204,407 72,444 1,008,746 86,354 1,311,312 1,345,152 4,028,415 3,767 144,806 207,404 355,977 431 - 11,799 4,396,622
Commercial Bank Subsidiaries
Stage 1 Stage 2 Stage 3 Stage 1 Stage 2 Stage 3 Stage 1 Stage 2 Stage 3
Wholesale Banking
Retail Banking
Wholesale Banking
Retail Banking
Wholesale Banking
Retail Banking
Total Commercial
Bank Alternatif bank
Total Alternatif
Bank Others Total
Balance at 1 January 2019 30,393 43,181 680,475 11,938 1,449,129 1,009,833 3,224,949 (23,192) 259,813 373,228 609,849 - - 11,827 3,846,625Adjustment due to reclassification between segments
481 (481) (41,060) 41,060 (59,756) 59,756 - - - - - - - - -
Allowance made during the year 14,149 (1,762) 87,048 (9,176) 250,230 446,077 786,566 54,931 100,991 144,353 300,275 - - - 1,086,841
Recoveries/reversal during the year - - - - (4,242) (72,550) (76,792) (64,568) (218,257) 199,975 (82,850) - - (28) (159,670)
Written off / transferred during the year - - (10,084) - (303,257) (227,189) (540,530) - - (494,310) (494,310) - - - (1,034,840)
Exchange differences - - - - - - - 8,832 (30,081) (32,035) (53,284) - - - (53,284)
Balance at 31 December 2019 45,023 40,938 716,379 43,822 1,332,104 1,215,927 3,394,193 (23,997) 112,466 191,211 279,680 - - 11,799 3,685,672
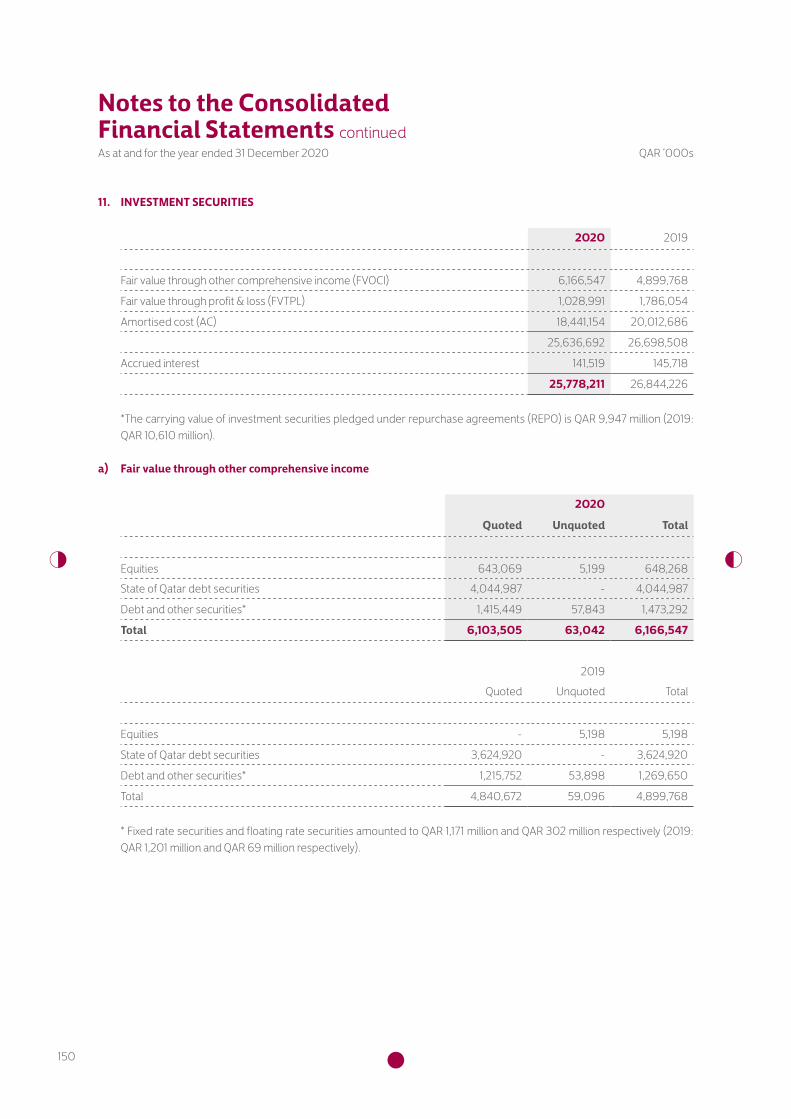
150
Notes to the Consolidated Financial Statements continuedAs at and for the year ended 31 December 2020 QAR ‘000s
11. INVESTMENT SECURITIES
2020 2019
Fair value through other comprehensive income (FVOCI) 6,166,547 4,899,768
Fair value through profit & loss (FVTPL) 1,028,991 1,786,054
Amortised cost (AC) 18,441,154 20,012,686
25,636,692 26,698,508
Accrued interest 141,519 145,718
25,778,211 26,844,226
*The carrying value of investment securities pledged under repurchase agreements (REPO) is QAR 9,947 million (2019: QAR 10,610 million).
a) Fair value through other comprehensive income
2020
Quoted Unquoted Total
Equities 643,069 5,199 648,268State of Qatar debt securities 4,044,987 - 4,044,987
Debt and other securities* 1,415,449 57,843 1,473,292
Total 6,103,505 63,042 6,166,547
2019Quoted Unquoted Total
Equities - 5,198 5,198
State of Qatar debt securities 3,624,920 - 3,624,920
Debt and other securities* 1,215,752 53,898 1,269,650
Total 4,840,672 59,096 4,899,768
* Fixed rate securities and floating rate securities amounted to QAR 1,171 million and QAR 302 million respectively (2019: QAR 1,201 million and QAR 69 million respectively).

151
Notes to the Consolidated Financial Statements continuedAs at and for the year ended 31 December 2020 QAR ‘000s
11. INVESTMENT SECURITIES (continued)
(b) Fair value through profit & loss
2020
Quoted Unquoted Total
Equities 105,220 22,148 127,368
State of Qatar debt securities 111,000 - 111,000
Debt and other securities 765,516 - 765,516
Investment funds 6,948 18,159 25,107
Total 988,684 40,307 1,028,991
2019Quoted Unquoted Total
Equities 390,718 8,321 399,039
State of Qatar debt securities 111,000 - 111,000
Debt and other securities 1,207,774 36,400 1,244,174
Investment funds 7,439 24,402 31,841
Total 1,716,931 69,123 1,786,054
c) Amortised Cost
2020
By Issuer Quoted Unquoted Total
State of Qatar debt securities 14,255,183 - 14,255,183
Debt and other securities 3,940,129 245,842 4,185,971
Total 18,195,312 245,842 18,441,154
2020
By Interest Rate Quoted Unquoted Total
Fixed Rate Securities 18,157,936 245,842 18,403,778
Floating Rate Securities 37,376 - 37,376
Total 18,195,312 245,842 18,441,154

152
Notes to the Consolidated Financial Statements continuedAs at and for the year ended 31 December 2020 QAR ‘000s
11. INVESTMENT SECURITIES (continued)
c) Amortised Cost (continued)
2019
By Issuer Quoted Unquoted Total
State of Qatar debt securities 15,533,030 - 15,533,030
Debt and other securities 4,197,774 281,882 4,479,656
Total 19,730,804 281,882 20,012,686
2019
By Interest Rate Quoted Unquoted Total
Fixed Rate Securities 19,577,298 281,882 19,859,180
Floating Rate Securities 153,506 - 153,506
Total 19,730,804 281,882 20,012,686
12. INVESTMENT IN ASSOCIATES AND A JOINT ARRANGEMENT The Group’s investment in associates and a joint arrangement are as follows:
2020 2019
Balance at 1 January 4,021,239 4,512,940
Share of results -(note 21) (210,006) (6,799)
Cash dividend - (note 21) (92,614) (93,072)
Other movements (10,820) 22,051
Impairment of investment in an associate (591,242) (413,881)
Balance at 31 December 3,116,557 4,021,239

153
Notes to the Consolidated Financial Statements continuedAs at and for the year ended 31 December 2020 QAR ‘000s
12. INVESTMENT IN ASSOCIATES AND A JOINT ARRANGEMENT (continued)
Carrying Value and % of interest heldPrice
per share (QAR)
Name of the Entity Classification Country Activities 2020 % 2019 %
National Bank of Oman SAOG (‘NBO’)
Associate Oman Banking 2,123,044 34.9% 2,163,815 34.9% 1.51
United Arab Bank PJSC (‘UAB’) Associate UAE Banking 985,561 40.0% 1,849,500 40.0% 0.84
Massoun Insurance Services L.L.C
Joint venture Qatar Insurance brokerage 7,952 50.0% 7,924 50.0% Not listed
3,116,557 4,021,239
2020 2019
Total assets 49,052,758 53,395,161
Total liabilities 42,599,295 46,000,933
Operating income 1,504,786 1,752,987
Net profit (489,645) 38,419
Total comprehensive income (557,932) 129,713
Share of results (212,534) (9,370)

154
Notes to the Consolidated Financial Statements continuedAs at and for the year ended 31 December 2020 QAR ‘000s
13 PROPERTY AND EQUIPMENT
Land and buildings
Right of use assets
Leasehold improvements
Furniture and
equipmentMotor
vehicles
Capital work in
progress Total
Cost
Balance at 1 January 2019 2,176,282 - 118,960 1,231,564 4,159 426,304 3,957,269
Adjustment on transition to IFRS 16 - 142,020 - - - - 142,020
Additions / transfers 6,543 28,981 7,724 58,274 3,891 66,747 172,160
Disposals (6) (4,282) (5,729) (5,898) (38) - (15,953)
Exchange differences (18,334) (1,178) (3,095) (6,192) (231) - (29,030)
Balance at 31 December 2019 2,164,485 165,541 117,860 1,277,748 7,781 493,051 4,226,466
Balance at 1 January 2020 2,164,485 165,541 117,860 1,277,748 7,781 493,051 4,226,466
Additions / transfers 271,689 385,403 5,142 86,309 8,843 (263,650) 493,736
Disposals (53) (14,025) (1,211) (1,323) (2) - (16,614)
Exchange differences (27,910) (8,293) (5,219) (10,735) (1,195) - (53,352)
Balance at 31 December 2020 2,408,211 528,626 116,572 1,351,999 15,427 229,401 4,650,236
Accumulated depreciation
Balance at 1 January 2019 87,769 - 103,385 1,044,337 2,865 - 1,238,356
Depreciation for the year 32,057 34,220 3,921 79,023 773 - 149,994
Disposals (1) (692) (3,444) (5,296) (31) - (9,464)
Exchange differences (311) (603) (1,660) (3,512) (46) - (6,132)
Balance at 31 December 2019 119,514 32,925 102,202 1,114,552 3,561 - 1,372,754
Balance at 1 January 2020 119,514 32,925 102,202 1,114,552 3,561 - 1,372,754
Depreciation for the year 32,630 32,827 4,381 69,293 1,214 - 140,345
Disposals (53) (6,811) (1,207) (1,179) - - (9,250)
Exchange differences (3,422) (349) (2,031) (5,789) (286) - (11,877)
Balance at 31 December 2020 148,669 58,592 103,345 1,176,877 4,489 - 1,491,972
Net carrying amounts
Balance at 31 December 2019 2,044,971 132,616 15,658 163,196 4,220 493,051 2,853,712
Balance at 31 December 2020 2,259,542 470,034 13,227 175,122 10,938 229,401 3,158,264
Right of use asset pertains to the following: 2020 2019
Land and buildings 469,561 131,592
Vehicles 473 1,024

155
Notes to the Consolidated Financial Statements continuedAs at and for the year ended 31 December 2020 QAR ‘000s
14. INTANGIBLE ASSETS
Goodwill BrandCustomer
relationshipCore
deposit
Internally developed
software Total
Cost
Balance at 1 January 2019 180,249 69,401 270,761 67,713 29,995 618,119
Acquisitions - 3,464 - - 10,716 14,180
Exchange differences (20,593) (6,976) 15,488 2,758 (2,431) (11,754)
Balance at 31 December 2019 159,656 65,889 286,249 70,471 38,280 620,545
Balance at 1 January 2020 159,656 65,889 286,249 70,471 38,280 620,545
Acquisitions - 319 - - 16,659 16,978
Exchange differences (30,819) (10,735) 16,334 2,211 (7,304) (30,313)
Balance at 31 December 2020 128,837 55,473 302,583 72,682 47,635 607,210
Amortisation and Impairment
Balance at 1 January 2019 49,800 38,029 184,470 41,615 21,156 335,070
Amortisation during the year - 3,414 36,892 8,323 6,394 55,023
Exchange differences - (2,955) - - (2,970) (5,925)
Balance at 31 December 2019 49,800 38,488 221,362 49,938 24,580 384,168
Balance at 1 January 2020 49,800 38,488 221,362 49,938 24,580 384,168
Amortisation during the year - 3,034 38,894 8,322 8,145 58,395
Exchange differences - (6,322) - - (3,861) (10,183)
Balance at 31 December 2020 49,800 35,200 260,256 58,260 28,864 432,380
Net carrying amounts
Balance at 31 December 2019 109,856 27,401 64,887 20,533 13,700 236,377
Balance at 31 December 2020 79,037 20,273 42,327 14,422 18,771 174,830
Impairment testing for CGU containing goodwill For the purpose of impairment testing, goodwill is allocated to the Group’s CGU-Alternatifbank. A cost of equity of 24.7%
(2019: 24.7%) and a terminal growth rate of 2.5 % (2019: 2.5%) were used to estimate the recoverable amount of Alternatifbank.
The recoverable amount for the CGU has been calculated based on the ‘Value in Use Method’, determined by discounting the future cash flows expected to be generated from the continuing use of the CGU. The discount rate was a pre-tax measure based on the Government Bonds 10 year yield TL, adjusted for an equity market risk premium and equity beta.

156
Notes to the Consolidated Financial Statements continuedAs at and for the year ended 31 December 2020 QAR ‘000s
14. INTANGIBLE ASSETS (continued) Five years of cash flows are included in the discounted cash model. A long term growth rate into perpetuity has been
determined as the lower of the nominal GDP rates for the country in which CGU operate and the long term compound annual profit before taxes, depreciation and amortization growth rate estimated by the management. The key assumptions described above may change as economic and market conditions change.
No impairment loss is recognized in 2020 Nil (2019: nil) as the recoverable amount of this CGU was determined to be higher than its carrying amount.
15. OTHER ASSETS2020 2019
Accrued income 31,345 69,973
Prepaid expenses 79,564 56,441
Accounts receivable 610,225 615,812
Repossessed collateral* 2,995,151 4,531,182
Positive fair value of derivatives (note 36) 1,621,501 764,320
Clearing cheques 223,651 240,094
Others 438,767 822,183
6,000,204 7,100,005
*This represents the value of the properties acquired in settlement of debts and subsequent additions, which have been stated at their carrying value net of any allowance for impairment and credit enhancement. The estimated market values of these properties at the end of the reporting period are not materially different from the carrying values.
16. DUE TO BANKS2020 2019
Balances due to central banks 1,257,471 1,193,687
Current accounts 547,091 844,499
Placement with banks 9,073,036 11,107,326
Repurchase agreements with banks 9,015,570 9,223,815
Accrued interest 113,817 161,455
Total 20,006,985 22,530,782

157
Notes to the Consolidated Financial Statements continuedAs at and for the year ended 31 December 2020 QAR ‘000s
17. CUSTOMER DEPOSITS2020 2019
Current and call deposits 23,492,174 18,712,151
Saving deposits 5,792,621 4,746,766
Time deposits 46,229,937 52,381,708
Accrued interest 274,811 455,967
Total 75,789,543 76,296,592
2020 2019
Government 4,316,909 6,788,520
Government and semi government agencies 10,953,947 12,286,077
Individuals 24,561,045 24,049,009
Corporate 28,904,155 28,516,188
Non-banking financial institutions 6,778,676 4,200,831
75,514,732 75,840,625
Accrued interest 274,811 455,967
75,789,543 76,296,592
18. DEBT SECURITIES2020 2019
EMTN unsecured Programme – Senior unsecured notes * 10,506,478 7,038,935
Senior Notes* 199,921 466,805
Subordinated Notes * 1,089,822 1,261,225
Others# 1,269,506 727,556
Accrued interest 41,407 30,069
Total 13,107,134 9,524,590
The following table provides the breakdown of the Debt Securities as at close of 31 December 2020.
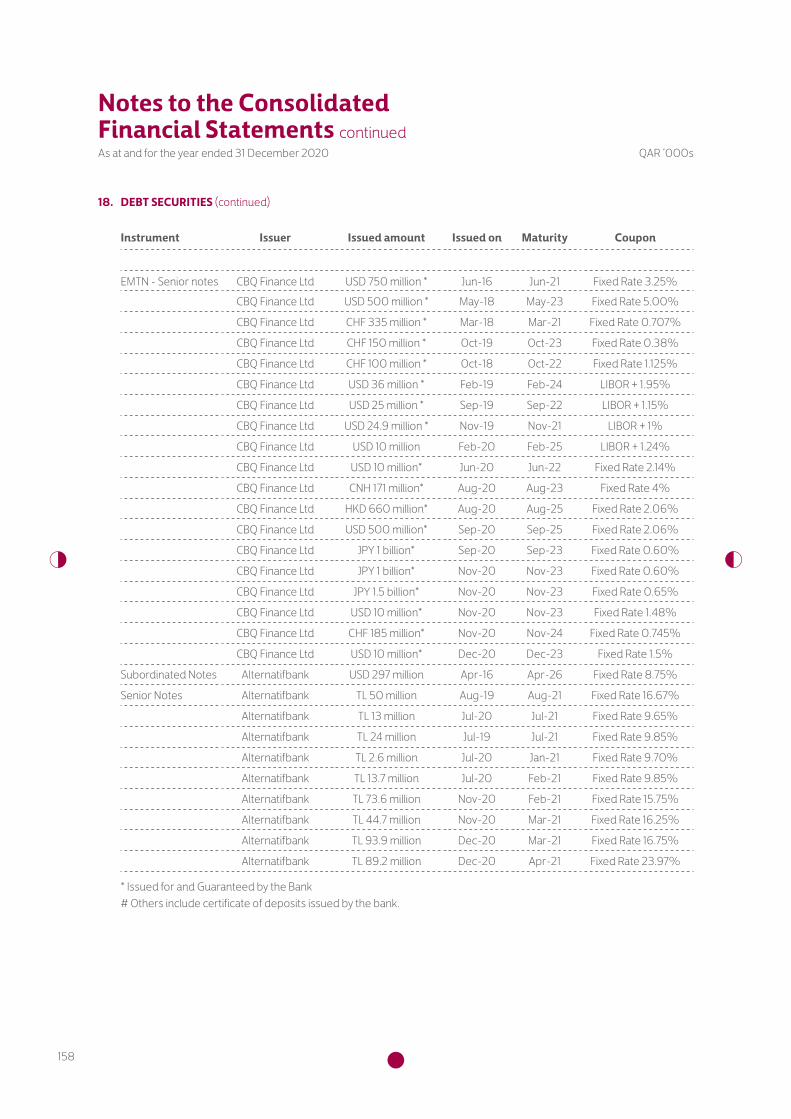
158
Notes to the Consolidated Financial Statements continuedAs at and for the year ended 31 December 2020 QAR ‘000s
18. DEBT SECURITIES (continued)
Instrument Issuer Issued amount Issued on Maturity Coupon
EMTN - Senior notes CBQ Finance Ltd USD 750 million * Jun-16 Jun-21 Fixed Rate 3.25%CBQ Finance Ltd USD 500 million * May-18 May-23 Fixed Rate 5.00%
CBQ Finance Ltd CHF 335 million * Mar-18 Mar-21 Fixed Rate 0.707%
CBQ Finance Ltd CHF 150 million * Oct-19 Oct-23 Fixed Rate 0.38%
CBQ Finance Ltd CHF 100 million * Oct-18 Oct-22 Fixed Rate 1.125%
CBQ Finance Ltd USD 36 million * Feb-19 Feb-24 LIBOR + 1.95%
CBQ Finance Ltd USD 25 million * Sep-19 Sep-22 LIBOR + 1.15%
CBQ Finance Ltd USD 24.9 million * Nov-19 Nov-21 LIBOR + 1%
CBQ Finance Ltd USD 10 million Feb-20 Feb-25 LIBOR + 1.24%
CBQ Finance Ltd USD 10 million* Jun-20 Jun-22 Fixed Rate 2.14%
CBQ Finance Ltd CNH 171 million* Aug-20 Aug-23 Fixed Rate 4%
CBQ Finance Ltd HKD 660 million* Aug-20 Aug-25 Fixed Rate 2.06%
CBQ Finance Ltd USD 500 million* Sep-20 Sep-25 Fixed Rate 2.06%
CBQ Finance Ltd JPY 1 billion* Sep-20 Sep-23 Fixed Rate 0.60%
CBQ Finance Ltd JPY 1 billion* Nov-20 Nov-23 Fixed Rate 0.60%
CBQ Finance Ltd JPY 1.5 billion* Nov-20 Nov-23 Fixed Rate 0.65%
CBQ Finance Ltd USD 10 million* Nov-20 Nov-23 Fixed Rate 1.48%
CBQ Finance Ltd CHF 185 million* Nov-20 Nov-24 Fixed Rate 0.745%
CBQ Finance Ltd USD 10 million* Dec-20 Dec-23 Fixed Rate 1.5%
Subordinated Notes Alternatifbank USD 297 million Apr-16 Apr-26 Fixed Rate 8.75%
Senior Notes Alternatifbank TL 50 million Aug-19 Aug-21 Fixed Rate 16.67%
Alternatifbank TL 13 million Jul-20 Jul-21 Fixed Rate 9.65%
Alternatifbank TL 24 million Jul-19 Jul-21 Fixed Rate 9.85%
Alternatifbank TL 2.6 million Jul-20 Jan-21 Fixed Rate 9.70%
Alternatifbank TL 13.7 million Jul-20 Feb-21 Fixed Rate 9.85%
Alternatifbank TL 73.6 million Nov-20 Feb-21 Fixed Rate 15.75%
Alternatifbank TL 44.7 million Nov-20 Mar-21 Fixed Rate 16.25%
Alternatifbank TL 93.9 million Dec-20 Mar-21 Fixed Rate 16.75%
Alternatifbank TL 89.2 million Dec-20 Apr-21 Fixed Rate 23.97%
* Issued for and Guaranteed by the Bank # Others include certificate of deposits issued by the bank.

159
Notes to the Consolidated Financial Statements continuedAs at and for the year ended 31 December 2020 QAR ‘000s
18. DEBT SECURITIES (continued) Movement in debt securities are analysed as follows:
2020 2019
Balance at 1 January 9,524,590 16,071,746
Additions 5,452,640 3,486,978
Repayments (2,157,982) (9,932,780)
Amortization of discount and transaction cost 13,623 23,826
Accrued interest (1,731) (43,138)
Exchange difference 275,994 (82,042)
Balance at 31 December 13,107,134 9,524,590
The table below shows the maturity profile of debt securities:
2020 2019
Up to 1 year 5,710,764 1,193,838
Between 1 and 3 years 3,259,122 4,568,449
Over 3 years 4,137,248 3,762,303
Total 13,107,134 9,524,590
19. OTHER BORROWINGS
2020 2019
Bilateral loans 1,427,572 180,559
Syndicated loans 5,178,191 4,616,940
Others 7,439,514 7,144,995
Accrued interest 80,399 100,673
Total 14,125,676 12,043,167

160
Notes to the Consolidated Financial Statements continuedAs at and for the year ended 31 December 2020 QAR ‘000s
19. OTHER BORROWINGS (continued) Movements in other borrowings are as follows:
2020 2019
Balance at 1 January 12,043,167 8,379,734
Additions 8,922,233 7,793,321
Repayments (6,073,532) (3,735,723)
Amortization of discount and transaction cost 15,886 12,077
Accrued interest (20,274) 22,767
Exchange difference (761,804) (429,009)
Balance at 31 December 14,125,676 12,043,167
The table below shows the maturity profile of other borrowings:2020 2019
Up to 1 year 10,370,990 7,102,050
Between 1 and 3 years 3,108,991 4,134,116
Over 3 years 645,695 807,001
Total 14,125,676 12,043,167

161
Notes to the Consolidated Financial Statements continuedAs at and for the year ended 31 December 2020 QAR ‘000s
20. OTHER LIABILITIES
2020 2019
Accrued expense payable 307,874 148,459Other provisions (Note i) 198,147 194,270Negative fair value of derivatives (Note 36) 1,059,829 526,643Unearned income 248,365 231,416Cash margins 631,355 663,044Accounts payable 588,751 650,715Directors’ remuneration and meeting attendance fee 18,500 18,500Provision for sports and social activities support fund (“Daam”) (Note 23) 32,530 50,526Dividend payable 23,211 23,373Managers’ cheque and payment order 52,619 46,841Unclaimed balances 14,065 12,609Due for trade acceptances 3,046,192 1,480,885Deferred tax liabilities 438 649Lease liabilities (Note ii) 491,035 133,333Employees’ benefit liability (Note 31 and Note iii) 90,474 117,462Income tax payable 17,440 25,596Others 1,424,190 965,052Net impairment losses on loan commitments and financial guarantees 160,881 95,753Total 8,405,896 5,385,126
(i) Other provisionsProvident
fund (a)Pension fund (b)
Total 2020
Total 2019
Balance at 1 January 193,866 401 194,267 215,706Provision made during the year (note 31) 13,772 9,880 23,652 22,483Earnings of the fund 5,376 - 5,376 5,530Provident fund – staff contribution 5,380 5,148 10,528 10,428Transferred to state retirement fund authority - (15,205) (15,205) (16,247)Payment during the year (19,729) - (19,729) (43,127)Exchange difference (742) - (742) (503)Balance at 31 December 197,923 224 198,147 194,270
(a) The provident fund includes the Group’s obligations for end of service benefits to expatriate staff per Qatar labour law and the employment contracts.
(b) Pension fund contributions in respect of the national staff are paid to the State administered retirement fund at the end of each month. The Group has no further payment obligations once the contributions have been paid. The contributions are recognized when they are due.

162
Notes to the Consolidated Financial Statements continuedAs at and for the year ended 31 December 2020 QAR ‘000s
20. OTHER LIABILITIES (continued)
(ii) Lease liabilities The table below shows the maturity profile of lease liabilities:
2020 2019
Up to 1 year 110,719 26,534
Above 1 year 380,316 106,799
Total 491,035 133,333
(iii) Employees’ benefit liability The Bank has granted performance rights to employees including senior management. Performance rights represent a
contingent right to receive a cash payment by referencing to the value of Bank shares during a specified period of time. These performance rights do not provide any entitlement to receive Bank shares, voting rights or dividends associated with them. The fair value at the grant date was estimated using the Black Scholes model, considering the terms and conditions upon which the performance rights were granted. Performance rights will be settled in cash. The following tables list the inputs to the model used for plan for the year ended 31 December 2020 and 31 December 2019:
2020 2019
Max Min Max Min
Expected volatility (%) 30.05% 21.45% 30.88% 26.78%Dividend yield (%) 14.45% 4.75% 9.92% 3.28%
Risk - free int. rate (%) 2.07% 1.36% 3.05% 2.43%
Number of performance rights 157.5 million 180.7 million
Vesting period 3 years 3 years
Share price (QAR) 4.4 4.7
Average strike price (QAR) 3.58 3.56
163
Notes to the Consolidated Financial Statements continuedAs at and for the year ended 31 December 2020 QAR ‘000s
21. EQUITY
(a) Share capital The issued, subscribed and paid up share capital of the Bank is QAR 4,047,253,750 (2019: QAR 4,047,253,750) divided
into 4,047,253,750 (2019: 4,047,253,750) ordinary shares of QAR 1 each (2019: QAR 1 each).
2020 2019
Authorized number of ordinary shares 4,047,253,750 4,047,253,750
Nominal value of ordinary shares (QAR) 1 1
Issued and paid up capital (in thousands of Qatar Riyals) 4,047,254 4,047,254
At 31 December 2020, the authorized share capital comprised 4,047,254 thousand ordinary share (2019: 4,047,254 thousand).
The holders of ordinary shares are entitled to receive dividends as declared from time to time and are entitled to one vote per share at shareholders’ Annual/Extra-ordinary General meeting of the Bank.
(b) Legal reserve The legal reserve of Commercial Bank and Alternatifbank are QAR 9,764 million (2019: QAR 9,740 million) and QAR 101
million (2019: QAR 96 million) respectively.
In accordance with Qatar Central Bank Law No 13 of 2012, 10% of the net profit of the Group for the year is required to be transferred to legal reserve. Share premium collected from the issuance of new shares and sale of treasury shares is also transferred to legal reserve. Transfer to legal reserve from net profit is mandatory until the legal reserve equals 100% of the paid up capital. This reserve is not available for distribution except in circumstances specified in Qatar Commercial Companies Law No 11 of 2015 and is subject to pre-approval from QCB.
In accordance with the Turkish Commercial code, an entity is required to transfer 5% of net profit until the legal reserve is equal to 20% of issued and fully paid up share capital. Rate for transfer to legal reserve goes up to 10% of net profit allocated for distribution excluding the first 5% of the allocated profit. Share premium and proceeds from cancelled shares, if any net of related expenses are also transferred to legal reserve.
(c) General reserve As per the Bank’s Articles of Association, the general reserve may only be used in accordance with a resolution from the
General Assembly upon the Board of Directors recommendation and after obtaining Qatar Central Bank approval.
(d) Risk reserve In accordance with QCB regulations, a risk reserve should be maintained created to cover contingencies on both the
public and private sector financing assets, with a minimum requirement of 2.50% of the total loans and advances of the Group inside and outside Qatar after the exclusion of the credit impairment losses and interest in suspense. The finance provided to/or secured by the Ministry of Finance or finance against cash guarantees is excluded from the gross direct finance. On 1st January 2018, after QCB approval QAR 1,529 millions was appropriated from risk reserve for transition adjustment on adoption of IFRS 9. During the year QAR 616 million (2019: QAR 535 million) was transferred to the risk reserve account as per QCB approval.

164
Notes to the Consolidated Financial Statements continuedAs at and for the year ended 31 December 2020 QAR ‘000s
21. EQUITY (continued)
(e) Fair value reserve The fair value reserve arises from the revaluation of the investment securities through FVOCI, cash flow hedges and
change of post acquisition fair value reserve of its associates and a joint arrangement.
Fair value reserve 2020 2019
Balance as at 1 January 600,094 (96,333)
Impact of revaluation (IFRS 9):
- on equity securities (including Foreign currency translation difference) (88,168) (34,072)
- on debt securities 443,081 663,769
Net amount Transferred to Income statement (3,519) (9,091)
Net movement in effective portion of Cash Flow hedges 59,634 9,053
Net change in fair value of investment in associates (10,821) 22,051
FVOCI instrument loss transferred to Retained earnings - 44,717
Net movement during the year 400,207 696,427
Balance as at 31 December 1,000,301 600,094
(f) Treasury shares Treasury shares represents ordinary shares of The Commercial Bank (P.S.Q.C) with nominal value of QAR 1 each. All treasury
shares were sold during the year 2020. Treasury shares are presented as a deduction from equity.
(g) Foreign currency translation reserve The translation reserve comprises all foreign exchange differences arising from the translation of the financial statements
of foreign operations.
(h) Other reserves This includes the Group’s share of profit from investment in associates and a joint arrangement and non-distributable
profit of subsidiaries, net of cash dividend received, as required by QCB regulations as follows:
2020 2019
Balance as at 1 January 859,893 959,764
Share of result of associates and a joint arrangement (note 12) (210,006) (6,799)
Dividend from associates and a joint arrangement (note 12) (92,614) (93,072)
Net movement (302,620) (99,871)
Balance as at 31 December 557,273 859,893

165
Notes to the Consolidated Financial Statements continuedAs at and for the year ended 31 December 2020 QAR ‘000s
21. EQUITY (continued)
(i) Proposed dividend The Board of Directors has proposed a cash dividend of 10% for the year 2020 (2019: 20% cash dividend). This proposal
is subject to approval at the Annual General Assembly.
( j) Dividends A cash dividend of 20% for the year 2019 (2018: 15% cash dividend), was approved at the Annual General Assembly held
on 23 March 2020 and distributed to shareholders.
(k) Revaluation reserve This represents the surplus on revaluation of land and buildings that are used in Group’s operations and is not available for
distribution until the related assets have been disposed off or used.
(l) Instruments eligible for additional capital In December 2013; the Bank raised regulatory tier 1 capital of QAR 2 billion by issuing unsecured perpetual non-cumulative
unlisted Tier 1 notes. The coupon payments are discretionary and non-cumulative. On the first call date of 30 December 2019, the interest rates on the notes have been agreed at 5.15% (previous rate 6%) and thereafter to be reset at a prevailing sixth year mid-swap rate plus margin every sixth year which will be at 30 December 2025.
In February 2016, the Bank raised additional regulatory tier 1 capital of QAR 2 billion by issuing unsecured perpetual non-cumulative unlisted Tier 1 notes. The coupon payments are discretionary and non-cumulative and priced at a fixed rate of 6% per annum, payable annually until the first call date and thereafter to be reset at a prevailing sixth year mid-swap rate plus margin every sixth year. As per amendments required by Qatar Central Bank the first call date was amended from 27 February 2022 to 31 December 2021.
The Notes are ranked junior to the Bank’s existing unsubordinated obligations including existing subordinated debt and depositors, pari passu to all current and future subordinated obligations and senior to the ordinary shares issued by the Bank.
The Notes have no fixed redemption date and the Bank can only redeem the Notes in the limited circumstance as mentioned in the term sheet i.e. regulatory / tax redemption and other general redemption conditions solely at the Bank’s discretion. The Bank might be required to write-off the proposed Capital issue, if a “loss absorption” event is triggered and the Bank has non-discretionary obligation to deliver cash or financial assets. These notes have been classified under equity.

166
Notes to the Consolidated Financial Statements continuedAs at and for the year ended 31 December 2020 QAR ‘000s
22. OTHER COMPREHENSIVE INCOME2020 2019
Changes in fair value of investments in debt securities designated at FVOCI (IFRS 9):
Positive change in fair value 445,568 666,739
Negative change in fair value (2,487) (2,970)
Net change in fair value 443,081 663,769
Net amount transferred to profit or loss* (3,519) (9,091)
Foreign currency translation differences for foreign operation (288,430) (129,811)
Share of other comprehensive income of associates and a joint arrangement 1,214 28,059
Net changes in FV of Cash Flow hedges 59,634 9,053
211,980 561,979
Net changes in fair value of equity investments designated at FVOCI (IFRS 9):
Net changes in FV of equity investments – FVOCI 43,104 (34,072)
Foreign currency translation differences (131,272) -
Share of other comprehensive income of associates and a joint arrangement (12,035) (6,008)
Total other comprehensive income 111,777 521,899
*Net amount transferred to profit or loss includes a positive change in fair value of QAR 10.4 million (2019: QAR 9.7 million) and a negative change in fair value of QAR 6.9 million (2019: QAR 0.6 million).
23. CONTRIBUTION TO PROVISION FOR SPORTS AND SOCIAL ACTIVITIES SUPPORT FUND (“DAAM”) Pursuant to Law No. 13 of 2008, the Bank made an appropriation of QAR 32.5 million (2019: QAR 50.5 million) from
retained earnings for its contribution to the Social and Sports Activities Support Fund (“Daam”) of Qatar. This amount represents 2.5% of the net profit of the Group for the year ended 31 December 2020.
24. INTEREST INCOME2020 2019
Loans and advances to customers 4,303,977 5,220,424
Debt securities 1,116,704 1,148,964
Amounts deposited with banks 235,349 375,151
Amounts deposited with central banks 15,347 50,871
5,671,377 6,795,410
The amounts reported above include interest income, calculated using the effective interest method, that relate to, at amortized cost QAR 5,280 million (2019: QAR 6,459 million) and at fair value QAR 391 million (2019: QAR 336 million).

167
Notes to the Consolidated Financial Statements continuedAs at and for the year ended 31 December 2020 QAR ‘000s
25. INTEREST EXPENSE2020 2019
Customer deposits 1,568,113 2,348,258
Debt securities 333,942 644,014
Other borrowings 412,444 393,231
Interest expense on lease liabilities 8,475 11,149
Amount deposited by central banks and other banks 248,268 435,575
2,571,242 3,832,227
The amounts reported above include interest expense, calculated using the effective interest method, on financial liabilities at amortized cost.
26. FEE AND COMMISSION INCOME2020 2019
Loans and advances 343,103 366,114
Credit and debit card fees 397,322 458,963
Indirect credit facilities 138,052 168,011
Banking and other operations 166,550 251,633
Investment activities for customers 65,068 44,499
1,110,095 1,289,220
27. FEE AND COMMISSION EXPENSE2020 2019
Credit and debit card fees 209,186 288,162
Brokerage services 14,619 11,391
Others 75,441 74,821
299,246 374,374
28. NET FOREIGN EXCHANGE GAIN2020 2019
Dealing in foreign currencies & revaluation of spot assets 296,351 281,045

168
Notes to the Consolidated Financial Statements continuedAs at and for the year ended 31 December 2020 QAR ‘000s
29. NET (LOSS) / INCOME FROM INVESTMENT SECURITIES2020 2019
Net gain on disposal of investment securities measured at fair value 26,560 25,237
Net Change in Fair-value of Investment securities (53,671) 39,405
Dividend income 3,664 4,351
(23,447) 68,993
30. OTHER INCOME2020 2019
Rental and other income 53,245 118,578
31. STAFF COSTS2020 2019
Salary and benefits (Note) 589,897 754,687
Health care and medical insurance expenses 17,498 17,028
Staff end of services and pension fund contribution (Note 20 (i)) 23,652 22,483
Training and education 1,552 2,154
632,599 796,352
Note: Salary and benefits include a credit of QR 6.8 million (2019: a surplus of QAR 117.5 million) with respect to performance rights due to decline in the market value.
32. OTHER EXPENSES2020 2019
Marketing and advertisement 34,750 26,842
Professional fees 19,638 16,325
Communication, utilities and insurance 50,044 46,914
Board of Directors’ remuneration 18,500 18,500
Occupancy, IT consumables and maintenance 49,490 41,486
Travel and related costs 446 1,684
Printing and stationery 4,847 4,376
Outsourcing service costs 31,199 38,158
Others 56,124 32,359
265,038 226,644
169
Notes to the Consolidated Financial Statements continuedAs at and for the year ended 31 December 2020 QAR ‘000s
33. EARNINGS PER SHARE Earnings per share of the Bank is calculated by dividing profit for the year attributable to the equity holders of the Bank by
the weighted average number of ordinary shares in issue during the year:
2020 2019
Basic and dilutedProfit for the year attributable to the equity holders of the Bank 1,301,213 2,021,040
Less: Dividend on Instrument eligible for additional capital (223,000) (240,000)
Profit for EPS calculation 1,078,213 1,781,040
Weighted average number of outstanding shares in thousands (Note 21 (a)) 4,047,254 4,047,254
Basic and diluted earnings per share (QAR) 0.27 0.44
34. CONTINGENT LIABILITIES AND CAPITAL COMMITMENTS2020 2019
a) Contingent liabilities Unutilized credit facilities 4,465,134 4,287,871
Guarantees 17,788,756 21,353,539
Letters of credit 2,291,488 1,706,950
Total 24,545,378 27,348,360
b) Capital commitments
Total 127,548 421,352
Unused facilities Commitments to extend credit represent contractual commitments to make loans and revolving credits. The total
contractual amounts do not necessarily represent future cash requirements, since commitments may expire without being drawn upon.
Guarantees and letters of credit Guarantees and letters of credit make the group liable to make payments on behalf of customers in the event of a specific
event. Guarantees and standby letters of credit carry the same credit risk as loans.
35. CASH AND CASH EQUIVALENTS2020 2019
Cash and balances with central banks * 4,376,695 2,453,619
Due from banks up to 90 days 6,145,270 7,602,352
10,521,965 10,055,971
*Cash and balances with central banks exclude the mandatory cash reserve.

170
Notes to the Consolidated Financial Statements continuedAs at and for the year ended 31 December 2020 QAR ‘000s
36. DERIVATIVESPositive
fair valueNegative fair value
Notional amount
within 3 months
3 - 12 months 1-5 years
More than 5 years
At 31 December 2020:Derivatives held for trading:Interest rate swaps 952,605 873,971 12,946,978 322,990 463,585 4,484,822 7,675,581Forward foreign exchange contracts & others 487,706 164,685 50,522,392 18,928,096 5,719,082 17,966,645 7,908,569
Derivatives held for fair value hedges:Interest rate swaps 177,350 19,031 8,763,546 2,686,102 949,070 3,235,574 1,892,800Derivatives held for cash flow hedges:Forward foreign exchange contracts & others - - 2,960,421 - - 2,960,421 -
Interest rate swaps 3,840 2,142 2,857,455 - 449,297 2,408,158 -
Total 1,621,501 1,059,829 78,050,792 21,937,188 7,581,034 31,055,620 17,476,950
At 31 December 2019:
Derivatives held for trading:
Interest rate swaps 439,654 333,780 12,540,390 30,599 1,936,671 4,004,935 6,568,185Forward foreign exchange contracts & others
237,389 113,847 47,722,621 14,873,925 3,979,028 19,924,049 8,945,619
Derivatives held for fair value hedges:Interest rate swaps 86,578 8,086 3,713,772 - - 1,092,122 2,621,650Derivatives held for cash flow hedges:Forward foreign exchange contracts & others
- 62,289 4,426,448 - - 4,426,448 -
Interest rate swaps 699 8,641 526,184 - 367,105 159,079 -
Total 764,320 526,643 68,929,415 14,904,524 6,282,804 29,606,633 18,135,454
The bank maintains strict control limits on net open derivative positions, i.e. the difference between purchase and sale contracts, by both amount and term. At any one time the amount subject to credit risk is limited to the current fair value of instruments that are favourable to the bank (i.e. assets) which in relation to derivatives is only a small fraction of the contract or notional values used to express the volume of instruments outstanding. This credit risk exposure is managed as part of the overall lending limits with customers, together with potential exposures from market movements. Collateral or other security is not usually obtained for credit risk exposures on these instruments, except where the bank requires margin deposits from counter-parties.

171
Notes to the Consolidated Financial Statements continuedAs at and for the year ended 31 December 2020 QAR ‘000s
36. DERIVATIVES (continued) At 31 December 2020, the Group held the following derivatives as hedging instruments:
Hedging instrument
Cash Flow Hedges: Hedged item Description CurrencyNotional in
currencyAverage
Rate
Interest Rate Swaps Customer Deposits Fixed for floating TRY 5,787,446 19.7%
Bond Issuance Fixed for floating USD 95,900,000 2.6%
Cross Currency Swaps Bond Issuance CHF to USD USD 813,302,542 3.8%
CHF 770,000,000 1.2%
CNH to USD USD 24,402,774 2.1%
CNH 171,000,000 4.0%
HKD to USD USD 85,157,619 2.0%
HKD 660,000,000 2.1%
JPY to USD USD 33,957,809 1.5%
JPY 3,500,000,000 0.6%
Loans JPY to USD USD 259,398,522 1.6%
JPY 27,700,000,000 -0.2%
Hedging instrument
Fair value Hedges: Hedged item Description CurrencyNotional in
currencyAverage
Rate
Interest Rate Swaps Govt Bonds Fixed for floating USD 260,000,000 2.79%
37. FUND MANAGEMENT As at the end of the reporting date, the Group holds QAR 913 million (2019: QAR 392 million) worth of international
investment securities on behalf of its customers. Out of this amount, investment securities with a value of QAR 552 million (2019: QAR 338 million) are held with an international custody and settlement house. The remaining investment securities are held with the financial institutions through whom the securities were purchased. These financial institutions are industry leaders in their respective fields. The Group has established maximum limits for such holding with each financial institution according to its risk management policy.

172
Notes to the Consolidated Financial Statements continuedAs at and for the year ended 31 December 2020 QAR ‘000s
38. RELATED PARTIES2020 2019
Board members of the bank- Loans, advances and financing activities (a) 1,435,891 1,176,839
- Deposits 1,150,952 798,857
- Contingent liabilities and other commitments 73,214 3,722
- Interest and fee income 52,200 25,835
- Interest paid on deposits accounts of board members 19,959 8,532
- Remuneration 18,500 18,500
Associates and joint arrangement companies
Due from banks 145,814 309,400
Due to banks 155,476 10,610
Deposits 8,274 9,951
Contingent liabilities 1,472,211 745,942
Interest paid to associates 1,402 4,725
Senior management of the bank
- Remuneration and other benefits* 47,864 110,941
- Loans and advances 5,634 5,156
* Remuneration and other benefits include cost for performance rights amounting to QAR 1.62 million (2019: QAR 71.7 million). The performance rights represent the movement of the share price related to the underlying share options.
(a) A significant portion of the loans, advances and financing activities’ balance at 31 December 2020 and 31 December 2019 with the members of the Board and the companies in which they have significant influence are secured against tangible collateral or personal guarantees. Moreover, the loans, advances and financing activities are performing satisfactorily honouring all obligations.
39. IMPACT OF COVID-19
Estimates and judgements The spread of coronavirus (“COVID-19”) pandemic has severely impacted various economies globally, causing disruption
to business and economic activities. This has resulted in a global economic slowdown with uncertainties in the economic environment. Global stock markets have also experienced great volatility and a significant weakening. Governments and central banks have responded with monetary and fiscal interventions to stabilize economic conditions.
The Group is actively monitoring the COVID 19 situation and in response to this outbreak CBQ, has activated its business continuity plan and various other risk management practices to manage the potential business disruption on its operations and financial performance.

173
Notes to the Consolidated Financial Statements continuedAs at and for the year ended 31 December 2020 QAR ‘000s
39. IMPACT OF COVID-19 (continued) In addition, the Group’s operations are mainly based in economies that are relatively dependent on the price of crude oil
and natural gas. During the current year oil prices have witnessed unprecedented volatility and has decreased significantly.
In preparing the consolidated financial statements, significant judgements made by management in applying the Group’s accounting policies and the key sources of estimation uncertainty were impacted by the potential impacts of the current economic volatility in determination of the reported amounts of the Group’s financial and non-financial assets and these are considered to represent management’s best assessment based on available or observable information. Markets however remain volatile and the recorded amounts remain sensitive to market fluctuations.
The significant accounting estimates impacted by these forecasts and associated uncertainties are predominantly related to expected credit losses, fair value measurement, and the assessment of the recoverable amount of non-financial assets. The Group has considered the potential impacts of the current economic volatility in determination of the reported amounts of the financial and non-financial assets and these are considered to represent management’s best assessment based on observable information. Markets however remain volatile and the recorded amounts remain sensitive to market fluctuations.
Credit risk IASB’s guidance note issued on 27 March 2020, advises that both the assessment of Significant Increase in Credit risk
(SICR) and the measurement of ECLs are required to be based on reasonable and supportable information that is available without undue cost or effort. In assessing forecast conditions, consideration should be given both to the effects of COVID-19 and the significant government support measures being undertaken. When it is not possible to reflect such information in the models, the Board expects post-model overlays or adjustments to be considered.
For the year end 31 December 2020, the Group has updated inputs and assumptions used for the determination of expected credit losses (“ECLs”) in response to uncertainties caused by COVID 19 and unprecedented volatility in oil prices. ECLs were estimated based on a range of forecast economic conditions as at that date. Considering that the situation is fast evolving, the Group has considered the impact of higher volatility in the forward-looking macro-economic factors, when determining the severity and likelihood of economic scenarios for ECL determination and will continue to do so for the upcoming quarters.
This is broadly consistent with guidelines issued by QCB which mandates that loan instalment deferment may not in its own trigger SICR as this might indicate short term liquidity problems.
The ECL models have been updated through adjustments in the methods of scenario construction and the underlying weightages assigned to these scenarios. The forward-looking factor (here Credit Index or CI) used is determined from the observed historical credit index. The credit index is used to forecast expected point-in-time probabilities of default for the credit portfolio of the Bank. These are disclosed in Note 4(b) Credit Risk.
The Group has given specific consideration to the relevant impact of COVID-19 on the qualitative and quantitative factors when determining the significant increase in credit risk and assessing the indicators of impairment for the exposures in potentially affected sectors. To this extent the Bank has elevated the near term PDs resulting in higher recognition of relevant ECLs and impairment allowances as disclosed in to the consolidated financial statements.

174
Notes to the Consolidated Financial Statements continuedAs at and for the year ended 31 December 2020 QAR ‘000s
39. IMPACT OF COVID-19 (continued) The Group has deferred repayments of certain customers for a temporary period. In accordance with IASB guidance, this
forbearance does not automatically trigger a significant increase in credit risk and a stage migration for the purpose of calculating expected credit losses, as these are measures are being made available to assist borrowers affected by COVID-19 outbreak to resume regular payments. Similarly, any covenant breach having particular relevance to COVID-19 e.g. delay in submission of audited financial accounts etc. may not necessarily trigger SICR.
The exercise of the deferment option by a customer, in its own, is not considered by the Bank as triggering SICR and as a consequence impact on ECL for those customers were determined based on their existing staging. However, as part of the Bank’s credit evaluation process especially given the current economic situation, the Bank obtained further information from the customer to understand their financial position and ability to repay the amount and in case where indicators of significant deterioration were noted, the customers’ credit ratings and accordingly exposure staging were adjusted, where applicable.
In addition to the assumptions outlined above, the Group continues to closely monitor the potential repayment risk impact of COVID-19 on affected industry sectors and borrower’s performance against the likelihood of repayments.

175
As at 31 December 2020 QAR ‘000sFinancial Statement of the Parent
(a) Statement of Financial Position – Parent
2020 2019
ASSETS
Cash and balances with central banks 6,503,599 4,431,379
Due from banks 10,406,613 11,767,481
Loans and advances to customers 84,938,536 76,475,207
Investment securities 23,174,627 24,407,811
Investment in associates and a joint arrangement and subsidiaries 4,343,780 5,445,227
Property and equipment 2,616,006 2,639,085
Other assets 5,199,800 6,403,778
TOTAL ASSETS 137,182,961 131,569,968
LIABILITIES
Due to banks 20,402,012 23,348,968
Customer deposits 67,037,368 66,854,395
Debt securities 11,814,989 7,791,254
Other borrowings 9,177,529 7,256,184
Other liabilities 6,984,993 4,779,148
TOTAL LIABILITIES 115,416,891 110,029,949
EQUITY
Share capital 4,047,254 4,047,254
Legal reserve 9,763,429 9,739,507
General reserve 26,500 26,500
Risk reserve 2,102,994 1,486,994
Fair value reserve 1,131,212 619,393
Treasury shares - (38,860)
Foreign currency translation reserve (2,493,892) (1,982,124)
Other reserves 507,273 809,892
Revaluation reserve 1,264,794 1,264,794
Retained earnings 1,416,506 1,566,669
TOTAL EQUITY ATTRIBUTABLE TO EQUITY HOLDERS OF THE BANK 17,766,070 17,540,019
Instruments eligible for additional capital 4,000,000 4,000,000
TOTAL EQUITY 21,766,070 21,540,019
TOTAL LIABILITIES AND EQUITY 137,182,961 131,569,968

176
For the year ended 31 December 2020 QAR ‘000s
(b) Income Statement – Parent
2020 2019
Interest income 4,553,007 5,047,785
Interest expense (1,750,374) (2,473,614)
Net interest income 2,802,633 2,574,171
Fee and commission income 923,606 1,118,382
Fee and commission expense (245,783) (333,812)
Net fee and commission income 677,823 784,570
Net foreign exchange gain 301,034 189,832
Net (loss)/income from investment securities (32,453) 69,955
Other operating income 54,546 128,052
Net operating income 3,803,583 3,746,580
Staff costs (419,900) (592,298)
Depreciation (109,509) (118,921)
Amortization and impairment of intangible assets (48,268) (46,268)
Net impairment (losses)/reversal on investment securities (31,899) 6,856
Net impairment losses on loans and advances to customers (718,590) (377,030)
Net impairment losses on other financial assets (107,461) (68,704)
Impairment on Investment in an Associate (591,242) (413,881)
Other provisions (40,177) -
Other expenses (298,331) (221,817)
Profit for the year 1,438,206 1,914,517
Accounting Policies for Financial Information of the ParentBank Statement of financial position and income statement of the parent bank are prepared using the same accounting policies followed for the consolidated financial statements except for investment in subsidiaries and associates, which are not consolidated and carried at cost.
Financial Statement of the Parent continued


www.cbq.qa