4.4 52 week range (EUR) No. of Shares 22.1 Avg. daily...
12
1 / 12 Sales in mio EUR 2012 % 2013 % YoY Western Europe 480.9 38.1% 466.7 37.6% -3.0% Eastern Europe 682.0 54.0% 684.5 55.2% 0.4% Other 100.2 7.9% 89.3 7.2% -10.9% Total Group 1,263.1 100.0% 1,240.5 100.0% -1.8% GORENJE D.D. www.gorenje.si Stock data as of 17.03.2014 Market price (EUR) Market Cap (EUR) 88.2 52 week range (EUR) No. of Shares 22.1 Avg. daily trade vol., EUR(k) Free float 59% Average daily % of stock traded Dividend yield 0.0% Price performance 3 months 12 months Multiples: TTM 2014F P/E neg. 12.1 price change in % -3.9% -3.4% EV/Sales 0.3 0.3 SBI TOP index change in % 9.0% 14.4% EV/EBITDA 5.3 4.6 relative to SBI TOP index in % -11.8% -15.6% EV/EBIT 11.5 9.6 3.99 3.7-4.6 26.40 0.028% Key figures (According to International Accounting Standards) Consolidated data in EURm Income statement: Balance sheet: million € FY2012 FY2013 FY2014 FY2015 million € FY2012 FY2013 TTM Sales 1,263.1 1,240.5 1,281.3 1,331.5 Investments 65.4 40.0 40.0 Growth yoy -1.5% -1.8% 3.3% 3.9% Cash 53.5 38.6 38.6 EBITDA 90.6 78.2 91.2 100.1 Debt 432.7 397.4 397.4 Margin 7.2% 6.3% 7.1% 7.5% Net debt 313.8 318.9 318.9 EBIT 44.9 36.3 43.3 50.6 Equity 389.8 380.7 380.7 Margin 3.6% 2.9% 3.4% 3.8% Assets 1,197.3 1,149.7 1,149.7 Net income 0.1 -25.2 8.1 12.7 D/E 111.0% 104.4% 104.4% Growth -99.4% -48471.2% -132.1% 56.9% ROE 0.0% -6.6% -6.6% EPS 0.0 -0.9 0.3 0.4 ND/EBITDA 3.5 4.1 4.1 Investment Thesis: Owning more than 4% of European appliance market: Gorenje is Slovenia’s biggest exporter, while the company has approximately 4.24% market share in appliances on the European market. We note this represents an increase during 2013, namely from 4.00%. We also note Gorenje is present on Eastern European markets (13% of sales revenues in 2012 came from Russia, 6.6% from Serbia, 5.3% from Ukraine, 4.7% from Czech Republic, 4.2% from Croatia) as well as Western European market (12.5% of sales revenues in 2012 came from Scandinavia, 12.4% from Germany, 10.1% from Netherlands, 3.6% from Slovenia, 2.4% from Austria). In order to further strengthen its position, Gorenje acquired ATAG (Netherlands) and Asko (Scandinavia) in the past few years. The latter contributed to better position on markets outside Europe as well. Ambitious management plan: For 2014 management guided for EUR 1,287m of consolidated revenues (+3.7% YoY), EBITDA of 93.7 (margin 7.2%; +20% YoY), EBIT of 46.4m and net profit of EUR 13.2m (without discontinued operations that deduct EUR 1.2m) versus loss reported for 2013. Overall a nice improvement in profitability and turnaround is planned for 2014. In October 2013 Gorenje Group published an updated Strategic Plan for the period from 2014 to 2018, based on successful completion of manufacturing location shift, strategic exclusive alliance with the Panasonic Corporation, divestment of its furniture manufacturing operations and sales structure reorganization and optimization. Deleveraging remains a key goal to the point where the Net debt/EBITDA ratio does not exceed 3.0. This is expected to be accomplished in 2015. The Group will continue to generate most of its revenue in Europe while revenue generated outside Europe is expected to double to around EUR 170m by 2018 as Gorenje will be more aggressive in entering new markets. They also expect to increase their market shares in most key markets. Revenue generated in the core activity is planned to be at over 90% of total revenue, while portfolio investments will be divested when opportunity arises (a good selling price) or if operations prove to be unprofitable (cash losing business). White Goods LJSE ticker: GRVG Bloomberg: GRVG SV 17 th March 2014 ALTA Invest, investicijske storitve, d.d. Železna cesta 18 SI-1000 Ljubljana Slovenia phone: + 386 1 32 00 300 e-mail: [email protected] http://www.alta.si Head of Research: Sašo Stanovnik [email protected] Head of Trading: Igor Taljat [email protected] 4.24% European market share. Management plans for margin expansion. Non-core divestment process. Cyclical industry. Panasonic strategic partnership. 12 months stock performance in EUR Target price : 6.4 EUR Previous target price : 6.2 EUR,BUY (19.11.2013) Recommendation : BUY 3.0 3.2 3.4 3.6 3.8 4.0 4.2 4.4 4.6 4.8 5.0 Mar 13 Jun 13 Sep 13 Dec 13 Mar 14 GRVG SBI TOP
Transcript of 4.4 52 week range (EUR) No. of Shares 22.1 Avg. daily...

1 / 12
Sales in mio EUR 2012 % 2013 % YoY
Western Europe 480.9 38.1% 466.7 37.6% -3.0%
Eastern Europe 682.0 54.0% 684.5 55.2% 0.4%
Other 100.2 7.9% 89.3 7.2% -10.9%
Total Group 1,263.1 100.0% 1,240.5 100.0% -1.8%
GORENJE D.D. www.gorenje.si
Stock data as of 17.03.2014
Market price (EUR) Market Cap (EUR) 88.2
52 week range (EUR) No. of Shares 22.1
Avg. daily trade vol., EUR(k) Free float 59%
Average daily % of stock traded Dividend yield 0.0%
Price performance 3 months 12 months Multiples: TTM 2014F
P/E neg. 12.1
price change in % -3.9% -3.4% EV/Sales 0.3 0.3
SBI TOP index change in % 9.0% 14.4% EV/EBITDA 5.3 4.6
relative to SBI TOP index in % -11.8% -15.6% EV/EBIT 11.5 9.6
3.99
3.7-4.6
26.40
0.028%
Key figures (According to International Accounting Standards) Consolidated data in EURm
Income statement: Balance sheet:
million € FY2012 FY2013 FY2014 FY2015 million € FY2012 FY2013 TTM
Sales 1,263.1 1,240.5 1,281.3 1,331.5 Investments 65.4 40.0 40.0
Growth yoy -1.5% -1.8% 3.3% 3.9% Cash 53.5 38.6 38.6
EBITDA 90.6 78.2 91.2 100.1 Debt 432.7 397.4 397.4
Margin 7.2% 6.3% 7.1% 7.5% Net debt 313.8 318.9 318.9
EBIT 44.9 36.3 43.3 50.6 Equity 389.8 380.7 380.7
Margin 3.6% 2.9% 3.4% 3.8% Assets 1,197.3 1,149.7 1,149.7
Net income 0.1 -25.2 8.1 12.7 D/E 111.0% 104.4% 104.4%
Growth -99.4% -48471.2% -132.1% 56.9% ROE 0.0% -6.6% -6.6%
EPS 0.0 -0.9 0.3 0.4 ND/EBITDA 3.5 4.1 4.1
Investment Thesis: Owning more than 4% of European appliance market: Gorenje is Slovenia’s biggest
exporter, while the company has approximately 4.24% market share in appliances on the European market. We note this represents an increase during 2013, namely from 4.00%. We also note Gorenje is present on Eastern European markets (13% of sales revenues in 2012 came from Russia, 6.6% from Serbia, 5.3% from Ukraine, 4.7% from Czech Republic, 4.2% from Croatia) as well as Western European market (12.5% of sales revenues in 2012 came from Scandinavia, 12.4% from Germany, 10.1% from Netherlands, 3.6% from Slovenia, 2.4% from Austria). In order to further strengthen its position, Gorenje acquired ATAG (Netherlands) and Asko (Scandinavia) in the past few years. The latter contributed to better position on markets outside
Europe as well.
Ambitious management plan: For 2014 management guided for EUR 1,287m of consolidated revenues (+3.7% YoY), EBITDA of 93.7 (margin 7.2%; +20% YoY), EBIT of 46.4m and net profit of EUR 13.2m (without discontinued operations that deduct EUR 1.2m) versus loss reported for 2013. Overall a nice improvement in profitability and turnaround is planned for 2014. In October 2013 Gorenje Group published an updated Strategic Plan for the period from 2014 to
2018, based on successful completion of manufacturing location shift, strategic exclusive alliance with the Panasonic Corporation, divestment of its furniture manufacturing operations and sales structure reorganization and optimization. Deleveraging remains a key goal to the point where the Net debt/EBITDA ratio does not
exceed 3.0. This is expected to be accomplished in 2015. The Group will continue to generate most of its revenue in Europe while revenue generated
outside Europe is expected to double to around EUR 170m by 2018 as Gorenje will be more aggressive in entering new markets.
They also expect to increase their market shares in most key markets. Revenue generated in the core activity is planned to be at over 90% of total revenue, while
portfolio investments will be divested when opportunity arises (a good selling price) or if operations prove to be unprofitable (cash losing business).
White Goods
LJSE ticker: GRVG Bloomberg: GRVG SV 17th March 2014
ALTA Invest, investicijske storitve, d.d. Železna cesta 18 SI-1000 Ljubljana Slovenia phone: + 386 1 32 00 300 e-mail: [email protected] http://www.alta.si Head of Research: Sašo Stanovnik [email protected] Head of Trading: Igor Taljat [email protected]
4.24% European market share. Management plans for margin expansion. Non-core divestment process. Cyclical industry. Panasonic strategic partnership.
12 months stock performance in EUR
Target price: 6.4 EUR Previous target price: 6.2 EUR,BUY (19.11.2013)
Recommendation: BUY
3.0
3.2
3.4
3.6
3.8
4.0
4.2
4.4
4.6
4.8
5.0
Mar 13 Jun 13 Sep 13 Dec 13 Mar 14
GRVG SBI TOP

2 / 12
The Group will continue to develop the multi-brand strategy and presence across the price ranges, with ASKO being a global premium brand, ATAG a local Benelux premium brand, Gorenje as central mid segment global brand etc. 25% of sales should come from premium segments till 2018.
Key projects for the future also include further development of strategic partnership with Panasonic, reducing complexity at all levels, optimizing the supply chain management and intensifying the development activities and innovation management.
Here we must note that management continues it’s focus on free cash flow generation as it is aware that only through this they can improve debt levels and valuation of the company. On the other hand we must be aware of FCF cyclicality in the business clearly seen in graphs. In period 2010 to 2013 period Gorenje Group generated negative EUR 2.9 through operations (EUR 150.2m) and investments (EUR -153.1m). Nevertheless debt was reduced in the period.
Positive start of 2014: In the first two months of this year Group’s performance indicates a
positive trend as revenues were 9% higher compared to the same period last year. Revenues from core activity increased by 3.6% YoY with Russia, Germany, Slovenia, Czech Republic and Slovakia recorded higher home products sales. According the Management estimates, 1Q14 should be positive in terms of profitability, which is a good sign as 1Q is usually a weaker quarter in the year. Also results for 1Q14 should be in accordance with the Group’s plans.
Moving production to low cost labor countries: Due to production facility repositioning conducted in 2012 and 2013 manufacturing plants are now concentrated only in three countries, namely Slovenia, Serbia and Czech Republic. Here we note the Group shifted entire Asko manufacturing operations (7% of Gorenje’s output) to other more cost effective locations. Cooker manufacturing facility was moved from Finland to Czech Republic. Washing machine, dryer and dishwasher production was moved from Sweden to Slovenia. Additionally Gorenje continued with
expansion of production in Serbia, where 3 locations are now utilized (refrigerators and freezers in Valjevo, washing machines and driers of 18,000m2 in Zaječar, water heaters programme in Stara Pazova). In July 2013 Gorenje Group and the Republic of Serbia signed a preliminary agreement on joint investment into Gorenje production facilities in Serbia. According to the agreement, the Republic of Serbia will by a contribution of EUR 15 million support Gorenje's investment into optimization and improvement of efficiency of manufacturing plants in Valjevo and Stara Pazova and investment into washing machine and dryer plant in Zaječar where Gorenje is to manufacture appliances developed in cooperation with Panasonic.
65.0%
62.0%
13.0%
15.0%
13.0%
23.0%
0% 10% 20% 30% 40% 50% 60% 70% 80% 90% 100%
2012 units
2014 unitsSlovenia
Czech Republic
Serbia
Sweden
Finland
65.0%
69.0%
9.0%
11.0%
10.0%
20.0%
0% 10% 20% 30% 40% 50% 60% 70% 80% 90% 100%
2012 value
2014 valueSlovenia
Czech Republic
Serbia
Sweden
Finland
-80
-60
-40
-20
0
20
40
60
80
100
1Q10 2Q10 3Q10 4Q10 1Q11 2Q11 3Q11 4Q11 1Q12 2Q12 3Q12 4Q12 1Q13 2Q13 3Q13 4Q13
Operating Cash Flow
-100
-80
-60
-40
-20
0
20
40
60
80
1Q10 2Q10 3Q10 4Q10 1Q11 2Q11 3Q11 4Q11 1Q12 2Q12 3Q12 4Q12 1Q13 2Q13 3Q13 4Q13
Operating - Investment CF

3 / 12
According to Gorenje estimates the now finished process of production repositioning will generate annual savings of at least EUR 20m from 2014 onwards (EUR 0.82 per share per year; 24.4 share count used for calculation) as an increase of logistic & amortization costs of EUR 3m will partially mitigate the positive effects of labour cost savings in the amount of EUR 23m.
Divestments and business portfolio optimization: Gorenje divested its Interior design division in the beginning of 2013 (Gorenje Kuhinje and Gorenje Notranja Oprema) that produced furniture especially for kitchens. This division has been producing net loss for several consecutive years and continued to struggle after several attempts to achieve a turnaround (although we must acknowledge macro environment was very difficult, significantly affecting sales numbers). The main advantage of this is that overall profitability will improve as well as free cash flow, which will make it easier to lower debt burden. This is a positive step for Gorenje, although probably long overdue, as it shows its willingness to finally divest non-core.
In 2013 EUR 23.7m was generated by divestment of non-core and underperforming assets, however discontinued operations still contributed to a loss of EUR 10.6m (EUR 8.9m in 2012) out of which EUR 7.7m were attributed to impairments. The proceeds were used to repay down debt.
Strategic alliance with Panasonic: In July 2013 Gorenje Group and Panasonic Corporation announced the creation of a long-term strategic alliance that will leverage the combined strengths and capabilities of the two companies, contribute to the profitability of both partners and improve their competitiveness in Europe. The strategic alliance between Gorenje and Panasonic was structured around two pillars: joint R&D and sharing of selected manufacturing platforms for selected product categories (washing machines, refrigerators and built-in ovens); and the sales network and marketing know-how for distribution throughout Europe. As a sign of confidence in the success of the alliance and a commitment to the long-term business relationship, Panasonic invested EUR 10 million and acquired a minority interest in Gorenje through capital injection. Namely Panasonic subscribed and paid 2,320,186 ordinary shares of Gorenje at subscription price of EUR 4.31 per share.
According to the Group, additional annual revenues will grow to EUR 80 million by the year 2018 and EBITDA will gradually improve to EUR 20 million per year till 2018 due to this alliance. We note however this partnership can be a limitation regarding any takeover speculation.
Distribution partnership: In February 2014 Gorenje Group and American premium appliance manufacturer Sub-Zero Group signed a distribution partnership. According to the agreement, Sub-Zero Group will become the exclusive distributor for Asko brand in North America as of April 2014. The cooperation is a part of Gorenje's strategic activities oriented at boosting the Group's presence beyond Europe as well as increasing sales of appliances in the premium price segment. After Panasonic deal, this is a second (positive) step in this direction.
Multi Brand strategy: Together with the acquisitions of different foreign brands (ASKO in Scandinavia, ATAG in Netherlands) Gorenje was extensively working on the rebranding project, which should contribute to future profitability. The main idea is to create a pool of brands ranging from budget to premium brands, which will be focused on different distribution channels. Global brand Local Brand Premium segment ASKO ATAG (Benelux) Mid segment Gorenje Pelgrim (Benelux) Budget segment UPO (Scandinavia)
Mora (Czech, Slovakia) Etna (Benelux) Korting (SEE)
While Gorenje brand will stay company's core business the share of sales of brands in premium
segment is seen by management to increase in the Group's total sales (25% of sales should come from premium segments from 2018 onwards) contributing to margin expansion.
Constant development of new products: Difficult market demands innovation and marketing.
Here Gorenje was been able to keep pace in recent years (with new design labels, by being one of the leaders in colourful home appliances etc.) and this continued in 2013 with a Gorenje Simplicity product line, a new generation of refrigerators, HomeCHEF cooking line, IQcook and appliances promoting healthy lifestyle. For 2014 they will introduce a new line based on concept of a renowned designer. The project for 2014 also include new generation of built-in ovens, upgrade of free-standing refrigerators and freezer, joint development with Panasonic of a new generation of washing machines and development of premium dryers and washing machines under brand Asko.

4 / 12
1Q11 2Q11 3Q11 4Q11 1Q12 2Q12 3Q12 4Q12 1Q13 2Q13 3Q13 4Q13
EBIDTA margin 6.5% 6.9% 5.8% 9.2% 7.3% 6.0% 3.3% 11.8% 5.6% 6.9% 6.1% 6.6%
EBIT margin 2.5% 3.0% 1.8% 6.2% 3.1% 2.3% -0.4% 8.9% 2.0% 3.3% 2.6% 3.7%
-2.0%
0.0%
2.0%
4.0%
6.0%
8.0%
10.0%
12.0%
14.0%
EBIT and EBITDA margins
With all of this we believe Gorenje is moving into right direction given its production structure and market position, but markets remain difficult and competition though.
Secondary listing on Warsaw Stock Exchange: On 30 December 2013 Gorenje shares were
admitted to the Warsaw Stock Exchange. All 22,104,427 ordinary GRVG shares that had previously been listed only on the Ljubljana Stock Exchange are now also traded on the Warsaw Stock Exchange. Secondary listing is a follow-up to two share capital increases in 2013 and one conducted in 2010 (together with IFC) as new international investors were attracted to the Group. Therefore Gorenje's ownership composition became more international. The following figures show five major Gorenje shareholders before and after this year's equity offerings.
KAD 25.19% KAD 22.22% KAD 18.09%
Home Product Europe 7.63% IFC 11.80% Panasonic 10.50%
Ingor 5.66% Home Product Europe 6.73% IFC 8.49%
KD Galileo 4.02% NFD 5.10% Universal Investment Capital 8.40%
Raiffeisen Zentralbank 3.33% Ingor 4.99% NFD 5.09%
Shareholder structure before
the two capital increases in 2013
Shareholder structure before
the two capital increases
Shareholder structure before
the capital increase in 2010
As a result, the government stake has decreased below 20% and with it state influence (although given the cost cutting aggressiveness, we believe the influence is still too high).
Risks:
Severe margin lag: Peer comparison clearly states that Gorenje is trailing its peer’s in terms of
margins. Namely EBITDA margin of Gorenje is on 78% of peer average, EBIT margin on 45% of average while net margin is negative in the amount of 2.0% with peer average at 3.8%. This shows that while Gorenje is a successful in maintaining market shares and top line it is still too cost ineffective and with it too shareholder unfriendly. We must additionally emphasise margins
contracted in 2013 and while management planed for quite some time to close the gap to peer margins, they were clearly unsuccessful so far. Guidance track record is not good. Nevertheless we believe that with its vision of transition to higher end markets on one hand and by moving production to low labour cost countries on the other, Gorenje has significant room for expanding margins in the long term. This would narrow the gap to its peers and improve bottom-line multiples. We therefore conclude that this margin lag is at the same time the biggest weakness and opportunity for Gorenje. If gap closes, results will be in a solid bottom line growth and share price should follow. But if the gap persists Gorenje will continue to struggle especially in terms of CAPEX, debt and stability in recessionary environment; and the share price will share the fate.
Increased Competition: Increasing competition is posed by several big manufacturers, namely Arcelik, Indesit, De’Longhi, Electrolux and Whirlpool. Additionally, the trend of Asian producers trying to capture market share in Europe is increasing and will probably continue. Manufacturers of household appliances are becoming fewer, larger and more international. The five largest
manufacturers of major appliances in the world (Whirlpool, Electrolux, Haier Group, Bosch-Siemens and LG Electronics) accounted for almost half of global sales in 2013. The Gorenje Group’s products will be under pricing pressure especially in low and mid price levels because of intense competition and desire from competitors to increase their respective market shares with Gorenje cost structure limiting its response. Furthermore, ASP pressure will be even more present also in high-end segment. Consequently, margins will be under pressure.
Though environment persists: Given Electrolux data 2013 was again a tough year for household appliances industry and European market continued to be very challenging. In 2013 demand for core appliances in Western Europe declined by 1%, while in Eastern Europe market
5 / 12
148.1
53.3
90.1
30.2
11.7
4.1
7.5
0 20 40 60 80 100 120 140 160
2014
2015
2016
2017
2018
2019
2020-2028
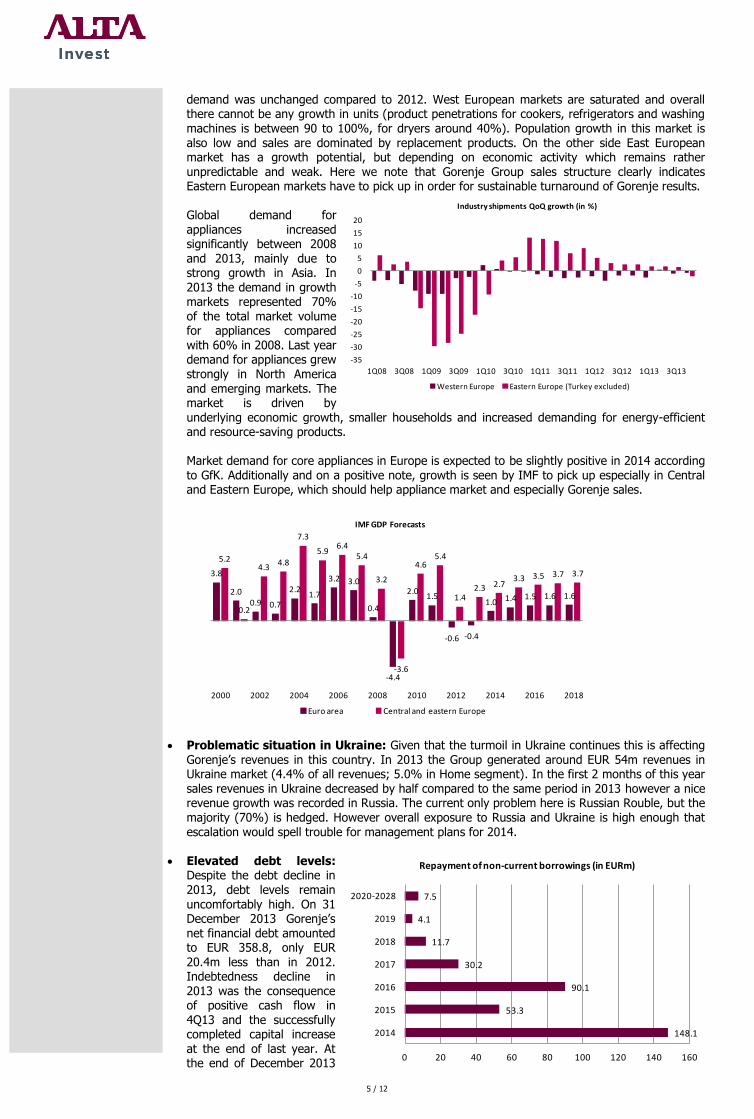
Repayment of non-current borrowings (in EURm)
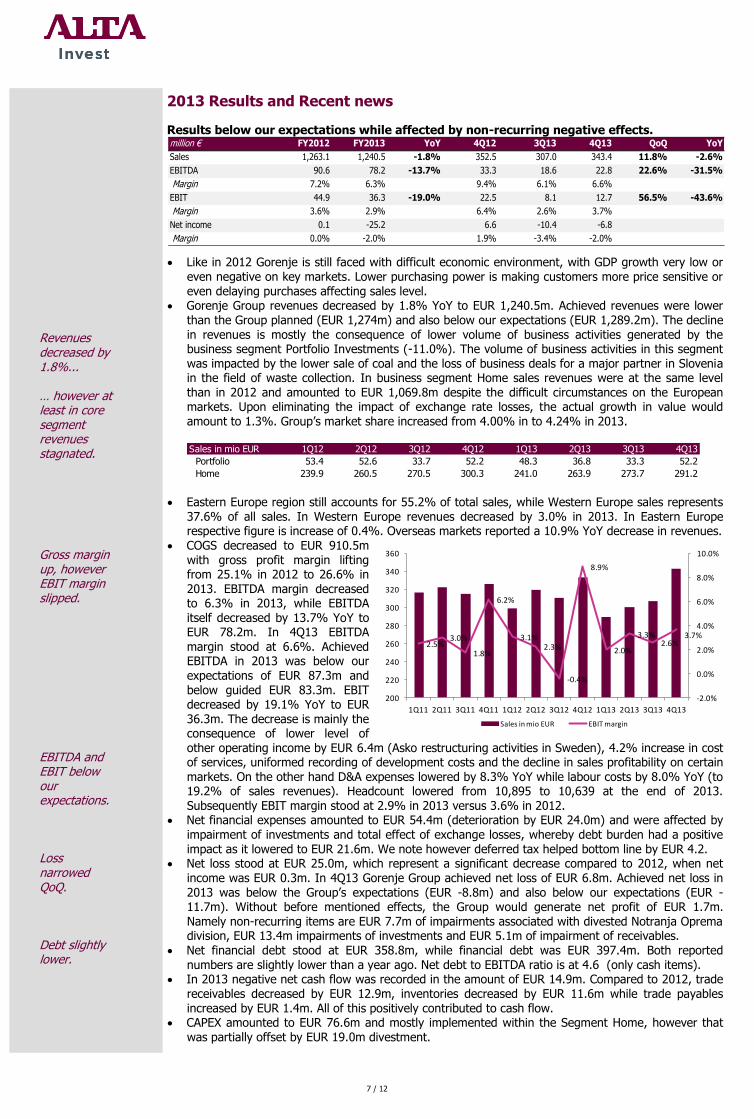
demand was unchanged compared to 2012. West European markets are saturated and overall there cannot be any growth in units (product penetrations for cookers, refrigerators and washing machines is between 90 to 100%, for dryers around 40%). Population growth in this market is also low and sales are dominated by replacement products. On the other side East European market has a growth potential, but depending on economic activity which remains rather unpredictable and weak. Here we note that Gorenje Group sales structure clearly indicates Eastern European markets have to pick up in order for sustainable turnaround of Gorenje results. Global demand for appliances increased significantly between 2008 and 2013, mainly due to strong growth in Asia. In 2013 the demand in growth markets represented 70% of the total market volume for appliances compared with 60% in 2008. Last year demand for appliances grew strongly in North America and emerging markets. The market is driven by underlying economic growth, smaller households and increased demanding for energy-efficient and resource-saving products. Market demand for core appliances in Europe is expected to be slightly positive in 2014 according to GfK. Additionally and on a positive note, growth is seen by IMF to pick up especially in Central and Eastern Europe, which should help appliance market and especially Gorenje sales.
3.8
2.00.9 0.7
2.21.7
3.2 3.0
0.4
-4.4
2.01.5
-0.6 -0.4
1.0 1.4 1.5 1.6 1.6
5.2
0.2
4.34.8
7.3
5.96.4
5.4
3.2
-3.6
4.65.4
1.42.3 2.7
3.3 3.5 3.7 3.7
2000 2002 2004 2006 2008 2010 2012 2014 2016 2018
IMF GDP Forecasts
Euro area Central and eastern Europe
Problematic situation in Ukraine: Given that the turmoil in Ukraine continues this is affecting
Gorenje’s revenues in this country. In 2013 the Group generated around EUR 54m revenues in Ukraine market (4.4% of all revenues; 5.0% in Home segment). In the first 2 months of this year sales revenues in Ukraine decreased by half compared to the same period in 2013 however a nice revenue growth was recorded in Russia. The current only problem here is Russian Rouble, but the majority (70%) is hedged. However overall exposure to Russia and Ukraine is high enough that escalation would spell trouble for management plans for 2014.
Elevated debt levels: Despite the debt decline in 2013, debt levels remain
uncomfortably high. On 31 December 2013 Gorenje’s net financial debt amounted to EUR 358.8, only EUR 20.4m less than in 2012. Indebtedness decline in 2013 was the consequence of positive cash flow in 4Q13 and the successfully completed capital increase at the end of last year. At the end of December 2013
-35
-30
-25
-20
-15
-10
-5
0
5
10
15
20
1Q08 3Q08 1Q09 3Q09 1Q10 3Q10 1Q11 3Q11 1Q12 3Q12 1Q13 3Q13
Industry shipments QoQ growth (in %)
Western Europe Eastern Europe (Turkey excluded)

6 / 12
Net debt to EBITDA ratio (including only cash) therefore stood at 4.6 which represents an increase versus previous year when it stood at 3.5. According to the company’s plan net debt to EBITDA will not exceed 3.0 in 2015. Till this is accomplished, risk is also elevated, with our valuation model showing us a very light possibility to generate FCF big enough (without drastic increase in profitability or NWC optimization) to repay a bigger chunk of debt.
Additionally in 2014 EUR 148.1m of non-current borrowings mature. The biggest share of borrowings, namely EUR 76.5m, matures in 3Q14. Although so far the company is confidant regarding refinancing, risk for investors is elevated. Here we note Gorenje is just in process of issuing commercial paper in March 2014 (9 month paper; 4.00% interest rate) in order to facilitate seasonal financing of business operations and in coherence with quarterly cash-flow dynamics. This should help the situation.
Capital injection dilution: Mostly in order to deleverage Gorenje went through capital injection
process in late 2013. However while Panasonic paid in EUR 10m into the company (which we deem positive), Gorenje attracted only 3,877,365 shares at set price EUR 4.31 out of planned 10,440,835. Existing shareholders subscribed 1,284,541 shares with total value of EUR 5.5m, employees subscribed and paid in 17,512 shares worth EUR 75,476, while new investors subscribed a total of 2,575,688 new shares, amounting to EUR 11.1m. In the first and second capital increase therefore Gorenje raised EUR 26.7m of fresh equity, thereby increasing the share capital by 38.69% and number of GRVG shares to 22,104,427. Based on August 2013 General Meeting Gorenje may also carry out a third capital increase. Gorenje’s management can offer up EUR 9.7m during 2014 at a price of EUR 4.31 per share (2,320,186 new shares) for non-cash (in-kind) contributions. Basically this is meant for possible debt to equity swap. Management is currently discussing this possibility with the interested financial institutions. While this will allow the Group to deleverage further (which we deem positive) it does lead to
dilution of existing owners. Even more importantly due to lower than projected capital increase, the debt is not lowered enough (in that respect the capital increase disappointed us). Further steps will therefore need to be taken in order to lower it, so possibilities for capital increases in the future still exist prolonging uncertainty regarding debt repayment and dilution.
Raw Materials risk: In 2012 commodity prices finally decreased while in 2013 price levels stagnated. This in turn helped gross margin as Gorenje managed to lower COGS by more than sales. Namely in 2013 costs of goods sold decreased more (-3.8% YoY) than sales revenues (-1.8% YoY) and gross profit as a consequence increased. We note the Group only partly utilizes hedging to limit the effects of the raw materials price increases as they rather use long term contracts with their suppliers. Nevertheless investors must be aware that Gorenje results is highly sensitive to commodity prices and that an environment of low GDP growth and rising commodity prices due to supply issues can be especially damaging. Therefore raw material prices will always be a crucial risk factor through manufacturing costs and logistics costs that can at least partially offset management plans to expand margins.
Continuation of impairments: In 2013 there were EUR 35m one-off negative effects tied to receivables, investments and discontinued operations. As portfolio cleaning will continue and since the regional economic situation is still adverse (although improving), some impairments in the future seem inevitable. This will affect results, but not cash flow. On the other hand management claims about 98% write-offs has been done. The Group has now about EUR 5m critical write-offs, which Gorenje monitors closely.
852
1,005 1,024
901
1,0411,105
946 911
23%
22%
23%
24%
25%
22%
25%
27%
20%
21%
22%
23%
24%
25%
26%
27%
0
200
400
600
800
1,000
1,200
2006 2007 2008 2009 2010 2011 2012 2013
COGS in EURm Gross Margin
7 / 12
2.5%3.0%
1.8%
6.2%
3.1%2.3%
-0.4%
8.9%
2.0%
3.3%2.6%
3.7%
-2.0%
0.0%
2.0%
4.0%
6.0%
8.0%
10.0%
200
220
240
260
280
300
320
340
360
1Q11 2Q11 3Q11 4Q11 1Q12 2Q12 3Q12 4Q12 1Q13 2Q13 3Q13 4Q13
Sales in mio EUR EBIT margin
2013 Results and Recent news
Results below our expectations while affected by non-recurring negative effects. million € FY2012 FY2013 YoY 4Q12 3Q13 4Q13 QoQ YoY
Sales 1,263.1 1,240.5 -1.8% 352.5 307.0 343.4 11.8% -2.6%
EBITDA 90.6 78.2 -13.7% 33.3 18.6 22.8 22.6% -31.5%
Margin 7.2% 6.3% 9.4% 6.1% 6.6%
EBIT 44.9 36.3 -19.0% 22.5 8.1 12.7 56.5% -43.6%
Margin 3.6% 2.9% 6.4% 2.6% 3.7%
Net income 0.1 -25.2 6.6 -10.4 -6.8
Margin 0.0% -2.0% 1.9% -3.4% -2.0%
Like in 2012 Gorenje is still faced with difficult economic environment, with GDP growth very low or even negative on key markets. Lower purchasing power is making customers more price sensitive or even delaying purchases affecting sales level.
Gorenje Group revenues decreased by 1.8% YoY to EUR 1,240.5m. Achieved revenues were lower than the Group planned (EUR 1,274m) and also below our expectations (EUR 1,289.2m). The decline in revenues is mostly the consequence of lower volume of business activities generated by the business segment Portfolio Investments (-11.0%). The volume of business activities in this segment was impacted by the lower sale of coal and the loss of business deals for a major partner in Slovenia in the field of waste collection. In business segment Home sales revenues were at the same level than in 2012 and amounted to EUR 1,069.8m despite the difficult circumstances on the European markets. Upon eliminating the impact of exchange rate losses, the actual growth in value would amount to 1.3%. Group’s market share increased from 4.00% in to 4.24% in 2013. Sales in mio EUR 1Q12 2Q12 3Q12 4Q12 1Q13 2Q13 3Q13 4Q13
Portfolio 53.4 52.6 33.7 52.2 48.3 36.8 33.3 52.2
Home 239.9 260.5 270.5 300.3 241.0 263.9 273.7 291.2
Eastern Europe region still accounts for 55.2% of total sales, while Western Europe sales represents 37.6% of all sales. In Western Europe revenues decreased by 3.0% in 2013. In Eastern Europe respective figure is increase of 0.4%. Overseas markets reported a 10.9% YoY decrease in revenues.
COGS decreased to EUR 910.5m with gross profit margin lifting from 25.1% in 2012 to 26.6% in 2013. EBITDA margin decreased to 6.3% in 2013, while EBITDA itself decreased by 13.7% YoY to EUR 78.2m. In 4Q13 EBITDA margin stood at 6.6%. Achieved EBITDA in 2013 was below our expectations of EUR 87.3m and below guided EUR 83.3m. EBIT decreased by 19.1% YoY to EUR 36.3m. The decrease is mainly the consequence of lower level of other operating income by EUR 6.4m (Asko restructuring activities in Sweden), 4.2% increase in cost of services, uniformed recording of development costs and the decline in sales profitability on certain markets. On the other hand D&A expenses lowered by 8.3% YoY while labour costs by 8.0% YoY (to 19.2% of sales revenues). Headcount lowered from 10,895 to 10,639 at the end of 2013. Subsequently EBIT margin stood at 2.9% in 2013 versus 3.6% in 2012.
Net financial expenses amounted to EUR 54.4m (deterioration by EUR 24.0m) and were affected by impairment of investments and total effect of exchange losses, whereby debt burden had a positive impact as it lowered to EUR 21.6m. We note however deferred tax helped bottom line by EUR 4.2.
Net loss stood at EUR 25.0m, which represent a significant decrease compared to 2012, when net income was EUR 0.3m. In 4Q13 Gorenje Group achieved net loss of EUR 6.8m. Achieved net loss in 2013 was below the Group’s expectations (EUR -8.8m) and also below our expectations (EUR -11.7m). Without before mentioned effects, the Group would generate net profit of EUR 1.7m. Namely non-recurring items are EUR 7.7m of impairments associated with divested Notranja Oprema division, EUR 13.4m impairments of investments and EUR 5.1m of impairment of receivables.
Net financial debt stood at EUR 358.8m, while financial debt was EUR 397.4m. Both reported numbers are slightly lower than a year ago. Net debt to EBITDA ratio is at 4.6 (only cash items).
In 2013 negative net cash flow was recorded in the amount of EUR 14.9m. Compared to 2012, trade receivables decreased by EUR 12.9m, inventories decreased by EUR 11.6m while trade payables increased by EUR 1.4m. All of this positively contributed to cash flow.
CAPEX amounted to EUR 76.6m and mostly implemented within the Segment Home, however that was partially offset by EUR 19.0m divestment.
Revenues decreased by 1.8%... … however at least in core segment revenues stagnated. Gross margin up, however EBIT margin slipped. EBITDA and EBIT below our expectations. Loss narrowed QoQ. Debt slightly lower.

8 / 12
Relative valuation:
EV/S EV/EBITDA EV/EBIT
Company name TTM 2014F 2015F TTM 2014F 2015F TTM 2014F 2015F
Indesit 0.7 0.7 0.6 9.0 7.4 6.8 16.0 12.8 11.6
Electrolux 0.5 0.5 0.4 7.2 5.7 5.3 13.1 9.0 8.5
Arcelik 1.0 0.8 0.7 9.2 7.2 6.5 12.5 9.3 8.4
De'Longhi 1.6 1.3 1.2 11.2 8.7 7.9 13.9 10.7 9.2
Whirlpool 0.7 0.6 0.6 6.3 5.4 4.7 8.6 7.0 n.a.
SEB SA 0.8 0.8 0.7 7.2 6.7 6.1 9.2 8.7 8.1
Amica 0.5 0.5 n.a. 6.8 6.3 n.a. 8.7 8.4 n.a.
Vestel Beyaz 0.5 0.4 0.4 7.7 5.6 5.5 16.5 8.8 11.2
Gorenje 0.34 0.3 0.3 5.3 4.6 4.2 11.5 9.6 8.3
Average 0.8 0.7 0.7 8.1 6.6 6.1 12.3 9.3 9.5
P/S P/E P/B
Company name TTM 2014F 2015F TTM 2014F 2015F TTM 2014F 2015F
Indesit 0.5 0.4 0.4 34.6 18.7 15.6 2.7 2.0 1.9
Electrolux 0.4 0.4 0.4 62.3 10.7 9.7 2.9 2.4 2.1
Arcelik 0.7 0.6 0.5 13.0 9.7 8.5 1.9 1.6 1.5
De'Longhi 1.5 1.3 1.2 21.3 15.4 12.6 3.8 2.7 2.4
Whirlpool 0.6 0.5 0.6 14.0 10.3 8.9 2.3 1.7 1.5
SEB SA 0.7 0.7 0.7 14.5 12.8 11.6 2.1 1.7 1.5
Amica 0.5 0.4 n.a. 8.6 13.0 n.a. 1.7 1.6 n.a.
Vestel Beyaz 0.3 0.2 0.2 19.2 7.5 7.8 1.1 0.9 0.8
Gorenje 0.1 0.1 0.1 neg. 12.2 9.3 0.3 0.2 0.3
Average 0.6 0.6 0.6 23.4 12.2 10.7 2.3 1.8 1.7
Company name
Indesit 7.4% 4.2% 1.2% 7.7% 1.4% 1.17 1.81 4.93 2.81
Electrolux 6.8% 3.7% 0.6% 4.7% 0.9% 1.44 4.44 5.32 1.07
Arcelik 10.5% 7.8% 5.4% 14.7% 5.2% 0.97 3.97 2.81 2.57
De'Longhi 14.1% 11.4% 7.1% 17.8% 8.3% 1.16 1.84 2.17 0.56
Whirlpool 10.6% 7.7% 4.4% 16.3% 5.3% 1.21 1.20 3.16 0.55
SEB SA 11.4% 9.0% 4.8% 14.3% 5.7% 1.18 2.20 2.53 0.88
Amica 7.7% 5.9% 5.4% 19.3% 9.4% 1.74 4.56 2.01 0.58
Vestel Beyaz 6.4% 2.9% 1.4% 5.9% 2.0% 1.37 0.00 2.97 3.28
Gorenje 6.3% 2.9% -2.0% -7.6% -2.2% 1.08 0.00 3.02 4.08
Average 9.3% 6.6% 3.8% 12.6% 4.8% 1.28 2.50 3.24 1.54
Div. yield
(%)
Assets/
Equity
Net debt to
EBITDA
EBIT margin
(%)
EBITDA
margin TTM
Assets
turnoverROA TTMROE TTM
Profit margin
(%)
ROE decomposition (company/peer average):
6.3% 9.3%
3.02 3.24
46.5% 70.3% -2.0% 3.8% -7.6% 12.6%
-2.2% 4.8%
-69.2% 57.7% 1.08 1.28
ROE
ROA
NI/EBIT Sales to assets
EBITDA margin
Assets to Equity
EBIT/EBITDA Profit margin
Peer comparison clearly shows Gorenje is lagging peers in terms of margins and therefore profitability. This lag has not decreased in recent years and this should be taken into account when comparing multiples. However P/E is highly influenced by loss from discontinued operations (at EUR 10.6m in 2013) and other impairments. Comparison of stock price movement from 2009 (in recovery period) shows an expanding gap and lag of Gorenjes shares, despite the similar nature and problems in business environment. Again lagging improvement in profitability could be a partial explanation behind this. Relative valuation based on EV/EBITDA, EV/EBIT and P/E multiples points to a target price of EUR 6.3. EV/Sales when taking into account lower operating margin (regression) points to a EUR 5.7. If previous management long term guidance (EBIT 4%) would materialize and stock valuation would follow, target price would improve to EUR 11.7 per share. This clearly shows the value driver is operating margin.
Trades at discount for top line multiples… …while bottom line multiple is negative. Still severely lagging in profitability.
Peer analysis implies a target price of EUR 6.0.
0
10
20
30
40
50
60
Jan 09 Jan 10 Jan 11 Jan 12 Jan 13 Jan 14
Stock price comparison
GRVG Peer average SBI TOP
GRVG
y = 11.023x + 0.046R² = 0.7717
0.0
0.2
0.4
0.6
0.8
1.0
1.2
1.4
1.6
1.8
0.0% 2.0% 4.0% 6.0% 8.0% 10.0% 12.0%
EV/S
ale
s
EBIT margin %
EV/Sales to margin regresion

9 / 12
Management sees a turnaround for 2014. While we agree in terms of revenue growth, we are slightly more cautious on margins. The key value driver is operating margin.
Outlook: Gorenje management stated year 2014 will be a year of improvement in profitability of operations
which will result from improved sales structure, production cost savings and cost optimizations implemented in the past. This year will also be marked by further deleveraging of the Group as the goal is to decrease gross financial debt by more than EUR 30m in order to scale down net debt/EBITDA ratio to 3.6. The Group plans to generate revenues of EUR 1,286.5m with 86.1% in Home Segment. EBITDA is planned at 93.7m, EBIT at EUR 46.4m and net income at EUR 12.1m. EBITDA margin would therefore expand to 7.2% and EBIT margin to 3.6%.
Our sales revenues estimation is based on European GDP dynamic which is forecasted to pick up as economic activity is increasing. Here we note Home Segment growth is more tied to regional GDP dynamic while Portfolio investment segment sales revenues should decrease its relevance due to divestment process. In 2014 we now see sales revenues at EUR 1,281.3m, which is just slightly below management plan and above our previous estimates due to an increase in GDP growth assumption. Main risk here is escalation in Ukraine. In 2015 to 2018 period growth should accelerate further in accordance with GDP growth.
We are slightly more pessimistic on margin forecasts compared to the Gorenje management due to their relatively weak track record (relatively constant past guidance misses) regarding margins, as we believe the competition will be more intense while cost optimization will continue to lag and also due to Ukraine crisis. We will additionally downgrade assumptions for 2014 if situation escalates and Russian sales in affected as well. We expect EBITDA margin at 7.1% in 2014 and EBIT margin at 3.4% with net profit at EUR 8.1.
Nevertheless we still believe margins has room for expansion and with appropriate action Gorenje can close the gap to peer average. By 2017 (peak) EBITDA margin is seen at 8.2% with EBIT at 4.5%. Here we note we applied proportional raise of revenues and EBIT for Panasonic deal according to management guidance of EUR 80m of additional revenues and EUR 20m of additional EBITDA by 2018. This is contributing nicely to this closing of gap to peer profitability.
CAPEX for 2014 is at EUR 73m and should decrease somewhat in the following years, while keeping in mind further investments will be needed in R&D and cost optimization.
Year 2009 2010 2011 2012 2013 2014 2015 2016 2017 2018
Sales 1,185.9 1,382.2 1,386.6 1,263.1 1,240.5 1,281.3 1,331.5 1,386.4 1,449.4 1,517.3
Sales growth 16.5% 0.3% -8.9% -1.8% 3.3% 3.9% 4.1% 4.5% 4.7%
EBITDA 68.2 108.7 92.0 90.6 78.2 91.2 100.1 105.9 108.9 124.0
EBITDA margin 5.8% 7.9% 6.6% 7.2% 6.3% 7.1% 7.5% 7.6% 7.5% 8.2%
EBIT 12.1 56.5 43.7 44.9 36.3 43.3 50.6 54.7 55.7 67.5
EBIT margin 1.0% 4.1% 3.1% 3.6% 2.9% 3.4% 3.8% 3.9% 3.8% 4.5%
EBT -9.3 13.2 11.0 5.9 -29.2 8.1 13.8 17.5 17.8 27.8
EBT margin -0.8% 1.0% 0.8% 0.5% -2.4% 0.6% 1.0% 1.3% 1.2% 1.8%
Net income -11.5 19.9 9.0 0.1 -25.2 8.1 12.7 14.5 14.8 23.1
Net income growth -55.0% -99.2% 56.9% 14.6% 1.8% 56.3%
Year 2009 2010 2011 2012 2013 2014 2015 2016 2017 2018
Fixed assets 576.1 563.4 556.3 566.1 595.8 622.6 643.6 651.2 659.6 669.2
PPE 382.8 375.4 358.8 341.2 356.6 381.4 401.1 408.6 416.8 424.6
Intangible assets 163.3 160.2 158.6 159.6 167.9 167.9 167.9 167.9 167.9 167.9
LT-investments 6.6 9.8 18.2 31.8 34.4 33.7 33.0 32.3 31.7 32.6
Other fixed assets 23.3 18.0 20.7 33.6 37.0 39.6 41.6 42.4 43.3 44.1
Current assets 604.4 755.3 695.3 631.2 554.2 563.0 571.7 579.1 588.4 613.9
Inventories 218.0 257.6 245.6 247.4 235.8 237.1 239.7 242.7 246.5 258.0
Trade receivables 251.7 306.3 255.9 218.5 205.6 212.3 214.0 215.9 218.5 228.7
Cash 27.1 82.7 101.6 53.5 38.6 39.9 41.4 43.1 45.1 47.2
ST-investments 68.2 50.1 42.3 33.7 18.9 14.5 14.2 13.9 13.6 14.0
Other current assets 39.3 58.6 49.9 78.2 55.4 59.3 62.3 63.5 64.8 66.0
Total Assets 1,180.4 1,318.8 1,251.7 1,197.3 1,150.0 1,185.6 1,215.3 1,230.4 1,248.0 1,283.1
Debt 452.2 484.9 484.1 432.7 397.4 397.4 387.4 376.4 369.4 367.4
ST-debt 209.9 224.0 181.6 155.8 198.7 198.7 193.7 188.2 184.7 183.7
LT-debt 242.4 260.9 302.5 276.9 198.8 198.8 193.8 188.3 184.8 183.8
Provisions 63.4 89.0 76.3 65.0 66.7 68.7 70.5 71.3 72.4 74.4
Trade payables 196.3 237.0 194.2 212.4 213.8 227.3 229.5 239.0 249.8 261.5
Other liabilities 97.3 115.7 99.2 95.0 88.9 91.6 93.9 95.1 96.4 99.1
Minority intrest 6.1 1.8 1.8 2.4 2.4 2.5 2.7 2.8 2.8 3.0
Equity 363.8 390.3 396.0 389.8 380.7 398.4 431.1 445.6 457.5 477.6
Year 2009 2010 2011 2012 2013 2014 2015 2016 2017 2018
Net profit margin -1.0% 1.4% 0.6% 0.0% -2.0% 0.6% 1.0% 1.0% 1.0% 1.5%
Asset turnover 1.00 1.05 1.11 1.05 1.08 1.08 1.10 1.13 1.16 1.18
ROA -1.0% 1.5% 0.7% 0.0% -2.2% 0.7% 1.0% 1.2% 1.2% 1.8%
Equity multiplier 3.24 3.38 3.16 3.07 3.02 2.98 2.82 2.76 2.73 2.69
ROE -3.2% 5.1% 2.3% 0.0% -6.6% 2.0% 2.9% 3.3% 3.2% 4.8%
CAPEX/Depreciation 55.3% 85.5% 98.2% 132.9% 182.9% 151.9% 139.7% 114.7% 115.3% 113.9%
Financial debt/Equity 1.24 1.24 1.22 1.11 1.04 1.00 0.90 0.84 0.81 0.77
Financial debt/Assets 0.38 0.37 0.39 0.36 0.35 0.34 0.32 0.31 0.30 0.29
Net debt/EBITDA 5.14 3.15 3.50 3.46 3.91 3.44 2.89 2.61 2.50 2.19
Working capital/ Sales 25.3% 29.6% 29.5% 24.3% 21.5% 20.5% 20.0% 19.0% 18.0% 18.0%
ROIC 0.0% 5.2% 4.1% 10.6% 5.3% 5.4% 5.6% 5.5% 5.6% 6.6%
all data in EURm

10 / 12
Discounted Cash Flow Valuation:
The main change from 2012 report is the Panasonic deal and only partially successful capital injection which only partially offsets dilution through lower interest payments (debt repayment). We are still calculating in an additional dilution through third round of capital increase (2,320,186 for debt to equity conversion) and an additional capital injection in the future (roughly EUR 20m) as we believe this is the only way (beside divestments) a bigger chunk of debt will be repaid in order to lower debt ratios to comfortable levels. The target price represents an increase versus previous 1H13 report, with additional share count being the key assumption that can influence the end value. Our DCF valuation calculation of EUR 6.7 assumes terminal growth rate of 1.5%, WACC of 8.5 %, EBITDA margin in 2019 to 2023 period at 8.0% while long term EBITDA margin conservatively set at 7.0%, under the current peer average and due to trends of significant price competition. Implied long term EV/EBITDA multiple is set at 5.4 which is a nice reflection of profitability weakness, which can be transformed into opportunity if right path of cost optimization and price mark-up is taken. Sensitivity analysis:
2.5% 3.0% 3.5% 4.0% 4.5% 5.0% 5.5%
7.4% 5.6 5.7 5.8 5.9 6.1 6.2 6.3
7.6% 5.8 5.9 6.1 6.2 6.3 6.5 6.6
7.8% 6.1 6.2 6.3 6.5 6.6 6.7 6.9
8.0% 6.3 6.4 6.6 6.7 6.8 7.0 7.1
8.2% 6.5 6.7 6.8 7.0 7.1 7.2 7.4
8.4% 6.8 6.9 7.1 7.2 7.4 7.5 7.7
8.6% 7.0 7.2 7.3 7.5 7.6 7.8 7.9
0.6% 0.9% 1.2% 1.5% 1.8% 2.1% 2.4%
6.4% 3.7 4.0 4.3 4.7 5.1 5.5 6.0
6.6% 4.3 4.6 5.0 5.4 5.8 6.2 6.7
6.8% 4.9 5.2 5.6 6.0 6.5 7.0 7.5
7.0% 5.5 5.9 6.3 6.7 7.2 7.7 8.3
7.2% 6.1 6.5 6.9 7.4 7.9 8.4 9.1
7.4% 6.7 7.1 7.6 8.1 8.6 9.2 9.8
7.6% 7.3 7.7 8.2 8.7 9.3 9.9 10.6
0.6% 0.9% 1.2% 1.5% 1.8% 2.1% 2.4%
7.0% 8.2 8.6 9.1 9.6 10.2 10.9 11.6
7.5% 7.3 7.7 8.1 8.5 9.0 9.5 10.1
8.0% 6.5 6.8 7.2 7.5 7.9 8.4 8.8
8.5% 5.9 6.1 6.4 6.7 7.0 7.4 7.8
9.0% 5.3 5.5 5.7 6.0 6.3 6.6 6.9
9.5% 4.8 5.0 5.2 5.4 5.6 5.8 6.1
10.0% 4.3 4.5 4.6 4.8 5.0 5.2 5.5
Perpetuity Growth
WA
CC
Sales growth 2019-2023
EB
ITD
A m
arg
in
20
19
-20
23
Perpetuity Growth
Pe
rpe
tuit
y E
BIT
DA
ma
rgin
Final target price calculation: Our valuation based on equal 50%:50% mix between peer and DCF valuation points to EUR 6.4. We again point to our regression picture of EV/Sales to EBIT margin (on page 8). This clearly shows current undervaluation, especially if management will be at least partially successful in expanding EBIT margin in following years. Therefore the crucial thing for buy recommendation justification is in assumption that management will succeed in this (although in the past the dynamic of the turnaround trailed guidance). If Gorenje continues to falter in this, the next recession will be damaging. Overall despite buy recommendation, we warn risk profile of this stock is elevated.
Year 2014 2015 2016 2017 2018 2019 2020 2021 2022 2023 TV
NOPLAT 43.3 46.3 45.4 46.2 56.1 57.1 60.1 63.2 66.3 69.5 55.0
NOPLAT growth 4.1% 6.9% -1.9% 1.8% 21.3% 1.8% 5.4% 5.1% 5.0% 4.8% -20.9%
Depreciation 47.9 49.5 51.2 53.3 56.5 57.5 58.9 60.4 62.1 63.9 64.9
Depretiation/Sales 3.7% 3.7% 3.7% 3.7% 3.7% 3.6% 3.6% 3.5% 3.5% 3.5% 3.5%
CAPEX 72.8 69.1 58.8 61.4 64.3 66.9 69.6 72.3 75.2 78.2 65.7
CAPEX/Sales 5.7% 5.2% 4.2% 4.2% 4.2% 4.2% 4.2% 4.2% 4.2% 4.2% 3.5%
Change in net working capital -4.1 3.6 -2.9 -2.6 12.2 10.9 11.3 11.8 12.3 12.7 5.0
NWC/Sales 20.5% 20.0% 19.0% 18.0% 18.0% 18.0% 18.0% 18.0% 18.0% 18.0% 18.0%
FCF to firm 22.5 23.0 40.8 40.6 36.0 36.8 38.1 39.5 40.9 42.4 49.2
FCF valuation
Value in forecasting period 227
Continuing value 310
Total enterprise value 537
Net debt 342
Equity value 194
No. of shares (in mio) 29.0
Equity value per share 6.7
WACC 2014 TV
Tax rate 0.0% 17.0%
Cost of debt 5.2% 5.2%
Beta 3.8 3.0
Cost of equity 24.1% 20.0%
Debt/Equity 338.4% 303.9%
WACC 9.5% 8.5%
Perpetuity growth rate 1.5%
DCF valuation implies a target price of EUR 6.7.
Target price is set at EUR 6.4.
11 / 12
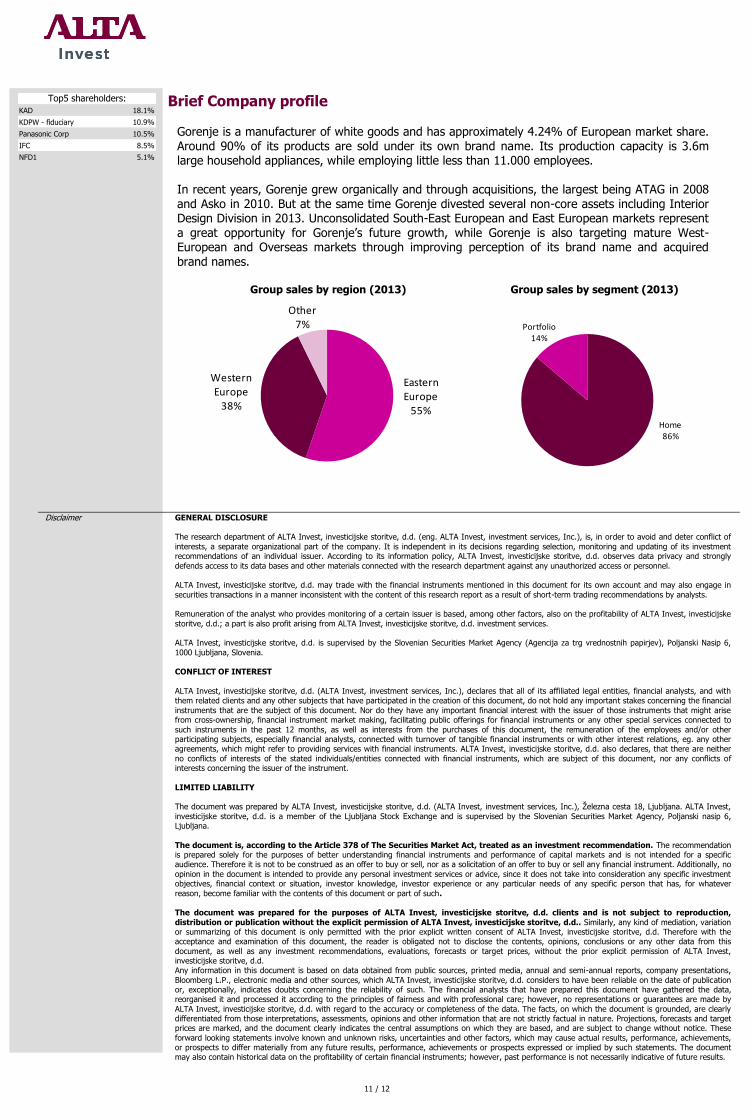
Eastern Europe
55%
Western Europe
38%
Other7%
Home 86%
Portfolio 14%
Brief Company profile Gorenje is a manufacturer of white goods and has approximately 4.24% of European market share. Around 90% of its products are sold under its own brand name. Its production capacity is 3.6m large household appliances, while employing little less than 11.000 employees. In recent years, Gorenje grew organically and through acquisitions, the largest being ATAG in 2008 and Asko in 2010. But at the same time Gorenje divested several non-core assets including Interior Design Division in 2013. Unconsolidated South-East European and East European markets represent a great opportunity for Gorenje’s future growth, while Gorenje is also targeting mature West-European and Overseas markets through improving perception of its brand name and acquired brand names.
Group sales by region (2013) Group sales by segment (2013)
Disclaimer GENERAL DISCLOSURE
The research department of ALTA Invest, investicijske storitve, d.d. (eng. ALTA Invest, investment services, Inc.), is, in order to avoid and deter conflict of
interests, a separate organizational part of the company. It is independent in its decisions regarding selection, monitoring and updating of its investment recommendations of an individual issuer. According to its information policy, ALTA Invest, investicijske storitve, d.d. observes data privacy and strongly
defends access to its data bases and other materials connected with the research department against any unauthorized access or personnel. ALTA Invest, investicijske storitve, d.d. may trade with the financial instruments mentioned in this document for its own account and may also engage in
securities transactions in a manner inconsistent with the content of this research report as a result of short-term trading recommendations by analysts. Remuneration of the analyst who provides monitoring of a certain issuer is based, among other factors, also on the profitability of ALTA Invest, investicijske
storitve, d.d.; a part is also profit arising from ALTA Invest, investicijske storitve, d.d. investment services. ALTA Invest, investicijske storitve, d.d. is supervised by the Slovenian Securities Market Agency (Agencija za trg vrednostnih papirjev), Poljanski Nasip 6,
1000 Ljubljana, Slovenia. CONFLICT OF INTEREST
ALTA Invest, investicijske storitve, d.d. (ALTA Invest, investment services, Inc.), declares that all of its affiliated legal entities, financial analysts, and with them related clients and any other subjects that have participated in the creation of this document, do not hold any important stakes concerning the financial
instruments that are the subject of this document. Nor do they have any important financial interest with the issuer of those instruments that might arise from cross-ownership, financial instrument market making, facilitating public offerings for financial instruments or any other special services connected to
such instruments in the past 12 months, as well as interests from the purchases of this document, the remuneration of the employees and/or other participating subjects, especially financial analysts, connected with turnover of tangible financial instruments or with other interest relations, eg. any other agreements, which might refer to providing services with financial instruments. ALTA Invest, investicijske storitve, d.d. also declares, that there are neither
no conflicts of interests of the stated individuals/entities connected with financial instruments, which are subject of this document, nor any conflicts of interests concerning the issuer of the instrument.
LIMITED LIABILITY The document was prepared by ALTA Invest, investicijske storitve, d.d. (ALTA Invest, investment services, Inc.), Železna cesta 18, Ljubljana. ALTA Invest,
investicijske storitve, d.d. is a member of the Ljubljana Stock Exchange and is supervised by the Slovenian Securities Market Agency, Poljanski nasip 6, Ljubljana.
The document is, according to the Article 378 of The Securities Market Act, treated as an investment recommendation. The recommendation is prepared solely for the purposes of better understanding financial instruments and performance of capital markets and is not intended for a specific audience. Therefore it is not to be construed as an offer to buy or sell, nor as a solicitation of an offer to buy or sell any financial instrument. Additionally, no
opinion in the document is intended to provide any personal investment services or advice, since it does not take into consideration any specific investment objectives, financial context or situation, investor knowledge, investor experience or any particular needs of any specific person that has, for whatever
reason, become familiar with the contents of this document or part of such. The document was prepared for the purposes of ALTA Invest, investicijske storitve, d.d. clients and is not subject to reproduction,
distribution or publication without the explicit permission of ALTA Invest, investicijske storitve, d.d.. Similarly, any kind of mediation, variation or summarizing of this document is only permitted with the prior explicit written consent of ALTA Invest, investicijske storitve, d.d. Therefore with the acceptance and examination of this document, the reader is obligated not to disclose the contents, opinions, conclusions or any other data from this
document, as well as any investment recommendations, evaluations, forecasts or target prices, without the prior explicit permission of ALTA Invest, investicijske storitve, d.d. Any information in this document is based on data obtained from public sources, printed media, annual and semi-annual reports, company presentations,
Bloomberg L.P., electronic media and other sources, which ALTA Invest, investicijske storitve, d.d. considers to have been reliable on the date of publication or, exceptionally, indicates doubts concerning the reliability of such. The financial analysts that have prepared this document have gathered the data, reorganised it and processed it according to the principles of fairness and with professional care; however, no representations or guarantees are made by
ALTA Invest, investicijske storitve, d.d. with regard to the accuracy or completeness of the data. The facts, on which the document is grounded, are clearly differentiated from those interpretations, assessments, opinions and other information that are not strictly factual in nature. Projections, forecasts and target prices are marked, and the document clearly indicates the central assumptions on which they are based, and are subject to change without notice. These
forward looking statements involve known and unknown risks, uncertainties and other factors, which may cause actual results, performance, achievements, or prospects to differ materially from any future results, performance, achievements or prospects expressed or implied by such statements. The document may also contain historical data on the profitability of certain financial instruments; however, past performance is not necessarily indicative of future results.
KAD 18.1%
KDPW - fiduciary 10.9%
Panasonic Corp 10.5%
IFC 8.5%
NFD1 5.1%
Top5 shareholders:

12 / 12
ALTA Invest, investicijske storitve, d.d. points out that any investments in financial instruments, including the financial instruments that are the subject of this document, pose certain risks. When investing in financial instruments, it is important to be aware of both systematic and unsystematic risks.
Unsystematic risk applies to certain financial instrument that are not under the influence of the entire financial market and are relatively independent of developments on those markets. The effects of unsystematic risk can be reduced or eliminated with portfolio diversification. On the other hand, systematic risk applies to factors that influence the entire financial market and therefore affect the value of an investor's portfolio. Furthermore, settlement and custodial
risk in emerging markets may be higher than in markets where there is a long-established infrastructure. Stock liquidity may be impacted by the number of market participants that may therefore impact the reliability of any investments made as a result of acting upon information contained in this document. Further, risks not discussed in this document may apply to the discussed security. Investors should always investigate the various risk aspects of any security
in any market before making an investment decision. We advise investors to contact the appropriate investment consultants or brokers to gather additional information.
The selling price of a financial instrument is usually not known in advance and can differ from the expected target price used to calculate expected gross return. Therefore, realized and expected gross returns may differ. Also, the investor must take into account that provisions, trade costs and taxes will
influence the final net return earned on the difference between the purchase and selling price of a financial instrument. The difference may be positive or negative and cannot be forecast with any certainty in advance. In addition, all investors should be aware of the possibility of failure to achieve forecasted events and valuation assumptions on which the document is based, as well as the possibilities of price fluctuation of a particular financial instrument and/or
issuer. In the case of unfavourable movements of the price of a particular financial instrument, there is the possibility of lower future value of the investment compared to the initial (purchase) value or vice versa. If a financial instrument is denominated in a currency other than the investor’s currency, a change in exchange rates may adversely affect the price or value of, or the income derived from, the financial instrument, and such investor effectively assumes this
currency risk. The reader of the document should also be aware of the significant impact of certain assumptions on predicting the target price of the issuer of the financial instrument, which is presented in the document, especially in the sensitivity analysis, as well as the fact that past performance is not necessarily an indicator of future profitability of the issuer of the financial instrument and vice versa.
ALTA Invest, investicijske storitve, d.d. accepts no responsibility for any damage or loss arising from the use of information in this document.
Target price and recommendation is set by determining the fair value of stocks, taking into account fundamental factors and news and should be understood as such. The target price and recommendation does not indicate any relative performance of the stock versus a regional or sector benchmark.
BUY: The investment rating reflects the total expected return (the difference between the current price of the stock and estimated price, expressed in %,
and the estimated dividend yield) for a potential investment in the 12-month period from the date of the initial rating, which is more than 10%. HOLD: The investment rating reflects the total expected return (the difference between the current price of the stock and est imated price, expressed in %, and the estimated dividend yield) for a potential investment in the 12-month period from the date of the initial rating, which is between 0% and 10%.
SELL: The investment rating reflects the total expected return (the difference between the current price of the stock and estimated price, expressed in %, and the estimated dividend yield) for a potential investment in the 12-month period from the date of the initial rating, which is lower than 10%. NO RECCOMMENDATION / EVALUATION: No recommendation can be given on the basis of the data available.
In the period between 01.01.2013 and 31.12.2013 the structure of all investment research was:
Number Share Share of issuers, for which ALTA Invest, investicijske storitve, d.d., has provided
investment services regarding financial instruments in last 12 months
Buy 34 50% 24%
Hold 14 21% 3%
Sell 20 29% 9%
Recommendations issued by ALTA Invest, investicijske storitve, d.d. Železna cesta 18, 1000 Ljubljana, are valid for 12 months, except in case of previous
update of the recommendation. However, ALTA Invest, investicijske storitve, d.d. is not engaged in periodical updating of the recommendations of the issuer under consideration as well as is not obliged to notify readers about any kind of valuation, opinion or forecast changes, which have arisen from the occurrences after the recommendation release. When dealing with its customers, ALTA Invest, investicijske storitve, d.d. is not obliged to act in accordance
with opinions and assessments expressed in investment recommendations. Financial analysts responsible for the preparation of the document and other individuals that are familiar with the content of the document have not engaged
in any personal transactions or trade with the financial instruments that are the subject of the document nor have they been connected with the financial instruments during the preparation period of the document, up to and including one day after its publication.
SPECIFIC DISCLOSURES ALTA Invest, investicijske storitve, d.d. Železna cesta 18, 1000 Ljubljana, Slovenia, and the financial analyst responsible for monitoring the issuer under
consideration, guarantee that this document has not been disclosed to the issuer of the financial instrument before its public release.
ALTA Invest, investicijske storitve, d.d. and its related legal entities can own shares of the issuer under consideration. A financial analyst responsible for monitoring of the issuer under consideration does not have any significant financial interests concerning the financial instrument. They also do not have any conflict of interest concerning the issuer under consideration.
ALTA Invest, investicijske storitve, d.d. and/or its related legal entities has performed services concerning financial instruments to the issuer under consideration herein within the past 12 months. It is providing investment relationship services (webcasts etc.) to the
company. ALTA Invest, investicijske storitve, d.d. and related entities may hold securities of the issuer in question herein.
STATEMENT OF FINANCIAL ANALYST
ALTA Invest, investicijske storitve, d.d. (eng. ALTA Invest, investment services, Inc.), and the undersigned financial analysts, responsible for the monitoring of the issuer under consideration, declare that they have not received any kind of compensation that could affect the formulation of this document or opinions expressed in this document. The recommendation has not been disclosed to anyone before it was publicly released.
Tina Orzan, Analyst. On the day of the public release, the author of the recommendation did not held securities of the relevant issuer.
Sašo Stanovnik, Head of research. On the day of the public release, the author of the recommendation held securities of the relevant issuer.
First release of the recommendation was performed on 13.04.2010. Quarterly updates are planned for data, valuation, target price and recommendation.
OTHER INFORMATION
Other information about the services of ALTA Invest, investicijske storitve, d.d. and financial instruments, including general conditions for the provision of services, price lists and other disclosures and information can be found at http://www.alta.si/, http://www.alta.si/Organizacija_skupine/Ceniki_pogoji_in_akti and http://www.alta.si/Osnove_trgovanja/Razlaga_financnih_instrumentov.
ALTA Invest, investicijske storitve, d.d., Železna cesta 18, SI-1000 Ljubljana. Registered at the District Court of Ljubljana, Registration Number: 3710432000, ID for DDV: SI89931181, Share capital: 2,031,803.00 EUR.
The distribution and/or content of this document in other jurisdictions may be restricted or differently regulated by law, and the reader should inform himself regarding any such restrictions. By accepting this document, the reader consents to be bound by the foregoing
instructions.