
43rd CONGRESS OF THE EUROPEAN REGIONAL SCIENCE ASSOCIATION
31
43rd CONGRESS OF THE EUROPEAN REGIONAL SCIENCE ASSOCIATION (ERSA) Jyväskylä, Finland, August 27-30, 2003 CENTRE–PERIPHERY MODEL EXPLAINING THE REGIONAL DEVELOPMENT OF THE INFORMATIONAL AND TRANSITIONAL SOCIETY Garri Raagmaa University of Tartu Pärnu College Ringi 35, 80010, Pärnu, ESTONIA Fax +372 44 50530; Tel. +372 44 50520 GSM: +372 52 78899; e-mail: [email protected] Abstract This discussion paper analyses regional development of Estonia and uses a centre- periphery model (CPM) as analytical framework. The aim of the paper is to prepare and test a planned study based on the more detailed population and labour market survey data as well as enterprise development data of the transition period in the 1990s. The CPM assumed the continuity of industrial society and became less relevant today. Firstly, therefore, this paper analyses concentration-deconcentration factors of the informational society and tries to combine the classical approach with new conditions. Secondly, the paper sets a hypothesis arguing that Estonia followed rather different spatial development stages, because of the external (political) factors influencing smooth development path. If even the spatial development seems to be very similar to what happened in the Western countries the reasons behind the spatial change may have been sometimes entirely different. Thirdly, as the Eastern European countries are still industrial their of spatial development can be traced back to the past Western countries development. Hypothetically, according to the CPM, the deconcentration processes should intensify in Estonia. The empirical part analyses the regional development of Estonia in the historical perspective. The discussion is supported by population data of censuses and other empirical materials. Finally, we attempt to design a comparison of different urban development stages in the UK, Finland and Estonia. Key words: centre-periphery model, settlement development stages, external factors in spatial development
Transcript of 43rd CONGRESS OF THE EUROPEAN REGIONAL SCIENCE ASSOCIATION

43rd CONGRESS OF THE EUROPEAN REGIONAL SCIENCE ASSOCIATION
(ERSA) Jyväskylä, Finland, August 27-30, 2003
CENTRE–PERIPHERY MODEL EXPLAINING THE REGIONAL
DEVELOPMENT OF THE INFORMATIONAL AND TRANSITIONAL
SOCIETY
Garri Raagmaa
University of Tartu Pärnu College
Ringi 35, 80010, Pärnu, ESTONIA
Fax +372 44 50530; Tel. +372 44 50520
GSM: +372 52 78899; e-mail: [email protected]
Abstract This discussion paper analyses regional development of Estonia and uses a centre-periphery model (CPM) as analytical framework. The aim of the paper is to prepare and test a planned study based on the more detailed population and labour market survey data as well as enterprise development data of the transition period in the 1990s. The CPM assumed the continuity of industrial society and became less relevant today. Firstly, therefore, this paper analyses concentration-deconcentration factors of the informational society and tries to combine the classical approach with new conditions. Secondly, the paper sets a hypothesis arguing that Estonia followed rather different spatial development stages, because of the external (political) factors influencing smooth development path. If even the spatial development seems to be very similar to what happened in the Western countries the reasons behind the spatial change may have been sometimes entirely different. Thirdly, as the Eastern European countries are still industrial their of spatial development can be traced back to the past Western countries development. Hypothetically, according to the CPM, the deconcentration processes should intensify in Estonia. The empirical part analyses the regional development of Estonia in the historical perspective. The discussion is supported by population data of censuses and other empirical materials. Finally, we attempt to design a comparison of different urban development stages in the UK, Finland and Estonia. Key words: centre-periphery model, settlement development stages, external factors in spatial development

2
1. Introduction
This paper analyses regional development of Estonia and uses centre-periphery1 models
(CPM) of Friedmann, Gibbs and Hautamäki as a base for theoretical discussion and
analytical framework. The aim of the paper is to prepare and test an extensive study
based on the more detailed census data and labour market survey as well as enterprise
development data of the transition period in the 1990s.
In general, these models foresee stabilisation and deconcentration population and
economic agents after the concentration stages. The post-war spatial processes and
deconcentration of the 1970s and 1980s were fairly well described by the CPM.
However, the 1990s turned to a new concentration in a number of countries. The CPM
that assumed the continuity of industrial society and relevant factors, both negative and
positive for concentration, influencing regional structures and settlement, became less
relevant. Therefore, the third chapter in this paper analyses concentration-
deconcentration factors of the informational society and tries to plant the classical
approach into the new soil.
Secondly, we set a hypothesis arguing that the Baltic Countries, Estonia in this case,
have followed different spatial development stages with Western countries. The level of
economic development and the amount of capital in circulation is considerably smaller
in the Eastern economies. When the Western economies enjoyed economic and political
stability after the World War II, regional development of their Eastern counterparts was
influenced by several political convulsions. Therefore, similar results in population and
settlement structure development may have rather different causes in the Eastern-
Europe.
For example, in Estonia, (1) the economy and population were relatively de-
concentrating in the 1980s and (2) rapidly concentrating during the mid 1990s. At the
first sight, on the basis of population statistics, this seems to be quite similar to what
1 Terms “centre” and “core” are used as synonyms in the sense of a national (or regional) capital city which operates as a functional (service) and administrative (political) centre and forms a core area of

3
happened in the Western countries. However, after a deeper look at the processes we see
that the driving forces have been entirely different.
The Eastern European countries are still industrial as to their economic structure, just
recently moving from labour intensive production towards capital intensive
manufacturing which means that driving forces and models of settlement development
can be traced back to the Western countries development of the 1970-1980s.
Hypothetically, according to the CPM, the deconcentration processes should intensify in
Estonia. True, we must consider that the transition processes from industrial and to
informational societies will take place simultaneously and at a higher speed.
The empirical part analyses the regional development of Estonia in the historical
perspective. The description of the past developments attempts to outline (1) influential
causal factors, (2) periods of concentration and deconcentration, and (3) particularities
compared with the Western countries. The discussion is mainly supported by population
data of censuses, but it also uses other empirical materials such as small case studies,
interviews and observations.
Finally, we attempt to design a comparison of different urban development stages in the
UK, Finland and Estonia.
2. Friedmann’s core-periphery model, models of Gibbs and Hautamäki and the
synthesis
John Friedmann (1966) developed the core-periphery model studying differences
between regions and the development policy of Venezuela. He differs four stages of
development in economic space:
I) The pre-industrial (agricultural) society, with localised economies, in
which settlement structure consisting of small units remains dispersed and
whose economic subjects (population and merchandise) have low mobility.
II) The concentration of the economy from periphery to the core begins as a
result of capital accumulation and industrial growth. The interregional
capital investments and economic concentration.

4
mobility of labour and intensity of trade rises enormously. However, the
labour force daily space remains local, as the personal mobility of people
remains limited. The periphery is totally subordinated to the centre of
political and economic dominance. The industries producing the highest
extra-value are located in the core area.
Periphery Core
Core
Periphery
Periphery Core
Periphery Core
I)
II)
III)
IV)
Figure 1. Friedmann’s (1966) Core -Periphery Model.
III) Economic growth spreads across the country and causes other growth
centres to appear. The main reasons for deconcentration are the lack of
labour force and rocketing prices in the core area. A similar effect has been
described in the 1950`s by Perroux (1955) – “growth poles”, Myrdal (1957)
– “spread” effect and by Hirshmann (1958) – “trickle down” effect. These
theories have influenced European regional policy in the 1960s and 1970s.
Furthermore, the deconcentration of economic units and population (living
estates) took also place within the metropolitan areas: intensity of people’s
personal daily mobility and distances between workplace and home increase.
However, the growth of the metropolitan region proceeds and the remote
periphery continues to decline.
5
I II III IV V
+5%
Towns City
Small towns
Country
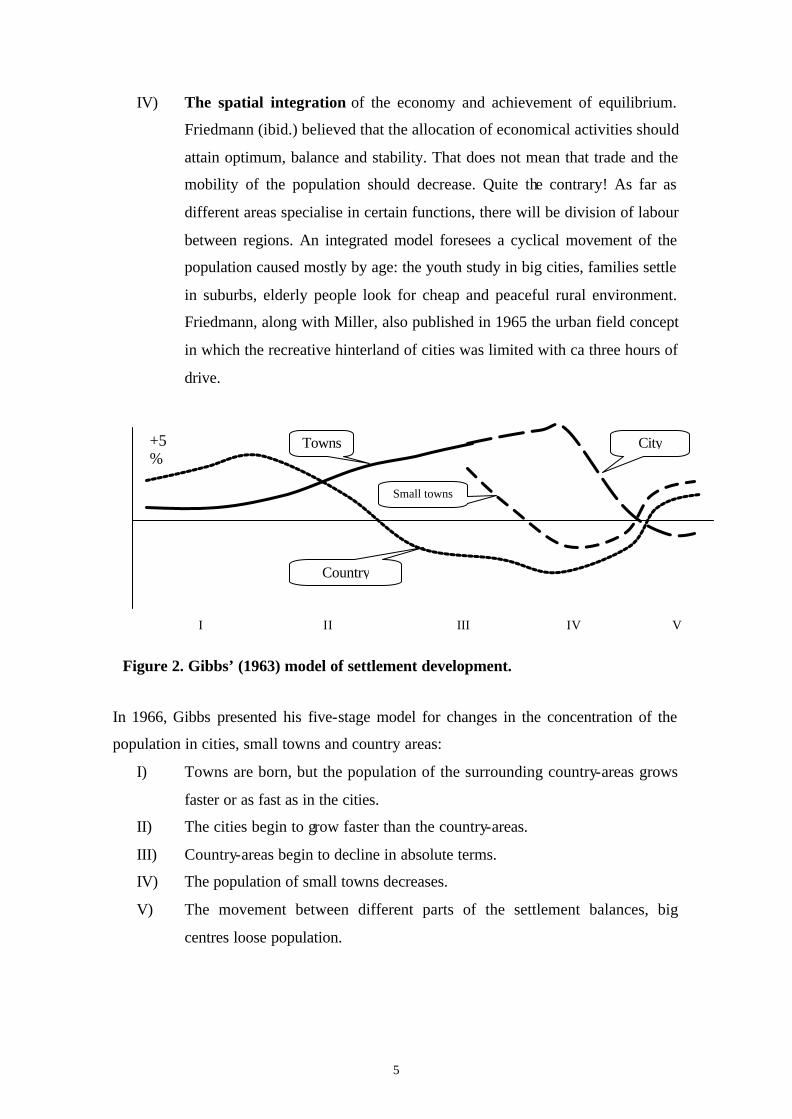
Figure 2. Gibbs’ (1963) model of settlement development.
IV) The spatial integration of the economy and achievement of equilibrium.
Friedmann (ibid.) believed that the allocation of economical activities should
attain optimum, balance and stability. That does not mean that trade and the
mobility of the population should decrease. Quite the contrary! As far as
different areas specialise in certain functions, there will be division of labour
between regions. An integrated model foresees a cyclical movement of the
population caused mostly by age: the youth study in big cities, families settle
in suburbs, elderly people look for cheap and peaceful rural environment.
Friedmann, along with Miller, also published in 1965 the urban field concept
in which the recreative hinterland of cities was limited with ca three hours of
drive.
In 1966, Gibbs presented his five-stage model for changes in the concentration of the
population in cities, small towns and country areas:
I) Towns are born, but the population of the surrounding country-areas grows
faster or as fast as in the cities.
II) The cities begin to grow faster than the country-areas.
III) Country-areas begin to decline in absolute terms.
IV) The population of small towns decreases.
V) The movement between different parts of the settlement balances, big
centres loose population.

6
Figure 3. Hautamäki (1982) Finnish centre periphery model.
I +
-
III +
-
V +
-
IV +
-
II +
-
Finland, for example, reached the third stage in which urbanization was very intense
and the population of country-areas started to decrease, only in the late 1960s. In the
1980s, the communities surrounding major cities started to grow – city regions (seutu-
alue) were formed and the big cities themselves started to decline (Kultalahti 1990, 94).
Lauri Hautamäki (1982, 152; cited by Kultalahti 1990, 61) presented Finland’s five-
stage model as the following:
I) Settlement is forming, towns are small, peripheries grow;
II) Settlement is spreading, urbanization begins;
III) The population grows only in centres;
IV) Growth in centres stops and the
population spreads to the city
regions;
V) Similar to the first stage, the
growth of peripheries is more rapid
due counter-urbanization.
The final stage was more like wishful thinking
because Finland has never reached the de-
urbanization stage yet. The areas of Helsinki
and other major cities have been growing
continuously (Kultalahti 1990, 94-95).
In summary of what we have learned, we can
design a complex centre-periphery model. The
model divides the settlement into four groups:
1) A big centre,
2) Regional centres,
3) Towns and
4) Rural areas.
The semi-bold line characterizes the change of
the population in country-areas – the
migratory movement. A five-stage model
forms.

Figure 4. Synthesised centre -periphery model by (Gibbs (1963), Friedmann (1966) and Hautamäki (1982, cf. Kultalahti 1990)).
0 Starting stage – diffused agrarian society
+ relative growth
_ relative decline
Stage I – local urbanization
Centre
Periphery
+ relative growth
_ relative decline
Stage IV - massive urban sprawl, decline of the main centre, growth of the regional city-regions
Stage III - suburbanization and new towns, growing regional centres
Stage V - counter-urbanization, decline of the whole metropolitan area as well as regional centres – population growth in rural areas and small towns
Stage II - core-urbanization
Centre
+ relative growth
_ relative decline
Centre
Periphery
+ relative growth
_ relative decline
Centre
Periphery
+ relative growth
_ relative decline
Centre
Periphery
+ relative growth
_ relative decline
Centre
Periphery

0 The starting period. There is no significant polarization in the economy and
people’s mobility. The population grows steadily, towns are small.
I First stage. Local urbanization begins with capitalism and industry developed. The
economic power and the significance of the capital city grows modestly. Centres grow
on the account of nearby population and capital. The population of peripheries grows
continually because of taking new lands into use. The growth of country-areas on the
whole continues. Cities and other settlements are compact and the mobility of people
remains low: the barracks for workers are built right next to mines and factories. The
industrialization began in England in the 18th century but in the Baltic countries about
100 years later.
II Core-urbanization. The main centre grows rapidly during the second stage. People
move from the country to the city – the hinterland for the core-city is formed. Core-
urbanization in concept accentuates the rapid growth of a metropolitan. Spreading of
agricultural settlements in the peripheries still continues (colonization and melioration)
because agriculture remains the main economic branch and employer.
III. Sub-urbanization and new towns. The nearby areas of the centre – suburbs grow,
spreading across the borders of the city. Thanks to the growing mobility of people
(railways, later cars) urban sprawl begins as well as planning of new suburbs and towns
which are connected to the city core with public transportation. After the central city,
the regional service and industrial centres start to grow.
IV Urban sprawl is accompanied by the massive use of cars, which allows the
thickening of the agglomeration space. Extensive territories near the cities form densely
built- in residential areas, cities in their turn merge with each other, forming
megalopolises. At the same time, the cores are jammed with cars. The core-city declines
due to agglomeration problems (high cost of living, traffic jams, pollution and high
crime rates).
V Counter-urbanization. In the final stage, the cities and entire central city regions
stop growing. Several far-away rural locations recover from previous decline – urban
people and enterprises move out from the jammed urban areas and apply urban lifestyle

9
in a scenic environment. New production, service and residential areas grow near
airports and highways. Such complex-planned edge-cities that provided superb
environment and good services, including security, grew in the US in the 1980s -1990s
(Hall, 1998, 162).
The counter-urbanization in the 1980s was caused by four factors:
1) The aging of the population (older citizens left their careers and moved to a
more peaceful environment);
2) Unemployment, social problems and high crime rates as a result of de-
industrialization (Hall 1998, 31-34);
3) High real estate prices of metropolitan areas (price of land was less expensive in
the remote country-areas) and the development of highways and other high-
speed transportation (high-speed trains) made distant locations easy to access
easily accessible.
4) Unpleasant physical environment in (Anglo-American) city centres: poorly
planned, ugly, unfriendly for pedestrians and bad and expensive services
because of the dominant bureaus and extremely high real estate prices. The city
centres turned into wastelands after “calling it a night” (Hall, 1998). The city
politicians of the 1980s began to improve the situation by using new
architecture, art and by helping culture life. Thanks to them, many city centres
reached new growth in the 1990s (Jauhiainen 1995, Hall 1998, 65-74).
3. Critics about the centre -periphery model and new input
Friedman’s, Gibbs’s and Hautamäki’s models became stuck in industrial society’s
economic models and environmental static: they presumed that the economical structure
stabilizes and that the environmental problems of the rapidly growing cities would be
continually insurmountable. Also, the CPM originated from rational arguments and the
interests of production. They ignored people’s personal needs and cultural factors
Friedmann’s (1966) CPM was criticized ever since it was created. Brenner (1977)
claimed that the centralization of power cannot cause the centralization of economy. He
also said that the given approach would not sufficiently describe interregional division
of labour, distribution of wealth and goods.
10
Storper and Walker (1989, 183) point out the importance of historic legacy and layers of
investment, which create a specific milieu for a region. Because of that, many
development paths are excluded and a path-dependency is formed: the development of a
region is rather evolutionary, based on the social networks and cultural values.
Even if some forms of enterprise are diffusing in the space, it does not mean that the
same goes for applies to power. If a community of entrepreneurs (the economic power)
who normally have the political power as well has settled in a region (created
structures), they will probably not leave the region. This means that although the form
changes, the concentration of economy still remains the same. For example, previous
manufacturing industries can be replaced with business services, which rather
centralises the power.
However, new investments can alter the power balances significantly. Doreen Massey
(1984) compared the local economic structure with a pie that has layers. Over the years
the pie acquires new layers and thus changes the character and size of the local
economy. Depending on the activities of the regional enterprises, investments intensify
or reduce expand or contract. Investments, e.g. into an old industry, may often result in
an obstruction for new developments. Peter Hall (1988) has said: “the new industry will
not go into the industrial areas of yesterday”. The problem lies not in the old industrial
buildings but in the polluted environment, in the social and labour force problems.
So, the economy is changing and the people of the information society are influenced by
rather different factors. The economic and political factors of the information society
have helped the centre regions to grow again. This is particularly visible in the global
financial centres which are going through undergoing a new growth stage.
3.1. Economic and political factors
The formation of a settlement structure on a centre-periphery line is influenced by
several new factors which emerged during the informational era.
Tertiarization and globalisation, especially the growth of the business services and
media lead on to the centralization of economic power in the international cores and the

11
decrease of manufacturing and the primary sector employment in peripheral areas of the
developed countries.
Innovative production which runs entirely new economies and also supplies traditional
industries and services with inventions is centred in the big metropolitan areas,
“superbrains”. Short life cycles of the high-tech products create the necessity for
geographical closeness – lack of time and tense competition are reasons why companies
cannot leave the path dependency to a new location because they would lose their
ability to compete. The high- tech production left the city-centre earlier. They who?
moved to areas near the city, to the clusters that formed around universities like Silicon
Valley (Stanford, San Francisco) and Route 128 (MIT, Boston) in the USA or
Cambridge and Oxford Universities close to London (Castells 1996).
On the other hand, cultural and recreational economies, the world’s most rapidly growing
branches in general prefer areas that are not damaged by former agricultural or industrial
legacy. The number of population and jobs has grown in the Western European and
American (US?) inviolate scenic areas.
Agglomeration problems such as traffic jams, high crime rates and rise in prices are still
burning issues for metropolitan areas. The production continues to move into the better
accessible areas near highways, airports, harbours, for example along the M4 highway
corridor West of London (Temple 1994, 145), sometimes pretty far away from centre-
cities like the so-called Trans-plant Corridor in Tennessee, US (Dicken 1998). The
metropolitan space expands (Issermann 2001, 41-45) and densifies (Hall 1998, 102-3).
On the other hand, active intervention of city authorities in the 1980s – 1990s:
renovation of city centres, bringing back services and improving the environment
(Jauhiainen 1995, 46-53) has improved the image of inner cities and caused, combined
with new city-service-workshops and new yuppie-cultural re-urbanization,
gentrification.
3.2. Technology
According to Kondratieff’s (Kondratieff 1935) theory, the capitalistic society has an
integrated engine generating new development by short- and long-term crises. The basis

12
for Kondratieff’s long-term waves are changes in technology, the so-called super-
innovations, rearranging the whole development of society (Shumpeter 1934). Different
forms of production dominate in different countries and regions at different times. For
example, in Great Britain, the areas of Lancashire, Shropshire and Black Country grew
during the first cycle, South-Wales and North-East during the second cycle, Midlands
and Greater London during the third and the fourth cycle.
However, big centres have managed to maintain their positions in technological
development. They are not only industrial, but first of all political, financial,
commercial, educational, and cultural centres where most of the new technologies and
innovations are born. IT technologies make it easy to control production from centres,
even increase the formation of branch plant economies Temple 1994).
On the other hand, growing mobility and information technology (IT) appliances make
the dispersion and mobility of many workplaces possible. In new terms, many distant
areas have the possibility to develop, thanks to their value as residential environment.
3.3. Cultural-lifestyle factors
Cultural- lifestyle factors alter centre-periphery relations also in two ways. First, the
human genome has formed in nature. Homo sapiens, feeling the connection with nature,
desires back to his natural environment. This factor has obviously created the demand
for recreational economy outside centres and artificial environments.
Secondly, the cultural legacy. Soja (1996) sets Los Angeles as an example of the post-
modern metropolis with active ongoing segregation, based on cultural identities
(nationality, language, race). Every identity group in this global metropolis is trying to
create their own environment. When the urban culture has formed, people’s tolerance
towards artificial environment is also higher and that may benefit urban growth
development, especially if there is a similar cultural environment.
A cultural factor by itself is also fashion, group madness, preferring certain particular
lifestyle types, depending on the behaviour of the elite. That alters the taste of the major
part of the population. For example, the American lifestyle “standard” includes a private
house which continuously spreads the US metropolitan population.
13
3.4. Synthesis
The previous attempt to analyse new factors influencing concentration-deconcentration
processes of the informational society on the centre-periphery axis did not give us a
clear-cut answer about the futures. There are factors both fostering and retarding
concentration and their combinations with each other and historical developments will
make the model even more complicated than in the 1950s when the CPM was
developed. Still, a number of messages can be found in this discussion.
Firstly, every new technological breakthrough benefits concentration because of high
risk in the field of new economic activities and demand for high capital available only
in the core areas. After a while, new technologies and economies will spread all over the
space looking for cheaper input factors and most favourable locations. Thus, these
relatively short cyclical changes in economic concentration can also be foreseen
expected in the future. These cycles evidently fit Kondratieff’s long waves theory.
However, new branches will probably benefit rather different fringe areas.
Secondly, new technologies increasing labour productivity with automation are
changing the basis of the society. The physical and especially virtual mobility of people
and goods will be increasing. There will be less physical work to do than now, the rate
of symbol analysts having mental (technological information) jobs and also people
employed in art industry, as well as all service sector will have increased. This means
on the one hand even higher concentration of economy, but on the other, highly
qualified workers who will choose more precisely their living environment, may live
rather far from their workplace and that way promote more remote areas.
Thirdly, cultural factors also seem to have much higher importance in informational
society settlement structure development. The key word is diversity which increases as
a result of immigration of different nationalities, but also because of massive creation of
new identity and lifestyles due to the “brainwash” in the media. Changing national
composition of different regions will produce hardly predictable patterns. Therefore,
national and professional composition should be considered as important factors in
predicting spatial behaviour of the population.

14
Consequently, different forms of production and relevant spatial structures dominate in
different countries and regions at different times. The problem of the classical CPM
stems from the continuous and accelerating changes in economy: new leading branches
choose new areas to expand and the equilibrium will never be achieved. Empirical
studies to be carried out in the Western countries and particularly in the US will show
rather soon whether the informational society continues to concentrate to the urban
cores or turns to a new cycle of deconcentration. The CPM can be used after the
modification as a descriptive tool.
Table 1. The conclusion of new informational society factors influencing
concentration-deconcentration processes on the centre -periphery axis.
Concentration + /
Deconcentration -
New/old factor
Economic and political factors
tertiarisation and globalisation + new
innovative production + new
renovation of city centres - new
agglomeration problems - - old
rise of recreational economies - new
Technology
easy to control production remotely + new
growing mobility of people - new (ICT & high-
speed trains) / old (car)
IT and web-based jobs - new
Cultural-lifestyle factors
demand for recreation - - new
spreading city culture + old
fashion +/- old
On the other hand, the CPM can be used to forecast new spatial development patterns in
the Eastern European countries, whose economic and consequently spatial development
is lagging behind. The presumable “after-development” of the Estonian economic and
settlement structure is therefore an object of this study. Well, we must definitely be
aware of the considerably smaller number of Estonian and its capital city population,

15
which make only about one tenth of the European largest metropolitan areas, and lower
densities.
4. Estonian development in the framework of the CPM
The chapter analyses the development of Estonian settlements in the framework of the
CPM.
4.1. Earlier applications of the CPM in Estonia
One can say that Estonia has not been analysed in the framework of the CPM so far.
Walter Christallers (1933) central place theory has been applied quite intensively,
focusing on the studies of the hierarchy of settlement structure and the relations between
settlements themselves (Kant 1935, Nõmmik 1979; Nõmmik and Mereste 1984, 200-
211, 219-226).
The pioneer of research Estonia‘s centre-periphery relations is without a question
professor Edgar Kant, who did that exhaustively in his doctoral research (Kant 1933)
and its German language monograph published in 1935 (Kant 1935).
Later, the school of professor Salme Nõmmik focussed on the so-called “social-
economic space systems” (sotsiaalmajanduslik ruumsüstem) and studied mainly the
location of industries and spatial disproportions between the existing settlement
structure and new economic development (Nõmmik 1981, 89-91). They pointed out the
necessity to locate production equally on the territory in order to make better use of
local resources (Tarmisto 1960, 192; Tarmisto 1975, 276), importance to develop small
towns (Ehrlich 1977, 208-13) and diverse planning of production and residential areas
(Tarmisto 1978, 122-7). They also pointed out differences between service quality in
cities and country areas (Mäeltsemees 1981, 138-140).
The statement of the school leader: “…villages lacking economic functions will decline
inevitably” (Nõmmik 1976, 151-2) based on the empirical proof of the industrial era
seems to be incorrect today when the growing mobility of people increases distances
between working and living places and when people are highly selective choosing their
living environment.

16
4.2. Early industrialization
The development of Estonia as an agrarian society had no special regional differences.
There were no big cities. The county centres – the network of fortress cities developed
in the 10th - 11th century and was fixed in the 14th – 15th century by building cities of
stone.
CPM stages I and II: The first industrial revolution from 1860 to 1915
Stages I and II of the CPM appeared almost simultaneously at the beginning of the
industrial revolution in the 19th century. The abolition of serfdom in Baltic Provinces at the
beginning of the 19th century caused the biggest change. Wealthy farms created the
demand for local town services and industrial enterprisers. Small towns appeared and grew
explosively in Upper Estonia in the last decade of the 19th century.
Textile, engineering, shipbuilding and other industries were also developing fast due to the
trade with Russia and favourable ice-free ports in the middle of the 19th century. Core-
urbanization began in Tallinn and other industrial cities in Northern Estonia. The
population of Tallinn for instance doubled from 58000 to 116000 during 1897-1913.
CPM I: The period of agrarian development from 1918 to 1933
In the 1920s, Estonia returned to the first stage of the CPM. Mostly the local centres of
Upper Estonia were expanding: small towns and boroughs whose development based on
supplying the agricultural producers of close hinterland with goods and machinery and
processing the agricultural products for export.
The growth was slow when compared to the growth at the turn of the century. However,
the citizens of boroughs who used to work in agriculture specialised in service- industry
(Raagmaa et al. 2002). The population grew also thanks to the land reform and
colonization in the most remote peripheries.
CPM II, III: The new industrial growth and the first appearance of sub-urbanization
1934-1940
17
In the middle of the 1930s the development of capital- intensive industries in North
Estonia began on the basis of oil shale, timber and phosphorites and in Tallinn port
industry. The resort towns in Western Estonia restored their position.
A phenomenon in itself was the building of Nõmme garden city in the middle of 1920s
near Tallinn (now a part of the city), which was a sign of western type sub-urbanization.
Two-thirds of the citizens of Nõmme worked in Tallinn in 1930s.
4.3. Socialist fordism – an industrialization based on external resources
The Soviet industrial policy was without a doubt the most important player in the
history of Estonian regional development. There was no industrial society in Estonia
before 1940s. The Soviet Union started using Estonia’s natural resources and labour
force after World War II and practised a mass production model, which can easily be
called “the socialist fordism” (see Amin, 1994)
Another important factor for regional development was direct administrative
interference. Investments were made centrally under the control of the communist party
headquarters and particular ministries. Administrative reforms influenced tremendously
the development of settlements: abolished self-governments and changed first and
second tier administrative borders several times.
CPM I, II: The period of small districts – the 1950s.
In the 1950s urbanization was caused by collectivisation and bad living conditions of
the rural population. But at the beginning the urbanization was local. The 39 districts,
formed in 1950, importantly strengthened small centres – local urbanization continued
as before the war. After a number of small districts merged by 1960s, these centres start
to decline. The development of the rural areas (e.g. supply with services) depended on
the activity of the county (rajoon) communist party leaders and on the activity of
collective farms (kolhoos). At the same time, large cities were growing too, a number of
large factories were (re)established.
18
A
Max: 171% Min: 91% Frequencies: 1 - 4 2 - 3 3 - 3 4 - 3 5 - 3
95 101 110 140
1 2 3 4 5
B Max: 123% Min: 92% Frequencies: 1 - 3 2 - 4 3 - 4 4 - 2 5 - 3
98 102 105 110
1 2 3 4 5
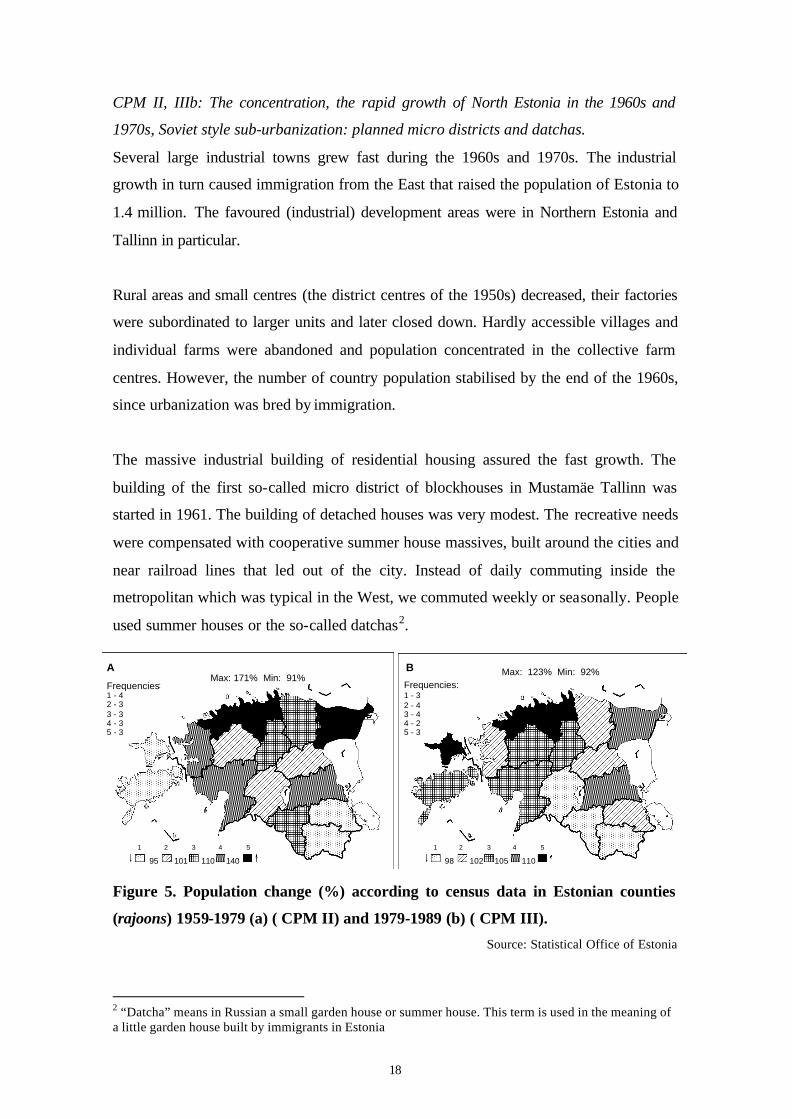
CPM II, IIIb: The concentration, the rapid growth of North Estonia in the 1960s and
1970s, Soviet style sub-urbanization: planned micro districts and datchas.
Several large industrial towns grew fast during the 1960s and 1970s. The industrial
growth in turn caused immigration from the East that raised the population of Estonia to
1.4 million. The favoured (industrial) development areas were in Northern Estonia and
Tallinn in particular.
Rural areas and small centres (the district centres of the 1950s) decreased, their factories
were subordinated to larger units and later closed down. Hardly accessible villages and
individual farms were abandoned and population concentrated in the collective farm
centres. However, the number of country population stabilised by the end of the 1960s,
since urbanization was bred by immigration.
The massive industrial building of residential housing assured the fast growth. The
building of the first so-called micro district of blockhouses in Mustamäe Tallinn was
started in 1961. The building of detached houses was very modest. The recreative needs
were compensated with cooperative summer house massives, built around the cities and
near railroad lines that led out of the city. Instead of daily commuting inside the
metropolitan which was typical in the West, we commuted weekly or seasonally. People
used summer houses or the so-called datchas2.
Figure 5. Population change (%) according to census data in Estonian counties
(rajoons) 1959-1979 (a) ( CPM II) and 1979-1989 (b) ( CPM III).
Source: Statistical Office of Estonia
2 “Datcha” means in Russian a small garden house or summer house. This term is used in the meaning of a little garden house built by immigrants in Estonia
19
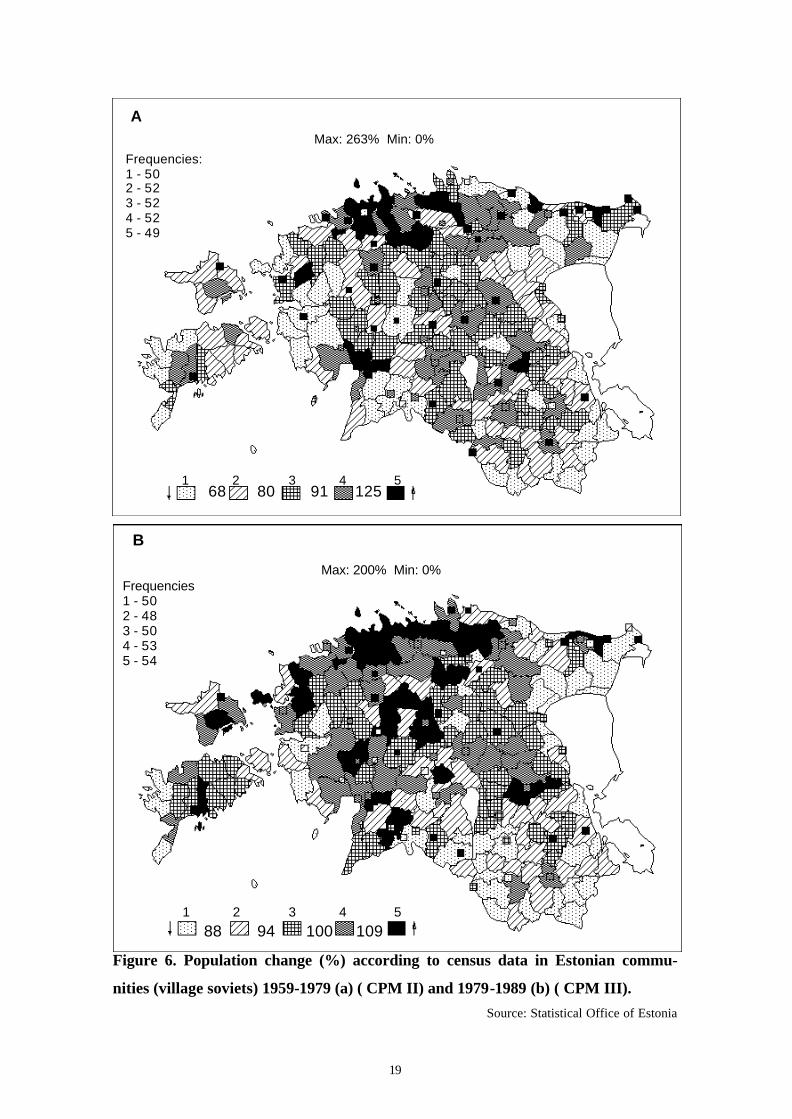
A Max: 263% Min: 0%
Frequencies: 1 - 50 2 - 52 3 - 52 4 - 52 5 - 49
68 80 91 125 1 2 3 4 5
B
Max: 200% Min: 0% Frequencies 1 - 50 2 - 48 3 - 50 4 - 53 5 - 54
88 94 100 109
1 2 3 4 5
Figure 6. Population change (%) according to census data in Estonian commu-
nities (village soviets) 1959-1979 (a) ( CPM II) and 1979-1989 (b) ( CPM III). Source: Statistical Office of Estonia

20
We have to point out a difference between the Western and the Eastern sub-urbanization
(CPM IIIa and CPM IIIb). The first one included the planning of family housing and
new cities away from centres. The idea (Howard) was to create better living
environment for the population. The planning of housing in the Soviet Union republics
preferred the needs of the industry: new city districts were often created next to
industrial buildings or farms.
Economic growth finally began in rural areas as well which was caused mainly by
Estonia's specialisation in the supply of animal products to the big cities of the USSR.
The main investments were directed to the central settlements of the collective farms,
resulting in the decline of villages deemed to have no useful contribution to make.
KPM IV: Relative concentration in the countryside in the 1980s
By the 1980s, 70% of the population lived in cities. The size of Tallinn had tripled and
was over half a million. North-East Estonia had grown four times and had become a
new industrial area with 230000 inhabitants, out of them 80% were Russian-speaking
immigrants. Tartu and “old” county centres had grown moderately (about twice).
Country population concentrated in the collective farm centres, closer to jobs, and
peripheries continued to sparse.
The number of rural population began to increase from 1983 (Katus 1989). Due to the
growth in agriculture, new jobs and higher wages were spread all over Estonia with the
exception of southern Estonia and some other remote areas (Marksoo 1992). The
Estonian agricultural- industrial cluster attracted city people with higher salaries.
Domestic economy and semi- illegal, the so-called secondary sector made also possible
to get significant extra income (Raagmaa, 1997). The rising income in the countryside
and the fall of living standards in the cities made Estonians move back to the rural areas,
particularly near cities, first and foremost to Western and Central Estonia.
4.4. Changes during the transition period: capitalistic spatial development again
At the beginning of the 1990s, Estonia re-entered the Western economic space. That
caused changes in economic structure, a drastic fall in agricultural and industrial
employment. As a result of transition period Estonia lost about 195 610 people (12.5 %
21
0 5 10 15 20
Rapla
Hiiu
Tartu
Pärnu
Saare
Põlva
Jõgeva
Viljandi
Järva
Võru
Harju
Valga
Lääne
Lääne-Viru
Ida-Viru
%
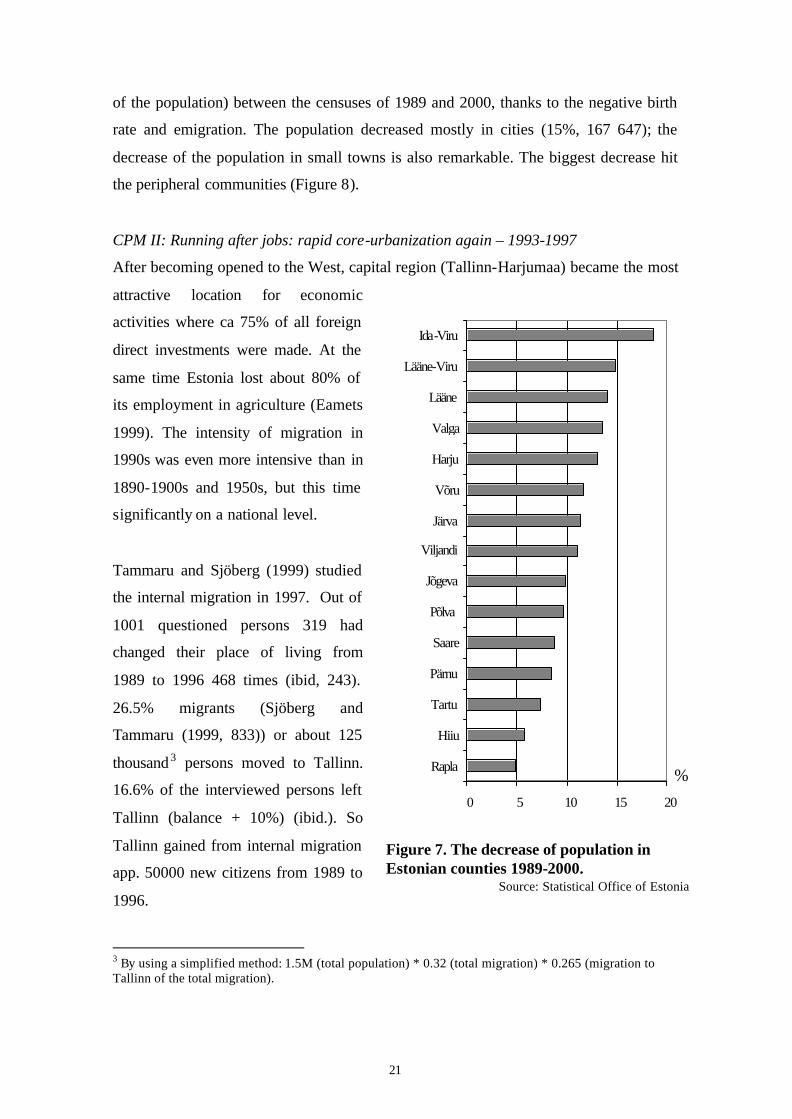
Figure 7. The decrease of population in Estonian counties 1989-2000.
Source: Statistical Office of Estonia
of the population) between the censuses of 1989 and 2000, thanks to the negative birth
rate and emigration. The population decreased mostly in cities (15%, 167 647); the
decrease of the population in small towns is also remarkable. The biggest decrease hit
the peripheral communities (Figure 8).
CPM II: Running after jobs: rapid core-urbanization again – 1993-1997
After becoming opened to the West, capital region (Tallinn-Harjumaa) became the most
attractive location for economic
activities where ca 75% of all foreign
direct investments were made. At the
same time Estonia lost about 80% of
its employment in agriculture (Eamets
1999). The intensity of migration in
1990s was even more intensive than in
1890-1900s and 1950s, but this time
significantly on a national level.
Tammaru and Sjöberg (1999) studied
the internal migration in 1997. Out of
1001 questioned persons 319 had
changed their place of living from
1989 to 1996 468 times (ibid, 243).
26.5% migrants (Sjöberg and
Tammaru (1999, 833)) or about 125
thousand 3 persons moved to Tallinn.
16.6% of the interviewed persons left
Tallinn (balance + 10%) (ibid.). So
Tallinn gained from internal migration
app. 50000 new citizens from 1989 to
1996.
3 By using a simplified method: 1.5M (total population) * 0.32 (total migration) * 0.265 (migration to Tallinn of the total migration).


Figure 8. Population change (%) according to census data in Estonian communities 1989-2000, 1989=100%
Source: Statistical Office of Estonia

24
Countryside and small towns lost about 70’000 citizens at the same time (balance –
15.2% (ibid)). A controversial process happened in the (former) collective farm centres:
when educated and younger people moved to the big cities, then older agricultural
specialists, who had bound themselves with the local life, moved away from their flats
to farmhouses, often to flee high central heating bills or cold flats. That is why tens of
blocks of flats in Estonian collective farm centres in mining and industrial settlements in
North East Estonia are abandoned.
CPM III: Sub-urbanization and the growth of regional centres – 1998-2002
The main process of the second half of the 1990s has been building new residential
housing near Tallinn, Tartu and Pärnu. True, in the mid-1990s, sub-urbanization was
based on rebuilding summer houses located behind the city borders. The summer houses
were extended and they were inhabited around the year. Therefore, it the movement of
the poor unemployed datcha-dwellers into a new cheaper location was probably more
intensive than the building of new houses for wealthier people (there are no studies).
Old flats were sold or rented. The building of private houses and the inhabitation of
summer houses led to a rapid population growth in a number of Harju county
communities: Viimsi grew 52,1%, Kiili 40,0%, Saku 25,3% and Kernu 24,6% during
1989-2000.
The economic growth and real-estate development has approached bigger county
centres with above 10 thousand inhabitants and sufficient hinterland since the second
half of 1990s. This change is based on demand created by services, new industries like
plastic industry and electronic assembly and restructured effective old branches like
farming, food and wood processing.
CPM IV: First signs of urban sprawl since 2001
The “real” real estate boom started in 2001 because low-interest loans were made
available. This will probably lead to the accelerating sub-urbanization. At the same time
the prices of these houses are still not affordable for the majority of the population and
thus the commuter belts are continuously expanding from the city borders.

25
4.5. The future of Estonia’s regional growth: will it ever reach counter-urbanization?
In the 1990s the economy and population concentrated into the city regions in Estonia.
This process is still continuing. Major changes occur in the countryside: the service and
production functions of the former collective farm centres have already been weakened,
the rationalization of service networks (bank and post offices, schools, etc.) and the
possible reform of the administrative structure will further reduce them.
However, according to the CPM the concentration will stop. The probable future
development is shown in Figure 2 modelling processes analogous in the western city
regions in the 1980s: the decline of the inner city, segregation, sub-urbanization. The
intensity and the distance of the wider deconcentration remains unclear because many
variables are still unpredictable. The factors for successful regional development in the
peripheral areas are the following:
(1) ability to change the industrial profile (replacing agricultural jobs with
manufacturing and services) – new jobs,
(2) the existence, the re-production or the creation of a good social and cultural
milieu – good living environment,
(3) the administrative structure, the ability and the willingness of local people and
key figures to innovate (Raagmaa, 2001) – proactive local governance.
When and whether Estonia reaches the fifth stage of the CPM remains unanswered for
now. Counter-urbanization took place in Western Europe and in the US in the 1980s,
but did not occur in sparsely inhabited Nordic countries. The re-urbanization started as a
result of growth of the information technology sector in Western Europe and Northern
America in the 1990s.
The Nordic countries went through the new urbanization wave as a result of cutting
back the public sector expenditure and the decrease of regional policy support schemes
since the beginning of 1990s. The 1.2 million region of Helsinki, capital of Finland,
world leader of informational society, acquired 150000 new citizens in the 1990s and
made Helsinki one of the fastest growing city regions in Europe (Jauhiainen 2002).
On the other hand, it is a fact tha t a number of the US metropolitan areas are
continuously spreading (Issermann 2001), the same happens in several European
countries too.

26
Primary migration Secondary migration
POOR CLOSED RURAL SOCIETY
G HETTO ( CLOSED , POOR , CRIMINAL URBAN SOCIETY )
Social and territorial segregation within a city
Suburban areas
CITY
Countryside, small towns with the dominance of staple branches
Stagnating, self-sufficient rural areas
Restructuring, economically active and/or recreationally valuable rural areas
Formation of closed, poor and socially excluded areas without real potential of indigenous development
Formation of culturally different and heterogeneous, but naturally, culturally & socially attractive open rural localities with high potential of indigenous growth
Labour (brain) mobility
Figure 9. Principal transformation model for the CEEC spatial development.
There has not been massive counter-urbanization in Estonia. 90% of people live in
apartments in Tallinn. This figure is under 50% in Belgium and 35% in the USA. 73%
of Estonian residents lived in flats in the mid-1990s, but 91% (96% of Estonians) of
them would like to live in a private house (UNDP 1996). It is important to know that the
milieu in Estonian blocks of flats is far from the milieu in similar western districts
which is another reason to leave the flats. These facts clearly indicate the continuing
spread of the settlement.
5. Synthesis and conclusion
This article used the centre-periphery model analysing the Estonian regional
development. The argumentation basically confirmed the hypothetical external
(political) influences on Estonian settlement systems.
The industrialization and urbanization began about 100 years later than in the
capitalistic flagship of the Western world - England (Figure 10). The main changes in
the settlement system took place in both countries at the end of 19th century and in the

27
1960s, but the developments were in different stages. For example, in the 1960s Tallinn
was in the CPM Stage III and built Mustamäe residential district - a Soviet style new
town. At the same time London had already reached urban sprawl – the population was
spreading over the agglomeration. The development of Finnish settlement system has
been much more stable than in Estonia, but fluctuating considerably more than the
British one.
CPM stages 1700 1750 1800 1850 1900 1920 1940 1960 1980 2000
Stage V
counter-urbanization
Stage IV
urban sprawl
Stage III
suburbanization
Stage II
core-urbanization
(re-urbanization 1990s)
Stage I
urbanization
0 Starting stage
agrarian society
Figure 10. The schematic path of the development of settlements in England,
Finland and Estonia.
First, we can agree with Tim Hall (1998, 105) who argued that the development of
settlement depends on the wealth of the society and the ability to invest capital in
construction.
Secondly, we should consider major political events that have altered Estonian
development more than in the more stable countries located in the economic core areas.
England
Estonia
Finland
I World War
Energy crisis
II World War
Breakdown of the Soviet Union 1991

28
The industrial growth before the World War I speeded up Estonian urbanization. After
the war, the urbanization was much slower, thanks to the lack of capital. The politics
influenced the settlement system in a very direct way in the 1950s when the number of
district centres multiplied increased fourfold. Another wave of rapid urbanization was
caused by political reasons at the beginning of 1990s.
STAGES ECONOMIC-POLITICAL
CPM
Russian
Empire
Republic of
Estonia I
Soviet
Union
Republic of
Estonia II
Estonia
under EU
Stage V
counter-
urbanization
1983-1992 ??
Stage IV
urban sprawl
2001 à
? 2004
Stage III
suburbanization
1926-1940a 1975-1992b 1997a à
? 2004
Stage II
core-urbanization
1880-1915* 1933-1940
1960-1975
1992-1996
Stage I
local urbanization
1860-1915 1920-1933
1949-1960
0 Starting stage
agrarian society
Before 1850
Figure 11. The influence of economical-political factors to the development of
Estonia.
* Underlined are shown the dominant sub-stages of the CPM, In Bold other important
sub-stages. a Western (Howard) style of sub- and neo-urbanization: suburbs with dominance of
private houses, and new cities planned behind a green belt. b Eastern type of sub- and neo-urbanization: microdistricts that border with the core-
city and the datšas.

29
There have been three major setbacks in the development of Estonian settlement and
they all occurred after changes in the political order (Table 1):
1) 1920-1933, falling from the CPM Stage II to Stage I was caused by the lack of
capital and the protectionism of European trade in the 1920s and 1930s.
2) 1950s, drop from the CPM Stage IV to Stage I was caused by the war and new
political order.
3) The setback of the 1990s from CPM Stage IV to Stage II was again caused by
political and social changes in the economy: the growing unemployment in rural
areas at the beginning of the 1990s gave a push to rapid urbanization.
Consequently, the CPM can be used fairly well to describe and analyse the history of
the settlement development. The CPM applies also as a forecast tool to analyse
countries that are lagging in their settlement development in comparison with western
core economies.
Further plans are to establish the stages of the CPM more precisely by using more
detailed population and enterprise development data.
References Amin, A. (1994) Post-Fordism: Models, Fantasies and Phantoms of Transition. In: Post-
fordism. A Reader. A. Amin (Ed.), Oxford: Blackwell. Bluestone, B., Harrisson, B. (1982) The De-industrialization of America. New York: Basic
Books. Brenner, R. (1977) The origins of capitalist development: a critique of neo-Smitian Marxism.
New Left Review, 104, 25-92. Castells M. (1996) The Rise of Network Society. The Informational Age: Economy, Society and
Culture, I., Blackwell: Oxford. Christaller, W. (1933) Die Zentralen Orte in Süddetschland. Jena. Dicken, P. (1998) Global Shift. Transforming the World Economy. London: Paul Chapman
Publishing. Eamets, R., Philips K., Annus, T. (1999) Background Study on Labour Market and Employment
in Estonia. EC Report 1999, Tallinn. Eesti 2010 (1998) Eesti territoriaal-majandusliku arengu kontseptsioon (üleriigiline planeering)
aastani 2010. Aado Keskpaik (Ed.) Tallinn: Estonian Institute for Futures Studies (Manuscript)
Ehrlich, R. (1977) Tootmise kontsentreerimise mõjust Eesti NSV väikeste linnaliste asulate arengule. Eesti Geograafia Seltsi aastaraamat. Tallinn: Valgus, 202-216.
Friedmann, J. (1966) Regional Development Policy: A Case Study of Venezuela. ??? Friedmann, J., Miller, J. (1965) The Urban Fields. Journal of American Institute of Planners,
40, 1, 1-16. Gibbs, J. P. (1963) The Evolution of Population Concentration. Economic Geography 39.

30
Hall, P. (1988) The geography of the fifth Kodratieff. In: Restructuring Britain. Uneven Re -development: Cities and Regions in Transition, D. Massey and J. Allen. (Eds.), London: Hodder & Stoughton, 6-47.
Hall, T. (1998) Urban Geography. London: Routledge Hirschmann, A. (1958) The Strategy of Economic Development. New Haven: Yale University
Press. Issermann, A.M. (2001) Competitive Advantage of Rural America. International Regional
Science Review 24, 1, 38-68. Jauhiainen, J.S. (1995) Kaupungisuunnittelu, kaupungiuudistus ja kaupungipolitiikka. Kolme
Eurooppalaista esimerkiä. Publicationes Instituti Geographici Universitatis Turkuensis 146, Turku.
Jauhiainen, J.S. (2002) Eesti linnaregioonide arengupotentsiaali analüüs. Tallinn: Eesti Siseministeerium. (Manuscript)
Katus, K. (1989) Eesti demograafiline areng läbi sajandite. Tallinn: EDA. Kondratieff, N. (1935) The Long Waves in Economic Life. Review of Economic Statistics, 17. Kant E. (1935) Bevölkerung und Lebensraum Estlands. Tartu. Katus, K. (1989) Eesti demograafiline areng läbi sajandite. Tallinn. Kaup, U. (1986) Tallinna aglomeratsiooni arengusuundi. In: Geograafia rakendusprobleeme
ENSV-s. Tallinn. Kultalahti, O. (1990) Yhteiskunta ja alue. Jyvaskylä: Finnpublishers. Kümmel T. (1987) Mõningad tendentsid Tallinna aglomeratsiooni arengus. TPI Toimetised, 849,
35-55. Marksoo, A. (1992) Dynamics of Rural Population in Estonia in the 1980s. In: Estonia, Man
and Nature. Tallinn: Estonian Academy Publishers, 129–151. Maskell, P. (1998) Learning the village economy of Denmark: the role of institutions and policy
in sustaining competitiveness. In: Regional Innovation Systems H.-J Braczyk, P. Cooke, M. Heidenreich (Eds.). UCL Press.
Massey, D. (1984) Spatial Divison of Labour. London: MacMillan. Mäeltsemees, S. (1981) Süsteemne lähenemine Eesti NSV teeninduse territoriaalse
organisatsiooni uurimisele. Eesti Geograafia Seltsi aastaraamat. Tallinn: Valgus, 130-143.
Myrdal, G. (1957) Economic Theory and underdeveloped regions. London: Duckworth. Nõmmik, S. (1976) Asustussüsteemide dünaamika ühiskondliku tootmise territoriaalse
kontsentratsiooni protsessis. Eesti Geograafia Seltsi aastaraamat. Tallinn: Valgus, 144-155.
Nõmmik, S. (1979) Eesti NSV majandusgeohgraafia, Tallinn: Valgus. Nõmmik, S. (1981) Kompleksne metodoloogia tootlike jõudude territoriaalsel uurimisel. Eesti
Geograafia Seltsi aastaraamat. Tallinn: Valgus, 86-105. Nõmmik, S.; Mereste, U. (1984) Sovremennaya geografya: voprocy teoryi. (In Russian)
/Theoretical issues of contemporary geogpaphy/. Moscow: Mysl. Perroux, F. (1955) Note sur la notion de pole de croissance. Economie Appliqueé 7, 307-20. Rees, J., Briggs, R., Oakey, R. (1984) The adoption of new Technologies in the American
Machinery Industry. Regional Studies, 18.6. Raagmaa, G. (1996) Shifts in Regional Development of Estonia During the Transition,
European Planning Studies, 1996, 4, 6, 679-699. Raagmaa, G (1997) Growth in the Hidden Economy. The case of Estonia, In: Transition in the
Baltic States - Microlevel Studies Neil Hood, Robert Kilis and Jan-Erik Vahlne,. London: Macmillan.
Raagmaa, G. (2000) Territorial Identity and Public Leaders in Regional Economic Development. Towards the New Approach in Regional Policy: Cultural Geography Theories in Explaining Economic Growth. Dissertationes Geographicae Universitatis Tartuensis 12. Tartu: Tartu University Press
Raagmaa, G. (2001) Public Leaders in Regional Economic Development. European Planning Studies. 9, 8, 1039-54.
31
Raagmaa, G., Albre, N., Kroon, K., Pikner, T. (2002) Central places versus networks: the future of collective farms built community infrastructure in Estonia. CD ROM, ERSA 42th Congress: Dortmund
Ristkok, P. (1998) Regionaalpoliitika areng Eestis. Tartu: Institute of Geography (Manuscript) Storper, M., Walker, R. (1989) The Capitalist imperative. Oxford: Blackwell. Scott, A. J. (1990) Flexible production systems and regional development: the rise of new
industrial spaces in North America and Western Europa. In: S. Illeris ja L. Jacobson Networks and Regional Development. NordREFO.
Shumpeter, J. A. (1934) The Theory of Economic Development. Cambridge, Mass.: Harvard University Press.
Sjöberg, Ö., Tammaru, T. (1999) Transitional Statistics: Internal Migration and Urban Growth in Post-Soviet Estonia. Europe-Asia Studies, 51, 5, 821-842.
Soja, E. (1996) Thirdspace: Journeys to Los Angeles and Other Real-and-Imagined Places. Oxford: Blackwell.
Tammaru, T. (2001) Eesti linnade mõjualad ja pendelränne. Rahvastikuministri Büroo, 2001. Tallinn
Tammaru, T., Sjöberg, Ö. (1999) On the Move: Explaining Migration Patterns in Estonia During the Transition Period. International Journal of Population Geography, 5, 241-260.
Tarmisto, V. (1960) Tallinna tööstuse kohast Eesti NSV tööstuses. Eesti Geograafia Seltsi aastaraamat. Tallinn, 176-197.
Tarmisto, V. (1975) Vnutrirayonnaya territorialnaya organizaciya proisvodstvo. Tallinn: Valgus.
Temple, M. (1994) Regional Economics. New York: St.Martin's Press. Toffler, A. (1980) The Third Wave. London: Pan Books with William Collins Sons & Co Ltd. Tööhõive, ettevõtluskeskkond, koolitusvõimalused ja elukvaliteet (2002). Tartumaa Peipsi-
äärsete valdade ja kallaste linna elanikkonna küsitluse ning intervjuude tulemused. Peipsiveere Arengu Sihtasutus, Sotsiaalministeerium, Tartu Maavalitsus. Tartu-Tallinn. (Manuscript)
UNDP (1996) Estonian Human Development Report 1996. Tallinn. <http://www.ciesin.ee/undp/nhdr.html>
WTO (World Tourism Organisation) (1999) Megatrends of Tourism. World Tourism Organisation: Madrid