
43806.pdf
6
Applying WebTables in Practice Sreeram Balakrishnan, Alon Halevy, Boulos Harb, Hongrae Lee, Jayant Madhavan, Afshin Rostamizadeh, Warren Shen, Kenneth Wilder, Fei Wu, Cong Yu Google Research {sreevb,halevy,harb,hrlee,jayant,rostami,whshen,wilder,wufei,congyu}@google.com ABSTRACT We started investigating the collection of HTML tables on the Web and developed the WebTables system a few years ago [4]. Since then, our work has been motivated by apply- ing WebTables in a broad set of applications at Google, resulting in several product launches. In this paper, we de- scribe the challenges faced, lessons learned, and new insights that we gained from our efforts. The main challenges we faced in our efforts were (1) iden- tifying tables that are likely to contain high-quality data (as opposed to tables used for navigation, layout, or formatting), and (2) recovering the semantics of these tables or signals that hint at their semantics. The result is a semantically en- riched table corpus that we used to develop several services. First, we created a search engine for structured data whose index includes over a hundred million HTML tables. Sec- ond, we enabled users of Google Docs (through its Research Panel) to find relevant data tables and to insert such data into their documents as needed. Most recently, we brought WebTables to a much broader audience by using the ta- ble corpus to provide richer tabular snippets for fact-seeking web search queries on Google.com. 1. INTRODUCTION A few years ago we started investigating the collection of HTML tables on the Web [4], a vast resource that also in- spired several other research efforts, e.g., [10, 3, 13]. Our goal was twofold. First, we wanted to characterize the size and quality of this untapped source of structured data. Sec- ond, we wanted to create services that would expose this content to Google users. In the past few years, we have been tackling the main challenges concerning this collection: (1) extracting a high- quality corpus of HTML data and (2) recovering signals that provide semantic clues about the content of these tables. Based on our high-quality corpus, we demonstrated that structured data from WebTables is relevant to a broad set of services. First, we created a search engine for structured This article is published under a Creative Commons Attribution License (http://creativecommons.org/licenses/by/3.0/), which permits distribution and reproduction in any medium as well allowing derivative works, pro- vided that you attribute the original work to the author(s) and CIDR 2015. 7th Biennial Conference on Innovative Data Systems Research (CIDR ’15) January 4-7, 2015, Asilomar, California, USA.. data whose index includes over a hundred million HTML tables and several million tables made public by the users of Google Fusion Tables, a tool for easily managing and visu- alizing data [6]. Second, we enabled users of Google Docs to tap into the table collection and insert data into their docu- ments as needed. Most recently, we used the table corpus to present tabular data in the Google.com search result page, thereby reaching a much wider audience. This paper describes the challenges we faced to create the table corpus and use it in the aforementioned applications. While some of the ideas underlying this work appeared in our previous research papers [4, 12], here we focus on the developments that were made and insights that were gained by applying these ideas in our products. Section 2 describes how we built the table corpus. Sec- tion 3 describes how we enriched the corpus with semantics. Section 4 describes each of the applications and the addi- tional innovations needed to launch them. 2. EXTRACTING HIGH QUALITY TABLES The Web contains tens of billions of HTML tables, even when we consider only pages in English. However, over 99% of the tables do not contain data, but rather use the HTML table tag as a formatting mechanism for presentation (see Figure 1(b)). A more subtle problem we discovered while looking at many tables is that there is no clear definition of what makes a good table and the classification can be subjec- tive. It was not uncommon to have disagreements among the evaluators of table quality, even when these evaluators had been studying HTML tables for quite a while. For example, while most people will agree that the table in Figure 1(a) provides valuable information, tables in Figure 2 may have more borderline importance. Such tables tend to be useful for an extremely small group of people, e.g., Figures 2(a) or (b), or have useful information in navigational links outside the table itself, e.g., Figure 2(c). These characteristics of Web tables created unique chal- lenges in identifying the (relatively) tiny subset (albeit huge in absolute numbers) of good tables among the sea of bad ta- bles. The first concrete technical challenge is that there is an extreme imbalance of bad to good table examples, thereby making it difficult to train a machine learning classifier to recognize good tables. A random sample of tables will in- variably consist of mostly negative examples, and hence any technique that classifies every table as bad would have per- formed quite well. The second challenge was that goodness of a table could be highly dependent on the application we were building.
-
Upload
anonymous-rm2m9swq -
Category
Documents
-
view
214 -
download
1
Transcript of 43806.pdf

Applying WebTables in Practice
Sreeram Balakrishnan, Alon Halevy, Boulos Harb, Hongrae Lee,Jayant Madhavan, Afshin Rostamizadeh, Warren Shen, Kenneth Wilder, Fei Wu, Cong Yu
Google Research{sreevb,halevy,harb,hrlee,jayant,rostami,whshen,wilder,wufei,congyu}@google.com
ABSTRACTWe started investigating the collection of HTML tables onthe Web and developed the WebTables system a few yearsago [4]. Since then, our work has been motivated by apply-ing WebTables in a broad set of applications at Google,resulting in several product launches. In this paper, we de-scribe the challenges faced, lessons learned, and new insightsthat we gained from our efforts.
The main challenges we faced in our efforts were (1) iden-tifying tables that are likely to contain high-quality data (asopposed to tables used for navigation, layout, or formatting),and (2) recovering the semantics of these tables or signalsthat hint at their semantics. The result is a semantically en-riched table corpus that we used to develop several services.First, we created a search engine for structured data whoseindex includes over a hundred million HTML tables. Sec-ond, we enabled users of Google Docs (through its ResearchPanel) to find relevant data tables and to insert such datainto their documents as needed. Most recently, we broughtWebTables to a much broader audience by using the ta-ble corpus to provide richer tabular snippets for fact-seekingweb search queries on Google.com.
1. INTRODUCTIONA few years ago we started investigating the collection of
HTML tables on the Web [4], a vast resource that also in-spired several other research efforts, e.g., [10, 3, 13]. Ourgoal was twofold. First, we wanted to characterize the sizeand quality of this untapped source of structured data. Sec-ond, we wanted to create services that would expose thiscontent to Google users.
In the past few years, we have been tackling the mainchallenges concerning this collection: (1) extracting a high-quality corpus of HTML data and (2) recovering signals thatprovide semantic clues about the content of these tables.Based on our high-quality corpus, we demonstrated thatstructured data from WebTables is relevant to a broad setof services. First, we created a search engine for structured
This article is published under a Creative Commons Attribution License(http://creativecommons.org/licenses/by/3.0/), which permits distributionand reproduction in any medium as well allowing derivative works, pro-vided that you attribute the original work to the author(s) and CIDR 2015.7th Biennial Conference on Innovative Data Systems Research (CIDR ’15)January 4-7, 2015, Asilomar, California, USA..
data whose index includes over a hundred million HTMLtables and several million tables made public by the users ofGoogle Fusion Tables, a tool for easily managing and visu-alizing data [6]. Second, we enabled users of Google Docs totap into the table collection and insert data into their docu-ments as needed. Most recently, we used the table corpus topresent tabular data in the Google.com search result page,thereby reaching a much wider audience.
This paper describes the challenges we faced to create thetable corpus and use it in the aforementioned applications.While some of the ideas underlying this work appeared inour previous research papers [4, 12], here we focus on thedevelopments that were made and insights that were gainedby applying these ideas in our products.
Section 2 describes how we built the table corpus. Sec-tion 3 describes how we enriched the corpus with semantics.Section 4 describes each of the applications and the addi-tional innovations needed to launch them.
2. EXTRACTING HIGH QUALITY TABLESThe Web contains tens of billions of HTML tables, even
when we consider only pages in English. However, over 99%of the tables do not contain data, but rather use the HTMLtable tag as a formatting mechanism for presentation (seeFigure 1(b)). A more subtle problem we discovered whilelooking at many tables is that there is no clear definition ofwhat makes a good table and the classification can be subjec-tive. It was not uncommon to have disagreements among theevaluators of table quality, even when these evaluators hadbeen studying HTML tables for quite a while. For example,while most people will agree that the table in Figure 1(a)provides valuable information, tables in Figure 2 may havemore borderline importance. Such tables tend to be usefulfor an extremely small group of people, e.g., Figures 2(a) or(b), or have useful information in navigational links outsidethe table itself, e.g., Figure 2(c).
These characteristics of Web tables created unique chal-lenges in identifying the (relatively) tiny subset (albeit hugein absolute numbers) of good tables among the sea of bad ta-bles. The first concrete technical challenge is that there is anextreme imbalance of bad to good table examples, therebymaking it difficult to train a machine learning classifier torecognize good tables. A random sample of tables will in-variably consist of mostly negative examples, and hence anytechnique that classifies every table as bad would have per-formed quite well. The second challenge was that goodnessof a table could be highly dependent on the application wewere building.

(a) The table shows critical temperature and pressure for varioussubstances as a tabular data.
(b) The table marked by dotted line includes contents, but itsprimary goal is to control the layout.
Figure 1: Example data and formatting tables
(a) Personal note (b) Game information with images (c) Download links
Figure 2: Example tables with subjective value
To address these challenges, we followed a 2-step approach:
1. Simple rules: We manually gathered the most frequentbad table patterns and designed simple heuristic rules thatfiltered tables that were most certainly bad. Examples ofthose heuristic patterns include tiny tables (less than 3 rowsand 2 columns), calendar tables, password tables, table-of-content tables. These heuristics eliminate about 90% of badtables. After this step, bad tables still dominate good onesby factor of 9 to 1, which is much better than the 99 to 1with which we started.
2. Machine learning classifier: At this point, the de-cision on which tables are considered good is dependent onthe application for which we intend to use the table cor-pus. Here is a real example of such a choice. Originally, weconsidered tables to be good if they are similar in spirit torelational tables: they should contain multiple rows, whereeach row corresponds to data about a particular entity inthe world (e.g., a location or a movie), and the columns ofthe table describe attributes of the row’s entity. When westarted developing tabular snippets for google.com search(see Section 4.3), however, we realized that a large collec-tion of vertical tables turned out to be useful as well. Verticaltables (see Figure 3) typically have only two columns and asmall number of rows. The vertical table lists the propertiesof a single entity, and the values in the first column are thenames of the properties.
There are three main aspects in the development of ourmachine learning classifiers: feature design, training exam-ple generation, and model selection. The production fea-tures we eventually adopted encode both syntactic and se-
mantic information. Semantic features include such signalsas to whether the table content falls into a boilerplate sec-tion of the page as well as labeling the topic of each columnin the table; Section 3 describes how we generated some ofthese semantic features. The structural features include thenumber of rows and columns, mean/variance of the numberof characters per cell, the fraction of non-empty cells, thefraction of cells that are generated using <th> tags and thenumber of distinct tokens in a table.
In order to generate training examples we used two sourcesof data: a uniform sampling of tables taken after the heuris-tic filter stage (which includes only a small fraction of goodtables, i.e., about 10%) and an additional uniform sampletaken from tables that were marked good by a simplisticdecision-tree classifier developed earlier [4], which makes useof the above features. Since the simplistic classifier is onlyused as a mechanism to collect training examples for a moreadvanced classifier, not as a production model to be deployedfor real use, we did not rigorously evaluate its performance.It only has the property that a significant fraction (%50+)of the tables it labels as good are indeed good. Thus, oncethe two sources are combined, the final training set containsa larger proportion of good tables (about 35%), which wefound useful for training a higher recall classifier.
After the training examples are generated, we train twohigh-accuracy classification models, one which classifies a ta-ble as “good horizontal” (e.g., Figure 1(a)) or not, and a sec-ond which classifies a table as “good vertical” (e.g., Figure 3)or not. Both models are trained using the multi-kernel SVMdescribed in [5], which uses an alignment based metric to
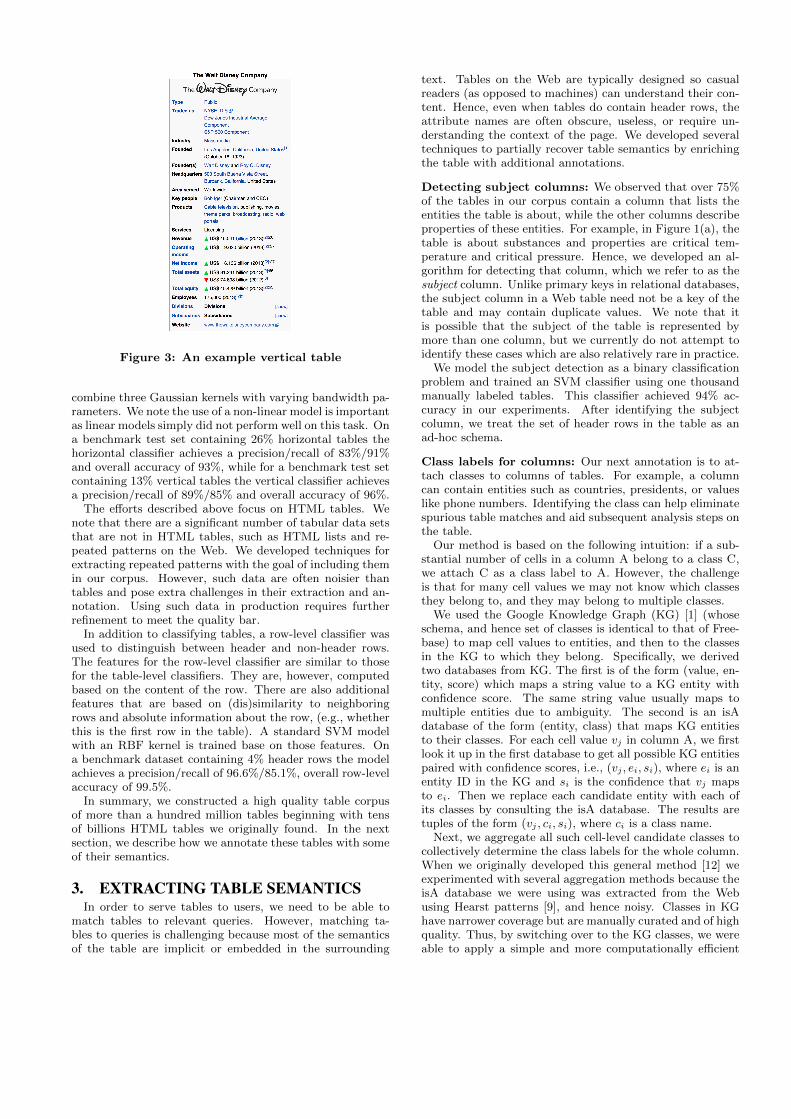
Figure 3: An example vertical table
combine three Gaussian kernels with varying bandwidth pa-rameters. We note the use of a non-linear model is importantas linear models simply did not perform well on this task. Ona benchmark test set containing 26% horizontal tables thehorizontal classifier achieves a precision/recall of 83%/91%and overall accuracy of 93%, while for a benchmark test setcontaining 13% vertical tables the vertical classifier achievesa precision/recall of 89%/85% and overall accuracy of 96%.
The efforts described above focus on HTML tables. Wenote that there are a significant number of tabular data setsthat are not in HTML tables, such as HTML lists and re-peated patterns on the Web. We developed techniques forextracting repeated patterns with the goal of including themin our corpus. However, such data are often noisier thantables and pose extra challenges in their extraction and an-notation. Using such data in production requires furtherrefinement to meet the quality bar.
In addition to classifying tables, a row-level classifier wasused to distinguish between header and non-header rows.The features for the row-level classifier are similar to thosefor the table-level classifiers. They are, however, computedbased on the content of the row. There are also additionalfeatures that are based on (dis)similarity to neighboringrows and absolute information about the row, (e.g., whetherthis is the first row in the table). A standard SVM modelwith an RBF kernel is trained base on those features. Ona benchmark dataset containing 4% header rows the modelachieves a precision/recall of 96.6%/85.1%, overall row-levelaccuracy of 99.5%.
In summary, we constructed a high quality table corpusof more than a hundred million tables beginning with tensof billions HTML tables we originally found. In the nextsection, we describe how we annotate these tables with someof their semantics.
3. EXTRACTING TABLE SEMANTICSIn order to serve tables to users, we need to be able to
match tables to relevant queries. However, matching ta-bles to queries is challenging because most of the semanticsof the table are implicit or embedded in the surrounding
text. Tables on the Web are typically designed so casualreaders (as opposed to machines) can understand their con-tent. Hence, even when tables do contain header rows, theattribute names are often obscure, useless, or require un-derstanding the context of the page. We developed severaltechniques to partially recover table semantics by enrichingthe table with additional annotations.
Detecting subject columns: We observed that over 75%of the tables in our corpus contain a column that lists theentities the table is about, while the other columns describeproperties of these entities. For example, in Figure 1(a), thetable is about substances and properties are critical tem-perature and critical pressure. Hence, we developed an al-gorithm for detecting that column, which we refer to as thesubject column. Unlike primary keys in relational databases,the subject column in a Web table need not be a key of thetable and may contain duplicate values. We note that itis possible that the subject of the table is represented bymore than one column, but we currently do not attempt toidentify these cases which are also relatively rare in practice.
We model the subject detection as a binary classificationproblem and trained an SVM classifier using one thousandmanually labeled tables. This classifier achieved 94% ac-curacy in our experiments. After identifying the subjectcolumn, we treat the set of header rows in the table as anad-hoc schema.
Class labels for columns: Our next annotation is to at-tach classes to columns of tables. For example, a columncan contain entities such as countries, presidents, or valueslike phone numbers. Identifying the class can help eliminatespurious table matches and aid subsequent analysis steps onthe table.
Our method is based on the following intuition: if a sub-stantial number of cells in a column A belong to a class C,we attach C as a class label to A. However, the challengeis that for many cell values we may not know which classesthey belong to, and they may belong to multiple classes.
We used the Google Knowledge Graph (KG) [1] (whoseschema, and hence set of classes is identical to that of Free-base) to map cell values to entities, and then to the classesin the KG to which they belong. Specifically, we derivedtwo databases from KG. The first is of the form (value, en-tity, score) which maps a string value to a KG entity withconfidence score. The same string value usually maps tomultiple entities due to ambiguity. The second is an isAdatabase of the form (entity, class) that maps KG entitiesto their classes. For each cell value vj in column A, we firstlook it up in the first database to get all possible KG entitiespaired with confidence scores, i.e., (vj , ei, si), where ei is anentity ID in the KG and si is the confidence that vj mapsto ei. Then we replace each candidate entity with each ofits classes by consulting the isA database. The results aretuples of the form (vj , ci, si), where ci is a class name.
Next, we aggregate all such cell-level candidate classes tocollectively determine the class labels for the whole column.When we originally developed this general method [12] weexperimented with several aggregation methods because theisA database we were using was extracted from the Webusing Hearst patterns [9], and hence noisy. Classes in KGhave narrower coverage but are manually curated and of highquality. Thus, by switching over to the KG classes, we wereable to apply a simple and more computationally efficient
majority voting algorithm, i.e., any class C that applied tomore than 50% of the cells in a column was associated withthe column.
After getting class labels for columns, we use them to re-fine the linking from cell values to KG entities. For eachcell we filter those candidate entities which does not belongto any of those column-level classes. If there are still multi-ple candidate entities left, we pick the one with the highestmapping score. An important observation of our work isthat considering the structure of the table was extremelyimportant. To prove the point, we also tried to treat tablecontent as plain text and apply entity linking techniques,e.g., [8]. However the performance was not as good mainlybecause they do not utilize the table structure informationas effectively. For columns which hold location data, we useGoogle Maps API [2] to determine the latitude and longi-tude coordinates of each cell.
An interesting observation was that being able to assign alabel to a column for the subject column was a very effectivesignal for table quality. When semantics can be discoveredfor a table, it is more likely that the table contains high-quality data. Hence, the percentage of cells in a columnthat were mapped to the same KG class was one of theimportant semantic features for our classifier.
Detecting binary relationships between columns: Thesemantic class of the subject column tells us quite a bit aboutthe contents of the table and sometimes suffices for match-ing tables to queries. However, it is also important to knowwhat properties of the subject-column entities are describedin the table, i.e., what are the binary relationships betweenthe subject column and each of the other columns in thetable.
These relationships are typically expressed in text sur-rounding the tables. However, the text can be quite longand detecting the specific phrases that refer to these rela-tionships can be tricky. To that end, we have recently devel-oped a dictionary of attributes that exist in search queriesand Web text [7]. For example, for the class Countries wemine thousands of attributes that may be associated withcountries, ranging from common ones such as gdp and cap-ital to longer-tail ones, such as coffee production andcorruption index. We then use this collection to findprominent words in the surrounding text that could referto the attributes of the subject column. These annotationsare already in our corpus but are not applied to productionapplications yet due to their recent addition. Our prelim-inary analysis shows that they enable us to recover muchmore of the table semantics. We expect the new addition tohave production impact in the near future.
Finally, we extract captions, and the text surrounding atable. Often times, captions and text surrounding the tabledescribe some of the semantics of the table such as the unitsused for numerical columns, relationships between columnsas described above, or some constraint that applies to theentities in the table (e.g., that the table has data collected in2013, or contains only countries in the southern hemisphere).To extract surrounding text we obtain a window of textbefore and after the table. To extract the caption of thetable, we analyze the DOM structure of the page to identifyprominent fragments (e.g., header text) and use syntacticsignals such as the distance from the table.
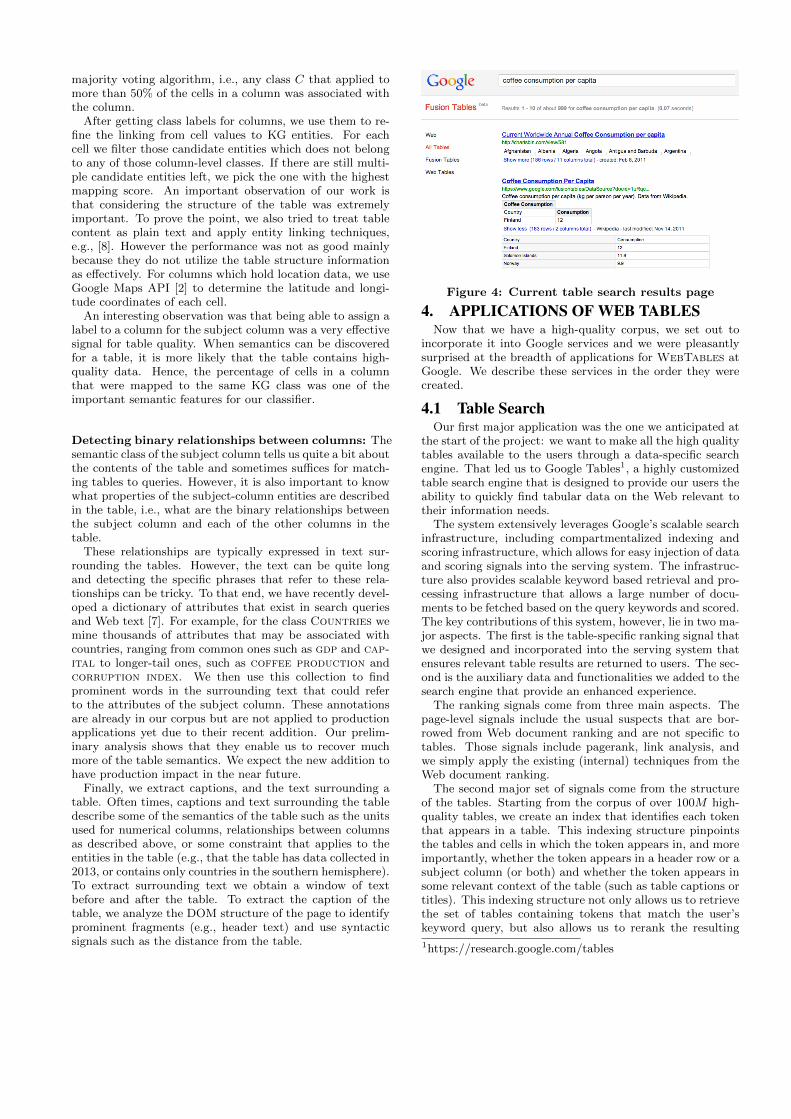
Figure 4: Current table search results page
4. APPLICATIONS OF WEB TABLESNow that we have a high-quality corpus, we set out to
incorporate it into Google services and we were pleasantlysurprised at the breadth of applications for WebTables atGoogle. We describe these services in the order they werecreated.
4.1 Table SearchOur first major application was the one we anticipated at
the start of the project: we want to make all the high qualitytables available to the users through a data-specific searchengine. That led us to Google Tables1, a highly customizedtable search engine that is designed to provide our users theability to quickly find tabular data on the Web relevant totheir information needs.
The system extensively leverages Google’s scalable searchinfrastructure, including compartmentalized indexing andscoring infrastructure, which allows for easy injection of dataand scoring signals into the serving system. The infrastruc-ture also provides scalable keyword based retrieval and pro-cessing infrastructure that allows a large number of docu-ments to be fetched based on the query keywords and scored.The key contributions of this system, however, lie in two ma-jor aspects. The first is the table-specific ranking signal thatwe designed and incorporated into the serving system thatensures relevant table results are returned to users. The sec-ond is the auxiliary data and functionalities we added to thesearch engine that provide an enhanced experience.
The ranking signals come from three main aspects. Thepage-level signals include the usual suspects that are bor-rowed from Web document ranking and are not specific totables. Those signals include pagerank, link analysis, andwe simply apply the existing (internal) techniques from theWeb document ranking.
The second major set of signals come from the structureof the tables. Starting from the corpus of over 100M high-quality tables, we create an index that identifies each tokenthat appears in a table. This indexing structure pinpointsthe tables and cells in which the token appears in, and moreimportantly, whether the token appears in a header row or asubject column (or both) and whether the token appears insome relevant context of the table (such as table captions ortitles). This indexing structure not only allows us to retrievethe set of tables containing tokens that match the user’skeyword query, but also allows us to rerank the resulting
1https://research.google.com/tables
tables based on where the query hits appear in the table.During scoring time, we consider hits on the schema, hitson table cells that are in columns deemed important, andthe context surrounding the table. The contributions fromdifferent hits are combined via a linear weighted sum model,where the weights are learned via simple linear regression.
The third major set of signals come from the semanticannotations (Section 3). In addition to the original tokensfrom the table content, we further index tokens that comefrom annotations on the content. To leverage those anno-tation tokens, we also perform semantic annotations on thequeries to supplement raw query tokens with correspond-ing rewritten annotation query tokens. Similarly to IR-styletext normalization, both table content token and query to-ken are normalized via common annotations and matchedtogether and those matches provide this third major set ofranking signals.
Presenting table search results turns out to be more chal-lenging than we expected. Snippets, i.e., the little piece oftext comes after each result title/URL, are integral parts ofmodern search results. One of the major differentiators ofour table search engine is that it provide auxiliary informa-tion that significantly enhances the user experience beyondsimply finding relevant table results. These auxiliary infor-mation are reflected in two ways: table snippet and tableimport. Once a table is retrieved, instead of simply showingthe first few rows or columns of the table, we use query hitson the table to generate a preview of the table that is mostrelevant to the query, by projecting and selecting the rowsand columns where the hits occur. Each hit is ranked basedon how much it matters to the table snippet. The signalswe use include the number of cells the same hit appears in,whether the hit is in a header row or subject column, andwhether the hit belongs to a group of hits in the same cell,row or column.
Table snippets (Figure 4) gives our users a nice previewover the table. Just previewing the data, however, may notbe the end goal of users; they often wish to import the dataand perform analytical tasks. Thus, table search aims toserve as a launching pad for completing such tasks using thefound data. As a first step in that direction, we added sup-port to import tables found in table search into Google Fu-sion Tables or Google Sheets. Once imported, the user canquery and visualize the data, combine it with other sourcesand export it to other tools for further manipulation.
Today, Google Tables is used by hundreds of thousands ofusers and table import is a very popular feature.
4.2 Docs and PresentationGoogle Research Tool, as part of Google Docs and Google
Presentation, is a tool that provides users a convenient wayto search for information while they are working on theirdocuments. For example, users can insert citations, links,and images into the document directly from the tool. Search-ing for tabular data turned out to be a natural new featurefor Research Tool and was requested by our users.
We integrated Google Tables into the Research Tool byincorporating table search as part of the Everything Searchtab as well as the Table Search tab, collectively called Ta-bles in Research Tool. For the Everything Search tab, whichpresents results returned by regular Google Web search, weinject a table snippet into a Web result’s summary (i.e.,snippet) if the Web result contains a high quality table that
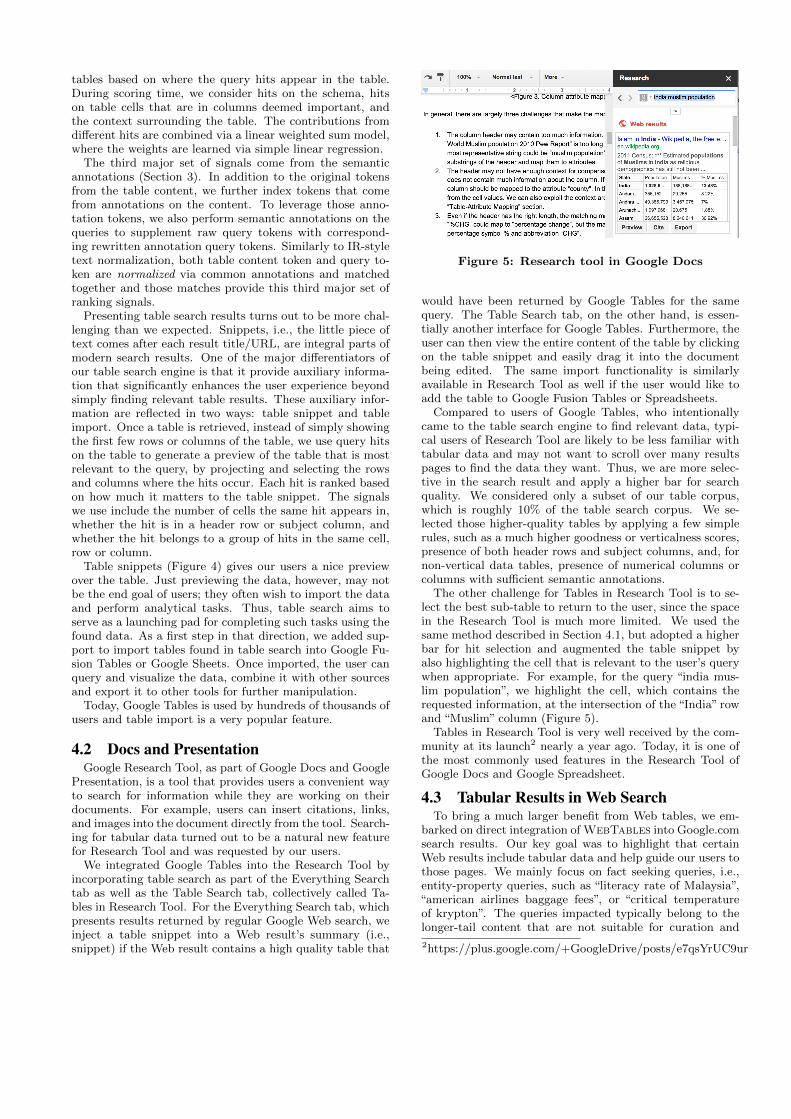
Figure 5: Research tool in Google Docs
would have been returned by Google Tables for the samequery. The Table Search tab, on the other hand, is essen-tially another interface for Google Tables. Furthermore, theuser can then view the entire content of the table by clickingon the table snippet and easily drag it into the documentbeing edited. The same import functionality is similarlyavailable in Research Tool as well if the user would like toadd the table to Google Fusion Tables or Spreadsheets.
Compared to users of Google Tables, who intentionallycame to the table search engine to find relevant data, typi-cal users of Research Tool are likely to be less familiar withtabular data and may not want to scroll over many resultspages to find the data they want. Thus, we are more selec-tive in the search result and apply a higher bar for searchquality. We considered only a subset of our table corpus,which is roughly 10% of the table search corpus. We se-lected those higher-quality tables by applying a few simplerules, such as a much higher goodness or verticalness scores,presence of both header rows and subject columns, and, fornon-vertical data tables, presence of numerical columns orcolumns with sufficient semantic annotations.
The other challenge for Tables in Research Tool is to se-lect the best sub-table to return to the user, since the spacein the Research Tool is much more limited. We used thesame method described in Section 4.1, but adopted a higherbar for hit selection and augmented the table snippet byalso highlighting the cell that is relevant to the user’s querywhen appropriate. For example, for the query “india mus-lim population”, we highlight the cell, which contains therequested information, at the intersection of the “India” rowand “Muslim” column (Figure 5).
Tables in Research Tool is very well received by the com-munity at its launch2 nearly a year ago. Today, it is one ofthe most commonly used features in the Research Tool ofGoogle Docs and Google Spreadsheet.
4.3 Tabular Results in Web SearchTo bring a much larger benefit from Web tables, we em-
barked on direct integration of WebTables into Google.comsearch results. Our key goal was to highlight that certainWeb results include tabular data and help guide our users tothose pages. We mainly focus on fact seeking queries, i.e.,entity-property queries, such as “literacy rate of Malaysia”,“american airlines baggage fees”, or “critical temperatureof krypton”. The queries impacted typically belong to thelonger-tail content that are not suitable for curation and
2https://plus.google.com/+GoogleDrive/posts/e7qsYrUC9ur

may not be stored in the KG.The integration with Google search raises multiple chal-
lenges. First, we need to identify queries that are fact seek-ing. Second, when a query is fact seeking, we need to findpages that contain relevant tables and when there are multi-ple such tables, choose which one to highlight in the result.Finally, we need to design a UI that is most effective in thelimited space.
Given a web query, when appropriate, we create a tabularsnippet on top of the search results with selected rows andcolumns from a Web table. This enables people to easilyfind pages that contain tables that are very likely to answertheir question. Currently, we examine the top few results inthe search ranking and decide whether any of them contain aWeb table that is relevant to the query. Note that restrictingto the top results already imposes a very high quality bar onthe possible tables we consider and also about the relevanceof the table to the query.
To decide whether a table is relevant, we perform a struc-tured matching between the query and tables where the en-tity in the query identifies relevant rows in the table andthe property in the query constraints the relevant columns.As an example, given a query “critical temperature of kryp-ton” and the Web table in Figure 1(a), we can potentiallymatch “krypton” to a cell in the subject column and “crit-ical temperature” to the Critical temperature column,and thus identify the table cells that are most relevant to thequery. We can then present, to the user, a subset of rows andcolumns that include those most relevant cells. Performingsuch matching with high degree of accuracy requires goodunderstanding of both the query and table. As mentionedin Section 3, Web tables schema information is inherentlyvague and we therefore consider various sources of informa-tion including page context (title, caption) to understandthe table as well as the table itself.
5. RELATED WORKThere has been a rich body of work on extracting HTML
tables from the Web, annotating their schema, and searchingWeb tables e.g., [4, 12, 3, 13, 10]. Pimplikar and Sarawagiproposed a structured search engine based on Web tableswhich returns a multi-column table in response to a queryconsisting of keywords describing each of its columns [10].They defined a query segmentation model for matching key-words to table columns, and a mechanism of exploiting con-tent overlap across table columns. Yakout et al. presentedthree core operations, namely entity augmentation by at-tribute name, entity augmentation by example and attributediscovery, that are useful for information gathering taskson a Web table corpus [13]. To achieve higher precisionand coverage, they considered indirectly matching tables aswell. Adelfio and Samet improved the schema extractiontask and proposed a classification technique based on con-ditional random fields in combination with a novel featureencoding method called logarithmic binning [3].
Several recent studies aim to respond to user queries withWeb tables or a knowledge base system. Sarawagi and Chakrabartideveloped techniques to present a ranked list of quantity dis-tributions for queries whose target is a quantity with naturalvariation [11]. Yang et al. studied how to find highly rel-evant patterns in a knowledge base for user-given keywordqueries to compose table answers [14].
6. CONCLUSIONSSince we started building the WebTables repository, we
have made significant efforts to apply WebTables in prac-tice. Table data now appears in three different products andmore is coming soon. In this paper, we discussed challengesfaced, lessons learned, and new insights that we gained.
While these applications are a great success, they alsohighlighted major areas for developments for the future.First, we aim to build an even larger corpus based on otherstructured data and implicitly structured data. Second, weneed better understanding of table semantics and query se-mantics to improve coverage.
7. REFERENCES[1] Google Knowledge Graph. http://www.google.com/
insidesearch/features/search/knowledge.html.
[2] Google Maps API.https://developers.google.com/maps/.
[3] M. D. Adelfio and H. Samet. Schema extraction fortabular data on the web. Proc. VLDB Endow.,6(6):421–432, Apr. 2013.
[4] M. J. Cafarella, A. Y. Halevy, D. Z. Wang, E. Wu,and Y. Zhang. WebTables: exploring the power oftables on the web. VLDB, 2008.
[5] C. Cortes, M. Mohri, and A. Rostamizadeh.Algorithms for learning kernels based on centeredalignment. The Journal of Machine LearningResearch, 13(1):795–828, 2012.
[6] H. Gonzalez, A. Y. Halevy, C. S. Jensen, A. Langen,J. Madhavan, R. Shapley, and W. Shen. Google fusiontables: data management, integration andcollaboration in the cloud. In SoCC, 2010.
[7] R. Gupta, A. Halevy, X. Wang, S. Whang, and F. Wu.Biperpedia: An ontology for search applications.VLDB, 2014.
[8] X. Han, L. Sun, and J. Zhao. Collective entity linkingin web text: a graph-based method. In SIGIR, pages765–774, 2011.
[9] M. A. Hearst. Automatic acquisition of hyponymsfrom large text corpora. In COLIN, 1992.
[10] R. Pimplikar and S. Sarawagi. Answering table querieson the web using column keywords. VLDB, 2012.
[11] S. Sarawagi and S. Chakrabarti. Open-domainquantity queries on web tables: Annotation, response,and consensus models. In SIGKDD, 2014.
[12] P. Venetis, A. Y. Halevy, J. Madhavan, M. Pasca,W. Shen, F. Wu, G. Miao, and C. Wu. Recoveringsemantics of tables on the web. VLDB, 2011.
[13] M. Yakout, K. Ganjam, K. Chakrabarti, andS. Chaudhuri. Infogather: entity augmentation andattribute discovery by holistic matching with webtables. In SIGMOD, 2012.
[14] M. Yang, B. Ding, S. Chaudhuri, and K. Chakrabarti.Finding patterns in a knowledge base using keywordsto compose table answers. In VLDB, 2015.


