Minimum Wage Effect on Small Businesses a presentation by Lindsey Terry.

Working Paper
437
THE EFFECT OF INFORMATION
TECHNOLOGY ON WAGE INEQUALITY:
EVIDENCE FROM INDIAN
MANUFACTURING SECTOR
Vinoj Abraham
September 2010

Working Papers can be downloaded from the
Centre’s website (www.cds.edu)

THE EFFECT OF INFORMATION TECHNOLOGY ON WAGE INEQUALITY:
EVIDENCE FROM INDIAN MANUFACTURING SECTOR
Vinoj Abraham
September 2010
I gratefully acknowledge comments of the referee. I Also thank
Prof. K.J.Joseph for his comments and suggestions. All errors and
omissions are mine.

4
ABSTRACT
A persistent widening of skill based wage inequality in the Indian
Organised Manufacturing sector has been reported by many researchers.
Two main hypotheses had been tested in developed economies to
explain such a phenomenon; an inter-sectoral shift in demand structure
and an intra-sectoral shift in production technology. A decomposition
of the change in wage share of skilled workers showed that sector bias
explained very little of the changes in the share of skilled worker wages
while more than 85 percent of the changes occurred within industries,
giving support to the argument of changing skill mix within industries,
rather than between industries. While scale effect and capital skill
complementarities do tend to give partial explanations for the increasing
share of skilled worker wage share, the most consistent and quantitatively
large explanation seems to appear from the effect of Information
Technology intensity in the production process, whatever the
specifications be. Moreover, argument of the skill biased wage inequality
is only weakly supported by mere IT adoption, but it is the intensity in
IT use that is the most dominant factor. However there is no evidence for
an enhanced effect of IT on wage shares since the signing of the ITA
agreement and the probably increased import of IT goods. Neither is
there any evidence to show that technology endowed capital goods
have had an impact on the changes in skill biased wage share during
1998-99 to 2004-05.
Key words: Skill Biased Technological Change, Wage Inequality,
Information Technology, Indian Manufacturing sector.
JEL Classification: J31, L6, O33

5
I. Introduction
A persistent widening of skill based wage inequality in the Indian
organised manufacturing sector had been reported by Berman et al
(2005), Nagaraj, (2000) and Ramaswamy (2008) among others. Between
1980-81 and 2004-05 the share of non-production workers’ wages in
the wage bill increased from 35 percent to 48 percent and the relative
wage per non-production worker, in comparison to the production worker
increased from 1.5 to 2.06 percent1. Moreover, average wage differential,
the ratio of wage rate of non-production to production workers increased
from 2:1 to 3.3 :1 during the period, indicating widening wage inequality
between the two groups. A shift did exist in the share of non-production
labour in total employment as well. Share of non-production workers
increased from 23 percent to 26 percent, conversely the share of
production workers declined from 77 to 74 percent during the period
1980-81 to 1998-992. The shift in wage share along with the changes in
share of non-production workers represents a rising demand for skilled
workers relative to less skilled workers.
The Heckshier Ohlin (H-O) theoretical predictions and their further
implications drawn by the Stopler Samuelson model argue that, based
on factor cost advantages, the labour surplus developing economies
would have comparative advantage in producing and exporting labour
intensive products, while the capital abundant developed economies
1 See Appendix table 1
2 However, the share of non-production workers declined from 26 to 23percent during the period 1998-99 to 2004-05.
6
would have comparative advantage in producing and exporting capital
intensive products. In turn, since production technology of labour
intensive products generate demand for less skilled labour, the relative
wages of less skilled workers in the developing economies would
increase, and in the developed economies the relative demand and
thereby wages for skilled workers would increase.
However, contrary to the H-O trade theoretic predictions of rising
relative demand for sector specific unskilled or less skilled employment
in developing economies empirical evidences suggest a globally
pervasive skill bias in the earnings and employment composition
(Berman and Machin 2000, Acemoglu 1998). Many economies, both
from the developed and developing world, experience a rise in skill
demand expressed as skill bias in the earnings and employment (Berman
et al, 1998).
Prominent studies about the developed economies argued that
technological change in the production and distribution processes have
led to a rising demand, and hence rising relative wages for skilled
workers. The phenomenon being termed as Skill Biased Technological
Change (SBTC) (Berman, Bound and Griliches, 1994., Autor,Katz and
Krueger, 1998., Berman, Bound and Machin, 1998). One of the major
arguments for this SBTC revolves around the changes in production
process and organizational changes stimulated by the adoption and use
of new Information and Communications Technologies (ICT) (Acemoglu,
1998; Autor, Katz and Krueger 1998; Card, Kramarz, .Lemeieux 1997;
Doms, Dunne and Troske 1997). Studies report that the steady decline
in the rental price of computers had led to rapid substitution of this
equipment for other inputs in the US economy. The substitution was, by
and large, skill biased, i.e. ,IT acted as a substitute for unskilled labour
and a complement to the skilled labour (Card, Kramarz and Lemieux
1997; Doms, Dunne and Trotske 1997; Berman 2000; Autor, Katz and
Krueger 1998).

7
The rising demand for skilled workers also started showing up on
the wages as well. The wage differential between the skilled and the less
skilled was high and increasing. Based on the Current Population Survey
of the U.S. for 1984 and 1989, Krueger (1993) relates the relation between
computer use and wages. His study showed that computer users received
a premium of approximately 20 per cent, which was also found increasing
over time. Cross-sectional studies done by Doms, Dunne and Troske
(1997) also report that plants that use a large number of technologies
paid higher wages. Autor, Katz and Krueger (1998) again provide
evidence to the argument that the use of computer has led to higher
wage levels. Using four digit datasets of NBER productivity database
the authors have argued that the within-industry wage differentials
between computer users and non-users have widened. Investment in
computer alone would seem to account for between one quarter to one
half of the within industry move away from production labour that
occurred during 80s. They conclude their study as
“…Skill-biased technological and organisational
changes that accompanied the computer revolution
appear to have contributed to faster growth in relative
skill demand within detailed industries starting in the
1970s. Although the strong observed conditional
correlations of computer measures and the growth in the
relative utilisation of highly educated workers may not
just reflect causal relationships, it seems clear that
whatever is driving the rapid rate of within industry skill
upgrading over the past few decades is concentrated in
the most computer-intensive sectors of the U. S. economy.”
In the developing economies, however it is argued that
endogenous technological change is feeble. On the other hand, it is
argued that technological change gets transmitted through the import
of technology embodied capital and intermediate goods by the

8
developing economies. Pavcnik (2002) and Attanasio et al (2004)
provide evidence for skill upgradation due to imported technology
adoption and trade in Chile and Columbia respectively. Berman et al
(2005) also argue that technology embodied within capital is a major
source of skill biased wage inequality in India. Since the liberalization
of the economy the trade openness may have attracted greater imports
of technology embodied capital. However, they do find that international
trade per se has no effect on the phenomenon. Ramaswamy (2008) also
argues that in the case of India capital skill complementarities are
becoming strong since trade liberalization in the economy. He posits
that probably technology embodied within imported capital is the causal
factor for this phenomenon. But while the Berman et.al (2005) paper
argues that there are sectoral differences in skill bias between U.S and
Middle Income countries and India and the Ramaswamy (2008) invokes
the increasing trend in capital imports as a probable reason for skill bias,
both these studies do not put forward a direct measure of technology, to
support their argument.
This paper specifically contributes to the literature on Skill Biased
Technological Change (SBTC) in India by utilizing a direct measure of
technology, in this case that of Information Technology. Given that IT
diffusion in the organized manufacturing sector has been rising at a fast
pace in India (Joseph and Abraham, 2005) it would be appropriate to
look into its effect on rising wage inequality. The results of the study
show that intensity in IT use explains a substantial share of the change
in wage inequality. Further, capital skill complimentarity becomes very
weak once the effect of IT is separated out.
The second section provides the analytical back ground to the
study. Section three gives the Data Sources and Scope of the Study. An
exercise on wage inequality decomposition is described in Section four.
The trends and patterns in skill intensity, wage differentials and trends
in IT adoption and use in India are discussed in Section Five. The

9
following section analyses the empirical relation between wage
differentials and the adoption and use of Information Technology in
India. Finally, the conclusions are presented in the last section.
II. Analytical Background
The increase in aggregate wage shares of skilled workers can be
analytically conceived to have two parts: one, the sector-specific increase
in total wage payment that normally have a high share of skilled worker
wages and two; a skill-specific increase in the wage share within
industries. The approach as suggested by Berman, Bound and Grilichez
(1994) is to decompose the change in the share of the wage bill share of
the skilled workers into ‘between’ industry share and ‘within’ industry
share, as expressed in equation (1). The ‘between’ industry would
account for ‘sector biasness’ and within industry would account for
‘skill biasness’. The decomposition equation is as follows:
(1)
Where Sn is the wage bill share of industry i… The within industry
component of skill upgrading is represented by the first term in the RHS.
P bar is a weight of the relative size of the industry, averaged across time,
in this case the size of employment. The second term in RHS estimates
contribution of ‘between’ industry shifts, wherein the changes in the size
of the industry’s employment, P , over time , keeping the ‘within’ industry
skill component averaged over time is estimated. A markedly higher share
of contribution of the second term, the ‘within’ industry component would
qualify the rise in wage inequality to be skill biased.
Further, this ‘within’ industry changes in skilled worker wage share
is analysed to explore the relation attributable to technological change
that affects the production process. A framework for the analysis of
factors that these changes in skilled worker wage share as suggested by
Berman, Bound and Grilichez (1994) is based on a quasi fixed cost
function of labour demand.

10
Consider the quasi fixed cost function:
C= f(K, Ws, Wu, Q) (2)
where Ws and Wu are the prices of variable inputs: skilled and
unskilled labour, Q is output and K is capital which is fixed.
The above cost function is used to derive equations for shares of
skilled and unskilled labour payment in total factor payments for all
variable factors assuming that some of the inputs are fixed and quantities
of variable inputs are chosen to minimize costs.
Assuming the above cost function takes the Translog form the
first order condition gives the cost share equation for each factor. After
imposing the symmetry and homogeneity restrictions only one of the
equations need to be estimated. By taking the first difference of the
resulting equation we arrive at the following change in skilled-workers
wage bill share equation
Where Sn = share of wage of skilled workers, subscript i. represent
the ith industry and t represent tth time period.
Capital – skill complimentarity implies β > 0.The technology
embodied capital raises the demand for skill, which gets reflected in
skilled worker wage share. α represents the cross industry average bias
in technological change. Constant returns to scale imply γ =0 , though
γ > 0 denotes short term cyclical fluctuations in skilled wage share. The
effect of relative wages on share of skilled wage share is captured by δ.
However, given that the ratio of wage rates may be endogenous to the
equation this term is dropped. The changes in wage rate are confounded
by skill upgrading and quality improvements. On the assumption that
the ratio of price of quality adjusted production and non-production
labour is constant, leaving the term from the system will not affect the

11
quality of the other coefficients, except for the constant (Berman, Bound
and Griliches, 1994).
The above equation, while captures the capital
complimentarity of share of skilled worker wages the argument of
technological change being an important factor for this skill bias is
brought in indirectly, through the assumption of technology embodied
capital. A direct measure warrants that indicators of technological change
are plugged in along with the above equation. Studies conducted
previously provide evidence that IT explained a large share of skill bias
in the developed economies (see Section 1). Taking cue from the
literature on developed economies we extend the equation to add a
term, ITPW, as an indicator for IT to test for the skill bias nature of IT. We
use two alternate indicators, IT adoption rate and the IT investment per
worker. While IT adoption rate captures the incidence of IT use, IT
investment per worker indicates the intensity of IT use. Φ > 0 indicates
that indicators of IT have a positive effect on share of skilled worker
wage.
Since the data takes a panel structure year dummies are added to
control for time specific shocks and industry dummies are added to
control for unobserved heterogeneity across observations. These
additions make the estimating equation (4) as follows.
(4)
Where ITPW indicates IT investment per worker, and alternatively
IT adoption rate, measured as the proportion of operating units using IT.
The variable Y is the year dummy, IND is the industry dummy, and ψ
and η are their coefficients respectively . ξ is the error term.
Following the literature on Skill enhancing trade hypothesis
(Robbins, 1996; Pavcnik 2002, Attanasio et al 2004) we augment the
above equation with two trade variables, namely export intensity and
import intensity. The import of technology endowed capital that is skill

12
biased can enhance wage inequality due to rise in demand for skilled
labour. Since developing economies are ‘technology followers’, the
import of technology endowed capital by developing economies could
cause widening skill based wage inequality, to the extent that such
import occurs within industry rather than being sector specific. Export
could also be skill enhancing in nature due to the re-export, from
developing economies, of ‘outsourced’ intermediate goods from
developed economies ( Feenstra and Hanson, 1996, 2001). Typically
the lower technology, low value added and labour intensive part of the
value chain is outsourced to developing economies for further
processing. However, even these low ends of the value chain maintain a
higher technology level than the domestic levels, thus creating the skill
bias. Moreover, the threat of import competition and export
competitiveness brings in greater use of technology and the related
skill bias. Thus it is expected that both the trade coefficients ρ for import
intensity and ω for export intensity would bear positive signs.
Finally, the effect of labour market rigidity in Indian
manufacturing sector is also expected to have a positive effect on skill
bias. Labour market rigidity has prompted subcontracting of work
(Ramaswamy,1998) in the manufacturing sector. The sub contracted
parts of the value chain, as mentioned earlier, are low end while the
higher end of the value chain, which are more technology intensive
remain within the firm. This is another source of skill bias. Thus we
expect υ, the coefficient for the indicator for labour market rigidity to
have a positive sign.
Thus, the augmented estimating equation is as follows
(5)
where I/Q is import intensity measured as total imports as a ratio
of gross value added; X/Q is export intensity measured as total exports
as a ratio of gross value added; LABREG is an indicator for labour
13
market rigidity measured as the number of mandays lost due to strikes
and lock outs per worker; ρ, ω and ν are coefficients to be estimated.
The analysis is done at three digit level aggregation for the period
1998-99 to 2004-05. The choice of period has been constrained by the
availability of data for IT investment. The estimations are based on OLS
regressions, reporting panel corrected standard errors. All estimations are
weighted by the share of wages of the i’th industry in total manufacturing
sector. These weights would give greater importance to industries with larger
wage payment, and lesser importance to industries with lesser wage payment.
III. Data Sources and Scope of the Study
The Annual Survey of Industries (ASI) conducted by Central
Statistical Organisation of India (CSO) publishes data for all important
characteristics of manufacturing sector at three digit level of National
Industrial Classification, which includes measures of output, capital,
wages to production and non-production workers and number of
production and non-production workers. This is the main source of data
used in the present study. The ASI reports the figures in current prices.
The Wholesale Price Index (WPI) has been utilized to deflate the values
to constant prices at 1993-94 prices3. We have deflated the prices by
using the appropriate commodity price index at the three digit NIC
(NIC 1998) classification of industries to arrive at the constant prices.
There is no appropriate commodity classification for NIC classification
number 371, 372. Hence we have used the WPI for total manufacturing
sector in these two industries. Gross Value Added as reported in ASI,
deflated using the Wholesale Price Index at 93-494 prices is taken to be
the Output. Fixed assets as reported in ASI deflated using the WPI for
plant and machinery is the indicator for capital. The nominal wages
reported in the ASI is deflated using the Consumer Price Index for
Industrial Workers for the respective years to arrive at real wages.
3 The WPI series for commodities is available at www. eaindustry.nic.in.

14
The ASI has added a query on IT since 1998-99, viz., the total
amount of investment in computer hardware and software by the firms.
Though this data is not available in the published reports of CSO this is
available on request. The data thus obtained was merged with the readily
available other variables from ASI at three digit levels. Since the IT data
is available only from 1998-99 the analysis in the paper is limited to the
period 1998-99 to 2004-05, the latest period for which ASI data has
been published. Computer investment was deflated using the WPI index
at 1993-94 prices to arrive at constant prices.
The data for imports and exports were obtained from the World
Integrated Trade System (WITS) database of UNCTAD. Both of these
variables were deflated using the WPI at 93-94 prices. Mandays lost
due to disputes were obtained from the ‘Pocketbook of Labour
Statisitics” published by Labour Bureau, Shimla of the Government
of India.
IV. Wage Inequality Decomposition
The percent annual change in the share of wages to the skilled
workers in total emoluments had been increasing since liberalization of
the Indian economy in 1990s. While the increase during the period
1990-98 was at 0.37 percent per annum during the period 1998-99 to
2004-05 was even higher at 0.49 percent per annum, indicating that not
only is there wage inequality, but also there is an acceleration in its
pace. On the other hand during the pre liberalisation period 1984-89
there was a decline in the share of wages to skilled workers declining
annually at -0.23 percent. Thus skill biased wage inequality had become
a noticeable phenomenon during the post liberalization period while
the period before liberalisation had reduced such inequalities. This wage
inequality measure is further supplemented by another measure of wage
inequality, percent change in the ratio of wages per skilled worker to
wages per less skilled worker. The change in this ratio also had
continuously increased from 0.26 to 1.07 to 1.69 during the three periods
mentioned above.

15
The decomposition of the wage share of skilled workers
according to equation (1) yields the result in row 2 of Table 1. It shows
that in all the three periods an overwhelming majority of the annual
change was ‘within’ industries while only a small minority occurred
‘between’ industries. During 1990-98, 90 percent of the changes in wage
share was within industries, while during 98-99 to 2004-05 , 97 percent
of the changes was within industries. This decomposition brings out the
‘within’ industry skilled biased changes in wage share allowing us to
follow the hypotheses of technological change and capital skill
complementarities within industries.
Table 1: Decomposition of Employment and Wage share “Within”Industries.
1984-89 1990-98 98-99 to 04-05
% annual change in share ofwages to the skilled workers in total emoluments -0.230 0.370 0.490
% of within Industry in annualchange in share of wages to theskilled workers in totalemoluments 175.310 89.450 96.55
Ratio of wages per skilledworker to wages per less skilled
worker 0.260 1.070 1.687
Note : The figures for 1984-89 and 1990-98 are taken from Berman,Somanathan and Tan (2005) The figures for period 98-99 to
04-05 are own calculations
V. Trends and patterns of IT adoption and use, Skill Intensity andWage Differentials
Skill Intensity and Wage Inequality: The average annual
employment in the organized manufacturing sector of India had declined

16
at the rate of 0.23 Lakh employees per annum during the period 1998-
99 to 2004-05. The declining trend in employment is also visible in the
standardized measure, employment per unit of output which declined at
the rate of -0.008 employees during the period. Skill intensity, measured
as the ratio of managerial and supervisory employees to total employees,
had in fact declined from 28.3 percent to 25.7 percent during this period4.
Yet the ratio of unskilled worker to skilled worker cost, a measure of the
wage differential, had decreased from 47 percent to 37 percent, at the rate
of -0.015 units(See Fig 1, Table 2), implying widening wage differentials
between the skilled workers and the less skilled workers. It is also to be
noted that the annual average change in inter-industry coefficient of
variation had been negative for both skill intensity and relative less
skilled worker to skilled worker cost, implying that the skill based
changes in employment and wages are increasingly becoming ‘within’
industry phenomenon rather than ‘between’ industry phenomenon.
4 It is true the number of skilled workers also declined. But, the share ofwages in total emoluments has increased. This in effect points to a rise inoverall demand for skilled workers. Surely, some frictional displacement isbound to happen at all levels due to technological change. But then as acategory the skilled workers overall demand is higher. It is possible that dueto the technological change even some skilled workers unequipped to workwith new technologies may become redundant, but the replacement may bea more skilled worker, who may be not only replacing floor workers alone,but also some skill-inflexible non-production workers as well.
Figure 1 : Share of Skilled Worker Wages in Total Wage Bill
17
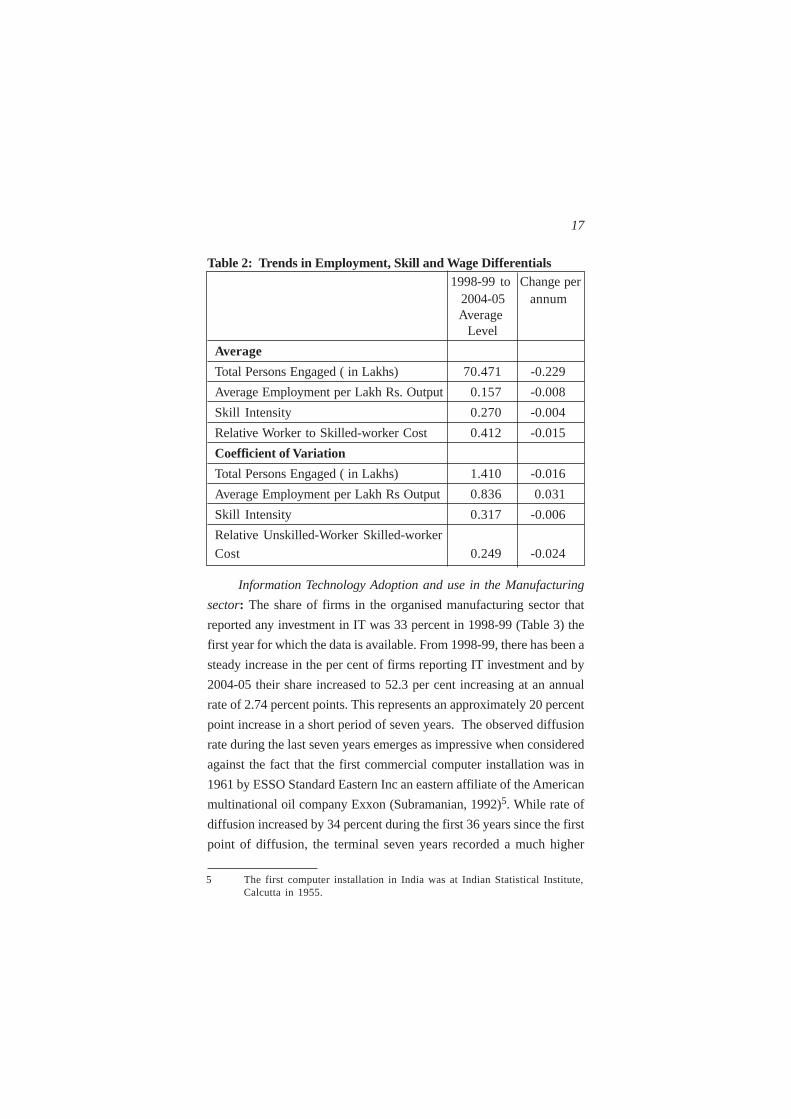
Table 2: Trends in Employment, Skill and Wage Differentials 1998-99 to Change per
2004-05 annumAverage Level
Average
Total Persons Engaged ( in Lakhs) 70.471 -0.229
Average Employment per Lakh Rs. Output 0.157 -0.008
Skill Intensity 0.270 -0.004
Relative Worker to Skilled-worker Cost 0.412 -0.015
Coefficient of Variation
Total Persons Engaged ( in Lakhs) 1.410 -0.016
Average Employment per Lakh Rs Output 0.836 0.031
Skill Intensity 0.317 -0.006
Relative Unskilled-Worker Skilled-worker
Cost 0.249 -0.024
Information Technology Adoption and use in the Manufacturing
sector: The share of firms in the organised manufacturing sector that
reported any investment in IT was 33 percent in 1998-99 (Table 3) the
first year for which the data is available. From 1998-99, there has been a
steady increase in the per cent of firms reporting IT investment and by
2004-05 their share increased to 52.3 per cent increasing at an annual
rate of 2.74 percent points. This represents an approximately 20 percent
point increase in a short period of seven years. The observed diffusion
rate during the last seven years emerges as impressive when considered
against the fact that the first commercial computer installation was in
1961 by ESSO Standard Eastern Inc an eastern affiliate of the American
multinational oil company Exxon (Subramanian, 1992)5. While rate of
diffusion increased by 34 percent during the first 36 years since the first
point of diffusion, the terminal seven years recorded a much higher
5 The first computer installation in India was at Indian Statistical Institute,Calcutta in 1955.

18
diffusion rate of 20 per cent. The IT investment per worker also increased
from Rs. 2681 in 1998-99 to Rs. 5475 increasing annually at Rs. 399 per
worker. Inter-industry variation in IT adoption does exist but the
variation has been continuously declining over years as is evident from
the estimated values of the coefficient of variation (CV), from 0.41 in
1998-99 to 0.27 in 2004-05 declining annually by -0.020. This trend,
along with the rise in average IT adoption rates, points to the fact the IT
adoption is increasing over the years and the inter industry variations
are declining. However the inter industry variation in IT investment per
worker was increasing, albeit gradually.
Table 3: Indicators of IT Diffusion in Indian Manufacturing Sector
1998-99 1998-99 to 1998-052004-05 change per
Level Average annum
IT Adoption Rate (%) 33.10 43.18 2.74
Inter-industry CV in IT Adoption 0.41 0.32 -0.020
IT investment per Worker (in Rs) 2680.68 4418.83 399.11
Inter-industry CV in IT per Worker 1.205 1.253 0.011
IT, Skill Intensity and Wage Inequality: The relation between IT
adoption, skill intensity and wage differentials is expressed in Table 4.
As is evident from the table below, the skill intensity levels marks a
secular increase along with the increase in adoption rates, from 18 percent
at the lowest class of adoption to 36 percent at the highest class. The
average salary share of skilled workers, an indicator for wage inequality,
increased from 33 percent to 58 percent. The ratio of average wage of
less skilled worker per less skilled worker, another indicator for wage
inequality, declined from 44 percent to 40 percent as the level of IT
adoption increased. Results are very similar when we take up IT
investment per worker as the classificatory variable instead of IT adoption
(Table 5). Here too we find that there is a linear relation for IT investment
per worker with skill intensity, wage share of skilled workers, though

19
there are some mixed trends for proportion of less skilled worker wages
to skilled worker wages. These results do tend to suggest an association
between skill biasness and IT use in the manufacturing sector.
Table 4: IT Adoption, Skill Intensity and Wage Inequality
IT Adoption Skill Intensity Average Salary Less skilledRate Levels share of skilled worker to Skilled
(in per cent) workers worker wage ratio
Less than 20 0.180 0.33 0.440
20-40 0.231 0.41 0.432
40-60 0.258 0.45 0.422
60-80 0.303 0.53 0.387
above 80 0.357 0.58 0.401
Table 5: IT Investment per Employee, Skill Intensity and WageInequality
IT investment Skill Intensity Average Salary Less skilledper employee Levels share of skilled worker to Skilled
workers worker wage ratio
Less than Rs 1500 0.206 0.38 0.416
1500 to 3000 0.255 0.45 0.425
3000 to 4500 0.303 0.50 0.426
4500 to 6000 0.313 0.53 0.395
above 6000 0.348 0.58 0.384
VI. Empirical Estimation Results
Long period time differenced OLS regression estimates are reported
in Table 6. From Column 2 of Table 6 the positive and highly significant
constant denotes the positive change in the share of skilled worker
wages. The size of the constant, after converting to percent, 0.39 is
nearly 80 percent of the total annual change in skilled wage share, at
0.49 percent (see Table 1 on wage difference decomposition). Thus

20
while the sector is experiencing a rise in wage share of skilled workers ,
only 20 percent of this change get explained away due to changes in
output and capital output ratio, the two prominent culprits in skill biased
changes in wage share. Even this 20 percent change may not speak of
much as both these variables are not statistically significant. However,
the addition of the technology variable, namely, the IT investment per
employee, adds a lot to the explanation of Skill biased changes. The
variable is added in the model expressed in column (3). The change in
IT investment per employee has a positive and significant effect on
change in the share of skilled worker wages. In this estimation the size
of the constant declined from 0.39 percent to 0.08 percent. Now, the
constant consisted of only 16 percent of the total change in share of
skilled worker wages. On the other hand, the addition of the IT investment
per worker accounted for 63 percent ((0.39-0.08)/0.49) of the change in
the share of skilled worker wage share. The R-square also improves from
3 percent to 15 percent in the equation. Adding the alternative indicator
of the same technology variable namely IT adoption rate, however, does
not turn out to be significant though the sign is positive. One could
interpret this as that mere adoption of IT need not create the noticed
skill biasness, but what matters is the intensity of IT use, which is
expressed in IT investment per employee.
The column (5) gives the estimated coefficients of Equation 5.
The perceived effect of trade are not visible in this study. Both the
variables on import intensity and export intensity are not statistically
different from zero. The other important variable suspected to have an
impact on skill bias, namely labour market rigidities also does not show
any significant effect on skill biasness.
Time differencing techniques was applied to two shorter periods
and their pooled data as well. The data was analyzed for the two periods
1998-99 to 2001-02 and 2002-03 to 2004-05 (See Table 7). Such a
classification has two purposes. One, it would allow to look into inter-

21Ta
ble
6:
Lon
g T
ime
Dif
fere
ncin
g –
2005
-199
8 (1)
(2)
(3)
(4)
(5)
Δ lo
g G
VA
0.01
40(0
.91)
0.02
47(1
.10)
0.02
35(1
.24)
0.02
76(1
.24)
0.01
96(0
.84)
Δ lo
g ca
pita
l GV
A r
atio
0.01
50(0
.72)
0.02
38(1
.20)
0.01
54(0
.76)
0.02
08(1
.01)
Δ l
og I
T i
nves
tmen
t pe
r em
ploy
ee0.
0351
**0.
0401
**(2
.36)
(2.4
4)
Δ l
og i
mpo
rt i
nten
sity
-0.0
066(
0.83
)
Δ l
og e
xpor
t in
tens
ity0.
0027
(0.2
5)
Δ l
og I
T a
dopt
ion
rate
0.02
70(0
.85)
Δ l
og l
abou
r ri
gidi
ty0.
0008
(0.2
8)
Con
stan
t0.
0039
***
0.00
39**
*0.
0008
0.00
200.
0009
(3.9
1)(3
.68)
(0.4
5)(0
.88)
(0.3
1)
Obs
erva
tion
s58
5858
5853
R-s
quar
ed0.
020.
030.
160.
040.
20
R -
squa
red
0.01
910.
0304
0.15
820.
0395
0.20
12
F te
st0.
8241
0.62
332.
5868
0.70
731.
5300
prob
>F
0.36
790.
5399
0.06
250.
5518
0.18
97
Rob
ust
t st
atis
tics
in p
aren
thes
es*s
igni
fica
nt a
t 10
%;
** s
igni
fica
nt a
t 5%
; **
* si
gnif
ican
t at
1%

22
temporal variations in the impact of these variables on skilled worker
wage share. Secondly, it also allows one to capture the effect of the
Information Technology Agreement (ITA) of the WTO, of which India
is a signatory. The ITA came into effect in 2000 and since then India
had been steadily reducing its import tariffs on IT goods. It can be
expected that the cheaper importation of IT goods would increase the
adoption and use of IT. Expecting a structural break in the impact of IT
use with a time lag of two years, we analyse the data for both the
periods. Then we pool the data along with a year dummy for structural
break in the data.
The technology variable, IT per worker continues to be positive
and highly significant. As expected, IT investment per employee has a
statistically significant positive coefficient, implying that IT investment
per employee does play a significant role in wage inequality in the
manufacturing sector.
The addition of year dummy in the pooled estimation in the first
estimation ( column (7)) shows that the change in the share of skilled
worker wages after controlling for the three variables, Real GVA, KY
ratio and IT per worker, was equal in both the periods at 0.17 percent per
annum. Thus the combined explanatory power of these three variables
was not different between the two periods. The size of the constant and
year dummy together was 0.34 percent. The addition of the variable IT
adoption rate in Column(8) showed that the effect of the year dummy
was higher in the second period, rejecting the argument that ITA had
enhanced the effect of IT use and adoption on skill biasness. Both
specifications in column(7) and (8) shows that real GVA , capital output
ratio and IT are statistically significant and positive.
Both the trade variables, Import intensity and Export intensity
takes negative values in all specifications, though only export intensity
is statistically significant. This is understandable, given that exports
from developing economies have their comparative advantage in labour

23
intensive low technology based goods. The presence of these variables
reduces the size and significance levels of both the variables on output
and capital output ratio.
The positive and significant coefficient of change in capital output
ratio in both the periods Column (1) of Table below shows the existence
of capital skill complimentarity. However, when one compares between
the two periods the estimation of Equation 5 in the first period explains
a much larger share of change in the skilled worker wage share than in
the second period. This is observable from the constants for the two
estimations in columns (1) and (4), wherein much of the change in
skilled worker remain unexplained and get accounted in the constant in
the second period ( .0042), in the first period the constant is much
smaller ( .0007) suggesting larger portion of the explanation by the
explanatory variables. In the second period IT investment per employee
does not turn out to be a significant variable though the sign remain
positive. Moreover, in the specification with IT adoption rate as
independent variable instead of IT investment this variable turns to be
significant.
To test the robustness of the results obtained from the time
differencing techniques we further analysed the same data using fixed
effects model(Table 8). Instead of long time differencing, we employ
year to year changes for the analysis. In the model year dummies are
added. Column (1) and (2) reports results from Fixed effects model.
Over all the fixed effects model has statistically significant levels of F
statistic. In the estimated fixed effects model both change in IT adoption
rate and change in IT investment intensity, along with change in gross
value added had a positive effect on wage inequality. This gives
further credence to the skill biasing properties of the IT use in the
manufacturing sector. Size of the industry also turns out significant
and positive across all models.

24Ta
ble
7: S
hort
Tim
e D
iffe
renc
ing
Reg
ress
ions
19
98
-20
02
20
03
-20
05
P
oole
d 19
98-2
002/
2003
-200
5
(0)
(1)
(2)
(3)
(4)
(5)
(6)
(7)
(8)
(9)
Δ l
og G
VA
0.0
32
10
.02
18
0.0
13
30
.02
68
0.0
40
60
.01
54
0.0
25
9*
*0
.02
86
**
0.0
13
1(1
.63
)(0
.98
)(0
.54
)(0
.94
)(1
.49
)(0
.50
)(2
.10
)(2
.42
)(0
.90
)Δ
log
cap
ital
GV
A r
atio
0.0
46
0*
0.0
42
60
.03
89
0.0
40
1*
0.0
35
4*
0.0
44
9*
0.0
43
7*
*0
.03
83
**
0.0
40
2(1
.82
)(1
.59
)(1
.36
)(1
.93
)(1
.81
)(1
.73
)(2
.43
)(2
.01
)(1
.35
)
Δ l
og I
T i
nves
tmen
t0
.02
48
**
0.0
24
8*
*0
.00
55
0.0
10
10
.01
74
**
*0.
0187
***
per
em
ploy
ee(2
.15
)(2
.14
)(0
.43
)(0
.76
)(3
.39
)(5
.98
)Δ
lo
g IT
ado
ptio
n ra
te0
.02
47
0.0
88
8*
0.0
47
3*
*(0
.84
)(1
.87
)(2
.00
)Δ
log
exp
ort
inte
nsit
y-0
.01
65
-0.0
11
0*
*0.
0134
***
(1.5
9)
(2.1
6)
-(6
.55
)Δ
log
im
port
int
ensi
ty-0
.00
18
-0.0
11
30
.00
15
(1.4
5)
(1.4
4)
-(0
.67
)Δ
log
lab
our
rigi
dity
0.0
02
5-0
.00
46
0.0
00
6(0
.87
)(1
.26
)-(
0.4
0)
Con
stan
t0
.00
07
0.0
02
60
.00
29
0.0
04
2*
*0
.00
06
0.0
06
2*
**
0.0
01
7*
*0
.00
11
0.00
35**
*(0
.36
)(1
.05
)(1
.18
)(2
.19
)(0
.27
)(2
.95
)(2
.46
)(0
.67
)(1
0.4
6)
Yea
r du
mm
y0
.00
17
**
0.0
01
80.
0009
***
(2.3
8)
(1.1
4)
(2.7
9)
Obs
erva
tion
s5
85
85
25
85
85
51
16
11
61
07
R –
squa
red
0.1
63
90
.06
44
0.1
88
20
.04
99
0.1
08
10
.15
74
0.0
97
60
.07
25
0.1
24
0F
test
4.1
12
01
.03
04
2.5
15
91
.50
84
2.0
97
72
.85
96
31
.95
40
16
.26
29
39
.35
48
prob
>F
0.0
10
60
.38
65
0.0
34
80
.22
28
0.1
11
30
.01
84
0.0
00
00
.00
10
0.0
00
0
Rob
ust
t st
atis
tics
in
pare
nthe
ses
* si
gnif
ican
t at
10%
; **
sig
nifi
cant
at
5%;
***
sign
ific
ant
at 1
%

25
Table 8: Wage Inequality: Fixed Effects Estimations
Fixed Effects
(1) (2)
Δ log GVA 0.0365*** 0.0438***(3.75) (4.54)
Δ log capital GVA ratio 0.0079 0.0136(0.88) (1.52)
Δ log IT investment per employee 0.0143***(3.79)
Δ log IT adoption rate 0.0319**(2.04)
Δ log import intensity 0.0004 0.0004(0.31) (0.30)
Δ log export intensity 0.0035 0.0042(0.71) (0.84)
Δ log labour rigidity 0.0015 0.0026(0.86) (1.41)
Year Dummy Yes Yes
Constant -0.0070 -0.0045(1.27) (0.80)
Observations 322 270
Number of NIC 54 54
R –squared 0.1688 0.1363
F test 7.4043 5.5183
prob>F 0.0000 0.0000
Absolute value of t statistics in parentheses
* significant at 10%; ** significant at 5%; *** significant at 1%
VII Conclusion
The rise in the proportion of skilled workers and their wages in
the Indian manufacturing in the nineties has been a matter of concern,
which reflected the world wide patterns. The two main suspects in such
changes usually are change in demand structure and change in

26
production technology. The first one brings about a sectoral shift
between industries and the second one brings a skill biased shift within
industries.
The case of Indian manufacturing sector, coinciding with
investment and trade liberalization had raised the apprehension that
sectoral shifts in trade composition of India, post liberalisation, had
created sector biased demand for skilled workers. The other route to
affect skill mix was through technological change within industries,
which could be through importation of technology embodied foreign
capital or use of such capital locally purchased. A decomposition of the
change in wage share of skilled workers showed that sector bias
explained very little of the changes in the share of skilled worker wages.
In fact more than 85 percent of the changes occurred within industries,
giving support to the argument of changing skill mix within industries,
rather than between industries.
The analysis brings out the importance of biased technological
change in explaining the increase in skilled worker wage share in the
Indian manufacturing. While scale effect and capital skill
complementarities do tend to suggest explanations for the increasing
share of skilled worker wage share, the most consistent and quantitatively
large explanation seem to appear from Information Technology, whatever
the specifications be. However there is no evidence for an enhanced
effect of IT on wage shares since the signing of the ITA agreement and
the probably increased import of IT goods. Neither there is any evidence
that capital goods have had an impact on the changes in skill biased
wage share, once the effect of IT is controlled for. Thus while IT does
seem to explain skill biased factor demand and ensuing wage inequality,
the role of trade either as an exogenous factor or as a technology
transmitting agent is negligible.
Labour market rigidities have little to contribute towards
explaining the skill biased wage share, while export intensity seem to
27
also contribute towards the phenomenon of skill biased wage share
changes. The negative signs of the trade variables in the estimation
support the H-O hypothesis of negative effect of trade on skill enhancing
in trade by developing economies.
Vinoj Abraham is Assistant Professor at the Centrefor Development Studies, Thiruvananthapuram. Hisresearch interests include Labour Economics,Economics of Technology and Innovation,Structural Transformation of Economies,Development Economics and RegionalDevelopment.
Email: [email protected]

28
Appendix
Table 1: Employment and Wage of Non-production Workers
Year Share of Share of Average Average Ratio ofnon- non- Annual Annual wage of
production production wage of wage of non-workers in workers non- production production
total wages in production worker worker to employment total wage worker (Rs. lakh) production
bill (Rs. lakh) worker
1981-82 21.72 35.17 0.14 0.07 1.98
1982-83 23.34 36.02 0.17 0.08 2.09
1983-84 22.30 35.77 0.20 0.10 2.06
1984-85 22.90 36.61 0.22 0.11 1.98
1985-86 21.91 36.00 0.24 0.12 1.98
1986-87 23.04 36.17 0.27 0.14 2.01
1987-88 22.86 36.56 0.30 0.15 2.03
1988-89 22.87 34.56 0.32 0.17 1.85
1989-90 23.00 35.92 0.36 0.19 1.95
1990-91 23.32 35.92 0.40 0.21 1.91
1991-92 24.31 35.23 0.38 0.22 1.77
1992-93 24.85 38.93 0.52 0.25 2.06
1993-94 24.99 38.56 0.53 0.27 2.01
1994-95 24.23 37.70 0.62 0.32 1.98
1995-96 25.11 38.00 0.71 0.37 1.94
1996-97 24.16 42.77 0.89 0.37 2.40
1997-98 - 43.13 0.96 0.39 2.47
1998-99 - 44.37 0.89 0.39 2.28
1999-00 23.31 45.02 1.08 0.42 2.57
2000-01 22.93 45.44 1.29 0.45 2.87
2001-02 22.82 46.26 1.37 0.46 2.97
2002-03 22.00 46.17 1.49 0.48 3.09
2003-04 22.28 47.76 1.62 0.50 3.24
2004-05 21.59 47.78 1.72 0.51 3.38

29
Table 2: Inter Industry Variations in Skill Intensity and WageDifferentials
NIC Skill Worker_2 DIGIT Intensity skilled
1998 worker WageRatio
Food Products and Beverages 15 0.257 0.413Tobacco Products 16 0.053 0.212Textiles 17 0.174 0.392Wearing Apparel Dressing andDyeing of Fur 18 0.151 0.331Tanning and Dressing of LeatherLuggage 19 0.179 0.344Wood and Products of Wood 20 0.237 0.551Paper and Paper Products 21 0.222 0.408Publishing, Printing andReproduction etc 22 0.392 0.429Coke, Petroleum Products andNuclear Fuel 23 0.260 0.494Chemicals and Products 24 0.294 0.388Rubber and Plastic Products 25 0.258 0.388Other Non-Metallic Mineral Products 26 0.198 0.345Basic Metals 27 0.253 0.457Fabricated Metal Products,Except Machinery 28 0.263 0.395Machinery and Equipments N.E.C 29 0.339 0.481Office, Accounting and ComputingMachinery 30 0.420 0.286Electrical Machinery and ApparatusN.E.C. 31 0.298 0.408Radio, TV & Communication Eqpts& Apparatus 32 0.355 0.336Medical & Optical Instr’s,Watches and Clocks 33 0.317 0.370Motor Vehicles, Trailers and Semi-Trailers 34 0.253 0.436Other Transport Equipment 35 0.290 0.476Furniture; Manufacturing N.E.C. 36 0.247 0.486
Total 0.270 0.411

30
Table 3: IT Diffusion as 2 digit level of aggregation
NIC 2 digit IT Adoption ITRate investment
Per Worker (Rs.)
Wood and Products of Wood 16.8 574.9
Tobacco Products 16.6 309.8
Tanning and Dressing of LeatherLuggage 44.9 923.6
Textiles 41.1 1296.3
Fabricated Metal Products,Except Machinery 45.3 2369.3
Food Products and Beverages 25.2 1204.4
Paper and Paper Products 51.5 1960.4
Rubber and Plastic Products 51.4 2245.7
Wearing Apparel Dressing andDyeing of Fur 62.1 1322.7
Other Non-Metallic Mineral Products 18.7 1847.9
Furniture; Manufacturing N.E.C. 50.1 3340.4
Machinery and Equipments N.E.C 58.2 4431.5
Basic Metals 49.2 2819.9
Electrical Machinery and Apparatus N.E.C. 65.1 3947
Other Transport Equipment 60.9 3354
Medical & Optical Instr’s, Watchesand Clocks 66 8335.2
Chemicals and Products 56 3995.6
Publishing, Printing and Reproduction etc 53.7 10294.7
Coke, Petroleum Products and Nuclear Fuel 49.1 7637.1
Radio, TV & Communication Eqpts &Apparatus 71.1 9560.9
Office, Accounting and ComputingMachinery 74 17276.8
Motor Vehicles, Trailers and Semi-Trailers 63.1 10299.7
Total 42.1 4418.8

31
References
Acemoglu, Daren (1998) “Why Do New Technologies Complement
Skills? Directed Technical Change and Wage Inequality”,
Quarterly Journal of Economics, Vol. CXIII, No.4,1054-1089.
Acemogulu,D.(2003) “Patterns of Skill Premia,” Review of Economic
Studies, Vol.70, No.2, 199-230.
Attanasio, O., P. Goldberg, P., and N. Pavcnik. (2004) “Trade Reforms
and Wage Inequality in Colombia,” Journal of Development
Economics 74, 331– 366.
Autor, David, H., Lawrence F. Katz and Alan B. Krueger (1998)
“Computing Inequality: Have Computers Changed the Labour
Market?” Quarterly Journal of Economics; Vol. CXIII, No.4,
1170-1213.
Berman, Eli & Somanathan, Rohini & Tan, Hong W.(2005) ‘Is Skill-
biased Technological change here yet ? Evidence from Indian
Manufacturing in the 1990,’ Policy Research Working Paper
Series 3761, The World Bank.
Berman, Eli (2000) ‘Does Factor-Biased Technological Change Stifle
International Convergence? Evidence from Manufacturing,’
Working Paper, Boston University.
Berman, Eli and Stephen Machin (2000) “Skill-Biased Technology Transfer
around the World,” Oxford Review of Economic Policy, 16(3).
Berman, Eli, John Bound and Stephen Machin (1998) “Implications of
Skill-Biased Technological Change: International Evidence,”
Quarterly Journal of Economics, 113(4), 1245-1280.
Berman, Eli, John Bound and Zvi Griliches (1994) “Changes in the
Demand for Skilled Labour within U.S.Manufacturing Industries:
Evidence from the Annual Survey of Manufacturing,” Quarterly
Journal of Economics, CIX, 367-398.

32
Besley, Timothy and Robin Burgess (2002) ‘Can Labour Regulation
Hinder Economic Performance? Evidence from India,’ CEPR
Discussion Paper 3260.
Card, D., Kramarz, and T.Lemeieux (1997) ‘Changes in the Relative
Structure of Wages and Employment : A Comparison of the United
States, Canada and France,’ NBER Working Paper 5487.
Card, F. Kramarz, T. Lemieux (1999) “Changes in the Relative Structure
of Wages and Employment: A Comparison of the United States,
Canada and France,” Canadian Journal of Economics, 32, 4,
843-877.
Doms, Mark, Timothy Dunne and Kenneth R. Troske (1997) “Workers,
Wages and Technology”, Quarterly Journal of Economics; Vol.
CXII, pp. 254-290.
Ghose, A.K. (2000) ‘Trade Liberalisation and Manufacturing
Employment,’ Employment Paper No. 2000/3, International
Labour Organisation, Geneva.
Joseph K.J. and Vinoj Abraham, (2007) ‘Information Technology and
Productivity : Evidence from India’s Manufacturing Sector,’
Working Paper No:389, Centre for Development Studies,
Trivandrum, Kerala, September.
K.V. Ramaswamy,( 2008) ‘Wage Inequality in Indian Manufacturing: Is
it Trade, Technology or Labour Regulations?’ WP-2008-021
Indira Gandhi Institute of Development Research, Mumbai,
November.
Machin and Van Raneen (1998), “Technology and Changes in Skill
Structure: Evidence from Seven OECD Countries,” Quarterly-
Journal-of-Economics. November,113(4): 1215-44.
Nagaraj, R. (2000) “Organised Manufacturing Employment,” Economic
and Political Weekly, September 16.

33
Robbins, D.J. (1996) ‘Evidence on Trade and Wages in the Developing
World,’ Working Paper 119, OECD Development Centre.
Subramanian, C R (1992) India and the Computer: A Study of Planned
Development, Oxford University Press, New Delhi.

34
PUBLICATIONS
For information on all publications, please visit the CDS Website:www.cds.edu. The Working Paper Series was initiated in 1971. WorkingPapers from 279 can be downloaded from the site.
The Working Papers published after April 2007 are listed below:
W.P. 436 S. IRUDAYA RAJAN, D. NARAYANA, The Financial Crisisin the Gulf and its Impact on South Asian Migrant Workers.August 2010.
W.P. 435 ANUP KUMAR BHANDARI, Total Factor ProductivityGrowth and its Decomposition: An Assessment of the IndianBanking Sector in the True Liberalised Era. August 2010
W.P. 434 BEENA SARASWATHY, Cross-Border Mergers andAcquisitions in India: Extent, Nature and Structure.July 2010
W.P. 433 VIJAY KORRA, Nature and Characteristics of SeasonalLabour Migration: A Case Study in Mahabubnagar Districtof Andhra Pradesh. July 2010
W.P. 432 K.C. ZACHARIAH S. IRUDAYA RAJAN, Impact of theGlobal Recession on Migration and Remittances in Kerala:New Evidences from the Return Migration Survey (RMS)2009. June 2010.
W.P. 431 GARGI SANATI, Integration of India’s Financial Marketson the Domestic and International Fronts: An EmpiricalAnalysis of the Post-Liberalisation Period, June 2010.
W.P. 430 SUNIL MANI, Has China and India Become moreInnovative Since the onset of Reforms in theTwo Countries?May 2010.
W.P. 429 T. R. DILIP, School Educational Attainment in Kerala:
Trends And Differentials. April 2010.
W.P. 428 SUNIL MANI, The Flight from Defence to Civilian Space:Evolution of the Sectoral System of Innovation of India’sAerospace Industry. April 2010.

35
W.P. 427 J. DEVIKA, V. J. VARGHESE, To Survive or to Flourish?
Minority Rights and Syrian Christian Community Assertions
in 20th Century Travancore/Kerala. April 2010.
W.P. 426 ANUP KUMAR BHANDARI, Global Crisis, Environmental
Volatility and Expansion of the Indian Leather Industry.
March 2010.
W.P. 425 P L. BEENA, HRUSHIKESH MALLICK, Exchange Rate
and Export Behaviour of Indian Textiles & Clothing Sector:
An Enquiry for Major Destination Countries. March 2010.
W.P. 424 K. C. ZACHARIAH, S. IRUDAYA RAJAN, MigrationMonitoring Study, 2008 Emigration and Remittancesin the Context of Surge in Oil Prices. March 2010.
W.P. 423 VIJAYAMOHANAN PILLAI N, Loss of Load Probability
of a Power System: Kerala. February 2010.
W.P. 422 JAYASEKHAR S, C. NALIN KUMAR, Compliance,
Competitiveness and Market Access: A Study on Indian
Seafood Industry. February 2010.
W.P. 421 S. IRUDAYA RAJAN, V.J. VARGHESE, M.S. JAYAKUMAROverseas Recruitment in India: Structures, Practices and
Remedies. December 2009.
W.P. 420 V.J. VARGHESE, Land, Labour and Migrations:
Understanding Kerala’s Economic Modernity, December 2009.
W.P. 419 R.MOHAN, D. SHYJAN Tax Devolution and Grant
Distribution to States in India Analysis and Roadmap for
Alternatives, December 2009.
W.P. 418 WILLIAM JOE & U. S. MISHRA Household Out-of-Pocket
Healthcare Expenditure in India Levels, Patterns and Policy
Concerns, October 2009.
W.P. 417 NEETHI P Globalisation Lived Locally: New Forms of
Control, Conflict and Response Among Labour in Kerala,
Examined Through a Labour Geography Lens. October 2009.

36
W.P. 416 SUNIL MANI High skilled migration from India, An analysisof its economic implications, September 2009.
W.P. 415 SUNIL MANI Has India Become more Innovative Since1991? Analysis of the Evidence and Some DisquietingFeatures, September 2009.
W.P. 414 WILLIAM JOE, PRIYAJIT SAMAIYAR, U. S. MISHRAMigration and Urban Poverty in India Some PreliminaryObservations, September 2009.
W.P. 413 K. N. NAIR, T.P. SREEDHARAN, M. ANOOPKUMAR, AStudy of National Rural Employment Guarantee Programmein Three Grama Panchayats of Kasaragod District,August 2009
W.P. 412 B.S. SURAN, D. NARAYANA, The Deluge of Debt: Under-standing the Financial Needs of Poor Households. July 2009
W.P. 411 K. NAVANEETHAM , M. KABIR , C.S. KRISHNAKUMAR
Morbidity Patterns in Kerala: Levels and Determinants.April 2009.
W.P. 410 ARINDAM BANERJEE, Peasant Classes, Farm Incomesand Rural Indebtedness: An Analysis of HouseholdProduction Data from two States. March 2009.
W.P. 409 SUNIL MANI, The Growth of Knowledge-intensiveEntrepreneurship in India, 1991-2007 Analysis of itsEvidence and the Facilitating Factors. February, 2009
W.P. 408 M. S. HARILAL, Home to Market: Responses, Resurgenceand Transformation of Ayurveda from 1830s to 1920.November 2008
W.P. 407 HRUSHIKESH MALLICK, Do Remittances Impact theEconomy ? Some Empirical Evidences from a DevelopingEconomy. October 2008.
W.P. 406 K.C.ZACHARIAH, S.IRUDAYA RAJAN, Costs of BasicServices in Kerala, 2007, Education, Health, Childbirth andFinance (Loans) September 2008.
W.P. 405 SUNIL MANI Financing of industrial innovations in IndiaHow effective are tax incentives for R&D? August 2008.

37
W.P. 404 VINOJ ABRAHAM Employment Growth in Rural India:Distress Driven? August 2008.
W.P. 403 HRUSHIKESH MALLICK, Government Spending, TradeOpenness and Economic Growth in India: A Time SeriesAnalysis. July 2008.
W.P. 402 K. PUSHPANGADAN, G. MURUGAN, Dynamics of RuralWater Supply in Coastal Kerala: A Sustainable DevelopmentView, June 2008
W.P. 401 K. K. SUBRAHMANIAN, SYAM PRASAD, Rising InequalityWith High Growth Isn't this Trend Worrisome? Analysis ofKerala Experience, June 2008
W.P. 400 T.R. DILIP, Role Of Private Hospitals in Kerala: AnExploration, June 2008
W.P. 399 V. DHANYA, Liberalisation of Tropical Commodity Marketand Adding-up Problem: A Bound Test Approach,March 2008
W.P. 398 P. MOHANAN PILLAI, N. SHANTA, ICT and EmploymentPromotion Among Poor Women: How can we Make itHappen? Some Reflections on Kerala's Experience.February 2008.
W.P. 397 K.N.NAIR, VINEETHA MENON, Distress Debt and Suicidesamong Agrarian Households: Findings from three VillageStudies in Kerala. December 2007
W.P. 396 K.N.NAIR, C.P. VINOD, VINEETHA MENON,Agrarian Distress and Livelihood Strategies: A Studyin Pulpalli Panchayat, Wayanad District , KeralaDecember 2007
W.P. 395 K.C. ZACHARIAH, S.IRUDAYA RAJAN, Migration,Remittances And Employment Short-term Trends and Long-term Implications. December 2007
W.P. 394 K.N.NAIR, ANTONYTO PAUL, VINEETHA MENON,Livelihood Risks and Coping strategies: A Case Study in theAgrarian Village of Cherumad, Kerala. November 2007

38
W.P. 393 S. IRUDAYA RAJAN, U.S.MISHRA, Managing Migrationin the Philippines: Lessons for India. November 2007.
W.P. 392 K.N. NAIR, R. RAMAKUMAR Agrarian Distress and RuralLivelihoods, a Study in Upputhara Panchayat Idukki District,Kerala. November 2007.
W.P. 391 PULAPRE BALAKRISHNAN, Visible hand: Public policyand economic growth in the Nehru era. November 2007.
W.P. 390 SUNIL MANI, The Growth Performance of India’sTelecommunications Services Industry, 1991-2006 Can itLead to the Emergence of a Domestic Manufacturing Hub?September 2007.
W.P. 389 K. J. JOSEPH, VINOJ ABRAHAM, Information Technologyand Productivity: Evidence from India's ManufacturingSector. September 2007.
W.P. 388 HRUSHIKESH MALLICK, Does Energy Consumption FuelEconomic Growth In India? September 2007.
W.P. 387 D. SHYJAN,Public Investment and Agricultural Productivity:A State-wise Analysis of Foodgrains in India. July 2007.
W.P. 386 J. DEVIKA, 'A People United in Development':Developmentalism in Modern Malayalee Identity.June 2007.
W.P. 385 M. PARAMESWARAN, International Trade, R&D Spilloversand Productivity: Evidence from Indian ManufacturingIndustry. June 2007.
W.P. 384 K. C. ZACHARIAH, S. IRUDAYA RAJAN Economic andSocial Dynamics of Migration in Kerala, 1999-2004 Analysisof Panel Data. May 2007.
W.P. 383 SAIKAT SINHA ROY Demand and Supply Factors in theDetermination or India's Disaggregated Manufactured Exports :A Simultaneous Error-Correction Approach. May 2007.

39

This work is licensed under a Creative Commons Attribution – NonCommercial - NoDerivs 3.0 Licence. To view a copy of the licence please see: http://creativecommons.org/licenses/by-nc-nd/3.0/