4%2D6 Regression and Median%2DFit Lines€¦ · F Sample answer: No; the correlation between sales...
32
3277(5< $ ORFDO XQLYHUVLW\ LV NHHSLQJ WUDFN RI WKH QXPEHU RI DUW VWXGHQWV ZKR XVH WKH SRWWHU\ VWXGLR HDFK GD\ a. Write an equation of the regression line and find the correlation coefficient. b. Graph the residual plot and determine if the regression line models the data well. 62/87,21 D Use a calculator to find the equation of the regression line. Step 1: Enter the data by pressing STAT and selecting the EDIT option. . Enter the day into List 1 (L1). These will represent the x-values. Enter the number of students into List 2 (L2). These will represent the y -values. Step 2: Perform the regression by pressing STAT DQG VHOHFWLQJ WKH CALC option. Scroll down to LinReg(ax+ b) and press ENTER. Substitute the values in for a and b to write the equation of the regression line. So, the equation is y = 1.18x + 11. Identify the value of r on the calculator to find the correlation coefficient. So, 0.7181 is the correlation coefficient. b. 7XUQ RQ Plot2 under the STAT PLOT menu and choose scatter plot. Use L1 for the Xlist and RESID for the Ylist. You can obtain RESID by pressing 2nd STAT and selecting RESID from the list of names. Graph the scatter plot of the residuals by pressing ZOOM and choosing ZoomStat. The residuals appear to be randomly scattered, so the regression line fits the data reasonably well. eSolutions Manual - Powered by Cognero Page 1 4 - 6 Regression and Median - Fit Lines
Transcript of 4%2D6 Regression and Median%2DFit Lines€¦ · F Sample answer: No; the correlation between sales...

���3277(5<� $�ORFDO�XQLYHUVLW\�LV�NHHSLQJ�WUDFN�RI�WKH�QXPEHU�RI�DUW�VWXGHQWV�ZKR�XVH�WKH�SRWWHU\�VWXGLR�HDFK�GD\�� �
� a. Write an equation of the regression line and find the correlation coefficient. � b. Graph the residual plot and determine if the regression line models the data well.
62/87,21���D��Use a calculator to find the equation of the regression line. � Step 1: Enter the data by pressing STAT and selecting the EDIT option. . Enter the day into List 1 (L1). These willrepresent the x-values. Enter the number of students into List 2 (L2). These will represent the y-values. � Step 2: Perform the regression by pressing STAT �DQG�VHOHFWLQJ�WKH�CALC option. Scroll down to LinReg(ax+ b) and press ENTER. �
� Substitute the values in for a and b to write the equation of the regression line. So, the equation is y = 1.18x + 11. � Identify the value of r on the calculator to find the correlation coefficient. So, 0.7181 is the correlation coefficient. � b.�7XUQ�RQ�Plot2 under the STAT PLOT menu and choose scatter plot. Use L1 for the Xlist and RESID for the Ylist. You can obtain RESID by pressing 2nd STAT and selecting RESID from the list of names. Graph the scatter plot of the residuals by pressing ZOOM and choosing ZoomStat. �
� The residuals appear to be randomly scattered, so the regression line fits the data reasonably well. �
���&20387(56� The table below shows the percent of Americans with a broadband connection at home in a recentyear. Use linear extrapolation and a regression equation to estimate the percentage of 60-year-olds with broadband at home. �
62/87,21���Use a calculator to find the equation of the regression line.�
� y = ±0.34x + 49.48 � Substitute 60 into the equation. �
� So, about 29% of 60-year-olds have broadband at home.
���9$&$7,21� The Smiths want to rent a house on the lake that sleeps eight people. The cost of the house per night is based on how close it is to the water. �
� D�� Find and graph an equation for the median-fit line. � E�� What would you estimate is the cost of a rental 1.75 miles from the lake?
62/87,21���a. Use a calculator to find and graph the equation of the median fit line. �
y = í271.88x + 554.48
� b. To estimate the cost of a rental 1.75 miles from the lake, evaluate the equation of the median-fit line for x = 1.75.�
� An estimate of the cost of a rental 1.75 miles from the lake is $78.69.
Write an equation of the regression line for the data in each table. Then find the correlation coefficient.���6.<6&5$3(56� The table ranks the ten tallest buildings in the world. �
62/87,21���Use a calculator to find the equation of the regression line.�
� y = í2.75x + 102.53 � Use a calculator to find the correlation coefficient. � í0.6071
���086,&� 7KH�WDEOH�JLYHV�WKH�QXPEHU�RI�DQQXDO�YLROLQ�DXGLWLRQV�KHOG�E\�D�\RXWK�V\PSKRQ\�HDFK�\HDU�VLQFH��������/HW�x be the number of years since 2004. �
�
62/87,21���Use a calculator to find the equation of the regression line.�
� y = 3.54x + 19.68 � Use a calculator to find the correlation coefficient. � 0.9007
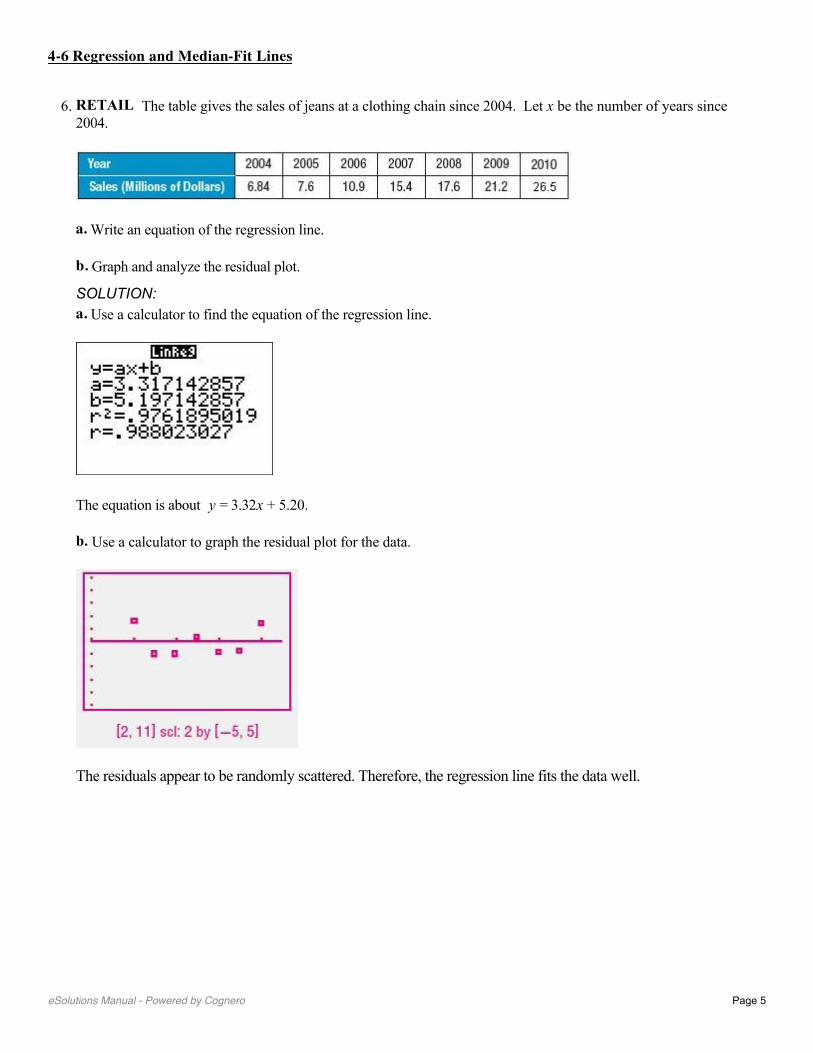
���5(7$,/� 7KH�WDEOH�JLYHV�WKH�VDOHV�RI�MHDQV�DW�D�FORWKLQJ�FKDLQ�VLQFH��������/HW�x be the number of years since ������ �
� a. Write an equation of the regression line. � b. Graph and analyze the residual plot.
62/87,21���a. Use a calculator to find the equation of the regression line. �
� The equation is about��\ = 3.32x + 5.20. � E��Use a calculator to graph the residual plot for the data. �
� The residuals appear to be randomly scattered. Therefore, the regression line fits the data well.
���0$5$7+21� 7KH�QXPEHU�RI�HQWUDQWV�LQ�WKH�%RVWRQ�0DUDWKRQ�HYHU\�ILYH�\HDUV�VLQFH������LV�VKRZQ���/HW�x be thenumber of years since 1975. �
� � D�� Find an equation for the median-fit line. � E�� According to the equation, how many entrants were there in 2003?
62/87,21���a. Let x = 0 for 1975. Use a calculator to find the equation of the median fit line. �
� y = 601.44x + 1236.13 � b. To estimate the number of entrants in 2003, evaluate the equation for the median-fit line for x = 2003 ± 1975 = 28.�
� There were about 18,076 entrants in 2003.
���&$03,1*� A campground kept a record of the number of campsites rented over the week of July 4 for several \HDUV���/HW�x be the number of years since 2000. �
� D�� Find an equation for the regression line. � E�� Predict the number of campsites that will be rented in 2012. � F�� Predict the number of campsites that will be rented in 2020.
62/87,21���a. Use a calculator to find an equation for the regression line. �
� y = 3.07x + 32.71 � b. To predict the number of campsites that will be rented in 2012, evaluate the regression equation for x = 12�
� There will be about 70 campsites rented in 2012. � c. To predict the number of campsites that will be rented in 2020, evaluate the regression equation for x = 20.�
� There will be about 94 campsites rented in 2020.
���,&(�&5($0� An ice cream company keeps a count of the tubs of cookie dough ice cream delivered to each of their stores in a particular area. ��
� D�� Find an equation for the median-fit line. � E�� Graph the points and the median-fit line. � F�� How many tubs would be delivered to a 1500-square-foot store? a 5000-square-foot store?
62/87,21���a. Use a calculator to find an equation for the median-fit line. �
� y = 0.095x í 94.58 � b. Plot the points and the equation. �
� c. To estimate the number of tubs to be delivered to a 1500-square-foot store, evaluate the regression equation for x = 1500. �
� There are about 48 tubs delivered to a 1500-square-foot store. To estimate the number of tubs to be delivered to a 5000-square-foot store, evaluate the regression equation for x = 5000. �
� There are about 380 tubs delivered to a 5000-square-foot store.
����CCSS SENSE-0$.,1*� The prices of the eight top-selling brands of jeans at Jeanie¶s Jeans are given in the table below. �
� D�� Find the equation for the regression line. � E�� According to the equation, what would be the price of a pair of the 12th best-selling brand? � F�� Is this a reasonable prediction? Explain.
62/87,21���a. Use a calculator to find an equation for the regression line. �
Step 1: Enter the data by pressing and selecting the EDIT option. Enter the sales rank into List 1 (L1). These will represent the x-values. Enter the price into List 2 (L2). These will represent the y-values. �
Step 2: Perform the regression by pressing �DQG�VHOHFWLQJ�WKH�CALC option. Scroll down to LinReg(ax+
b) and press . �
� y = 9.8x + 28.79 � b. To predict the price of a pair of the 12th bestselling brands of jeans, evaluate the regression equation for x = 12. �
� The price of a pair of the 12th bestselling brands of jeans would be about $146.39. � F�� Sample answer: No; the correlation between sales rank and price is too weak to make any reasonable prediction. The 12th bestselling brand of jeans could just as easily be a poorly made pair of jeans selling for $15.
����67$7(�)$,56� The table shows the total attendance, in millions of people, at the Minnesota State Fair from 2005 to 2009. �
� D��Graph a scatter plot of the data, where x = 1 represents 2005. Then find and graph the equation for the best-fit line. � b. Graph and analyze the residual plot. � c.��3UHGLFW�WKH�WRWDO�DWWHQGDQFH�LQ������ �
62/87,21���a. Enter the data from the table into the lists. Let x be the years starting with x = 1 for 2005 and let y = the attendence (in millions). Then graph the scatter plot. �
�
[0, 6] scl: 1 by [0, 3] scl: 0.5 � Perform the linear regression using the data in the lists. Find the equation of the best-fit line. �
� The equation is about y = 0.0326x + 1.598. � Use Y= to enter the equation into the calculator and graph the best-fit line with the scatter plot. �
[0, 6] scl: 1 by [0, 3] scl: 0.5 � b. Use the calculator to graph the residual plot for the data. �
� All the residuals appear to almost be on the line. Therefore, the regression line is a good fit for the data. � F���0HWKRG����To find the number of people in 2020, substitute 16 for x��
� Method 2: Copy the equation to the Y= list and graph. Use the value option to find the value of y when x = 16. �
[0, 17] scl: 1 by [0, 3] scl: 0.5 � 6R��WKHUH�ZLOO�EH�DERXW������PLOOLRQ�SHRSOH�LQ�������
����),5(),*+7(56� 7KH�WDEOH�VKRZV�VWDWLVWLFV�IURP�WKH�8�6��)LUH�$GPLQLVWUDWLRQ�� �
� D�� Find an equation for the median-fit line. � E�� Graph the points and the median-fit line. � F�� Does the median-fit line give you an accurate picture of the number of firefighters? Explain.
62/87,21���a. Use a calculator to find an equation for the median-fit line. �
Step 1: Enter the data by pressing and selecting the EDIT option. Enter age into List 1 (L1). These will represent the x-values. Enter the number of firefighters into List 2 (L2). These will represent the y-values. �
Step 2: Perform the regression by pressing and selecting the CALC option. Scroll down to Med-Med
and press �� �
� y = í841.42x + 223288 � b. Plot the points and graph the median fit line. �
� c. No, the median-fit line does not give an accurate picture of the number of firefighters. The points show no linear correlation; therefore a line cannot accurately portray the data.
����$7+/(7,&6� The table shows the total number of teens who participated in high school athletics in various years. �
� � D�� Find an equation for the regression line. � E�� According to the equation, how many participated in 1988?
62/87,21���a. Use a calculator to find an equation for the regression line. �
Step 1: Enter the data by pressing and selecting the EDIT option. Let the year 1970 be represented by 0. Enter the years since 1970 into List 1 (L1). These will represent the x-values. Enter the number of athletes into List 2 (L2). These will represent the y-values. �
Step 2: Perform the regression by pressing and selecting the CALC option. Scroll down to LinReg(ax+
b) and press . �
� y = 87,390.5x + 4,018,431 � b. To estimate the number of participants in 1988, evaluate the regression equation for x = 18 because 1988 is 18 years after 1970. �
� There were about 5,591,460 participants in 1988.
����$57� $�FRXQW�ZDV�NHSW�RQ�WKH�QXPEHU�RI�SDLQWLQJV�WKDW�VROG�DW�DQ�DXFWLRQ�E\�WKH�\HDU�LQ�ZKLFK�WKH\�ZHUH�SDLQWHG���Let x be the number of years since 1950. �
� D�� Find the equation for the linear regression line. � E�� How many paintings were sold that were painted in 1961? � F�� Is the linear regression equation an accurate model of the data? Explain why or why not.
62/87,21���a. 8VH�D�FDOFXODWRU�WR�ILQG�DQ�HTXDWLRQ�IRU�WKH�UHJUHVVLRQ�OLQH�� �
Step 1: Enter the data by pressing and selecting the EDIT option. Let x =0 for the year 1950.. Enter the years since 1950 into List 1 (L1). These will represent the x-values. Enter the number of painting sold into List 2 (L2). These will represent the y-values. �
Step 2: Perform the regression by pressing �DQG�VHOHFWLQJ�WKH�CALC option. Scroll down to LinReg(ax+
b) and press . � �
� y = 0.446x +9.43 � b. 7R�HVWLPDWH�WKH�QXPEHU�RI�SDLQWLQJV�VROG�LQ�������HYDOXDWH�WKH�UHJUHVVLRQ�HTXDWLRQ�IRU������ZKHQ��x =11. �
� There were about 14 paintings sold in 1961. � F�� No, the correlation coefficient is 0.48, so the linear model is not a good fit for the data. It does not appear from the data that there is a relationship between the number of paintings sold and the year they were painted.
����&&66�$5*80(176� Below are the results of the World Superpipe Championships in 2008.\ �
� � Find an equation of the regression line for each, and graph them on the same coordinate plane. Compare and contrast the men¶s and women's graphs.
62/87,21���Use a calculator to find an equation of the regression line for each set of data.� Men: y = í2.92x + 95.92 Women: y = í7x+106 � Graph the equations on the same coordinate plane. �
� The women¶s scores are typically lower than the men¶s.
����5($621,1*� For a class project, the scores that 10 randomly selected students earned on the first 8 tests of the VFKRRO�\HDU�DUH�JLYHQ��([SODLQ�KRZ�WR�ILQG�D�OLQH�RI��EHVW�ILW���&RXOG�LW�EH�XVHG�WR�SUHGLFW�WKH�VFRUHV�RI�RWKHU�VWXGHQWV"Explain your reasoning.
62/87,21���Apply a linear regression model to the data. Use the number of each test as the independent variable and the score on each test as the dependent variable. If there is no correlation, the r value will not be close to 1 or í1. If this is the case, the line of fit could not be used to predict the scores of the other students.
����23(1�(1'('� For 10 different people, measure their heights and the lengths of their heads from chin to top. Use these data to generate a linear regression equation and a median-fit equation. Make a prediction using both of the equations.
62/87,21���Student should gather and record data and use a calculator to find the equation of linear regression and a median-fit equation. Students should make predictions based on both equations. � 6DPSOH�GDWD��
� Median-fit (Store in Y1)
y = 8.31x ± 3.12 � /LQHDU�UHJUHVVLRQ���6WRUH�LQ Y2)
y = 7.39x + 5.22 � Find the height of a student with chin to top of head measure of 8.1. Use the value option from the CALC menu. Use the up arrow to move from one line to another. �
�
� The median-fit line predicts a student¶s height of 64.17 inches and the linear regression line predicts a height of 65.07.
Chin to 7RS��RI�
Head Measure Height8.8 70.99.1 72.89.3 73.87.5 61.08.4 66.37.8 62.08.5 67.38.8 68.98.3 68.78.9 71.5
����WRITING IN MATH How are lines of fit and linear regression similar? different?
62/87,21���Sample answer: Both lines of fit and linear regression are used to model data. However, you could have numerous lines of fit, while linear regression results in one line of best fit. If linear regression is used, you can also use the correlation coefficient to see how closely the model fits the data. For example, the scatter plot below displays the points (1, 10), (2, 17), (3, 15), (4, 20), (5, 28), (6, 19), and (7, 25). �
$�OLQH�RI�ILW�FRXOG�EH�GUDZQ�WKURXJK���������DQG����������7KH�HTXDWLRQ�RI�WKLV�OLQH�RI�ILW�LV�� .
� Use a calculator to find the equation of the regression line for this data. �
� The only regression line for this data has an equation of about y = 2.2x����������
����*(20(75<� Sam is putting a border around a poster. x represents the poster¶s width, and y represents the poster¶s length. Which equation represents how much border Sam will use if he doubles the length and the width? � $� 4xy � %� (x + y)4 � &� 4(x + y) � '� 16(x + y)
62/87,21���The perimeter of the room is found by . y is the length and x is the width, so . But Sam wants to double the border, so the perimeter becomes: �
� So, the correct choice is C.
����6+257�5(63216(� Tatiana wants to run 5 miles at an average pace of 9 minutes per mile. After 4 miles, her average pace is 9 minutes 10 seconds. In how many minutes must she complete the final mile to reach her goal?
62/87,21���Tatiana ran each of the first 4 miles in 10 more seconds than she planned. So to reach her goal, she must run the lastmile in 40 seconds less than she planned. 9 min ± 40 s = 8 min and 20 s.
����What is the slope of the line that passes through (1, 3) and (í3, 1)?� )� í2 �
*��
�
+��
� -� 2
62/87,21���
� So, the correct choice is H.
����What is an equation of the line that passes through (0, 1) and has a slope of 3?� $� y = 3x í 1 � %� y = 3x í 2 � &� y = 3x + 4 � '� y = 3x + 1
62/87,21���Find the y-intercept. �
� The equation is y = 3x + 1. So, the correct choice is D.
����86('�&$56� Gianna wants to buy a specific make and model of a used car. She researched prices from dealers and private sellers and made the graph shown. �
� D�� Describe the relationship in the data. � E�� Use the line of fit to predict the price of a car that is 7 years old. � F�� Is it reasonable to use this line of fit to predict the price of a 10-year old car? Explain.
62/87,21���a. Because y decreases as x increases, there is a negative correlation in the data. � b. Find x = 7 on the graph and follow the line up to the line of fit. According to the graph, the price of a car that is 7 years old would be about $3600. � c. No, it would not be reasonable to use this line of fit to predict the price of a 10-year old car, because according to the line of fit, the cost would be $0 and that doesn¶t make sense.
����*(20(75<� A quadrilateral has sides with equations y = í2x, 2x + y = 6, , and x í 2y = 9. Is the figure a rectangle? Explain your reasoning.
62/87,21���Write all of the equations in slope-intercept form. � Equation 1: y = í2x � (TXDWLRQ���� �
� (TXDWLRQ����
������������������y = x + 6 � Equation 4:� �
� Find the slope of each line �
� The slope of opposite sides are equal (±2 and ±���DQG�����DQG�������VR�WKH\�DUH�SDUDOOHO��$OVR��WKH�VORSH�RI�consecutive sides are opposite reciprocals (±2 and 0.5; and ±2 and 0.5), so they are perpendicular. So, the figure is a rectangle.
y = í2x í2y = ±2x +6 í2
y = 0.5x + 6
y = 0.5x ± 4.5
Write each equation in standard form.����y í 2 = 3(x í 1)
62/87,21���
����y í 5 = 6(x + 1)
62/87,21���
����y + 2 = í2(x í 5)
62/87,21���
����
62/87,21���
����
62/87,21���
����
62/87,21���
Find the slope of the line that passes through each pair of points.����(3, 4), (10, 8)
62/87,21���
����(í4, 7), (3, 5)
62/87,21���
����(3, 7), (í2, 4)
62/87,21���
����(í3, 2), (í3, 4)
62/87,21���
The slope is undefined.
If f (x) = x2 í x + 1, find each value.����f (í1)
62/87,21���
����f (5) í3
62/87,21���
����f (a)
62/87,21���
����f (b2)
62/87,21���
Graph each equation.����y = x + 2
62/87,21���To graph the equation, plot the y-intercept (0, 2). Then move up 1 unit and right 1 unit. Plot the point. Draw a line through the two points.
����x + 5y = 4
62/87,21���Write the equation in slope-intercept form. �
To graph the equation, plot the y-LQWHUFHSW�� . Then move down 1 unit and right 5 units. Plot the point. Draw a
line through the two points. �
����2x í 3y = 6
62/87,21���Write the equation in slope-intercept form. �
� To graph the equation, plot the y-intercept (0, ±2). Then move up 2 units and right 3 units. Plot the point. Draw a line through the two points. �
����5x + 2y = 6
62/87,21���Write the equation in slope-intercept form. �
� To graph the equation, plot the y-intercept (0, 3). Then move down 5 units and right 2 units. Plot the point. Draw a line through the two points. �
Another line of fit may pass through (2, 15) and (7, 25). The equation of this line of fit is y = 2x + 11. More lines of fit that come close to the points could be drawn.
eSolutions Manual - Powered by Cognero Page 1
4-6 Regression and Median-Fit Lines

���3277(5<� $�ORFDO�XQLYHUVLW\�LV�NHHSLQJ�WUDFN�RI�WKH�QXPEHU�RI�DUW�VWXGHQWV�ZKR�XVH�WKH�SRWWHU\�VWXGLR�HDFK�GD\�� �
� a. Write an equation of the regression line and find the correlation coefficient. � b. Graph the residual plot and determine if the regression line models the data well.
62/87,21���D��Use a calculator to find the equation of the regression line. � Step 1: Enter the data by pressing STAT and selecting the EDIT option. . Enter the day into List 1 (L1). These willrepresent the x-values. Enter the number of students into List 2 (L2). These will represent the y-values. � Step 2: Perform the regression by pressing STAT �DQG�VHOHFWLQJ�WKH�CALC option. Scroll down to LinReg(ax+ b) and press ENTER. �
� Substitute the values in for a and b to write the equation of the regression line. So, the equation is y = 1.18x + 11. � Identify the value of r on the calculator to find the correlation coefficient. So, 0.7181 is the correlation coefficient. � b.�7XUQ�RQ�Plot2 under the STAT PLOT menu and choose scatter plot. Use L1 for the Xlist and RESID for the Ylist. You can obtain RESID by pressing 2nd STAT and selecting RESID from the list of names. Graph the scatter plot of the residuals by pressing ZOOM and choosing ZoomStat. �
� The residuals appear to be randomly scattered, so the regression line fits the data reasonably well. �
���&20387(56� The table below shows the percent of Americans with a broadband connection at home in a recentyear. Use linear extrapolation and a regression equation to estimate the percentage of 60-year-olds with broadband at home. �
62/87,21���Use a calculator to find the equation of the regression line.�
� y = ±0.34x + 49.48 � Substitute 60 into the equation. �
� So, about 29% of 60-year-olds have broadband at home.
���9$&$7,21� The Smiths want to rent a house on the lake that sleeps eight people. The cost of the house per night is based on how close it is to the water. �
� D�� Find and graph an equation for the median-fit line. � E�� What would you estimate is the cost of a rental 1.75 miles from the lake?
62/87,21���a. Use a calculator to find and graph the equation of the median fit line. �
y = í271.88x + 554.48
� b. To estimate the cost of a rental 1.75 miles from the lake, evaluate the equation of the median-fit line for x = 1.75.�
� An estimate of the cost of a rental 1.75 miles from the lake is $78.69.
Write an equation of the regression line for the data in each table. Then find the correlation coefficient.���6.<6&5$3(56� The table ranks the ten tallest buildings in the world. �
62/87,21���Use a calculator to find the equation of the regression line.�
� y = í2.75x + 102.53 � Use a calculator to find the correlation coefficient. � í0.6071
���086,&� 7KH�WDEOH�JLYHV�WKH�QXPEHU�RI�DQQXDO�YLROLQ�DXGLWLRQV�KHOG�E\�D�\RXWK�V\PSKRQ\�HDFK�\HDU�VLQFH��������/HW�x be the number of years since 2004. �
�
62/87,21���Use a calculator to find the equation of the regression line.�
� y = 3.54x + 19.68 � Use a calculator to find the correlation coefficient. � 0.9007
���5(7$,/� 7KH�WDEOH�JLYHV�WKH�VDOHV�RI�MHDQV�DW�D�FORWKLQJ�FKDLQ�VLQFH��������/HW�x be the number of years since ������ �
� a. Write an equation of the regression line. � b. Graph and analyze the residual plot.
62/87,21���a. Use a calculator to find the equation of the regression line. �
� The equation is about��\ = 3.32x + 5.20. � E��Use a calculator to graph the residual plot for the data. �
� The residuals appear to be randomly scattered. Therefore, the regression line fits the data well.
���0$5$7+21� 7KH�QXPEHU�RI�HQWUDQWV�LQ�WKH�%RVWRQ�0DUDWKRQ�HYHU\�ILYH�\HDUV�VLQFH������LV�VKRZQ���/HW�x be thenumber of years since 1975. �
� � D�� Find an equation for the median-fit line. � E�� According to the equation, how many entrants were there in 2003?
62/87,21���a. Let x = 0 for 1975. Use a calculator to find the equation of the median fit line. �
� y = 601.44x + 1236.13 � b. To estimate the number of entrants in 2003, evaluate the equation for the median-fit line for x = 2003 ± 1975 = 28.�
� There were about 18,076 entrants in 2003.
���&$03,1*� A campground kept a record of the number of campsites rented over the week of July 4 for several \HDUV���/HW�x be the number of years since 2000. �
� D�� Find an equation for the regression line. � E�� Predict the number of campsites that will be rented in 2012. � F�� Predict the number of campsites that will be rented in 2020.
62/87,21���a. Use a calculator to find an equation for the regression line. �
� y = 3.07x + 32.71 � b. To predict the number of campsites that will be rented in 2012, evaluate the regression equation for x = 12�
� There will be about 70 campsites rented in 2012. � c. To predict the number of campsites that will be rented in 2020, evaluate the regression equation for x = 20.�
� There will be about 94 campsites rented in 2020.
���,&(�&5($0� An ice cream company keeps a count of the tubs of cookie dough ice cream delivered to each of their stores in a particular area. ��
� D�� Find an equation for the median-fit line. � E�� Graph the points and the median-fit line. � F�� How many tubs would be delivered to a 1500-square-foot store? a 5000-square-foot store?
62/87,21���a. Use a calculator to find an equation for the median-fit line. �
� y = 0.095x í 94.58 � b. Plot the points and the equation. �
� c. To estimate the number of tubs to be delivered to a 1500-square-foot store, evaluate the regression equation for x = 1500. �
� There are about 48 tubs delivered to a 1500-square-foot store. To estimate the number of tubs to be delivered to a 5000-square-foot store, evaluate the regression equation for x = 5000. �
� There are about 380 tubs delivered to a 5000-square-foot store.
����CCSS SENSE-0$.,1*� The prices of the eight top-selling brands of jeans at Jeanie¶s Jeans are given in the table below. �
� D�� Find the equation for the regression line. � E�� According to the equation, what would be the price of a pair of the 12th best-selling brand? � F�� Is this a reasonable prediction? Explain.
62/87,21���a. Use a calculator to find an equation for the regression line. �
Step 1: Enter the data by pressing and selecting the EDIT option. Enter the sales rank into List 1 (L1). These will represent the x-values. Enter the price into List 2 (L2). These will represent the y-values. �
Step 2: Perform the regression by pressing �DQG�VHOHFWLQJ�WKH�CALC option. Scroll down to LinReg(ax+
b) and press . �
� y = 9.8x + 28.79 � b. To predict the price of a pair of the 12th bestselling brands of jeans, evaluate the regression equation for x = 12. �
� The price of a pair of the 12th bestselling brands of jeans would be about $146.39. � F�� Sample answer: No; the correlation between sales rank and price is too weak to make any reasonable prediction. The 12th bestselling brand of jeans could just as easily be a poorly made pair of jeans selling for $15.
����67$7(�)$,56� The table shows the total attendance, in millions of people, at the Minnesota State Fair from 2005 to 2009. �
� D��Graph a scatter plot of the data, where x = 1 represents 2005. Then find and graph the equation for the best-fit line. � b. Graph and analyze the residual plot. � c.��3UHGLFW�WKH�WRWDO�DWWHQGDQFH�LQ������ �
62/87,21���a. Enter the data from the table into the lists. Let x be the years starting with x = 1 for 2005 and let y = the attendence (in millions). Then graph the scatter plot. �
�
[0, 6] scl: 1 by [0, 3] scl: 0.5 � Perform the linear regression using the data in the lists. Find the equation of the best-fit line. �
� The equation is about y = 0.0326x + 1.598. � Use Y= to enter the equation into the calculator and graph the best-fit line with the scatter plot. �
[0, 6] scl: 1 by [0, 3] scl: 0.5 � b. Use the calculator to graph the residual plot for the data. �
� All the residuals appear to almost be on the line. Therefore, the regression line is a good fit for the data. � F���0HWKRG����To find the number of people in 2020, substitute 16 for x��
� Method 2: Copy the equation to the Y= list and graph. Use the value option to find the value of y when x = 16. �
[0, 17] scl: 1 by [0, 3] scl: 0.5 � 6R��WKHUH�ZLOO�EH�DERXW������PLOOLRQ�SHRSOH�LQ�������
����),5(),*+7(56� 7KH�WDEOH�VKRZV�VWDWLVWLFV�IURP�WKH�8�6��)LUH�$GPLQLVWUDWLRQ�� �
� D�� Find an equation for the median-fit line. � E�� Graph the points and the median-fit line. � F�� Does the median-fit line give you an accurate picture of the number of firefighters? Explain.
62/87,21���a. Use a calculator to find an equation for the median-fit line. �
Step 1: Enter the data by pressing and selecting the EDIT option. Enter age into List 1 (L1). These will represent the x-values. Enter the number of firefighters into List 2 (L2). These will represent the y-values. �
Step 2: Perform the regression by pressing and selecting the CALC option. Scroll down to Med-Med
and press �� �
� y = í841.42x + 223288 � b. Plot the points and graph the median fit line. �
� c. No, the median-fit line does not give an accurate picture of the number of firefighters. The points show no linear correlation; therefore a line cannot accurately portray the data.
����$7+/(7,&6� The table shows the total number of teens who participated in high school athletics in various years. �
� � D�� Find an equation for the regression line. � E�� According to the equation, how many participated in 1988?
62/87,21���a. Use a calculator to find an equation for the regression line. �
Step 1: Enter the data by pressing and selecting the EDIT option. Let the year 1970 be represented by 0. Enter the years since 1970 into List 1 (L1). These will represent the x-values. Enter the number of athletes into List 2 (L2). These will represent the y-values. �
Step 2: Perform the regression by pressing and selecting the CALC option. Scroll down to LinReg(ax+
b) and press . �
� y = 87,390.5x + 4,018,431 � b. To estimate the number of participants in 1988, evaluate the regression equation for x = 18 because 1988 is 18 years after 1970. �
� There were about 5,591,460 participants in 1988.
����$57� $�FRXQW�ZDV�NHSW�RQ�WKH�QXPEHU�RI�SDLQWLQJV�WKDW�VROG�DW�DQ�DXFWLRQ�E\�WKH�\HDU�LQ�ZKLFK�WKH\�ZHUH�SDLQWHG���Let x be the number of years since 1950. �
� D�� Find the equation for the linear regression line. � E�� How many paintings were sold that were painted in 1961? � F�� Is the linear regression equation an accurate model of the data? Explain why or why not.
62/87,21���a. 8VH�D�FDOFXODWRU�WR�ILQG�DQ�HTXDWLRQ�IRU�WKH�UHJUHVVLRQ�OLQH�� �
Step 1: Enter the data by pressing and selecting the EDIT option. Let x =0 for the year 1950.. Enter the years since 1950 into List 1 (L1). These will represent the x-values. Enter the number of painting sold into List 2 (L2). These will represent the y-values. �
Step 2: Perform the regression by pressing �DQG�VHOHFWLQJ�WKH�CALC option. Scroll down to LinReg(ax+
b) and press . � �
� y = 0.446x +9.43 � b. 7R�HVWLPDWH�WKH�QXPEHU�RI�SDLQWLQJV�VROG�LQ�������HYDOXDWH�WKH�UHJUHVVLRQ�HTXDWLRQ�IRU������ZKHQ��x =11. �
� There were about 14 paintings sold in 1961. � F�� No, the correlation coefficient is 0.48, so the linear model is not a good fit for the data. It does not appear from the data that there is a relationship between the number of paintings sold and the year they were painted.
����&&66�$5*80(176� Below are the results of the World Superpipe Championships in 2008.\ �
� � Find an equation of the regression line for each, and graph them on the same coordinate plane. Compare and contrast the men¶s and women's graphs.
62/87,21���Use a calculator to find an equation of the regression line for each set of data.� Men: y = í2.92x + 95.92 Women: y = í7x+106 � Graph the equations on the same coordinate plane. �
� The women¶s scores are typically lower than the men¶s.
����5($621,1*� For a class project, the scores that 10 randomly selected students earned on the first 8 tests of the VFKRRO�\HDU�DUH�JLYHQ��([SODLQ�KRZ�WR�ILQG�D�OLQH�RI��EHVW�ILW���&RXOG�LW�EH�XVHG�WR�SUHGLFW�WKH�VFRUHV�RI�RWKHU�VWXGHQWV"Explain your reasoning.
62/87,21���Apply a linear regression model to the data. Use the number of each test as the independent variable and the score on each test as the dependent variable. If there is no correlation, the r value will not be close to 1 or í1. If this is the case, the line of fit could not be used to predict the scores of the other students.
����23(1�(1'('� For 10 different people, measure their heights and the lengths of their heads from chin to top. Use these data to generate a linear regression equation and a median-fit equation. Make a prediction using both of the equations.
62/87,21���Student should gather and record data and use a calculator to find the equation of linear regression and a median-fit equation. Students should make predictions based on both equations. � 6DPSOH�GDWD��
� Median-fit (Store in Y1)
y = 8.31x ± 3.12 � /LQHDU�UHJUHVVLRQ���6WRUH�LQ Y2)
y = 7.39x + 5.22 � Find the height of a student with chin to top of head measure of 8.1. Use the value option from the CALC menu. Use the up arrow to move from one line to another. �
�
� The median-fit line predicts a student¶s height of 64.17 inches and the linear regression line predicts a height of 65.07.
Chin to 7RS��RI�
Head Measure Height8.8 70.99.1 72.89.3 73.87.5 61.08.4 66.37.8 62.08.5 67.38.8 68.98.3 68.78.9 71.5
����WRITING IN MATH How are lines of fit and linear regression similar? different?
62/87,21���Sample answer: Both lines of fit and linear regression are used to model data. However, you could have numerous lines of fit, while linear regression results in one line of best fit. If linear regression is used, you can also use the correlation coefficient to see how closely the model fits the data. For example, the scatter plot below displays the points (1, 10), (2, 17), (3, 15), (4, 20), (5, 28), (6, 19), and (7, 25). �
$�OLQH�RI�ILW�FRXOG�EH�GUDZQ�WKURXJK���������DQG����������7KH�HTXDWLRQ�RI�WKLV�OLQH�RI�ILW�LV�� .
� Use a calculator to find the equation of the regression line for this data. �
� The only regression line for this data has an equation of about y = 2.2x����������
����*(20(75<� Sam is putting a border around a poster. x represents the poster¶s width, and y represents the poster¶s length. Which equation represents how much border Sam will use if he doubles the length and the width? � $� 4xy � %� (x + y)4 � &� 4(x + y) � '� 16(x + y)
62/87,21���The perimeter of the room is found by . y is the length and x is the width, so . But Sam wants to double the border, so the perimeter becomes: �
� So, the correct choice is C.
����6+257�5(63216(� Tatiana wants to run 5 miles at an average pace of 9 minutes per mile. After 4 miles, her average pace is 9 minutes 10 seconds. In how many minutes must she complete the final mile to reach her goal?
62/87,21���Tatiana ran each of the first 4 miles in 10 more seconds than she planned. So to reach her goal, she must run the lastmile in 40 seconds less than she planned. 9 min ± 40 s = 8 min and 20 s.
����What is the slope of the line that passes through (1, 3) and (í3, 1)?� )� í2 �
*��
�
+��
� -� 2
62/87,21���
� So, the correct choice is H.
����What is an equation of the line that passes through (0, 1) and has a slope of 3?� $� y = 3x í 1 � %� y = 3x í 2 � &� y = 3x + 4 � '� y = 3x + 1
62/87,21���Find the y-intercept. �
� The equation is y = 3x + 1. So, the correct choice is D.
����86('�&$56� Gianna wants to buy a specific make and model of a used car. She researched prices from dealers and private sellers and made the graph shown. �
� D�� Describe the relationship in the data. � E�� Use the line of fit to predict the price of a car that is 7 years old. � F�� Is it reasonable to use this line of fit to predict the price of a 10-year old car? Explain.
62/87,21���a. Because y decreases as x increases, there is a negative correlation in the data. � b. Find x = 7 on the graph and follow the line up to the line of fit. According to the graph, the price of a car that is 7 years old would be about $3600. � c. No, it would not be reasonable to use this line of fit to predict the price of a 10-year old car, because according to the line of fit, the cost would be $0 and that doesn¶t make sense.
����*(20(75<� A quadrilateral has sides with equations y = í2x, 2x + y = 6, , and x í 2y = 9. Is the figure a rectangle? Explain your reasoning.
62/87,21���Write all of the equations in slope-intercept form. � Equation 1: y = í2x � (TXDWLRQ���� �
� (TXDWLRQ����
������������������y = x + 6 � Equation 4:� �
� Find the slope of each line �
� The slope of opposite sides are equal (±2 and ±���DQG�����DQG�������VR�WKH\�DUH�SDUDOOHO��$OVR��WKH�VORSH�RI�consecutive sides are opposite reciprocals (±2 and 0.5; and ±2 and 0.5), so they are perpendicular. So, the figure is a rectangle.
y = í2x í2y = ±2x +6 í2
y = 0.5x + 6
y = 0.5x ± 4.5
Write each equation in standard form.����y í 2 = 3(x í 1)
62/87,21���
����y í 5 = 6(x + 1)
62/87,21���
����y + 2 = í2(x í 5)
62/87,21���
����
62/87,21���
����
62/87,21���
����
62/87,21���
Find the slope of the line that passes through each pair of points.����(3, 4), (10, 8)
62/87,21���
����(í4, 7), (3, 5)
62/87,21���
����(3, 7), (í2, 4)
62/87,21���
����(í3, 2), (í3, 4)
62/87,21���
The slope is undefined.
If f (x) = x2 í x + 1, find each value.����f (í1)
62/87,21���
����f (5) í3
62/87,21���
����f (a)
62/87,21���
����f (b2)
62/87,21���
Graph each equation.����y = x + 2
62/87,21���To graph the equation, plot the y-intercept (0, 2). Then move up 1 unit and right 1 unit. Plot the point. Draw a line through the two points.
����x + 5y = 4
62/87,21���Write the equation in slope-intercept form. �
To graph the equation, plot the y-LQWHUFHSW�� . Then move down 1 unit and right 5 units. Plot the point. Draw a
line through the two points. �
����2x í 3y = 6
62/87,21���Write the equation in slope-intercept form. �
� To graph the equation, plot the y-intercept (0, ±2). Then move up 2 units and right 3 units. Plot the point. Draw a line through the two points. �
����5x + 2y = 6
62/87,21���Write the equation in slope-intercept form. �
� To graph the equation, plot the y-intercept (0, 3). Then move down 5 units and right 2 units. Plot the point. Draw a line through the two points. �
Another line of fit may pass through (2, 15) and (7, 25). The equation of this line of fit is y = 2x + 11. More lines of fit that come close to the points could be drawn.
eSolutions Manual - Powered by Cognero Page 2
4-6 Regression and Median-Fit Lines

���3277(5<� $�ORFDO�XQLYHUVLW\�LV�NHHSLQJ�WUDFN�RI�WKH�QXPEHU�RI�DUW�VWXGHQWV�ZKR�XVH�WKH�SRWWHU\�VWXGLR�HDFK�GD\�� �
� a. Write an equation of the regression line and find the correlation coefficient. � b. Graph the residual plot and determine if the regression line models the data well.
62/87,21���D��Use a calculator to find the equation of the regression line. � Step 1: Enter the data by pressing STAT and selecting the EDIT option. . Enter the day into List 1 (L1). These willrepresent the x-values. Enter the number of students into List 2 (L2). These will represent the y-values. � Step 2: Perform the regression by pressing STAT �DQG�VHOHFWLQJ�WKH�CALC option. Scroll down to LinReg(ax+ b) and press ENTER. �
� Substitute the values in for a and b to write the equation of the regression line. So, the equation is y = 1.18x + 11. � Identify the value of r on the calculator to find the correlation coefficient. So, 0.7181 is the correlation coefficient. � b.�7XUQ�RQ�Plot2 under the STAT PLOT menu and choose scatter plot. Use L1 for the Xlist and RESID for the Ylist. You can obtain RESID by pressing 2nd STAT and selecting RESID from the list of names. Graph the scatter plot of the residuals by pressing ZOOM and choosing ZoomStat. �
� The residuals appear to be randomly scattered, so the regression line fits the data reasonably well. �
���&20387(56� The table below shows the percent of Americans with a broadband connection at home in a recentyear. Use linear extrapolation and a regression equation to estimate the percentage of 60-year-olds with broadband at home. �
62/87,21���Use a calculator to find the equation of the regression line.�
� y = ±0.34x + 49.48 � Substitute 60 into the equation. �
� So, about 29% of 60-year-olds have broadband at home.
���9$&$7,21� The Smiths want to rent a house on the lake that sleeps eight people. The cost of the house per night is based on how close it is to the water. �
� D�� Find and graph an equation for the median-fit line. � E�� What would you estimate is the cost of a rental 1.75 miles from the lake?
62/87,21���a. Use a calculator to find and graph the equation of the median fit line. �
y = í271.88x + 554.48
� b. To estimate the cost of a rental 1.75 miles from the lake, evaluate the equation of the median-fit line for x = 1.75.�
� An estimate of the cost of a rental 1.75 miles from the lake is $78.69.
Write an equation of the regression line for the data in each table. Then find the correlation coefficient.���6.<6&5$3(56� The table ranks the ten tallest buildings in the world. �
62/87,21���Use a calculator to find the equation of the regression line.�
� y = í2.75x + 102.53 � Use a calculator to find the correlation coefficient. � í0.6071
���086,&� 7KH�WDEOH�JLYHV�WKH�QXPEHU�RI�DQQXDO�YLROLQ�DXGLWLRQV�KHOG�E\�D�\RXWK�V\PSKRQ\�HDFK�\HDU�VLQFH��������/HW�x be the number of years since 2004. �
�
62/87,21���Use a calculator to find the equation of the regression line.�
� y = 3.54x + 19.68 � Use a calculator to find the correlation coefficient. � 0.9007
���5(7$,/� 7KH�WDEOH�JLYHV�WKH�VDOHV�RI�MHDQV�DW�D�FORWKLQJ�FKDLQ�VLQFH��������/HW�x be the number of years since ������ �
� a. Write an equation of the regression line. � b. Graph and analyze the residual plot.
62/87,21���a. Use a calculator to find the equation of the regression line. �
� The equation is about��\ = 3.32x + 5.20. � E��Use a calculator to graph the residual plot for the data. �
� The residuals appear to be randomly scattered. Therefore, the regression line fits the data well.
���0$5$7+21� 7KH�QXPEHU�RI�HQWUDQWV�LQ�WKH�%RVWRQ�0DUDWKRQ�HYHU\�ILYH�\HDUV�VLQFH������LV�VKRZQ���/HW�x be thenumber of years since 1975. �
� � D�� Find an equation for the median-fit line. � E�� According to the equation, how many entrants were there in 2003?
62/87,21���a. Let x = 0 for 1975. Use a calculator to find the equation of the median fit line. �
� y = 601.44x + 1236.13 � b. To estimate the number of entrants in 2003, evaluate the equation for the median-fit line for x = 2003 ± 1975 = 28.�
� There were about 18,076 entrants in 2003.
���&$03,1*� A campground kept a record of the number of campsites rented over the week of July 4 for several \HDUV���/HW�x be the number of years since 2000. �
� D�� Find an equation for the regression line. � E�� Predict the number of campsites that will be rented in 2012. � F�� Predict the number of campsites that will be rented in 2020.
62/87,21���a. Use a calculator to find an equation for the regression line. �
� y = 3.07x + 32.71 � b. To predict the number of campsites that will be rented in 2012, evaluate the regression equation for x = 12�
� There will be about 70 campsites rented in 2012. � c. To predict the number of campsites that will be rented in 2020, evaluate the regression equation for x = 20.�
� There will be about 94 campsites rented in 2020.
���,&(�&5($0� An ice cream company keeps a count of the tubs of cookie dough ice cream delivered to each of their stores in a particular area. ��
� D�� Find an equation for the median-fit line. � E�� Graph the points and the median-fit line. � F�� How many tubs would be delivered to a 1500-square-foot store? a 5000-square-foot store?
62/87,21���a. Use a calculator to find an equation for the median-fit line. �
� y = 0.095x í 94.58 � b. Plot the points and the equation. �
� c. To estimate the number of tubs to be delivered to a 1500-square-foot store, evaluate the regression equation for x = 1500. �
� There are about 48 tubs delivered to a 1500-square-foot store. To estimate the number of tubs to be delivered to a 5000-square-foot store, evaluate the regression equation for x = 5000. �
� There are about 380 tubs delivered to a 5000-square-foot store.
����CCSS SENSE-0$.,1*� The prices of the eight top-selling brands of jeans at Jeanie¶s Jeans are given in the table below. �
� D�� Find the equation for the regression line. � E�� According to the equation, what would be the price of a pair of the 12th best-selling brand? � F�� Is this a reasonable prediction? Explain.
62/87,21���a. Use a calculator to find an equation for the regression line. �
Step 1: Enter the data by pressing and selecting the EDIT option. Enter the sales rank into List 1 (L1). These will represent the x-values. Enter the price into List 2 (L2). These will represent the y-values. �
Step 2: Perform the regression by pressing �DQG�VHOHFWLQJ�WKH�CALC option. Scroll down to LinReg(ax+
b) and press . �
� y = 9.8x + 28.79 � b. To predict the price of a pair of the 12th bestselling brands of jeans, evaluate the regression equation for x = 12. �
� The price of a pair of the 12th bestselling brands of jeans would be about $146.39. � F�� Sample answer: No; the correlation between sales rank and price is too weak to make any reasonable prediction. The 12th bestselling brand of jeans could just as easily be a poorly made pair of jeans selling for $15.
����67$7(�)$,56� The table shows the total attendance, in millions of people, at the Minnesota State Fair from 2005 to 2009. �
� D��Graph a scatter plot of the data, where x = 1 represents 2005. Then find and graph the equation for the best-fit line. � b. Graph and analyze the residual plot. � c.��3UHGLFW�WKH�WRWDO�DWWHQGDQFH�LQ������ �
62/87,21���a. Enter the data from the table into the lists. Let x be the years starting with x = 1 for 2005 and let y = the attendence (in millions). Then graph the scatter plot. �
�
[0, 6] scl: 1 by [0, 3] scl: 0.5 � Perform the linear regression using the data in the lists. Find the equation of the best-fit line. �
� The equation is about y = 0.0326x + 1.598. � Use Y= to enter the equation into the calculator and graph the best-fit line with the scatter plot. �
[0, 6] scl: 1 by [0, 3] scl: 0.5 � b. Use the calculator to graph the residual plot for the data. �
� All the residuals appear to almost be on the line. Therefore, the regression line is a good fit for the data. � F���0HWKRG����To find the number of people in 2020, substitute 16 for x��
� Method 2: Copy the equation to the Y= list and graph. Use the value option to find the value of y when x = 16. �
[0, 17] scl: 1 by [0, 3] scl: 0.5 � 6R��WKHUH�ZLOO�EH�DERXW������PLOOLRQ�SHRSOH�LQ�������
����),5(),*+7(56� 7KH�WDEOH�VKRZV�VWDWLVWLFV�IURP�WKH�8�6��)LUH�$GPLQLVWUDWLRQ�� �
� D�� Find an equation for the median-fit line. � E�� Graph the points and the median-fit line. � F�� Does the median-fit line give you an accurate picture of the number of firefighters? Explain.
62/87,21���a. Use a calculator to find an equation for the median-fit line. �
Step 1: Enter the data by pressing and selecting the EDIT option. Enter age into List 1 (L1). These will represent the x-values. Enter the number of firefighters into List 2 (L2). These will represent the y-values. �
Step 2: Perform the regression by pressing and selecting the CALC option. Scroll down to Med-Med
and press �� �
� y = í841.42x + 223288 � b. Plot the points and graph the median fit line. �
� c. No, the median-fit line does not give an accurate picture of the number of firefighters. The points show no linear correlation; therefore a line cannot accurately portray the data.
����$7+/(7,&6� The table shows the total number of teens who participated in high school athletics in various years. �
� � D�� Find an equation for the regression line. � E�� According to the equation, how many participated in 1988?
62/87,21���a. Use a calculator to find an equation for the regression line. �
Step 1: Enter the data by pressing and selecting the EDIT option. Let the year 1970 be represented by 0. Enter the years since 1970 into List 1 (L1). These will represent the x-values. Enter the number of athletes into List 2 (L2). These will represent the y-values. �
Step 2: Perform the regression by pressing and selecting the CALC option. Scroll down to LinReg(ax+
b) and press . �
� y = 87,390.5x + 4,018,431 � b. To estimate the number of participants in 1988, evaluate the regression equation for x = 18 because 1988 is 18 years after 1970. �
� There were about 5,591,460 participants in 1988.
����$57� $�FRXQW�ZDV�NHSW�RQ�WKH�QXPEHU�RI�SDLQWLQJV�WKDW�VROG�DW�DQ�DXFWLRQ�E\�WKH�\HDU�LQ�ZKLFK�WKH\�ZHUH�SDLQWHG���Let x be the number of years since 1950. �
� D�� Find the equation for the linear regression line. � E�� How many paintings were sold that were painted in 1961? � F�� Is the linear regression equation an accurate model of the data? Explain why or why not.
62/87,21���a. 8VH�D�FDOFXODWRU�WR�ILQG�DQ�HTXDWLRQ�IRU�WKH�UHJUHVVLRQ�OLQH�� �
Step 1: Enter the data by pressing and selecting the EDIT option. Let x =0 for the year 1950.. Enter the years since 1950 into List 1 (L1). These will represent the x-values. Enter the number of painting sold into List 2 (L2). These will represent the y-values. �
Step 2: Perform the regression by pressing �DQG�VHOHFWLQJ�WKH�CALC option. Scroll down to LinReg(ax+
b) and press . � �
� y = 0.446x +9.43 � b. 7R�HVWLPDWH�WKH�QXPEHU�RI�SDLQWLQJV�VROG�LQ�������HYDOXDWH�WKH�UHJUHVVLRQ�HTXDWLRQ�IRU������ZKHQ��x =11. �
� There were about 14 paintings sold in 1961. � F�� No, the correlation coefficient is 0.48, so the linear model is not a good fit for the data. It does not appear from the data that there is a relationship between the number of paintings sold and the year they were painted.
����&&66�$5*80(176� Below are the results of the World Superpipe Championships in 2008.\ �
� � Find an equation of the regression line for each, and graph them on the same coordinate plane. Compare and contrast the men¶s and women's graphs.
62/87,21���Use a calculator to find an equation of the regression line for each set of data.� Men: y = í2.92x + 95.92 Women: y = í7x+106 � Graph the equations on the same coordinate plane. �
� The women¶s scores are typically lower than the men¶s.
����5($621,1*� For a class project, the scores that 10 randomly selected students earned on the first 8 tests of the VFKRRO�\HDU�DUH�JLYHQ��([SODLQ�KRZ�WR�ILQG�D�OLQH�RI��EHVW�ILW���&RXOG�LW�EH�XVHG�WR�SUHGLFW�WKH�VFRUHV�RI�RWKHU�VWXGHQWV"Explain your reasoning.
62/87,21���Apply a linear regression model to the data. Use the number of each test as the independent variable and the score on each test as the dependent variable. If there is no correlation, the r value will not be close to 1 or í1. If this is the case, the line of fit could not be used to predict the scores of the other students.
����23(1�(1'('� For 10 different people, measure their heights and the lengths of their heads from chin to top. Use these data to generate a linear regression equation and a median-fit equation. Make a prediction using both of the equations.
62/87,21���Student should gather and record data and use a calculator to find the equation of linear regression and a median-fit equation. Students should make predictions based on both equations. � 6DPSOH�GDWD��
� Median-fit (Store in Y1)
y = 8.31x ± 3.12 � /LQHDU�UHJUHVVLRQ���6WRUH�LQ Y2)
y = 7.39x + 5.22 � Find the height of a student with chin to top of head measure of 8.1. Use the value option from the CALC menu. Use the up arrow to move from one line to another. �
�
� The median-fit line predicts a student¶s height of 64.17 inches and the linear regression line predicts a height of 65.07.
Chin to 7RS��RI�
Head Measure Height8.8 70.99.1 72.89.3 73.87.5 61.08.4 66.37.8 62.08.5 67.38.8 68.98.3 68.78.9 71.5
����WRITING IN MATH How are lines of fit and linear regression similar? different?
62/87,21���Sample answer: Both lines of fit and linear regression are used to model data. However, you could have numerous lines of fit, while linear regression results in one line of best fit. If linear regression is used, you can also use the correlation coefficient to see how closely the model fits the data. For example, the scatter plot below displays the points (1, 10), (2, 17), (3, 15), (4, 20), (5, 28), (6, 19), and (7, 25). �
$�OLQH�RI�ILW�FRXOG�EH�GUDZQ�WKURXJK���������DQG����������7KH�HTXDWLRQ�RI�WKLV�OLQH�RI�ILW�LV�� .
� Use a calculator to find the equation of the regression line for this data. �
� The only regression line for this data has an equation of about y = 2.2x����������
����*(20(75<� Sam is putting a border around a poster. x represents the poster¶s width, and y represents the poster¶s length. Which equation represents how much border Sam will use if he doubles the length and the width? � $� 4xy � %� (x + y)4 � &� 4(x + y) � '� 16(x + y)
62/87,21���The perimeter of the room is found by . y is the length and x is the width, so . But Sam wants to double the border, so the perimeter becomes: �
� So, the correct choice is C.
����6+257�5(63216(� Tatiana wants to run 5 miles at an average pace of 9 minutes per mile. After 4 miles, her average pace is 9 minutes 10 seconds. In how many minutes must she complete the final mile to reach her goal?
62/87,21���Tatiana ran each of the first 4 miles in 10 more seconds than she planned. So to reach her goal, she must run the lastmile in 40 seconds less than she planned. 9 min ± 40 s = 8 min and 20 s.
����What is the slope of the line that passes through (1, 3) and (í3, 1)?� )� í2 �
*��
�
+��
� -� 2
62/87,21���
� So, the correct choice is H.
����What is an equation of the line that passes through (0, 1) and has a slope of 3?� $� y = 3x í 1 � %� y = 3x í 2 � &� y = 3x + 4 � '� y = 3x + 1
62/87,21���Find the y-intercept. �
� The equation is y = 3x + 1. So, the correct choice is D.
����86('�&$56� Gianna wants to buy a specific make and model of a used car. She researched prices from dealers and private sellers and made the graph shown. �
� D�� Describe the relationship in the data. � E�� Use the line of fit to predict the price of a car that is 7 years old. � F�� Is it reasonable to use this line of fit to predict the price of a 10-year old car? Explain.
62/87,21���a. Because y decreases as x increases, there is a negative correlation in the data. � b. Find x = 7 on the graph and follow the line up to the line of fit. According to the graph, the price of a car that is 7 years old would be about $3600. � c. No, it would not be reasonable to use this line of fit to predict the price of a 10-year old car, because according to the line of fit, the cost would be $0 and that doesn¶t make sense.
����*(20(75<� A quadrilateral has sides with equations y = í2x, 2x + y = 6, , and x í 2y = 9. Is the figure a rectangle? Explain your reasoning.
62/87,21���Write all of the equations in slope-intercept form. � Equation 1: y = í2x � (TXDWLRQ���� �
� (TXDWLRQ����
������������������y = x + 6 � Equation 4:� �
� Find the slope of each line �
� The slope of opposite sides are equal (±2 and ±���DQG�����DQG�������VR�WKH\�DUH�SDUDOOHO��$OVR��WKH�VORSH�RI�consecutive sides are opposite reciprocals (±2 and 0.5; and ±2 and 0.5), so they are perpendicular. So, the figure is a rectangle.
y = í2x í2y = ±2x +6 í2
y = 0.5x + 6
y = 0.5x ± 4.5
Write each equation in standard form.����y í 2 = 3(x í 1)
62/87,21���
����y í 5 = 6(x + 1)
62/87,21���
����y + 2 = í2(x í 5)
62/87,21���
����
62/87,21���
����
62/87,21���
����
62/87,21���
Find the slope of the line that passes through each pair of points.����(3, 4), (10, 8)
62/87,21���
����(í4, 7), (3, 5)
62/87,21���
����(3, 7), (í2, 4)
62/87,21���
����(í3, 2), (í3, 4)
62/87,21���
The slope is undefined.
If f (x) = x2 í x + 1, find each value.����f (í1)
62/87,21���
����f (5) í3
62/87,21���
����f (a)
62/87,21���
����f (b2)
62/87,21���
Graph each equation.����y = x + 2
62/87,21���To graph the equation, plot the y-intercept (0, 2). Then move up 1 unit and right 1 unit. Plot the point. Draw a line through the two points.
����x + 5y = 4
62/87,21���Write the equation in slope-intercept form. �
To graph the equation, plot the y-LQWHUFHSW�� . Then move down 1 unit and right 5 units. Plot the point. Draw a
line through the two points. �
����2x í 3y = 6
62/87,21���Write the equation in slope-intercept form. �
� To graph the equation, plot the y-intercept (0, ±2). Then move up 2 units and right 3 units. Plot the point. Draw a line through the two points. �
����5x + 2y = 6
62/87,21���Write the equation in slope-intercept form. �
� To graph the equation, plot the y-intercept (0, 3). Then move down 5 units and right 2 units. Plot the point. Draw a line through the two points. �
Another line of fit may pass through (2, 15) and (7, 25). The equation of this line of fit is y = 2x + 11. More lines of fit that come close to the points could be drawn.
eSolutions Manual - Powered by Cognero Page 3
4-6 Regression and Median-Fit Lines

���3277(5<� $�ORFDO�XQLYHUVLW\�LV�NHHSLQJ�WUDFN�RI�WKH�QXPEHU�RI�DUW�VWXGHQWV�ZKR�XVH�WKH�SRWWHU\�VWXGLR�HDFK�GD\�� �
� a. Write an equation of the regression line and find the correlation coefficient. � b. Graph the residual plot and determine if the regression line models the data well.
62/87,21���D��Use a calculator to find the equation of the regression line. � Step 1: Enter the data by pressing STAT and selecting the EDIT option. . Enter the day into List 1 (L1). These willrepresent the x-values. Enter the number of students into List 2 (L2). These will represent the y-values. � Step 2: Perform the regression by pressing STAT �DQG�VHOHFWLQJ�WKH�CALC option. Scroll down to LinReg(ax+ b) and press ENTER. �
� Substitute the values in for a and b to write the equation of the regression line. So, the equation is y = 1.18x + 11. � Identify the value of r on the calculator to find the correlation coefficient. So, 0.7181 is the correlation coefficient. � b.�7XUQ�RQ�Plot2 under the STAT PLOT menu and choose scatter plot. Use L1 for the Xlist and RESID for the Ylist. You can obtain RESID by pressing 2nd STAT and selecting RESID from the list of names. Graph the scatter plot of the residuals by pressing ZOOM and choosing ZoomStat. �
� The residuals appear to be randomly scattered, so the regression line fits the data reasonably well. �
���&20387(56� The table below shows the percent of Americans with a broadband connection at home in a recentyear. Use linear extrapolation and a regression equation to estimate the percentage of 60-year-olds with broadband at home. �
62/87,21���Use a calculator to find the equation of the regression line.�
� y = ±0.34x + 49.48 � Substitute 60 into the equation. �
� So, about 29% of 60-year-olds have broadband at home.
���9$&$7,21� The Smiths want to rent a house on the lake that sleeps eight people. The cost of the house per night is based on how close it is to the water. �
� D�� Find and graph an equation for the median-fit line. � E�� What would you estimate is the cost of a rental 1.75 miles from the lake?
62/87,21���a. Use a calculator to find and graph the equation of the median fit line. �
y = í271.88x + 554.48
� b. To estimate the cost of a rental 1.75 miles from the lake, evaluate the equation of the median-fit line for x = 1.75.�
� An estimate of the cost of a rental 1.75 miles from the lake is $78.69.
Write an equation of the regression line for the data in each table. Then find the correlation coefficient.���6.<6&5$3(56� The table ranks the ten tallest buildings in the world. �
62/87,21���Use a calculator to find the equation of the regression line.�
� y = í2.75x + 102.53 � Use a calculator to find the correlation coefficient. � í0.6071
���086,&� 7KH�WDEOH�JLYHV�WKH�QXPEHU�RI�DQQXDO�YLROLQ�DXGLWLRQV�KHOG�E\�D�\RXWK�V\PSKRQ\�HDFK�\HDU�VLQFH��������/HW�x be the number of years since 2004. �
�
62/87,21���Use a calculator to find the equation of the regression line.�
� y = 3.54x + 19.68 � Use a calculator to find the correlation coefficient. � 0.9007
���5(7$,/� 7KH�WDEOH�JLYHV�WKH�VDOHV�RI�MHDQV�DW�D�FORWKLQJ�FKDLQ�VLQFH��������/HW�x be the number of years since ������ �
� a. Write an equation of the regression line. � b. Graph and analyze the residual plot.
62/87,21���a. Use a calculator to find the equation of the regression line. �
� The equation is about��\ = 3.32x + 5.20. � E��Use a calculator to graph the residual plot for the data. �
� The residuals appear to be randomly scattered. Therefore, the regression line fits the data well.
���0$5$7+21� 7KH�QXPEHU�RI�HQWUDQWV�LQ�WKH�%RVWRQ�0DUDWKRQ�HYHU\�ILYH�\HDUV�VLQFH������LV�VKRZQ���/HW�x be thenumber of years since 1975. �
� � D�� Find an equation for the median-fit line. � E�� According to the equation, how many entrants were there in 2003?
62/87,21���a. Let x = 0 for 1975. Use a calculator to find the equation of the median fit line. �
� y = 601.44x + 1236.13 � b. To estimate the number of entrants in 2003, evaluate the equation for the median-fit line for x = 2003 ± 1975 = 28.�
� There were about 18,076 entrants in 2003.
���&$03,1*� A campground kept a record of the number of campsites rented over the week of July 4 for several \HDUV���/HW�x be the number of years since 2000. �
� D�� Find an equation for the regression line. � E�� Predict the number of campsites that will be rented in 2012. � F�� Predict the number of campsites that will be rented in 2020.
62/87,21���a. Use a calculator to find an equation for the regression line. �
� y = 3.07x + 32.71 � b. To predict the number of campsites that will be rented in 2012, evaluate the regression equation for x = 12�
� There will be about 70 campsites rented in 2012. � c. To predict the number of campsites that will be rented in 2020, evaluate the regression equation for x = 20.�
� There will be about 94 campsites rented in 2020.
���,&(�&5($0� An ice cream company keeps a count of the tubs of cookie dough ice cream delivered to each of their stores in a particular area. ��
� D�� Find an equation for the median-fit line. � E�� Graph the points and the median-fit line. � F�� How many tubs would be delivered to a 1500-square-foot store? a 5000-square-foot store?
62/87,21���a. Use a calculator to find an equation for the median-fit line. �
� y = 0.095x í 94.58 � b. Plot the points and the equation. �
� c. To estimate the number of tubs to be delivered to a 1500-square-foot store, evaluate the regression equation for x = 1500. �
� There are about 48 tubs delivered to a 1500-square-foot store. To estimate the number of tubs to be delivered to a 5000-square-foot store, evaluate the regression equation for x = 5000. �
� There are about 380 tubs delivered to a 5000-square-foot store.
����CCSS SENSE-0$.,1*� The prices of the eight top-selling brands of jeans at Jeanie¶s Jeans are given in the table below. �
� D�� Find the equation for the regression line. � E�� According to the equation, what would be the price of a pair of the 12th best-selling brand? � F�� Is this a reasonable prediction? Explain.
62/87,21���a. Use a calculator to find an equation for the regression line. �
Step 1: Enter the data by pressing and selecting the EDIT option. Enter the sales rank into List 1 (L1). These will represent the x-values. Enter the price into List 2 (L2). These will represent the y-values. �
Step 2: Perform the regression by pressing �DQG�VHOHFWLQJ�WKH�CALC option. Scroll down to LinReg(ax+
b) and press . �
� y = 9.8x + 28.79 � b. To predict the price of a pair of the 12th bestselling brands of jeans, evaluate the regression equation for x = 12. �
� The price of a pair of the 12th bestselling brands of jeans would be about $146.39. � F�� Sample answer: No; the correlation between sales rank and price is too weak to make any reasonable prediction. The 12th bestselling brand of jeans could just as easily be a poorly made pair of jeans selling for $15.
����67$7(�)$,56� The table shows the total attendance, in millions of people, at the Minnesota State Fair from 2005 to 2009. �
� D��Graph a scatter plot of the data, where x = 1 represents 2005. Then find and graph the equation for the best-fit line. � b. Graph and analyze the residual plot. � c.��3UHGLFW�WKH�WRWDO�DWWHQGDQFH�LQ������ �
62/87,21���a. Enter the data from the table into the lists. Let x be the years starting with x = 1 for 2005 and let y = the attendence (in millions). Then graph the scatter plot. �
�
[0, 6] scl: 1 by [0, 3] scl: 0.5 � Perform the linear regression using the data in the lists. Find the equation of the best-fit line. �
� The equation is about y = 0.0326x + 1.598. � Use Y= to enter the equation into the calculator and graph the best-fit line with the scatter plot. �
[0, 6] scl: 1 by [0, 3] scl: 0.5 � b. Use the calculator to graph the residual plot for the data. �
� All the residuals appear to almost be on the line. Therefore, the regression line is a good fit for the data. � F���0HWKRG����To find the number of people in 2020, substitute 16 for x��
� Method 2: Copy the equation to the Y= list and graph. Use the value option to find the value of y when x = 16. �
[0, 17] scl: 1 by [0, 3] scl: 0.5 � 6R��WKHUH�ZLOO�EH�DERXW������PLOOLRQ�SHRSOH�LQ�������
����),5(),*+7(56� 7KH�WDEOH�VKRZV�VWDWLVWLFV�IURP�WKH�8�6��)LUH�$GPLQLVWUDWLRQ�� �
� D�� Find an equation for the median-fit line. � E�� Graph the points and the median-fit line. � F�� Does the median-fit line give you an accurate picture of the number of firefighters? Explain.
62/87,21���a. Use a calculator to find an equation for the median-fit line. �
Step 1: Enter the data by pressing and selecting the EDIT option. Enter age into List 1 (L1). These will represent the x-values. Enter the number of firefighters into List 2 (L2). These will represent the y-values. �
Step 2: Perform the regression by pressing and selecting the CALC option. Scroll down to Med-Med
and press �� �
� y = í841.42x + 223288 � b. Plot the points and graph the median fit line. �
� c. No, the median-fit line does not give an accurate picture of the number of firefighters. The points show no linear correlation; therefore a line cannot accurately portray the data.
����$7+/(7,&6� The table shows the total number of teens who participated in high school athletics in various years. �
� � D�� Find an equation for the regression line. � E�� According to the equation, how many participated in 1988?
62/87,21���a. Use a calculator to find an equation for the regression line. �
Step 1: Enter the data by pressing and selecting the EDIT option. Let the year 1970 be represented by 0. Enter the years since 1970 into List 1 (L1). These will represent the x-values. Enter the number of athletes into List 2 (L2). These will represent the y-values. �
Step 2: Perform the regression by pressing and selecting the CALC option. Scroll down to LinReg(ax+
b) and press . �
� y = 87,390.5x + 4,018,431 � b. To estimate the number of participants in 1988, evaluate the regression equation for x = 18 because 1988 is 18 years after 1970. �
� There were about 5,591,460 participants in 1988.
����$57� $�FRXQW�ZDV�NHSW�RQ�WKH�QXPEHU�RI�SDLQWLQJV�WKDW�VROG�DW�DQ�DXFWLRQ�E\�WKH�\HDU�LQ�ZKLFK�WKH\�ZHUH�SDLQWHG���Let x be the number of years since 1950. �
� D�� Find the equation for the linear regression line. � E�� How many paintings were sold that were painted in 1961? � F�� Is the linear regression equation an accurate model of the data? Explain why or why not.
62/87,21���a. 8VH�D�FDOFXODWRU�WR�ILQG�DQ�HTXDWLRQ�IRU�WKH�UHJUHVVLRQ�OLQH�� �
Step 1: Enter the data by pressing and selecting the EDIT option. Let x =0 for the year 1950.. Enter the years since 1950 into List 1 (L1). These will represent the x-values. Enter the number of painting sold into List 2 (L2). These will represent the y-values. �
Step 2: Perform the regression by pressing �DQG�VHOHFWLQJ�WKH�CALC option. Scroll down to LinReg(ax+
b) and press . � �
� y = 0.446x +9.43 � b. 7R�HVWLPDWH�WKH�QXPEHU�RI�SDLQWLQJV�VROG�LQ�������HYDOXDWH�WKH�UHJUHVVLRQ�HTXDWLRQ�IRU������ZKHQ��x =11. �
� There were about 14 paintings sold in 1961. � F�� No, the correlation coefficient is 0.48, so the linear model is not a good fit for the data. It does not appear from the data that there is a relationship between the number of paintings sold and the year they were painted.
����&&66�$5*80(176� Below are the results of the World Superpipe Championships in 2008.\ �
� � Find an equation of the regression line for each, and graph them on the same coordinate plane. Compare and contrast the men¶s and women's graphs.
62/87,21���Use a calculator to find an equation of the regression line for each set of data.� Men: y = í2.92x + 95.92 Women: y = í7x+106 � Graph the equations on the same coordinate plane. �
� The women¶s scores are typically lower than the men¶s.
����5($621,1*� For a class project, the scores that 10 randomly selected students earned on the first 8 tests of the VFKRRO�\HDU�DUH�JLYHQ��([SODLQ�KRZ�WR�ILQG�D�OLQH�RI��EHVW�ILW���&RXOG�LW�EH�XVHG�WR�SUHGLFW�WKH�VFRUHV�RI�RWKHU�VWXGHQWV"Explain your reasoning.
62/87,21���Apply a linear regression model to the data. Use the number of each test as the independent variable and the score on each test as the dependent variable. If there is no correlation, the r value will not be close to 1 or í1. If this is the case, the line of fit could not be used to predict the scores of the other students.
����23(1�(1'('� For 10 different people, measure their heights and the lengths of their heads from chin to top. Use these data to generate a linear regression equation and a median-fit equation. Make a prediction using both of the equations.
62/87,21���Student should gather and record data and use a calculator to find the equation of linear regression and a median-fit equation. Students should make predictions based on both equations. � 6DPSOH�GDWD��
� Median-fit (Store in Y1)
y = 8.31x ± 3.12 � /LQHDU�UHJUHVVLRQ���6WRUH�LQ Y2)
y = 7.39x + 5.22 � Find the height of a student with chin to top of head measure of 8.1. Use the value option from the CALC menu. Use the up arrow to move from one line to another. �
�
� The median-fit line predicts a student¶s height of 64.17 inches and the linear regression line predicts a height of 65.07.
Chin to 7RS��RI�
Head Measure Height8.8 70.99.1 72.89.3 73.87.5 61.08.4 66.37.8 62.08.5 67.38.8 68.98.3 68.78.9 71.5
����WRITING IN MATH How are lines of fit and linear regression similar? different?
62/87,21���Sample answer: Both lines of fit and linear regression are used to model data. However, you could have numerous lines of fit, while linear regression results in one line of best fit. If linear regression is used, you can also use the correlation coefficient to see how closely the model fits the data. For example, the scatter plot below displays the points (1, 10), (2, 17), (3, 15), (4, 20), (5, 28), (6, 19), and (7, 25). �
$�OLQH�RI�ILW�FRXOG�EH�GUDZQ�WKURXJK���������DQG����������7KH�HTXDWLRQ�RI�WKLV�OLQH�RI�ILW�LV�� .
� Use a calculator to find the equation of the regression line for this data. �
� The only regression line for this data has an equation of about y = 2.2x����������
����*(20(75<� Sam is putting a border around a poster. x represents the poster¶s width, and y represents the poster¶s length. Which equation represents how much border Sam will use if he doubles the length and the width? � $� 4xy � %� (x + y)4 � &� 4(x + y) � '� 16(x + y)
62/87,21���The perimeter of the room is found by . y is the length and x is the width, so . But Sam wants to double the border, so the perimeter becomes: �
� So, the correct choice is C.
����6+257�5(63216(� Tatiana wants to run 5 miles at an average pace of 9 minutes per mile. After 4 miles, her average pace is 9 minutes 10 seconds. In how many minutes must she complete the final mile to reach her goal?
62/87,21���Tatiana ran each of the first 4 miles in 10 more seconds than she planned. So to reach her goal, she must run the lastmile in 40 seconds less than she planned. 9 min ± 40 s = 8 min and 20 s.
����What is the slope of the line that passes through (1, 3) and (í3, 1)?� )� í2 �
*��
�
+��
� -� 2
62/87,21���
� So, the correct choice is H.
����What is an equation of the line that passes through (0, 1) and has a slope of 3?� $� y = 3x í 1 � %� y = 3x í 2 � &� y = 3x + 4 � '� y = 3x + 1
62/87,21���Find the y-intercept. �
� The equation is y = 3x + 1. So, the correct choice is D.
����86('�&$56� Gianna wants to buy a specific make and model of a used car. She researched prices from dealers and private sellers and made the graph shown. �
� D�� Describe the relationship in the data. � E�� Use the line of fit to predict the price of a car that is 7 years old. � F�� Is it reasonable to use this line of fit to predict the price of a 10-year old car? Explain.
62/87,21���a. Because y decreases as x increases, there is a negative correlation in the data. � b. Find x = 7 on the graph and follow the line up to the line of fit. According to the graph, the price of a car that is 7 years old would be about $3600. � c. No, it would not be reasonable to use this line of fit to predict the price of a 10-year old car, because according to the line of fit, the cost would be $0 and that doesn¶t make sense.
����*(20(75<� A quadrilateral has sides with equations y = í2x, 2x + y = 6, , and x í 2y = 9. Is the figure a rectangle? Explain your reasoning.
62/87,21���Write all of the equations in slope-intercept form. � Equation 1: y = í2x � (TXDWLRQ���� �
� (TXDWLRQ����
������������������y = x + 6 � Equation 4:� �
� Find the slope of each line �
� The slope of opposite sides are equal (±2 and ±���DQG�����DQG�������VR�WKH\�DUH�SDUDOOHO��$OVR��WKH�VORSH�RI�consecutive sides are opposite reciprocals (±2 and 0.5; and ±2 and 0.5), so they are perpendicular. So, the figure is a rectangle.
y = í2x í2y = ±2x +6 í2
y = 0.5x + 6
y = 0.5x ± 4.5
Write each equation in standard form.����y í 2 = 3(x í 1)
62/87,21���
����y í 5 = 6(x + 1)
62/87,21���
����y + 2 = í2(x í 5)
62/87,21���
����
62/87,21���
����
62/87,21���
����
62/87,21���
Find the slope of the line that passes through each pair of points.����(3, 4), (10, 8)
62/87,21���
����(í4, 7), (3, 5)
62/87,21���
����(3, 7), (í2, 4)
62/87,21���
����(í3, 2), (í3, 4)
62/87,21���
The slope is undefined.
If f (x) = x2 í x + 1, find each value.����f (í1)
62/87,21���
����f (5) í3
62/87,21���
����f (a)
62/87,21���
����f (b2)
62/87,21���
Graph each equation.����y = x + 2
62/87,21���To graph the equation, plot the y-intercept (0, 2). Then move up 1 unit and right 1 unit. Plot the point. Draw a line through the two points.
����x + 5y = 4
62/87,21���Write the equation in slope-intercept form. �
To graph the equation, plot the y-LQWHUFHSW�� . Then move down 1 unit and right 5 units. Plot the point. Draw a
line through the two points. �
����2x í 3y = 6
62/87,21���Write the equation in slope-intercept form. �
� To graph the equation, plot the y-intercept (0, ±2). Then move up 2 units and right 3 units. Plot the point. Draw a line through the two points. �
����5x + 2y = 6
62/87,21���Write the equation in slope-intercept form. �
� To graph the equation, plot the y-intercept (0, 3). Then move down 5 units and right 2 units. Plot the point. Draw a line through the two points. �
Another line of fit may pass through (2, 15) and (7, 25). The equation of this line of fit is y = 2x + 11. More lines of fit that come close to the points could be drawn.
eSolutions Manual - Powered by Cognero Page 4
4-6 Regression and Median-Fit Lines
���3277(5<� $�ORFDO�XQLYHUVLW\�LV�NHHSLQJ�WUDFN�RI�WKH�QXPEHU�RI�DUW�VWXGHQWV�ZKR�XVH�WKH�SRWWHU\�VWXGLR�HDFK�GD\�� �
� a. Write an equation of the regression line and find the correlation coefficient. � b. Graph the residual plot and determine if the regression line models the data well.
62/87,21���D��Use a calculator to find the equation of the regression line. � Step 1: Enter the data by pressing STAT and selecting the EDIT option. . Enter the day into List 1 (L1). These willrepresent the x-values. Enter the number of students into List 2 (L2). These will represent the y-values. � Step 2: Perform the regression by pressing STAT �DQG�VHOHFWLQJ�WKH�CALC option. Scroll down to LinReg(ax+ b) and press ENTER. �
� Substitute the values in for a and b to write the equation of the regression line. So, the equation is y = 1.18x + 11. � Identify the value of r on the calculator to find the correlation coefficient. So, 0.7181 is the correlation coefficient. � b.�7XUQ�RQ�Plot2 under the STAT PLOT menu and choose scatter plot. Use L1 for the Xlist and RESID for the Ylist. You can obtain RESID by pressing 2nd STAT and selecting RESID from the list of names. Graph the scatter plot of the residuals by pressing ZOOM and choosing ZoomStat. �
� The residuals appear to be randomly scattered, so the regression line fits the data reasonably well. �
���&20387(56� The table below shows the percent of Americans with a broadband connection at home in a recentyear. Use linear extrapolation and a regression equation to estimate the percentage of 60-year-olds with broadband at home. �
62/87,21���Use a calculator to find the equation of the regression line.�
� y = ±0.34x + 49.48 � Substitute 60 into the equation. �
� So, about 29% of 60-year-olds have broadband at home.
���9$&$7,21� The Smiths want to rent a house on the lake that sleeps eight people. The cost of the house per night is based on how close it is to the water. �
� D�� Find and graph an equation for the median-fit line. � E�� What would you estimate is the cost of a rental 1.75 miles from the lake?
62/87,21���a. Use a calculator to find and graph the equation of the median fit line. �
y = í271.88x + 554.48
� b. To estimate the cost of a rental 1.75 miles from the lake, evaluate the equation of the median-fit line for x = 1.75.�
� An estimate of the cost of a rental 1.75 miles from the lake is $78.69.
Write an equation of the regression line for the data in each table. Then find the correlation coefficient.���6.<6&5$3(56� The table ranks the ten tallest buildings in the world. �
62/87,21���Use a calculator to find the equation of the regression line.�
� y = í2.75x + 102.53 � Use a calculator to find the correlation coefficient. � í0.6071
���086,&� 7KH�WDEOH�JLYHV�WKH�QXPEHU�RI�DQQXDO�YLROLQ�DXGLWLRQV�KHOG�E\�D�\RXWK�V\PSKRQ\�HDFK�\HDU�VLQFH��������/HW�x be the number of years since 2004. �
�
62/87,21���Use a calculator to find the equation of the regression line.�
� y = 3.54x + 19.68 � Use a calculator to find the correlation coefficient. � 0.9007
���5(7$,/� 7KH�WDEOH�JLYHV�WKH�VDOHV�RI�MHDQV�DW�D�FORWKLQJ�FKDLQ�VLQFH��������/HW�x be the number of years since ������ �
� a. Write an equation of the regression line. � b. Graph and analyze the residual plot.
62/87,21���a. Use a calculator to find the equation of the regression line. �
� The equation is about��\ = 3.32x + 5.20. � E��Use a calculator to graph the residual plot for the data. �
� The residuals appear to be randomly scattered. Therefore, the regression line fits the data well.
���0$5$7+21� 7KH�QXPEHU�RI�HQWUDQWV�LQ�WKH�%RVWRQ�0DUDWKRQ�HYHU\�ILYH�\HDUV�VLQFH������LV�VKRZQ���/HW�x be thenumber of years since 1975. �
� � D�� Find an equation for the median-fit line. � E�� According to the equation, how many entrants were there in 2003?
62/87,21���a. Let x = 0 for 1975. Use a calculator to find the equation of the median fit line. �
� y = 601.44x + 1236.13 � b. To estimate the number of entrants in 2003, evaluate the equation for the median-fit line for x = 2003 ± 1975 = 28.�
� There were about 18,076 entrants in 2003.
���&$03,1*� A campground kept a record of the number of campsites rented over the week of July 4 for several \HDUV���/HW�x be the number of years since 2000. �
� D�� Find an equation for the regression line. � E�� Predict the number of campsites that will be rented in 2012. � F�� Predict the number of campsites that will be rented in 2020.
62/87,21���a. Use a calculator to find an equation for the regression line. �
� y = 3.07x + 32.71 � b. To predict the number of campsites that will be rented in 2012, evaluate the regression equation for x = 12�
� There will be about 70 campsites rented in 2012. � c. To predict the number of campsites that will be rented in 2020, evaluate the regression equation for x = 20.�
� There will be about 94 campsites rented in 2020.
���,&(�&5($0� An ice cream company keeps a count of the tubs of cookie dough ice cream delivered to each of their stores in a particular area. ��
� D�� Find an equation for the median-fit line. � E�� Graph the points and the median-fit line. � F�� How many tubs would be delivered to a 1500-square-foot store? a 5000-square-foot store?
62/87,21���a. Use a calculator to find an equation for the median-fit line. �
� y = 0.095x í 94.58 � b. Plot the points and the equation. �
� c. To estimate the number of tubs to be delivered to a 1500-square-foot store, evaluate the regression equation for x = 1500. �
� There are about 48 tubs delivered to a 1500-square-foot store. To estimate the number of tubs to be delivered to a 5000-square-foot store, evaluate the regression equation for x = 5000. �
� There are about 380 tubs delivered to a 5000-square-foot store.
����CCSS SENSE-0$.,1*� The prices of the eight top-selling brands of jeans at Jeanie¶s Jeans are given in the table below. �
� D�� Find the equation for the regression line. � E�� According to the equation, what would be the price of a pair of the 12th best-selling brand? � F�� Is this a reasonable prediction? Explain.
62/87,21���a. Use a calculator to find an equation for the regression line. �
Step 1: Enter the data by pressing and selecting the EDIT option. Enter the sales rank into List 1 (L1). These will represent the x-values. Enter the price into List 2 (L2). These will represent the y-values. �
Step 2: Perform the regression by pressing �DQG�VHOHFWLQJ�WKH�CALC option. Scroll down to LinReg(ax+
b) and press . �
� y = 9.8x + 28.79 � b. To predict the price of a pair of the 12th bestselling brands of jeans, evaluate the regression equation for x = 12. �
� The price of a pair of the 12th bestselling brands of jeans would be about $146.39. � F�� Sample answer: No; the correlation between sales rank and price is too weak to make any reasonable prediction. The 12th bestselling brand of jeans could just as easily be a poorly made pair of jeans selling for $15.
����67$7(�)$,56� The table shows the total attendance, in millions of people, at the Minnesota State Fair from 2005 to 2009. �
� D��Graph a scatter plot of the data, where x = 1 represents 2005. Then find and graph the equation for the best-fit line. � b. Graph and analyze the residual plot. � c.��3UHGLFW�WKH�WRWDO�DWWHQGDQFH�LQ������ �
62/87,21���a. Enter the data from the table into the lists. Let x be the years starting with x = 1 for 2005 and let y = the attendence (in millions). Then graph the scatter plot. �
�
[0, 6] scl: 1 by [0, 3] scl: 0.5 � Perform the linear regression using the data in the lists. Find the equation of the best-fit line. �
� The equation is about y = 0.0326x + 1.598. � Use Y= to enter the equation into the calculator and graph the best-fit line with the scatter plot. �
[0, 6] scl: 1 by [0, 3] scl: 0.5 � b. Use the calculator to graph the residual plot for the data. �
� All the residuals appear to almost be on the line. Therefore, the regression line is a good fit for the data. � F���0HWKRG����To find the number of people in 2020, substitute 16 for x��
� Method 2: Copy the equation to the Y= list and graph. Use the value option to find the value of y when x = 16. �
[0, 17] scl: 1 by [0, 3] scl: 0.5 � 6R��WKHUH�ZLOO�EH�DERXW������PLOOLRQ�SHRSOH�LQ�������
����),5(),*+7(56� 7KH�WDEOH�VKRZV�VWDWLVWLFV�IURP�WKH�8�6��)LUH�$GPLQLVWUDWLRQ�� �
� D�� Find an equation for the median-fit line. � E�� Graph the points and the median-fit line. � F�� Does the median-fit line give you an accurate picture of the number of firefighters? Explain.
62/87,21���a. Use a calculator to find an equation for the median-fit line. �
Step 1: Enter the data by pressing and selecting the EDIT option. Enter age into List 1 (L1). These will represent the x-values. Enter the number of firefighters into List 2 (L2). These will represent the y-values. �
Step 2: Perform the regression by pressing and selecting the CALC option. Scroll down to Med-Med
and press �� �
� y = í841.42x + 223288 � b. Plot the points and graph the median fit line. �
� c. No, the median-fit line does not give an accurate picture of the number of firefighters. The points show no linear correlation; therefore a line cannot accurately portray the data.
����$7+/(7,&6� The table shows the total number of teens who participated in high school athletics in various years. �
� � D�� Find an equation for the regression line. � E�� According to the equation, how many participated in 1988?
62/87,21���a. Use a calculator to find an equation for the regression line. �
Step 1: Enter the data by pressing and selecting the EDIT option. Let the year 1970 be represented by 0. Enter the years since 1970 into List 1 (L1). These will represent the x-values. Enter the number of athletes into List 2 (L2). These will represent the y-values. �
Step 2: Perform the regression by pressing and selecting the CALC option. Scroll down to LinReg(ax+
b) and press . �
� y = 87,390.5x + 4,018,431 � b. To estimate the number of participants in 1988, evaluate the regression equation for x = 18 because 1988 is 18 years after 1970. �
� There were about 5,591,460 participants in 1988.
����$57� $�FRXQW�ZDV�NHSW�RQ�WKH�QXPEHU�RI�SDLQWLQJV�WKDW�VROG�DW�DQ�DXFWLRQ�E\�WKH�\HDU�LQ�ZKLFK�WKH\�ZHUH�SDLQWHG���Let x be the number of years since 1950. �
� D�� Find the equation for the linear regression line. � E�� How many paintings were sold that were painted in 1961? � F�� Is the linear regression equation an accurate model of the data? Explain why or why not.
62/87,21���a. 8VH�D�FDOFXODWRU�WR�ILQG�DQ�HTXDWLRQ�IRU�WKH�UHJUHVVLRQ�OLQH�� �
Step 1: Enter the data by pressing and selecting the EDIT option. Let x =0 for the year 1950.. Enter the years since 1950 into List 1 (L1). These will represent the x-values. Enter the number of painting sold into List 2 (L2). These will represent the y-values. �
Step 2: Perform the regression by pressing �DQG�VHOHFWLQJ�WKH�CALC option. Scroll down to LinReg(ax+
b) and press . � �
� y = 0.446x +9.43 � b. 7R�HVWLPDWH�WKH�QXPEHU�RI�SDLQWLQJV�VROG�LQ�������HYDOXDWH�WKH�UHJUHVVLRQ�HTXDWLRQ�IRU������ZKHQ��x =11. �
� There were about 14 paintings sold in 1961. � F�� No, the correlation coefficient is 0.48, so the linear model is not a good fit for the data. It does not appear from the data that there is a relationship between the number of paintings sold and the year they were painted.
����&&66�$5*80(176� Below are the results of the World Superpipe Championships in 2008.\ �
� � Find an equation of the regression line for each, and graph them on the same coordinate plane. Compare and contrast the men¶s and women's graphs.
62/87,21���Use a calculator to find an equation of the regression line for each set of data.� Men: y = í2.92x + 95.92 Women: y = í7x+106 � Graph the equations on the same coordinate plane. �
� The women¶s scores are typically lower than the men¶s.
����5($621,1*� For a class project, the scores that 10 randomly selected students earned on the first 8 tests of the VFKRRO�\HDU�DUH�JLYHQ��([SODLQ�KRZ�WR�ILQG�D�OLQH�RI��EHVW�ILW���&RXOG�LW�EH�XVHG�WR�SUHGLFW�WKH�VFRUHV�RI�RWKHU�VWXGHQWV"Explain your reasoning.
62/87,21���Apply a linear regression model to the data. Use the number of each test as the independent variable and the score on each test as the dependent variable. If there is no correlation, the r value will not be close to 1 or í1. If this is the case, the line of fit could not be used to predict the scores of the other students.
����23(1�(1'('� For 10 different people, measure their heights and the lengths of their heads from chin to top. Use these data to generate a linear regression equation and a median-fit equation. Make a prediction using both of the equations.
62/87,21���Student should gather and record data and use a calculator to find the equation of linear regression and a median-fit equation. Students should make predictions based on both equations. � 6DPSOH�GDWD��
� Median-fit (Store in Y1)
y = 8.31x ± 3.12 � /LQHDU�UHJUHVVLRQ���6WRUH�LQ Y2)
y = 7.39x + 5.22 � Find the height of a student with chin to top of head measure of 8.1. Use the value option from the CALC menu. Use the up arrow to move from one line to another. �
�
� The median-fit line predicts a student¶s height of 64.17 inches and the linear regression line predicts a height of 65.07.
Chin to 7RS��RI�
Head Measure Height8.8 70.99.1 72.89.3 73.87.5 61.08.4 66.37.8 62.08.5 67.38.8 68.98.3 68.78.9 71.5
����WRITING IN MATH How are lines of fit and linear regression similar? different?
62/87,21���Sample answer: Both lines of fit and linear regression are used to model data. However, you could have numerous lines of fit, while linear regression results in one line of best fit. If linear regression is used, you can also use the correlation coefficient to see how closely the model fits the data. For example, the scatter plot below displays the points (1, 10), (2, 17), (3, 15), (4, 20), (5, 28), (6, 19), and (7, 25). �
$�OLQH�RI�ILW�FRXOG�EH�GUDZQ�WKURXJK���������DQG����������7KH�HTXDWLRQ�RI�WKLV�OLQH�RI�ILW�LV�� .
� Use a calculator to find the equation of the regression line for this data. �
� The only regression line for this data has an equation of about y = 2.2x����������
����*(20(75<� Sam is putting a border around a poster. x represents the poster¶s width, and y represents the poster¶s length. Which equation represents how much border Sam will use if he doubles the length and the width? � $� 4xy � %� (x + y)4 � &� 4(x + y) � '� 16(x + y)
62/87,21���The perimeter of the room is found by . y is the length and x is the width, so . But Sam wants to double the border, so the perimeter becomes: �
� So, the correct choice is C.
����6+257�5(63216(� Tatiana wants to run 5 miles at an average pace of 9 minutes per mile. After 4 miles, her average pace is 9 minutes 10 seconds. In how many minutes must she complete the final mile to reach her goal?
62/87,21���Tatiana ran each of the first 4 miles in 10 more seconds than she planned. So to reach her goal, she must run the lastmile in 40 seconds less than she planned. 9 min ± 40 s = 8 min and 20 s.
����What is the slope of the line that passes through (1, 3) and (í3, 1)?� )� í2 �
*��
�
+��
� -� 2
62/87,21���
� So, the correct choice is H.
����What is an equation of the line that passes through (0, 1) and has a slope of 3?� $� y = 3x í 1 � %� y = 3x í 2 � &� y = 3x + 4 � '� y = 3x + 1
62/87,21���Find the y-intercept. �
� The equation is y = 3x + 1. So, the correct choice is D.
����86('�&$56� Gianna wants to buy a specific make and model of a used car. She researched prices from dealers and private sellers and made the graph shown. �
� D�� Describe the relationship in the data. � E�� Use the line of fit to predict the price of a car that is 7 years old. � F�� Is it reasonable to use this line of fit to predict the price of a 10-year old car? Explain.
62/87,21���a. Because y decreases as x increases, there is a negative correlation in the data. � b. Find x = 7 on the graph and follow the line up to the line of fit. According to the graph, the price of a car that is 7 years old would be about $3600. � c. No, it would not be reasonable to use this line of fit to predict the price of a 10-year old car, because according to the line of fit, the cost would be $0 and that doesn¶t make sense.
����*(20(75<� A quadrilateral has sides with equations y = í2x, 2x + y = 6, , and x í 2y = 9. Is the figure a rectangle? Explain your reasoning.
62/87,21���Write all of the equations in slope-intercept form. � Equation 1: y = í2x � (TXDWLRQ���� �
� (TXDWLRQ����
������������������y = x + 6 � Equation 4:� �
� Find the slope of each line �
� The slope of opposite sides are equal (±2 and ±���DQG�����DQG�������VR�WKH\�DUH�SDUDOOHO��$OVR��WKH�VORSH�RI�consecutive sides are opposite reciprocals (±2 and 0.5; and ±2 and 0.5), so they are perpendicular. So, the figure is a rectangle.
y = í2x í2y = ±2x +6 í2
y = 0.5x + 6
y = 0.5x ± 4.5
Write each equation in standard form.����y í 2 = 3(x í 1)
62/87,21���
����y í 5 = 6(x + 1)
62/87,21���
����y + 2 = í2(x í 5)
62/87,21���
����
62/87,21���
����
62/87,21���
����
62/87,21���
Find the slope of the line that passes through each pair of points.����(3, 4), (10, 8)
62/87,21���
����(í4, 7), (3, 5)
62/87,21���
����(3, 7), (í2, 4)
62/87,21���
����(í3, 2), (í3, 4)
62/87,21���
The slope is undefined.
If f (x) = x2 í x + 1, find each value.����f (í1)
62/87,21���
����f (5) í3
62/87,21���
����f (a)
62/87,21���
����f (b2)
62/87,21���
Graph each equation.����y = x + 2
62/87,21���To graph the equation, plot the y-intercept (0, 2). Then move up 1 unit and right 1 unit. Plot the point. Draw a line through the two points.
����x + 5y = 4
62/87,21���Write the equation in slope-intercept form. �
To graph the equation, plot the y-LQWHUFHSW�� . Then move down 1 unit and right 5 units. Plot the point. Draw a
line through the two points. �
����2x í 3y = 6
62/87,21���Write the equation in slope-intercept form. �
� To graph the equation, plot the y-intercept (0, ±2). Then move up 2 units and right 3 units. Plot the point. Draw a line through the two points. �
����5x + 2y = 6
62/87,21���Write the equation in slope-intercept form. �
� To graph the equation, plot the y-intercept (0, 3). Then move down 5 units and right 2 units. Plot the point. Draw a line through the two points. �
Another line of fit may pass through (2, 15) and (7, 25). The equation of this line of fit is y = 2x + 11. More lines of fit that come close to the points could be drawn.
eSolutions Manual - Powered by Cognero Page 5
4-6 Regression and Median-Fit Lines
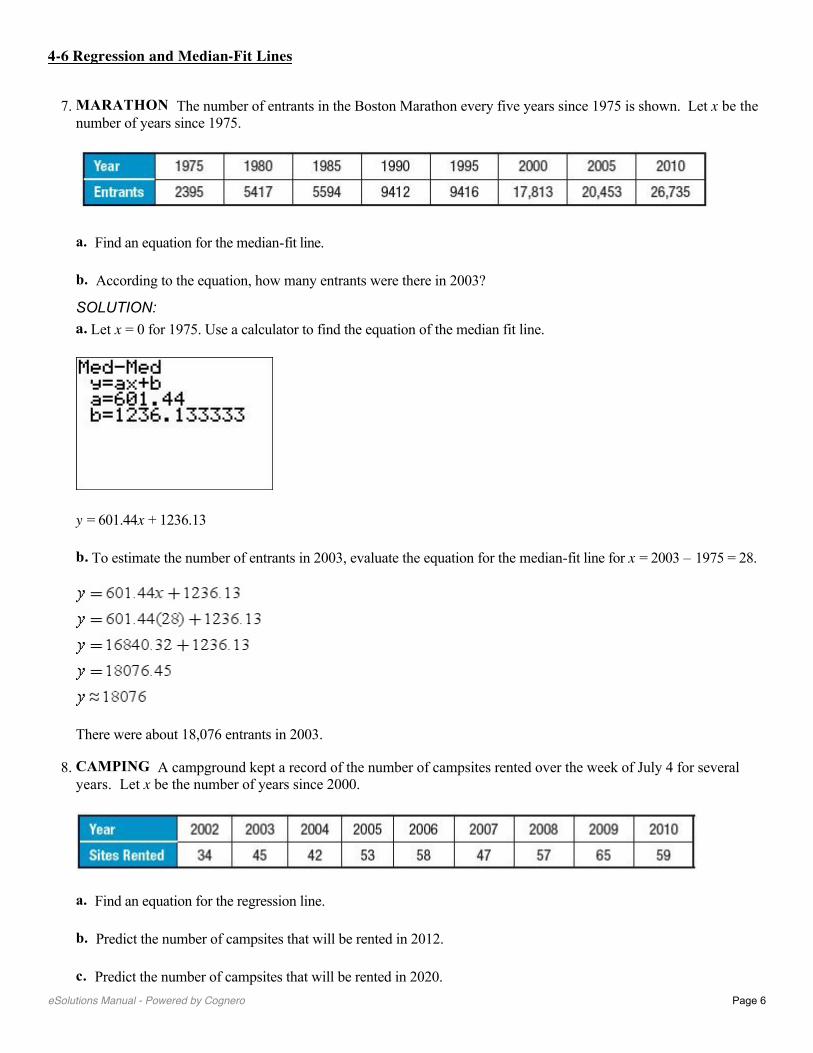
���3277(5<� $�ORFDO�XQLYHUVLW\�LV�NHHSLQJ�WUDFN�RI�WKH�QXPEHU�RI�DUW�VWXGHQWV�ZKR�XVH�WKH�SRWWHU\�VWXGLR�HDFK�GD\�� �
� a. Write an equation of the regression line and find the correlation coefficient. � b. Graph the residual plot and determine if the regression line models the data well.
62/87,21���D��Use a calculator to find the equation of the regression line. � Step 1: Enter the data by pressing STAT and selecting the EDIT option. . Enter the day into List 1 (L1). These willrepresent the x-values. Enter the number of students into List 2 (L2). These will represent the y-values. � Step 2: Perform the regression by pressing STAT �DQG�VHOHFWLQJ�WKH�CALC option. Scroll down to LinReg(ax+ b) and press ENTER. �
� Substitute the values in for a and b to write the equation of the regression line. So, the equation is y = 1.18x + 11. � Identify the value of r on the calculator to find the correlation coefficient. So, 0.7181 is the correlation coefficient. � b.�7XUQ�RQ�Plot2 under the STAT PLOT menu and choose scatter plot. Use L1 for the Xlist and RESID for the Ylist. You can obtain RESID by pressing 2nd STAT and selecting RESID from the list of names. Graph the scatter plot of the residuals by pressing ZOOM and choosing ZoomStat. �
� The residuals appear to be randomly scattered, so the regression line fits the data reasonably well. �
���&20387(56� The table below shows the percent of Americans with a broadband connection at home in a recentyear. Use linear extrapolation and a regression equation to estimate the percentage of 60-year-olds with broadband at home. �
62/87,21���Use a calculator to find the equation of the regression line.�
� y = ±0.34x + 49.48 � Substitute 60 into the equation. �
� So, about 29% of 60-year-olds have broadband at home.
���9$&$7,21� The Smiths want to rent a house on the lake that sleeps eight people. The cost of the house per night is based on how close it is to the water. �
� D�� Find and graph an equation for the median-fit line. � E�� What would you estimate is the cost of a rental 1.75 miles from the lake?
62/87,21���a. Use a calculator to find and graph the equation of the median fit line. �
y = í271.88x + 554.48
� b. To estimate the cost of a rental 1.75 miles from the lake, evaluate the equation of the median-fit line for x = 1.75.�
� An estimate of the cost of a rental 1.75 miles from the lake is $78.69.
Write an equation of the regression line for the data in each table. Then find the correlation coefficient.���6.<6&5$3(56� The table ranks the ten tallest buildings in the world. �
62/87,21���Use a calculator to find the equation of the regression line.�
� y = í2.75x + 102.53 � Use a calculator to find the correlation coefficient. � í0.6071
���086,&� 7KH�WDEOH�JLYHV�WKH�QXPEHU�RI�DQQXDO�YLROLQ�DXGLWLRQV�KHOG�E\�D�\RXWK�V\PSKRQ\�HDFK�\HDU�VLQFH��������/HW�x be the number of years since 2004. �
�
62/87,21���Use a calculator to find the equation of the regression line.�
� y = 3.54x + 19.68 � Use a calculator to find the correlation coefficient. � 0.9007
���5(7$,/� 7KH�WDEOH�JLYHV�WKH�VDOHV�RI�MHDQV�DW�D�FORWKLQJ�FKDLQ�VLQFH��������/HW�x be the number of years since ������ �
� a. Write an equation of the regression line. � b. Graph and analyze the residual plot.
62/87,21���a. Use a calculator to find the equation of the regression line. �
� The equation is about��\ = 3.32x + 5.20. � E��Use a calculator to graph the residual plot for the data. �
� The residuals appear to be randomly scattered. Therefore, the regression line fits the data well.
���0$5$7+21� 7KH�QXPEHU�RI�HQWUDQWV�LQ�WKH�%RVWRQ�0DUDWKRQ�HYHU\�ILYH�\HDUV�VLQFH������LV�VKRZQ���/HW�x be thenumber of years since 1975. �
� � D�� Find an equation for the median-fit line. � E�� According to the equation, how many entrants were there in 2003?
62/87,21���a. Let x = 0 for 1975. Use a calculator to find the equation of the median fit line. �
� y = 601.44x + 1236.13 � b. To estimate the number of entrants in 2003, evaluate the equation for the median-fit line for x = 2003 ± 1975 = 28.�
� There were about 18,076 entrants in 2003.
���&$03,1*� A campground kept a record of the number of campsites rented over the week of July 4 for several \HDUV���/HW�x be the number of years since 2000. �
� D�� Find an equation for the regression line. � E�� Predict the number of campsites that will be rented in 2012. � F�� Predict the number of campsites that will be rented in 2020.
62/87,21���a. Use a calculator to find an equation for the regression line. �
� y = 3.07x + 32.71 � b. To predict the number of campsites that will be rented in 2012, evaluate the regression equation for x = 12�
� There will be about 70 campsites rented in 2012. � c. To predict the number of campsites that will be rented in 2020, evaluate the regression equation for x = 20.�
� There will be about 94 campsites rented in 2020.
���,&(�&5($0� An ice cream company keeps a count of the tubs of cookie dough ice cream delivered to each of their stores in a particular area. ��
� D�� Find an equation for the median-fit line. � E�� Graph the points and the median-fit line. � F�� How many tubs would be delivered to a 1500-square-foot store? a 5000-square-foot store?
62/87,21���a. Use a calculator to find an equation for the median-fit line. �
� y = 0.095x í 94.58 � b. Plot the points and the equation. �
� c. To estimate the number of tubs to be delivered to a 1500-square-foot store, evaluate the regression equation for x = 1500. �
� There are about 48 tubs delivered to a 1500-square-foot store. To estimate the number of tubs to be delivered to a 5000-square-foot store, evaluate the regression equation for x = 5000. �
� There are about 380 tubs delivered to a 5000-square-foot store.
����CCSS SENSE-0$.,1*� The prices of the eight top-selling brands of jeans at Jeanie¶s Jeans are given in the table below. �
� D�� Find the equation for the regression line. � E�� According to the equation, what would be the price of a pair of the 12th best-selling brand? � F�� Is this a reasonable prediction? Explain.
62/87,21���a. Use a calculator to find an equation for the regression line. �
Step 1: Enter the data by pressing and selecting the EDIT option. Enter the sales rank into List 1 (L1). These will represent the x-values. Enter the price into List 2 (L2). These will represent the y-values. �
Step 2: Perform the regression by pressing �DQG�VHOHFWLQJ�WKH�CALC option. Scroll down to LinReg(ax+
b) and press . �
� y = 9.8x + 28.79 � b. To predict the price of a pair of the 12th bestselling brands of jeans, evaluate the regression equation for x = 12. �
� The price of a pair of the 12th bestselling brands of jeans would be about $146.39. � F�� Sample answer: No; the correlation between sales rank and price is too weak to make any reasonable prediction. The 12th bestselling brand of jeans could just as easily be a poorly made pair of jeans selling for $15.
����67$7(�)$,56� The table shows the total attendance, in millions of people, at the Minnesota State Fair from 2005 to 2009. �
� D��Graph a scatter plot of the data, where x = 1 represents 2005. Then find and graph the equation for the best-fit line. � b. Graph and analyze the residual plot. � c.��3UHGLFW�WKH�WRWDO�DWWHQGDQFH�LQ������ �
62/87,21���a. Enter the data from the table into the lists. Let x be the years starting with x = 1 for 2005 and let y = the attendence (in millions). Then graph the scatter plot. �
�
[0, 6] scl: 1 by [0, 3] scl: 0.5 � Perform the linear regression using the data in the lists. Find the equation of the best-fit line. �
� The equation is about y = 0.0326x + 1.598. � Use Y= to enter the equation into the calculator and graph the best-fit line with the scatter plot. �
[0, 6] scl: 1 by [0, 3] scl: 0.5 � b. Use the calculator to graph the residual plot for the data. �
� All the residuals appear to almost be on the line. Therefore, the regression line is a good fit for the data. � F���0HWKRG����To find the number of people in 2020, substitute 16 for x��
� Method 2: Copy the equation to the Y= list and graph. Use the value option to find the value of y when x = 16. �
[0, 17] scl: 1 by [0, 3] scl: 0.5 � 6R��WKHUH�ZLOO�EH�DERXW������PLOOLRQ�SHRSOH�LQ�������
����),5(),*+7(56� 7KH�WDEOH�VKRZV�VWDWLVWLFV�IURP�WKH�8�6��)LUH�$GPLQLVWUDWLRQ�� �
� D�� Find an equation for the median-fit line. � E�� Graph the points and the median-fit line. � F�� Does the median-fit line give you an accurate picture of the number of firefighters? Explain.
62/87,21���a. Use a calculator to find an equation for the median-fit line. �
Step 1: Enter the data by pressing and selecting the EDIT option. Enter age into List 1 (L1). These will represent the x-values. Enter the number of firefighters into List 2 (L2). These will represent the y-values. �
Step 2: Perform the regression by pressing and selecting the CALC option. Scroll down to Med-Med
and press �� �
� y = í841.42x + 223288 � b. Plot the points and graph the median fit line. �
� c. No, the median-fit line does not give an accurate picture of the number of firefighters. The points show no linear correlation; therefore a line cannot accurately portray the data.
����$7+/(7,&6� The table shows the total number of teens who participated in high school athletics in various years. �
� � D�� Find an equation for the regression line. � E�� According to the equation, how many participated in 1988?
62/87,21���a. Use a calculator to find an equation for the regression line. �
Step 1: Enter the data by pressing and selecting the EDIT option. Let the year 1970 be represented by 0. Enter the years since 1970 into List 1 (L1). These will represent the x-values. Enter the number of athletes into List 2 (L2). These will represent the y-values. �
Step 2: Perform the regression by pressing and selecting the CALC option. Scroll down to LinReg(ax+
b) and press . �
� y = 87,390.5x + 4,018,431 � b. To estimate the number of participants in 1988, evaluate the regression equation for x = 18 because 1988 is 18 years after 1970. �
� There were about 5,591,460 participants in 1988.
����$57� $�FRXQW�ZDV�NHSW�RQ�WKH�QXPEHU�RI�SDLQWLQJV�WKDW�VROG�DW�DQ�DXFWLRQ�E\�WKH�\HDU�LQ�ZKLFK�WKH\�ZHUH�SDLQWHG���Let x be the number of years since 1950. �
� D�� Find the equation for the linear regression line. � E�� How many paintings were sold that were painted in 1961? � F�� Is the linear regression equation an accurate model of the data? Explain why or why not.
62/87,21���a. 8VH�D�FDOFXODWRU�WR�ILQG�DQ�HTXDWLRQ�IRU�WKH�UHJUHVVLRQ�OLQH�� �
Step 1: Enter the data by pressing and selecting the EDIT option. Let x =0 for the year 1950.. Enter the years since 1950 into List 1 (L1). These will represent the x-values. Enter the number of painting sold into List 2 (L2). These will represent the y-values. �
Step 2: Perform the regression by pressing �DQG�VHOHFWLQJ�WKH�CALC option. Scroll down to LinReg(ax+
b) and press . � �
� y = 0.446x +9.43 � b. 7R�HVWLPDWH�WKH�QXPEHU�RI�SDLQWLQJV�VROG�LQ�������HYDOXDWH�WKH�UHJUHVVLRQ�HTXDWLRQ�IRU������ZKHQ��x =11. �
� There were about 14 paintings sold in 1961. � F�� No, the correlation coefficient is 0.48, so the linear model is not a good fit for the data. It does not appear from the data that there is a relationship between the number of paintings sold and the year they were painted.
����&&66�$5*80(176� Below are the results of the World Superpipe Championships in 2008.\ �
� � Find an equation of the regression line for each, and graph them on the same coordinate plane. Compare and contrast the men¶s and women's graphs.
62/87,21���Use a calculator to find an equation of the regression line for each set of data.� Men: y = í2.92x + 95.92 Women: y = í7x+106 � Graph the equations on the same coordinate plane. �
� The women¶s scores are typically lower than the men¶s.
����5($621,1*� For a class project, the scores that 10 randomly selected students earned on the first 8 tests of the VFKRRO�\HDU�DUH�JLYHQ��([SODLQ�KRZ�WR�ILQG�D�OLQH�RI��EHVW�ILW���&RXOG�LW�EH�XVHG�WR�SUHGLFW�WKH�VFRUHV�RI�RWKHU�VWXGHQWV"Explain your reasoning.
62/87,21���Apply a linear regression model to the data. Use the number of each test as the independent variable and the score on each test as the dependent variable. If there is no correlation, the r value will not be close to 1 or í1. If this is the case, the line of fit could not be used to predict the scores of the other students.
����23(1�(1'('� For 10 different people, measure their heights and the lengths of their heads from chin to top. Use these data to generate a linear regression equation and a median-fit equation. Make a prediction using both of the equations.
62/87,21���Student should gather and record data and use a calculator to find the equation of linear regression and a median-fit equation. Students should make predictions based on both equations. � 6DPSOH�GDWD��
� Median-fit (Store in Y1)
y = 8.31x ± 3.12 � /LQHDU�UHJUHVVLRQ���6WRUH�LQ Y2)
y = 7.39x + 5.22 � Find the height of a student with chin to top of head measure of 8.1. Use the value option from the CALC menu. Use the up arrow to move from one line to another. �
�
� The median-fit line predicts a student¶s height of 64.17 inches and the linear regression line predicts a height of 65.07.
Chin to 7RS��RI�
Head Measure Height8.8 70.99.1 72.89.3 73.87.5 61.08.4 66.37.8 62.08.5 67.38.8 68.98.3 68.78.9 71.5
����WRITING IN MATH How are lines of fit and linear regression similar? different?
62/87,21���Sample answer: Both lines of fit and linear regression are used to model data. However, you could have numerous lines of fit, while linear regression results in one line of best fit. If linear regression is used, you can also use the correlation coefficient to see how closely the model fits the data. For example, the scatter plot below displays the points (1, 10), (2, 17), (3, 15), (4, 20), (5, 28), (6, 19), and (7, 25). �
$�OLQH�RI�ILW�FRXOG�EH�GUDZQ�WKURXJK���������DQG����������7KH�HTXDWLRQ�RI�WKLV�OLQH�RI�ILW�LV�� .
� Use a calculator to find the equation of the regression line for this data. �
� The only regression line for this data has an equation of about y = 2.2x����������
����*(20(75<� Sam is putting a border around a poster. x represents the poster¶s width, and y represents the poster¶s length. Which equation represents how much border Sam will use if he doubles the length and the width? � $� 4xy � %� (x + y)4 � &� 4(x + y) � '� 16(x + y)
62/87,21���The perimeter of the room is found by . y is the length and x is the width, so . But Sam wants to double the border, so the perimeter becomes: �
� So, the correct choice is C.
����6+257�5(63216(� Tatiana wants to run 5 miles at an average pace of 9 minutes per mile. After 4 miles, her average pace is 9 minutes 10 seconds. In how many minutes must she complete the final mile to reach her goal?
62/87,21���Tatiana ran each of the first 4 miles in 10 more seconds than she planned. So to reach her goal, she must run the lastmile in 40 seconds less than she planned. 9 min ± 40 s = 8 min and 20 s.
����What is the slope of the line that passes through (1, 3) and (í3, 1)?� )� í2 �
*��
�
+��
� -� 2
62/87,21���
� So, the correct choice is H.
����What is an equation of the line that passes through (0, 1) and has a slope of 3?� $� y = 3x í 1 � %� y = 3x í 2 � &� y = 3x + 4 � '� y = 3x + 1
62/87,21���Find the y-intercept. �
� The equation is y = 3x + 1. So, the correct choice is D.
����86('�&$56� Gianna wants to buy a specific make and model of a used car. She researched prices from dealers and private sellers and made the graph shown. �
� D�� Describe the relationship in the data. � E�� Use the line of fit to predict the price of a car that is 7 years old. � F�� Is it reasonable to use this line of fit to predict the price of a 10-year old car? Explain.
62/87,21���a. Because y decreases as x increases, there is a negative correlation in the data. � b. Find x = 7 on the graph and follow the line up to the line of fit. According to the graph, the price of a car that is 7 years old would be about $3600. � c. No, it would not be reasonable to use this line of fit to predict the price of a 10-year old car, because according to the line of fit, the cost would be $0 and that doesn¶t make sense.
����*(20(75<� A quadrilateral has sides with equations y = í2x, 2x + y = 6, , and x í 2y = 9. Is the figure a rectangle? Explain your reasoning.
62/87,21���Write all of the equations in slope-intercept form. � Equation 1: y = í2x � (TXDWLRQ���� �
� (TXDWLRQ����
������������������y = x + 6 � Equation 4:� �
� Find the slope of each line �
� The slope of opposite sides are equal (±2 and ±���DQG�����DQG�������VR�WKH\�DUH�SDUDOOHO��$OVR��WKH�VORSH�RI�consecutive sides are opposite reciprocals (±2 and 0.5; and ±2 and 0.5), so they are perpendicular. So, the figure is a rectangle.
y = í2x í2y = ±2x +6 í2
y = 0.5x + 6
y = 0.5x ± 4.5
Write each equation in standard form.����y í 2 = 3(x í 1)
62/87,21���
����y í 5 = 6(x + 1)
62/87,21���
����y + 2 = í2(x í 5)
62/87,21���
����
62/87,21���
����
62/87,21���
����
62/87,21���
Find the slope of the line that passes through each pair of points.����(3, 4), (10, 8)
62/87,21���
����(í4, 7), (3, 5)
62/87,21���
����(3, 7), (í2, 4)
62/87,21���
����(í3, 2), (í3, 4)
62/87,21���
The slope is undefined.
If f (x) = x2 í x + 1, find each value.����f (í1)
62/87,21���
����f (5) í3
62/87,21���
����f (a)
62/87,21���
����f (b2)
62/87,21���
Graph each equation.����y = x + 2
62/87,21���To graph the equation, plot the y-intercept (0, 2). Then move up 1 unit and right 1 unit. Plot the point. Draw a line through the two points.
����x + 5y = 4
62/87,21���Write the equation in slope-intercept form. �
To graph the equation, plot the y-LQWHUFHSW�� . Then move down 1 unit and right 5 units. Plot the point. Draw a
line through the two points. �
����2x í 3y = 6
62/87,21���Write the equation in slope-intercept form. �
� To graph the equation, plot the y-intercept (0, ±2). Then move up 2 units and right 3 units. Plot the point. Draw a line through the two points. �
����5x + 2y = 6
62/87,21���Write the equation in slope-intercept form. �
� To graph the equation, plot the y-intercept (0, 3). Then move down 5 units and right 2 units. Plot the point. Draw a line through the two points. �
Another line of fit may pass through (2, 15) and (7, 25). The equation of this line of fit is y = 2x + 11. More lines of fit that come close to the points could be drawn.
eSolutions Manual - Powered by Cognero Page 6
4-6 Regression and Median-Fit Lines

���3277(5<� $�ORFDO�XQLYHUVLW\�LV�NHHSLQJ�WUDFN�RI�WKH�QXPEHU�RI�DUW�VWXGHQWV�ZKR�XVH�WKH�SRWWHU\�VWXGLR�HDFK�GD\�� �
� a. Write an equation of the regression line and find the correlation coefficient. � b. Graph the residual plot and determine if the regression line models the data well.
62/87,21���D��Use a calculator to find the equation of the regression line. � Step 1: Enter the data by pressing STAT and selecting the EDIT option. . Enter the day into List 1 (L1). These willrepresent the x-values. Enter the number of students into List 2 (L2). These will represent the y-values. � Step 2: Perform the regression by pressing STAT �DQG�VHOHFWLQJ�WKH�CALC option. Scroll down to LinReg(ax+ b) and press ENTER. �
� Substitute the values in for a and b to write the equation of the regression line. So, the equation is y = 1.18x + 11. � Identify the value of r on the calculator to find the correlation coefficient. So, 0.7181 is the correlation coefficient. � b.�7XUQ�RQ�Plot2 under the STAT PLOT menu and choose scatter plot. Use L1 for the Xlist and RESID for the Ylist. You can obtain RESID by pressing 2nd STAT and selecting RESID from the list of names. Graph the scatter plot of the residuals by pressing ZOOM and choosing ZoomStat. �
� The residuals appear to be randomly scattered, so the regression line fits the data reasonably well. �
���&20387(56� The table below shows the percent of Americans with a broadband connection at home in a recentyear. Use linear extrapolation and a regression equation to estimate the percentage of 60-year-olds with broadband at home. �
62/87,21���Use a calculator to find the equation of the regression line.�
� y = ±0.34x + 49.48 � Substitute 60 into the equation. �
� So, about 29% of 60-year-olds have broadband at home.
���9$&$7,21� The Smiths want to rent a house on the lake that sleeps eight people. The cost of the house per night is based on how close it is to the water. �
� D�� Find and graph an equation for the median-fit line. � E�� What would you estimate is the cost of a rental 1.75 miles from the lake?
62/87,21���a. Use a calculator to find and graph the equation of the median fit line. �
y = í271.88x + 554.48
� b. To estimate the cost of a rental 1.75 miles from the lake, evaluate the equation of the median-fit line for x = 1.75.�
� An estimate of the cost of a rental 1.75 miles from the lake is $78.69.
Write an equation of the regression line for the data in each table. Then find the correlation coefficient.���6.<6&5$3(56� The table ranks the ten tallest buildings in the world. �
62/87,21���Use a calculator to find the equation of the regression line.�
� y = í2.75x + 102.53 � Use a calculator to find the correlation coefficient. � í0.6071
���086,&� 7KH�WDEOH�JLYHV�WKH�QXPEHU�RI�DQQXDO�YLROLQ�DXGLWLRQV�KHOG�E\�D�\RXWK�V\PSKRQ\�HDFK�\HDU�VLQFH��������/HW�x be the number of years since 2004. �
�
62/87,21���Use a calculator to find the equation of the regression line.�
� y = 3.54x + 19.68 � Use a calculator to find the correlation coefficient. � 0.9007
���5(7$,/� 7KH�WDEOH�JLYHV�WKH�VDOHV�RI�MHDQV�DW�D�FORWKLQJ�FKDLQ�VLQFH��������/HW�x be the number of years since ������ �
� a. Write an equation of the regression line. � b. Graph and analyze the residual plot.
62/87,21���a. Use a calculator to find the equation of the regression line. �
� The equation is about��\ = 3.32x + 5.20. � E��Use a calculator to graph the residual plot for the data. �
� The residuals appear to be randomly scattered. Therefore, the regression line fits the data well.
���0$5$7+21� 7KH�QXPEHU�RI�HQWUDQWV�LQ�WKH�%RVWRQ�0DUDWKRQ�HYHU\�ILYH�\HDUV�VLQFH������LV�VKRZQ���/HW�x be thenumber of years since 1975. �
� � D�� Find an equation for the median-fit line. � E�� According to the equation, how many entrants were there in 2003?
62/87,21���a. Let x = 0 for 1975. Use a calculator to find the equation of the median fit line. �
� y = 601.44x + 1236.13 � b. To estimate the number of entrants in 2003, evaluate the equation for the median-fit line for x = 2003 ± 1975 = 28.�
� There were about 18,076 entrants in 2003.
���&$03,1*� A campground kept a record of the number of campsites rented over the week of July 4 for several \HDUV���/HW�x be the number of years since 2000. �
� D�� Find an equation for the regression line. � E�� Predict the number of campsites that will be rented in 2012. � F�� Predict the number of campsites that will be rented in 2020.
62/87,21���a. Use a calculator to find an equation for the regression line. �
� y = 3.07x + 32.71 � b. To predict the number of campsites that will be rented in 2012, evaluate the regression equation for x = 12�
� There will be about 70 campsites rented in 2012. � c. To predict the number of campsites that will be rented in 2020, evaluate the regression equation for x = 20.�
� There will be about 94 campsites rented in 2020.
���,&(�&5($0� An ice cream company keeps a count of the tubs of cookie dough ice cream delivered to each of their stores in a particular area. ��
� D�� Find an equation for the median-fit line. � E�� Graph the points and the median-fit line. � F�� How many tubs would be delivered to a 1500-square-foot store? a 5000-square-foot store?
62/87,21���a. Use a calculator to find an equation for the median-fit line. �
� y = 0.095x í 94.58 � b. Plot the points and the equation. �
� c. To estimate the number of tubs to be delivered to a 1500-square-foot store, evaluate the regression equation for x = 1500. �
� There are about 48 tubs delivered to a 1500-square-foot store. To estimate the number of tubs to be delivered to a 5000-square-foot store, evaluate the regression equation for x = 5000. �
� There are about 380 tubs delivered to a 5000-square-foot store.
����CCSS SENSE-0$.,1*� The prices of the eight top-selling brands of jeans at Jeanie¶s Jeans are given in the table below. �
� D�� Find the equation for the regression line. � E�� According to the equation, what would be the price of a pair of the 12th best-selling brand? � F�� Is this a reasonable prediction? Explain.
62/87,21���a. Use a calculator to find an equation for the regression line. �
Step 1: Enter the data by pressing and selecting the EDIT option. Enter the sales rank into List 1 (L1). These will represent the x-values. Enter the price into List 2 (L2). These will represent the y-values. �
Step 2: Perform the regression by pressing �DQG�VHOHFWLQJ�WKH�CALC option. Scroll down to LinReg(ax+
b) and press . �
� y = 9.8x + 28.79 � b. To predict the price of a pair of the 12th bestselling brands of jeans, evaluate the regression equation for x = 12. �
� The price of a pair of the 12th bestselling brands of jeans would be about $146.39. � F�� Sample answer: No; the correlation between sales rank and price is too weak to make any reasonable prediction. The 12th bestselling brand of jeans could just as easily be a poorly made pair of jeans selling for $15.
����67$7(�)$,56� The table shows the total attendance, in millions of people, at the Minnesota State Fair from 2005 to 2009. �
� D��Graph a scatter plot of the data, where x = 1 represents 2005. Then find and graph the equation for the best-fit line. � b. Graph and analyze the residual plot. � c.��3UHGLFW�WKH�WRWDO�DWWHQGDQFH�LQ������ �
62/87,21���a. Enter the data from the table into the lists. Let x be the years starting with x = 1 for 2005 and let y = the attendence (in millions). Then graph the scatter plot. �
�
[0, 6] scl: 1 by [0, 3] scl: 0.5 � Perform the linear regression using the data in the lists. Find the equation of the best-fit line. �
� The equation is about y = 0.0326x + 1.598. � Use Y= to enter the equation into the calculator and graph the best-fit line with the scatter plot. �
[0, 6] scl: 1 by [0, 3] scl: 0.5 � b. Use the calculator to graph the residual plot for the data. �
� All the residuals appear to almost be on the line. Therefore, the regression line is a good fit for the data. � F���0HWKRG����To find the number of people in 2020, substitute 16 for x��
� Method 2: Copy the equation to the Y= list and graph. Use the value option to find the value of y when x = 16. �
[0, 17] scl: 1 by [0, 3] scl: 0.5 � 6R��WKHUH�ZLOO�EH�DERXW������PLOOLRQ�SHRSOH�LQ�������
����),5(),*+7(56� 7KH�WDEOH�VKRZV�VWDWLVWLFV�IURP�WKH�8�6��)LUH�$GPLQLVWUDWLRQ�� �
� D�� Find an equation for the median-fit line. � E�� Graph the points and the median-fit line. � F�� Does the median-fit line give you an accurate picture of the number of firefighters? Explain.
62/87,21���a. Use a calculator to find an equation for the median-fit line. �
Step 1: Enter the data by pressing and selecting the EDIT option. Enter age into List 1 (L1). These will represent the x-values. Enter the number of firefighters into List 2 (L2). These will represent the y-values. �
Step 2: Perform the regression by pressing and selecting the CALC option. Scroll down to Med-Med
and press �� �
� y = í841.42x + 223288 � b. Plot the points and graph the median fit line. �
� c. No, the median-fit line does not give an accurate picture of the number of firefighters. The points show no linear correlation; therefore a line cannot accurately portray the data.
����$7+/(7,&6� The table shows the total number of teens who participated in high school athletics in various years. �
� � D�� Find an equation for the regression line. � E�� According to the equation, how many participated in 1988?
62/87,21���a. Use a calculator to find an equation for the regression line. �
Step 1: Enter the data by pressing and selecting the EDIT option. Let the year 1970 be represented by 0. Enter the years since 1970 into List 1 (L1). These will represent the x-values. Enter the number of athletes into List 2 (L2). These will represent the y-values. �
Step 2: Perform the regression by pressing and selecting the CALC option. Scroll down to LinReg(ax+
b) and press . �
� y = 87,390.5x + 4,018,431 � b. To estimate the number of participants in 1988, evaluate the regression equation for x = 18 because 1988 is 18 years after 1970. �
� There were about 5,591,460 participants in 1988.
����$57� $�FRXQW�ZDV�NHSW�RQ�WKH�QXPEHU�RI�SDLQWLQJV�WKDW�VROG�DW�DQ�DXFWLRQ�E\�WKH�\HDU�LQ�ZKLFK�WKH\�ZHUH�SDLQWHG���Let x be the number of years since 1950. �
� D�� Find the equation for the linear regression line. � E�� How many paintings were sold that were painted in 1961? � F�� Is the linear regression equation an accurate model of the data? Explain why or why not.
62/87,21���a. 8VH�D�FDOFXODWRU�WR�ILQG�DQ�HTXDWLRQ�IRU�WKH�UHJUHVVLRQ�OLQH�� �
Step 1: Enter the data by pressing and selecting the EDIT option. Let x =0 for the year 1950.. Enter the years since 1950 into List 1 (L1). These will represent the x-values. Enter the number of painting sold into List 2 (L2). These will represent the y-values. �
Step 2: Perform the regression by pressing �DQG�VHOHFWLQJ�WKH�CALC option. Scroll down to LinReg(ax+
b) and press . � �
� y = 0.446x +9.43 � b. 7R�HVWLPDWH�WKH�QXPEHU�RI�SDLQWLQJV�VROG�LQ�������HYDOXDWH�WKH�UHJUHVVLRQ�HTXDWLRQ�IRU������ZKHQ��x =11. �
� There were about 14 paintings sold in 1961. � F�� No, the correlation coefficient is 0.48, so the linear model is not a good fit for the data. It does not appear from the data that there is a relationship between the number of paintings sold and the year they were painted.
����&&66�$5*80(176� Below are the results of the World Superpipe Championships in 2008.\ �
� � Find an equation of the regression line for each, and graph them on the same coordinate plane. Compare and contrast the men¶s and women's graphs.
62/87,21���Use a calculator to find an equation of the regression line for each set of data.� Men: y = í2.92x + 95.92 Women: y = í7x+106 � Graph the equations on the same coordinate plane. �
� The women¶s scores are typically lower than the men¶s.
����5($621,1*� For a class project, the scores that 10 randomly selected students earned on the first 8 tests of the VFKRRO�\HDU�DUH�JLYHQ��([SODLQ�KRZ�WR�ILQG�D�OLQH�RI��EHVW�ILW���&RXOG�LW�EH�XVHG�WR�SUHGLFW�WKH�VFRUHV�RI�RWKHU�VWXGHQWV"Explain your reasoning.
62/87,21���Apply a linear regression model to the data. Use the number of each test as the independent variable and the score on each test as the dependent variable. If there is no correlation, the r value will not be close to 1 or í1. If this is the case, the line of fit could not be used to predict the scores of the other students.
����23(1�(1'('� For 10 different people, measure their heights and the lengths of their heads from chin to top. Use these data to generate a linear regression equation and a median-fit equation. Make a prediction using both of the equations.
62/87,21���Student should gather and record data and use a calculator to find the equation of linear regression and a median-fit equation. Students should make predictions based on both equations. � 6DPSOH�GDWD��
� Median-fit (Store in Y1)
y = 8.31x ± 3.12 � /LQHDU�UHJUHVVLRQ���6WRUH�LQ Y2)
y = 7.39x + 5.22 � Find the height of a student with chin to top of head measure of 8.1. Use the value option from the CALC menu. Use the up arrow to move from one line to another. �
�
� The median-fit line predicts a student¶s height of 64.17 inches and the linear regression line predicts a height of 65.07.
Chin to 7RS��RI�
Head Measure Height8.8 70.99.1 72.89.3 73.87.5 61.08.4 66.37.8 62.08.5 67.38.8 68.98.3 68.78.9 71.5
����WRITING IN MATH How are lines of fit and linear regression similar? different?
62/87,21���Sample answer: Both lines of fit and linear regression are used to model data. However, you could have numerous lines of fit, while linear regression results in one line of best fit. If linear regression is used, you can also use the correlation coefficient to see how closely the model fits the data. For example, the scatter plot below displays the points (1, 10), (2, 17), (3, 15), (4, 20), (5, 28), (6, 19), and (7, 25). �
$�OLQH�RI�ILW�FRXOG�EH�GUDZQ�WKURXJK���������DQG����������7KH�HTXDWLRQ�RI�WKLV�OLQH�RI�ILW�LV�� .
� Use a calculator to find the equation of the regression line for this data. �
� The only regression line for this data has an equation of about y = 2.2x����������
����*(20(75<� Sam is putting a border around a poster. x represents the poster¶s width, and y represents the poster¶s length. Which equation represents how much border Sam will use if he doubles the length and the width? � $� 4xy � %� (x + y)4 � &� 4(x + y) � '� 16(x + y)
62/87,21���The perimeter of the room is found by . y is the length and x is the width, so . But Sam wants to double the border, so the perimeter becomes: �
� So, the correct choice is C.
����6+257�5(63216(� Tatiana wants to run 5 miles at an average pace of 9 minutes per mile. After 4 miles, her average pace is 9 minutes 10 seconds. In how many minutes must she complete the final mile to reach her goal?
62/87,21���Tatiana ran each of the first 4 miles in 10 more seconds than she planned. So to reach her goal, she must run the lastmile in 40 seconds less than she planned. 9 min ± 40 s = 8 min and 20 s.
����What is the slope of the line that passes through (1, 3) and (í3, 1)?� )� í2 �
*��
�
+��
� -� 2
62/87,21���
� So, the correct choice is H.
����What is an equation of the line that passes through (0, 1) and has a slope of 3?� $� y = 3x í 1 � %� y = 3x í 2 � &� y = 3x + 4 � '� y = 3x + 1
62/87,21���Find the y-intercept. �
� The equation is y = 3x + 1. So, the correct choice is D.
����86('�&$56� Gianna wants to buy a specific make and model of a used car. She researched prices from dealers and private sellers and made the graph shown. �
� D�� Describe the relationship in the data. � E�� Use the line of fit to predict the price of a car that is 7 years old. � F�� Is it reasonable to use this line of fit to predict the price of a 10-year old car? Explain.
62/87,21���a. Because y decreases as x increases, there is a negative correlation in the data. � b. Find x = 7 on the graph and follow the line up to the line of fit. According to the graph, the price of a car that is 7 years old would be about $3600. � c. No, it would not be reasonable to use this line of fit to predict the price of a 10-year old car, because according to the line of fit, the cost would be $0 and that doesn¶t make sense.
����*(20(75<� A quadrilateral has sides with equations y = í2x, 2x + y = 6, , and x í 2y = 9. Is the figure a rectangle? Explain your reasoning.
62/87,21���Write all of the equations in slope-intercept form. � Equation 1: y = í2x � (TXDWLRQ���� �
� (TXDWLRQ����
������������������y = x + 6 � Equation 4:� �
� Find the slope of each line �
� The slope of opposite sides are equal (±2 and ±���DQG�����DQG�������VR�WKH\�DUH�SDUDOOHO��$OVR��WKH�VORSH�RI�consecutive sides are opposite reciprocals (±2 and 0.5; and ±2 and 0.5), so they are perpendicular. So, the figure is a rectangle.
y = í2x í2y = ±2x +6 í2
y = 0.5x + 6
y = 0.5x ± 4.5
Write each equation in standard form.����y í 2 = 3(x í 1)
62/87,21���
����y í 5 = 6(x + 1)
62/87,21���
����y + 2 = í2(x í 5)
62/87,21���
����
62/87,21���
����
62/87,21���
����
62/87,21���
Find the slope of the line that passes through each pair of points.����(3, 4), (10, 8)
62/87,21���
����(í4, 7), (3, 5)
62/87,21���
����(3, 7), (í2, 4)
62/87,21���
����(í3, 2), (í3, 4)
62/87,21���
The slope is undefined.
If f (x) = x2 í x + 1, find each value.����f (í1)
62/87,21���
����f (5) í3
62/87,21���
����f (a)
62/87,21���
����f (b2)
62/87,21���
Graph each equation.����y = x + 2
62/87,21���To graph the equation, plot the y-intercept (0, 2). Then move up 1 unit and right 1 unit. Plot the point. Draw a line through the two points.
����x + 5y = 4
62/87,21���Write the equation in slope-intercept form. �
To graph the equation, plot the y-LQWHUFHSW�� . Then move down 1 unit and right 5 units. Plot the point. Draw a
line through the two points. �
����2x í 3y = 6
62/87,21���Write the equation in slope-intercept form. �
� To graph the equation, plot the y-intercept (0, ±2). Then move up 2 units and right 3 units. Plot the point. Draw a line through the two points. �
����5x + 2y = 6
62/87,21���Write the equation in slope-intercept form. �
� To graph the equation, plot the y-intercept (0, 3). Then move down 5 units and right 2 units. Plot the point. Draw a line through the two points. �
Another line of fit may pass through (2, 15) and (7, 25). The equation of this line of fit is y = 2x + 11. More lines of fit that come close to the points could be drawn.
eSolutions Manual - Powered by Cognero Page 7
4-6 Regression and Median-Fit Lines

���3277(5<� $�ORFDO�XQLYHUVLW\�LV�NHHSLQJ�WUDFN�RI�WKH�QXPEHU�RI�DUW�VWXGHQWV�ZKR�XVH�WKH�SRWWHU\�VWXGLR�HDFK�GD\�� �
� a. Write an equation of the regression line and find the correlation coefficient. � b. Graph the residual plot and determine if the regression line models the data well.
62/87,21���D��Use a calculator to find the equation of the regression line. � Step 1: Enter the data by pressing STAT and selecting the EDIT option. . Enter the day into List 1 (L1). These willrepresent the x-values. Enter the number of students into List 2 (L2). These will represent the y-values. � Step 2: Perform the regression by pressing STAT �DQG�VHOHFWLQJ�WKH�CALC option. Scroll down to LinReg(ax+ b) and press ENTER. �
� Substitute the values in for a and b to write the equation of the regression line. So, the equation is y = 1.18x + 11. � Identify the value of r on the calculator to find the correlation coefficient. So, 0.7181 is the correlation coefficient. � b.�7XUQ�RQ�Plot2 under the STAT PLOT menu and choose scatter plot. Use L1 for the Xlist and RESID for the Ylist. You can obtain RESID by pressing 2nd STAT and selecting RESID from the list of names. Graph the scatter plot of the residuals by pressing ZOOM and choosing ZoomStat. �
� The residuals appear to be randomly scattered, so the regression line fits the data reasonably well. �
���&20387(56� The table below shows the percent of Americans with a broadband connection at home in a recentyear. Use linear extrapolation and a regression equation to estimate the percentage of 60-year-olds with broadband at home. �
62/87,21���Use a calculator to find the equation of the regression line.�
� y = ±0.34x + 49.48 � Substitute 60 into the equation. �
� So, about 29% of 60-year-olds have broadband at home.
���9$&$7,21� The Smiths want to rent a house on the lake that sleeps eight people. The cost of the house per night is based on how close it is to the water. �
� D�� Find and graph an equation for the median-fit line. � E�� What would you estimate is the cost of a rental 1.75 miles from the lake?
62/87,21���a. Use a calculator to find and graph the equation of the median fit line. �
y = í271.88x + 554.48
� b. To estimate the cost of a rental 1.75 miles from the lake, evaluate the equation of the median-fit line for x = 1.75.�
� An estimate of the cost of a rental 1.75 miles from the lake is $78.69.
Write an equation of the regression line for the data in each table. Then find the correlation coefficient.���6.<6&5$3(56� The table ranks the ten tallest buildings in the world. �
62/87,21���Use a calculator to find the equation of the regression line.�
� y = í2.75x + 102.53 � Use a calculator to find the correlation coefficient. � í0.6071
���086,&� 7KH�WDEOH�JLYHV�WKH�QXPEHU�RI�DQQXDO�YLROLQ�DXGLWLRQV�KHOG�E\�D�\RXWK�V\PSKRQ\�HDFK�\HDU�VLQFH��������/HW�x be the number of years since 2004. �
�
62/87,21���Use a calculator to find the equation of the regression line.�
� y = 3.54x + 19.68 � Use a calculator to find the correlation coefficient. � 0.9007
���5(7$,/� 7KH�WDEOH�JLYHV�WKH�VDOHV�RI�MHDQV�DW�D�FORWKLQJ�FKDLQ�VLQFH��������/HW�x be the number of years since ������ �
� a. Write an equation of the regression line. � b. Graph and analyze the residual plot.
62/87,21���a. Use a calculator to find the equation of the regression line. �
� The equation is about��\ = 3.32x + 5.20. � E��Use a calculator to graph the residual plot for the data. �
� The residuals appear to be randomly scattered. Therefore, the regression line fits the data well.
���0$5$7+21� 7KH�QXPEHU�RI�HQWUDQWV�LQ�WKH�%RVWRQ�0DUDWKRQ�HYHU\�ILYH�\HDUV�VLQFH������LV�VKRZQ���/HW�x be thenumber of years since 1975. �
� � D�� Find an equation for the median-fit line. � E�� According to the equation, how many entrants were there in 2003?
62/87,21���a. Let x = 0 for 1975. Use a calculator to find the equation of the median fit line. �
� y = 601.44x + 1236.13 � b. To estimate the number of entrants in 2003, evaluate the equation for the median-fit line for x = 2003 ± 1975 = 28.�
� There were about 18,076 entrants in 2003.
���&$03,1*� A campground kept a record of the number of campsites rented over the week of July 4 for several \HDUV���/HW�x be the number of years since 2000. �
� D�� Find an equation for the regression line. � E�� Predict the number of campsites that will be rented in 2012. � F�� Predict the number of campsites that will be rented in 2020.
62/87,21���a. Use a calculator to find an equation for the regression line. �
� y = 3.07x + 32.71 � b. To predict the number of campsites that will be rented in 2012, evaluate the regression equation for x = 12�
� There will be about 70 campsites rented in 2012. � c. To predict the number of campsites that will be rented in 2020, evaluate the regression equation for x = 20.�
� There will be about 94 campsites rented in 2020.
���,&(�&5($0� An ice cream company keeps a count of the tubs of cookie dough ice cream delivered to each of their stores in a particular area. ��
� D�� Find an equation for the median-fit line. � E�� Graph the points and the median-fit line. � F�� How many tubs would be delivered to a 1500-square-foot store? a 5000-square-foot store?
62/87,21���a. Use a calculator to find an equation for the median-fit line. �
� y = 0.095x í 94.58 � b. Plot the points and the equation. �
� c. To estimate the number of tubs to be delivered to a 1500-square-foot store, evaluate the regression equation for x = 1500. �
� There are about 48 tubs delivered to a 1500-square-foot store. To estimate the number of tubs to be delivered to a 5000-square-foot store, evaluate the regression equation for x = 5000. �
� There are about 380 tubs delivered to a 5000-square-foot store.
����CCSS SENSE-0$.,1*� The prices of the eight top-selling brands of jeans at Jeanie¶s Jeans are given in the table below. �
� D�� Find the equation for the regression line. � E�� According to the equation, what would be the price of a pair of the 12th best-selling brand? � F�� Is this a reasonable prediction? Explain.
62/87,21���a. Use a calculator to find an equation for the regression line. �
Step 1: Enter the data by pressing and selecting the EDIT option. Enter the sales rank into List 1 (L1). These will represent the x-values. Enter the price into List 2 (L2). These will represent the y-values. �
Step 2: Perform the regression by pressing �DQG�VHOHFWLQJ�WKH�CALC option. Scroll down to LinReg(ax+
b) and press . �
� y = 9.8x + 28.79 � b. To predict the price of a pair of the 12th bestselling brands of jeans, evaluate the regression equation for x = 12. �
� The price of a pair of the 12th bestselling brands of jeans would be about $146.39. � F�� Sample answer: No; the correlation between sales rank and price is too weak to make any reasonable prediction. The 12th bestselling brand of jeans could just as easily be a poorly made pair of jeans selling for $15.
����67$7(�)$,56� The table shows the total attendance, in millions of people, at the Minnesota State Fair from 2005 to 2009. �
� D��Graph a scatter plot of the data, where x = 1 represents 2005. Then find and graph the equation for the best-fit line. � b. Graph and analyze the residual plot. � c.��3UHGLFW�WKH�WRWDO�DWWHQGDQFH�LQ������ �
62/87,21���a. Enter the data from the table into the lists. Let x be the years starting with x = 1 for 2005 and let y = the attendence (in millions). Then graph the scatter plot. �
�
[0, 6] scl: 1 by [0, 3] scl: 0.5 � Perform the linear regression using the data in the lists. Find the equation of the best-fit line. �
� The equation is about y = 0.0326x + 1.598. � Use Y= to enter the equation into the calculator and graph the best-fit line with the scatter plot. �
[0, 6] scl: 1 by [0, 3] scl: 0.5 � b. Use the calculator to graph the residual plot for the data. �
� All the residuals appear to almost be on the line. Therefore, the regression line is a good fit for the data. � F���0HWKRG����To find the number of people in 2020, substitute 16 for x��
� Method 2: Copy the equation to the Y= list and graph. Use the value option to find the value of y when x = 16. �
[0, 17] scl: 1 by [0, 3] scl: 0.5 � 6R��WKHUH�ZLOO�EH�DERXW������PLOOLRQ�SHRSOH�LQ�������
����),5(),*+7(56� 7KH�WDEOH�VKRZV�VWDWLVWLFV�IURP�WKH�8�6��)LUH�$GPLQLVWUDWLRQ�� �
� D�� Find an equation for the median-fit line. � E�� Graph the points and the median-fit line. � F�� Does the median-fit line give you an accurate picture of the number of firefighters? Explain.
62/87,21���a. Use a calculator to find an equation for the median-fit line. �
Step 1: Enter the data by pressing and selecting the EDIT option. Enter age into List 1 (L1). These will represent the x-values. Enter the number of firefighters into List 2 (L2). These will represent the y-values. �
Step 2: Perform the regression by pressing and selecting the CALC option. Scroll down to Med-Med
and press �� �
� y = í841.42x + 223288 � b. Plot the points and graph the median fit line. �
� c. No, the median-fit line does not give an accurate picture of the number of firefighters. The points show no linear correlation; therefore a line cannot accurately portray the data.
����$7+/(7,&6� The table shows the total number of teens who participated in high school athletics in various years. �
� � D�� Find an equation for the regression line. � E�� According to the equation, how many participated in 1988?
62/87,21���a. Use a calculator to find an equation for the regression line. �
Step 1: Enter the data by pressing and selecting the EDIT option. Let the year 1970 be represented by 0. Enter the years since 1970 into List 1 (L1). These will represent the x-values. Enter the number of athletes into List 2 (L2). These will represent the y-values. �
Step 2: Perform the regression by pressing and selecting the CALC option. Scroll down to LinReg(ax+
b) and press . �
� y = 87,390.5x + 4,018,431 � b. To estimate the number of participants in 1988, evaluate the regression equation for x = 18 because 1988 is 18 years after 1970. �
� There were about 5,591,460 participants in 1988.
����$57� $�FRXQW�ZDV�NHSW�RQ�WKH�QXPEHU�RI�SDLQWLQJV�WKDW�VROG�DW�DQ�DXFWLRQ�E\�WKH�\HDU�LQ�ZKLFK�WKH\�ZHUH�SDLQWHG���Let x be the number of years since 1950. �
� D�� Find the equation for the linear regression line. � E�� How many paintings were sold that were painted in 1961? � F�� Is the linear regression equation an accurate model of the data? Explain why or why not.
62/87,21���a. 8VH�D�FDOFXODWRU�WR�ILQG�DQ�HTXDWLRQ�IRU�WKH�UHJUHVVLRQ�OLQH�� �
Step 1: Enter the data by pressing and selecting the EDIT option. Let x =0 for the year 1950.. Enter the years since 1950 into List 1 (L1). These will represent the x-values. Enter the number of painting sold into List 2 (L2). These will represent the y-values. �
Step 2: Perform the regression by pressing �DQG�VHOHFWLQJ�WKH�CALC option. Scroll down to LinReg(ax+
b) and press . � �
� y = 0.446x +9.43 � b. 7R�HVWLPDWH�WKH�QXPEHU�RI�SDLQWLQJV�VROG�LQ�������HYDOXDWH�WKH�UHJUHVVLRQ�HTXDWLRQ�IRU������ZKHQ��x =11. �
� There were about 14 paintings sold in 1961. � F�� No, the correlation coefficient is 0.48, so the linear model is not a good fit for the data. It does not appear from the data that there is a relationship between the number of paintings sold and the year they were painted.
����&&66�$5*80(176� Below are the results of the World Superpipe Championships in 2008.\ �
� � Find an equation of the regression line for each, and graph them on the same coordinate plane. Compare and contrast the men¶s and women's graphs.
62/87,21���Use a calculator to find an equation of the regression line for each set of data.� Men: y = í2.92x + 95.92 Women: y = í7x+106 � Graph the equations on the same coordinate plane. �
� The women¶s scores are typically lower than the men¶s.
����5($621,1*� For a class project, the scores that 10 randomly selected students earned on the first 8 tests of the VFKRRO�\HDU�DUH�JLYHQ��([SODLQ�KRZ�WR�ILQG�D�OLQH�RI��EHVW�ILW���&RXOG�LW�EH�XVHG�WR�SUHGLFW�WKH�VFRUHV�RI�RWKHU�VWXGHQWV"Explain your reasoning.
62/87,21���Apply a linear regression model to the data. Use the number of each test as the independent variable and the score on each test as the dependent variable. If there is no correlation, the r value will not be close to 1 or í1. If this is the case, the line of fit could not be used to predict the scores of the other students.
����23(1�(1'('� For 10 different people, measure their heights and the lengths of their heads from chin to top. Use these data to generate a linear regression equation and a median-fit equation. Make a prediction using both of the equations.
62/87,21���Student should gather and record data and use a calculator to find the equation of linear regression and a median-fit equation. Students should make predictions based on both equations. � 6DPSOH�GDWD��
� Median-fit (Store in Y1)
y = 8.31x ± 3.12 � /LQHDU�UHJUHVVLRQ���6WRUH�LQ Y2)
y = 7.39x + 5.22 � Find the height of a student with chin to top of head measure of 8.1. Use the value option from the CALC menu. Use the up arrow to move from one line to another. �
�
� The median-fit line predicts a student¶s height of 64.17 inches and the linear regression line predicts a height of 65.07.
Chin to 7RS��RI�
Head Measure Height8.8 70.99.1 72.89.3 73.87.5 61.08.4 66.37.8 62.08.5 67.38.8 68.98.3 68.78.9 71.5
����WRITING IN MATH How are lines of fit and linear regression similar? different?
62/87,21���Sample answer: Both lines of fit and linear regression are used to model data. However, you could have numerous lines of fit, while linear regression results in one line of best fit. If linear regression is used, you can also use the correlation coefficient to see how closely the model fits the data. For example, the scatter plot below displays the points (1, 10), (2, 17), (3, 15), (4, 20), (5, 28), (6, 19), and (7, 25). �
$�OLQH�RI�ILW�FRXOG�EH�GUDZQ�WKURXJK���������DQG����������7KH�HTXDWLRQ�RI�WKLV�OLQH�RI�ILW�LV�� .
� Use a calculator to find the equation of the regression line for this data. �
� The only regression line for this data has an equation of about y = 2.2x����������
����*(20(75<� Sam is putting a border around a poster. x represents the poster¶s width, and y represents the poster¶s length. Which equation represents how much border Sam will use if he doubles the length and the width? � $� 4xy � %� (x + y)4 � &� 4(x + y) � '� 16(x + y)
62/87,21���The perimeter of the room is found by . y is the length and x is the width, so . But Sam wants to double the border, so the perimeter becomes: �
� So, the correct choice is C.
����6+257�5(63216(� Tatiana wants to run 5 miles at an average pace of 9 minutes per mile. After 4 miles, her average pace is 9 minutes 10 seconds. In how many minutes must she complete the final mile to reach her goal?
62/87,21���Tatiana ran each of the first 4 miles in 10 more seconds than she planned. So to reach her goal, she must run the lastmile in 40 seconds less than she planned. 9 min ± 40 s = 8 min and 20 s.
����What is the slope of the line that passes through (1, 3) and (í3, 1)?� )� í2 �
*��
�
+��
� -� 2
62/87,21���
� So, the correct choice is H.
����What is an equation of the line that passes through (0, 1) and has a slope of 3?� $� y = 3x í 1 � %� y = 3x í 2 � &� y = 3x + 4 � '� y = 3x + 1
62/87,21���Find the y-intercept. �
� The equation is y = 3x + 1. So, the correct choice is D.
����86('�&$56� Gianna wants to buy a specific make and model of a used car. She researched prices from dealers and private sellers and made the graph shown. �
� D�� Describe the relationship in the data. � E�� Use the line of fit to predict the price of a car that is 7 years old. � F�� Is it reasonable to use this line of fit to predict the price of a 10-year old car? Explain.
62/87,21���a. Because y decreases as x increases, there is a negative correlation in the data. � b. Find x = 7 on the graph and follow the line up to the line of fit. According to the graph, the price of a car that is 7 years old would be about $3600. � c. No, it would not be reasonable to use this line of fit to predict the price of a 10-year old car, because according to the line of fit, the cost would be $0 and that doesn¶t make sense.
����*(20(75<� A quadrilateral has sides with equations y = í2x, 2x + y = 6, , and x í 2y = 9. Is the figure a rectangle? Explain your reasoning.
62/87,21���Write all of the equations in slope-intercept form. � Equation 1: y = í2x � (TXDWLRQ���� �
� (TXDWLRQ����
������������������y = x + 6 � Equation 4:� �
� Find the slope of each line �
� The slope of opposite sides are equal (±2 and ±���DQG�����DQG�������VR�WKH\�DUH�SDUDOOHO��$OVR��WKH�VORSH�RI�consecutive sides are opposite reciprocals (±2 and 0.5; and ±2 and 0.5), so they are perpendicular. So, the figure is a rectangle.
y = í2x í2y = ±2x +6 í2
y = 0.5x + 6
y = 0.5x ± 4.5
Write each equation in standard form.����y í 2 = 3(x í 1)
62/87,21���
����y í 5 = 6(x + 1)
62/87,21���
����y + 2 = í2(x í 5)
62/87,21���
����
62/87,21���
����
62/87,21���
����
62/87,21���
Find the slope of the line that passes through each pair of points.����(3, 4), (10, 8)
62/87,21���
����(í4, 7), (3, 5)
62/87,21���
����(3, 7), (í2, 4)
62/87,21���
����(í3, 2), (í3, 4)
62/87,21���
The slope is undefined.
If f (x) = x2 í x + 1, find each value.����f (í1)
62/87,21���
����f (5) í3
62/87,21���
����f (a)
62/87,21���
����f (b2)
62/87,21���
Graph each equation.����y = x + 2
62/87,21���To graph the equation, plot the y-intercept (0, 2). Then move up 1 unit and right 1 unit. Plot the point. Draw a line through the two points.
����x + 5y = 4
62/87,21���Write the equation in slope-intercept form. �
To graph the equation, plot the y-LQWHUFHSW�� . Then move down 1 unit and right 5 units. Plot the point. Draw a
line through the two points. �
����2x í 3y = 6
62/87,21���Write the equation in slope-intercept form. �
� To graph the equation, plot the y-intercept (0, ±2). Then move up 2 units and right 3 units. Plot the point. Draw a line through the two points. �
����5x + 2y = 6
62/87,21���Write the equation in slope-intercept form. �
� To graph the equation, plot the y-intercept (0, 3). Then move down 5 units and right 2 units. Plot the point. Draw a line through the two points. �
Another line of fit may pass through (2, 15) and (7, 25). The equation of this line of fit is y = 2x + 11. More lines of fit that come close to the points could be drawn.
eSolutions Manual - Powered by Cognero Page 8
4-6 Regression and Median-Fit Lines

���3277(5<� $�ORFDO�XQLYHUVLW\�LV�NHHSLQJ�WUDFN�RI�WKH�QXPEHU�RI�DUW�VWXGHQWV�ZKR�XVH�WKH�SRWWHU\�VWXGLR�HDFK�GD\�� �
� a. Write an equation of the regression line and find the correlation coefficient. � b. Graph the residual plot and determine if the regression line models the data well.
62/87,21���D��Use a calculator to find the equation of the regression line. � Step 1: Enter the data by pressing STAT and selecting the EDIT option. . Enter the day into List 1 (L1). These willrepresent the x-values. Enter the number of students into List 2 (L2). These will represent the y-values. � Step 2: Perform the regression by pressing STAT �DQG�VHOHFWLQJ�WKH�CALC option. Scroll down to LinReg(ax+ b) and press ENTER. �
� Substitute the values in for a and b to write the equation of the regression line. So, the equation is y = 1.18x + 11. � Identify the value of r on the calculator to find the correlation coefficient. So, 0.7181 is the correlation coefficient. � b.�7XUQ�RQ�Plot2 under the STAT PLOT menu and choose scatter plot. Use L1 for the Xlist and RESID for the Ylist. You can obtain RESID by pressing 2nd STAT and selecting RESID from the list of names. Graph the scatter plot of the residuals by pressing ZOOM and choosing ZoomStat. �
� The residuals appear to be randomly scattered, so the regression line fits the data reasonably well. �
���&20387(56� The table below shows the percent of Americans with a broadband connection at home in a recentyear. Use linear extrapolation and a regression equation to estimate the percentage of 60-year-olds with broadband at home. �
62/87,21���Use a calculator to find the equation of the regression line.�
� y = ±0.34x + 49.48 � Substitute 60 into the equation. �
� So, about 29% of 60-year-olds have broadband at home.
���9$&$7,21� The Smiths want to rent a house on the lake that sleeps eight people. The cost of the house per night is based on how close it is to the water. �
� D�� Find and graph an equation for the median-fit line. � E�� What would you estimate is the cost of a rental 1.75 miles from the lake?
62/87,21���a. Use a calculator to find and graph the equation of the median fit line. �
y = í271.88x + 554.48
� b. To estimate the cost of a rental 1.75 miles from the lake, evaluate the equation of the median-fit line for x = 1.75.�
� An estimate of the cost of a rental 1.75 miles from the lake is $78.69.
Write an equation of the regression line for the data in each table. Then find the correlation coefficient.���6.<6&5$3(56� The table ranks the ten tallest buildings in the world. �
62/87,21���Use a calculator to find the equation of the regression line.�
� y = í2.75x + 102.53 � Use a calculator to find the correlation coefficient. � í0.6071
���086,&� 7KH�WDEOH�JLYHV�WKH�QXPEHU�RI�DQQXDO�YLROLQ�DXGLWLRQV�KHOG�E\�D�\RXWK�V\PSKRQ\�HDFK�\HDU�VLQFH��������/HW�x be the number of years since 2004. �
�
62/87,21���Use a calculator to find the equation of the regression line.�
� y = 3.54x + 19.68 � Use a calculator to find the correlation coefficient. � 0.9007
���5(7$,/� 7KH�WDEOH�JLYHV�WKH�VDOHV�RI�MHDQV�DW�D�FORWKLQJ�FKDLQ�VLQFH��������/HW�x be the number of years since ������ �
� a. Write an equation of the regression line. � b. Graph and analyze the residual plot.
62/87,21���a. Use a calculator to find the equation of the regression line. �
� The equation is about��\ = 3.32x + 5.20. � E��Use a calculator to graph the residual plot for the data. �
� The residuals appear to be randomly scattered. Therefore, the regression line fits the data well.
���0$5$7+21� 7KH�QXPEHU�RI�HQWUDQWV�LQ�WKH�%RVWRQ�0DUDWKRQ�HYHU\�ILYH�\HDUV�VLQFH������LV�VKRZQ���/HW�x be thenumber of years since 1975. �
� � D�� Find an equation for the median-fit line. � E�� According to the equation, how many entrants were there in 2003?
62/87,21���a. Let x = 0 for 1975. Use a calculator to find the equation of the median fit line. �
� y = 601.44x + 1236.13 � b. To estimate the number of entrants in 2003, evaluate the equation for the median-fit line for x = 2003 ± 1975 = 28.�
� There were about 18,076 entrants in 2003.
���&$03,1*� A campground kept a record of the number of campsites rented over the week of July 4 for several \HDUV���/HW�x be the number of years since 2000. �
� D�� Find an equation for the regression line. � E�� Predict the number of campsites that will be rented in 2012. � F�� Predict the number of campsites that will be rented in 2020.
62/87,21���a. Use a calculator to find an equation for the regression line. �
� y = 3.07x + 32.71 � b. To predict the number of campsites that will be rented in 2012, evaluate the regression equation for x = 12�
� There will be about 70 campsites rented in 2012. � c. To predict the number of campsites that will be rented in 2020, evaluate the regression equation for x = 20.�
� There will be about 94 campsites rented in 2020.
���,&(�&5($0� An ice cream company keeps a count of the tubs of cookie dough ice cream delivered to each of their stores in a particular area. ��
� D�� Find an equation for the median-fit line. � E�� Graph the points and the median-fit line. � F�� How many tubs would be delivered to a 1500-square-foot store? a 5000-square-foot store?
62/87,21���a. Use a calculator to find an equation for the median-fit line. �
� y = 0.095x í 94.58 � b. Plot the points and the equation. �
� c. To estimate the number of tubs to be delivered to a 1500-square-foot store, evaluate the regression equation for x = 1500. �
� There are about 48 tubs delivered to a 1500-square-foot store. To estimate the number of tubs to be delivered to a 5000-square-foot store, evaluate the regression equation for x = 5000. �
� There are about 380 tubs delivered to a 5000-square-foot store.
����CCSS SENSE-0$.,1*� The prices of the eight top-selling brands of jeans at Jeanie¶s Jeans are given in the table below. �
� D�� Find the equation for the regression line. � E�� According to the equation, what would be the price of a pair of the 12th best-selling brand? � F�� Is this a reasonable prediction? Explain.
62/87,21���a. Use a calculator to find an equation for the regression line. �
Step 1: Enter the data by pressing and selecting the EDIT option. Enter the sales rank into List 1 (L1). These will represent the x-values. Enter the price into List 2 (L2). These will represent the y-values. �
Step 2: Perform the regression by pressing �DQG�VHOHFWLQJ�WKH�CALC option. Scroll down to LinReg(ax+
b) and press . �
� y = 9.8x + 28.79 � b. To predict the price of a pair of the 12th bestselling brands of jeans, evaluate the regression equation for x = 12. �
� The price of a pair of the 12th bestselling brands of jeans would be about $146.39. � F�� Sample answer: No; the correlation between sales rank and price is too weak to make any reasonable prediction. The 12th bestselling brand of jeans could just as easily be a poorly made pair of jeans selling for $15.
����67$7(�)$,56� The table shows the total attendance, in millions of people, at the Minnesota State Fair from 2005 to 2009. �
� D��Graph a scatter plot of the data, where x = 1 represents 2005. Then find and graph the equation for the best-fit line. � b. Graph and analyze the residual plot. � c.��3UHGLFW�WKH�WRWDO�DWWHQGDQFH�LQ������ �
62/87,21���a. Enter the data from the table into the lists. Let x be the years starting with x = 1 for 2005 and let y = the attendence (in millions). Then graph the scatter plot. �
�
[0, 6] scl: 1 by [0, 3] scl: 0.5 � Perform the linear regression using the data in the lists. Find the equation of the best-fit line. �
� The equation is about y = 0.0326x + 1.598. � Use Y= to enter the equation into the calculator and graph the best-fit line with the scatter plot. �
[0, 6] scl: 1 by [0, 3] scl: 0.5 � b. Use the calculator to graph the residual plot for the data. �
� All the residuals appear to almost be on the line. Therefore, the regression line is a good fit for the data. � F���0HWKRG����To find the number of people in 2020, substitute 16 for x��
� Method 2: Copy the equation to the Y= list and graph. Use the value option to find the value of y when x = 16. �
[0, 17] scl: 1 by [0, 3] scl: 0.5 � 6R��WKHUH�ZLOO�EH�DERXW������PLOOLRQ�SHRSOH�LQ�������
����),5(),*+7(56� 7KH�WDEOH�VKRZV�VWDWLVWLFV�IURP�WKH�8�6��)LUH�$GPLQLVWUDWLRQ�� �
� D�� Find an equation for the median-fit line. � E�� Graph the points and the median-fit line. � F�� Does the median-fit line give you an accurate picture of the number of firefighters? Explain.
62/87,21���a. Use a calculator to find an equation for the median-fit line. �
Step 1: Enter the data by pressing and selecting the EDIT option. Enter age into List 1 (L1). These will represent the x-values. Enter the number of firefighters into List 2 (L2). These will represent the y-values. �
Step 2: Perform the regression by pressing and selecting the CALC option. Scroll down to Med-Med
and press �� �
� y = í841.42x + 223288 � b. Plot the points and graph the median fit line. �
� c. No, the median-fit line does not give an accurate picture of the number of firefighters. The points show no linear correlation; therefore a line cannot accurately portray the data.
����$7+/(7,&6� The table shows the total number of teens who participated in high school athletics in various years. �
� � D�� Find an equation for the regression line. � E�� According to the equation, how many participated in 1988?
62/87,21���a. Use a calculator to find an equation for the regression line. �
Step 1: Enter the data by pressing and selecting the EDIT option. Let the year 1970 be represented by 0. Enter the years since 1970 into List 1 (L1). These will represent the x-values. Enter the number of athletes into List 2 (L2). These will represent the y-values. �
Step 2: Perform the regression by pressing and selecting the CALC option. Scroll down to LinReg(ax+
b) and press . �
� y = 87,390.5x + 4,018,431 � b. To estimate the number of participants in 1988, evaluate the regression equation for x = 18 because 1988 is 18 years after 1970. �
� There were about 5,591,460 participants in 1988.
����$57� $�FRXQW�ZDV�NHSW�RQ�WKH�QXPEHU�RI�SDLQWLQJV�WKDW�VROG�DW�DQ�DXFWLRQ�E\�WKH�\HDU�LQ�ZKLFK�WKH\�ZHUH�SDLQWHG���Let x be the number of years since 1950. �
� D�� Find the equation for the linear regression line. � E�� How many paintings were sold that were painted in 1961? � F�� Is the linear regression equation an accurate model of the data? Explain why or why not.
62/87,21���a. 8VH�D�FDOFXODWRU�WR�ILQG�DQ�HTXDWLRQ�IRU�WKH�UHJUHVVLRQ�OLQH�� �
Step 1: Enter the data by pressing and selecting the EDIT option. Let x =0 for the year 1950.. Enter the years since 1950 into List 1 (L1). These will represent the x-values. Enter the number of painting sold into List 2 (L2). These will represent the y-values. �
Step 2: Perform the regression by pressing �DQG�VHOHFWLQJ�WKH�CALC option. Scroll down to LinReg(ax+
b) and press . � �
� y = 0.446x +9.43 � b. 7R�HVWLPDWH�WKH�QXPEHU�RI�SDLQWLQJV�VROG�LQ�������HYDOXDWH�WKH�UHJUHVVLRQ�HTXDWLRQ�IRU������ZKHQ��x =11. �
� There were about 14 paintings sold in 1961. � F�� No, the correlation coefficient is 0.48, so the linear model is not a good fit for the data. It does not appear from the data that there is a relationship between the number of paintings sold and the year they were painted.
����&&66�$5*80(176� Below are the results of the World Superpipe Championships in 2008.\ �
� � Find an equation of the regression line for each, and graph them on the same coordinate plane. Compare and contrast the men¶s and women's graphs.
62/87,21���Use a calculator to find an equation of the regression line for each set of data.� Men: y = í2.92x + 95.92 Women: y = í7x+106 � Graph the equations on the same coordinate plane. �
� The women¶s scores are typically lower than the men¶s.
����5($621,1*� For a class project, the scores that 10 randomly selected students earned on the first 8 tests of the VFKRRO�\HDU�DUH�JLYHQ��([SODLQ�KRZ�WR�ILQG�D�OLQH�RI��EHVW�ILW���&RXOG�LW�EH�XVHG�WR�SUHGLFW�WKH�VFRUHV�RI�RWKHU�VWXGHQWV"Explain your reasoning.
62/87,21���Apply a linear regression model to the data. Use the number of each test as the independent variable and the score on each test as the dependent variable. If there is no correlation, the r value will not be close to 1 or í1. If this is the case, the line of fit could not be used to predict the scores of the other students.
����23(1�(1'('� For 10 different people, measure their heights and the lengths of their heads from chin to top. Use these data to generate a linear regression equation and a median-fit equation. Make a prediction using both of the equations.
62/87,21���Student should gather and record data and use a calculator to find the equation of linear regression and a median-fit equation. Students should make predictions based on both equations. � 6DPSOH�GDWD��
� Median-fit (Store in Y1)
y = 8.31x ± 3.12 � /LQHDU�UHJUHVVLRQ���6WRUH�LQ Y2)
y = 7.39x + 5.22 � Find the height of a student with chin to top of head measure of 8.1. Use the value option from the CALC menu. Use the up arrow to move from one line to another. �
�
� The median-fit line predicts a student¶s height of 64.17 inches and the linear regression line predicts a height of 65.07.
Chin to 7RS��RI�
Head Measure Height8.8 70.99.1 72.89.3 73.87.5 61.08.4 66.37.8 62.08.5 67.38.8 68.98.3 68.78.9 71.5
����WRITING IN MATH How are lines of fit and linear regression similar? different?
62/87,21���Sample answer: Both lines of fit and linear regression are used to model data. However, you could have numerous lines of fit, while linear regression results in one line of best fit. If linear regression is used, you can also use the correlation coefficient to see how closely the model fits the data. For example, the scatter plot below displays the points (1, 10), (2, 17), (3, 15), (4, 20), (5, 28), (6, 19), and (7, 25). �
$�OLQH�RI�ILW�FRXOG�EH�GUDZQ�WKURXJK���������DQG����������7KH�HTXDWLRQ�RI�WKLV�OLQH�RI�ILW�LV�� .
� Use a calculator to find the equation of the regression line for this data. �
� The only regression line for this data has an equation of about y = 2.2x����������
����*(20(75<� Sam is putting a border around a poster. x represents the poster¶s width, and y represents the poster¶s length. Which equation represents how much border Sam will use if he doubles the length and the width? � $� 4xy � %� (x + y)4 � &� 4(x + y) � '� 16(x + y)
62/87,21���The perimeter of the room is found by . y is the length and x is the width, so . But Sam wants to double the border, so the perimeter becomes: �
� So, the correct choice is C.
����6+257�5(63216(� Tatiana wants to run 5 miles at an average pace of 9 minutes per mile. After 4 miles, her average pace is 9 minutes 10 seconds. In how many minutes must she complete the final mile to reach her goal?
62/87,21���Tatiana ran each of the first 4 miles in 10 more seconds than she planned. So to reach her goal, she must run the lastmile in 40 seconds less than she planned. 9 min ± 40 s = 8 min and 20 s.
����What is the slope of the line that passes through (1, 3) and (í3, 1)?� )� í2 �
*��
�
+��
� -� 2
62/87,21���
� So, the correct choice is H.
����What is an equation of the line that passes through (0, 1) and has a slope of 3?� $� y = 3x í 1 � %� y = 3x í 2 � &� y = 3x + 4 � '� y = 3x + 1
62/87,21���Find the y-intercept. �
� The equation is y = 3x + 1. So, the correct choice is D.
����86('�&$56� Gianna wants to buy a specific make and model of a used car. She researched prices from dealers and private sellers and made the graph shown. �
� D�� Describe the relationship in the data. � E�� Use the line of fit to predict the price of a car that is 7 years old. � F�� Is it reasonable to use this line of fit to predict the price of a 10-year old car? Explain.
62/87,21���a. Because y decreases as x increases, there is a negative correlation in the data. � b. Find x = 7 on the graph and follow the line up to the line of fit. According to the graph, the price of a car that is 7 years old would be about $3600. � c. No, it would not be reasonable to use this line of fit to predict the price of a 10-year old car, because according to the line of fit, the cost would be $0 and that doesn¶t make sense.
����*(20(75<� A quadrilateral has sides with equations y = í2x, 2x + y = 6, , and x í 2y = 9. Is the figure a rectangle? Explain your reasoning.
62/87,21���Write all of the equations in slope-intercept form. � Equation 1: y = í2x � (TXDWLRQ���� �
� (TXDWLRQ����
������������������y = x + 6 � Equation 4:� �
� Find the slope of each line �
� The slope of opposite sides are equal (±2 and ±���DQG�����DQG�������VR�WKH\�DUH�SDUDOOHO��$OVR��WKH�VORSH�RI�consecutive sides are opposite reciprocals (±2 and 0.5; and ±2 and 0.5), so they are perpendicular. So, the figure is a rectangle.
y = í2x í2y = ±2x +6 í2
y = 0.5x + 6
y = 0.5x ± 4.5
Write each equation in standard form.����y í 2 = 3(x í 1)
62/87,21���
����y í 5 = 6(x + 1)
62/87,21���
����y + 2 = í2(x í 5)
62/87,21���
����
62/87,21���
����
62/87,21���
����
62/87,21���
Find the slope of the line that passes through each pair of points.����(3, 4), (10, 8)
62/87,21���
����(í4, 7), (3, 5)
62/87,21���
����(3, 7), (í2, 4)
62/87,21���
����(í3, 2), (í3, 4)
62/87,21���
The slope is undefined.
If f (x) = x2 í x + 1, find each value.����f (í1)
62/87,21���
����f (5) í3
62/87,21���
����f (a)
62/87,21���
����f (b2)
62/87,21���
Graph each equation.����y = x + 2
62/87,21���To graph the equation, plot the y-intercept (0, 2). Then move up 1 unit and right 1 unit. Plot the point. Draw a line through the two points.
����x + 5y = 4
62/87,21���Write the equation in slope-intercept form. �
To graph the equation, plot the y-LQWHUFHSW�� . Then move down 1 unit and right 5 units. Plot the point. Draw a
line through the two points. �
����2x í 3y = 6
62/87,21���Write the equation in slope-intercept form. �
� To graph the equation, plot the y-intercept (0, ±2). Then move up 2 units and right 3 units. Plot the point. Draw a line through the two points. �
����5x + 2y = 6
62/87,21���Write the equation in slope-intercept form. �
� To graph the equation, plot the y-intercept (0, 3). Then move down 5 units and right 2 units. Plot the point. Draw a line through the two points. �
Another line of fit may pass through (2, 15) and (7, 25). The equation of this line of fit is y = 2x + 11. More lines of fit that come close to the points could be drawn.
eSolutions Manual - Powered by Cognero Page 9
4-6 Regression and Median-Fit Lines
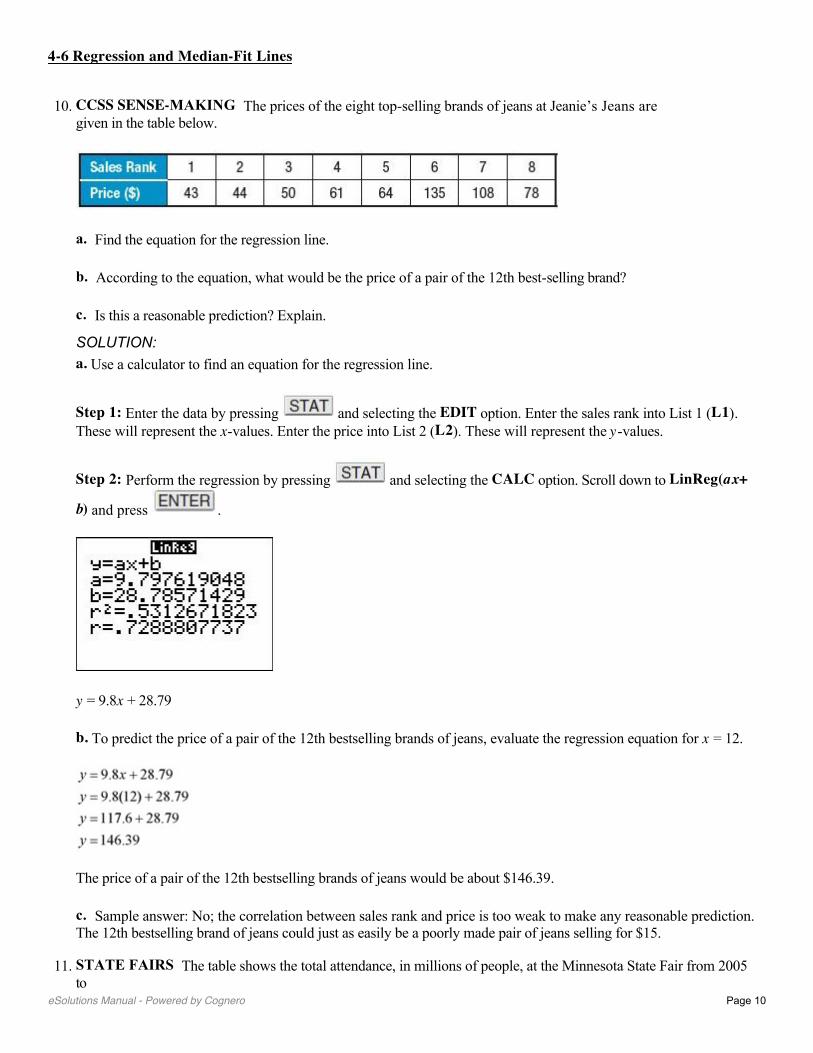
���3277(5<� $�ORFDO�XQLYHUVLW\�LV�NHHSLQJ�WUDFN�RI�WKH�QXPEHU�RI�DUW�VWXGHQWV�ZKR�XVH�WKH�SRWWHU\�VWXGLR�HDFK�GD\�� �
� a. Write an equation of the regression line and find the correlation coefficient. � b. Graph the residual plot and determine if the regression line models the data well.
62/87,21���D��Use a calculator to find the equation of the regression line. � Step 1: Enter the data by pressing STAT and selecting the EDIT option. . Enter the day into List 1 (L1). These willrepresent the x-values. Enter the number of students into List 2 (L2). These will represent the y-values. � Step 2: Perform the regression by pressing STAT �DQG�VHOHFWLQJ�WKH�CALC option. Scroll down to LinReg(ax+ b) and press ENTER. �
� Substitute the values in for a and b to write the equation of the regression line. So, the equation is y = 1.18x + 11. � Identify the value of r on the calculator to find the correlation coefficient. So, 0.7181 is the correlation coefficient. � b.�7XUQ�RQ�Plot2 under the STAT PLOT menu and choose scatter plot. Use L1 for the Xlist and RESID for the Ylist. You can obtain RESID by pressing 2nd STAT and selecting RESID from the list of names. Graph the scatter plot of the residuals by pressing ZOOM and choosing ZoomStat. �
� The residuals appear to be randomly scattered, so the regression line fits the data reasonably well. �
���&20387(56� The table below shows the percent of Americans with a broadband connection at home in a recentyear. Use linear extrapolation and a regression equation to estimate the percentage of 60-year-olds with broadband at home. �
62/87,21���Use a calculator to find the equation of the regression line.�
� y = ±0.34x + 49.48 � Substitute 60 into the equation. �
� So, about 29% of 60-year-olds have broadband at home.
���9$&$7,21� The Smiths want to rent a house on the lake that sleeps eight people. The cost of the house per night is based on how close it is to the water. �
� D�� Find and graph an equation for the median-fit line. � E�� What would you estimate is the cost of a rental 1.75 miles from the lake?
62/87,21���a. Use a calculator to find and graph the equation of the median fit line. �
y = í271.88x + 554.48
� b. To estimate the cost of a rental 1.75 miles from the lake, evaluate the equation of the median-fit line for x = 1.75.�
� An estimate of the cost of a rental 1.75 miles from the lake is $78.69.
Write an equation of the regression line for the data in each table. Then find the correlation coefficient.���6.<6&5$3(56� The table ranks the ten tallest buildings in the world. �
62/87,21���Use a calculator to find the equation of the regression line.�
� y = í2.75x + 102.53 � Use a calculator to find the correlation coefficient. � í0.6071
���086,&� 7KH�WDEOH�JLYHV�WKH�QXPEHU�RI�DQQXDO�YLROLQ�DXGLWLRQV�KHOG�E\�D�\RXWK�V\PSKRQ\�HDFK�\HDU�VLQFH��������/HW�x be the number of years since 2004. �
�
62/87,21���Use a calculator to find the equation of the regression line.�
� y = 3.54x + 19.68 � Use a calculator to find the correlation coefficient. � 0.9007
���5(7$,/� 7KH�WDEOH�JLYHV�WKH�VDOHV�RI�MHDQV�DW�D�FORWKLQJ�FKDLQ�VLQFH��������/HW�x be the number of years since ������ �
� a. Write an equation of the regression line. � b. Graph and analyze the residual plot.
62/87,21���a. Use a calculator to find the equation of the regression line. �
� The equation is about��\ = 3.32x + 5.20. � E��Use a calculator to graph the residual plot for the data. �
� The residuals appear to be randomly scattered. Therefore, the regression line fits the data well.
���0$5$7+21� 7KH�QXPEHU�RI�HQWUDQWV�LQ�WKH�%RVWRQ�0DUDWKRQ�HYHU\�ILYH�\HDUV�VLQFH������LV�VKRZQ���/HW�x be thenumber of years since 1975. �
� � D�� Find an equation for the median-fit line. � E�� According to the equation, how many entrants were there in 2003?
62/87,21���a. Let x = 0 for 1975. Use a calculator to find the equation of the median fit line. �
� y = 601.44x + 1236.13 � b. To estimate the number of entrants in 2003, evaluate the equation for the median-fit line for x = 2003 ± 1975 = 28.�
� There were about 18,076 entrants in 2003.
���&$03,1*� A campground kept a record of the number of campsites rented over the week of July 4 for several \HDUV���/HW�x be the number of years since 2000. �
� D�� Find an equation for the regression line. � E�� Predict the number of campsites that will be rented in 2012. � F�� Predict the number of campsites that will be rented in 2020.
62/87,21���a. Use a calculator to find an equation for the regression line. �
� y = 3.07x + 32.71 � b. To predict the number of campsites that will be rented in 2012, evaluate the regression equation for x = 12�
� There will be about 70 campsites rented in 2012. � c. To predict the number of campsites that will be rented in 2020, evaluate the regression equation for x = 20.�
� There will be about 94 campsites rented in 2020.
���,&(�&5($0� An ice cream company keeps a count of the tubs of cookie dough ice cream delivered to each of their stores in a particular area. ��
� D�� Find an equation for the median-fit line. � E�� Graph the points and the median-fit line. � F�� How many tubs would be delivered to a 1500-square-foot store? a 5000-square-foot store?
62/87,21���a. Use a calculator to find an equation for the median-fit line. �
� y = 0.095x í 94.58 � b. Plot the points and the equation. �
� c. To estimate the number of tubs to be delivered to a 1500-square-foot store, evaluate the regression equation for x = 1500. �
� There are about 48 tubs delivered to a 1500-square-foot store. To estimate the number of tubs to be delivered to a 5000-square-foot store, evaluate the regression equation for x = 5000. �
� There are about 380 tubs delivered to a 5000-square-foot store.
����CCSS SENSE-0$.,1*� The prices of the eight top-selling brands of jeans at Jeanie¶s Jeans are given in the table below. �
� D�� Find the equation for the regression line. � E�� According to the equation, what would be the price of a pair of the 12th best-selling brand? � F�� Is this a reasonable prediction? Explain.
62/87,21���a. Use a calculator to find an equation for the regression line. �
Step 1: Enter the data by pressing and selecting the EDIT option. Enter the sales rank into List 1 (L1). These will represent the x-values. Enter the price into List 2 (L2). These will represent the y-values. �
Step 2: Perform the regression by pressing �DQG�VHOHFWLQJ�WKH�CALC option. Scroll down to LinReg(ax+
b) and press . �
� y = 9.8x + 28.79 � b. To predict the price of a pair of the 12th bestselling brands of jeans, evaluate the regression equation for x = 12. �
� The price of a pair of the 12th bestselling brands of jeans would be about $146.39. � F�� Sample answer: No; the correlation between sales rank and price is too weak to make any reasonable prediction. The 12th bestselling brand of jeans could just as easily be a poorly made pair of jeans selling for $15.
����67$7(�)$,56� The table shows the total attendance, in millions of people, at the Minnesota State Fair from 2005 to 2009. �
� D��Graph a scatter plot of the data, where x = 1 represents 2005. Then find and graph the equation for the best-fit line. � b. Graph and analyze the residual plot. � c.��3UHGLFW�WKH�WRWDO�DWWHQGDQFH�LQ������ �
62/87,21���a. Enter the data from the table into the lists. Let x be the years starting with x = 1 for 2005 and let y = the attendence (in millions). Then graph the scatter plot. �
�
[0, 6] scl: 1 by [0, 3] scl: 0.5 � Perform the linear regression using the data in the lists. Find the equation of the best-fit line. �
� The equation is about y = 0.0326x + 1.598. � Use Y= to enter the equation into the calculator and graph the best-fit line with the scatter plot. �
[0, 6] scl: 1 by [0, 3] scl: 0.5 � b. Use the calculator to graph the residual plot for the data. �
� All the residuals appear to almost be on the line. Therefore, the regression line is a good fit for the data. � F���0HWKRG����To find the number of people in 2020, substitute 16 for x��
� Method 2: Copy the equation to the Y= list and graph. Use the value option to find the value of y when x = 16. �
[0, 17] scl: 1 by [0, 3] scl: 0.5 � 6R��WKHUH�ZLOO�EH�DERXW������PLOOLRQ�SHRSOH�LQ�������
����),5(),*+7(56� 7KH�WDEOH�VKRZV�VWDWLVWLFV�IURP�WKH�8�6��)LUH�$GPLQLVWUDWLRQ�� �
� D�� Find an equation for the median-fit line. � E�� Graph the points and the median-fit line. � F�� Does the median-fit line give you an accurate picture of the number of firefighters? Explain.
62/87,21���a. Use a calculator to find an equation for the median-fit line. �
Step 1: Enter the data by pressing and selecting the EDIT option. Enter age into List 1 (L1). These will represent the x-values. Enter the number of firefighters into List 2 (L2). These will represent the y-values. �
Step 2: Perform the regression by pressing and selecting the CALC option. Scroll down to Med-Med
and press �� �
� y = í841.42x + 223288 � b. Plot the points and graph the median fit line. �
� c. No, the median-fit line does not give an accurate picture of the number of firefighters. The points show no linear correlation; therefore a line cannot accurately portray the data.
����$7+/(7,&6� The table shows the total number of teens who participated in high school athletics in various years. �
� � D�� Find an equation for the regression line. � E�� According to the equation, how many participated in 1988?
62/87,21���a. Use a calculator to find an equation for the regression line. �
Step 1: Enter the data by pressing and selecting the EDIT option. Let the year 1970 be represented by 0. Enter the years since 1970 into List 1 (L1). These will represent the x-values. Enter the number of athletes into List 2 (L2). These will represent the y-values. �
Step 2: Perform the regression by pressing and selecting the CALC option. Scroll down to LinReg(ax+
b) and press . �
� y = 87,390.5x + 4,018,431 � b. To estimate the number of participants in 1988, evaluate the regression equation for x = 18 because 1988 is 18 years after 1970. �
� There were about 5,591,460 participants in 1988.
����$57� $�FRXQW�ZDV�NHSW�RQ�WKH�QXPEHU�RI�SDLQWLQJV�WKDW�VROG�DW�DQ�DXFWLRQ�E\�WKH�\HDU�LQ�ZKLFK�WKH\�ZHUH�SDLQWHG���Let x be the number of years since 1950. �
� D�� Find the equation for the linear regression line. � E�� How many paintings were sold that were painted in 1961? � F�� Is the linear regression equation an accurate model of the data? Explain why or why not.
62/87,21���a. 8VH�D�FDOFXODWRU�WR�ILQG�DQ�HTXDWLRQ�IRU�WKH�UHJUHVVLRQ�OLQH�� �
Step 1: Enter the data by pressing and selecting the EDIT option. Let x =0 for the year 1950.. Enter the years since 1950 into List 1 (L1). These will represent the x-values. Enter the number of painting sold into List 2 (L2). These will represent the y-values. �
Step 2: Perform the regression by pressing �DQG�VHOHFWLQJ�WKH�CALC option. Scroll down to LinReg(ax+
b) and press . � �
� y = 0.446x +9.43 � b. 7R�HVWLPDWH�WKH�QXPEHU�RI�SDLQWLQJV�VROG�LQ�������HYDOXDWH�WKH�UHJUHVVLRQ�HTXDWLRQ�IRU������ZKHQ��x =11. �
� There were about 14 paintings sold in 1961. � F�� No, the correlation coefficient is 0.48, so the linear model is not a good fit for the data. It does not appear from the data that there is a relationship between the number of paintings sold and the year they were painted.
����&&66�$5*80(176� Below are the results of the World Superpipe Championships in 2008.\ �
� � Find an equation of the regression line for each, and graph them on the same coordinate plane. Compare and contrast the men¶s and women's graphs.
62/87,21���Use a calculator to find an equation of the regression line for each set of data.� Men: y = í2.92x + 95.92 Women: y = í7x+106 � Graph the equations on the same coordinate plane. �
� The women¶s scores are typically lower than the men¶s.
����5($621,1*� For a class project, the scores that 10 randomly selected students earned on the first 8 tests of the VFKRRO�\HDU�DUH�JLYHQ��([SODLQ�KRZ�WR�ILQG�D�OLQH�RI��EHVW�ILW���&RXOG�LW�EH�XVHG�WR�SUHGLFW�WKH�VFRUHV�RI�RWKHU�VWXGHQWV"Explain your reasoning.
62/87,21���Apply a linear regression model to the data. Use the number of each test as the independent variable and the score on each test as the dependent variable. If there is no correlation, the r value will not be close to 1 or í1. If this is the case, the line of fit could not be used to predict the scores of the other students.
����23(1�(1'('� For 10 different people, measure their heights and the lengths of their heads from chin to top. Use these data to generate a linear regression equation and a median-fit equation. Make a prediction using both of the equations.
62/87,21���Student should gather and record data and use a calculator to find the equation of linear regression and a median-fit equation. Students should make predictions based on both equations. � 6DPSOH�GDWD��
� Median-fit (Store in Y1)
y = 8.31x ± 3.12 � /LQHDU�UHJUHVVLRQ���6WRUH�LQ Y2)
y = 7.39x + 5.22 � Find the height of a student with chin to top of head measure of 8.1. Use the value option from the CALC menu. Use the up arrow to move from one line to another. �
�
� The median-fit line predicts a student¶s height of 64.17 inches and the linear regression line predicts a height of 65.07.
Chin to 7RS��RI�
Head Measure Height8.8 70.99.1 72.89.3 73.87.5 61.08.4 66.37.8 62.08.5 67.38.8 68.98.3 68.78.9 71.5
����WRITING IN MATH How are lines of fit and linear regression similar? different?
62/87,21���Sample answer: Both lines of fit and linear regression are used to model data. However, you could have numerous lines of fit, while linear regression results in one line of best fit. If linear regression is used, you can also use the correlation coefficient to see how closely the model fits the data. For example, the scatter plot below displays the points (1, 10), (2, 17), (3, 15), (4, 20), (5, 28), (6, 19), and (7, 25). �
$�OLQH�RI�ILW�FRXOG�EH�GUDZQ�WKURXJK���������DQG����������7KH�HTXDWLRQ�RI�WKLV�OLQH�RI�ILW�LV�� .
� Use a calculator to find the equation of the regression line for this data. �
� The only regression line for this data has an equation of about y = 2.2x����������
����*(20(75<� Sam is putting a border around a poster. x represents the poster¶s width, and y represents the poster¶s length. Which equation represents how much border Sam will use if he doubles the length and the width? � $� 4xy � %� (x + y)4 � &� 4(x + y) � '� 16(x + y)
62/87,21���The perimeter of the room is found by . y is the length and x is the width, so . But Sam wants to double the border, so the perimeter becomes: �
� So, the correct choice is C.
����6+257�5(63216(� Tatiana wants to run 5 miles at an average pace of 9 minutes per mile. After 4 miles, her average pace is 9 minutes 10 seconds. In how many minutes must she complete the final mile to reach her goal?
62/87,21���Tatiana ran each of the first 4 miles in 10 more seconds than she planned. So to reach her goal, she must run the lastmile in 40 seconds less than she planned. 9 min ± 40 s = 8 min and 20 s.
����What is the slope of the line that passes through (1, 3) and (í3, 1)?� )� í2 �
*��
�
+��
� -� 2
62/87,21���
� So, the correct choice is H.
����What is an equation of the line that passes through (0, 1) and has a slope of 3?� $� y = 3x í 1 � %� y = 3x í 2 � &� y = 3x + 4 � '� y = 3x + 1
62/87,21���Find the y-intercept. �
� The equation is y = 3x + 1. So, the correct choice is D.
����86('�&$56� Gianna wants to buy a specific make and model of a used car. She researched prices from dealers and private sellers and made the graph shown. �
� D�� Describe the relationship in the data. � E�� Use the line of fit to predict the price of a car that is 7 years old. � F�� Is it reasonable to use this line of fit to predict the price of a 10-year old car? Explain.
62/87,21���a. Because y decreases as x increases, there is a negative correlation in the data. � b. Find x = 7 on the graph and follow the line up to the line of fit. According to the graph, the price of a car that is 7 years old would be about $3600. � c. No, it would not be reasonable to use this line of fit to predict the price of a 10-year old car, because according to the line of fit, the cost would be $0 and that doesn¶t make sense.
����*(20(75<� A quadrilateral has sides with equations y = í2x, 2x + y = 6, , and x í 2y = 9. Is the figure a rectangle? Explain your reasoning.
62/87,21���Write all of the equations in slope-intercept form. � Equation 1: y = í2x � (TXDWLRQ���� �
� (TXDWLRQ����
������������������y = x + 6 � Equation 4:� �
� Find the slope of each line �
� The slope of opposite sides are equal (±2 and ±���DQG�����DQG�������VR�WKH\�DUH�SDUDOOHO��$OVR��WKH�VORSH�RI�consecutive sides are opposite reciprocals (±2 and 0.5; and ±2 and 0.5), so they are perpendicular. So, the figure is a rectangle.
y = í2x í2y = ±2x +6 í2
y = 0.5x + 6
y = 0.5x ± 4.5
Write each equation in standard form.����y í 2 = 3(x í 1)
62/87,21���
����y í 5 = 6(x + 1)
62/87,21���
����y + 2 = í2(x í 5)
62/87,21���
����
62/87,21���
����
62/87,21���
����
62/87,21���
Find the slope of the line that passes through each pair of points.����(3, 4), (10, 8)
62/87,21���
����(í4, 7), (3, 5)
62/87,21���
����(3, 7), (í2, 4)
62/87,21���
����(í3, 2), (í3, 4)
62/87,21���
The slope is undefined.
If f (x) = x2 í x + 1, find each value.����f (í1)
62/87,21���
����f (5) í3
62/87,21���
����f (a)
62/87,21���
����f (b2)
62/87,21���
Graph each equation.����y = x + 2
62/87,21���To graph the equation, plot the y-intercept (0, 2). Then move up 1 unit and right 1 unit. Plot the point. Draw a line through the two points.
����x + 5y = 4
62/87,21���Write the equation in slope-intercept form. �
To graph the equation, plot the y-LQWHUFHSW�� . Then move down 1 unit and right 5 units. Plot the point. Draw a
line through the two points. �
����2x í 3y = 6
62/87,21���Write the equation in slope-intercept form. �
� To graph the equation, plot the y-intercept (0, ±2). Then move up 2 units and right 3 units. Plot the point. Draw a line through the two points. �
����5x + 2y = 6
62/87,21���Write the equation in slope-intercept form. �
� To graph the equation, plot the y-intercept (0, 3). Then move down 5 units and right 2 units. Plot the point. Draw a line through the two points. �
Another line of fit may pass through (2, 15) and (7, 25). The equation of this line of fit is y = 2x + 11. More lines of fit that come close to the points could be drawn.
eSolutions Manual - Powered by Cognero Page 10
4-6 Regression and Median-Fit Lines

���3277(5<� $�ORFDO�XQLYHUVLW\�LV�NHHSLQJ�WUDFN�RI�WKH�QXPEHU�RI�DUW�VWXGHQWV�ZKR�XVH�WKH�SRWWHU\�VWXGLR�HDFK�GD\�� �
� a. Write an equation of the regression line and find the correlation coefficient. � b. Graph the residual plot and determine if the regression line models the data well.
62/87,21���D��Use a calculator to find the equation of the regression line. � Step 1: Enter the data by pressing STAT and selecting the EDIT option. . Enter the day into List 1 (L1). These willrepresent the x-values. Enter the number of students into List 2 (L2). These will represent the y-values. � Step 2: Perform the regression by pressing STAT �DQG�VHOHFWLQJ�WKH�CALC option. Scroll down to LinReg(ax+ b) and press ENTER. �
� Substitute the values in for a and b to write the equation of the regression line. So, the equation is y = 1.18x + 11. � Identify the value of r on the calculator to find the correlation coefficient. So, 0.7181 is the correlation coefficient. � b.�7XUQ�RQ�Plot2 under the STAT PLOT menu and choose scatter plot. Use L1 for the Xlist and RESID for the Ylist. You can obtain RESID by pressing 2nd STAT and selecting RESID from the list of names. Graph the scatter plot of the residuals by pressing ZOOM and choosing ZoomStat. �
� The residuals appear to be randomly scattered, so the regression line fits the data reasonably well. �
���&20387(56� The table below shows the percent of Americans with a broadband connection at home in a recentyear. Use linear extrapolation and a regression equation to estimate the percentage of 60-year-olds with broadband at home. �
62/87,21���Use a calculator to find the equation of the regression line.�
� y = ±0.34x + 49.48 � Substitute 60 into the equation. �
� So, about 29% of 60-year-olds have broadband at home.
���9$&$7,21� The Smiths want to rent a house on the lake that sleeps eight people. The cost of the house per night is based on how close it is to the water. �
� D�� Find and graph an equation for the median-fit line. � E�� What would you estimate is the cost of a rental 1.75 miles from the lake?
62/87,21���a. Use a calculator to find and graph the equation of the median fit line. �
y = í271.88x + 554.48
� b. To estimate the cost of a rental 1.75 miles from the lake, evaluate the equation of the median-fit line for x = 1.75.�
� An estimate of the cost of a rental 1.75 miles from the lake is $78.69.
Write an equation of the regression line for the data in each table. Then find the correlation coefficient.���6.<6&5$3(56� The table ranks the ten tallest buildings in the world. �
62/87,21���Use a calculator to find the equation of the regression line.�
� y = í2.75x + 102.53 � Use a calculator to find the correlation coefficient. � í0.6071
���086,&� 7KH�WDEOH�JLYHV�WKH�QXPEHU�RI�DQQXDO�YLROLQ�DXGLWLRQV�KHOG�E\�D�\RXWK�V\PSKRQ\�HDFK�\HDU�VLQFH��������/HW�x be the number of years since 2004. �
�
62/87,21���Use a calculator to find the equation of the regression line.�
� y = 3.54x + 19.68 � Use a calculator to find the correlation coefficient. � 0.9007
���5(7$,/� 7KH�WDEOH�JLYHV�WKH�VDOHV�RI�MHDQV�DW�D�FORWKLQJ�FKDLQ�VLQFH��������/HW�x be the number of years since ������ �
� a. Write an equation of the regression line. � b. Graph and analyze the residual plot.
62/87,21���a. Use a calculator to find the equation of the regression line. �
� The equation is about��\ = 3.32x + 5.20. � E��Use a calculator to graph the residual plot for the data. �
� The residuals appear to be randomly scattered. Therefore, the regression line fits the data well.
���0$5$7+21� 7KH�QXPEHU�RI�HQWUDQWV�LQ�WKH�%RVWRQ�0DUDWKRQ�HYHU\�ILYH�\HDUV�VLQFH������LV�VKRZQ���/HW�x be thenumber of years since 1975. �
� � D�� Find an equation for the median-fit line. � E�� According to the equation, how many entrants were there in 2003?
62/87,21���a. Let x = 0 for 1975. Use a calculator to find the equation of the median fit line. �
� y = 601.44x + 1236.13 � b. To estimate the number of entrants in 2003, evaluate the equation for the median-fit line for x = 2003 ± 1975 = 28.�
� There were about 18,076 entrants in 2003.
���&$03,1*� A campground kept a record of the number of campsites rented over the week of July 4 for several \HDUV���/HW�x be the number of years since 2000. �
� D�� Find an equation for the regression line. � E�� Predict the number of campsites that will be rented in 2012. � F�� Predict the number of campsites that will be rented in 2020.
62/87,21���a. Use a calculator to find an equation for the regression line. �
� y = 3.07x + 32.71 � b. To predict the number of campsites that will be rented in 2012, evaluate the regression equation for x = 12�
� There will be about 70 campsites rented in 2012. � c. To predict the number of campsites that will be rented in 2020, evaluate the regression equation for x = 20.�
� There will be about 94 campsites rented in 2020.
���,&(�&5($0� An ice cream company keeps a count of the tubs of cookie dough ice cream delivered to each of their stores in a particular area. ��
� D�� Find an equation for the median-fit line. � E�� Graph the points and the median-fit line. � F�� How many tubs would be delivered to a 1500-square-foot store? a 5000-square-foot store?
62/87,21���a. Use a calculator to find an equation for the median-fit line. �
� y = 0.095x í 94.58 � b. Plot the points and the equation. �
� c. To estimate the number of tubs to be delivered to a 1500-square-foot store, evaluate the regression equation for x = 1500. �
� There are about 48 tubs delivered to a 1500-square-foot store. To estimate the number of tubs to be delivered to a 5000-square-foot store, evaluate the regression equation for x = 5000. �
� There are about 380 tubs delivered to a 5000-square-foot store.
����CCSS SENSE-0$.,1*� The prices of the eight top-selling brands of jeans at Jeanie¶s Jeans are given in the table below. �
� D�� Find the equation for the regression line. � E�� According to the equation, what would be the price of a pair of the 12th best-selling brand? � F�� Is this a reasonable prediction? Explain.
62/87,21���a. Use a calculator to find an equation for the regression line. �
Step 1: Enter the data by pressing and selecting the EDIT option. Enter the sales rank into List 1 (L1). These will represent the x-values. Enter the price into List 2 (L2). These will represent the y-values. �
Step 2: Perform the regression by pressing �DQG�VHOHFWLQJ�WKH�CALC option. Scroll down to LinReg(ax+
b) and press . �
� y = 9.8x + 28.79 � b. To predict the price of a pair of the 12th bestselling brands of jeans, evaluate the regression equation for x = 12. �
� The price of a pair of the 12th bestselling brands of jeans would be about $146.39. � F�� Sample answer: No; the correlation between sales rank and price is too weak to make any reasonable prediction. The 12th bestselling brand of jeans could just as easily be a poorly made pair of jeans selling for $15.
����67$7(�)$,56� The table shows the total attendance, in millions of people, at the Minnesota State Fair from 2005 to 2009. �
� D��Graph a scatter plot of the data, where x = 1 represents 2005. Then find and graph the equation for the best-fit line. � b. Graph and analyze the residual plot. � c.��3UHGLFW�WKH�WRWDO�DWWHQGDQFH�LQ������ �
62/87,21���a. Enter the data from the table into the lists. Let x be the years starting with x = 1 for 2005 and let y = the attendence (in millions). Then graph the scatter plot. �
�
[0, 6] scl: 1 by [0, 3] scl: 0.5 � Perform the linear regression using the data in the lists. Find the equation of the best-fit line. �
� The equation is about y = 0.0326x + 1.598. � Use Y= to enter the equation into the calculator and graph the best-fit line with the scatter plot. �
[0, 6] scl: 1 by [0, 3] scl: 0.5 � b. Use the calculator to graph the residual plot for the data. �
� All the residuals appear to almost be on the line. Therefore, the regression line is a good fit for the data. � F���0HWKRG����To find the number of people in 2020, substitute 16 for x��
� Method 2: Copy the equation to the Y= list and graph. Use the value option to find the value of y when x = 16. �
[0, 17] scl: 1 by [0, 3] scl: 0.5 � 6R��WKHUH�ZLOO�EH�DERXW������PLOOLRQ�SHRSOH�LQ�������
����),5(),*+7(56� 7KH�WDEOH�VKRZV�VWDWLVWLFV�IURP�WKH�8�6��)LUH�$GPLQLVWUDWLRQ�� �
� D�� Find an equation for the median-fit line. � E�� Graph the points and the median-fit line. � F�� Does the median-fit line give you an accurate picture of the number of firefighters? Explain.
62/87,21���a. Use a calculator to find an equation for the median-fit line. �
Step 1: Enter the data by pressing and selecting the EDIT option. Enter age into List 1 (L1). These will represent the x-values. Enter the number of firefighters into List 2 (L2). These will represent the y-values. �
Step 2: Perform the regression by pressing and selecting the CALC option. Scroll down to Med-Med
and press �� �
� y = í841.42x + 223288 � b. Plot the points and graph the median fit line. �
� c. No, the median-fit line does not give an accurate picture of the number of firefighters. The points show no linear correlation; therefore a line cannot accurately portray the data.
����$7+/(7,&6� The table shows the total number of teens who participated in high school athletics in various years. �
� � D�� Find an equation for the regression line. � E�� According to the equation, how many participated in 1988?
62/87,21���a. Use a calculator to find an equation for the regression line. �
Step 1: Enter the data by pressing and selecting the EDIT option. Let the year 1970 be represented by 0. Enter the years since 1970 into List 1 (L1). These will represent the x-values. Enter the number of athletes into List 2 (L2). These will represent the y-values. �
Step 2: Perform the regression by pressing and selecting the CALC option. Scroll down to LinReg(ax+
b) and press . �
� y = 87,390.5x + 4,018,431 � b. To estimate the number of participants in 1988, evaluate the regression equation for x = 18 because 1988 is 18 years after 1970. �
� There were about 5,591,460 participants in 1988.
����$57� $�FRXQW�ZDV�NHSW�RQ�WKH�QXPEHU�RI�SDLQWLQJV�WKDW�VROG�DW�DQ�DXFWLRQ�E\�WKH�\HDU�LQ�ZKLFK�WKH\�ZHUH�SDLQWHG���Let x be the number of years since 1950. �
� D�� Find the equation for the linear regression line. � E�� How many paintings were sold that were painted in 1961? � F�� Is the linear regression equation an accurate model of the data? Explain why or why not.
62/87,21���a. 8VH�D�FDOFXODWRU�WR�ILQG�DQ�HTXDWLRQ�IRU�WKH�UHJUHVVLRQ�OLQH�� �
Step 1: Enter the data by pressing and selecting the EDIT option. Let x =0 for the year 1950.. Enter the years since 1950 into List 1 (L1). These will represent the x-values. Enter the number of painting sold into List 2 (L2). These will represent the y-values. �
Step 2: Perform the regression by pressing �DQG�VHOHFWLQJ�WKH�CALC option. Scroll down to LinReg(ax+
b) and press . � �
� y = 0.446x +9.43 � b. 7R�HVWLPDWH�WKH�QXPEHU�RI�SDLQWLQJV�VROG�LQ�������HYDOXDWH�WKH�UHJUHVVLRQ�HTXDWLRQ�IRU������ZKHQ��x =11. �
� There were about 14 paintings sold in 1961. � F�� No, the correlation coefficient is 0.48, so the linear model is not a good fit for the data. It does not appear from the data that there is a relationship between the number of paintings sold and the year they were painted.
����&&66�$5*80(176� Below are the results of the World Superpipe Championships in 2008.\ �
� � Find an equation of the regression line for each, and graph them on the same coordinate plane. Compare and contrast the men¶s and women's graphs.
62/87,21���Use a calculator to find an equation of the regression line for each set of data.� Men: y = í2.92x + 95.92 Women: y = í7x+106 � Graph the equations on the same coordinate plane. �
� The women¶s scores are typically lower than the men¶s.
����5($621,1*� For a class project, the scores that 10 randomly selected students earned on the first 8 tests of the VFKRRO�\HDU�DUH�JLYHQ��([SODLQ�KRZ�WR�ILQG�D�OLQH�RI��EHVW�ILW���&RXOG�LW�EH�XVHG�WR�SUHGLFW�WKH�VFRUHV�RI�RWKHU�VWXGHQWV"Explain your reasoning.
62/87,21���Apply a linear regression model to the data. Use the number of each test as the independent variable and the score on each test as the dependent variable. If there is no correlation, the r value will not be close to 1 or í1. If this is the case, the line of fit could not be used to predict the scores of the other students.
����23(1�(1'('� For 10 different people, measure their heights and the lengths of their heads from chin to top. Use these data to generate a linear regression equation and a median-fit equation. Make a prediction using both of the equations.
62/87,21���Student should gather and record data and use a calculator to find the equation of linear regression and a median-fit equation. Students should make predictions based on both equations. � 6DPSOH�GDWD��
� Median-fit (Store in Y1)
y = 8.31x ± 3.12 � /LQHDU�UHJUHVVLRQ���6WRUH�LQ Y2)
y = 7.39x + 5.22 � Find the height of a student with chin to top of head measure of 8.1. Use the value option from the CALC menu. Use the up arrow to move from one line to another. �
�
� The median-fit line predicts a student¶s height of 64.17 inches and the linear regression line predicts a height of 65.07.
Chin to 7RS��RI�
Head Measure Height8.8 70.99.1 72.89.3 73.87.5 61.08.4 66.37.8 62.08.5 67.38.8 68.98.3 68.78.9 71.5
����WRITING IN MATH How are lines of fit and linear regression similar? different?
62/87,21���Sample answer: Both lines of fit and linear regression are used to model data. However, you could have numerous lines of fit, while linear regression results in one line of best fit. If linear regression is used, you can also use the correlation coefficient to see how closely the model fits the data. For example, the scatter plot below displays the points (1, 10), (2, 17), (3, 15), (4, 20), (5, 28), (6, 19), and (7, 25). �
$�OLQH�RI�ILW�FRXOG�EH�GUDZQ�WKURXJK���������DQG����������7KH�HTXDWLRQ�RI�WKLV�OLQH�RI�ILW�LV�� .
� Use a calculator to find the equation of the regression line for this data. �
� The only regression line for this data has an equation of about y = 2.2x����������
����*(20(75<� Sam is putting a border around a poster. x represents the poster¶s width, and y represents the poster¶s length. Which equation represents how much border Sam will use if he doubles the length and the width? � $� 4xy � %� (x + y)4 � &� 4(x + y) � '� 16(x + y)
62/87,21���The perimeter of the room is found by . y is the length and x is the width, so . But Sam wants to double the border, so the perimeter becomes: �
� So, the correct choice is C.
����6+257�5(63216(� Tatiana wants to run 5 miles at an average pace of 9 minutes per mile. After 4 miles, her average pace is 9 minutes 10 seconds. In how many minutes must she complete the final mile to reach her goal?
62/87,21���Tatiana ran each of the first 4 miles in 10 more seconds than she planned. So to reach her goal, she must run the lastmile in 40 seconds less than she planned. 9 min ± 40 s = 8 min and 20 s.
����What is the slope of the line that passes through (1, 3) and (í3, 1)?� )� í2 �
*��
�
+��
� -� 2
62/87,21���
� So, the correct choice is H.
����What is an equation of the line that passes through (0, 1) and has a slope of 3?� $� y = 3x í 1 � %� y = 3x í 2 � &� y = 3x + 4 � '� y = 3x + 1
62/87,21���Find the y-intercept. �
� The equation is y = 3x + 1. So, the correct choice is D.
����86('�&$56� Gianna wants to buy a specific make and model of a used car. She researched prices from dealers and private sellers and made the graph shown. �
� D�� Describe the relationship in the data. � E�� Use the line of fit to predict the price of a car that is 7 years old. � F�� Is it reasonable to use this line of fit to predict the price of a 10-year old car? Explain.
62/87,21���a. Because y decreases as x increases, there is a negative correlation in the data. � b. Find x = 7 on the graph and follow the line up to the line of fit. According to the graph, the price of a car that is 7 years old would be about $3600. � c. No, it would not be reasonable to use this line of fit to predict the price of a 10-year old car, because according to the line of fit, the cost would be $0 and that doesn¶t make sense.
����*(20(75<� A quadrilateral has sides with equations y = í2x, 2x + y = 6, , and x í 2y = 9. Is the figure a rectangle? Explain your reasoning.
62/87,21���Write all of the equations in slope-intercept form. � Equation 1: y = í2x � (TXDWLRQ���� �
� (TXDWLRQ����
������������������y = x + 6 � Equation 4:� �
� Find the slope of each line �
� The slope of opposite sides are equal (±2 and ±���DQG�����DQG�������VR�WKH\�DUH�SDUDOOHO��$OVR��WKH�VORSH�RI�consecutive sides are opposite reciprocals (±2 and 0.5; and ±2 and 0.5), so they are perpendicular. So, the figure is a rectangle.
y = í2x í2y = ±2x +6 í2
y = 0.5x + 6
y = 0.5x ± 4.5
Write each equation in standard form.����y í 2 = 3(x í 1)
62/87,21���
����y í 5 = 6(x + 1)
62/87,21���
����y + 2 = í2(x í 5)
62/87,21���
����
62/87,21���
����
62/87,21���
����
62/87,21���
Find the slope of the line that passes through each pair of points.����(3, 4), (10, 8)
62/87,21���
����(í4, 7), (3, 5)
62/87,21���
����(3, 7), (í2, 4)
62/87,21���
����(í3, 2), (í3, 4)
62/87,21���
The slope is undefined.
If f (x) = x2 í x + 1, find each value.����f (í1)
62/87,21���
����f (5) í3
62/87,21���
����f (a)
62/87,21���
����f (b2)
62/87,21���
Graph each equation.����y = x + 2
62/87,21���To graph the equation, plot the y-intercept (0, 2). Then move up 1 unit and right 1 unit. Plot the point. Draw a line through the two points.
����x + 5y = 4
62/87,21���Write the equation in slope-intercept form. �
To graph the equation, plot the y-LQWHUFHSW�� . Then move down 1 unit and right 5 units. Plot the point. Draw a
line through the two points. �
����2x í 3y = 6
62/87,21���Write the equation in slope-intercept form. �
� To graph the equation, plot the y-intercept (0, ±2). Then move up 2 units and right 3 units. Plot the point. Draw a line through the two points. �
����5x + 2y = 6
62/87,21���Write the equation in slope-intercept form. �
� To graph the equation, plot the y-intercept (0, 3). Then move down 5 units and right 2 units. Plot the point. Draw a line through the two points. �
Another line of fit may pass through (2, 15) and (7, 25). The equation of this line of fit is y = 2x + 11. More lines of fit that come close to the points could be drawn.
eSolutions Manual - Powered by Cognero Page 11
4-6 Regression and Median-Fit Lines

���3277(5<� $�ORFDO�XQLYHUVLW\�LV�NHHSLQJ�WUDFN�RI�WKH�QXPEHU�RI�DUW�VWXGHQWV�ZKR�XVH�WKH�SRWWHU\�VWXGLR�HDFK�GD\�� �
� a. Write an equation of the regression line and find the correlation coefficient. � b. Graph the residual plot and determine if the regression line models the data well.
62/87,21���D��Use a calculator to find the equation of the regression line. � Step 1: Enter the data by pressing STAT and selecting the EDIT option. . Enter the day into List 1 (L1). These willrepresent the x-values. Enter the number of students into List 2 (L2). These will represent the y-values. � Step 2: Perform the regression by pressing STAT �DQG�VHOHFWLQJ�WKH�CALC option. Scroll down to LinReg(ax+ b) and press ENTER. �
� Substitute the values in for a and b to write the equation of the regression line. So, the equation is y = 1.18x + 11. � Identify the value of r on the calculator to find the correlation coefficient. So, 0.7181 is the correlation coefficient. � b.�7XUQ�RQ�Plot2 under the STAT PLOT menu and choose scatter plot. Use L1 for the Xlist and RESID for the Ylist. You can obtain RESID by pressing 2nd STAT and selecting RESID from the list of names. Graph the scatter plot of the residuals by pressing ZOOM and choosing ZoomStat. �
� The residuals appear to be randomly scattered, so the regression line fits the data reasonably well. �
���&20387(56� The table below shows the percent of Americans with a broadband connection at home in a recentyear. Use linear extrapolation and a regression equation to estimate the percentage of 60-year-olds with broadband at home. �
62/87,21���Use a calculator to find the equation of the regression line.�
� y = ±0.34x + 49.48 � Substitute 60 into the equation. �
� So, about 29% of 60-year-olds have broadband at home.
���9$&$7,21� The Smiths want to rent a house on the lake that sleeps eight people. The cost of the house per night is based on how close it is to the water. �
� D�� Find and graph an equation for the median-fit line. � E�� What would you estimate is the cost of a rental 1.75 miles from the lake?
62/87,21���a. Use a calculator to find and graph the equation of the median fit line. �
y = í271.88x + 554.48
� b. To estimate the cost of a rental 1.75 miles from the lake, evaluate the equation of the median-fit line for x = 1.75.�
� An estimate of the cost of a rental 1.75 miles from the lake is $78.69.
Write an equation of the regression line for the data in each table. Then find the correlation coefficient.���6.<6&5$3(56� The table ranks the ten tallest buildings in the world. �
62/87,21���Use a calculator to find the equation of the regression line.�
� y = í2.75x + 102.53 � Use a calculator to find the correlation coefficient. � í0.6071
���086,&� 7KH�WDEOH�JLYHV�WKH�QXPEHU�RI�DQQXDO�YLROLQ�DXGLWLRQV�KHOG�E\�D�\RXWK�V\PSKRQ\�HDFK�\HDU�VLQFH��������/HW�x be the number of years since 2004. �
�
62/87,21���Use a calculator to find the equation of the regression line.�
� y = 3.54x + 19.68 � Use a calculator to find the correlation coefficient. � 0.9007
���5(7$,/� 7KH�WDEOH�JLYHV�WKH�VDOHV�RI�MHDQV�DW�D�FORWKLQJ�FKDLQ�VLQFH��������/HW�x be the number of years since ������ �
� a. Write an equation of the regression line. � b. Graph and analyze the residual plot.
62/87,21���a. Use a calculator to find the equation of the regression line. �
� The equation is about��\ = 3.32x + 5.20. � E��Use a calculator to graph the residual plot for the data. �
� The residuals appear to be randomly scattered. Therefore, the regression line fits the data well.
���0$5$7+21� 7KH�QXPEHU�RI�HQWUDQWV�LQ�WKH�%RVWRQ�0DUDWKRQ�HYHU\�ILYH�\HDUV�VLQFH������LV�VKRZQ���/HW�x be thenumber of years since 1975. �
� � D�� Find an equation for the median-fit line. � E�� According to the equation, how many entrants were there in 2003?
62/87,21���a. Let x = 0 for 1975. Use a calculator to find the equation of the median fit line. �
� y = 601.44x + 1236.13 � b. To estimate the number of entrants in 2003, evaluate the equation for the median-fit line for x = 2003 ± 1975 = 28.�
� There were about 18,076 entrants in 2003.
���&$03,1*� A campground kept a record of the number of campsites rented over the week of July 4 for several \HDUV���/HW�x be the number of years since 2000. �
� D�� Find an equation for the regression line. � E�� Predict the number of campsites that will be rented in 2012. � F�� Predict the number of campsites that will be rented in 2020.
62/87,21���a. Use a calculator to find an equation for the regression line. �
� y = 3.07x + 32.71 � b. To predict the number of campsites that will be rented in 2012, evaluate the regression equation for x = 12�
� There will be about 70 campsites rented in 2012. � c. To predict the number of campsites that will be rented in 2020, evaluate the regression equation for x = 20.�
� There will be about 94 campsites rented in 2020.
���,&(�&5($0� An ice cream company keeps a count of the tubs of cookie dough ice cream delivered to each of their stores in a particular area. ��
� D�� Find an equation for the median-fit line. � E�� Graph the points and the median-fit line. � F�� How many tubs would be delivered to a 1500-square-foot store? a 5000-square-foot store?
62/87,21���a. Use a calculator to find an equation for the median-fit line. �
� y = 0.095x í 94.58 � b. Plot the points and the equation. �
� c. To estimate the number of tubs to be delivered to a 1500-square-foot store, evaluate the regression equation for x = 1500. �
� There are about 48 tubs delivered to a 1500-square-foot store. To estimate the number of tubs to be delivered to a 5000-square-foot store, evaluate the regression equation for x = 5000. �
� There are about 380 tubs delivered to a 5000-square-foot store.
����CCSS SENSE-0$.,1*� The prices of the eight top-selling brands of jeans at Jeanie¶s Jeans are given in the table below. �
� D�� Find the equation for the regression line. � E�� According to the equation, what would be the price of a pair of the 12th best-selling brand? � F�� Is this a reasonable prediction? Explain.
62/87,21���a. Use a calculator to find an equation for the regression line. �
Step 1: Enter the data by pressing and selecting the EDIT option. Enter the sales rank into List 1 (L1). These will represent the x-values. Enter the price into List 2 (L2). These will represent the y-values. �
Step 2: Perform the regression by pressing �DQG�VHOHFWLQJ�WKH�CALC option. Scroll down to LinReg(ax+
b) and press . �
� y = 9.8x + 28.79 � b. To predict the price of a pair of the 12th bestselling brands of jeans, evaluate the regression equation for x = 12. �
� The price of a pair of the 12th bestselling brands of jeans would be about $146.39. � F�� Sample answer: No; the correlation between sales rank and price is too weak to make any reasonable prediction. The 12th bestselling brand of jeans could just as easily be a poorly made pair of jeans selling for $15.
����67$7(�)$,56� The table shows the total attendance, in millions of people, at the Minnesota State Fair from 2005 to 2009. �
� D��Graph a scatter plot of the data, where x = 1 represents 2005. Then find and graph the equation for the best-fit line. � b. Graph and analyze the residual plot. � c.��3UHGLFW�WKH�WRWDO�DWWHQGDQFH�LQ������ �
62/87,21���a. Enter the data from the table into the lists. Let x be the years starting with x = 1 for 2005 and let y = the attendence (in millions). Then graph the scatter plot. �
�
[0, 6] scl: 1 by [0, 3] scl: 0.5 � Perform the linear regression using the data in the lists. Find the equation of the best-fit line. �
� The equation is about y = 0.0326x + 1.598. � Use Y= to enter the equation into the calculator and graph the best-fit line with the scatter plot. �
[0, 6] scl: 1 by [0, 3] scl: 0.5 � b. Use the calculator to graph the residual plot for the data. �
� All the residuals appear to almost be on the line. Therefore, the regression line is a good fit for the data. � F���0HWKRG����To find the number of people in 2020, substitute 16 for x��
� Method 2: Copy the equation to the Y= list and graph. Use the value option to find the value of y when x = 16. �
[0, 17] scl: 1 by [0, 3] scl: 0.5 � 6R��WKHUH�ZLOO�EH�DERXW������PLOOLRQ�SHRSOH�LQ�������
����),5(),*+7(56� 7KH�WDEOH�VKRZV�VWDWLVWLFV�IURP�WKH�8�6��)LUH�$GPLQLVWUDWLRQ�� �
� D�� Find an equation for the median-fit line. � E�� Graph the points and the median-fit line. � F�� Does the median-fit line give you an accurate picture of the number of firefighters? Explain.
62/87,21���a. Use a calculator to find an equation for the median-fit line. �
Step 1: Enter the data by pressing and selecting the EDIT option. Enter age into List 1 (L1). These will represent the x-values. Enter the number of firefighters into List 2 (L2). These will represent the y-values. �
Step 2: Perform the regression by pressing and selecting the CALC option. Scroll down to Med-Med
and press �� �
� y = í841.42x + 223288 � b. Plot the points and graph the median fit line. �
� c. No, the median-fit line does not give an accurate picture of the number of firefighters. The points show no linear correlation; therefore a line cannot accurately portray the data.
����$7+/(7,&6� The table shows the total number of teens who participated in high school athletics in various years. �
� � D�� Find an equation for the regression line. � E�� According to the equation, how many participated in 1988?
62/87,21���a. Use a calculator to find an equation for the regression line. �
Step 1: Enter the data by pressing and selecting the EDIT option. Let the year 1970 be represented by 0. Enter the years since 1970 into List 1 (L1). These will represent the x-values. Enter the number of athletes into List 2 (L2). These will represent the y-values. �
Step 2: Perform the regression by pressing and selecting the CALC option. Scroll down to LinReg(ax+
b) and press . �
� y = 87,390.5x + 4,018,431 � b. To estimate the number of participants in 1988, evaluate the regression equation for x = 18 because 1988 is 18 years after 1970. �
� There were about 5,591,460 participants in 1988.
����$57� $�FRXQW�ZDV�NHSW�RQ�WKH�QXPEHU�RI�SDLQWLQJV�WKDW�VROG�DW�DQ�DXFWLRQ�E\�WKH�\HDU�LQ�ZKLFK�WKH\�ZHUH�SDLQWHG���Let x be the number of years since 1950. �
� D�� Find the equation for the linear regression line. � E�� How many paintings were sold that were painted in 1961? � F�� Is the linear regression equation an accurate model of the data? Explain why or why not.
62/87,21���a. 8VH�D�FDOFXODWRU�WR�ILQG�DQ�HTXDWLRQ�IRU�WKH�UHJUHVVLRQ�OLQH�� �
Step 1: Enter the data by pressing and selecting the EDIT option. Let x =0 for the year 1950.. Enter the years since 1950 into List 1 (L1). These will represent the x-values. Enter the number of painting sold into List 2 (L2). These will represent the y-values. �
Step 2: Perform the regression by pressing �DQG�VHOHFWLQJ�WKH�CALC option. Scroll down to LinReg(ax+
b) and press . � �
� y = 0.446x +9.43 � b. 7R�HVWLPDWH�WKH�QXPEHU�RI�SDLQWLQJV�VROG�LQ�������HYDOXDWH�WKH�UHJUHVVLRQ�HTXDWLRQ�IRU������ZKHQ��x =11. �
� There were about 14 paintings sold in 1961. � F�� No, the correlation coefficient is 0.48, so the linear model is not a good fit for the data. It does not appear from the data that there is a relationship between the number of paintings sold and the year they were painted.
����&&66�$5*80(176� Below are the results of the World Superpipe Championships in 2008.\ �
� � Find an equation of the regression line for each, and graph them on the same coordinate plane. Compare and contrast the men¶s and women's graphs.
62/87,21���Use a calculator to find an equation of the regression line for each set of data.� Men: y = í2.92x + 95.92 Women: y = í7x+106 � Graph the equations on the same coordinate plane. �
� The women¶s scores are typically lower than the men¶s.
����5($621,1*� For a class project, the scores that 10 randomly selected students earned on the first 8 tests of the VFKRRO�\HDU�DUH�JLYHQ��([SODLQ�KRZ�WR�ILQG�D�OLQH�RI��EHVW�ILW���&RXOG�LW�EH�XVHG�WR�SUHGLFW�WKH�VFRUHV�RI�RWKHU�VWXGHQWV"Explain your reasoning.
62/87,21���Apply a linear regression model to the data. Use the number of each test as the independent variable and the score on each test as the dependent variable. If there is no correlation, the r value will not be close to 1 or í1. If this is the case, the line of fit could not be used to predict the scores of the other students.
����23(1�(1'('� For 10 different people, measure their heights and the lengths of their heads from chin to top. Use these data to generate a linear regression equation and a median-fit equation. Make a prediction using both of the equations.
62/87,21���Student should gather and record data and use a calculator to find the equation of linear regression and a median-fit equation. Students should make predictions based on both equations. � 6DPSOH�GDWD��
� Median-fit (Store in Y1)
y = 8.31x ± 3.12 � /LQHDU�UHJUHVVLRQ���6WRUH�LQ Y2)
y = 7.39x + 5.22 � Find the height of a student with chin to top of head measure of 8.1. Use the value option from the CALC menu. Use the up arrow to move from one line to another. �
�
� The median-fit line predicts a student¶s height of 64.17 inches and the linear regression line predicts a height of 65.07.
Chin to 7RS��RI�
Head Measure Height8.8 70.99.1 72.89.3 73.87.5 61.08.4 66.37.8 62.08.5 67.38.8 68.98.3 68.78.9 71.5
����WRITING IN MATH How are lines of fit and linear regression similar? different?
62/87,21���Sample answer: Both lines of fit and linear regression are used to model data. However, you could have numerous lines of fit, while linear regression results in one line of best fit. If linear regression is used, you can also use the correlation coefficient to see how closely the model fits the data. For example, the scatter plot below displays the points (1, 10), (2, 17), (3, 15), (4, 20), (5, 28), (6, 19), and (7, 25). �
$�OLQH�RI�ILW�FRXOG�EH�GUDZQ�WKURXJK���������DQG����������7KH�HTXDWLRQ�RI�WKLV�OLQH�RI�ILW�LV�� .
� Use a calculator to find the equation of the regression line for this data. �
� The only regression line for this data has an equation of about y = 2.2x����������
����*(20(75<� Sam is putting a border around a poster. x represents the poster¶s width, and y represents the poster¶s length. Which equation represents how much border Sam will use if he doubles the length and the width? � $� 4xy � %� (x + y)4 � &� 4(x + y) � '� 16(x + y)
62/87,21���The perimeter of the room is found by . y is the length and x is the width, so . But Sam wants to double the border, so the perimeter becomes: �
� So, the correct choice is C.
����6+257�5(63216(� Tatiana wants to run 5 miles at an average pace of 9 minutes per mile. After 4 miles, her average pace is 9 minutes 10 seconds. In how many minutes must she complete the final mile to reach her goal?
62/87,21���Tatiana ran each of the first 4 miles in 10 more seconds than she planned. So to reach her goal, she must run the lastmile in 40 seconds less than she planned. 9 min ± 40 s = 8 min and 20 s.
����What is the slope of the line that passes through (1, 3) and (í3, 1)?� )� í2 �
*��
�
+��
� -� 2
62/87,21���
� So, the correct choice is H.
����What is an equation of the line that passes through (0, 1) and has a slope of 3?� $� y = 3x í 1 � %� y = 3x í 2 � &� y = 3x + 4 � '� y = 3x + 1
62/87,21���Find the y-intercept. �
� The equation is y = 3x + 1. So, the correct choice is D.
����86('�&$56� Gianna wants to buy a specific make and model of a used car. She researched prices from dealers and private sellers and made the graph shown. �
� D�� Describe the relationship in the data. � E�� Use the line of fit to predict the price of a car that is 7 years old. � F�� Is it reasonable to use this line of fit to predict the price of a 10-year old car? Explain.
62/87,21���a. Because y decreases as x increases, there is a negative correlation in the data. � b. Find x = 7 on the graph and follow the line up to the line of fit. According to the graph, the price of a car that is 7 years old would be about $3600. � c. No, it would not be reasonable to use this line of fit to predict the price of a 10-year old car, because according to the line of fit, the cost would be $0 and that doesn¶t make sense.
����*(20(75<� A quadrilateral has sides with equations y = í2x, 2x + y = 6, , and x í 2y = 9. Is the figure a rectangle? Explain your reasoning.
62/87,21���Write all of the equations in slope-intercept form. � Equation 1: y = í2x � (TXDWLRQ���� �
� (TXDWLRQ����
������������������y = x + 6 � Equation 4:� �
� Find the slope of each line �
� The slope of opposite sides are equal (±2 and ±���DQG�����DQG�������VR�WKH\�DUH�SDUDOOHO��$OVR��WKH�VORSH�RI�consecutive sides are opposite reciprocals (±2 and 0.5; and ±2 and 0.5), so they are perpendicular. So, the figure is a rectangle.
y = í2x í2y = ±2x +6 í2
y = 0.5x + 6
y = 0.5x ± 4.5
Write each equation in standard form.����y í 2 = 3(x í 1)
62/87,21���
����y í 5 = 6(x + 1)
62/87,21���
����y + 2 = í2(x í 5)
62/87,21���
����
62/87,21���
����
62/87,21���
����
62/87,21���
Find the slope of the line that passes through each pair of points.����(3, 4), (10, 8)
62/87,21���
����(í4, 7), (3, 5)
62/87,21���
����(3, 7), (í2, 4)
62/87,21���
����(í3, 2), (í3, 4)
62/87,21���
The slope is undefined.
If f (x) = x2 í x + 1, find each value.����f (í1)
62/87,21���
����f (5) í3
62/87,21���
����f (a)
62/87,21���
����f (b2)
62/87,21���
Graph each equation.����y = x + 2
62/87,21���To graph the equation, plot the y-intercept (0, 2). Then move up 1 unit and right 1 unit. Plot the point. Draw a line through the two points.
����x + 5y = 4
62/87,21���Write the equation in slope-intercept form. �
To graph the equation, plot the y-LQWHUFHSW�� . Then move down 1 unit and right 5 units. Plot the point. Draw a
line through the two points. �
����2x í 3y = 6
62/87,21���Write the equation in slope-intercept form. �
� To graph the equation, plot the y-intercept (0, ±2). Then move up 2 units and right 3 units. Plot the point. Draw a line through the two points. �
����5x + 2y = 6
62/87,21���Write the equation in slope-intercept form. �
� To graph the equation, plot the y-intercept (0, 3). Then move down 5 units and right 2 units. Plot the point. Draw a line through the two points. �
Another line of fit may pass through (2, 15) and (7, 25). The equation of this line of fit is y = 2x + 11. More lines of fit that come close to the points could be drawn.
eSolutions Manual - Powered by Cognero Page 12
4-6 Regression and Median-Fit Lines

���3277(5<� $�ORFDO�XQLYHUVLW\�LV�NHHSLQJ�WUDFN�RI�WKH�QXPEHU�RI�DUW�VWXGHQWV�ZKR�XVH�WKH�SRWWHU\�VWXGLR�HDFK�GD\�� �
� a. Write an equation of the regression line and find the correlation coefficient. � b. Graph the residual plot and determine if the regression line models the data well.
62/87,21���D��Use a calculator to find the equation of the regression line. � Step 1: Enter the data by pressing STAT and selecting the EDIT option. . Enter the day into List 1 (L1). These willrepresent the x-values. Enter the number of students into List 2 (L2). These will represent the y-values. � Step 2: Perform the regression by pressing STAT �DQG�VHOHFWLQJ�WKH�CALC option. Scroll down to LinReg(ax+ b) and press ENTER. �
� Substitute the values in for a and b to write the equation of the regression line. So, the equation is y = 1.18x + 11. � Identify the value of r on the calculator to find the correlation coefficient. So, 0.7181 is the correlation coefficient. � b.�7XUQ�RQ�Plot2 under the STAT PLOT menu and choose scatter plot. Use L1 for the Xlist and RESID for the Ylist. You can obtain RESID by pressing 2nd STAT and selecting RESID from the list of names. Graph the scatter plot of the residuals by pressing ZOOM and choosing ZoomStat. �
� The residuals appear to be randomly scattered, so the regression line fits the data reasonably well. �
���&20387(56� The table below shows the percent of Americans with a broadband connection at home in a recentyear. Use linear extrapolation and a regression equation to estimate the percentage of 60-year-olds with broadband at home. �
62/87,21���Use a calculator to find the equation of the regression line.�
� y = ±0.34x + 49.48 � Substitute 60 into the equation. �
� So, about 29% of 60-year-olds have broadband at home.
���9$&$7,21� The Smiths want to rent a house on the lake that sleeps eight people. The cost of the house per night is based on how close it is to the water. �
� D�� Find and graph an equation for the median-fit line. � E�� What would you estimate is the cost of a rental 1.75 miles from the lake?
62/87,21���a. Use a calculator to find and graph the equation of the median fit line. �
y = í271.88x + 554.48
� b. To estimate the cost of a rental 1.75 miles from the lake, evaluate the equation of the median-fit line for x = 1.75.�
� An estimate of the cost of a rental 1.75 miles from the lake is $78.69.
Write an equation of the regression line for the data in each table. Then find the correlation coefficient.���6.<6&5$3(56� The table ranks the ten tallest buildings in the world. �
62/87,21���Use a calculator to find the equation of the regression line.�
� y = í2.75x + 102.53 � Use a calculator to find the correlation coefficient. � í0.6071
���086,&� 7KH�WDEOH�JLYHV�WKH�QXPEHU�RI�DQQXDO�YLROLQ�DXGLWLRQV�KHOG�E\�D�\RXWK�V\PSKRQ\�HDFK�\HDU�VLQFH��������/HW�x be the number of years since 2004. �
�
62/87,21���Use a calculator to find the equation of the regression line.�
� y = 3.54x + 19.68 � Use a calculator to find the correlation coefficient. � 0.9007
���5(7$,/� 7KH�WDEOH�JLYHV�WKH�VDOHV�RI�MHDQV�DW�D�FORWKLQJ�FKDLQ�VLQFH��������/HW�x be the number of years since ������ �
� a. Write an equation of the regression line. � b. Graph and analyze the residual plot.
62/87,21���a. Use a calculator to find the equation of the regression line. �
� The equation is about��\ = 3.32x + 5.20. � E��Use a calculator to graph the residual plot for the data. �
� The residuals appear to be randomly scattered. Therefore, the regression line fits the data well.
���0$5$7+21� 7KH�QXPEHU�RI�HQWUDQWV�LQ�WKH�%RVWRQ�0DUDWKRQ�HYHU\�ILYH�\HDUV�VLQFH������LV�VKRZQ���/HW�x be thenumber of years since 1975. �
� � D�� Find an equation for the median-fit line. � E�� According to the equation, how many entrants were there in 2003?
62/87,21���a. Let x = 0 for 1975. Use a calculator to find the equation of the median fit line. �
� y = 601.44x + 1236.13 � b. To estimate the number of entrants in 2003, evaluate the equation for the median-fit line for x = 2003 ± 1975 = 28.�
� There were about 18,076 entrants in 2003.
���&$03,1*� A campground kept a record of the number of campsites rented over the week of July 4 for several \HDUV���/HW�x be the number of years since 2000. �
� D�� Find an equation for the regression line. � E�� Predict the number of campsites that will be rented in 2012. � F�� Predict the number of campsites that will be rented in 2020.
62/87,21���a. Use a calculator to find an equation for the regression line. �
� y = 3.07x + 32.71 � b. To predict the number of campsites that will be rented in 2012, evaluate the regression equation for x = 12�
� There will be about 70 campsites rented in 2012. � c. To predict the number of campsites that will be rented in 2020, evaluate the regression equation for x = 20.�
� There will be about 94 campsites rented in 2020.
���,&(�&5($0� An ice cream company keeps a count of the tubs of cookie dough ice cream delivered to each of their stores in a particular area. ��
� D�� Find an equation for the median-fit line. � E�� Graph the points and the median-fit line. � F�� How many tubs would be delivered to a 1500-square-foot store? a 5000-square-foot store?
62/87,21���a. Use a calculator to find an equation for the median-fit line. �
� y = 0.095x í 94.58 � b. Plot the points and the equation. �
� c. To estimate the number of tubs to be delivered to a 1500-square-foot store, evaluate the regression equation for x = 1500. �
� There are about 48 tubs delivered to a 1500-square-foot store. To estimate the number of tubs to be delivered to a 5000-square-foot store, evaluate the regression equation for x = 5000. �
� There are about 380 tubs delivered to a 5000-square-foot store.
����CCSS SENSE-0$.,1*� The prices of the eight top-selling brands of jeans at Jeanie¶s Jeans are given in the table below. �
� D�� Find the equation for the regression line. � E�� According to the equation, what would be the price of a pair of the 12th best-selling brand? � F�� Is this a reasonable prediction? Explain.
62/87,21���a. Use a calculator to find an equation for the regression line. �
Step 1: Enter the data by pressing and selecting the EDIT option. Enter the sales rank into List 1 (L1). These will represent the x-values. Enter the price into List 2 (L2). These will represent the y-values. �
Step 2: Perform the regression by pressing �DQG�VHOHFWLQJ�WKH�CALC option. Scroll down to LinReg(ax+
b) and press . �
� y = 9.8x + 28.79 � b. To predict the price of a pair of the 12th bestselling brands of jeans, evaluate the regression equation for x = 12. �
� The price of a pair of the 12th bestselling brands of jeans would be about $146.39. � F�� Sample answer: No; the correlation between sales rank and price is too weak to make any reasonable prediction. The 12th bestselling brand of jeans could just as easily be a poorly made pair of jeans selling for $15.
����67$7(�)$,56� The table shows the total attendance, in millions of people, at the Minnesota State Fair from 2005 to 2009. �
� D��Graph a scatter plot of the data, where x = 1 represents 2005. Then find and graph the equation for the best-fit line. � b. Graph and analyze the residual plot. � c.��3UHGLFW�WKH�WRWDO�DWWHQGDQFH�LQ������ �
62/87,21���a. Enter the data from the table into the lists. Let x be the years starting with x = 1 for 2005 and let y = the attendence (in millions). Then graph the scatter plot. �
�
[0, 6] scl: 1 by [0, 3] scl: 0.5 � Perform the linear regression using the data in the lists. Find the equation of the best-fit line. �
� The equation is about y = 0.0326x + 1.598. � Use Y= to enter the equation into the calculator and graph the best-fit line with the scatter plot. �
[0, 6] scl: 1 by [0, 3] scl: 0.5 � b. Use the calculator to graph the residual plot for the data. �
� All the residuals appear to almost be on the line. Therefore, the regression line is a good fit for the data. � F���0HWKRG����To find the number of people in 2020, substitute 16 for x��
� Method 2: Copy the equation to the Y= list and graph. Use the value option to find the value of y when x = 16. �
[0, 17] scl: 1 by [0, 3] scl: 0.5 � 6R��WKHUH�ZLOO�EH�DERXW������PLOOLRQ�SHRSOH�LQ�������
����),5(),*+7(56� 7KH�WDEOH�VKRZV�VWDWLVWLFV�IURP�WKH�8�6��)LUH�$GPLQLVWUDWLRQ�� �
� D�� Find an equation for the median-fit line. � E�� Graph the points and the median-fit line. � F�� Does the median-fit line give you an accurate picture of the number of firefighters? Explain.
62/87,21���a. Use a calculator to find an equation for the median-fit line. �
Step 1: Enter the data by pressing and selecting the EDIT option. Enter age into List 1 (L1). These will represent the x-values. Enter the number of firefighters into List 2 (L2). These will represent the y-values. �
Step 2: Perform the regression by pressing and selecting the CALC option. Scroll down to Med-Med
and press �� �
� y = í841.42x + 223288 � b. Plot the points and graph the median fit line. �
� c. No, the median-fit line does not give an accurate picture of the number of firefighters. The points show no linear correlation; therefore a line cannot accurately portray the data.
����$7+/(7,&6� The table shows the total number of teens who participated in high school athletics in various years. �
� � D�� Find an equation for the regression line. � E�� According to the equation, how many participated in 1988?
62/87,21���a. Use a calculator to find an equation for the regression line. �
Step 1: Enter the data by pressing and selecting the EDIT option. Let the year 1970 be represented by 0. Enter the years since 1970 into List 1 (L1). These will represent the x-values. Enter the number of athletes into List 2 (L2). These will represent the y-values. �
Step 2: Perform the regression by pressing and selecting the CALC option. Scroll down to LinReg(ax+
b) and press . �
� y = 87,390.5x + 4,018,431 � b. To estimate the number of participants in 1988, evaluate the regression equation for x = 18 because 1988 is 18 years after 1970. �
� There were about 5,591,460 participants in 1988.
����$57� $�FRXQW�ZDV�NHSW�RQ�WKH�QXPEHU�RI�SDLQWLQJV�WKDW�VROG�DW�DQ�DXFWLRQ�E\�WKH�\HDU�LQ�ZKLFK�WKH\�ZHUH�SDLQWHG���Let x be the number of years since 1950. �
� D�� Find the equation for the linear regression line. � E�� How many paintings were sold that were painted in 1961? � F�� Is the linear regression equation an accurate model of the data? Explain why or why not.
62/87,21���a. 8VH�D�FDOFXODWRU�WR�ILQG�DQ�HTXDWLRQ�IRU�WKH�UHJUHVVLRQ�OLQH�� �
Step 1: Enter the data by pressing and selecting the EDIT option. Let x =0 for the year 1950.. Enter the years since 1950 into List 1 (L1). These will represent the x-values. Enter the number of painting sold into List 2 (L2). These will represent the y-values. �
Step 2: Perform the regression by pressing �DQG�VHOHFWLQJ�WKH�CALC option. Scroll down to LinReg(ax+
b) and press . � �
� y = 0.446x +9.43 � b. 7R�HVWLPDWH�WKH�QXPEHU�RI�SDLQWLQJV�VROG�LQ�������HYDOXDWH�WKH�UHJUHVVLRQ�HTXDWLRQ�IRU������ZKHQ��x =11. �
� There were about 14 paintings sold in 1961. � F�� No, the correlation coefficient is 0.48, so the linear model is not a good fit for the data. It does not appear from the data that there is a relationship between the number of paintings sold and the year they were painted.
����&&66�$5*80(176� Below are the results of the World Superpipe Championships in 2008.\ �
� � Find an equation of the regression line for each, and graph them on the same coordinate plane. Compare and contrast the men¶s and women's graphs.
62/87,21���Use a calculator to find an equation of the regression line for each set of data.� Men: y = í2.92x + 95.92 Women: y = í7x+106 � Graph the equations on the same coordinate plane. �
� The women¶s scores are typically lower than the men¶s.
����5($621,1*� For a class project, the scores that 10 randomly selected students earned on the first 8 tests of the VFKRRO�\HDU�DUH�JLYHQ��([SODLQ�KRZ�WR�ILQG�D�OLQH�RI��EHVW�ILW���&RXOG�LW�EH�XVHG�WR�SUHGLFW�WKH�VFRUHV�RI�RWKHU�VWXGHQWV"Explain your reasoning.
62/87,21���Apply a linear regression model to the data. Use the number of each test as the independent variable and the score on each test as the dependent variable. If there is no correlation, the r value will not be close to 1 or í1. If this is the case, the line of fit could not be used to predict the scores of the other students.
����23(1�(1'('� For 10 different people, measure their heights and the lengths of their heads from chin to top. Use these data to generate a linear regression equation and a median-fit equation. Make a prediction using both of the equations.
62/87,21���Student should gather and record data and use a calculator to find the equation of linear regression and a median-fit equation. Students should make predictions based on both equations. � 6DPSOH�GDWD��
� Median-fit (Store in Y1)
y = 8.31x ± 3.12 � /LQHDU�UHJUHVVLRQ���6WRUH�LQ Y2)
y = 7.39x + 5.22 � Find the height of a student with chin to top of head measure of 8.1. Use the value option from the CALC menu. Use the up arrow to move from one line to another. �
�
� The median-fit line predicts a student¶s height of 64.17 inches and the linear regression line predicts a height of 65.07.
Chin to 7RS��RI�
Head Measure Height8.8 70.99.1 72.89.3 73.87.5 61.08.4 66.37.8 62.08.5 67.38.8 68.98.3 68.78.9 71.5
����WRITING IN MATH How are lines of fit and linear regression similar? different?
62/87,21���Sample answer: Both lines of fit and linear regression are used to model data. However, you could have numerous lines of fit, while linear regression results in one line of best fit. If linear regression is used, you can also use the correlation coefficient to see how closely the model fits the data. For example, the scatter plot below displays the points (1, 10), (2, 17), (3, 15), (4, 20), (5, 28), (6, 19), and (7, 25). �
$�OLQH�RI�ILW�FRXOG�EH�GUDZQ�WKURXJK���������DQG����������7KH�HTXDWLRQ�RI�WKLV�OLQH�RI�ILW�LV�� .
� Use a calculator to find the equation of the regression line for this data. �
� The only regression line for this data has an equation of about y = 2.2x����������
����*(20(75<� Sam is putting a border around a poster. x represents the poster¶s width, and y represents the poster¶s length. Which equation represents how much border Sam will use if he doubles the length and the width? � $� 4xy � %� (x + y)4 � &� 4(x + y) � '� 16(x + y)
62/87,21���The perimeter of the room is found by . y is the length and x is the width, so . But Sam wants to double the border, so the perimeter becomes: �
� So, the correct choice is C.
����6+257�5(63216(� Tatiana wants to run 5 miles at an average pace of 9 minutes per mile. After 4 miles, her average pace is 9 minutes 10 seconds. In how many minutes must she complete the final mile to reach her goal?
62/87,21���Tatiana ran each of the first 4 miles in 10 more seconds than she planned. So to reach her goal, she must run the lastmile in 40 seconds less than she planned. 9 min ± 40 s = 8 min and 20 s.
����What is the slope of the line that passes through (1, 3) and (í3, 1)?� )� í2 �
*��
�
+��
� -� 2
62/87,21���
� So, the correct choice is H.
����What is an equation of the line that passes through (0, 1) and has a slope of 3?� $� y = 3x í 1 � %� y = 3x í 2 � &� y = 3x + 4 � '� y = 3x + 1
62/87,21���Find the y-intercept. �
� The equation is y = 3x + 1. So, the correct choice is D.
����86('�&$56� Gianna wants to buy a specific make and model of a used car. She researched prices from dealers and private sellers and made the graph shown. �
� D�� Describe the relationship in the data. � E�� Use the line of fit to predict the price of a car that is 7 years old. � F�� Is it reasonable to use this line of fit to predict the price of a 10-year old car? Explain.
62/87,21���a. Because y decreases as x increases, there is a negative correlation in the data. � b. Find x = 7 on the graph and follow the line up to the line of fit. According to the graph, the price of a car that is 7 years old would be about $3600. � c. No, it would not be reasonable to use this line of fit to predict the price of a 10-year old car, because according to the line of fit, the cost would be $0 and that doesn¶t make sense.
����*(20(75<� A quadrilateral has sides with equations y = í2x, 2x + y = 6, , and x í 2y = 9. Is the figure a rectangle? Explain your reasoning.
62/87,21���Write all of the equations in slope-intercept form. � Equation 1: y = í2x � (TXDWLRQ���� �
� (TXDWLRQ����
������������������y = x + 6 � Equation 4:� �
� Find the slope of each line �
� The slope of opposite sides are equal (±2 and ±���DQG�����DQG�������VR�WKH\�DUH�SDUDOOHO��$OVR��WKH�VORSH�RI�consecutive sides are opposite reciprocals (±2 and 0.5; and ±2 and 0.5), so they are perpendicular. So, the figure is a rectangle.
y = í2x í2y = ±2x +6 í2
y = 0.5x + 6
y = 0.5x ± 4.5
Write each equation in standard form.����y í 2 = 3(x í 1)
62/87,21���
����y í 5 = 6(x + 1)
62/87,21���
����y + 2 = í2(x í 5)
62/87,21���
����
62/87,21���
����
62/87,21���
����
62/87,21���
Find the slope of the line that passes through each pair of points.����(3, 4), (10, 8)
62/87,21���
����(í4, 7), (3, 5)
62/87,21���
����(3, 7), (í2, 4)
62/87,21���
����(í3, 2), (í3, 4)
62/87,21���
The slope is undefined.
If f (x) = x2 í x + 1, find each value.����f (í1)
62/87,21���
����f (5) í3
62/87,21���
����f (a)
62/87,21���
����f (b2)
62/87,21���
Graph each equation.����y = x + 2
62/87,21���To graph the equation, plot the y-intercept (0, 2). Then move up 1 unit and right 1 unit. Plot the point. Draw a line through the two points.
����x + 5y = 4
62/87,21���Write the equation in slope-intercept form. �
To graph the equation, plot the y-LQWHUFHSW�� . Then move down 1 unit and right 5 units. Plot the point. Draw a
line through the two points. �
����2x í 3y = 6
62/87,21���Write the equation in slope-intercept form. �
� To graph the equation, plot the y-intercept (0, ±2). Then move up 2 units and right 3 units. Plot the point. Draw a line through the two points. �
����5x + 2y = 6
62/87,21���Write the equation in slope-intercept form. �
� To graph the equation, plot the y-intercept (0, 3). Then move down 5 units and right 2 units. Plot the point. Draw a line through the two points. �
Another line of fit may pass through (2, 15) and (7, 25). The equation of this line of fit is y = 2x + 11. More lines of fit that come close to the points could be drawn.
eSolutions Manual - Powered by Cognero Page 13
4-6 Regression and Median-Fit Lines

���3277(5<� $�ORFDO�XQLYHUVLW\�LV�NHHSLQJ�WUDFN�RI�WKH�QXPEHU�RI�DUW�VWXGHQWV�ZKR�XVH�WKH�SRWWHU\�VWXGLR�HDFK�GD\�� �
� a. Write an equation of the regression line and find the correlation coefficient. � b. Graph the residual plot and determine if the regression line models the data well.
62/87,21���D��Use a calculator to find the equation of the regression line. � Step 1: Enter the data by pressing STAT and selecting the EDIT option. . Enter the day into List 1 (L1). These willrepresent the x-values. Enter the number of students into List 2 (L2). These will represent the y-values. � Step 2: Perform the regression by pressing STAT �DQG�VHOHFWLQJ�WKH�CALC option. Scroll down to LinReg(ax+ b) and press ENTER. �
� Substitute the values in for a and b to write the equation of the regression line. So, the equation is y = 1.18x + 11. � Identify the value of r on the calculator to find the correlation coefficient. So, 0.7181 is the correlation coefficient. � b.�7XUQ�RQ�Plot2 under the STAT PLOT menu and choose scatter plot. Use L1 for the Xlist and RESID for the Ylist. You can obtain RESID by pressing 2nd STAT and selecting RESID from the list of names. Graph the scatter plot of the residuals by pressing ZOOM and choosing ZoomStat. �
� The residuals appear to be randomly scattered, so the regression line fits the data reasonably well. �
���&20387(56� The table below shows the percent of Americans with a broadband connection at home in a recentyear. Use linear extrapolation and a regression equation to estimate the percentage of 60-year-olds with broadband at home. �
62/87,21���Use a calculator to find the equation of the regression line.�
� y = ±0.34x + 49.48 � Substitute 60 into the equation. �
� So, about 29% of 60-year-olds have broadband at home.
���9$&$7,21� The Smiths want to rent a house on the lake that sleeps eight people. The cost of the house per night is based on how close it is to the water. �
� D�� Find and graph an equation for the median-fit line. � E�� What would you estimate is the cost of a rental 1.75 miles from the lake?
62/87,21���a. Use a calculator to find and graph the equation of the median fit line. �
y = í271.88x + 554.48
� b. To estimate the cost of a rental 1.75 miles from the lake, evaluate the equation of the median-fit line for x = 1.75.�
� An estimate of the cost of a rental 1.75 miles from the lake is $78.69.
Write an equation of the regression line for the data in each table. Then find the correlation coefficient.���6.<6&5$3(56� The table ranks the ten tallest buildings in the world. �
62/87,21���Use a calculator to find the equation of the regression line.�
� y = í2.75x + 102.53 � Use a calculator to find the correlation coefficient. � í0.6071
���086,&� 7KH�WDEOH�JLYHV�WKH�QXPEHU�RI�DQQXDO�YLROLQ�DXGLWLRQV�KHOG�E\�D�\RXWK�V\PSKRQ\�HDFK�\HDU�VLQFH��������/HW�x be the number of years since 2004. �
�
62/87,21���Use a calculator to find the equation of the regression line.�
� y = 3.54x + 19.68 � Use a calculator to find the correlation coefficient. � 0.9007
���5(7$,/� 7KH�WDEOH�JLYHV�WKH�VDOHV�RI�MHDQV�DW�D�FORWKLQJ�FKDLQ�VLQFH��������/HW�x be the number of years since ������ �
� a. Write an equation of the regression line. � b. Graph and analyze the residual plot.
62/87,21���a. Use a calculator to find the equation of the regression line. �
� The equation is about��\ = 3.32x + 5.20. � E��Use a calculator to graph the residual plot for the data. �
� The residuals appear to be randomly scattered. Therefore, the regression line fits the data well.
���0$5$7+21� 7KH�QXPEHU�RI�HQWUDQWV�LQ�WKH�%RVWRQ�0DUDWKRQ�HYHU\�ILYH�\HDUV�VLQFH������LV�VKRZQ���/HW�x be thenumber of years since 1975. �
� � D�� Find an equation for the median-fit line. � E�� According to the equation, how many entrants were there in 2003?
62/87,21���a. Let x = 0 for 1975. Use a calculator to find the equation of the median fit line. �
� y = 601.44x + 1236.13 � b. To estimate the number of entrants in 2003, evaluate the equation for the median-fit line for x = 2003 ± 1975 = 28.�
� There were about 18,076 entrants in 2003.
���&$03,1*� A campground kept a record of the number of campsites rented over the week of July 4 for several \HDUV���/HW�x be the number of years since 2000. �
� D�� Find an equation for the regression line. � E�� Predict the number of campsites that will be rented in 2012. � F�� Predict the number of campsites that will be rented in 2020.
62/87,21���a. Use a calculator to find an equation for the regression line. �
� y = 3.07x + 32.71 � b. To predict the number of campsites that will be rented in 2012, evaluate the regression equation for x = 12�
� There will be about 70 campsites rented in 2012. � c. To predict the number of campsites that will be rented in 2020, evaluate the regression equation for x = 20.�
� There will be about 94 campsites rented in 2020.
���,&(�&5($0� An ice cream company keeps a count of the tubs of cookie dough ice cream delivered to each of their stores in a particular area. ��
� D�� Find an equation for the median-fit line. � E�� Graph the points and the median-fit line. � F�� How many tubs would be delivered to a 1500-square-foot store? a 5000-square-foot store?
62/87,21���a. Use a calculator to find an equation for the median-fit line. �
� y = 0.095x í 94.58 � b. Plot the points and the equation. �
� c. To estimate the number of tubs to be delivered to a 1500-square-foot store, evaluate the regression equation for x = 1500. �
� There are about 48 tubs delivered to a 1500-square-foot store. To estimate the number of tubs to be delivered to a 5000-square-foot store, evaluate the regression equation for x = 5000. �
� There are about 380 tubs delivered to a 5000-square-foot store.
����CCSS SENSE-0$.,1*� The prices of the eight top-selling brands of jeans at Jeanie¶s Jeans are given in the table below. �
� D�� Find the equation for the regression line. � E�� According to the equation, what would be the price of a pair of the 12th best-selling brand? � F�� Is this a reasonable prediction? Explain.
62/87,21���a. Use a calculator to find an equation for the regression line. �
Step 1: Enter the data by pressing and selecting the EDIT option. Enter the sales rank into List 1 (L1). These will represent the x-values. Enter the price into List 2 (L2). These will represent the y-values. �
Step 2: Perform the regression by pressing �DQG�VHOHFWLQJ�WKH�CALC option. Scroll down to LinReg(ax+
b) and press . �
� y = 9.8x + 28.79 � b. To predict the price of a pair of the 12th bestselling brands of jeans, evaluate the regression equation for x = 12. �
� The price of a pair of the 12th bestselling brands of jeans would be about $146.39. � F�� Sample answer: No; the correlation between sales rank and price is too weak to make any reasonable prediction. The 12th bestselling brand of jeans could just as easily be a poorly made pair of jeans selling for $15.
����67$7(�)$,56� The table shows the total attendance, in millions of people, at the Minnesota State Fair from 2005 to 2009. �
� D��Graph a scatter plot of the data, where x = 1 represents 2005. Then find and graph the equation for the best-fit line. � b. Graph and analyze the residual plot. � c.��3UHGLFW�WKH�WRWDO�DWWHQGDQFH�LQ������ �
62/87,21���a. Enter the data from the table into the lists. Let x be the years starting with x = 1 for 2005 and let y = the attendence (in millions). Then graph the scatter plot. �
�
[0, 6] scl: 1 by [0, 3] scl: 0.5 � Perform the linear regression using the data in the lists. Find the equation of the best-fit line. �
� The equation is about y = 0.0326x + 1.598. � Use Y= to enter the equation into the calculator and graph the best-fit line with the scatter plot. �
[0, 6] scl: 1 by [0, 3] scl: 0.5 � b. Use the calculator to graph the residual plot for the data. �
� All the residuals appear to almost be on the line. Therefore, the regression line is a good fit for the data. � F���0HWKRG����To find the number of people in 2020, substitute 16 for x��
� Method 2: Copy the equation to the Y= list and graph. Use the value option to find the value of y when x = 16. �
[0, 17] scl: 1 by [0, 3] scl: 0.5 � 6R��WKHUH�ZLOO�EH�DERXW������PLOOLRQ�SHRSOH�LQ�������
����),5(),*+7(56� 7KH�WDEOH�VKRZV�VWDWLVWLFV�IURP�WKH�8�6��)LUH�$GPLQLVWUDWLRQ�� �
� D�� Find an equation for the median-fit line. � E�� Graph the points and the median-fit line. � F�� Does the median-fit line give you an accurate picture of the number of firefighters? Explain.
62/87,21���a. Use a calculator to find an equation for the median-fit line. �
Step 1: Enter the data by pressing and selecting the EDIT option. Enter age into List 1 (L1). These will represent the x-values. Enter the number of firefighters into List 2 (L2). These will represent the y-values. �
Step 2: Perform the regression by pressing and selecting the CALC option. Scroll down to Med-Med
and press �� �
� y = í841.42x + 223288 � b. Plot the points and graph the median fit line. �
� c. No, the median-fit line does not give an accurate picture of the number of firefighters. The points show no linear correlation; therefore a line cannot accurately portray the data.
����$7+/(7,&6� The table shows the total number of teens who participated in high school athletics in various years. �
� � D�� Find an equation for the regression line. � E�� According to the equation, how many participated in 1988?
62/87,21���a. Use a calculator to find an equation for the regression line. �
Step 1: Enter the data by pressing and selecting the EDIT option. Let the year 1970 be represented by 0. Enter the years since 1970 into List 1 (L1). These will represent the x-values. Enter the number of athletes into List 2 (L2). These will represent the y-values. �
Step 2: Perform the regression by pressing and selecting the CALC option. Scroll down to LinReg(ax+
b) and press . �
� y = 87,390.5x + 4,018,431 � b. To estimate the number of participants in 1988, evaluate the regression equation for x = 18 because 1988 is 18 years after 1970. �
� There were about 5,591,460 participants in 1988.
����$57� $�FRXQW�ZDV�NHSW�RQ�WKH�QXPEHU�RI�SDLQWLQJV�WKDW�VROG�DW�DQ�DXFWLRQ�E\�WKH�\HDU�LQ�ZKLFK�WKH\�ZHUH�SDLQWHG���Let x be the number of years since 1950. �
� D�� Find the equation for the linear regression line. � E�� How many paintings were sold that were painted in 1961? � F�� Is the linear regression equation an accurate model of the data? Explain why or why not.
62/87,21���a. 8VH�D�FDOFXODWRU�WR�ILQG�DQ�HTXDWLRQ�IRU�WKH�UHJUHVVLRQ�OLQH�� �
Step 1: Enter the data by pressing and selecting the EDIT option. Let x =0 for the year 1950.. Enter the years since 1950 into List 1 (L1). These will represent the x-values. Enter the number of painting sold into List 2 (L2). These will represent the y-values. �
Step 2: Perform the regression by pressing �DQG�VHOHFWLQJ�WKH�CALC option. Scroll down to LinReg(ax+
b) and press . � �
� y = 0.446x +9.43 � b. 7R�HVWLPDWH�WKH�QXPEHU�RI�SDLQWLQJV�VROG�LQ�������HYDOXDWH�WKH�UHJUHVVLRQ�HTXDWLRQ�IRU������ZKHQ��x =11. �
� There were about 14 paintings sold in 1961. � F�� No, the correlation coefficient is 0.48, so the linear model is not a good fit for the data. It does not appear from the data that there is a relationship between the number of paintings sold and the year they were painted.
����&&66�$5*80(176� Below are the results of the World Superpipe Championships in 2008.\ �
� � Find an equation of the regression line for each, and graph them on the same coordinate plane. Compare and contrast the men¶s and women's graphs.
62/87,21���Use a calculator to find an equation of the regression line for each set of data.� Men: y = í2.92x + 95.92 Women: y = í7x+106 � Graph the equations on the same coordinate plane. �
� The women¶s scores are typically lower than the men¶s.
����5($621,1*� For a class project, the scores that 10 randomly selected students earned on the first 8 tests of the VFKRRO�\HDU�DUH�JLYHQ��([SODLQ�KRZ�WR�ILQG�D�OLQH�RI��EHVW�ILW���&RXOG�LW�EH�XVHG�WR�SUHGLFW�WKH�VFRUHV�RI�RWKHU�VWXGHQWV"Explain your reasoning.
62/87,21���Apply a linear regression model to the data. Use the number of each test as the independent variable and the score on each test as the dependent variable. If there is no correlation, the r value will not be close to 1 or í1. If this is the case, the line of fit could not be used to predict the scores of the other students.
����23(1�(1'('� For 10 different people, measure their heights and the lengths of their heads from chin to top. Use these data to generate a linear regression equation and a median-fit equation. Make a prediction using both of the equations.
62/87,21���Student should gather and record data and use a calculator to find the equation of linear regression and a median-fit equation. Students should make predictions based on both equations. � 6DPSOH�GDWD��
� Median-fit (Store in Y1)
y = 8.31x ± 3.12 � /LQHDU�UHJUHVVLRQ���6WRUH�LQ Y2)
y = 7.39x + 5.22 � Find the height of a student with chin to top of head measure of 8.1. Use the value option from the CALC menu. Use the up arrow to move from one line to another. �
�
� The median-fit line predicts a student¶s height of 64.17 inches and the linear regression line predicts a height of 65.07.
Chin to 7RS��RI�
Head Measure Height8.8 70.99.1 72.89.3 73.87.5 61.08.4 66.37.8 62.08.5 67.38.8 68.98.3 68.78.9 71.5
����WRITING IN MATH How are lines of fit and linear regression similar? different?
62/87,21���Sample answer: Both lines of fit and linear regression are used to model data. However, you could have numerous lines of fit, while linear regression results in one line of best fit. If linear regression is used, you can also use the correlation coefficient to see how closely the model fits the data. For example, the scatter plot below displays the points (1, 10), (2, 17), (3, 15), (4, 20), (5, 28), (6, 19), and (7, 25). �
$�OLQH�RI�ILW�FRXOG�EH�GUDZQ�WKURXJK���������DQG����������7KH�HTXDWLRQ�RI�WKLV�OLQH�RI�ILW�LV�� .
� Use a calculator to find the equation of the regression line for this data. �
� The only regression line for this data has an equation of about y = 2.2x����������
����*(20(75<� Sam is putting a border around a poster. x represents the poster¶s width, and y represents the poster¶s length. Which equation represents how much border Sam will use if he doubles the length and the width? � $� 4xy � %� (x + y)4 � &� 4(x + y) � '� 16(x + y)
62/87,21���The perimeter of the room is found by . y is the length and x is the width, so . But Sam wants to double the border, so the perimeter becomes: �
� So, the correct choice is C.
����6+257�5(63216(� Tatiana wants to run 5 miles at an average pace of 9 minutes per mile. After 4 miles, her average pace is 9 minutes 10 seconds. In how many minutes must she complete the final mile to reach her goal?
62/87,21���Tatiana ran each of the first 4 miles in 10 more seconds than she planned. So to reach her goal, she must run the lastmile in 40 seconds less than she planned. 9 min ± 40 s = 8 min and 20 s.
����What is the slope of the line that passes through (1, 3) and (í3, 1)?� )� í2 �
*��
�
+��
� -� 2
62/87,21���
� So, the correct choice is H.
����What is an equation of the line that passes through (0, 1) and has a slope of 3?� $� y = 3x í 1 � %� y = 3x í 2 � &� y = 3x + 4 � '� y = 3x + 1
62/87,21���Find the y-intercept. �
� The equation is y = 3x + 1. So, the correct choice is D.
����86('�&$56� Gianna wants to buy a specific make and model of a used car. She researched prices from dealers and private sellers and made the graph shown. �
� D�� Describe the relationship in the data. � E�� Use the line of fit to predict the price of a car that is 7 years old. � F�� Is it reasonable to use this line of fit to predict the price of a 10-year old car? Explain.
62/87,21���a. Because y decreases as x increases, there is a negative correlation in the data. � b. Find x = 7 on the graph and follow the line up to the line of fit. According to the graph, the price of a car that is 7 years old would be about $3600. � c. No, it would not be reasonable to use this line of fit to predict the price of a 10-year old car, because according to the line of fit, the cost would be $0 and that doesn¶t make sense.
����*(20(75<� A quadrilateral has sides with equations y = í2x, 2x + y = 6, , and x í 2y = 9. Is the figure a rectangle? Explain your reasoning.
62/87,21���Write all of the equations in slope-intercept form. � Equation 1: y = í2x � (TXDWLRQ���� �
� (TXDWLRQ����
������������������y = x + 6 � Equation 4:� �
� Find the slope of each line �
� The slope of opposite sides are equal (±2 and ±���DQG�����DQG�������VR�WKH\�DUH�SDUDOOHO��$OVR��WKH�VORSH�RI�consecutive sides are opposite reciprocals (±2 and 0.5; and ±2 and 0.5), so they are perpendicular. So, the figure is a rectangle.
y = í2x í2y = ±2x +6 í2
y = 0.5x + 6
y = 0.5x ± 4.5
Write each equation in standard form.����y í 2 = 3(x í 1)
62/87,21���
����y í 5 = 6(x + 1)
62/87,21���
����y + 2 = í2(x í 5)
62/87,21���
����
62/87,21���
����
62/87,21���
����
62/87,21���
Find the slope of the line that passes through each pair of points.����(3, 4), (10, 8)
62/87,21���
����(í4, 7), (3, 5)
62/87,21���
����(3, 7), (í2, 4)
62/87,21���
����(í3, 2), (í3, 4)
62/87,21���
The slope is undefined.
If f (x) = x2 í x + 1, find each value.����f (í1)
62/87,21���
����f (5) í3
62/87,21���
����f (a)
62/87,21���
����f (b2)
62/87,21���
Graph each equation.����y = x + 2
62/87,21���To graph the equation, plot the y-intercept (0, 2). Then move up 1 unit and right 1 unit. Plot the point. Draw a line through the two points.
����x + 5y = 4
62/87,21���Write the equation in slope-intercept form. �
To graph the equation, plot the y-LQWHUFHSW�� . Then move down 1 unit and right 5 units. Plot the point. Draw a
line through the two points. �
����2x í 3y = 6
62/87,21���Write the equation in slope-intercept form. �
� To graph the equation, plot the y-intercept (0, ±2). Then move up 2 units and right 3 units. Plot the point. Draw a line through the two points. �
����5x + 2y = 6
62/87,21���Write the equation in slope-intercept form. �
� To graph the equation, plot the y-intercept (0, 3). Then move down 5 units and right 2 units. Plot the point. Draw a line through the two points. �
Another line of fit may pass through (2, 15) and (7, 25). The equation of this line of fit is y = 2x + 11. More lines of fit that come close to the points could be drawn.
eSolutions Manual - Powered by Cognero Page 14
4-6 Regression and Median-Fit Lines

���3277(5<� $�ORFDO�XQLYHUVLW\�LV�NHHSLQJ�WUDFN�RI�WKH�QXPEHU�RI�DUW�VWXGHQWV�ZKR�XVH�WKH�SRWWHU\�VWXGLR�HDFK�GD\�� �
� a. Write an equation of the regression line and find the correlation coefficient. � b. Graph the residual plot and determine if the regression line models the data well.
62/87,21���D��Use a calculator to find the equation of the regression line. � Step 1: Enter the data by pressing STAT and selecting the EDIT option. . Enter the day into List 1 (L1). These willrepresent the x-values. Enter the number of students into List 2 (L2). These will represent the y-values. � Step 2: Perform the regression by pressing STAT �DQG�VHOHFWLQJ�WKH�CALC option. Scroll down to LinReg(ax+ b) and press ENTER. �
� Substitute the values in for a and b to write the equation of the regression line. So, the equation is y = 1.18x + 11. � Identify the value of r on the calculator to find the correlation coefficient. So, 0.7181 is the correlation coefficient. � b.�7XUQ�RQ�Plot2 under the STAT PLOT menu and choose scatter plot. Use L1 for the Xlist and RESID for the Ylist. You can obtain RESID by pressing 2nd STAT and selecting RESID from the list of names. Graph the scatter plot of the residuals by pressing ZOOM and choosing ZoomStat. �
� The residuals appear to be randomly scattered, so the regression line fits the data reasonably well. �
���&20387(56� The table below shows the percent of Americans with a broadband connection at home in a recentyear. Use linear extrapolation and a regression equation to estimate the percentage of 60-year-olds with broadband at home. �
62/87,21���Use a calculator to find the equation of the regression line.�
� y = ±0.34x + 49.48 � Substitute 60 into the equation. �
� So, about 29% of 60-year-olds have broadband at home.
���9$&$7,21� The Smiths want to rent a house on the lake that sleeps eight people. The cost of the house per night is based on how close it is to the water. �
� D�� Find and graph an equation for the median-fit line. � E�� What would you estimate is the cost of a rental 1.75 miles from the lake?
62/87,21���a. Use a calculator to find and graph the equation of the median fit line. �
y = í271.88x + 554.48
� b. To estimate the cost of a rental 1.75 miles from the lake, evaluate the equation of the median-fit line for x = 1.75.�
� An estimate of the cost of a rental 1.75 miles from the lake is $78.69.
Write an equation of the regression line for the data in each table. Then find the correlation coefficient.���6.<6&5$3(56� The table ranks the ten tallest buildings in the world. �
62/87,21���Use a calculator to find the equation of the regression line.�
� y = í2.75x + 102.53 � Use a calculator to find the correlation coefficient. � í0.6071
���086,&� 7KH�WDEOH�JLYHV�WKH�QXPEHU�RI�DQQXDO�YLROLQ�DXGLWLRQV�KHOG�E\�D�\RXWK�V\PSKRQ\�HDFK�\HDU�VLQFH��������/HW�x be the number of years since 2004. �
�
62/87,21���Use a calculator to find the equation of the regression line.�
� y = 3.54x + 19.68 � Use a calculator to find the correlation coefficient. � 0.9007
���5(7$,/� 7KH�WDEOH�JLYHV�WKH�VDOHV�RI�MHDQV�DW�D�FORWKLQJ�FKDLQ�VLQFH��������/HW�x be the number of years since ������ �
� a. Write an equation of the regression line. � b. Graph and analyze the residual plot.
62/87,21���a. Use a calculator to find the equation of the regression line. �
� The equation is about��\ = 3.32x + 5.20. � E��Use a calculator to graph the residual plot for the data. �
� The residuals appear to be randomly scattered. Therefore, the regression line fits the data well.
���0$5$7+21� 7KH�QXPEHU�RI�HQWUDQWV�LQ�WKH�%RVWRQ�0DUDWKRQ�HYHU\�ILYH�\HDUV�VLQFH������LV�VKRZQ���/HW�x be thenumber of years since 1975. �
� � D�� Find an equation for the median-fit line. � E�� According to the equation, how many entrants were there in 2003?
62/87,21���a. Let x = 0 for 1975. Use a calculator to find the equation of the median fit line. �
� y = 601.44x + 1236.13 � b. To estimate the number of entrants in 2003, evaluate the equation for the median-fit line for x = 2003 ± 1975 = 28.�
� There were about 18,076 entrants in 2003.
���&$03,1*� A campground kept a record of the number of campsites rented over the week of July 4 for several \HDUV���/HW�x be the number of years since 2000. �
� D�� Find an equation for the regression line. � E�� Predict the number of campsites that will be rented in 2012. � F�� Predict the number of campsites that will be rented in 2020.
62/87,21���a. Use a calculator to find an equation for the regression line. �
� y = 3.07x + 32.71 � b. To predict the number of campsites that will be rented in 2012, evaluate the regression equation for x = 12�
� There will be about 70 campsites rented in 2012. � c. To predict the number of campsites that will be rented in 2020, evaluate the regression equation for x = 20.�
� There will be about 94 campsites rented in 2020.
���,&(�&5($0� An ice cream company keeps a count of the tubs of cookie dough ice cream delivered to each of their stores in a particular area. ��
� D�� Find an equation for the median-fit line. � E�� Graph the points and the median-fit line. � F�� How many tubs would be delivered to a 1500-square-foot store? a 5000-square-foot store?
62/87,21���a. Use a calculator to find an equation for the median-fit line. �
� y = 0.095x í 94.58 � b. Plot the points and the equation. �
� c. To estimate the number of tubs to be delivered to a 1500-square-foot store, evaluate the regression equation for x = 1500. �
� There are about 48 tubs delivered to a 1500-square-foot store. To estimate the number of tubs to be delivered to a 5000-square-foot store, evaluate the regression equation for x = 5000. �
� There are about 380 tubs delivered to a 5000-square-foot store.
����CCSS SENSE-0$.,1*� The prices of the eight top-selling brands of jeans at Jeanie¶s Jeans are given in the table below. �
� D�� Find the equation for the regression line. � E�� According to the equation, what would be the price of a pair of the 12th best-selling brand? � F�� Is this a reasonable prediction? Explain.
62/87,21���a. Use a calculator to find an equation for the regression line. �
Step 1: Enter the data by pressing and selecting the EDIT option. Enter the sales rank into List 1 (L1). These will represent the x-values. Enter the price into List 2 (L2). These will represent the y-values. �
Step 2: Perform the regression by pressing �DQG�VHOHFWLQJ�WKH�CALC option. Scroll down to LinReg(ax+
b) and press . �
� y = 9.8x + 28.79 � b. To predict the price of a pair of the 12th bestselling brands of jeans, evaluate the regression equation for x = 12. �
� The price of a pair of the 12th bestselling brands of jeans would be about $146.39. � F�� Sample answer: No; the correlation between sales rank and price is too weak to make any reasonable prediction. The 12th bestselling brand of jeans could just as easily be a poorly made pair of jeans selling for $15.
����67$7(�)$,56� The table shows the total attendance, in millions of people, at the Minnesota State Fair from 2005 to 2009. �
� D��Graph a scatter plot of the data, where x = 1 represents 2005. Then find and graph the equation for the best-fit line. � b. Graph and analyze the residual plot. � c.��3UHGLFW�WKH�WRWDO�DWWHQGDQFH�LQ������ �
62/87,21���a. Enter the data from the table into the lists. Let x be the years starting with x = 1 for 2005 and let y = the attendence (in millions). Then graph the scatter plot. �
�
[0, 6] scl: 1 by [0, 3] scl: 0.5 � Perform the linear regression using the data in the lists. Find the equation of the best-fit line. �
� The equation is about y = 0.0326x + 1.598. � Use Y= to enter the equation into the calculator and graph the best-fit line with the scatter plot. �
[0, 6] scl: 1 by [0, 3] scl: 0.5 � b. Use the calculator to graph the residual plot for the data. �
� All the residuals appear to almost be on the line. Therefore, the regression line is a good fit for the data. � F���0HWKRG����To find the number of people in 2020, substitute 16 for x��
� Method 2: Copy the equation to the Y= list and graph. Use the value option to find the value of y when x = 16. �
[0, 17] scl: 1 by [0, 3] scl: 0.5 � 6R��WKHUH�ZLOO�EH�DERXW������PLOOLRQ�SHRSOH�LQ�������
����),5(),*+7(56� 7KH�WDEOH�VKRZV�VWDWLVWLFV�IURP�WKH�8�6��)LUH�$GPLQLVWUDWLRQ�� �
� D�� Find an equation for the median-fit line. � E�� Graph the points and the median-fit line. � F�� Does the median-fit line give you an accurate picture of the number of firefighters? Explain.
62/87,21���a. Use a calculator to find an equation for the median-fit line. �
Step 1: Enter the data by pressing and selecting the EDIT option. Enter age into List 1 (L1). These will represent the x-values. Enter the number of firefighters into List 2 (L2). These will represent the y-values. �
Step 2: Perform the regression by pressing and selecting the CALC option. Scroll down to Med-Med
and press �� �
� y = í841.42x + 223288 � b. Plot the points and graph the median fit line. �
� c. No, the median-fit line does not give an accurate picture of the number of firefighters. The points show no linear correlation; therefore a line cannot accurately portray the data.
����$7+/(7,&6� The table shows the total number of teens who participated in high school athletics in various years. �
� � D�� Find an equation for the regression line. � E�� According to the equation, how many participated in 1988?
62/87,21���a. Use a calculator to find an equation for the regression line. �
Step 1: Enter the data by pressing and selecting the EDIT option. Let the year 1970 be represented by 0. Enter the years since 1970 into List 1 (L1). These will represent the x-values. Enter the number of athletes into List 2 (L2). These will represent the y-values. �
Step 2: Perform the regression by pressing and selecting the CALC option. Scroll down to LinReg(ax+
b) and press . �
� y = 87,390.5x + 4,018,431 � b. To estimate the number of participants in 1988, evaluate the regression equation for x = 18 because 1988 is 18 years after 1970. �
� There were about 5,591,460 participants in 1988.
����$57� $�FRXQW�ZDV�NHSW�RQ�WKH�QXPEHU�RI�SDLQWLQJV�WKDW�VROG�DW�DQ�DXFWLRQ�E\�WKH�\HDU�LQ�ZKLFK�WKH\�ZHUH�SDLQWHG���Let x be the number of years since 1950. �
� D�� Find the equation for the linear regression line. � E�� How many paintings were sold that were painted in 1961? � F�� Is the linear regression equation an accurate model of the data? Explain why or why not.
62/87,21���a. 8VH�D�FDOFXODWRU�WR�ILQG�DQ�HTXDWLRQ�IRU�WKH�UHJUHVVLRQ�OLQH�� �
Step 1: Enter the data by pressing and selecting the EDIT option. Let x =0 for the year 1950.. Enter the years since 1950 into List 1 (L1). These will represent the x-values. Enter the number of painting sold into List 2 (L2). These will represent the y-values. �
Step 2: Perform the regression by pressing �DQG�VHOHFWLQJ�WKH�CALC option. Scroll down to LinReg(ax+
b) and press . � �
� y = 0.446x +9.43 � b. 7R�HVWLPDWH�WKH�QXPEHU�RI�SDLQWLQJV�VROG�LQ�������HYDOXDWH�WKH�UHJUHVVLRQ�HTXDWLRQ�IRU������ZKHQ��x =11. �
� There were about 14 paintings sold in 1961. � F�� No, the correlation coefficient is 0.48, so the linear model is not a good fit for the data. It does not appear from the data that there is a relationship between the number of paintings sold and the year they were painted.
����&&66�$5*80(176� Below are the results of the World Superpipe Championships in 2008.\ �
� � Find an equation of the regression line for each, and graph them on the same coordinate plane. Compare and contrast the men¶s and women's graphs.
62/87,21���Use a calculator to find an equation of the regression line for each set of data.� Men: y = í2.92x + 95.92 Women: y = í7x+106 � Graph the equations on the same coordinate plane. �
� The women¶s scores are typically lower than the men¶s.
����5($621,1*� For a class project, the scores that 10 randomly selected students earned on the first 8 tests of the VFKRRO�\HDU�DUH�JLYHQ��([SODLQ�KRZ�WR�ILQG�D�OLQH�RI��EHVW�ILW���&RXOG�LW�EH�XVHG�WR�SUHGLFW�WKH�VFRUHV�RI�RWKHU�VWXGHQWV"Explain your reasoning.
62/87,21���Apply a linear regression model to the data. Use the number of each test as the independent variable and the score on each test as the dependent variable. If there is no correlation, the r value will not be close to 1 or í1. If this is the case, the line of fit could not be used to predict the scores of the other students.
����23(1�(1'('� For 10 different people, measure their heights and the lengths of their heads from chin to top. Use these data to generate a linear regression equation and a median-fit equation. Make a prediction using both of the equations.
62/87,21���Student should gather and record data and use a calculator to find the equation of linear regression and a median-fit equation. Students should make predictions based on both equations. � 6DPSOH�GDWD��
� Median-fit (Store in Y1)
y = 8.31x ± 3.12 � /LQHDU�UHJUHVVLRQ���6WRUH�LQ Y2)
y = 7.39x + 5.22 � Find the height of a student with chin to top of head measure of 8.1. Use the value option from the CALC menu. Use the up arrow to move from one line to another. �
�
� The median-fit line predicts a student¶s height of 64.17 inches and the linear regression line predicts a height of 65.07.
Chin to 7RS��RI�
Head Measure Height8.8 70.99.1 72.89.3 73.87.5 61.08.4 66.37.8 62.08.5 67.38.8 68.98.3 68.78.9 71.5
����WRITING IN MATH How are lines of fit and linear regression similar? different?
62/87,21���Sample answer: Both lines of fit and linear regression are used to model data. However, you could have numerous lines of fit, while linear regression results in one line of best fit. If linear regression is used, you can also use the correlation coefficient to see how closely the model fits the data. For example, the scatter plot below displays the points (1, 10), (2, 17), (3, 15), (4, 20), (5, 28), (6, 19), and (7, 25). �
$�OLQH�RI�ILW�FRXOG�EH�GUDZQ�WKURXJK���������DQG����������7KH�HTXDWLRQ�RI�WKLV�OLQH�RI�ILW�LV�� .
� Use a calculator to find the equation of the regression line for this data. �
� The only regression line for this data has an equation of about y = 2.2x����������
����*(20(75<� Sam is putting a border around a poster. x represents the poster¶s width, and y represents the poster¶s length. Which equation represents how much border Sam will use if he doubles the length and the width? � $� 4xy � %� (x + y)4 � &� 4(x + y) � '� 16(x + y)
62/87,21���The perimeter of the room is found by . y is the length and x is the width, so . But Sam wants to double the border, so the perimeter becomes: �
� So, the correct choice is C.
����6+257�5(63216(� Tatiana wants to run 5 miles at an average pace of 9 minutes per mile. After 4 miles, her average pace is 9 minutes 10 seconds. In how many minutes must she complete the final mile to reach her goal?
62/87,21���Tatiana ran each of the first 4 miles in 10 more seconds than she planned. So to reach her goal, she must run the lastmile in 40 seconds less than she planned. 9 min ± 40 s = 8 min and 20 s.
����What is the slope of the line that passes through (1, 3) and (í3, 1)?� )� í2 �
*��
�
+��
� -� 2
62/87,21���
� So, the correct choice is H.
����What is an equation of the line that passes through (0, 1) and has a slope of 3?� $� y = 3x í 1 � %� y = 3x í 2 � &� y = 3x + 4 � '� y = 3x + 1
62/87,21���Find the y-intercept. �
� The equation is y = 3x + 1. So, the correct choice is D.
����86('�&$56� Gianna wants to buy a specific make and model of a used car. She researched prices from dealers and private sellers and made the graph shown. �
� D�� Describe the relationship in the data. � E�� Use the line of fit to predict the price of a car that is 7 years old. � F�� Is it reasonable to use this line of fit to predict the price of a 10-year old car? Explain.
62/87,21���a. Because y decreases as x increases, there is a negative correlation in the data. � b. Find x = 7 on the graph and follow the line up to the line of fit. According to the graph, the price of a car that is 7 years old would be about $3600. � c. No, it would not be reasonable to use this line of fit to predict the price of a 10-year old car, because according to the line of fit, the cost would be $0 and that doesn¶t make sense.
����*(20(75<� A quadrilateral has sides with equations y = í2x, 2x + y = 6, , and x í 2y = 9. Is the figure a rectangle? Explain your reasoning.
62/87,21���Write all of the equations in slope-intercept form. � Equation 1: y = í2x � (TXDWLRQ���� �
� (TXDWLRQ����
������������������y = x + 6 � Equation 4:� �
� Find the slope of each line �
� The slope of opposite sides are equal (±2 and ±���DQG�����DQG�������VR�WKH\�DUH�SDUDOOHO��$OVR��WKH�VORSH�RI�consecutive sides are opposite reciprocals (±2 and 0.5; and ±2 and 0.5), so they are perpendicular. So, the figure is a rectangle.
y = í2x í2y = ±2x +6 í2
y = 0.5x + 6
y = 0.5x ± 4.5
Write each equation in standard form.����y í 2 = 3(x í 1)
62/87,21���
����y í 5 = 6(x + 1)
62/87,21���
����y + 2 = í2(x í 5)
62/87,21���
����
62/87,21���
����
62/87,21���
����
62/87,21���
Find the slope of the line that passes through each pair of points.����(3, 4), (10, 8)
62/87,21���
����(í4, 7), (3, 5)
62/87,21���
����(3, 7), (í2, 4)
62/87,21���
����(í3, 2), (í3, 4)
62/87,21���
The slope is undefined.
If f (x) = x2 í x + 1, find each value.����f (í1)
62/87,21���
����f (5) í3
62/87,21���
����f (a)
62/87,21���
����f (b2)
62/87,21���
Graph each equation.����y = x + 2
62/87,21���To graph the equation, plot the y-intercept (0, 2). Then move up 1 unit and right 1 unit. Plot the point. Draw a line through the two points.
����x + 5y = 4
62/87,21���Write the equation in slope-intercept form. �
To graph the equation, plot the y-LQWHUFHSW�� . Then move down 1 unit and right 5 units. Plot the point. Draw a
line through the two points. �
����2x í 3y = 6
62/87,21���Write the equation in slope-intercept form. �
� To graph the equation, plot the y-intercept (0, ±2). Then move up 2 units and right 3 units. Plot the point. Draw a line through the two points. �
����5x + 2y = 6
62/87,21���Write the equation in slope-intercept form. �
� To graph the equation, plot the y-intercept (0, 3). Then move down 5 units and right 2 units. Plot the point. Draw a line through the two points. �
Another line of fit may pass through (2, 15) and (7, 25). The equation of this line of fit is y = 2x + 11. More lines of fit that come close to the points could be drawn.
eSolutions Manual - Powered by Cognero Page 15
4-6 Regression and Median-Fit Lines

���3277(5<� $�ORFDO�XQLYHUVLW\�LV�NHHSLQJ�WUDFN�RI�WKH�QXPEHU�RI�DUW�VWXGHQWV�ZKR�XVH�WKH�SRWWHU\�VWXGLR�HDFK�GD\�� �
� a. Write an equation of the regression line and find the correlation coefficient. � b. Graph the residual plot and determine if the regression line models the data well.
62/87,21���D��Use a calculator to find the equation of the regression line. � Step 1: Enter the data by pressing STAT and selecting the EDIT option. . Enter the day into List 1 (L1). These willrepresent the x-values. Enter the number of students into List 2 (L2). These will represent the y-values. � Step 2: Perform the regression by pressing STAT �DQG�VHOHFWLQJ�WKH�CALC option. Scroll down to LinReg(ax+ b) and press ENTER. �
� Substitute the values in for a and b to write the equation of the regression line. So, the equation is y = 1.18x + 11. � Identify the value of r on the calculator to find the correlation coefficient. So, 0.7181 is the correlation coefficient. � b.�7XUQ�RQ�Plot2 under the STAT PLOT menu and choose scatter plot. Use L1 for the Xlist and RESID for the Ylist. You can obtain RESID by pressing 2nd STAT and selecting RESID from the list of names. Graph the scatter plot of the residuals by pressing ZOOM and choosing ZoomStat. �
� The residuals appear to be randomly scattered, so the regression line fits the data reasonably well. �
���&20387(56� The table below shows the percent of Americans with a broadband connection at home in a recentyear. Use linear extrapolation and a regression equation to estimate the percentage of 60-year-olds with broadband at home. �
62/87,21���Use a calculator to find the equation of the regression line.�
� y = ±0.34x + 49.48 � Substitute 60 into the equation. �
� So, about 29% of 60-year-olds have broadband at home.
���9$&$7,21� The Smiths want to rent a house on the lake that sleeps eight people. The cost of the house per night is based on how close it is to the water. �
� D�� Find and graph an equation for the median-fit line. � E�� What would you estimate is the cost of a rental 1.75 miles from the lake?
62/87,21���a. Use a calculator to find and graph the equation of the median fit line. �
y = í271.88x + 554.48
� b. To estimate the cost of a rental 1.75 miles from the lake, evaluate the equation of the median-fit line for x = 1.75.�
� An estimate of the cost of a rental 1.75 miles from the lake is $78.69.
Write an equation of the regression line for the data in each table. Then find the correlation coefficient.���6.<6&5$3(56� The table ranks the ten tallest buildings in the world. �
62/87,21���Use a calculator to find the equation of the regression line.�
� y = í2.75x + 102.53 � Use a calculator to find the correlation coefficient. � í0.6071
���086,&� 7KH�WDEOH�JLYHV�WKH�QXPEHU�RI�DQQXDO�YLROLQ�DXGLWLRQV�KHOG�E\�D�\RXWK�V\PSKRQ\�HDFK�\HDU�VLQFH��������/HW�x be the number of years since 2004. �
�
62/87,21���Use a calculator to find the equation of the regression line.�
� y = 3.54x + 19.68 � Use a calculator to find the correlation coefficient. � 0.9007
���5(7$,/� 7KH�WDEOH�JLYHV�WKH�VDOHV�RI�MHDQV�DW�D�FORWKLQJ�FKDLQ�VLQFH��������/HW�x be the number of years since ������ �
� a. Write an equation of the regression line. � b. Graph and analyze the residual plot.
62/87,21���a. Use a calculator to find the equation of the regression line. �
� The equation is about��\ = 3.32x + 5.20. � E��Use a calculator to graph the residual plot for the data. �
� The residuals appear to be randomly scattered. Therefore, the regression line fits the data well.
���0$5$7+21� 7KH�QXPEHU�RI�HQWUDQWV�LQ�WKH�%RVWRQ�0DUDWKRQ�HYHU\�ILYH�\HDUV�VLQFH������LV�VKRZQ���/HW�x be thenumber of years since 1975. �
� � D�� Find an equation for the median-fit line. � E�� According to the equation, how many entrants were there in 2003?
62/87,21���a. Let x = 0 for 1975. Use a calculator to find the equation of the median fit line. �
� y = 601.44x + 1236.13 � b. To estimate the number of entrants in 2003, evaluate the equation for the median-fit line for x = 2003 ± 1975 = 28.�
� There were about 18,076 entrants in 2003.
���&$03,1*� A campground kept a record of the number of campsites rented over the week of July 4 for several \HDUV���/HW�x be the number of years since 2000. �
� D�� Find an equation for the regression line. � E�� Predict the number of campsites that will be rented in 2012. � F�� Predict the number of campsites that will be rented in 2020.
62/87,21���a. Use a calculator to find an equation for the regression line. �
� y = 3.07x + 32.71 � b. To predict the number of campsites that will be rented in 2012, evaluate the regression equation for x = 12�
� There will be about 70 campsites rented in 2012. � c. To predict the number of campsites that will be rented in 2020, evaluate the regression equation for x = 20.�
� There will be about 94 campsites rented in 2020.
���,&(�&5($0� An ice cream company keeps a count of the tubs of cookie dough ice cream delivered to each of their stores in a particular area. ��
� D�� Find an equation for the median-fit line. � E�� Graph the points and the median-fit line. � F�� How many tubs would be delivered to a 1500-square-foot store? a 5000-square-foot store?
62/87,21���a. Use a calculator to find an equation for the median-fit line. �
� y = 0.095x í 94.58 � b. Plot the points and the equation. �
� c. To estimate the number of tubs to be delivered to a 1500-square-foot store, evaluate the regression equation for x = 1500. �
� There are about 48 tubs delivered to a 1500-square-foot store. To estimate the number of tubs to be delivered to a 5000-square-foot store, evaluate the regression equation for x = 5000. �
� There are about 380 tubs delivered to a 5000-square-foot store.
����CCSS SENSE-0$.,1*� The prices of the eight top-selling brands of jeans at Jeanie¶s Jeans are given in the table below. �
� D�� Find the equation for the regression line. � E�� According to the equation, what would be the price of a pair of the 12th best-selling brand? � F�� Is this a reasonable prediction? Explain.
62/87,21���a. Use a calculator to find an equation for the regression line. �
Step 1: Enter the data by pressing and selecting the EDIT option. Enter the sales rank into List 1 (L1). These will represent the x-values. Enter the price into List 2 (L2). These will represent the y-values. �
Step 2: Perform the regression by pressing �DQG�VHOHFWLQJ�WKH�CALC option. Scroll down to LinReg(ax+
b) and press . �
� y = 9.8x + 28.79 � b. To predict the price of a pair of the 12th bestselling brands of jeans, evaluate the regression equation for x = 12. �
� The price of a pair of the 12th bestselling brands of jeans would be about $146.39. � F�� Sample answer: No; the correlation between sales rank and price is too weak to make any reasonable prediction. The 12th bestselling brand of jeans could just as easily be a poorly made pair of jeans selling for $15.
����67$7(�)$,56� The table shows the total attendance, in millions of people, at the Minnesota State Fair from 2005 to 2009. �
� D��Graph a scatter plot of the data, where x = 1 represents 2005. Then find and graph the equation for the best-fit line. � b. Graph and analyze the residual plot. � c.��3UHGLFW�WKH�WRWDO�DWWHQGDQFH�LQ������ �
62/87,21���a. Enter the data from the table into the lists. Let x be the years starting with x = 1 for 2005 and let y = the attendence (in millions). Then graph the scatter plot. �
�
[0, 6] scl: 1 by [0, 3] scl: 0.5 � Perform the linear regression using the data in the lists. Find the equation of the best-fit line. �
� The equation is about y = 0.0326x + 1.598. � Use Y= to enter the equation into the calculator and graph the best-fit line with the scatter plot. �
[0, 6] scl: 1 by [0, 3] scl: 0.5 � b. Use the calculator to graph the residual plot for the data. �
� All the residuals appear to almost be on the line. Therefore, the regression line is a good fit for the data. � F���0HWKRG����To find the number of people in 2020, substitute 16 for x��
� Method 2: Copy the equation to the Y= list and graph. Use the value option to find the value of y when x = 16. �
[0, 17] scl: 1 by [0, 3] scl: 0.5 � 6R��WKHUH�ZLOO�EH�DERXW������PLOOLRQ�SHRSOH�LQ�������
����),5(),*+7(56� 7KH�WDEOH�VKRZV�VWDWLVWLFV�IURP�WKH�8�6��)LUH�$GPLQLVWUDWLRQ�� �
� D�� Find an equation for the median-fit line. � E�� Graph the points and the median-fit line. � F�� Does the median-fit line give you an accurate picture of the number of firefighters? Explain.
62/87,21���a. Use a calculator to find an equation for the median-fit line. �
Step 1: Enter the data by pressing and selecting the EDIT option. Enter age into List 1 (L1). These will represent the x-values. Enter the number of firefighters into List 2 (L2). These will represent the y-values. �
Step 2: Perform the regression by pressing and selecting the CALC option. Scroll down to Med-Med
and press �� �
� y = í841.42x + 223288 � b. Plot the points and graph the median fit line. �
� c. No, the median-fit line does not give an accurate picture of the number of firefighters. The points show no linear correlation; therefore a line cannot accurately portray the data.
����$7+/(7,&6� The table shows the total number of teens who participated in high school athletics in various years. �
� � D�� Find an equation for the regression line. � E�� According to the equation, how many participated in 1988?
62/87,21���a. Use a calculator to find an equation for the regression line. �
Step 1: Enter the data by pressing and selecting the EDIT option. Let the year 1970 be represented by 0. Enter the years since 1970 into List 1 (L1). These will represent the x-values. Enter the number of athletes into List 2 (L2). These will represent the y-values. �
Step 2: Perform the regression by pressing and selecting the CALC option. Scroll down to LinReg(ax+
b) and press . �
� y = 87,390.5x + 4,018,431 � b. To estimate the number of participants in 1988, evaluate the regression equation for x = 18 because 1988 is 18 years after 1970. �
� There were about 5,591,460 participants in 1988.
����$57� $�FRXQW�ZDV�NHSW�RQ�WKH�QXPEHU�RI�SDLQWLQJV�WKDW�VROG�DW�DQ�DXFWLRQ�E\�WKH�\HDU�LQ�ZKLFK�WKH\�ZHUH�SDLQWHG���Let x be the number of years since 1950. �
� D�� Find the equation for the linear regression line. � E�� How many paintings were sold that were painted in 1961? � F�� Is the linear regression equation an accurate model of the data? Explain why or why not.
62/87,21���a. 8VH�D�FDOFXODWRU�WR�ILQG�DQ�HTXDWLRQ�IRU�WKH�UHJUHVVLRQ�OLQH�� �
Step 1: Enter the data by pressing and selecting the EDIT option. Let x =0 for the year 1950.. Enter the years since 1950 into List 1 (L1). These will represent the x-values. Enter the number of painting sold into List 2 (L2). These will represent the y-values. �
Step 2: Perform the regression by pressing �DQG�VHOHFWLQJ�WKH�CALC option. Scroll down to LinReg(ax+
b) and press . � �
� y = 0.446x +9.43 � b. 7R�HVWLPDWH�WKH�QXPEHU�RI�SDLQWLQJV�VROG�LQ�������HYDOXDWH�WKH�UHJUHVVLRQ�HTXDWLRQ�IRU������ZKHQ��x =11. �
� There were about 14 paintings sold in 1961. � F�� No, the correlation coefficient is 0.48, so the linear model is not a good fit for the data. It does not appear from the data that there is a relationship between the number of paintings sold and the year they were painted.
����&&66�$5*80(176� Below are the results of the World Superpipe Championships in 2008.\ �
� � Find an equation of the regression line for each, and graph them on the same coordinate plane. Compare and contrast the men¶s and women's graphs.
62/87,21���Use a calculator to find an equation of the regression line for each set of data.� Men: y = í2.92x + 95.92 Women: y = í7x+106 � Graph the equations on the same coordinate plane. �
� The women¶s scores are typically lower than the men¶s.
����5($621,1*� For a class project, the scores that 10 randomly selected students earned on the first 8 tests of the VFKRRO�\HDU�DUH�JLYHQ��([SODLQ�KRZ�WR�ILQG�D�OLQH�RI��EHVW�ILW���&RXOG�LW�EH�XVHG�WR�SUHGLFW�WKH�VFRUHV�RI�RWKHU�VWXGHQWV"Explain your reasoning.
62/87,21���Apply a linear regression model to the data. Use the number of each test as the independent variable and the score on each test as the dependent variable. If there is no correlation, the r value will not be close to 1 or í1. If this is the case, the line of fit could not be used to predict the scores of the other students.
����23(1�(1'('� For 10 different people, measure their heights and the lengths of their heads from chin to top. Use these data to generate a linear regression equation and a median-fit equation. Make a prediction using both of the equations.
62/87,21���Student should gather and record data and use a calculator to find the equation of linear regression and a median-fit equation. Students should make predictions based on both equations. � 6DPSOH�GDWD��
� Median-fit (Store in Y1)
y = 8.31x ± 3.12 � /LQHDU�UHJUHVVLRQ���6WRUH�LQ Y2)
y = 7.39x + 5.22 � Find the height of a student with chin to top of head measure of 8.1. Use the value option from the CALC menu. Use the up arrow to move from one line to another. �
�
� The median-fit line predicts a student¶s height of 64.17 inches and the linear regression line predicts a height of 65.07.
Chin to 7RS��RI�
Head Measure Height8.8 70.99.1 72.89.3 73.87.5 61.08.4 66.37.8 62.08.5 67.38.8 68.98.3 68.78.9 71.5
����WRITING IN MATH How are lines of fit and linear regression similar? different?
62/87,21���Sample answer: Both lines of fit and linear regression are used to model data. However, you could have numerous lines of fit, while linear regression results in one line of best fit. If linear regression is used, you can also use the correlation coefficient to see how closely the model fits the data. For example, the scatter plot below displays the points (1, 10), (2, 17), (3, 15), (4, 20), (5, 28), (6, 19), and (7, 25). �
$�OLQH�RI�ILW�FRXOG�EH�GUDZQ�WKURXJK���������DQG����������7KH�HTXDWLRQ�RI�WKLV�OLQH�RI�ILW�LV�� .
� Use a calculator to find the equation of the regression line for this data. �
� The only regression line for this data has an equation of about y = 2.2x����������
����*(20(75<� Sam is putting a border around a poster. x represents the poster¶s width, and y represents the poster¶s length. Which equation represents how much border Sam will use if he doubles the length and the width? � $� 4xy � %� (x + y)4 � &� 4(x + y) � '� 16(x + y)
62/87,21���The perimeter of the room is found by . y is the length and x is the width, so . But Sam wants to double the border, so the perimeter becomes: �
� So, the correct choice is C.
����6+257�5(63216(� Tatiana wants to run 5 miles at an average pace of 9 minutes per mile. After 4 miles, her average pace is 9 minutes 10 seconds. In how many minutes must she complete the final mile to reach her goal?
62/87,21���Tatiana ran each of the first 4 miles in 10 more seconds than she planned. So to reach her goal, she must run the lastmile in 40 seconds less than she planned. 9 min ± 40 s = 8 min and 20 s.
����What is the slope of the line that passes through (1, 3) and (í3, 1)?� )� í2 �
*��
�
+��
� -� 2
62/87,21���
� So, the correct choice is H.
����What is an equation of the line that passes through (0, 1) and has a slope of 3?� $� y = 3x í 1 � %� y = 3x í 2 � &� y = 3x + 4 � '� y = 3x + 1
62/87,21���Find the y-intercept. �
� The equation is y = 3x + 1. So, the correct choice is D.
����86('�&$56� Gianna wants to buy a specific make and model of a used car. She researched prices from dealers and private sellers and made the graph shown. �
� D�� Describe the relationship in the data. � E�� Use the line of fit to predict the price of a car that is 7 years old. � F�� Is it reasonable to use this line of fit to predict the price of a 10-year old car? Explain.
62/87,21���a. Because y decreases as x increases, there is a negative correlation in the data. � b. Find x = 7 on the graph and follow the line up to the line of fit. According to the graph, the price of a car that is 7 years old would be about $3600. � c. No, it would not be reasonable to use this line of fit to predict the price of a 10-year old car, because according to the line of fit, the cost would be $0 and that doesn¶t make sense.
����*(20(75<� A quadrilateral has sides with equations y = í2x, 2x + y = 6, , and x í 2y = 9. Is the figure a rectangle? Explain your reasoning.
62/87,21���Write all of the equations in slope-intercept form. � Equation 1: y = í2x � (TXDWLRQ���� �
� (TXDWLRQ����
������������������y = x + 6 � Equation 4:� �
� Find the slope of each line �
� The slope of opposite sides are equal (±2 and ±���DQG�����DQG�������VR�WKH\�DUH�SDUDOOHO��$OVR��WKH�VORSH�RI�consecutive sides are opposite reciprocals (±2 and 0.5; and ±2 and 0.5), so they are perpendicular. So, the figure is a rectangle.
y = í2x í2y = ±2x +6 í2
y = 0.5x + 6
y = 0.5x ± 4.5
Write each equation in standard form.����y í 2 = 3(x í 1)
62/87,21���
����y í 5 = 6(x + 1)
62/87,21���
����y + 2 = í2(x í 5)
62/87,21���
����
62/87,21���
����
62/87,21���
����
62/87,21���
Find the slope of the line that passes through each pair of points.����(3, 4), (10, 8)
62/87,21���
����(í4, 7), (3, 5)
62/87,21���
����(3, 7), (í2, 4)
62/87,21���
����(í3, 2), (í3, 4)
62/87,21���
The slope is undefined.
If f (x) = x2 í x + 1, find each value.����f (í1)
62/87,21���
����f (5) í3
62/87,21���
����f (a)
62/87,21���
����f (b2)
62/87,21���
Graph each equation.����y = x + 2
62/87,21���To graph the equation, plot the y-intercept (0, 2). Then move up 1 unit and right 1 unit. Plot the point. Draw a line through the two points.
����x + 5y = 4
62/87,21���Write the equation in slope-intercept form. �
To graph the equation, plot the y-LQWHUFHSW�� . Then move down 1 unit and right 5 units. Plot the point. Draw a
line through the two points. �
����2x í 3y = 6
62/87,21���Write the equation in slope-intercept form. �
� To graph the equation, plot the y-intercept (0, ±2). Then move up 2 units and right 3 units. Plot the point. Draw a line through the two points. �
����5x + 2y = 6
62/87,21���Write the equation in slope-intercept form. �
� To graph the equation, plot the y-intercept (0, 3). Then move down 5 units and right 2 units. Plot the point. Draw a line through the two points. �
Another line of fit may pass through (2, 15) and (7, 25). The equation of this line of fit is y = 2x + 11. More lines of fit that come close to the points could be drawn.
eSolutions Manual - Powered by Cognero Page 16
4-6 Regression and Median-Fit Lines
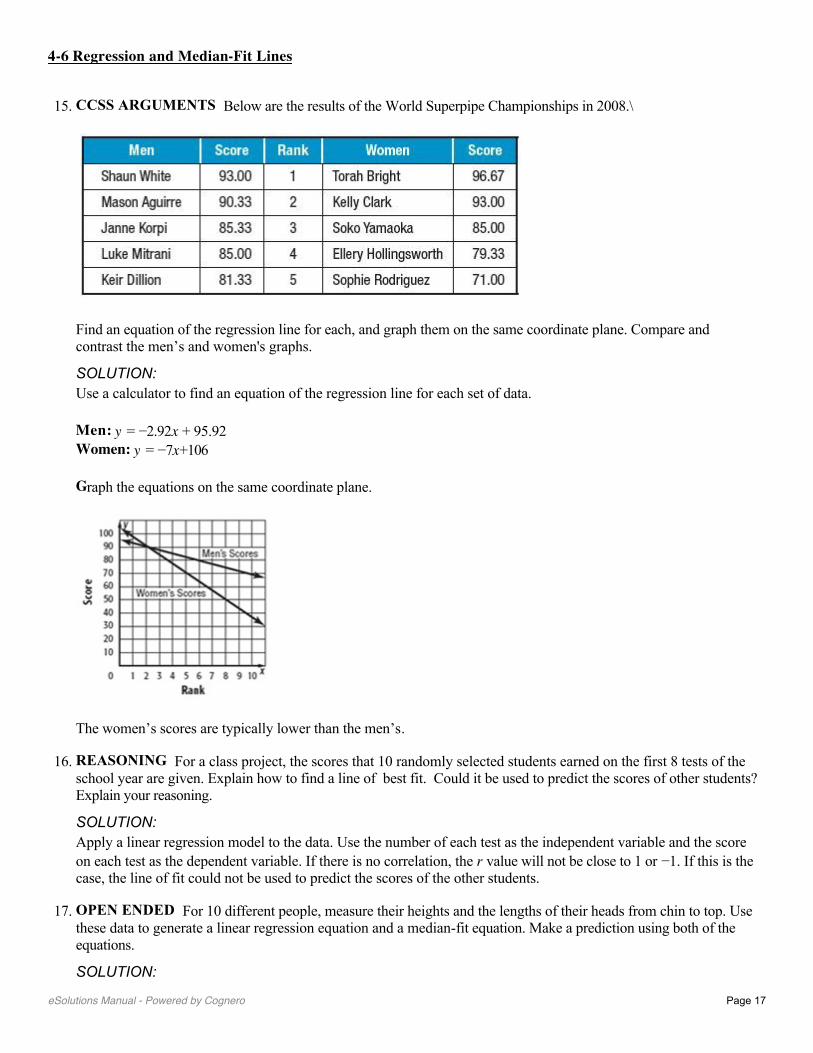
���3277(5<� $�ORFDO�XQLYHUVLW\�LV�NHHSLQJ�WUDFN�RI�WKH�QXPEHU�RI�DUW�VWXGHQWV�ZKR�XVH�WKH�SRWWHU\�VWXGLR�HDFK�GD\�� �
� a. Write an equation of the regression line and find the correlation coefficient. � b. Graph the residual plot and determine if the regression line models the data well.
62/87,21���D��Use a calculator to find the equation of the regression line. � Step 1: Enter the data by pressing STAT and selecting the EDIT option. . Enter the day into List 1 (L1). These willrepresent the x-values. Enter the number of students into List 2 (L2). These will represent the y-values. � Step 2: Perform the regression by pressing STAT �DQG�VHOHFWLQJ�WKH�CALC option. Scroll down to LinReg(ax+ b) and press ENTER. �
� Substitute the values in for a and b to write the equation of the regression line. So, the equation is y = 1.18x + 11. � Identify the value of r on the calculator to find the correlation coefficient. So, 0.7181 is the correlation coefficient. � b.�7XUQ�RQ�Plot2 under the STAT PLOT menu and choose scatter plot. Use L1 for the Xlist and RESID for the Ylist. You can obtain RESID by pressing 2nd STAT and selecting RESID from the list of names. Graph the scatter plot of the residuals by pressing ZOOM and choosing ZoomStat. �
� The residuals appear to be randomly scattered, so the regression line fits the data reasonably well. �
���&20387(56� The table below shows the percent of Americans with a broadband connection at home in a recentyear. Use linear extrapolation and a regression equation to estimate the percentage of 60-year-olds with broadband at home. �
62/87,21���Use a calculator to find the equation of the regression line.�
� y = ±0.34x + 49.48 � Substitute 60 into the equation. �
� So, about 29% of 60-year-olds have broadband at home.
���9$&$7,21� The Smiths want to rent a house on the lake that sleeps eight people. The cost of the house per night is based on how close it is to the water. �
� D�� Find and graph an equation for the median-fit line. � E�� What would you estimate is the cost of a rental 1.75 miles from the lake?
62/87,21���a. Use a calculator to find and graph the equation of the median fit line. �
y = í271.88x + 554.48
� b. To estimate the cost of a rental 1.75 miles from the lake, evaluate the equation of the median-fit line for x = 1.75.�
� An estimate of the cost of a rental 1.75 miles from the lake is $78.69.
Write an equation of the regression line for the data in each table. Then find the correlation coefficient.���6.<6&5$3(56� The table ranks the ten tallest buildings in the world. �
62/87,21���Use a calculator to find the equation of the regression line.�
� y = í2.75x + 102.53 � Use a calculator to find the correlation coefficient. � í0.6071
���086,&� 7KH�WDEOH�JLYHV�WKH�QXPEHU�RI�DQQXDO�YLROLQ�DXGLWLRQV�KHOG�E\�D�\RXWK�V\PSKRQ\�HDFK�\HDU�VLQFH��������/HW�x be the number of years since 2004. �
�
62/87,21���Use a calculator to find the equation of the regression line.�
� y = 3.54x + 19.68 � Use a calculator to find the correlation coefficient. � 0.9007
���5(7$,/� 7KH�WDEOH�JLYHV�WKH�VDOHV�RI�MHDQV�DW�D�FORWKLQJ�FKDLQ�VLQFH��������/HW�x be the number of years since ������ �
� a. Write an equation of the regression line. � b. Graph and analyze the residual plot.
62/87,21���a. Use a calculator to find the equation of the regression line. �
� The equation is about��\ = 3.32x + 5.20. � E��Use a calculator to graph the residual plot for the data. �
� The residuals appear to be randomly scattered. Therefore, the regression line fits the data well.
���0$5$7+21� 7KH�QXPEHU�RI�HQWUDQWV�LQ�WKH�%RVWRQ�0DUDWKRQ�HYHU\�ILYH�\HDUV�VLQFH������LV�VKRZQ���/HW�x be thenumber of years since 1975. �
� � D�� Find an equation for the median-fit line. � E�� According to the equation, how many entrants were there in 2003?
62/87,21���a. Let x = 0 for 1975. Use a calculator to find the equation of the median fit line. �
� y = 601.44x + 1236.13 � b. To estimate the number of entrants in 2003, evaluate the equation for the median-fit line for x = 2003 ± 1975 = 28.�
� There were about 18,076 entrants in 2003.
���&$03,1*� A campground kept a record of the number of campsites rented over the week of July 4 for several \HDUV���/HW�x be the number of years since 2000. �
� D�� Find an equation for the regression line. � E�� Predict the number of campsites that will be rented in 2012. � F�� Predict the number of campsites that will be rented in 2020.
62/87,21���a. Use a calculator to find an equation for the regression line. �
� y = 3.07x + 32.71 � b. To predict the number of campsites that will be rented in 2012, evaluate the regression equation for x = 12�
� There will be about 70 campsites rented in 2012. � c. To predict the number of campsites that will be rented in 2020, evaluate the regression equation for x = 20.�
� There will be about 94 campsites rented in 2020.
���,&(�&5($0� An ice cream company keeps a count of the tubs of cookie dough ice cream delivered to each of their stores in a particular area. ��
� D�� Find an equation for the median-fit line. � E�� Graph the points and the median-fit line. � F�� How many tubs would be delivered to a 1500-square-foot store? a 5000-square-foot store?
62/87,21���a. Use a calculator to find an equation for the median-fit line. �
� y = 0.095x í 94.58 � b. Plot the points and the equation. �
� c. To estimate the number of tubs to be delivered to a 1500-square-foot store, evaluate the regression equation for x = 1500. �
� There are about 48 tubs delivered to a 1500-square-foot store. To estimate the number of tubs to be delivered to a 5000-square-foot store, evaluate the regression equation for x = 5000. �
� There are about 380 tubs delivered to a 5000-square-foot store.
����CCSS SENSE-0$.,1*� The prices of the eight top-selling brands of jeans at Jeanie¶s Jeans are given in the table below. �
� D�� Find the equation for the regression line. � E�� According to the equation, what would be the price of a pair of the 12th best-selling brand? � F�� Is this a reasonable prediction? Explain.
62/87,21���a. Use a calculator to find an equation for the regression line. �
Step 1: Enter the data by pressing and selecting the EDIT option. Enter the sales rank into List 1 (L1). These will represent the x-values. Enter the price into List 2 (L2). These will represent the y-values. �
Step 2: Perform the regression by pressing �DQG�VHOHFWLQJ�WKH�CALC option. Scroll down to LinReg(ax+
b) and press . �
� y = 9.8x + 28.79 � b. To predict the price of a pair of the 12th bestselling brands of jeans, evaluate the regression equation for x = 12. �
� The price of a pair of the 12th bestselling brands of jeans would be about $146.39. � F�� Sample answer: No; the correlation between sales rank and price is too weak to make any reasonable prediction. The 12th bestselling brand of jeans could just as easily be a poorly made pair of jeans selling for $15.
����67$7(�)$,56� The table shows the total attendance, in millions of people, at the Minnesota State Fair from 2005 to 2009. �
� D��Graph a scatter plot of the data, where x = 1 represents 2005. Then find and graph the equation for the best-fit line. � b. Graph and analyze the residual plot. � c.��3UHGLFW�WKH�WRWDO�DWWHQGDQFH�LQ������ �
62/87,21���a. Enter the data from the table into the lists. Let x be the years starting with x = 1 for 2005 and let y = the attendence (in millions). Then graph the scatter plot. �
�
[0, 6] scl: 1 by [0, 3] scl: 0.5 � Perform the linear regression using the data in the lists. Find the equation of the best-fit line. �
� The equation is about y = 0.0326x + 1.598. � Use Y= to enter the equation into the calculator and graph the best-fit line with the scatter plot. �
[0, 6] scl: 1 by [0, 3] scl: 0.5 � b. Use the calculator to graph the residual plot for the data. �
� All the residuals appear to almost be on the line. Therefore, the regression line is a good fit for the data. � F���0HWKRG����To find the number of people in 2020, substitute 16 for x��
� Method 2: Copy the equation to the Y= list and graph. Use the value option to find the value of y when x = 16. �
[0, 17] scl: 1 by [0, 3] scl: 0.5 � 6R��WKHUH�ZLOO�EH�DERXW������PLOOLRQ�SHRSOH�LQ�������
����),5(),*+7(56� 7KH�WDEOH�VKRZV�VWDWLVWLFV�IURP�WKH�8�6��)LUH�$GPLQLVWUDWLRQ�� �
� D�� Find an equation for the median-fit line. � E�� Graph the points and the median-fit line. � F�� Does the median-fit line give you an accurate picture of the number of firefighters? Explain.
62/87,21���a. Use a calculator to find an equation for the median-fit line. �
Step 1: Enter the data by pressing and selecting the EDIT option. Enter age into List 1 (L1). These will represent the x-values. Enter the number of firefighters into List 2 (L2). These will represent the y-values. �
Step 2: Perform the regression by pressing and selecting the CALC option. Scroll down to Med-Med
and press �� �
� y = í841.42x + 223288 � b. Plot the points and graph the median fit line. �
� c. No, the median-fit line does not give an accurate picture of the number of firefighters. The points show no linear correlation; therefore a line cannot accurately portray the data.
����$7+/(7,&6� The table shows the total number of teens who participated in high school athletics in various years. �
� � D�� Find an equation for the regression line. � E�� According to the equation, how many participated in 1988?
62/87,21���a. Use a calculator to find an equation for the regression line. �
Step 1: Enter the data by pressing and selecting the EDIT option. Let the year 1970 be represented by 0. Enter the years since 1970 into List 1 (L1). These will represent the x-values. Enter the number of athletes into List 2 (L2). These will represent the y-values. �
Step 2: Perform the regression by pressing and selecting the CALC option. Scroll down to LinReg(ax+
b) and press . �
� y = 87,390.5x + 4,018,431 � b. To estimate the number of participants in 1988, evaluate the regression equation for x = 18 because 1988 is 18 years after 1970. �
� There were about 5,591,460 participants in 1988.
����$57� $�FRXQW�ZDV�NHSW�RQ�WKH�QXPEHU�RI�SDLQWLQJV�WKDW�VROG�DW�DQ�DXFWLRQ�E\�WKH�\HDU�LQ�ZKLFK�WKH\�ZHUH�SDLQWHG���Let x be the number of years since 1950. �
� D�� Find the equation for the linear regression line. � E�� How many paintings were sold that were painted in 1961? � F�� Is the linear regression equation an accurate model of the data? Explain why or why not.
62/87,21���a. 8VH�D�FDOFXODWRU�WR�ILQG�DQ�HTXDWLRQ�IRU�WKH�UHJUHVVLRQ�OLQH�� �
Step 1: Enter the data by pressing and selecting the EDIT option. Let x =0 for the year 1950.. Enter the years since 1950 into List 1 (L1). These will represent the x-values. Enter the number of painting sold into List 2 (L2). These will represent the y-values. �
Step 2: Perform the regression by pressing �DQG�VHOHFWLQJ�WKH�CALC option. Scroll down to LinReg(ax+
b) and press . � �
� y = 0.446x +9.43 � b. 7R�HVWLPDWH�WKH�QXPEHU�RI�SDLQWLQJV�VROG�LQ�������HYDOXDWH�WKH�UHJUHVVLRQ�HTXDWLRQ�IRU������ZKHQ��x =11. �
� There were about 14 paintings sold in 1961. � F�� No, the correlation coefficient is 0.48, so the linear model is not a good fit for the data. It does not appear from the data that there is a relationship between the number of paintings sold and the year they were painted.
����&&66�$5*80(176� Below are the results of the World Superpipe Championships in 2008.\ �
� � Find an equation of the regression line for each, and graph them on the same coordinate plane. Compare and contrast the men¶s and women's graphs.
62/87,21���Use a calculator to find an equation of the regression line for each set of data.� Men: y = í2.92x + 95.92 Women: y = í7x+106 � Graph the equations on the same coordinate plane. �
� The women¶s scores are typically lower than the men¶s.
����5($621,1*� For a class project, the scores that 10 randomly selected students earned on the first 8 tests of the VFKRRO�\HDU�DUH�JLYHQ��([SODLQ�KRZ�WR�ILQG�D�OLQH�RI��EHVW�ILW���&RXOG�LW�EH�XVHG�WR�SUHGLFW�WKH�VFRUHV�RI�RWKHU�VWXGHQWV"Explain your reasoning.
62/87,21���Apply a linear regression model to the data. Use the number of each test as the independent variable and the score on each test as the dependent variable. If there is no correlation, the r value will not be close to 1 or í1. If this is the case, the line of fit could not be used to predict the scores of the other students.
����23(1�(1'('� For 10 different people, measure their heights and the lengths of their heads from chin to top. Use these data to generate a linear regression equation and a median-fit equation. Make a prediction using both of the equations.
62/87,21���Student should gather and record data and use a calculator to find the equation of linear regression and a median-fit equation. Students should make predictions based on both equations. � 6DPSOH�GDWD��
� Median-fit (Store in Y1)
y = 8.31x ± 3.12 � /LQHDU�UHJUHVVLRQ���6WRUH�LQ Y2)
y = 7.39x + 5.22 � Find the height of a student with chin to top of head measure of 8.1. Use the value option from the CALC menu. Use the up arrow to move from one line to another. �
�
� The median-fit line predicts a student¶s height of 64.17 inches and the linear regression line predicts a height of 65.07.
Chin to 7RS��RI�
Head Measure Height8.8 70.99.1 72.89.3 73.87.5 61.08.4 66.37.8 62.08.5 67.38.8 68.98.3 68.78.9 71.5
����WRITING IN MATH How are lines of fit and linear regression similar? different?
62/87,21���Sample answer: Both lines of fit and linear regression are used to model data. However, you could have numerous lines of fit, while linear regression results in one line of best fit. If linear regression is used, you can also use the correlation coefficient to see how closely the model fits the data. For example, the scatter plot below displays the points (1, 10), (2, 17), (3, 15), (4, 20), (5, 28), (6, 19), and (7, 25). �
$�OLQH�RI�ILW�FRXOG�EH�GUDZQ�WKURXJK���������DQG����������7KH�HTXDWLRQ�RI�WKLV�OLQH�RI�ILW�LV�� .
� Use a calculator to find the equation of the regression line for this data. �
� The only regression line for this data has an equation of about y = 2.2x����������
����*(20(75<� Sam is putting a border around a poster. x represents the poster¶s width, and y represents the poster¶s length. Which equation represents how much border Sam will use if he doubles the length and the width? � $� 4xy � %� (x + y)4 � &� 4(x + y) � '� 16(x + y)
62/87,21���The perimeter of the room is found by . y is the length and x is the width, so . But Sam wants to double the border, so the perimeter becomes: �
� So, the correct choice is C.
����6+257�5(63216(� Tatiana wants to run 5 miles at an average pace of 9 minutes per mile. After 4 miles, her average pace is 9 minutes 10 seconds. In how many minutes must she complete the final mile to reach her goal?
62/87,21���Tatiana ran each of the first 4 miles in 10 more seconds than she planned. So to reach her goal, she must run the lastmile in 40 seconds less than she planned. 9 min ± 40 s = 8 min and 20 s.
����What is the slope of the line that passes through (1, 3) and (í3, 1)?� )� í2 �
*��
�
+��
� -� 2
62/87,21���
� So, the correct choice is H.
����What is an equation of the line that passes through (0, 1) and has a slope of 3?� $� y = 3x í 1 � %� y = 3x í 2 � &� y = 3x + 4 � '� y = 3x + 1
62/87,21���Find the y-intercept. �
� The equation is y = 3x + 1. So, the correct choice is D.
����86('�&$56� Gianna wants to buy a specific make and model of a used car. She researched prices from dealers and private sellers and made the graph shown. �
� D�� Describe the relationship in the data. � E�� Use the line of fit to predict the price of a car that is 7 years old. � F�� Is it reasonable to use this line of fit to predict the price of a 10-year old car? Explain.
62/87,21���a. Because y decreases as x increases, there is a negative correlation in the data. � b. Find x = 7 on the graph and follow the line up to the line of fit. According to the graph, the price of a car that is 7 years old would be about $3600. � c. No, it would not be reasonable to use this line of fit to predict the price of a 10-year old car, because according to the line of fit, the cost would be $0 and that doesn¶t make sense.
����*(20(75<� A quadrilateral has sides with equations y = í2x, 2x + y = 6, , and x í 2y = 9. Is the figure a rectangle? Explain your reasoning.
62/87,21���Write all of the equations in slope-intercept form. � Equation 1: y = í2x � (TXDWLRQ���� �
� (TXDWLRQ����
������������������y = x + 6 � Equation 4:� �
� Find the slope of each line �
� The slope of opposite sides are equal (±2 and ±���DQG�����DQG�������VR�WKH\�DUH�SDUDOOHO��$OVR��WKH�VORSH�RI�consecutive sides are opposite reciprocals (±2 and 0.5; and ±2 and 0.5), so they are perpendicular. So, the figure is a rectangle.
y = í2x í2y = ±2x +6 í2
y = 0.5x + 6
y = 0.5x ± 4.5
Write each equation in standard form.����y í 2 = 3(x í 1)
62/87,21���
����y í 5 = 6(x + 1)
62/87,21���
����y + 2 = í2(x í 5)
62/87,21���
����
62/87,21���
����
62/87,21���
����
62/87,21���
Find the slope of the line that passes through each pair of points.����(3, 4), (10, 8)
62/87,21���
����(í4, 7), (3, 5)
62/87,21���
����(3, 7), (í2, 4)
62/87,21���
����(í3, 2), (í3, 4)
62/87,21���
The slope is undefined.
If f (x) = x2 í x + 1, find each value.����f (í1)
62/87,21���
����f (5) í3
62/87,21���
����f (a)
62/87,21���
����f (b2)
62/87,21���
Graph each equation.����y = x + 2
62/87,21���To graph the equation, plot the y-intercept (0, 2). Then move up 1 unit and right 1 unit. Plot the point. Draw a line through the two points.
����x + 5y = 4
62/87,21���Write the equation in slope-intercept form. �
To graph the equation, plot the y-LQWHUFHSW�� . Then move down 1 unit and right 5 units. Plot the point. Draw a
line through the two points. �
����2x í 3y = 6
62/87,21���Write the equation in slope-intercept form. �
� To graph the equation, plot the y-intercept (0, ±2). Then move up 2 units and right 3 units. Plot the point. Draw a line through the two points. �
����5x + 2y = 6
62/87,21���Write the equation in slope-intercept form. �
� To graph the equation, plot the y-intercept (0, 3). Then move down 5 units and right 2 units. Plot the point. Draw a line through the two points. �
Another line of fit may pass through (2, 15) and (7, 25). The equation of this line of fit is y = 2x + 11. More lines of fit that come close to the points could be drawn.
eSolutions Manual - Powered by Cognero Page 17
4-6 Regression and Median-Fit Lines

���3277(5<� $�ORFDO�XQLYHUVLW\�LV�NHHSLQJ�WUDFN�RI�WKH�QXPEHU�RI�DUW�VWXGHQWV�ZKR�XVH�WKH�SRWWHU\�VWXGLR�HDFK�GD\�� �
� a. Write an equation of the regression line and find the correlation coefficient. � b. Graph the residual plot and determine if the regression line models the data well.
62/87,21���D��Use a calculator to find the equation of the regression line. � Step 1: Enter the data by pressing STAT and selecting the EDIT option. . Enter the day into List 1 (L1). These willrepresent the x-values. Enter the number of students into List 2 (L2). These will represent the y-values. � Step 2: Perform the regression by pressing STAT �DQG�VHOHFWLQJ�WKH�CALC option. Scroll down to LinReg(ax+ b) and press ENTER. �
� Substitute the values in for a and b to write the equation of the regression line. So, the equation is y = 1.18x + 11. � Identify the value of r on the calculator to find the correlation coefficient. So, 0.7181 is the correlation coefficient. � b.�7XUQ�RQ�Plot2 under the STAT PLOT menu and choose scatter plot. Use L1 for the Xlist and RESID for the Ylist. You can obtain RESID by pressing 2nd STAT and selecting RESID from the list of names. Graph the scatter plot of the residuals by pressing ZOOM and choosing ZoomStat. �
� The residuals appear to be randomly scattered, so the regression line fits the data reasonably well. �
���&20387(56� The table below shows the percent of Americans with a broadband connection at home in a recentyear. Use linear extrapolation and a regression equation to estimate the percentage of 60-year-olds with broadband at home. �
62/87,21���Use a calculator to find the equation of the regression line.�
� y = ±0.34x + 49.48 � Substitute 60 into the equation. �
� So, about 29% of 60-year-olds have broadband at home.
���9$&$7,21� The Smiths want to rent a house on the lake that sleeps eight people. The cost of the house per night is based on how close it is to the water. �
� D�� Find and graph an equation for the median-fit line. � E�� What would you estimate is the cost of a rental 1.75 miles from the lake?
62/87,21���a. Use a calculator to find and graph the equation of the median fit line. �
y = í271.88x + 554.48
� b. To estimate the cost of a rental 1.75 miles from the lake, evaluate the equation of the median-fit line for x = 1.75.�
� An estimate of the cost of a rental 1.75 miles from the lake is $78.69.
Write an equation of the regression line for the data in each table. Then find the correlation coefficient.���6.<6&5$3(56� The table ranks the ten tallest buildings in the world. �
62/87,21���Use a calculator to find the equation of the regression line.�
� y = í2.75x + 102.53 � Use a calculator to find the correlation coefficient. � í0.6071
���086,&� 7KH�WDEOH�JLYHV�WKH�QXPEHU�RI�DQQXDO�YLROLQ�DXGLWLRQV�KHOG�E\�D�\RXWK�V\PSKRQ\�HDFK�\HDU�VLQFH��������/HW�x be the number of years since 2004. �
�
62/87,21���Use a calculator to find the equation of the regression line.�
� y = 3.54x + 19.68 � Use a calculator to find the correlation coefficient. � 0.9007
���5(7$,/� 7KH�WDEOH�JLYHV�WKH�VDOHV�RI�MHDQV�DW�D�FORWKLQJ�FKDLQ�VLQFH��������/HW�x be the number of years since ������ �
� a. Write an equation of the regression line. � b. Graph and analyze the residual plot.
62/87,21���a. Use a calculator to find the equation of the regression line. �
� The equation is about��\ = 3.32x + 5.20. � E��Use a calculator to graph the residual plot for the data. �
� The residuals appear to be randomly scattered. Therefore, the regression line fits the data well.
���0$5$7+21� 7KH�QXPEHU�RI�HQWUDQWV�LQ�WKH�%RVWRQ�0DUDWKRQ�HYHU\�ILYH�\HDUV�VLQFH������LV�VKRZQ���/HW�x be thenumber of years since 1975. �
� � D�� Find an equation for the median-fit line. � E�� According to the equation, how many entrants were there in 2003?
62/87,21���a. Let x = 0 for 1975. Use a calculator to find the equation of the median fit line. �
� y = 601.44x + 1236.13 � b. To estimate the number of entrants in 2003, evaluate the equation for the median-fit line for x = 2003 ± 1975 = 28.�
� There were about 18,076 entrants in 2003.
���&$03,1*� A campground kept a record of the number of campsites rented over the week of July 4 for several \HDUV���/HW�x be the number of years since 2000. �
� D�� Find an equation for the regression line. � E�� Predict the number of campsites that will be rented in 2012. � F�� Predict the number of campsites that will be rented in 2020.
62/87,21���a. Use a calculator to find an equation for the regression line. �
� y = 3.07x + 32.71 � b. To predict the number of campsites that will be rented in 2012, evaluate the regression equation for x = 12�
� There will be about 70 campsites rented in 2012. � c. To predict the number of campsites that will be rented in 2020, evaluate the regression equation for x = 20.�
� There will be about 94 campsites rented in 2020.
���,&(�&5($0� An ice cream company keeps a count of the tubs of cookie dough ice cream delivered to each of their stores in a particular area. ��
� D�� Find an equation for the median-fit line. � E�� Graph the points and the median-fit line. � F�� How many tubs would be delivered to a 1500-square-foot store? a 5000-square-foot store?
62/87,21���a. Use a calculator to find an equation for the median-fit line. �
� y = 0.095x í 94.58 � b. Plot the points and the equation. �
� c. To estimate the number of tubs to be delivered to a 1500-square-foot store, evaluate the regression equation for x = 1500. �
� There are about 48 tubs delivered to a 1500-square-foot store. To estimate the number of tubs to be delivered to a 5000-square-foot store, evaluate the regression equation for x = 5000. �
� There are about 380 tubs delivered to a 5000-square-foot store.
����CCSS SENSE-0$.,1*� The prices of the eight top-selling brands of jeans at Jeanie¶s Jeans are given in the table below. �
� D�� Find the equation for the regression line. � E�� According to the equation, what would be the price of a pair of the 12th best-selling brand? � F�� Is this a reasonable prediction? Explain.
62/87,21���a. Use a calculator to find an equation for the regression line. �
Step 1: Enter the data by pressing and selecting the EDIT option. Enter the sales rank into List 1 (L1). These will represent the x-values. Enter the price into List 2 (L2). These will represent the y-values. �
Step 2: Perform the regression by pressing �DQG�VHOHFWLQJ�WKH�CALC option. Scroll down to LinReg(ax+
b) and press . �
� y = 9.8x + 28.79 � b. To predict the price of a pair of the 12th bestselling brands of jeans, evaluate the regression equation for x = 12. �
� The price of a pair of the 12th bestselling brands of jeans would be about $146.39. � F�� Sample answer: No; the correlation between sales rank and price is too weak to make any reasonable prediction. The 12th bestselling brand of jeans could just as easily be a poorly made pair of jeans selling for $15.
����67$7(�)$,56� The table shows the total attendance, in millions of people, at the Minnesota State Fair from 2005 to 2009. �
� D��Graph a scatter plot of the data, where x = 1 represents 2005. Then find and graph the equation for the best-fit line. � b. Graph and analyze the residual plot. � c.��3UHGLFW�WKH�WRWDO�DWWHQGDQFH�LQ������ �
62/87,21���a. Enter the data from the table into the lists. Let x be the years starting with x = 1 for 2005 and let y = the attendence (in millions). Then graph the scatter plot. �
�
[0, 6] scl: 1 by [0, 3] scl: 0.5 � Perform the linear regression using the data in the lists. Find the equation of the best-fit line. �
� The equation is about y = 0.0326x + 1.598. � Use Y= to enter the equation into the calculator and graph the best-fit line with the scatter plot. �
[0, 6] scl: 1 by [0, 3] scl: 0.5 � b. Use the calculator to graph the residual plot for the data. �
� All the residuals appear to almost be on the line. Therefore, the regression line is a good fit for the data. � F���0HWKRG����To find the number of people in 2020, substitute 16 for x��
� Method 2: Copy the equation to the Y= list and graph. Use the value option to find the value of y when x = 16. �
[0, 17] scl: 1 by [0, 3] scl: 0.5 � 6R��WKHUH�ZLOO�EH�DERXW������PLOOLRQ�SHRSOH�LQ�������
����),5(),*+7(56� 7KH�WDEOH�VKRZV�VWDWLVWLFV�IURP�WKH�8�6��)LUH�$GPLQLVWUDWLRQ�� �
� D�� Find an equation for the median-fit line. � E�� Graph the points and the median-fit line. � F�� Does the median-fit line give you an accurate picture of the number of firefighters? Explain.
62/87,21���a. Use a calculator to find an equation for the median-fit line. �
Step 1: Enter the data by pressing and selecting the EDIT option. Enter age into List 1 (L1). These will represent the x-values. Enter the number of firefighters into List 2 (L2). These will represent the y-values. �
Step 2: Perform the regression by pressing and selecting the CALC option. Scroll down to Med-Med
and press �� �
� y = í841.42x + 223288 � b. Plot the points and graph the median fit line. �
� c. No, the median-fit line does not give an accurate picture of the number of firefighters. The points show no linear correlation; therefore a line cannot accurately portray the data.
����$7+/(7,&6� The table shows the total number of teens who participated in high school athletics in various years. �
� � D�� Find an equation for the regression line. � E�� According to the equation, how many participated in 1988?
62/87,21���a. Use a calculator to find an equation for the regression line. �
Step 1: Enter the data by pressing and selecting the EDIT option. Let the year 1970 be represented by 0. Enter the years since 1970 into List 1 (L1). These will represent the x-values. Enter the number of athletes into List 2 (L2). These will represent the y-values. �
Step 2: Perform the regression by pressing and selecting the CALC option. Scroll down to LinReg(ax+
b) and press . �
� y = 87,390.5x + 4,018,431 � b. To estimate the number of participants in 1988, evaluate the regression equation for x = 18 because 1988 is 18 years after 1970. �
� There were about 5,591,460 participants in 1988.
����$57� $�FRXQW�ZDV�NHSW�RQ�WKH�QXPEHU�RI�SDLQWLQJV�WKDW�VROG�DW�DQ�DXFWLRQ�E\�WKH�\HDU�LQ�ZKLFK�WKH\�ZHUH�SDLQWHG���Let x be the number of years since 1950. �
� D�� Find the equation for the linear regression line. � E�� How many paintings were sold that were painted in 1961? � F�� Is the linear regression equation an accurate model of the data? Explain why or why not.
62/87,21���a. 8VH�D�FDOFXODWRU�WR�ILQG�DQ�HTXDWLRQ�IRU�WKH�UHJUHVVLRQ�OLQH�� �
Step 1: Enter the data by pressing and selecting the EDIT option. Let x =0 for the year 1950.. Enter the years since 1950 into List 1 (L1). These will represent the x-values. Enter the number of painting sold into List 2 (L2). These will represent the y-values. �
Step 2: Perform the regression by pressing �DQG�VHOHFWLQJ�WKH�CALC option. Scroll down to LinReg(ax+
b) and press . � �
� y = 0.446x +9.43 � b. 7R�HVWLPDWH�WKH�QXPEHU�RI�SDLQWLQJV�VROG�LQ�������HYDOXDWH�WKH�UHJUHVVLRQ�HTXDWLRQ�IRU������ZKHQ��x =11. �
� There were about 14 paintings sold in 1961. � F�� No, the correlation coefficient is 0.48, so the linear model is not a good fit for the data. It does not appear from the data that there is a relationship between the number of paintings sold and the year they were painted.
����&&66�$5*80(176� Below are the results of the World Superpipe Championships in 2008.\ �
� � Find an equation of the regression line for each, and graph them on the same coordinate plane. Compare and contrast the men¶s and women's graphs.
62/87,21���Use a calculator to find an equation of the regression line for each set of data.� Men: y = í2.92x + 95.92 Women: y = í7x+106 � Graph the equations on the same coordinate plane. �
� The women¶s scores are typically lower than the men¶s.
����5($621,1*� For a class project, the scores that 10 randomly selected students earned on the first 8 tests of the VFKRRO�\HDU�DUH�JLYHQ��([SODLQ�KRZ�WR�ILQG�D�OLQH�RI��EHVW�ILW���&RXOG�LW�EH�XVHG�WR�SUHGLFW�WKH�VFRUHV�RI�RWKHU�VWXGHQWV"Explain your reasoning.
62/87,21���Apply a linear regression model to the data. Use the number of each test as the independent variable and the score on each test as the dependent variable. If there is no correlation, the r value will not be close to 1 or í1. If this is the case, the line of fit could not be used to predict the scores of the other students.
����23(1�(1'('� For 10 different people, measure their heights and the lengths of their heads from chin to top. Use these data to generate a linear regression equation and a median-fit equation. Make a prediction using both of the equations.
62/87,21���Student should gather and record data and use a calculator to find the equation of linear regression and a median-fit equation. Students should make predictions based on both equations. � 6DPSOH�GDWD��
� Median-fit (Store in Y1)
y = 8.31x ± 3.12 � /LQHDU�UHJUHVVLRQ���6WRUH�LQ Y2)
y = 7.39x + 5.22 � Find the height of a student with chin to top of head measure of 8.1. Use the value option from the CALC menu. Use the up arrow to move from one line to another. �
�
� The median-fit line predicts a student¶s height of 64.17 inches and the linear regression line predicts a height of 65.07.
Chin to 7RS��RI�
Head Measure Height8.8 70.99.1 72.89.3 73.87.5 61.08.4 66.37.8 62.08.5 67.38.8 68.98.3 68.78.9 71.5
����WRITING IN MATH How are lines of fit and linear regression similar? different?
62/87,21���Sample answer: Both lines of fit and linear regression are used to model data. However, you could have numerous lines of fit, while linear regression results in one line of best fit. If linear regression is used, you can also use the correlation coefficient to see how closely the model fits the data. For example, the scatter plot below displays the points (1, 10), (2, 17), (3, 15), (4, 20), (5, 28), (6, 19), and (7, 25). �
$�OLQH�RI�ILW�FRXOG�EH�GUDZQ�WKURXJK���������DQG����������7KH�HTXDWLRQ�RI�WKLV�OLQH�RI�ILW�LV�� .
� Use a calculator to find the equation of the regression line for this data. �
� The only regression line for this data has an equation of about y = 2.2x����������
����*(20(75<� Sam is putting a border around a poster. x represents the poster¶s width, and y represents the poster¶s length. Which equation represents how much border Sam will use if he doubles the length and the width? � $� 4xy � %� (x + y)4 � &� 4(x + y) � '� 16(x + y)
62/87,21���The perimeter of the room is found by . y is the length and x is the width, so . But Sam wants to double the border, so the perimeter becomes: �
� So, the correct choice is C.
����6+257�5(63216(� Tatiana wants to run 5 miles at an average pace of 9 minutes per mile. After 4 miles, her average pace is 9 minutes 10 seconds. In how many minutes must she complete the final mile to reach her goal?
62/87,21���Tatiana ran each of the first 4 miles in 10 more seconds than she planned. So to reach her goal, she must run the lastmile in 40 seconds less than she planned. 9 min ± 40 s = 8 min and 20 s.
����What is the slope of the line that passes through (1, 3) and (í3, 1)?� )� í2 �
*��
�
+��
� -� 2
62/87,21���
� So, the correct choice is H.
����What is an equation of the line that passes through (0, 1) and has a slope of 3?� $� y = 3x í 1 � %� y = 3x í 2 � &� y = 3x + 4 � '� y = 3x + 1
62/87,21���Find the y-intercept. �
� The equation is y = 3x + 1. So, the correct choice is D.
����86('�&$56� Gianna wants to buy a specific make and model of a used car. She researched prices from dealers and private sellers and made the graph shown. �
� D�� Describe the relationship in the data. � E�� Use the line of fit to predict the price of a car that is 7 years old. � F�� Is it reasonable to use this line of fit to predict the price of a 10-year old car? Explain.
62/87,21���a. Because y decreases as x increases, there is a negative correlation in the data. � b. Find x = 7 on the graph and follow the line up to the line of fit. According to the graph, the price of a car that is 7 years old would be about $3600. � c. No, it would not be reasonable to use this line of fit to predict the price of a 10-year old car, because according to the line of fit, the cost would be $0 and that doesn¶t make sense.
����*(20(75<� A quadrilateral has sides with equations y = í2x, 2x + y = 6, , and x í 2y = 9. Is the figure a rectangle? Explain your reasoning.
62/87,21���Write all of the equations in slope-intercept form. � Equation 1: y = í2x � (TXDWLRQ���� �
� (TXDWLRQ����
������������������y = x + 6 � Equation 4:� �
� Find the slope of each line �
� The slope of opposite sides are equal (±2 and ±���DQG�����DQG�������VR�WKH\�DUH�SDUDOOHO��$OVR��WKH�VORSH�RI�consecutive sides are opposite reciprocals (±2 and 0.5; and ±2 and 0.5), so they are perpendicular. So, the figure is a rectangle.
y = í2x í2y = ±2x +6 í2
y = 0.5x + 6
y = 0.5x ± 4.5
Write each equation in standard form.����y í 2 = 3(x í 1)
62/87,21���
����y í 5 = 6(x + 1)
62/87,21���
����y + 2 = í2(x í 5)
62/87,21���
����
62/87,21���
����
62/87,21���
����
62/87,21���
Find the slope of the line that passes through each pair of points.����(3, 4), (10, 8)
62/87,21���
����(í4, 7), (3, 5)
62/87,21���
����(3, 7), (í2, 4)
62/87,21���
����(í3, 2), (í3, 4)
62/87,21���
The slope is undefined.
If f (x) = x2 í x + 1, find each value.����f (í1)
62/87,21���
����f (5) í3
62/87,21���
����f (a)
62/87,21���
����f (b2)
62/87,21���
Graph each equation.����y = x + 2
62/87,21���To graph the equation, plot the y-intercept (0, 2). Then move up 1 unit and right 1 unit. Plot the point. Draw a line through the two points.
����x + 5y = 4
62/87,21���Write the equation in slope-intercept form. �
To graph the equation, plot the y-LQWHUFHSW�� . Then move down 1 unit and right 5 units. Plot the point. Draw a
line through the two points. �
����2x í 3y = 6
62/87,21���Write the equation in slope-intercept form. �
� To graph the equation, plot the y-intercept (0, ±2). Then move up 2 units and right 3 units. Plot the point. Draw a line through the two points. �
����5x + 2y = 6
62/87,21���Write the equation in slope-intercept form. �
� To graph the equation, plot the y-intercept (0, 3). Then move down 5 units and right 2 units. Plot the point. Draw a line through the two points. �
Another line of fit may pass through (2, 15) and (7, 25). The equation of this line of fit is y = 2x + 11. More lines of fit that come close to the points could be drawn.
eSolutions Manual - Powered by Cognero Page 18
4-6 Regression and Median-Fit Lines
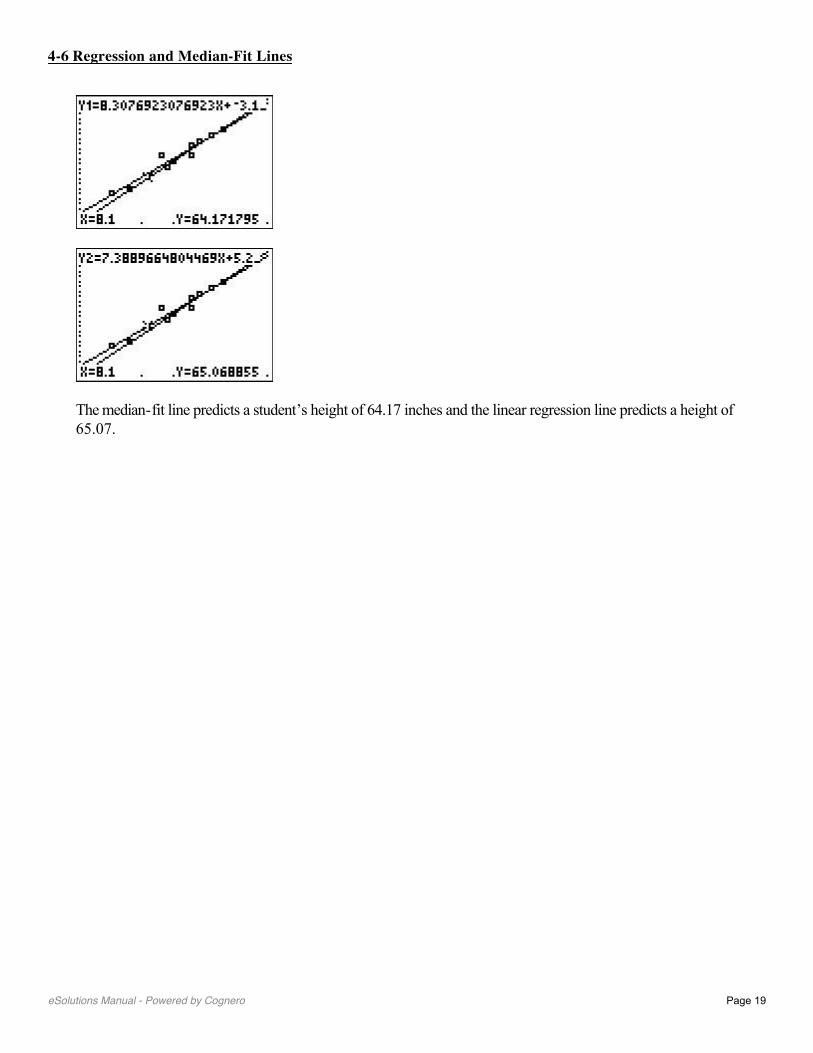
���3277(5<� $�ORFDO�XQLYHUVLW\�LV�NHHSLQJ�WUDFN�RI�WKH�QXPEHU�RI�DUW�VWXGHQWV�ZKR�XVH�WKH�SRWWHU\�VWXGLR�HDFK�GD\�� �
� a. Write an equation of the regression line and find the correlation coefficient. � b. Graph the residual plot and determine if the regression line models the data well.
62/87,21���D��Use a calculator to find the equation of the regression line. � Step 1: Enter the data by pressing STAT and selecting the EDIT option. . Enter the day into List 1 (L1). These willrepresent the x-values. Enter the number of students into List 2 (L2). These will represent the y-values. � Step 2: Perform the regression by pressing STAT �DQG�VHOHFWLQJ�WKH�CALC option. Scroll down to LinReg(ax+ b) and press ENTER. �
� Substitute the values in for a and b to write the equation of the regression line. So, the equation is y = 1.18x + 11. � Identify the value of r on the calculator to find the correlation coefficient. So, 0.7181 is the correlation coefficient. � b.�7XUQ�RQ�Plot2 under the STAT PLOT menu and choose scatter plot. Use L1 for the Xlist and RESID for the Ylist. You can obtain RESID by pressing 2nd STAT and selecting RESID from the list of names. Graph the scatter plot of the residuals by pressing ZOOM and choosing ZoomStat. �
� The residuals appear to be randomly scattered, so the regression line fits the data reasonably well. �
���&20387(56� The table below shows the percent of Americans with a broadband connection at home in a recentyear. Use linear extrapolation and a regression equation to estimate the percentage of 60-year-olds with broadband at home. �
62/87,21���Use a calculator to find the equation of the regression line.�
� y = ±0.34x + 49.48 � Substitute 60 into the equation. �
� So, about 29% of 60-year-olds have broadband at home.
���9$&$7,21� The Smiths want to rent a house on the lake that sleeps eight people. The cost of the house per night is based on how close it is to the water. �
� D�� Find and graph an equation for the median-fit line. � E�� What would you estimate is the cost of a rental 1.75 miles from the lake?
62/87,21���a. Use a calculator to find and graph the equation of the median fit line. �
y = í271.88x + 554.48
� b. To estimate the cost of a rental 1.75 miles from the lake, evaluate the equation of the median-fit line for x = 1.75.�
� An estimate of the cost of a rental 1.75 miles from the lake is $78.69.
Write an equation of the regression line for the data in each table. Then find the correlation coefficient.���6.<6&5$3(56� The table ranks the ten tallest buildings in the world. �
62/87,21���Use a calculator to find the equation of the regression line.�
� y = í2.75x + 102.53 � Use a calculator to find the correlation coefficient. � í0.6071
���086,&� 7KH�WDEOH�JLYHV�WKH�QXPEHU�RI�DQQXDO�YLROLQ�DXGLWLRQV�KHOG�E\�D�\RXWK�V\PSKRQ\�HDFK�\HDU�VLQFH��������/HW�x be the number of years since 2004. �
�
62/87,21���Use a calculator to find the equation of the regression line.�
� y = 3.54x + 19.68 � Use a calculator to find the correlation coefficient. � 0.9007
���5(7$,/� 7KH�WDEOH�JLYHV�WKH�VDOHV�RI�MHDQV�DW�D�FORWKLQJ�FKDLQ�VLQFH��������/HW�x be the number of years since ������ �
� a. Write an equation of the regression line. � b. Graph and analyze the residual plot.
62/87,21���a. Use a calculator to find the equation of the regression line. �
� The equation is about��\ = 3.32x + 5.20. � E��Use a calculator to graph the residual plot for the data. �
� The residuals appear to be randomly scattered. Therefore, the regression line fits the data well.
���0$5$7+21� 7KH�QXPEHU�RI�HQWUDQWV�LQ�WKH�%RVWRQ�0DUDWKRQ�HYHU\�ILYH�\HDUV�VLQFH������LV�VKRZQ���/HW�x be thenumber of years since 1975. �
� � D�� Find an equation for the median-fit line. � E�� According to the equation, how many entrants were there in 2003?
62/87,21���a. Let x = 0 for 1975. Use a calculator to find the equation of the median fit line. �
� y = 601.44x + 1236.13 � b. To estimate the number of entrants in 2003, evaluate the equation for the median-fit line for x = 2003 ± 1975 = 28.�
� There were about 18,076 entrants in 2003.
���&$03,1*� A campground kept a record of the number of campsites rented over the week of July 4 for several \HDUV���/HW�x be the number of years since 2000. �
� D�� Find an equation for the regression line. � E�� Predict the number of campsites that will be rented in 2012. � F�� Predict the number of campsites that will be rented in 2020.
62/87,21���a. Use a calculator to find an equation for the regression line. �
� y = 3.07x + 32.71 � b. To predict the number of campsites that will be rented in 2012, evaluate the regression equation for x = 12�
� There will be about 70 campsites rented in 2012. � c. To predict the number of campsites that will be rented in 2020, evaluate the regression equation for x = 20.�
� There will be about 94 campsites rented in 2020.
���,&(�&5($0� An ice cream company keeps a count of the tubs of cookie dough ice cream delivered to each of their stores in a particular area. ��
� D�� Find an equation for the median-fit line. � E�� Graph the points and the median-fit line. � F�� How many tubs would be delivered to a 1500-square-foot store? a 5000-square-foot store?
62/87,21���a. Use a calculator to find an equation for the median-fit line. �
� y = 0.095x í 94.58 � b. Plot the points and the equation. �
� c. To estimate the number of tubs to be delivered to a 1500-square-foot store, evaluate the regression equation for x = 1500. �
� There are about 48 tubs delivered to a 1500-square-foot store. To estimate the number of tubs to be delivered to a 5000-square-foot store, evaluate the regression equation for x = 5000. �
� There are about 380 tubs delivered to a 5000-square-foot store.
����CCSS SENSE-0$.,1*� The prices of the eight top-selling brands of jeans at Jeanie¶s Jeans are given in the table below. �
� D�� Find the equation for the regression line. � E�� According to the equation, what would be the price of a pair of the 12th best-selling brand? � F�� Is this a reasonable prediction? Explain.
62/87,21���a. Use a calculator to find an equation for the regression line. �
Step 1: Enter the data by pressing and selecting the EDIT option. Enter the sales rank into List 1 (L1). These will represent the x-values. Enter the price into List 2 (L2). These will represent the y-values. �
Step 2: Perform the regression by pressing �DQG�VHOHFWLQJ�WKH�CALC option. Scroll down to LinReg(ax+
b) and press . �
� y = 9.8x + 28.79 � b. To predict the price of a pair of the 12th bestselling brands of jeans, evaluate the regression equation for x = 12. �
� The price of a pair of the 12th bestselling brands of jeans would be about $146.39. � F�� Sample answer: No; the correlation between sales rank and price is too weak to make any reasonable prediction. The 12th bestselling brand of jeans could just as easily be a poorly made pair of jeans selling for $15.
����67$7(�)$,56� The table shows the total attendance, in millions of people, at the Minnesota State Fair from 2005 to 2009. �
� D��Graph a scatter plot of the data, where x = 1 represents 2005. Then find and graph the equation for the best-fit line. � b. Graph and analyze the residual plot. � c.��3UHGLFW�WKH�WRWDO�DWWHQGDQFH�LQ������ �
62/87,21���a. Enter the data from the table into the lists. Let x be the years starting with x = 1 for 2005 and let y = the attendence (in millions). Then graph the scatter plot. �
�
[0, 6] scl: 1 by [0, 3] scl: 0.5 � Perform the linear regression using the data in the lists. Find the equation of the best-fit line. �
� The equation is about y = 0.0326x + 1.598. � Use Y= to enter the equation into the calculator and graph the best-fit line with the scatter plot. �
[0, 6] scl: 1 by [0, 3] scl: 0.5 � b. Use the calculator to graph the residual plot for the data. �
� All the residuals appear to almost be on the line. Therefore, the regression line is a good fit for the data. � F���0HWKRG����To find the number of people in 2020, substitute 16 for x��
� Method 2: Copy the equation to the Y= list and graph. Use the value option to find the value of y when x = 16. �
[0, 17] scl: 1 by [0, 3] scl: 0.5 � 6R��WKHUH�ZLOO�EH�DERXW������PLOOLRQ�SHRSOH�LQ�������
����),5(),*+7(56� 7KH�WDEOH�VKRZV�VWDWLVWLFV�IURP�WKH�8�6��)LUH�$GPLQLVWUDWLRQ�� �
� D�� Find an equation for the median-fit line. � E�� Graph the points and the median-fit line. � F�� Does the median-fit line give you an accurate picture of the number of firefighters? Explain.
62/87,21���a. Use a calculator to find an equation for the median-fit line. �
Step 1: Enter the data by pressing and selecting the EDIT option. Enter age into List 1 (L1). These will represent the x-values. Enter the number of firefighters into List 2 (L2). These will represent the y-values. �
Step 2: Perform the regression by pressing and selecting the CALC option. Scroll down to Med-Med
and press �� �
� y = í841.42x + 223288 � b. Plot the points and graph the median fit line. �
� c. No, the median-fit line does not give an accurate picture of the number of firefighters. The points show no linear correlation; therefore a line cannot accurately portray the data.
����$7+/(7,&6� The table shows the total number of teens who participated in high school athletics in various years. �
� � D�� Find an equation for the regression line. � E�� According to the equation, how many participated in 1988?
62/87,21���a. Use a calculator to find an equation for the regression line. �
Step 1: Enter the data by pressing and selecting the EDIT option. Let the year 1970 be represented by 0. Enter the years since 1970 into List 1 (L1). These will represent the x-values. Enter the number of athletes into List 2 (L2). These will represent the y-values. �
Step 2: Perform the regression by pressing and selecting the CALC option. Scroll down to LinReg(ax+
b) and press . �
� y = 87,390.5x + 4,018,431 � b. To estimate the number of participants in 1988, evaluate the regression equation for x = 18 because 1988 is 18 years after 1970. �
� There were about 5,591,460 participants in 1988.
����$57� $�FRXQW�ZDV�NHSW�RQ�WKH�QXPEHU�RI�SDLQWLQJV�WKDW�VROG�DW�DQ�DXFWLRQ�E\�WKH�\HDU�LQ�ZKLFK�WKH\�ZHUH�SDLQWHG���Let x be the number of years since 1950. �
� D�� Find the equation for the linear regression line. � E�� How many paintings were sold that were painted in 1961? � F�� Is the linear regression equation an accurate model of the data? Explain why or why not.
62/87,21���a. 8VH�D�FDOFXODWRU�WR�ILQG�DQ�HTXDWLRQ�IRU�WKH�UHJUHVVLRQ�OLQH�� �
Step 1: Enter the data by pressing and selecting the EDIT option. Let x =0 for the year 1950.. Enter the years since 1950 into List 1 (L1). These will represent the x-values. Enter the number of painting sold into List 2 (L2). These will represent the y-values. �
Step 2: Perform the regression by pressing �DQG�VHOHFWLQJ�WKH�CALC option. Scroll down to LinReg(ax+
b) and press . � �
� y = 0.446x +9.43 � b. 7R�HVWLPDWH�WKH�QXPEHU�RI�SDLQWLQJV�VROG�LQ�������HYDOXDWH�WKH�UHJUHVVLRQ�HTXDWLRQ�IRU������ZKHQ��x =11. �
� There were about 14 paintings sold in 1961. � F�� No, the correlation coefficient is 0.48, so the linear model is not a good fit for the data. It does not appear from the data that there is a relationship between the number of paintings sold and the year they were painted.
����&&66�$5*80(176� Below are the results of the World Superpipe Championships in 2008.\ �
� � Find an equation of the regression line for each, and graph them on the same coordinate plane. Compare and contrast the men¶s and women's graphs.
62/87,21���Use a calculator to find an equation of the regression line for each set of data.� Men: y = í2.92x + 95.92 Women: y = í7x+106 � Graph the equations on the same coordinate plane. �
� The women¶s scores are typically lower than the men¶s.
����5($621,1*� For a class project, the scores that 10 randomly selected students earned on the first 8 tests of the VFKRRO�\HDU�DUH�JLYHQ��([SODLQ�KRZ�WR�ILQG�D�OLQH�RI��EHVW�ILW���&RXOG�LW�EH�XVHG�WR�SUHGLFW�WKH�VFRUHV�RI�RWKHU�VWXGHQWV"Explain your reasoning.
62/87,21���Apply a linear regression model to the data. Use the number of each test as the independent variable and the score on each test as the dependent variable. If there is no correlation, the r value will not be close to 1 or í1. If this is the case, the line of fit could not be used to predict the scores of the other students.
����23(1�(1'('� For 10 different people, measure their heights and the lengths of their heads from chin to top. Use these data to generate a linear regression equation and a median-fit equation. Make a prediction using both of the equations.
62/87,21���Student should gather and record data and use a calculator to find the equation of linear regression and a median-fit equation. Students should make predictions based on both equations. � 6DPSOH�GDWD��
� Median-fit (Store in Y1)
y = 8.31x ± 3.12 � /LQHDU�UHJUHVVLRQ���6WRUH�LQ Y2)
y = 7.39x + 5.22 � Find the height of a student with chin to top of head measure of 8.1. Use the value option from the CALC menu. Use the up arrow to move from one line to another. �
�
� The median-fit line predicts a student¶s height of 64.17 inches and the linear regression line predicts a height of 65.07.
Chin to 7RS��RI�
Head Measure Height8.8 70.99.1 72.89.3 73.87.5 61.08.4 66.37.8 62.08.5 67.38.8 68.98.3 68.78.9 71.5
����WRITING IN MATH How are lines of fit and linear regression similar? different?
62/87,21���Sample answer: Both lines of fit and linear regression are used to model data. However, you could have numerous lines of fit, while linear regression results in one line of best fit. If linear regression is used, you can also use the correlation coefficient to see how closely the model fits the data. For example, the scatter plot below displays the points (1, 10), (2, 17), (3, 15), (4, 20), (5, 28), (6, 19), and (7, 25). �
$�OLQH�RI�ILW�FRXOG�EH�GUDZQ�WKURXJK���������DQG����������7KH�HTXDWLRQ�RI�WKLV�OLQH�RI�ILW�LV�� .
� Use a calculator to find the equation of the regression line for this data. �
� The only regression line for this data has an equation of about y = 2.2x����������
����*(20(75<� Sam is putting a border around a poster. x represents the poster¶s width, and y represents the poster¶s length. Which equation represents how much border Sam will use if he doubles the length and the width? � $� 4xy � %� (x + y)4 � &� 4(x + y) � '� 16(x + y)
62/87,21���The perimeter of the room is found by . y is the length and x is the width, so . But Sam wants to double the border, so the perimeter becomes: �
� So, the correct choice is C.
����6+257�5(63216(� Tatiana wants to run 5 miles at an average pace of 9 minutes per mile. After 4 miles, her average pace is 9 minutes 10 seconds. In how many minutes must she complete the final mile to reach her goal?
62/87,21���Tatiana ran each of the first 4 miles in 10 more seconds than she planned. So to reach her goal, she must run the lastmile in 40 seconds less than she planned. 9 min ± 40 s = 8 min and 20 s.
����What is the slope of the line that passes through (1, 3) and (í3, 1)?� )� í2 �
*��
�
+��
� -� 2
62/87,21���
� So, the correct choice is H.
����What is an equation of the line that passes through (0, 1) and has a slope of 3?� $� y = 3x í 1 � %� y = 3x í 2 � &� y = 3x + 4 � '� y = 3x + 1
62/87,21���Find the y-intercept. �
� The equation is y = 3x + 1. So, the correct choice is D.
����86('�&$56� Gianna wants to buy a specific make and model of a used car. She researched prices from dealers and private sellers and made the graph shown. �
� D�� Describe the relationship in the data. � E�� Use the line of fit to predict the price of a car that is 7 years old. � F�� Is it reasonable to use this line of fit to predict the price of a 10-year old car? Explain.
62/87,21���a. Because y decreases as x increases, there is a negative correlation in the data. � b. Find x = 7 on the graph and follow the line up to the line of fit. According to the graph, the price of a car that is 7 years old would be about $3600. � c. No, it would not be reasonable to use this line of fit to predict the price of a 10-year old car, because according to the line of fit, the cost would be $0 and that doesn¶t make sense.
����*(20(75<� A quadrilateral has sides with equations y = í2x, 2x + y = 6, , and x í 2y = 9. Is the figure a rectangle? Explain your reasoning.
62/87,21���Write all of the equations in slope-intercept form. � Equation 1: y = í2x � (TXDWLRQ���� �
� (TXDWLRQ����
������������������y = x + 6 � Equation 4:� �
� Find the slope of each line �
� The slope of opposite sides are equal (±2 and ±���DQG�����DQG�������VR�WKH\�DUH�SDUDOOHO��$OVR��WKH�VORSH�RI�consecutive sides are opposite reciprocals (±2 and 0.5; and ±2 and 0.5), so they are perpendicular. So, the figure is a rectangle.
y = í2x í2y = ±2x +6 í2
y = 0.5x + 6
y = 0.5x ± 4.5
Write each equation in standard form.����y í 2 = 3(x í 1)
62/87,21���
����y í 5 = 6(x + 1)
62/87,21���
����y + 2 = í2(x í 5)
62/87,21���
����
62/87,21���
����
62/87,21���
����
62/87,21���
Find the slope of the line that passes through each pair of points.����(3, 4), (10, 8)
62/87,21���
����(í4, 7), (3, 5)
62/87,21���
����(3, 7), (í2, 4)
62/87,21���
����(í3, 2), (í3, 4)
62/87,21���
The slope is undefined.
If f (x) = x2 í x + 1, find each value.����f (í1)
62/87,21���
����f (5) í3
62/87,21���
����f (a)
62/87,21���
����f (b2)
62/87,21���
Graph each equation.����y = x + 2
62/87,21���To graph the equation, plot the y-intercept (0, 2). Then move up 1 unit and right 1 unit. Plot the point. Draw a line through the two points.
����x + 5y = 4
62/87,21���Write the equation in slope-intercept form. �
To graph the equation, plot the y-LQWHUFHSW�� . Then move down 1 unit and right 5 units. Plot the point. Draw a
line through the two points. �
����2x í 3y = 6
62/87,21���Write the equation in slope-intercept form. �
� To graph the equation, plot the y-intercept (0, ±2). Then move up 2 units and right 3 units. Plot the point. Draw a line through the two points. �
����5x + 2y = 6
62/87,21���Write the equation in slope-intercept form. �
� To graph the equation, plot the y-intercept (0, 3). Then move down 5 units and right 2 units. Plot the point. Draw a line through the two points. �
Another line of fit may pass through (2, 15) and (7, 25). The equation of this line of fit is y = 2x + 11. More lines of fit that come close to the points could be drawn.
eSolutions Manual - Powered by Cognero Page 19
4-6 Regression and Median-Fit Lines

���3277(5<� $�ORFDO�XQLYHUVLW\�LV�NHHSLQJ�WUDFN�RI�WKH�QXPEHU�RI�DUW�VWXGHQWV�ZKR�XVH�WKH�SRWWHU\�VWXGLR�HDFK�GD\�� �
� a. Write an equation of the regression line and find the correlation coefficient. � b. Graph the residual plot and determine if the regression line models the data well.
62/87,21���D��Use a calculator to find the equation of the regression line. � Step 1: Enter the data by pressing STAT and selecting the EDIT option. . Enter the day into List 1 (L1). These willrepresent the x-values. Enter the number of students into List 2 (L2). These will represent the y-values. � Step 2: Perform the regression by pressing STAT �DQG�VHOHFWLQJ�WKH�CALC option. Scroll down to LinReg(ax+ b) and press ENTER. �
� Substitute the values in for a and b to write the equation of the regression line. So, the equation is y = 1.18x + 11. � Identify the value of r on the calculator to find the correlation coefficient. So, 0.7181 is the correlation coefficient. � b.�7XUQ�RQ�Plot2 under the STAT PLOT menu and choose scatter plot. Use L1 for the Xlist and RESID for the Ylist. You can obtain RESID by pressing 2nd STAT and selecting RESID from the list of names. Graph the scatter plot of the residuals by pressing ZOOM and choosing ZoomStat. �
� The residuals appear to be randomly scattered, so the regression line fits the data reasonably well. �
���&20387(56� The table below shows the percent of Americans with a broadband connection at home in a recentyear. Use linear extrapolation and a regression equation to estimate the percentage of 60-year-olds with broadband at home. �
62/87,21���Use a calculator to find the equation of the regression line.�
� y = ±0.34x + 49.48 � Substitute 60 into the equation. �
� So, about 29% of 60-year-olds have broadband at home.
���9$&$7,21� The Smiths want to rent a house on the lake that sleeps eight people. The cost of the house per night is based on how close it is to the water. �
� D�� Find and graph an equation for the median-fit line. � E�� What would you estimate is the cost of a rental 1.75 miles from the lake?
62/87,21���a. Use a calculator to find and graph the equation of the median fit line. �
y = í271.88x + 554.48
� b. To estimate the cost of a rental 1.75 miles from the lake, evaluate the equation of the median-fit line for x = 1.75.�
� An estimate of the cost of a rental 1.75 miles from the lake is $78.69.
Write an equation of the regression line for the data in each table. Then find the correlation coefficient.���6.<6&5$3(56� The table ranks the ten tallest buildings in the world. �
62/87,21���Use a calculator to find the equation of the regression line.�
� y = í2.75x + 102.53 � Use a calculator to find the correlation coefficient. � í0.6071
���086,&� 7KH�WDEOH�JLYHV�WKH�QXPEHU�RI�DQQXDO�YLROLQ�DXGLWLRQV�KHOG�E\�D�\RXWK�V\PSKRQ\�HDFK�\HDU�VLQFH��������/HW�x be the number of years since 2004. �
�
62/87,21���Use a calculator to find the equation of the regression line.�
� y = 3.54x + 19.68 � Use a calculator to find the correlation coefficient. � 0.9007
���5(7$,/� 7KH�WDEOH�JLYHV�WKH�VDOHV�RI�MHDQV�DW�D�FORWKLQJ�FKDLQ�VLQFH��������/HW�x be the number of years since ������ �
� a. Write an equation of the regression line. � b. Graph and analyze the residual plot.
62/87,21���a. Use a calculator to find the equation of the regression line. �
� The equation is about��\ = 3.32x + 5.20. � E��Use a calculator to graph the residual plot for the data. �
� The residuals appear to be randomly scattered. Therefore, the regression line fits the data well.
���0$5$7+21� 7KH�QXPEHU�RI�HQWUDQWV�LQ�WKH�%RVWRQ�0DUDWKRQ�HYHU\�ILYH�\HDUV�VLQFH������LV�VKRZQ���/HW�x be thenumber of years since 1975. �
� � D�� Find an equation for the median-fit line. � E�� According to the equation, how many entrants were there in 2003?
62/87,21���a. Let x = 0 for 1975. Use a calculator to find the equation of the median fit line. �
� y = 601.44x + 1236.13 � b. To estimate the number of entrants in 2003, evaluate the equation for the median-fit line for x = 2003 ± 1975 = 28.�
� There were about 18,076 entrants in 2003.
���&$03,1*� A campground kept a record of the number of campsites rented over the week of July 4 for several \HDUV���/HW�x be the number of years since 2000. �
� D�� Find an equation for the regression line. � E�� Predict the number of campsites that will be rented in 2012. � F�� Predict the number of campsites that will be rented in 2020.
62/87,21���a. Use a calculator to find an equation for the regression line. �
� y = 3.07x + 32.71 � b. To predict the number of campsites that will be rented in 2012, evaluate the regression equation for x = 12�
� There will be about 70 campsites rented in 2012. � c. To predict the number of campsites that will be rented in 2020, evaluate the regression equation for x = 20.�
� There will be about 94 campsites rented in 2020.
���,&(�&5($0� An ice cream company keeps a count of the tubs of cookie dough ice cream delivered to each of their stores in a particular area. ��
� D�� Find an equation for the median-fit line. � E�� Graph the points and the median-fit line. � F�� How many tubs would be delivered to a 1500-square-foot store? a 5000-square-foot store?
62/87,21���a. Use a calculator to find an equation for the median-fit line. �
� y = 0.095x í 94.58 � b. Plot the points and the equation. �
� c. To estimate the number of tubs to be delivered to a 1500-square-foot store, evaluate the regression equation for x = 1500. �
� There are about 48 tubs delivered to a 1500-square-foot store. To estimate the number of tubs to be delivered to a 5000-square-foot store, evaluate the regression equation for x = 5000. �
� There are about 380 tubs delivered to a 5000-square-foot store.
����CCSS SENSE-0$.,1*� The prices of the eight top-selling brands of jeans at Jeanie¶s Jeans are given in the table below. �
� D�� Find the equation for the regression line. � E�� According to the equation, what would be the price of a pair of the 12th best-selling brand? � F�� Is this a reasonable prediction? Explain.
62/87,21���a. Use a calculator to find an equation for the regression line. �
Step 1: Enter the data by pressing and selecting the EDIT option. Enter the sales rank into List 1 (L1). These will represent the x-values. Enter the price into List 2 (L2). These will represent the y-values. �
Step 2: Perform the regression by pressing �DQG�VHOHFWLQJ�WKH�CALC option. Scroll down to LinReg(ax+
b) and press . �
� y = 9.8x + 28.79 � b. To predict the price of a pair of the 12th bestselling brands of jeans, evaluate the regression equation for x = 12. �
� The price of a pair of the 12th bestselling brands of jeans would be about $146.39. � F�� Sample answer: No; the correlation between sales rank and price is too weak to make any reasonable prediction. The 12th bestselling brand of jeans could just as easily be a poorly made pair of jeans selling for $15.
����67$7(�)$,56� The table shows the total attendance, in millions of people, at the Minnesota State Fair from 2005 to 2009. �
� D��Graph a scatter plot of the data, where x = 1 represents 2005. Then find and graph the equation for the best-fit line. � b. Graph and analyze the residual plot. � c.��3UHGLFW�WKH�WRWDO�DWWHQGDQFH�LQ������ �
62/87,21���a. Enter the data from the table into the lists. Let x be the years starting with x = 1 for 2005 and let y = the attendence (in millions). Then graph the scatter plot. �
�
[0, 6] scl: 1 by [0, 3] scl: 0.5 � Perform the linear regression using the data in the lists. Find the equation of the best-fit line. �
� The equation is about y = 0.0326x + 1.598. � Use Y= to enter the equation into the calculator and graph the best-fit line with the scatter plot. �
[0, 6] scl: 1 by [0, 3] scl: 0.5 � b. Use the calculator to graph the residual plot for the data. �
� All the residuals appear to almost be on the line. Therefore, the regression line is a good fit for the data. � F���0HWKRG����To find the number of people in 2020, substitute 16 for x��
� Method 2: Copy the equation to the Y= list and graph. Use the value option to find the value of y when x = 16. �
[0, 17] scl: 1 by [0, 3] scl: 0.5 � 6R��WKHUH�ZLOO�EH�DERXW������PLOOLRQ�SHRSOH�LQ�������
����),5(),*+7(56� 7KH�WDEOH�VKRZV�VWDWLVWLFV�IURP�WKH�8�6��)LUH�$GPLQLVWUDWLRQ�� �
� D�� Find an equation for the median-fit line. � E�� Graph the points and the median-fit line. � F�� Does the median-fit line give you an accurate picture of the number of firefighters? Explain.
62/87,21���a. Use a calculator to find an equation for the median-fit line. �
Step 1: Enter the data by pressing and selecting the EDIT option. Enter age into List 1 (L1). These will represent the x-values. Enter the number of firefighters into List 2 (L2). These will represent the y-values. �
Step 2: Perform the regression by pressing and selecting the CALC option. Scroll down to Med-Med
and press �� �
� y = í841.42x + 223288 � b. Plot the points and graph the median fit line. �
� c. No, the median-fit line does not give an accurate picture of the number of firefighters. The points show no linear correlation; therefore a line cannot accurately portray the data.
����$7+/(7,&6� The table shows the total number of teens who participated in high school athletics in various years. �
� � D�� Find an equation for the regression line. � E�� According to the equation, how many participated in 1988?
62/87,21���a. Use a calculator to find an equation for the regression line. �
Step 1: Enter the data by pressing and selecting the EDIT option. Let the year 1970 be represented by 0. Enter the years since 1970 into List 1 (L1). These will represent the x-values. Enter the number of athletes into List 2 (L2). These will represent the y-values. �
Step 2: Perform the regression by pressing and selecting the CALC option. Scroll down to LinReg(ax+
b) and press . �
� y = 87,390.5x + 4,018,431 � b. To estimate the number of participants in 1988, evaluate the regression equation for x = 18 because 1988 is 18 years after 1970. �
� There were about 5,591,460 participants in 1988.
����$57� $�FRXQW�ZDV�NHSW�RQ�WKH�QXPEHU�RI�SDLQWLQJV�WKDW�VROG�DW�DQ�DXFWLRQ�E\�WKH�\HDU�LQ�ZKLFK�WKH\�ZHUH�SDLQWHG���Let x be the number of years since 1950. �
� D�� Find the equation for the linear regression line. � E�� How many paintings were sold that were painted in 1961? � F�� Is the linear regression equation an accurate model of the data? Explain why or why not.
62/87,21���a. 8VH�D�FDOFXODWRU�WR�ILQG�DQ�HTXDWLRQ�IRU�WKH�UHJUHVVLRQ�OLQH�� �
Step 1: Enter the data by pressing and selecting the EDIT option. Let x =0 for the year 1950.. Enter the years since 1950 into List 1 (L1). These will represent the x-values. Enter the number of painting sold into List 2 (L2). These will represent the y-values. �
Step 2: Perform the regression by pressing �DQG�VHOHFWLQJ�WKH�CALC option. Scroll down to LinReg(ax+
b) and press . � �
� y = 0.446x +9.43 � b. 7R�HVWLPDWH�WKH�QXPEHU�RI�SDLQWLQJV�VROG�LQ�������HYDOXDWH�WKH�UHJUHVVLRQ�HTXDWLRQ�IRU������ZKHQ��x =11. �
� There were about 14 paintings sold in 1961. � F�� No, the correlation coefficient is 0.48, so the linear model is not a good fit for the data. It does not appear from the data that there is a relationship between the number of paintings sold and the year they were painted.
����&&66�$5*80(176� Below are the results of the World Superpipe Championships in 2008.\ �
� � Find an equation of the regression line for each, and graph them on the same coordinate plane. Compare and contrast the men¶s and women's graphs.
62/87,21���Use a calculator to find an equation of the regression line for each set of data.� Men: y = í2.92x + 95.92 Women: y = í7x+106 � Graph the equations on the same coordinate plane. �
� The women¶s scores are typically lower than the men¶s.
����5($621,1*� For a class project, the scores that 10 randomly selected students earned on the first 8 tests of the VFKRRO�\HDU�DUH�JLYHQ��([SODLQ�KRZ�WR�ILQG�D�OLQH�RI��EHVW�ILW���&RXOG�LW�EH�XVHG�WR�SUHGLFW�WKH�VFRUHV�RI�RWKHU�VWXGHQWV"Explain your reasoning.
62/87,21���Apply a linear regression model to the data. Use the number of each test as the independent variable and the score on each test as the dependent variable. If there is no correlation, the r value will not be close to 1 or í1. If this is the case, the line of fit could not be used to predict the scores of the other students.
����23(1�(1'('� For 10 different people, measure their heights and the lengths of their heads from chin to top. Use these data to generate a linear regression equation and a median-fit equation. Make a prediction using both of the equations.
62/87,21���Student should gather and record data and use a calculator to find the equation of linear regression and a median-fit equation. Students should make predictions based on both equations. � 6DPSOH�GDWD��
� Median-fit (Store in Y1)
y = 8.31x ± 3.12 � /LQHDU�UHJUHVVLRQ���6WRUH�LQ Y2)
y = 7.39x + 5.22 � Find the height of a student with chin to top of head measure of 8.1. Use the value option from the CALC menu. Use the up arrow to move from one line to another. �
�
� The median-fit line predicts a student¶s height of 64.17 inches and the linear regression line predicts a height of 65.07.
Chin to 7RS��RI�
Head Measure Height8.8 70.99.1 72.89.3 73.87.5 61.08.4 66.37.8 62.08.5 67.38.8 68.98.3 68.78.9 71.5
����WRITING IN MATH How are lines of fit and linear regression similar? different?
62/87,21���Sample answer: Both lines of fit and linear regression are used to model data. However, you could have numerous lines of fit, while linear regression results in one line of best fit. If linear regression is used, you can also use the correlation coefficient to see how closely the model fits the data. For example, the scatter plot below displays the points (1, 10), (2, 17), (3, 15), (4, 20), (5, 28), (6, 19), and (7, 25). �
$�OLQH�RI�ILW�FRXOG�EH�GUDZQ�WKURXJK���������DQG����������7KH�HTXDWLRQ�RI�WKLV�OLQH�RI�ILW�LV�� .
� Use a calculator to find the equation of the regression line for this data. �
� The only regression line for this data has an equation of about y = 2.2x����������
����*(20(75<� Sam is putting a border around a poster. x represents the poster¶s width, and y represents the poster¶s length. Which equation represents how much border Sam will use if he doubles the length and the width? � $� 4xy � %� (x + y)4 � &� 4(x + y) � '� 16(x + y)
62/87,21���The perimeter of the room is found by . y is the length and x is the width, so . But Sam wants to double the border, so the perimeter becomes: �
� So, the correct choice is C.
����6+257�5(63216(� Tatiana wants to run 5 miles at an average pace of 9 minutes per mile. After 4 miles, her average pace is 9 minutes 10 seconds. In how many minutes must she complete the final mile to reach her goal?
62/87,21���Tatiana ran each of the first 4 miles in 10 more seconds than she planned. So to reach her goal, she must run the lastmile in 40 seconds less than she planned. 9 min ± 40 s = 8 min and 20 s.
����What is the slope of the line that passes through (1, 3) and (í3, 1)?� )� í2 �
*��
�
+��
� -� 2
62/87,21���
� So, the correct choice is H.
����What is an equation of the line that passes through (0, 1) and has a slope of 3?� $� y = 3x í 1 � %� y = 3x í 2 � &� y = 3x + 4 � '� y = 3x + 1
62/87,21���Find the y-intercept. �
� The equation is y = 3x + 1. So, the correct choice is D.
����86('�&$56� Gianna wants to buy a specific make and model of a used car. She researched prices from dealers and private sellers and made the graph shown. �
� D�� Describe the relationship in the data. � E�� Use the line of fit to predict the price of a car that is 7 years old. � F�� Is it reasonable to use this line of fit to predict the price of a 10-year old car? Explain.
62/87,21���a. Because y decreases as x increases, there is a negative correlation in the data. � b. Find x = 7 on the graph and follow the line up to the line of fit. According to the graph, the price of a car that is 7 years old would be about $3600. � c. No, it would not be reasonable to use this line of fit to predict the price of a 10-year old car, because according to the line of fit, the cost would be $0 and that doesn¶t make sense.
����*(20(75<� A quadrilateral has sides with equations y = í2x, 2x + y = 6, , and x í 2y = 9. Is the figure a rectangle? Explain your reasoning.
62/87,21���Write all of the equations in slope-intercept form. � Equation 1: y = í2x � (TXDWLRQ���� �
� (TXDWLRQ����
������������������y = x + 6 � Equation 4:� �
� Find the slope of each line �
� The slope of opposite sides are equal (±2 and ±���DQG�����DQG�������VR�WKH\�DUH�SDUDOOHO��$OVR��WKH�VORSH�RI�consecutive sides are opposite reciprocals (±2 and 0.5; and ±2 and 0.5), so they are perpendicular. So, the figure is a rectangle.
y = í2x í2y = ±2x +6 í2
y = 0.5x + 6
y = 0.5x ± 4.5
Write each equation in standard form.����y í 2 = 3(x í 1)
62/87,21���
����y í 5 = 6(x + 1)
62/87,21���
����y + 2 = í2(x í 5)
62/87,21���
����
62/87,21���
����
62/87,21���
����
62/87,21���
Find the slope of the line that passes through each pair of points.����(3, 4), (10, 8)
62/87,21���
����(í4, 7), (3, 5)
62/87,21���
����(3, 7), (í2, 4)
62/87,21���
����(í3, 2), (í3, 4)
62/87,21���
The slope is undefined.
If f (x) = x2 í x + 1, find each value.����f (í1)
62/87,21���
����f (5) í3
62/87,21���
����f (a)
62/87,21���
����f (b2)
62/87,21���
Graph each equation.����y = x + 2
62/87,21���To graph the equation, plot the y-intercept (0, 2). Then move up 1 unit and right 1 unit. Plot the point. Draw a line through the two points.
����x + 5y = 4
62/87,21���Write the equation in slope-intercept form. �
To graph the equation, plot the y-LQWHUFHSW�� . Then move down 1 unit and right 5 units. Plot the point. Draw a
line through the two points. �
����2x í 3y = 6
62/87,21���Write the equation in slope-intercept form. �
� To graph the equation, plot the y-intercept (0, ±2). Then move up 2 units and right 3 units. Plot the point. Draw a line through the two points. �
����5x + 2y = 6
62/87,21���Write the equation in slope-intercept form. �
� To graph the equation, plot the y-intercept (0, 3). Then move down 5 units and right 2 units. Plot the point. Draw a line through the two points. �
Another line of fit may pass through (2, 15) and (7, 25). The equation of this line of fit is y = 2x + 11. More lines of fit that come close to the points could be drawn.
eSolutions Manual - Powered by Cognero Page 20
4-6 Regression and Median-Fit Lines

���3277(5<� $�ORFDO�XQLYHUVLW\�LV�NHHSLQJ�WUDFN�RI�WKH�QXPEHU�RI�DUW�VWXGHQWV�ZKR�XVH�WKH�SRWWHU\�VWXGLR�HDFK�GD\�� �
� a. Write an equation of the regression line and find the correlation coefficient. � b. Graph the residual plot and determine if the regression line models the data well.
62/87,21���D��Use a calculator to find the equation of the regression line. � Step 1: Enter the data by pressing STAT and selecting the EDIT option. . Enter the day into List 1 (L1). These willrepresent the x-values. Enter the number of students into List 2 (L2). These will represent the y-values. � Step 2: Perform the regression by pressing STAT �DQG�VHOHFWLQJ�WKH�CALC option. Scroll down to LinReg(ax+ b) and press ENTER. �
� Substitute the values in for a and b to write the equation of the regression line. So, the equation is y = 1.18x + 11. � Identify the value of r on the calculator to find the correlation coefficient. So, 0.7181 is the correlation coefficient. � b.�7XUQ�RQ�Plot2 under the STAT PLOT menu and choose scatter plot. Use L1 for the Xlist and RESID for the Ylist. You can obtain RESID by pressing 2nd STAT and selecting RESID from the list of names. Graph the scatter plot of the residuals by pressing ZOOM and choosing ZoomStat. �
� The residuals appear to be randomly scattered, so the regression line fits the data reasonably well. �
���&20387(56� The table below shows the percent of Americans with a broadband connection at home in a recentyear. Use linear extrapolation and a regression equation to estimate the percentage of 60-year-olds with broadband at home. �
62/87,21���Use a calculator to find the equation of the regression line.�
� y = ±0.34x + 49.48 � Substitute 60 into the equation. �
� So, about 29% of 60-year-olds have broadband at home.
���9$&$7,21� The Smiths want to rent a house on the lake that sleeps eight people. The cost of the house per night is based on how close it is to the water. �
� D�� Find and graph an equation for the median-fit line. � E�� What would you estimate is the cost of a rental 1.75 miles from the lake?
62/87,21���a. Use a calculator to find and graph the equation of the median fit line. �
y = í271.88x + 554.48
� b. To estimate the cost of a rental 1.75 miles from the lake, evaluate the equation of the median-fit line for x = 1.75.�
� An estimate of the cost of a rental 1.75 miles from the lake is $78.69.
Write an equation of the regression line for the data in each table. Then find the correlation coefficient.���6.<6&5$3(56� The table ranks the ten tallest buildings in the world. �
62/87,21���Use a calculator to find the equation of the regression line.�
� y = í2.75x + 102.53 � Use a calculator to find the correlation coefficient. � í0.6071
���086,&� 7KH�WDEOH�JLYHV�WKH�QXPEHU�RI�DQQXDO�YLROLQ�DXGLWLRQV�KHOG�E\�D�\RXWK�V\PSKRQ\�HDFK�\HDU�VLQFH��������/HW�x be the number of years since 2004. �
�
62/87,21���Use a calculator to find the equation of the regression line.�
� y = 3.54x + 19.68 � Use a calculator to find the correlation coefficient. � 0.9007
���5(7$,/� 7KH�WDEOH�JLYHV�WKH�VDOHV�RI�MHDQV�DW�D�FORWKLQJ�FKDLQ�VLQFH��������/HW�x be the number of years since ������ �
� a. Write an equation of the regression line. � b. Graph and analyze the residual plot.
62/87,21���a. Use a calculator to find the equation of the regression line. �
� The equation is about��\ = 3.32x + 5.20. � E��Use a calculator to graph the residual plot for the data. �
� The residuals appear to be randomly scattered. Therefore, the regression line fits the data well.
���0$5$7+21� 7KH�QXPEHU�RI�HQWUDQWV�LQ�WKH�%RVWRQ�0DUDWKRQ�HYHU\�ILYH�\HDUV�VLQFH������LV�VKRZQ���/HW�x be thenumber of years since 1975. �
� � D�� Find an equation for the median-fit line. � E�� According to the equation, how many entrants were there in 2003?
62/87,21���a. Let x = 0 for 1975. Use a calculator to find the equation of the median fit line. �
� y = 601.44x + 1236.13 � b. To estimate the number of entrants in 2003, evaluate the equation for the median-fit line for x = 2003 ± 1975 = 28.�
� There were about 18,076 entrants in 2003.
���&$03,1*� A campground kept a record of the number of campsites rented over the week of July 4 for several \HDUV���/HW�x be the number of years since 2000. �
� D�� Find an equation for the regression line. � E�� Predict the number of campsites that will be rented in 2012. � F�� Predict the number of campsites that will be rented in 2020.
62/87,21���a. Use a calculator to find an equation for the regression line. �
� y = 3.07x + 32.71 � b. To predict the number of campsites that will be rented in 2012, evaluate the regression equation for x = 12�
� There will be about 70 campsites rented in 2012. � c. To predict the number of campsites that will be rented in 2020, evaluate the regression equation for x = 20.�
� There will be about 94 campsites rented in 2020.
���,&(�&5($0� An ice cream company keeps a count of the tubs of cookie dough ice cream delivered to each of their stores in a particular area. ��
� D�� Find an equation for the median-fit line. � E�� Graph the points and the median-fit line. � F�� How many tubs would be delivered to a 1500-square-foot store? a 5000-square-foot store?
62/87,21���a. Use a calculator to find an equation for the median-fit line. �
� y = 0.095x í 94.58 � b. Plot the points and the equation. �
� c. To estimate the number of tubs to be delivered to a 1500-square-foot store, evaluate the regression equation for x = 1500. �
� There are about 48 tubs delivered to a 1500-square-foot store. To estimate the number of tubs to be delivered to a 5000-square-foot store, evaluate the regression equation for x = 5000. �
� There are about 380 tubs delivered to a 5000-square-foot store.
����CCSS SENSE-0$.,1*� The prices of the eight top-selling brands of jeans at Jeanie¶s Jeans are given in the table below. �
� D�� Find the equation for the regression line. � E�� According to the equation, what would be the price of a pair of the 12th best-selling brand? � F�� Is this a reasonable prediction? Explain.
62/87,21���a. Use a calculator to find an equation for the regression line. �
Step 1: Enter the data by pressing and selecting the EDIT option. Enter the sales rank into List 1 (L1). These will represent the x-values. Enter the price into List 2 (L2). These will represent the y-values. �
Step 2: Perform the regression by pressing �DQG�VHOHFWLQJ�WKH�CALC option. Scroll down to LinReg(ax+
b) and press . �
� y = 9.8x + 28.79 � b. To predict the price of a pair of the 12th bestselling brands of jeans, evaluate the regression equation for x = 12. �
� The price of a pair of the 12th bestselling brands of jeans would be about $146.39. � F�� Sample answer: No; the correlation between sales rank and price is too weak to make any reasonable prediction. The 12th bestselling brand of jeans could just as easily be a poorly made pair of jeans selling for $15.
����67$7(�)$,56� The table shows the total attendance, in millions of people, at the Minnesota State Fair from 2005 to 2009. �
� D��Graph a scatter plot of the data, where x = 1 represents 2005. Then find and graph the equation for the best-fit line. � b. Graph and analyze the residual plot. � c.��3UHGLFW�WKH�WRWDO�DWWHQGDQFH�LQ������ �
62/87,21���a. Enter the data from the table into the lists. Let x be the years starting with x = 1 for 2005 and let y = the attendence (in millions). Then graph the scatter plot. �
�
[0, 6] scl: 1 by [0, 3] scl: 0.5 � Perform the linear regression using the data in the lists. Find the equation of the best-fit line. �
� The equation is about y = 0.0326x + 1.598. � Use Y= to enter the equation into the calculator and graph the best-fit line with the scatter plot. �
[0, 6] scl: 1 by [0, 3] scl: 0.5 � b. Use the calculator to graph the residual plot for the data. �
� All the residuals appear to almost be on the line. Therefore, the regression line is a good fit for the data. � F���0HWKRG����To find the number of people in 2020, substitute 16 for x��
� Method 2: Copy the equation to the Y= list and graph. Use the value option to find the value of y when x = 16. �
[0, 17] scl: 1 by [0, 3] scl: 0.5 � 6R��WKHUH�ZLOO�EH�DERXW������PLOOLRQ�SHRSOH�LQ�������
����),5(),*+7(56� 7KH�WDEOH�VKRZV�VWDWLVWLFV�IURP�WKH�8�6��)LUH�$GPLQLVWUDWLRQ�� �
� D�� Find an equation for the median-fit line. � E�� Graph the points and the median-fit line. � F�� Does the median-fit line give you an accurate picture of the number of firefighters? Explain.
62/87,21���a. Use a calculator to find an equation for the median-fit line. �
Step 1: Enter the data by pressing and selecting the EDIT option. Enter age into List 1 (L1). These will represent the x-values. Enter the number of firefighters into List 2 (L2). These will represent the y-values. �
Step 2: Perform the regression by pressing and selecting the CALC option. Scroll down to Med-Med
and press �� �
� y = í841.42x + 223288 � b. Plot the points and graph the median fit line. �
� c. No, the median-fit line does not give an accurate picture of the number of firefighters. The points show no linear correlation; therefore a line cannot accurately portray the data.
����$7+/(7,&6� The table shows the total number of teens who participated in high school athletics in various years. �
� � D�� Find an equation for the regression line. � E�� According to the equation, how many participated in 1988?
62/87,21���a. Use a calculator to find an equation for the regression line. �
Step 1: Enter the data by pressing and selecting the EDIT option. Let the year 1970 be represented by 0. Enter the years since 1970 into List 1 (L1). These will represent the x-values. Enter the number of athletes into List 2 (L2). These will represent the y-values. �
Step 2: Perform the regression by pressing and selecting the CALC option. Scroll down to LinReg(ax+
b) and press . �
� y = 87,390.5x + 4,018,431 � b. To estimate the number of participants in 1988, evaluate the regression equation for x = 18 because 1988 is 18 years after 1970. �
� There were about 5,591,460 participants in 1988.
����$57� $�FRXQW�ZDV�NHSW�RQ�WKH�QXPEHU�RI�SDLQWLQJV�WKDW�VROG�DW�DQ�DXFWLRQ�E\�WKH�\HDU�LQ�ZKLFK�WKH\�ZHUH�SDLQWHG���Let x be the number of years since 1950. �
� D�� Find the equation for the linear regression line. � E�� How many paintings were sold that were painted in 1961? � F�� Is the linear regression equation an accurate model of the data? Explain why or why not.
62/87,21���a. 8VH�D�FDOFXODWRU�WR�ILQG�DQ�HTXDWLRQ�IRU�WKH�UHJUHVVLRQ�OLQH�� �
Step 1: Enter the data by pressing and selecting the EDIT option. Let x =0 for the year 1950.. Enter the years since 1950 into List 1 (L1). These will represent the x-values. Enter the number of painting sold into List 2 (L2). These will represent the y-values. �
Step 2: Perform the regression by pressing �DQG�VHOHFWLQJ�WKH�CALC option. Scroll down to LinReg(ax+
b) and press . � �
� y = 0.446x +9.43 � b. 7R�HVWLPDWH�WKH�QXPEHU�RI�SDLQWLQJV�VROG�LQ�������HYDOXDWH�WKH�UHJUHVVLRQ�HTXDWLRQ�IRU������ZKHQ��x =11. �
� There were about 14 paintings sold in 1961. � F�� No, the correlation coefficient is 0.48, so the linear model is not a good fit for the data. It does not appear from the data that there is a relationship between the number of paintings sold and the year they were painted.
����&&66�$5*80(176� Below are the results of the World Superpipe Championships in 2008.\ �
� � Find an equation of the regression line for each, and graph them on the same coordinate plane. Compare and contrast the men¶s and women's graphs.
62/87,21���Use a calculator to find an equation of the regression line for each set of data.� Men: y = í2.92x + 95.92 Women: y = í7x+106 � Graph the equations on the same coordinate plane. �
� The women¶s scores are typically lower than the men¶s.
����5($621,1*� For a class project, the scores that 10 randomly selected students earned on the first 8 tests of the VFKRRO�\HDU�DUH�JLYHQ��([SODLQ�KRZ�WR�ILQG�D�OLQH�RI��EHVW�ILW���&RXOG�LW�EH�XVHG�WR�SUHGLFW�WKH�VFRUHV�RI�RWKHU�VWXGHQWV"Explain your reasoning.
62/87,21���Apply a linear regression model to the data. Use the number of each test as the independent variable and the score on each test as the dependent variable. If there is no correlation, the r value will not be close to 1 or í1. If this is the case, the line of fit could not be used to predict the scores of the other students.
����23(1�(1'('� For 10 different people, measure their heights and the lengths of their heads from chin to top. Use these data to generate a linear regression equation and a median-fit equation. Make a prediction using both of the equations.
62/87,21���Student should gather and record data and use a calculator to find the equation of linear regression and a median-fit equation. Students should make predictions based on both equations. � 6DPSOH�GDWD��
� Median-fit (Store in Y1)
y = 8.31x ± 3.12 � /LQHDU�UHJUHVVLRQ���6WRUH�LQ Y2)
y = 7.39x + 5.22 � Find the height of a student with chin to top of head measure of 8.1. Use the value option from the CALC menu. Use the up arrow to move from one line to another. �
�
� The median-fit line predicts a student¶s height of 64.17 inches and the linear regression line predicts a height of 65.07.
Chin to 7RS��RI�
Head Measure Height8.8 70.99.1 72.89.3 73.87.5 61.08.4 66.37.8 62.08.5 67.38.8 68.98.3 68.78.9 71.5
����WRITING IN MATH How are lines of fit and linear regression similar? different?
62/87,21���Sample answer: Both lines of fit and linear regression are used to model data. However, you could have numerous lines of fit, while linear regression results in one line of best fit. If linear regression is used, you can also use the correlation coefficient to see how closely the model fits the data. For example, the scatter plot below displays the points (1, 10), (2, 17), (3, 15), (4, 20), (5, 28), (6, 19), and (7, 25). �
$�OLQH�RI�ILW�FRXOG�EH�GUDZQ�WKURXJK���������DQG����������7KH�HTXDWLRQ�RI�WKLV�OLQH�RI�ILW�LV�� .
� Use a calculator to find the equation of the regression line for this data. �
� The only regression line for this data has an equation of about y = 2.2x����������
����*(20(75<� Sam is putting a border around a poster. x represents the poster¶s width, and y represents the poster¶s length. Which equation represents how much border Sam will use if he doubles the length and the width? � $� 4xy � %� (x + y)4 � &� 4(x + y) � '� 16(x + y)
62/87,21���The perimeter of the room is found by . y is the length and x is the width, so . But Sam wants to double the border, so the perimeter becomes: �
� So, the correct choice is C.
����6+257�5(63216(� Tatiana wants to run 5 miles at an average pace of 9 minutes per mile. After 4 miles, her average pace is 9 minutes 10 seconds. In how many minutes must she complete the final mile to reach her goal?
62/87,21���Tatiana ran each of the first 4 miles in 10 more seconds than she planned. So to reach her goal, she must run the lastmile in 40 seconds less than she planned. 9 min ± 40 s = 8 min and 20 s.
����What is the slope of the line that passes through (1, 3) and (í3, 1)?� )� í2 �
*��
�
+��
� -� 2
62/87,21���
� So, the correct choice is H.
����What is an equation of the line that passes through (0, 1) and has a slope of 3?� $� y = 3x í 1 � %� y = 3x í 2 � &� y = 3x + 4 � '� y = 3x + 1
62/87,21���Find the y-intercept. �
� The equation is y = 3x + 1. So, the correct choice is D.
����86('�&$56� Gianna wants to buy a specific make and model of a used car. She researched prices from dealers and private sellers and made the graph shown. �
� D�� Describe the relationship in the data. � E�� Use the line of fit to predict the price of a car that is 7 years old. � F�� Is it reasonable to use this line of fit to predict the price of a 10-year old car? Explain.
62/87,21���a. Because y decreases as x increases, there is a negative correlation in the data. � b. Find x = 7 on the graph and follow the line up to the line of fit. According to the graph, the price of a car that is 7 years old would be about $3600. � c. No, it would not be reasonable to use this line of fit to predict the price of a 10-year old car, because according to the line of fit, the cost would be $0 and that doesn¶t make sense.
����*(20(75<� A quadrilateral has sides with equations y = í2x, 2x + y = 6, , and x í 2y = 9. Is the figure a rectangle? Explain your reasoning.
62/87,21���Write all of the equations in slope-intercept form. � Equation 1: y = í2x � (TXDWLRQ���� �
� (TXDWLRQ����
������������������y = x + 6 � Equation 4:� �
� Find the slope of each line �
� The slope of opposite sides are equal (±2 and ±���DQG�����DQG�������VR�WKH\�DUH�SDUDOOHO��$OVR��WKH�VORSH�RI�consecutive sides are opposite reciprocals (±2 and 0.5; and ±2 and 0.5), so they are perpendicular. So, the figure is a rectangle.
y = í2x í2y = ±2x +6 í2
y = 0.5x + 6
y = 0.5x ± 4.5
Write each equation in standard form.����y í 2 = 3(x í 1)
62/87,21���
����y í 5 = 6(x + 1)
62/87,21���
����y + 2 = í2(x í 5)
62/87,21���
����
62/87,21���
����
62/87,21���
����
62/87,21���
Find the slope of the line that passes through each pair of points.����(3, 4), (10, 8)
62/87,21���
����(í4, 7), (3, 5)
62/87,21���
����(3, 7), (í2, 4)
62/87,21���
����(í3, 2), (í3, 4)
62/87,21���
The slope is undefined.
If f (x) = x2 í x + 1, find each value.����f (í1)
62/87,21���
����f (5) í3
62/87,21���
����f (a)
62/87,21���
����f (b2)
62/87,21���
Graph each equation.����y = x + 2
62/87,21���To graph the equation, plot the y-intercept (0, 2). Then move up 1 unit and right 1 unit. Plot the point. Draw a line through the two points.
����x + 5y = 4
62/87,21���Write the equation in slope-intercept form. �
To graph the equation, plot the y-LQWHUFHSW�� . Then move down 1 unit and right 5 units. Plot the point. Draw a
line through the two points. �
����2x í 3y = 6
62/87,21���Write the equation in slope-intercept form. �
� To graph the equation, plot the y-intercept (0, ±2). Then move up 2 units and right 3 units. Plot the point. Draw a line through the two points. �
����5x + 2y = 6
62/87,21���Write the equation in slope-intercept form. �
� To graph the equation, plot the y-intercept (0, 3). Then move down 5 units and right 2 units. Plot the point. Draw a line through the two points. �
Another line of fit may pass through (2, 15) and (7, 25). The equation of this line of fit is y = 2x + 11. More lines of fit that come close to the points could be drawn.
eSolutions Manual - Powered by Cognero Page 21
4-6 Regression and Median-Fit Lines

���3277(5<� $�ORFDO�XQLYHUVLW\�LV�NHHSLQJ�WUDFN�RI�WKH�QXPEHU�RI�DUW�VWXGHQWV�ZKR�XVH�WKH�SRWWHU\�VWXGLR�HDFK�GD\�� �
� a. Write an equation of the regression line and find the correlation coefficient. � b. Graph the residual plot and determine if the regression line models the data well.
62/87,21���D��Use a calculator to find the equation of the regression line. � Step 1: Enter the data by pressing STAT and selecting the EDIT option. . Enter the day into List 1 (L1). These willrepresent the x-values. Enter the number of students into List 2 (L2). These will represent the y-values. � Step 2: Perform the regression by pressing STAT �DQG�VHOHFWLQJ�WKH�CALC option. Scroll down to LinReg(ax+ b) and press ENTER. �
� Substitute the values in for a and b to write the equation of the regression line. So, the equation is y = 1.18x + 11. � Identify the value of r on the calculator to find the correlation coefficient. So, 0.7181 is the correlation coefficient. � b.�7XUQ�RQ�Plot2 under the STAT PLOT menu and choose scatter plot. Use L1 for the Xlist and RESID for the Ylist. You can obtain RESID by pressing 2nd STAT and selecting RESID from the list of names. Graph the scatter plot of the residuals by pressing ZOOM and choosing ZoomStat. �
� The residuals appear to be randomly scattered, so the regression line fits the data reasonably well. �
���&20387(56� The table below shows the percent of Americans with a broadband connection at home in a recentyear. Use linear extrapolation and a regression equation to estimate the percentage of 60-year-olds with broadband at home. �
62/87,21���Use a calculator to find the equation of the regression line.�
� y = ±0.34x + 49.48 � Substitute 60 into the equation. �
� So, about 29% of 60-year-olds have broadband at home.
���9$&$7,21� The Smiths want to rent a house on the lake that sleeps eight people. The cost of the house per night is based on how close it is to the water. �
� D�� Find and graph an equation for the median-fit line. � E�� What would you estimate is the cost of a rental 1.75 miles from the lake?
62/87,21���a. Use a calculator to find and graph the equation of the median fit line. �
y = í271.88x + 554.48
� b. To estimate the cost of a rental 1.75 miles from the lake, evaluate the equation of the median-fit line for x = 1.75.�
� An estimate of the cost of a rental 1.75 miles from the lake is $78.69.
Write an equation of the regression line for the data in each table. Then find the correlation coefficient.���6.<6&5$3(56� The table ranks the ten tallest buildings in the world. �
62/87,21���Use a calculator to find the equation of the regression line.�
� y = í2.75x + 102.53 � Use a calculator to find the correlation coefficient. � í0.6071
���086,&� 7KH�WDEOH�JLYHV�WKH�QXPEHU�RI�DQQXDO�YLROLQ�DXGLWLRQV�KHOG�E\�D�\RXWK�V\PSKRQ\�HDFK�\HDU�VLQFH��������/HW�x be the number of years since 2004. �
�
62/87,21���Use a calculator to find the equation of the regression line.�
� y = 3.54x + 19.68 � Use a calculator to find the correlation coefficient. � 0.9007
���5(7$,/� 7KH�WDEOH�JLYHV�WKH�VDOHV�RI�MHDQV�DW�D�FORWKLQJ�FKDLQ�VLQFH��������/HW�x be the number of years since ������ �
� a. Write an equation of the regression line. � b. Graph and analyze the residual plot.
62/87,21���a. Use a calculator to find the equation of the regression line. �
� The equation is about��\ = 3.32x + 5.20. � E��Use a calculator to graph the residual plot for the data. �
� The residuals appear to be randomly scattered. Therefore, the regression line fits the data well.
���0$5$7+21� 7KH�QXPEHU�RI�HQWUDQWV�LQ�WKH�%RVWRQ�0DUDWKRQ�HYHU\�ILYH�\HDUV�VLQFH������LV�VKRZQ���/HW�x be thenumber of years since 1975. �
� � D�� Find an equation for the median-fit line. � E�� According to the equation, how many entrants were there in 2003?
62/87,21���a. Let x = 0 for 1975. Use a calculator to find the equation of the median fit line. �
� y = 601.44x + 1236.13 � b. To estimate the number of entrants in 2003, evaluate the equation for the median-fit line for x = 2003 ± 1975 = 28.�
� There were about 18,076 entrants in 2003.
���&$03,1*� A campground kept a record of the number of campsites rented over the week of July 4 for several \HDUV���/HW�x be the number of years since 2000. �
� D�� Find an equation for the regression line. � E�� Predict the number of campsites that will be rented in 2012. � F�� Predict the number of campsites that will be rented in 2020.
62/87,21���a. Use a calculator to find an equation for the regression line. �
� y = 3.07x + 32.71 � b. To predict the number of campsites that will be rented in 2012, evaluate the regression equation for x = 12�
� There will be about 70 campsites rented in 2012. � c. To predict the number of campsites that will be rented in 2020, evaluate the regression equation for x = 20.�
� There will be about 94 campsites rented in 2020.
���,&(�&5($0� An ice cream company keeps a count of the tubs of cookie dough ice cream delivered to each of their stores in a particular area. ��
� D�� Find an equation for the median-fit line. � E�� Graph the points and the median-fit line. � F�� How many tubs would be delivered to a 1500-square-foot store? a 5000-square-foot store?
62/87,21���a. Use a calculator to find an equation for the median-fit line. �
� y = 0.095x í 94.58 � b. Plot the points and the equation. �
� c. To estimate the number of tubs to be delivered to a 1500-square-foot store, evaluate the regression equation for x = 1500. �
� There are about 48 tubs delivered to a 1500-square-foot store. To estimate the number of tubs to be delivered to a 5000-square-foot store, evaluate the regression equation for x = 5000. �
� There are about 380 tubs delivered to a 5000-square-foot store.
����CCSS SENSE-0$.,1*� The prices of the eight top-selling brands of jeans at Jeanie¶s Jeans are given in the table below. �
� D�� Find the equation for the regression line. � E�� According to the equation, what would be the price of a pair of the 12th best-selling brand? � F�� Is this a reasonable prediction? Explain.
62/87,21���a. Use a calculator to find an equation for the regression line. �
Step 1: Enter the data by pressing and selecting the EDIT option. Enter the sales rank into List 1 (L1). These will represent the x-values. Enter the price into List 2 (L2). These will represent the y-values. �
Step 2: Perform the regression by pressing �DQG�VHOHFWLQJ�WKH�CALC option. Scroll down to LinReg(ax+
b) and press . �
� y = 9.8x + 28.79 � b. To predict the price of a pair of the 12th bestselling brands of jeans, evaluate the regression equation for x = 12. �
� The price of a pair of the 12th bestselling brands of jeans would be about $146.39. � F�� Sample answer: No; the correlation between sales rank and price is too weak to make any reasonable prediction. The 12th bestselling brand of jeans could just as easily be a poorly made pair of jeans selling for $15.
����67$7(�)$,56� The table shows the total attendance, in millions of people, at the Minnesota State Fair from 2005 to 2009. �
� D��Graph a scatter plot of the data, where x = 1 represents 2005. Then find and graph the equation for the best-fit line. � b. Graph and analyze the residual plot. � c.��3UHGLFW�WKH�WRWDO�DWWHQGDQFH�LQ������ �
62/87,21���a. Enter the data from the table into the lists. Let x be the years starting with x = 1 for 2005 and let y = the attendence (in millions). Then graph the scatter plot. �
�
[0, 6] scl: 1 by [0, 3] scl: 0.5 � Perform the linear regression using the data in the lists. Find the equation of the best-fit line. �
� The equation is about y = 0.0326x + 1.598. � Use Y= to enter the equation into the calculator and graph the best-fit line with the scatter plot. �
[0, 6] scl: 1 by [0, 3] scl: 0.5 � b. Use the calculator to graph the residual plot for the data. �
� All the residuals appear to almost be on the line. Therefore, the regression line is a good fit for the data. � F���0HWKRG����To find the number of people in 2020, substitute 16 for x��
� Method 2: Copy the equation to the Y= list and graph. Use the value option to find the value of y when x = 16. �
[0, 17] scl: 1 by [0, 3] scl: 0.5 � 6R��WKHUH�ZLOO�EH�DERXW������PLOOLRQ�SHRSOH�LQ�������
����),5(),*+7(56� 7KH�WDEOH�VKRZV�VWDWLVWLFV�IURP�WKH�8�6��)LUH�$GPLQLVWUDWLRQ�� �
� D�� Find an equation for the median-fit line. � E�� Graph the points and the median-fit line. � F�� Does the median-fit line give you an accurate picture of the number of firefighters? Explain.
62/87,21���a. Use a calculator to find an equation for the median-fit line. �
Step 1: Enter the data by pressing and selecting the EDIT option. Enter age into List 1 (L1). These will represent the x-values. Enter the number of firefighters into List 2 (L2). These will represent the y-values. �
Step 2: Perform the regression by pressing and selecting the CALC option. Scroll down to Med-Med
and press �� �
� y = í841.42x + 223288 � b. Plot the points and graph the median fit line. �
� c. No, the median-fit line does not give an accurate picture of the number of firefighters. The points show no linear correlation; therefore a line cannot accurately portray the data.
����$7+/(7,&6� The table shows the total number of teens who participated in high school athletics in various years. �
� � D�� Find an equation for the regression line. � E�� According to the equation, how many participated in 1988?
62/87,21���a. Use a calculator to find an equation for the regression line. �
Step 1: Enter the data by pressing and selecting the EDIT option. Let the year 1970 be represented by 0. Enter the years since 1970 into List 1 (L1). These will represent the x-values. Enter the number of athletes into List 2 (L2). These will represent the y-values. �
Step 2: Perform the regression by pressing and selecting the CALC option. Scroll down to LinReg(ax+
b) and press . �
� y = 87,390.5x + 4,018,431 � b. To estimate the number of participants in 1988, evaluate the regression equation for x = 18 because 1988 is 18 years after 1970. �
� There were about 5,591,460 participants in 1988.
����$57� $�FRXQW�ZDV�NHSW�RQ�WKH�QXPEHU�RI�SDLQWLQJV�WKDW�VROG�DW�DQ�DXFWLRQ�E\�WKH�\HDU�LQ�ZKLFK�WKH\�ZHUH�SDLQWHG���Let x be the number of years since 1950. �
� D�� Find the equation for the linear regression line. � E�� How many paintings were sold that were painted in 1961? � F�� Is the linear regression equation an accurate model of the data? Explain why or why not.
62/87,21���a. 8VH�D�FDOFXODWRU�WR�ILQG�DQ�HTXDWLRQ�IRU�WKH�UHJUHVVLRQ�OLQH�� �
Step 1: Enter the data by pressing and selecting the EDIT option. Let x =0 for the year 1950.. Enter the years since 1950 into List 1 (L1). These will represent the x-values. Enter the number of painting sold into List 2 (L2). These will represent the y-values. �
Step 2: Perform the regression by pressing �DQG�VHOHFWLQJ�WKH�CALC option. Scroll down to LinReg(ax+
b) and press . � �
� y = 0.446x +9.43 � b. 7R�HVWLPDWH�WKH�QXPEHU�RI�SDLQWLQJV�VROG�LQ�������HYDOXDWH�WKH�UHJUHVVLRQ�HTXDWLRQ�IRU������ZKHQ��x =11. �
� There were about 14 paintings sold in 1961. � F�� No, the correlation coefficient is 0.48, so the linear model is not a good fit for the data. It does not appear from the data that there is a relationship between the number of paintings sold and the year they were painted.
����&&66�$5*80(176� Below are the results of the World Superpipe Championships in 2008.\ �
� � Find an equation of the regression line for each, and graph them on the same coordinate plane. Compare and contrast the men¶s and women's graphs.
62/87,21���Use a calculator to find an equation of the regression line for each set of data.� Men: y = í2.92x + 95.92 Women: y = í7x+106 � Graph the equations on the same coordinate plane. �
� The women¶s scores are typically lower than the men¶s.
����5($621,1*� For a class project, the scores that 10 randomly selected students earned on the first 8 tests of the VFKRRO�\HDU�DUH�JLYHQ��([SODLQ�KRZ�WR�ILQG�D�OLQH�RI��EHVW�ILW���&RXOG�LW�EH�XVHG�WR�SUHGLFW�WKH�VFRUHV�RI�RWKHU�VWXGHQWV"Explain your reasoning.
62/87,21���Apply a linear regression model to the data. Use the number of each test as the independent variable and the score on each test as the dependent variable. If there is no correlation, the r value will not be close to 1 or í1. If this is the case, the line of fit could not be used to predict the scores of the other students.
����23(1�(1'('� For 10 different people, measure their heights and the lengths of their heads from chin to top. Use these data to generate a linear regression equation and a median-fit equation. Make a prediction using both of the equations.
62/87,21���Student should gather and record data and use a calculator to find the equation of linear regression and a median-fit equation. Students should make predictions based on both equations. � 6DPSOH�GDWD��
� Median-fit (Store in Y1)
y = 8.31x ± 3.12 � /LQHDU�UHJUHVVLRQ���6WRUH�LQ Y2)
y = 7.39x + 5.22 � Find the height of a student with chin to top of head measure of 8.1. Use the value option from the CALC menu. Use the up arrow to move from one line to another. �
�
� The median-fit line predicts a student¶s height of 64.17 inches and the linear regression line predicts a height of 65.07.
Chin to 7RS��RI�
Head Measure Height8.8 70.99.1 72.89.3 73.87.5 61.08.4 66.37.8 62.08.5 67.38.8 68.98.3 68.78.9 71.5
����WRITING IN MATH How are lines of fit and linear regression similar? different?
62/87,21���Sample answer: Both lines of fit and linear regression are used to model data. However, you could have numerous lines of fit, while linear regression results in one line of best fit. If linear regression is used, you can also use the correlation coefficient to see how closely the model fits the data. For example, the scatter plot below displays the points (1, 10), (2, 17), (3, 15), (4, 20), (5, 28), (6, 19), and (7, 25). �
$�OLQH�RI�ILW�FRXOG�EH�GUDZQ�WKURXJK���������DQG����������7KH�HTXDWLRQ�RI�WKLV�OLQH�RI�ILW�LV�� .
� Use a calculator to find the equation of the regression line for this data. �
� The only regression line for this data has an equation of about y = 2.2x����������
����*(20(75<� Sam is putting a border around a poster. x represents the poster¶s width, and y represents the poster¶s length. Which equation represents how much border Sam will use if he doubles the length and the width? � $� 4xy � %� (x + y)4 � &� 4(x + y) � '� 16(x + y)
62/87,21���The perimeter of the room is found by . y is the length and x is the width, so . But Sam wants to double the border, so the perimeter becomes: �
� So, the correct choice is C.
����6+257�5(63216(� Tatiana wants to run 5 miles at an average pace of 9 minutes per mile. After 4 miles, her average pace is 9 minutes 10 seconds. In how many minutes must she complete the final mile to reach her goal?
62/87,21���Tatiana ran each of the first 4 miles in 10 more seconds than she planned. So to reach her goal, she must run the lastmile in 40 seconds less than she planned. 9 min ± 40 s = 8 min and 20 s.
����What is the slope of the line that passes through (1, 3) and (í3, 1)?� )� í2 �
*��
�
+��
� -� 2
62/87,21���
� So, the correct choice is H.
����What is an equation of the line that passes through (0, 1) and has a slope of 3?� $� y = 3x í 1 � %� y = 3x í 2 � &� y = 3x + 4 � '� y = 3x + 1
62/87,21���Find the y-intercept. �
� The equation is y = 3x + 1. So, the correct choice is D.
����86('�&$56� Gianna wants to buy a specific make and model of a used car. She researched prices from dealers and private sellers and made the graph shown. �
� D�� Describe the relationship in the data. � E�� Use the line of fit to predict the price of a car that is 7 years old. � F�� Is it reasonable to use this line of fit to predict the price of a 10-year old car? Explain.
62/87,21���a. Because y decreases as x increases, there is a negative correlation in the data. � b. Find x = 7 on the graph and follow the line up to the line of fit. According to the graph, the price of a car that is 7 years old would be about $3600. � c. No, it would not be reasonable to use this line of fit to predict the price of a 10-year old car, because according to the line of fit, the cost would be $0 and that doesn¶t make sense.
����*(20(75<� A quadrilateral has sides with equations y = í2x, 2x + y = 6, , and x í 2y = 9. Is the figure a rectangle? Explain your reasoning.
62/87,21���Write all of the equations in slope-intercept form. � Equation 1: y = í2x � (TXDWLRQ���� �
� (TXDWLRQ����
������������������y = x + 6 � Equation 4:� �
� Find the slope of each line �
� The slope of opposite sides are equal (±2 and ±���DQG�����DQG�������VR�WKH\�DUH�SDUDOOHO��$OVR��WKH�VORSH�RI�consecutive sides are opposite reciprocals (±2 and 0.5; and ±2 and 0.5), so they are perpendicular. So, the figure is a rectangle.
y = í2x í2y = ±2x +6 í2
y = 0.5x + 6
y = 0.5x ± 4.5
Write each equation in standard form.����y í 2 = 3(x í 1)
62/87,21���
����y í 5 = 6(x + 1)
62/87,21���
����y + 2 = í2(x í 5)
62/87,21���
����
62/87,21���
����
62/87,21���
����
62/87,21���
Find the slope of the line that passes through each pair of points.����(3, 4), (10, 8)
62/87,21���
����(í4, 7), (3, 5)
62/87,21���
����(3, 7), (í2, 4)
62/87,21���
����(í3, 2), (í3, 4)
62/87,21���
The slope is undefined.
If f (x) = x2 í x + 1, find each value.����f (í1)
62/87,21���
����f (5) í3
62/87,21���
����f (a)
62/87,21���
����f (b2)
62/87,21���
Graph each equation.����y = x + 2
62/87,21���To graph the equation, plot the y-intercept (0, 2). Then move up 1 unit and right 1 unit. Plot the point. Draw a line through the two points.
����x + 5y = 4
62/87,21���Write the equation in slope-intercept form. �
To graph the equation, plot the y-LQWHUFHSW�� . Then move down 1 unit and right 5 units. Plot the point. Draw a
line through the two points. �
����2x í 3y = 6
62/87,21���Write the equation in slope-intercept form. �
� To graph the equation, plot the y-intercept (0, ±2). Then move up 2 units and right 3 units. Plot the point. Draw a line through the two points. �
����5x + 2y = 6
62/87,21���Write the equation in slope-intercept form. �
� To graph the equation, plot the y-intercept (0, 3). Then move down 5 units and right 2 units. Plot the point. Draw a line through the two points. �
Another line of fit may pass through (2, 15) and (7, 25). The equation of this line of fit is y = 2x + 11. More lines of fit that come close to the points could be drawn.
eSolutions Manual - Powered by Cognero Page 22
4-6 Regression and Median-Fit Lines

���3277(5<� $�ORFDO�XQLYHUVLW\�LV�NHHSLQJ�WUDFN�RI�WKH�QXPEHU�RI�DUW�VWXGHQWV�ZKR�XVH�WKH�SRWWHU\�VWXGLR�HDFK�GD\�� �
� a. Write an equation of the regression line and find the correlation coefficient. � b. Graph the residual plot and determine if the regression line models the data well.
62/87,21���D��Use a calculator to find the equation of the regression line. � Step 1: Enter the data by pressing STAT and selecting the EDIT option. . Enter the day into List 1 (L1). These willrepresent the x-values. Enter the number of students into List 2 (L2). These will represent the y-values. � Step 2: Perform the regression by pressing STAT �DQG�VHOHFWLQJ�WKH�CALC option. Scroll down to LinReg(ax+ b) and press ENTER. �
� Substitute the values in for a and b to write the equation of the regression line. So, the equation is y = 1.18x + 11. � Identify the value of r on the calculator to find the correlation coefficient. So, 0.7181 is the correlation coefficient. � b.�7XUQ�RQ�Plot2 under the STAT PLOT menu and choose scatter plot. Use L1 for the Xlist and RESID for the Ylist. You can obtain RESID by pressing 2nd STAT and selecting RESID from the list of names. Graph the scatter plot of the residuals by pressing ZOOM and choosing ZoomStat. �
� The residuals appear to be randomly scattered, so the regression line fits the data reasonably well. �
���&20387(56� The table below shows the percent of Americans with a broadband connection at home in a recentyear. Use linear extrapolation and a regression equation to estimate the percentage of 60-year-olds with broadband at home. �
62/87,21���Use a calculator to find the equation of the regression line.�
� y = ±0.34x + 49.48 � Substitute 60 into the equation. �
� So, about 29% of 60-year-olds have broadband at home.
���9$&$7,21� The Smiths want to rent a house on the lake that sleeps eight people. The cost of the house per night is based on how close it is to the water. �
� D�� Find and graph an equation for the median-fit line. � E�� What would you estimate is the cost of a rental 1.75 miles from the lake?
62/87,21���a. Use a calculator to find and graph the equation of the median fit line. �
y = í271.88x + 554.48
� b. To estimate the cost of a rental 1.75 miles from the lake, evaluate the equation of the median-fit line for x = 1.75.�
� An estimate of the cost of a rental 1.75 miles from the lake is $78.69.
Write an equation of the regression line for the data in each table. Then find the correlation coefficient.���6.<6&5$3(56� The table ranks the ten tallest buildings in the world. �
62/87,21���Use a calculator to find the equation of the regression line.�
� y = í2.75x + 102.53 � Use a calculator to find the correlation coefficient. � í0.6071
���086,&� 7KH�WDEOH�JLYHV�WKH�QXPEHU�RI�DQQXDO�YLROLQ�DXGLWLRQV�KHOG�E\�D�\RXWK�V\PSKRQ\�HDFK�\HDU�VLQFH��������/HW�x be the number of years since 2004. �
�
62/87,21���Use a calculator to find the equation of the regression line.�
� y = 3.54x + 19.68 � Use a calculator to find the correlation coefficient. � 0.9007
���5(7$,/� 7KH�WDEOH�JLYHV�WKH�VDOHV�RI�MHDQV�DW�D�FORWKLQJ�FKDLQ�VLQFH��������/HW�x be the number of years since ������ �
� a. Write an equation of the regression line. � b. Graph and analyze the residual plot.
62/87,21���a. Use a calculator to find the equation of the regression line. �
� The equation is about��\ = 3.32x + 5.20. � E��Use a calculator to graph the residual plot for the data. �
� The residuals appear to be randomly scattered. Therefore, the regression line fits the data well.
���0$5$7+21� 7KH�QXPEHU�RI�HQWUDQWV�LQ�WKH�%RVWRQ�0DUDWKRQ�HYHU\�ILYH�\HDUV�VLQFH������LV�VKRZQ���/HW�x be thenumber of years since 1975. �
� � D�� Find an equation for the median-fit line. � E�� According to the equation, how many entrants were there in 2003?
62/87,21���a. Let x = 0 for 1975. Use a calculator to find the equation of the median fit line. �
� y = 601.44x + 1236.13 � b. To estimate the number of entrants in 2003, evaluate the equation for the median-fit line for x = 2003 ± 1975 = 28.�
� There were about 18,076 entrants in 2003.
���&$03,1*� A campground kept a record of the number of campsites rented over the week of July 4 for several \HDUV���/HW�x be the number of years since 2000. �
� D�� Find an equation for the regression line. � E�� Predict the number of campsites that will be rented in 2012. � F�� Predict the number of campsites that will be rented in 2020.
62/87,21���a. Use a calculator to find an equation for the regression line. �
� y = 3.07x + 32.71 � b. To predict the number of campsites that will be rented in 2012, evaluate the regression equation for x = 12�
� There will be about 70 campsites rented in 2012. � c. To predict the number of campsites that will be rented in 2020, evaluate the regression equation for x = 20.�
� There will be about 94 campsites rented in 2020.
���,&(�&5($0� An ice cream company keeps a count of the tubs of cookie dough ice cream delivered to each of their stores in a particular area. ��
� D�� Find an equation for the median-fit line. � E�� Graph the points and the median-fit line. � F�� How many tubs would be delivered to a 1500-square-foot store? a 5000-square-foot store?
62/87,21���a. Use a calculator to find an equation for the median-fit line. �
� y = 0.095x í 94.58 � b. Plot the points and the equation. �
� c. To estimate the number of tubs to be delivered to a 1500-square-foot store, evaluate the regression equation for x = 1500. �
� There are about 48 tubs delivered to a 1500-square-foot store. To estimate the number of tubs to be delivered to a 5000-square-foot store, evaluate the regression equation for x = 5000. �
� There are about 380 tubs delivered to a 5000-square-foot store.
����CCSS SENSE-0$.,1*� The prices of the eight top-selling brands of jeans at Jeanie¶s Jeans are given in the table below. �
� D�� Find the equation for the regression line. � E�� According to the equation, what would be the price of a pair of the 12th best-selling brand? � F�� Is this a reasonable prediction? Explain.
62/87,21���a. Use a calculator to find an equation for the regression line. �
Step 1: Enter the data by pressing and selecting the EDIT option. Enter the sales rank into List 1 (L1). These will represent the x-values. Enter the price into List 2 (L2). These will represent the y-values. �
Step 2: Perform the regression by pressing �DQG�VHOHFWLQJ�WKH�CALC option. Scroll down to LinReg(ax+
b) and press . �
� y = 9.8x + 28.79 � b. To predict the price of a pair of the 12th bestselling brands of jeans, evaluate the regression equation for x = 12. �
� The price of a pair of the 12th bestselling brands of jeans would be about $146.39. � F�� Sample answer: No; the correlation between sales rank and price is too weak to make any reasonable prediction. The 12th bestselling brand of jeans could just as easily be a poorly made pair of jeans selling for $15.
����67$7(�)$,56� The table shows the total attendance, in millions of people, at the Minnesota State Fair from 2005 to 2009. �
� D��Graph a scatter plot of the data, where x = 1 represents 2005. Then find and graph the equation for the best-fit line. � b. Graph and analyze the residual plot. � c.��3UHGLFW�WKH�WRWDO�DWWHQGDQFH�LQ������ �
62/87,21���a. Enter the data from the table into the lists. Let x be the years starting with x = 1 for 2005 and let y = the attendence (in millions). Then graph the scatter plot. �
�
[0, 6] scl: 1 by [0, 3] scl: 0.5 � Perform the linear regression using the data in the lists. Find the equation of the best-fit line. �
� The equation is about y = 0.0326x + 1.598. � Use Y= to enter the equation into the calculator and graph the best-fit line with the scatter plot. �
[0, 6] scl: 1 by [0, 3] scl: 0.5 � b. Use the calculator to graph the residual plot for the data. �
� All the residuals appear to almost be on the line. Therefore, the regression line is a good fit for the data. � F���0HWKRG����To find the number of people in 2020, substitute 16 for x��
� Method 2: Copy the equation to the Y= list and graph. Use the value option to find the value of y when x = 16. �
[0, 17] scl: 1 by [0, 3] scl: 0.5 � 6R��WKHUH�ZLOO�EH�DERXW������PLOOLRQ�SHRSOH�LQ�������
����),5(),*+7(56� 7KH�WDEOH�VKRZV�VWDWLVWLFV�IURP�WKH�8�6��)LUH�$GPLQLVWUDWLRQ�� �
� D�� Find an equation for the median-fit line. � E�� Graph the points and the median-fit line. � F�� Does the median-fit line give you an accurate picture of the number of firefighters? Explain.
62/87,21���a. Use a calculator to find an equation for the median-fit line. �
Step 1: Enter the data by pressing and selecting the EDIT option. Enter age into List 1 (L1). These will represent the x-values. Enter the number of firefighters into List 2 (L2). These will represent the y-values. �
Step 2: Perform the regression by pressing and selecting the CALC option. Scroll down to Med-Med
and press �� �
� y = í841.42x + 223288 � b. Plot the points and graph the median fit line. �
� c. No, the median-fit line does not give an accurate picture of the number of firefighters. The points show no linear correlation; therefore a line cannot accurately portray the data.
����$7+/(7,&6� The table shows the total number of teens who participated in high school athletics in various years. �
� � D�� Find an equation for the regression line. � E�� According to the equation, how many participated in 1988?
62/87,21���a. Use a calculator to find an equation for the regression line. �
Step 1: Enter the data by pressing and selecting the EDIT option. Let the year 1970 be represented by 0. Enter the years since 1970 into List 1 (L1). These will represent the x-values. Enter the number of athletes into List 2 (L2). These will represent the y-values. �
Step 2: Perform the regression by pressing and selecting the CALC option. Scroll down to LinReg(ax+
b) and press . �
� y = 87,390.5x + 4,018,431 � b. To estimate the number of participants in 1988, evaluate the regression equation for x = 18 because 1988 is 18 years after 1970. �
� There were about 5,591,460 participants in 1988.
����$57� $�FRXQW�ZDV�NHSW�RQ�WKH�QXPEHU�RI�SDLQWLQJV�WKDW�VROG�DW�DQ�DXFWLRQ�E\�WKH�\HDU�LQ�ZKLFK�WKH\�ZHUH�SDLQWHG���Let x be the number of years since 1950. �
� D�� Find the equation for the linear regression line. � E�� How many paintings were sold that were painted in 1961? � F�� Is the linear regression equation an accurate model of the data? Explain why or why not.
62/87,21���a. 8VH�D�FDOFXODWRU�WR�ILQG�DQ�HTXDWLRQ�IRU�WKH�UHJUHVVLRQ�OLQH�� �
Step 1: Enter the data by pressing and selecting the EDIT option. Let x =0 for the year 1950.. Enter the years since 1950 into List 1 (L1). These will represent the x-values. Enter the number of painting sold into List 2 (L2). These will represent the y-values. �
Step 2: Perform the regression by pressing �DQG�VHOHFWLQJ�WKH�CALC option. Scroll down to LinReg(ax+
b) and press . � �
� y = 0.446x +9.43 � b. 7R�HVWLPDWH�WKH�QXPEHU�RI�SDLQWLQJV�VROG�LQ�������HYDOXDWH�WKH�UHJUHVVLRQ�HTXDWLRQ�IRU������ZKHQ��x =11. �
� There were about 14 paintings sold in 1961. � F�� No, the correlation coefficient is 0.48, so the linear model is not a good fit for the data. It does not appear from the data that there is a relationship between the number of paintings sold and the year they were painted.
����&&66�$5*80(176� Below are the results of the World Superpipe Championships in 2008.\ �
� � Find an equation of the regression line for each, and graph them on the same coordinate plane. Compare and contrast the men¶s and women's graphs.
62/87,21���Use a calculator to find an equation of the regression line for each set of data.� Men: y = í2.92x + 95.92 Women: y = í7x+106 � Graph the equations on the same coordinate plane. �
� The women¶s scores are typically lower than the men¶s.
����5($621,1*� For a class project, the scores that 10 randomly selected students earned on the first 8 tests of the VFKRRO�\HDU�DUH�JLYHQ��([SODLQ�KRZ�WR�ILQG�D�OLQH�RI��EHVW�ILW���&RXOG�LW�EH�XVHG�WR�SUHGLFW�WKH�VFRUHV�RI�RWKHU�VWXGHQWV"Explain your reasoning.
62/87,21���Apply a linear regression model to the data. Use the number of each test as the independent variable and the score on each test as the dependent variable. If there is no correlation, the r value will not be close to 1 or í1. If this is the case, the line of fit could not be used to predict the scores of the other students.
����23(1�(1'('� For 10 different people, measure their heights and the lengths of their heads from chin to top. Use these data to generate a linear regression equation and a median-fit equation. Make a prediction using both of the equations.
62/87,21���Student should gather and record data and use a calculator to find the equation of linear regression and a median-fit equation. Students should make predictions based on both equations. � 6DPSOH�GDWD��
� Median-fit (Store in Y1)
y = 8.31x ± 3.12 � /LQHDU�UHJUHVVLRQ���6WRUH�LQ Y2)
y = 7.39x + 5.22 � Find the height of a student with chin to top of head measure of 8.1. Use the value option from the CALC menu. Use the up arrow to move from one line to another. �
�
� The median-fit line predicts a student¶s height of 64.17 inches and the linear regression line predicts a height of 65.07.
Chin to 7RS��RI�
Head Measure Height8.8 70.99.1 72.89.3 73.87.5 61.08.4 66.37.8 62.08.5 67.38.8 68.98.3 68.78.9 71.5
����WRITING IN MATH How are lines of fit and linear regression similar? different?
62/87,21���Sample answer: Both lines of fit and linear regression are used to model data. However, you could have numerous lines of fit, while linear regression results in one line of best fit. If linear regression is used, you can also use the correlation coefficient to see how closely the model fits the data. For example, the scatter plot below displays the points (1, 10), (2, 17), (3, 15), (4, 20), (5, 28), (6, 19), and (7, 25). �
$�OLQH�RI�ILW�FRXOG�EH�GUDZQ�WKURXJK���������DQG����������7KH�HTXDWLRQ�RI�WKLV�OLQH�RI�ILW�LV�� .
� Use a calculator to find the equation of the regression line for this data. �
� The only regression line for this data has an equation of about y = 2.2x����������
����*(20(75<� Sam is putting a border around a poster. x represents the poster¶s width, and y represents the poster¶s length. Which equation represents how much border Sam will use if he doubles the length and the width? � $� 4xy � %� (x + y)4 � &� 4(x + y) � '� 16(x + y)
62/87,21���The perimeter of the room is found by . y is the length and x is the width, so . But Sam wants to double the border, so the perimeter becomes: �
� So, the correct choice is C.
����6+257�5(63216(� Tatiana wants to run 5 miles at an average pace of 9 minutes per mile. After 4 miles, her average pace is 9 minutes 10 seconds. In how many minutes must she complete the final mile to reach her goal?
62/87,21���Tatiana ran each of the first 4 miles in 10 more seconds than she planned. So to reach her goal, she must run the lastmile in 40 seconds less than she planned. 9 min ± 40 s = 8 min and 20 s.
����What is the slope of the line that passes through (1, 3) and (í3, 1)?� )� í2 �
*��
�
+��
� -� 2
62/87,21���
� So, the correct choice is H.
����What is an equation of the line that passes through (0, 1) and has a slope of 3?� $� y = 3x í 1 � %� y = 3x í 2 � &� y = 3x + 4 � '� y = 3x + 1
62/87,21���Find the y-intercept. �
� The equation is y = 3x + 1. So, the correct choice is D.
����86('�&$56� Gianna wants to buy a specific make and model of a used car. She researched prices from dealers and private sellers and made the graph shown. �
� D�� Describe the relationship in the data. � E�� Use the line of fit to predict the price of a car that is 7 years old. � F�� Is it reasonable to use this line of fit to predict the price of a 10-year old car? Explain.
62/87,21���a. Because y decreases as x increases, there is a negative correlation in the data. � b. Find x = 7 on the graph and follow the line up to the line of fit. According to the graph, the price of a car that is 7 years old would be about $3600. � c. No, it would not be reasonable to use this line of fit to predict the price of a 10-year old car, because according to the line of fit, the cost would be $0 and that doesn¶t make sense.
����*(20(75<� A quadrilateral has sides with equations y = í2x, 2x + y = 6, , and x í 2y = 9. Is the figure a rectangle? Explain your reasoning.
62/87,21���Write all of the equations in slope-intercept form. � Equation 1: y = í2x � (TXDWLRQ���� �
� (TXDWLRQ����
������������������y = x + 6 � Equation 4:� �
� Find the slope of each line �
� The slope of opposite sides are equal (±2 and ±���DQG�����DQG�������VR�WKH\�DUH�SDUDOOHO��$OVR��WKH�VORSH�RI�consecutive sides are opposite reciprocals (±2 and 0.5; and ±2 and 0.5), so they are perpendicular. So, the figure is a rectangle.
y = í2x í2y = ±2x +6 í2
y = 0.5x + 6
y = 0.5x ± 4.5
Write each equation in standard form.����y í 2 = 3(x í 1)
62/87,21���
����y í 5 = 6(x + 1)
62/87,21���
����y + 2 = í2(x í 5)
62/87,21���
����
62/87,21���
����
62/87,21���
����
62/87,21���
Find the slope of the line that passes through each pair of points.����(3, 4), (10, 8)
62/87,21���
����(í4, 7), (3, 5)
62/87,21���
����(3, 7), (í2, 4)
62/87,21���
����(í3, 2), (í3, 4)
62/87,21���
The slope is undefined.
If f (x) = x2 í x + 1, find each value.����f (í1)
62/87,21���
����f (5) í3
62/87,21���
����f (a)
62/87,21���
����f (b2)
62/87,21���
Graph each equation.����y = x + 2
62/87,21���To graph the equation, plot the y-intercept (0, 2). Then move up 1 unit and right 1 unit. Plot the point. Draw a line through the two points.
����x + 5y = 4
62/87,21���Write the equation in slope-intercept form. �
To graph the equation, plot the y-LQWHUFHSW�� . Then move down 1 unit and right 5 units. Plot the point. Draw a
line through the two points. �
����2x í 3y = 6
62/87,21���Write the equation in slope-intercept form. �
� To graph the equation, plot the y-intercept (0, ±2). Then move up 2 units and right 3 units. Plot the point. Draw a line through the two points. �
����5x + 2y = 6
62/87,21���Write the equation in slope-intercept form. �
� To graph the equation, plot the y-intercept (0, 3). Then move down 5 units and right 2 units. Plot the point. Draw a line through the two points. �
Another line of fit may pass through (2, 15) and (7, 25). The equation of this line of fit is y = 2x + 11. More lines of fit that come close to the points could be drawn.
eSolutions Manual - Powered by Cognero Page 23
4-6 Regression and Median-Fit Lines

���3277(5<� $�ORFDO�XQLYHUVLW\�LV�NHHSLQJ�WUDFN�RI�WKH�QXPEHU�RI�DUW�VWXGHQWV�ZKR�XVH�WKH�SRWWHU\�VWXGLR�HDFK�GD\�� �
� a. Write an equation of the regression line and find the correlation coefficient. � b. Graph the residual plot and determine if the regression line models the data well.
62/87,21���D��Use a calculator to find the equation of the regression line. � Step 1: Enter the data by pressing STAT and selecting the EDIT option. . Enter the day into List 1 (L1). These willrepresent the x-values. Enter the number of students into List 2 (L2). These will represent the y-values. � Step 2: Perform the regression by pressing STAT �DQG�VHOHFWLQJ�WKH�CALC option. Scroll down to LinReg(ax+ b) and press ENTER. �
� Substitute the values in for a and b to write the equation of the regression line. So, the equation is y = 1.18x + 11. � Identify the value of r on the calculator to find the correlation coefficient. So, 0.7181 is the correlation coefficient. � b.�7XUQ�RQ�Plot2 under the STAT PLOT menu and choose scatter plot. Use L1 for the Xlist and RESID for the Ylist. You can obtain RESID by pressing 2nd STAT and selecting RESID from the list of names. Graph the scatter plot of the residuals by pressing ZOOM and choosing ZoomStat. �
� The residuals appear to be randomly scattered, so the regression line fits the data reasonably well. �
���&20387(56� The table below shows the percent of Americans with a broadband connection at home in a recentyear. Use linear extrapolation and a regression equation to estimate the percentage of 60-year-olds with broadband at home. �
62/87,21���Use a calculator to find the equation of the regression line.�
� y = ±0.34x + 49.48 � Substitute 60 into the equation. �
� So, about 29% of 60-year-olds have broadband at home.
���9$&$7,21� The Smiths want to rent a house on the lake that sleeps eight people. The cost of the house per night is based on how close it is to the water. �
� D�� Find and graph an equation for the median-fit line. � E�� What would you estimate is the cost of a rental 1.75 miles from the lake?
62/87,21���a. Use a calculator to find and graph the equation of the median fit line. �
y = í271.88x + 554.48
� b. To estimate the cost of a rental 1.75 miles from the lake, evaluate the equation of the median-fit line for x = 1.75.�
� An estimate of the cost of a rental 1.75 miles from the lake is $78.69.
Write an equation of the regression line for the data in each table. Then find the correlation coefficient.���6.<6&5$3(56� The table ranks the ten tallest buildings in the world. �
62/87,21���Use a calculator to find the equation of the regression line.�
� y = í2.75x + 102.53 � Use a calculator to find the correlation coefficient. � í0.6071
���086,&� 7KH�WDEOH�JLYHV�WKH�QXPEHU�RI�DQQXDO�YLROLQ�DXGLWLRQV�KHOG�E\�D�\RXWK�V\PSKRQ\�HDFK�\HDU�VLQFH��������/HW�x be the number of years since 2004. �
�
62/87,21���Use a calculator to find the equation of the regression line.�
� y = 3.54x + 19.68 � Use a calculator to find the correlation coefficient. � 0.9007
���5(7$,/� 7KH�WDEOH�JLYHV�WKH�VDOHV�RI�MHDQV�DW�D�FORWKLQJ�FKDLQ�VLQFH��������/HW�x be the number of years since ������ �
� a. Write an equation of the regression line. � b. Graph and analyze the residual plot.
62/87,21���a. Use a calculator to find the equation of the regression line. �
� The equation is about��\ = 3.32x + 5.20. � E��Use a calculator to graph the residual plot for the data. �
� The residuals appear to be randomly scattered. Therefore, the regression line fits the data well.
���0$5$7+21� 7KH�QXPEHU�RI�HQWUDQWV�LQ�WKH�%RVWRQ�0DUDWKRQ�HYHU\�ILYH�\HDUV�VLQFH������LV�VKRZQ���/HW�x be thenumber of years since 1975. �
� � D�� Find an equation for the median-fit line. � E�� According to the equation, how many entrants were there in 2003?
62/87,21���a. Let x = 0 for 1975. Use a calculator to find the equation of the median fit line. �
� y = 601.44x + 1236.13 � b. To estimate the number of entrants in 2003, evaluate the equation for the median-fit line for x = 2003 ± 1975 = 28.�
� There were about 18,076 entrants in 2003.
���&$03,1*� A campground kept a record of the number of campsites rented over the week of July 4 for several \HDUV���/HW�x be the number of years since 2000. �
� D�� Find an equation for the regression line. � E�� Predict the number of campsites that will be rented in 2012. � F�� Predict the number of campsites that will be rented in 2020.
62/87,21���a. Use a calculator to find an equation for the regression line. �
� y = 3.07x + 32.71 � b. To predict the number of campsites that will be rented in 2012, evaluate the regression equation for x = 12�
� There will be about 70 campsites rented in 2012. � c. To predict the number of campsites that will be rented in 2020, evaluate the regression equation for x = 20.�
� There will be about 94 campsites rented in 2020.
���,&(�&5($0� An ice cream company keeps a count of the tubs of cookie dough ice cream delivered to each of their stores in a particular area. ��
� D�� Find an equation for the median-fit line. � E�� Graph the points and the median-fit line. � F�� How many tubs would be delivered to a 1500-square-foot store? a 5000-square-foot store?
62/87,21���a. Use a calculator to find an equation for the median-fit line. �
� y = 0.095x í 94.58 � b. Plot the points and the equation. �
� c. To estimate the number of tubs to be delivered to a 1500-square-foot store, evaluate the regression equation for x = 1500. �
� There are about 48 tubs delivered to a 1500-square-foot store. To estimate the number of tubs to be delivered to a 5000-square-foot store, evaluate the regression equation for x = 5000. �
� There are about 380 tubs delivered to a 5000-square-foot store.
����CCSS SENSE-0$.,1*� The prices of the eight top-selling brands of jeans at Jeanie¶s Jeans are given in the table below. �
� D�� Find the equation for the regression line. � E�� According to the equation, what would be the price of a pair of the 12th best-selling brand? � F�� Is this a reasonable prediction? Explain.
62/87,21���a. Use a calculator to find an equation for the regression line. �
Step 1: Enter the data by pressing and selecting the EDIT option. Enter the sales rank into List 1 (L1). These will represent the x-values. Enter the price into List 2 (L2). These will represent the y-values. �
Step 2: Perform the regression by pressing �DQG�VHOHFWLQJ�WKH�CALC option. Scroll down to LinReg(ax+
b) and press . �
� y = 9.8x + 28.79 � b. To predict the price of a pair of the 12th bestselling brands of jeans, evaluate the regression equation for x = 12. �
� The price of a pair of the 12th bestselling brands of jeans would be about $146.39. � F�� Sample answer: No; the correlation between sales rank and price is too weak to make any reasonable prediction. The 12th bestselling brand of jeans could just as easily be a poorly made pair of jeans selling for $15.
����67$7(�)$,56� The table shows the total attendance, in millions of people, at the Minnesota State Fair from 2005 to 2009. �
� D��Graph a scatter plot of the data, where x = 1 represents 2005. Then find and graph the equation for the best-fit line. � b. Graph and analyze the residual plot. � c.��3UHGLFW�WKH�WRWDO�DWWHQGDQFH�LQ������ �
62/87,21���a. Enter the data from the table into the lists. Let x be the years starting with x = 1 for 2005 and let y = the attendence (in millions). Then graph the scatter plot. �
�
[0, 6] scl: 1 by [0, 3] scl: 0.5 � Perform the linear regression using the data in the lists. Find the equation of the best-fit line. �
� The equation is about y = 0.0326x + 1.598. � Use Y= to enter the equation into the calculator and graph the best-fit line with the scatter plot. �
[0, 6] scl: 1 by [0, 3] scl: 0.5 � b. Use the calculator to graph the residual plot for the data. �
� All the residuals appear to almost be on the line. Therefore, the regression line is a good fit for the data. � F���0HWKRG����To find the number of people in 2020, substitute 16 for x��
� Method 2: Copy the equation to the Y= list and graph. Use the value option to find the value of y when x = 16. �
[0, 17] scl: 1 by [0, 3] scl: 0.5 � 6R��WKHUH�ZLOO�EH�DERXW������PLOOLRQ�SHRSOH�LQ�������
����),5(),*+7(56� 7KH�WDEOH�VKRZV�VWDWLVWLFV�IURP�WKH�8�6��)LUH�$GPLQLVWUDWLRQ�� �
� D�� Find an equation for the median-fit line. � E�� Graph the points and the median-fit line. � F�� Does the median-fit line give you an accurate picture of the number of firefighters? Explain.
62/87,21���a. Use a calculator to find an equation for the median-fit line. �
Step 1: Enter the data by pressing and selecting the EDIT option. Enter age into List 1 (L1). These will represent the x-values. Enter the number of firefighters into List 2 (L2). These will represent the y-values. �
Step 2: Perform the regression by pressing and selecting the CALC option. Scroll down to Med-Med
and press �� �
� y = í841.42x + 223288 � b. Plot the points and graph the median fit line. �
� c. No, the median-fit line does not give an accurate picture of the number of firefighters. The points show no linear correlation; therefore a line cannot accurately portray the data.
����$7+/(7,&6� The table shows the total number of teens who participated in high school athletics in various years. �
� � D�� Find an equation for the regression line. � E�� According to the equation, how many participated in 1988?
62/87,21���a. Use a calculator to find an equation for the regression line. �
Step 1: Enter the data by pressing and selecting the EDIT option. Let the year 1970 be represented by 0. Enter the years since 1970 into List 1 (L1). These will represent the x-values. Enter the number of athletes into List 2 (L2). These will represent the y-values. �
Step 2: Perform the regression by pressing and selecting the CALC option. Scroll down to LinReg(ax+
b) and press . �
� y = 87,390.5x + 4,018,431 � b. To estimate the number of participants in 1988, evaluate the regression equation for x = 18 because 1988 is 18 years after 1970. �
� There were about 5,591,460 participants in 1988.
����$57� $�FRXQW�ZDV�NHSW�RQ�WKH�QXPEHU�RI�SDLQWLQJV�WKDW�VROG�DW�DQ�DXFWLRQ�E\�WKH�\HDU�LQ�ZKLFK�WKH\�ZHUH�SDLQWHG���Let x be the number of years since 1950. �
� D�� Find the equation for the linear regression line. � E�� How many paintings were sold that were painted in 1961? � F�� Is the linear regression equation an accurate model of the data? Explain why or why not.
62/87,21���a. 8VH�D�FDOFXODWRU�WR�ILQG�DQ�HTXDWLRQ�IRU�WKH�UHJUHVVLRQ�OLQH�� �
Step 1: Enter the data by pressing and selecting the EDIT option. Let x =0 for the year 1950.. Enter the years since 1950 into List 1 (L1). These will represent the x-values. Enter the number of painting sold into List 2 (L2). These will represent the y-values. �
Step 2: Perform the regression by pressing �DQG�VHOHFWLQJ�WKH�CALC option. Scroll down to LinReg(ax+
b) and press . � �
� y = 0.446x +9.43 � b. 7R�HVWLPDWH�WKH�QXPEHU�RI�SDLQWLQJV�VROG�LQ�������HYDOXDWH�WKH�UHJUHVVLRQ�HTXDWLRQ�IRU������ZKHQ��x =11. �
� There were about 14 paintings sold in 1961. � F�� No, the correlation coefficient is 0.48, so the linear model is not a good fit for the data. It does not appear from the data that there is a relationship between the number of paintings sold and the year they were painted.
����&&66�$5*80(176� Below are the results of the World Superpipe Championships in 2008.\ �
� � Find an equation of the regression line for each, and graph them on the same coordinate plane. Compare and contrast the men¶s and women's graphs.
62/87,21���Use a calculator to find an equation of the regression line for each set of data.� Men: y = í2.92x + 95.92 Women: y = í7x+106 � Graph the equations on the same coordinate plane. �
� The women¶s scores are typically lower than the men¶s.
����5($621,1*� For a class project, the scores that 10 randomly selected students earned on the first 8 tests of the VFKRRO�\HDU�DUH�JLYHQ��([SODLQ�KRZ�WR�ILQG�D�OLQH�RI��EHVW�ILW���&RXOG�LW�EH�XVHG�WR�SUHGLFW�WKH�VFRUHV�RI�RWKHU�VWXGHQWV"Explain your reasoning.
62/87,21���Apply a linear regression model to the data. Use the number of each test as the independent variable and the score on each test as the dependent variable. If there is no correlation, the r value will not be close to 1 or í1. If this is the case, the line of fit could not be used to predict the scores of the other students.
����23(1�(1'('� For 10 different people, measure their heights and the lengths of their heads from chin to top. Use these data to generate a linear regression equation and a median-fit equation. Make a prediction using both of the equations.
62/87,21���Student should gather and record data and use a calculator to find the equation of linear regression and a median-fit equation. Students should make predictions based on both equations. � 6DPSOH�GDWD��
� Median-fit (Store in Y1)
y = 8.31x ± 3.12 � /LQHDU�UHJUHVVLRQ���6WRUH�LQ Y2)
y = 7.39x + 5.22 � Find the height of a student with chin to top of head measure of 8.1. Use the value option from the CALC menu. Use the up arrow to move from one line to another. �
�
� The median-fit line predicts a student¶s height of 64.17 inches and the linear regression line predicts a height of 65.07.
Chin to 7RS��RI�
Head Measure Height8.8 70.99.1 72.89.3 73.87.5 61.08.4 66.37.8 62.08.5 67.38.8 68.98.3 68.78.9 71.5
����WRITING IN MATH How are lines of fit and linear regression similar? different?
62/87,21���Sample answer: Both lines of fit and linear regression are used to model data. However, you could have numerous lines of fit, while linear regression results in one line of best fit. If linear regression is used, you can also use the correlation coefficient to see how closely the model fits the data. For example, the scatter plot below displays the points (1, 10), (2, 17), (3, 15), (4, 20), (5, 28), (6, 19), and (7, 25). �
$�OLQH�RI�ILW�FRXOG�EH�GUDZQ�WKURXJK���������DQG����������7KH�HTXDWLRQ�RI�WKLV�OLQH�RI�ILW�LV�� .
� Use a calculator to find the equation of the regression line for this data. �
� The only regression line for this data has an equation of about y = 2.2x����������
����*(20(75<� Sam is putting a border around a poster. x represents the poster¶s width, and y represents the poster¶s length. Which equation represents how much border Sam will use if he doubles the length and the width? � $� 4xy � %� (x + y)4 � &� 4(x + y) � '� 16(x + y)
62/87,21���The perimeter of the room is found by . y is the length and x is the width, so . But Sam wants to double the border, so the perimeter becomes: �
� So, the correct choice is C.
����6+257�5(63216(� Tatiana wants to run 5 miles at an average pace of 9 minutes per mile. After 4 miles, her average pace is 9 minutes 10 seconds. In how many minutes must she complete the final mile to reach her goal?
62/87,21���Tatiana ran each of the first 4 miles in 10 more seconds than she planned. So to reach her goal, she must run the lastmile in 40 seconds less than she planned. 9 min ± 40 s = 8 min and 20 s.
����What is the slope of the line that passes through (1, 3) and (í3, 1)?� )� í2 �
*��
�
+��
� -� 2
62/87,21���
� So, the correct choice is H.
����What is an equation of the line that passes through (0, 1) and has a slope of 3?� $� y = 3x í 1 � %� y = 3x í 2 � &� y = 3x + 4 � '� y = 3x + 1
62/87,21���Find the y-intercept. �
� The equation is y = 3x + 1. So, the correct choice is D.
����86('�&$56� Gianna wants to buy a specific make and model of a used car. She researched prices from dealers and private sellers and made the graph shown. �
� D�� Describe the relationship in the data. � E�� Use the line of fit to predict the price of a car that is 7 years old. � F�� Is it reasonable to use this line of fit to predict the price of a 10-year old car? Explain.
62/87,21���a. Because y decreases as x increases, there is a negative correlation in the data. � b. Find x = 7 on the graph and follow the line up to the line of fit. According to the graph, the price of a car that is 7 years old would be about $3600. � c. No, it would not be reasonable to use this line of fit to predict the price of a 10-year old car, because according to the line of fit, the cost would be $0 and that doesn¶t make sense.
����*(20(75<� A quadrilateral has sides with equations y = í2x, 2x + y = 6, , and x í 2y = 9. Is the figure a rectangle? Explain your reasoning.
62/87,21���Write all of the equations in slope-intercept form. � Equation 1: y = í2x � (TXDWLRQ���� �
� (TXDWLRQ����
������������������y = x + 6 � Equation 4:� �
� Find the slope of each line �
� The slope of opposite sides are equal (±2 and ±���DQG�����DQG�������VR�WKH\�DUH�SDUDOOHO��$OVR��WKH�VORSH�RI�consecutive sides are opposite reciprocals (±2 and 0.5; and ±2 and 0.5), so they are perpendicular. So, the figure is a rectangle.
y = í2x í2y = ±2x +6 í2
y = 0.5x + 6
y = 0.5x ± 4.5
Write each equation in standard form.����y í 2 = 3(x í 1)
62/87,21���
����y í 5 = 6(x + 1)
62/87,21���
����y + 2 = í2(x í 5)
62/87,21���
����
62/87,21���
����
62/87,21���
����
62/87,21���
Find the slope of the line that passes through each pair of points.����(3, 4), (10, 8)
62/87,21���
����(í4, 7), (3, 5)
62/87,21���
����(3, 7), (í2, 4)
62/87,21���
����(í3, 2), (í3, 4)
62/87,21���
The slope is undefined.
If f (x) = x2 í x + 1, find each value.����f (í1)
62/87,21���
����f (5) í3
62/87,21���
����f (a)
62/87,21���
����f (b2)
62/87,21���
Graph each equation.����y = x + 2
62/87,21���To graph the equation, plot the y-intercept (0, 2). Then move up 1 unit and right 1 unit. Plot the point. Draw a line through the two points.
����x + 5y = 4
62/87,21���Write the equation in slope-intercept form. �
To graph the equation, plot the y-LQWHUFHSW�� . Then move down 1 unit and right 5 units. Plot the point. Draw a
line through the two points. �
����2x í 3y = 6
62/87,21���Write the equation in slope-intercept form. �
� To graph the equation, plot the y-intercept (0, ±2). Then move up 2 units and right 3 units. Plot the point. Draw a line through the two points. �
����5x + 2y = 6
62/87,21���Write the equation in slope-intercept form. �
� To graph the equation, plot the y-intercept (0, 3). Then move down 5 units and right 2 units. Plot the point. Draw a line through the two points. �
Another line of fit may pass through (2, 15) and (7, 25). The equation of this line of fit is y = 2x + 11. More lines of fit that come close to the points could be drawn.
eSolutions Manual - Powered by Cognero Page 24
4-6 Regression and Median-Fit Lines
���3277(5<� $�ORFDO�XQLYHUVLW\�LV�NHHSLQJ�WUDFN�RI�WKH�QXPEHU�RI�DUW�VWXGHQWV�ZKR�XVH�WKH�SRWWHU\�VWXGLR�HDFK�GD\�� �
� a. Write an equation of the regression line and find the correlation coefficient. � b. Graph the residual plot and determine if the regression line models the data well.
62/87,21���D��Use a calculator to find the equation of the regression line. � Step 1: Enter the data by pressing STAT and selecting the EDIT option. . Enter the day into List 1 (L1). These willrepresent the x-values. Enter the number of students into List 2 (L2). These will represent the y-values. � Step 2: Perform the regression by pressing STAT �DQG�VHOHFWLQJ�WKH�CALC option. Scroll down to LinReg(ax+ b) and press ENTER. �
� Substitute the values in for a and b to write the equation of the regression line. So, the equation is y = 1.18x + 11. � Identify the value of r on the calculator to find the correlation coefficient. So, 0.7181 is the correlation coefficient. � b.�7XUQ�RQ�Plot2 under the STAT PLOT menu and choose scatter plot. Use L1 for the Xlist and RESID for the Ylist. You can obtain RESID by pressing 2nd STAT and selecting RESID from the list of names. Graph the scatter plot of the residuals by pressing ZOOM and choosing ZoomStat. �
� The residuals appear to be randomly scattered, so the regression line fits the data reasonably well. �
���&20387(56� The table below shows the percent of Americans with a broadband connection at home in a recentyear. Use linear extrapolation and a regression equation to estimate the percentage of 60-year-olds with broadband at home. �
62/87,21���Use a calculator to find the equation of the regression line.�
� y = ±0.34x + 49.48 � Substitute 60 into the equation. �
� So, about 29% of 60-year-olds have broadband at home.
���9$&$7,21� The Smiths want to rent a house on the lake that sleeps eight people. The cost of the house per night is based on how close it is to the water. �
� D�� Find and graph an equation for the median-fit line. � E�� What would you estimate is the cost of a rental 1.75 miles from the lake?
62/87,21���a. Use a calculator to find and graph the equation of the median fit line. �
y = í271.88x + 554.48
� b. To estimate the cost of a rental 1.75 miles from the lake, evaluate the equation of the median-fit line for x = 1.75.�
� An estimate of the cost of a rental 1.75 miles from the lake is $78.69.
Write an equation of the regression line for the data in each table. Then find the correlation coefficient.���6.<6&5$3(56� The table ranks the ten tallest buildings in the world. �
62/87,21���Use a calculator to find the equation of the regression line.�
� y = í2.75x + 102.53 � Use a calculator to find the correlation coefficient. � í0.6071
���086,&� 7KH�WDEOH�JLYHV�WKH�QXPEHU�RI�DQQXDO�YLROLQ�DXGLWLRQV�KHOG�E\�D�\RXWK�V\PSKRQ\�HDFK�\HDU�VLQFH��������/HW�x be the number of years since 2004. �
�
62/87,21���Use a calculator to find the equation of the regression line.�
� y = 3.54x + 19.68 � Use a calculator to find the correlation coefficient. � 0.9007
���5(7$,/� 7KH�WDEOH�JLYHV�WKH�VDOHV�RI�MHDQV�DW�D�FORWKLQJ�FKDLQ�VLQFH��������/HW�x be the number of years since ������ �
� a. Write an equation of the regression line. � b. Graph and analyze the residual plot.
62/87,21���a. Use a calculator to find the equation of the regression line. �
� The equation is about��\ = 3.32x + 5.20. � E��Use a calculator to graph the residual plot for the data. �
� The residuals appear to be randomly scattered. Therefore, the regression line fits the data well.
���0$5$7+21� 7KH�QXPEHU�RI�HQWUDQWV�LQ�WKH�%RVWRQ�0DUDWKRQ�HYHU\�ILYH�\HDUV�VLQFH������LV�VKRZQ���/HW�x be thenumber of years since 1975. �
� � D�� Find an equation for the median-fit line. � E�� According to the equation, how many entrants were there in 2003?
62/87,21���a. Let x = 0 for 1975. Use a calculator to find the equation of the median fit line. �
� y = 601.44x + 1236.13 � b. To estimate the number of entrants in 2003, evaluate the equation for the median-fit line for x = 2003 ± 1975 = 28.�
� There were about 18,076 entrants in 2003.
���&$03,1*� A campground kept a record of the number of campsites rented over the week of July 4 for several \HDUV���/HW�x be the number of years since 2000. �
� D�� Find an equation for the regression line. � E�� Predict the number of campsites that will be rented in 2012. � F�� Predict the number of campsites that will be rented in 2020.
62/87,21���a. Use a calculator to find an equation for the regression line. �
� y = 3.07x + 32.71 � b. To predict the number of campsites that will be rented in 2012, evaluate the regression equation for x = 12�
� There will be about 70 campsites rented in 2012. � c. To predict the number of campsites that will be rented in 2020, evaluate the regression equation for x = 20.�
� There will be about 94 campsites rented in 2020.
���,&(�&5($0� An ice cream company keeps a count of the tubs of cookie dough ice cream delivered to each of their stores in a particular area. ��
� D�� Find an equation for the median-fit line. � E�� Graph the points and the median-fit line. � F�� How many tubs would be delivered to a 1500-square-foot store? a 5000-square-foot store?
62/87,21���a. Use a calculator to find an equation for the median-fit line. �
� y = 0.095x í 94.58 � b. Plot the points and the equation. �
� c. To estimate the number of tubs to be delivered to a 1500-square-foot store, evaluate the regression equation for x = 1500. �
� There are about 48 tubs delivered to a 1500-square-foot store. To estimate the number of tubs to be delivered to a 5000-square-foot store, evaluate the regression equation for x = 5000. �
� There are about 380 tubs delivered to a 5000-square-foot store.
����CCSS SENSE-0$.,1*� The prices of the eight top-selling brands of jeans at Jeanie¶s Jeans are given in the table below. �
� D�� Find the equation for the regression line. � E�� According to the equation, what would be the price of a pair of the 12th best-selling brand? � F�� Is this a reasonable prediction? Explain.
62/87,21���a. Use a calculator to find an equation for the regression line. �
Step 1: Enter the data by pressing and selecting the EDIT option. Enter the sales rank into List 1 (L1). These will represent the x-values. Enter the price into List 2 (L2). These will represent the y-values. �
Step 2: Perform the regression by pressing �DQG�VHOHFWLQJ�WKH�CALC option. Scroll down to LinReg(ax+
b) and press . �
� y = 9.8x + 28.79 � b. To predict the price of a pair of the 12th bestselling brands of jeans, evaluate the regression equation for x = 12. �
� The price of a pair of the 12th bestselling brands of jeans would be about $146.39. � F�� Sample answer: No; the correlation between sales rank and price is too weak to make any reasonable prediction. The 12th bestselling brand of jeans could just as easily be a poorly made pair of jeans selling for $15.
����67$7(�)$,56� The table shows the total attendance, in millions of people, at the Minnesota State Fair from 2005 to 2009. �
� D��Graph a scatter plot of the data, where x = 1 represents 2005. Then find and graph the equation for the best-fit line. � b. Graph and analyze the residual plot. � c.��3UHGLFW�WKH�WRWDO�DWWHQGDQFH�LQ������ �
62/87,21���a. Enter the data from the table into the lists. Let x be the years starting with x = 1 for 2005 and let y = the attendence (in millions). Then graph the scatter plot. �
�
[0, 6] scl: 1 by [0, 3] scl: 0.5 � Perform the linear regression using the data in the lists. Find the equation of the best-fit line. �
� The equation is about y = 0.0326x + 1.598. � Use Y= to enter the equation into the calculator and graph the best-fit line with the scatter plot. �
[0, 6] scl: 1 by [0, 3] scl: 0.5 � b. Use the calculator to graph the residual plot for the data. �
� All the residuals appear to almost be on the line. Therefore, the regression line is a good fit for the data. � F���0HWKRG����To find the number of people in 2020, substitute 16 for x��
� Method 2: Copy the equation to the Y= list and graph. Use the value option to find the value of y when x = 16. �
[0, 17] scl: 1 by [0, 3] scl: 0.5 � 6R��WKHUH�ZLOO�EH�DERXW������PLOOLRQ�SHRSOH�LQ�������
����),5(),*+7(56� 7KH�WDEOH�VKRZV�VWDWLVWLFV�IURP�WKH�8�6��)LUH�$GPLQLVWUDWLRQ�� �
� D�� Find an equation for the median-fit line. � E�� Graph the points and the median-fit line. � F�� Does the median-fit line give you an accurate picture of the number of firefighters? Explain.
62/87,21���a. Use a calculator to find an equation for the median-fit line. �
Step 1: Enter the data by pressing and selecting the EDIT option. Enter age into List 1 (L1). These will represent the x-values. Enter the number of firefighters into List 2 (L2). These will represent the y-values. �
Step 2: Perform the regression by pressing and selecting the CALC option. Scroll down to Med-Med
and press �� �
� y = í841.42x + 223288 � b. Plot the points and graph the median fit line. �
� c. No, the median-fit line does not give an accurate picture of the number of firefighters. The points show no linear correlation; therefore a line cannot accurately portray the data.
����$7+/(7,&6� The table shows the total number of teens who participated in high school athletics in various years. �
� � D�� Find an equation for the regression line. � E�� According to the equation, how many participated in 1988?
62/87,21���a. Use a calculator to find an equation for the regression line. �
Step 1: Enter the data by pressing and selecting the EDIT option. Let the year 1970 be represented by 0. Enter the years since 1970 into List 1 (L1). These will represent the x-values. Enter the number of athletes into List 2 (L2). These will represent the y-values. �
Step 2: Perform the regression by pressing and selecting the CALC option. Scroll down to LinReg(ax+
b) and press . �
� y = 87,390.5x + 4,018,431 � b. To estimate the number of participants in 1988, evaluate the regression equation for x = 18 because 1988 is 18 years after 1970. �
� There were about 5,591,460 participants in 1988.
����$57� $�FRXQW�ZDV�NHSW�RQ�WKH�QXPEHU�RI�SDLQWLQJV�WKDW�VROG�DW�DQ�DXFWLRQ�E\�WKH�\HDU�LQ�ZKLFK�WKH\�ZHUH�SDLQWHG���Let x be the number of years since 1950. �
� D�� Find the equation for the linear regression line. � E�� How many paintings were sold that were painted in 1961? � F�� Is the linear regression equation an accurate model of the data? Explain why or why not.
62/87,21���a. 8VH�D�FDOFXODWRU�WR�ILQG�DQ�HTXDWLRQ�IRU�WKH�UHJUHVVLRQ�OLQH�� �
Step 1: Enter the data by pressing and selecting the EDIT option. Let x =0 for the year 1950.. Enter the years since 1950 into List 1 (L1). These will represent the x-values. Enter the number of painting sold into List 2 (L2). These will represent the y-values. �
Step 2: Perform the regression by pressing �DQG�VHOHFWLQJ�WKH�CALC option. Scroll down to LinReg(ax+
b) and press . � �
� y = 0.446x +9.43 � b. 7R�HVWLPDWH�WKH�QXPEHU�RI�SDLQWLQJV�VROG�LQ�������HYDOXDWH�WKH�UHJUHVVLRQ�HTXDWLRQ�IRU������ZKHQ��x =11. �
� There were about 14 paintings sold in 1961. � F�� No, the correlation coefficient is 0.48, so the linear model is not a good fit for the data. It does not appear from the data that there is a relationship between the number of paintings sold and the year they were painted.
����&&66�$5*80(176� Below are the results of the World Superpipe Championships in 2008.\ �
� � Find an equation of the regression line for each, and graph them on the same coordinate plane. Compare and contrast the men¶s and women's graphs.
62/87,21���Use a calculator to find an equation of the regression line for each set of data.� Men: y = í2.92x + 95.92 Women: y = í7x+106 � Graph the equations on the same coordinate plane. �
� The women¶s scores are typically lower than the men¶s.
����5($621,1*� For a class project, the scores that 10 randomly selected students earned on the first 8 tests of the VFKRRO�\HDU�DUH�JLYHQ��([SODLQ�KRZ�WR�ILQG�D�OLQH�RI��EHVW�ILW���&RXOG�LW�EH�XVHG�WR�SUHGLFW�WKH�VFRUHV�RI�RWKHU�VWXGHQWV"Explain your reasoning.
62/87,21���Apply a linear regression model to the data. Use the number of each test as the independent variable and the score on each test as the dependent variable. If there is no correlation, the r value will not be close to 1 or í1. If this is the case, the line of fit could not be used to predict the scores of the other students.
����23(1�(1'('� For 10 different people, measure their heights and the lengths of their heads from chin to top. Use these data to generate a linear regression equation and a median-fit equation. Make a prediction using both of the equations.
62/87,21���Student should gather and record data and use a calculator to find the equation of linear regression and a median-fit equation. Students should make predictions based on both equations. � 6DPSOH�GDWD��
� Median-fit (Store in Y1)
y = 8.31x ± 3.12 � /LQHDU�UHJUHVVLRQ���6WRUH�LQ Y2)
y = 7.39x + 5.22 � Find the height of a student with chin to top of head measure of 8.1. Use the value option from the CALC menu. Use the up arrow to move from one line to another. �
�
� The median-fit line predicts a student¶s height of 64.17 inches and the linear regression line predicts a height of 65.07.
Chin to 7RS��RI�
Head Measure Height8.8 70.99.1 72.89.3 73.87.5 61.08.4 66.37.8 62.08.5 67.38.8 68.98.3 68.78.9 71.5
����WRITING IN MATH How are lines of fit and linear regression similar? different?
62/87,21���Sample answer: Both lines of fit and linear regression are used to model data. However, you could have numerous lines of fit, while linear regression results in one line of best fit. If linear regression is used, you can also use the correlation coefficient to see how closely the model fits the data. For example, the scatter plot below displays the points (1, 10), (2, 17), (3, 15), (4, 20), (5, 28), (6, 19), and (7, 25). �
$�OLQH�RI�ILW�FRXOG�EH�GUDZQ�WKURXJK���������DQG����������7KH�HTXDWLRQ�RI�WKLV�OLQH�RI�ILW�LV�� .
� Use a calculator to find the equation of the regression line for this data. �
� The only regression line for this data has an equation of about y = 2.2x����������
����*(20(75<� Sam is putting a border around a poster. x represents the poster¶s width, and y represents the poster¶s length. Which equation represents how much border Sam will use if he doubles the length and the width? � $� 4xy � %� (x + y)4 � &� 4(x + y) � '� 16(x + y)
62/87,21���The perimeter of the room is found by . y is the length and x is the width, so . But Sam wants to double the border, so the perimeter becomes: �
� So, the correct choice is C.
����6+257�5(63216(� Tatiana wants to run 5 miles at an average pace of 9 minutes per mile. After 4 miles, her average pace is 9 minutes 10 seconds. In how many minutes must she complete the final mile to reach her goal?
62/87,21���Tatiana ran each of the first 4 miles in 10 more seconds than she planned. So to reach her goal, she must run the lastmile in 40 seconds less than she planned. 9 min ± 40 s = 8 min and 20 s.
����What is the slope of the line that passes through (1, 3) and (í3, 1)?� )� í2 �
*��
�
+��
� -� 2
62/87,21���
� So, the correct choice is H.
����What is an equation of the line that passes through (0, 1) and has a slope of 3?� $� y = 3x í 1 � %� y = 3x í 2 � &� y = 3x + 4 � '� y = 3x + 1
62/87,21���Find the y-intercept. �
� The equation is y = 3x + 1. So, the correct choice is D.
����86('�&$56� Gianna wants to buy a specific make and model of a used car. She researched prices from dealers and private sellers and made the graph shown. �
� D�� Describe the relationship in the data. � E�� Use the line of fit to predict the price of a car that is 7 years old. � F�� Is it reasonable to use this line of fit to predict the price of a 10-year old car? Explain.
62/87,21���a. Because y decreases as x increases, there is a negative correlation in the data. � b. Find x = 7 on the graph and follow the line up to the line of fit. According to the graph, the price of a car that is 7 years old would be about $3600. � c. No, it would not be reasonable to use this line of fit to predict the price of a 10-year old car, because according to the line of fit, the cost would be $0 and that doesn¶t make sense.
����*(20(75<� A quadrilateral has sides with equations y = í2x, 2x + y = 6, , and x í 2y = 9. Is the figure a rectangle? Explain your reasoning.
62/87,21���Write all of the equations in slope-intercept form. � Equation 1: y = í2x � (TXDWLRQ���� �
� (TXDWLRQ����
������������������y = x + 6 � Equation 4:� �
� Find the slope of each line �
� The slope of opposite sides are equal (±2 and ±���DQG�����DQG�������VR�WKH\�DUH�SDUDOOHO��$OVR��WKH�VORSH�RI�consecutive sides are opposite reciprocals (±2 and 0.5; and ±2 and 0.5), so they are perpendicular. So, the figure is a rectangle.
y = í2x í2y = ±2x +6 í2
y = 0.5x + 6
y = 0.5x ± 4.5
Write each equation in standard form.����y í 2 = 3(x í 1)
62/87,21���
����y í 5 = 6(x + 1)
62/87,21���
����y + 2 = í2(x í 5)
62/87,21���
����
62/87,21���
����
62/87,21���
����
62/87,21���
Find the slope of the line that passes through each pair of points.����(3, 4), (10, 8)
62/87,21���
����(í4, 7), (3, 5)
62/87,21���
����(3, 7), (í2, 4)
62/87,21���
����(í3, 2), (í3, 4)
62/87,21���
The slope is undefined.
If f (x) = x2 í x + 1, find each value.����f (í1)
62/87,21���
����f (5) í3
62/87,21���
����f (a)
62/87,21���
����f (b2)
62/87,21���
Graph each equation.����y = x + 2
62/87,21���To graph the equation, plot the y-intercept (0, 2). Then move up 1 unit and right 1 unit. Plot the point. Draw a line through the two points.
����x + 5y = 4
62/87,21���Write the equation in slope-intercept form. �
To graph the equation, plot the y-LQWHUFHSW�� . Then move down 1 unit and right 5 units. Plot the point. Draw a
line through the two points. �
����2x í 3y = 6
62/87,21���Write the equation in slope-intercept form. �
� To graph the equation, plot the y-intercept (0, ±2). Then move up 2 units and right 3 units. Plot the point. Draw a line through the two points. �
����5x + 2y = 6
62/87,21���Write the equation in slope-intercept form. �
� To graph the equation, plot the y-intercept (0, 3). Then move down 5 units and right 2 units. Plot the point. Draw a line through the two points. �
Another line of fit may pass through (2, 15) and (7, 25). The equation of this line of fit is y = 2x + 11. More lines of fit that come close to the points could be drawn.
eSolutions Manual - Powered by Cognero Page 25
4-6 Regression and Median-Fit Lines

���3277(5<� $�ORFDO�XQLYHUVLW\�LV�NHHSLQJ�WUDFN�RI�WKH�QXPEHU�RI�DUW�VWXGHQWV�ZKR�XVH�WKH�SRWWHU\�VWXGLR�HDFK�GD\�� �
� a. Write an equation of the regression line and find the correlation coefficient. � b. Graph the residual plot and determine if the regression line models the data well.
62/87,21���D��Use a calculator to find the equation of the regression line. � Step 1: Enter the data by pressing STAT and selecting the EDIT option. . Enter the day into List 1 (L1). These willrepresent the x-values. Enter the number of students into List 2 (L2). These will represent the y-values. � Step 2: Perform the regression by pressing STAT �DQG�VHOHFWLQJ�WKH�CALC option. Scroll down to LinReg(ax+ b) and press ENTER. �
� Substitute the values in for a and b to write the equation of the regression line. So, the equation is y = 1.18x + 11. � Identify the value of r on the calculator to find the correlation coefficient. So, 0.7181 is the correlation coefficient. � b.�7XUQ�RQ�Plot2 under the STAT PLOT menu and choose scatter plot. Use L1 for the Xlist and RESID for the Ylist. You can obtain RESID by pressing 2nd STAT and selecting RESID from the list of names. Graph the scatter plot of the residuals by pressing ZOOM and choosing ZoomStat. �
� The residuals appear to be randomly scattered, so the regression line fits the data reasonably well. �
���&20387(56� The table below shows the percent of Americans with a broadband connection at home in a recentyear. Use linear extrapolation and a regression equation to estimate the percentage of 60-year-olds with broadband at home. �
62/87,21���Use a calculator to find the equation of the regression line.�
� y = ±0.34x + 49.48 � Substitute 60 into the equation. �
� So, about 29% of 60-year-olds have broadband at home.
���9$&$7,21� The Smiths want to rent a house on the lake that sleeps eight people. The cost of the house per night is based on how close it is to the water. �
� D�� Find and graph an equation for the median-fit line. � E�� What would you estimate is the cost of a rental 1.75 miles from the lake?
62/87,21���a. Use a calculator to find and graph the equation of the median fit line. �
y = í271.88x + 554.48
� b. To estimate the cost of a rental 1.75 miles from the lake, evaluate the equation of the median-fit line for x = 1.75.�
� An estimate of the cost of a rental 1.75 miles from the lake is $78.69.
Write an equation of the regression line for the data in each table. Then find the correlation coefficient.���6.<6&5$3(56� The table ranks the ten tallest buildings in the world. �
62/87,21���Use a calculator to find the equation of the regression line.�
� y = í2.75x + 102.53 � Use a calculator to find the correlation coefficient. � í0.6071
���086,&� 7KH�WDEOH�JLYHV�WKH�QXPEHU�RI�DQQXDO�YLROLQ�DXGLWLRQV�KHOG�E\�D�\RXWK�V\PSKRQ\�HDFK�\HDU�VLQFH��������/HW�x be the number of years since 2004. �
�
62/87,21���Use a calculator to find the equation of the regression line.�
� y = 3.54x + 19.68 � Use a calculator to find the correlation coefficient. � 0.9007
���5(7$,/� 7KH�WDEOH�JLYHV�WKH�VDOHV�RI�MHDQV�DW�D�FORWKLQJ�FKDLQ�VLQFH��������/HW�x be the number of years since ������ �
� a. Write an equation of the regression line. � b. Graph and analyze the residual plot.
62/87,21���a. Use a calculator to find the equation of the regression line. �
� The equation is about��\ = 3.32x + 5.20. � E��Use a calculator to graph the residual plot for the data. �
� The residuals appear to be randomly scattered. Therefore, the regression line fits the data well.
���0$5$7+21� 7KH�QXPEHU�RI�HQWUDQWV�LQ�WKH�%RVWRQ�0DUDWKRQ�HYHU\�ILYH�\HDUV�VLQFH������LV�VKRZQ���/HW�x be thenumber of years since 1975. �
� � D�� Find an equation for the median-fit line. � E�� According to the equation, how many entrants were there in 2003?
62/87,21���a. Let x = 0 for 1975. Use a calculator to find the equation of the median fit line. �
� y = 601.44x + 1236.13 � b. To estimate the number of entrants in 2003, evaluate the equation for the median-fit line for x = 2003 ± 1975 = 28.�
� There were about 18,076 entrants in 2003.
���&$03,1*� A campground kept a record of the number of campsites rented over the week of July 4 for several \HDUV���/HW�x be the number of years since 2000. �
� D�� Find an equation for the regression line. � E�� Predict the number of campsites that will be rented in 2012. � F�� Predict the number of campsites that will be rented in 2020.
62/87,21���a. Use a calculator to find an equation for the regression line. �
� y = 3.07x + 32.71 � b. To predict the number of campsites that will be rented in 2012, evaluate the regression equation for x = 12�
� There will be about 70 campsites rented in 2012. � c. To predict the number of campsites that will be rented in 2020, evaluate the regression equation for x = 20.�
� There will be about 94 campsites rented in 2020.
���,&(�&5($0� An ice cream company keeps a count of the tubs of cookie dough ice cream delivered to each of their stores in a particular area. ��
� D�� Find an equation for the median-fit line. � E�� Graph the points and the median-fit line. � F�� How many tubs would be delivered to a 1500-square-foot store? a 5000-square-foot store?
62/87,21���a. Use a calculator to find an equation for the median-fit line. �
� y = 0.095x í 94.58 � b. Plot the points and the equation. �
� c. To estimate the number of tubs to be delivered to a 1500-square-foot store, evaluate the regression equation for x = 1500. �
� There are about 48 tubs delivered to a 1500-square-foot store. To estimate the number of tubs to be delivered to a 5000-square-foot store, evaluate the regression equation for x = 5000. �
� There are about 380 tubs delivered to a 5000-square-foot store.
����CCSS SENSE-0$.,1*� The prices of the eight top-selling brands of jeans at Jeanie¶s Jeans are given in the table below. �
� D�� Find the equation for the regression line. � E�� According to the equation, what would be the price of a pair of the 12th best-selling brand? � F�� Is this a reasonable prediction? Explain.
62/87,21���a. Use a calculator to find an equation for the regression line. �
Step 1: Enter the data by pressing and selecting the EDIT option. Enter the sales rank into List 1 (L1). These will represent the x-values. Enter the price into List 2 (L2). These will represent the y-values. �
Step 2: Perform the regression by pressing �DQG�VHOHFWLQJ�WKH�CALC option. Scroll down to LinReg(ax+
b) and press . �
� y = 9.8x + 28.79 � b. To predict the price of a pair of the 12th bestselling brands of jeans, evaluate the regression equation for x = 12. �
� The price of a pair of the 12th bestselling brands of jeans would be about $146.39. � F�� Sample answer: No; the correlation between sales rank and price is too weak to make any reasonable prediction. The 12th bestselling brand of jeans could just as easily be a poorly made pair of jeans selling for $15.
����67$7(�)$,56� The table shows the total attendance, in millions of people, at the Minnesota State Fair from 2005 to 2009. �
� D��Graph a scatter plot of the data, where x = 1 represents 2005. Then find and graph the equation for the best-fit line. � b. Graph and analyze the residual plot. � c.��3UHGLFW�WKH�WRWDO�DWWHQGDQFH�LQ������ �
62/87,21���a. Enter the data from the table into the lists. Let x be the years starting with x = 1 for 2005 and let y = the attendence (in millions). Then graph the scatter plot. �
�
[0, 6] scl: 1 by [0, 3] scl: 0.5 � Perform the linear regression using the data in the lists. Find the equation of the best-fit line. �
� The equation is about y = 0.0326x + 1.598. � Use Y= to enter the equation into the calculator and graph the best-fit line with the scatter plot. �
[0, 6] scl: 1 by [0, 3] scl: 0.5 � b. Use the calculator to graph the residual plot for the data. �
� All the residuals appear to almost be on the line. Therefore, the regression line is a good fit for the data. � F���0HWKRG����To find the number of people in 2020, substitute 16 for x��
� Method 2: Copy the equation to the Y= list and graph. Use the value option to find the value of y when x = 16. �
[0, 17] scl: 1 by [0, 3] scl: 0.5 � 6R��WKHUH�ZLOO�EH�DERXW������PLOOLRQ�SHRSOH�LQ�������
����),5(),*+7(56� 7KH�WDEOH�VKRZV�VWDWLVWLFV�IURP�WKH�8�6��)LUH�$GPLQLVWUDWLRQ�� �
� D�� Find an equation for the median-fit line. � E�� Graph the points and the median-fit line. � F�� Does the median-fit line give you an accurate picture of the number of firefighters? Explain.
62/87,21���a. Use a calculator to find an equation for the median-fit line. �
Step 1: Enter the data by pressing and selecting the EDIT option. Enter age into List 1 (L1). These will represent the x-values. Enter the number of firefighters into List 2 (L2). These will represent the y-values. �
Step 2: Perform the regression by pressing and selecting the CALC option. Scroll down to Med-Med
and press �� �
� y = í841.42x + 223288 � b. Plot the points and graph the median fit line. �
� c. No, the median-fit line does not give an accurate picture of the number of firefighters. The points show no linear correlation; therefore a line cannot accurately portray the data.
����$7+/(7,&6� The table shows the total number of teens who participated in high school athletics in various years. �
� � D�� Find an equation for the regression line. � E�� According to the equation, how many participated in 1988?
62/87,21���a. Use a calculator to find an equation for the regression line. �
Step 1: Enter the data by pressing and selecting the EDIT option. Let the year 1970 be represented by 0. Enter the years since 1970 into List 1 (L1). These will represent the x-values. Enter the number of athletes into List 2 (L2). These will represent the y-values. �
Step 2: Perform the regression by pressing and selecting the CALC option. Scroll down to LinReg(ax+
b) and press . �
� y = 87,390.5x + 4,018,431 � b. To estimate the number of participants in 1988, evaluate the regression equation for x = 18 because 1988 is 18 years after 1970. �
� There were about 5,591,460 participants in 1988.
����$57� $�FRXQW�ZDV�NHSW�RQ�WKH�QXPEHU�RI�SDLQWLQJV�WKDW�VROG�DW�DQ�DXFWLRQ�E\�WKH�\HDU�LQ�ZKLFK�WKH\�ZHUH�SDLQWHG���Let x be the number of years since 1950. �
� D�� Find the equation for the linear regression line. � E�� How many paintings were sold that were painted in 1961? � F�� Is the linear regression equation an accurate model of the data? Explain why or why not.
62/87,21���a. 8VH�D�FDOFXODWRU�WR�ILQG�DQ�HTXDWLRQ�IRU�WKH�UHJUHVVLRQ�OLQH�� �
Step 1: Enter the data by pressing and selecting the EDIT option. Let x =0 for the year 1950.. Enter the years since 1950 into List 1 (L1). These will represent the x-values. Enter the number of painting sold into List 2 (L2). These will represent the y-values. �
Step 2: Perform the regression by pressing �DQG�VHOHFWLQJ�WKH�CALC option. Scroll down to LinReg(ax+
b) and press . � �
� y = 0.446x +9.43 � b. 7R�HVWLPDWH�WKH�QXPEHU�RI�SDLQWLQJV�VROG�LQ�������HYDOXDWH�WKH�UHJUHVVLRQ�HTXDWLRQ�IRU������ZKHQ��x =11. �
� There were about 14 paintings sold in 1961. � F�� No, the correlation coefficient is 0.48, so the linear model is not a good fit for the data. It does not appear from the data that there is a relationship between the number of paintings sold and the year they were painted.
����&&66�$5*80(176� Below are the results of the World Superpipe Championships in 2008.\ �
� � Find an equation of the regression line for each, and graph them on the same coordinate plane. Compare and contrast the men¶s and women's graphs.
62/87,21���Use a calculator to find an equation of the regression line for each set of data.� Men: y = í2.92x + 95.92 Women: y = í7x+106 � Graph the equations on the same coordinate plane. �
� The women¶s scores are typically lower than the men¶s.
����5($621,1*� For a class project, the scores that 10 randomly selected students earned on the first 8 tests of the VFKRRO�\HDU�DUH�JLYHQ��([SODLQ�KRZ�WR�ILQG�D�OLQH�RI��EHVW�ILW���&RXOG�LW�EH�XVHG�WR�SUHGLFW�WKH�VFRUHV�RI�RWKHU�VWXGHQWV"Explain your reasoning.
62/87,21���Apply a linear regression model to the data. Use the number of each test as the independent variable and the score on each test as the dependent variable. If there is no correlation, the r value will not be close to 1 or í1. If this is the case, the line of fit could not be used to predict the scores of the other students.
����23(1�(1'('� For 10 different people, measure their heights and the lengths of their heads from chin to top. Use these data to generate a linear regression equation and a median-fit equation. Make a prediction using both of the equations.
62/87,21���Student should gather and record data and use a calculator to find the equation of linear regression and a median-fit equation. Students should make predictions based on both equations. � 6DPSOH�GDWD��
� Median-fit (Store in Y1)
y = 8.31x ± 3.12 � /LQHDU�UHJUHVVLRQ���6WRUH�LQ Y2)
y = 7.39x + 5.22 � Find the height of a student with chin to top of head measure of 8.1. Use the value option from the CALC menu. Use the up arrow to move from one line to another. �
�
� The median-fit line predicts a student¶s height of 64.17 inches and the linear regression line predicts a height of 65.07.
Chin to 7RS��RI�
Head Measure Height8.8 70.99.1 72.89.3 73.87.5 61.08.4 66.37.8 62.08.5 67.38.8 68.98.3 68.78.9 71.5
����WRITING IN MATH How are lines of fit and linear regression similar? different?
62/87,21���Sample answer: Both lines of fit and linear regression are used to model data. However, you could have numerous lines of fit, while linear regression results in one line of best fit. If linear regression is used, you can also use the correlation coefficient to see how closely the model fits the data. For example, the scatter plot below displays the points (1, 10), (2, 17), (3, 15), (4, 20), (5, 28), (6, 19), and (7, 25). �
$�OLQH�RI�ILW�FRXOG�EH�GUDZQ�WKURXJK���������DQG����������7KH�HTXDWLRQ�RI�WKLV�OLQH�RI�ILW�LV�� .
� Use a calculator to find the equation of the regression line for this data. �
� The only regression line for this data has an equation of about y = 2.2x����������
����*(20(75<� Sam is putting a border around a poster. x represents the poster¶s width, and y represents the poster¶s length. Which equation represents how much border Sam will use if he doubles the length and the width? � $� 4xy � %� (x + y)4 � &� 4(x + y) � '� 16(x + y)
62/87,21���The perimeter of the room is found by . y is the length and x is the width, so . But Sam wants to double the border, so the perimeter becomes: �
� So, the correct choice is C.
����6+257�5(63216(� Tatiana wants to run 5 miles at an average pace of 9 minutes per mile. After 4 miles, her average pace is 9 minutes 10 seconds. In how many minutes must she complete the final mile to reach her goal?
62/87,21���Tatiana ran each of the first 4 miles in 10 more seconds than she planned. So to reach her goal, she must run the lastmile in 40 seconds less than she planned. 9 min ± 40 s = 8 min and 20 s.
����What is the slope of the line that passes through (1, 3) and (í3, 1)?� )� í2 �
*��
�
+��
� -� 2
62/87,21���
� So, the correct choice is H.
����What is an equation of the line that passes through (0, 1) and has a slope of 3?� $� y = 3x í 1 � %� y = 3x í 2 � &� y = 3x + 4 � '� y = 3x + 1
62/87,21���Find the y-intercept. �
� The equation is y = 3x + 1. So, the correct choice is D.
����86('�&$56� Gianna wants to buy a specific make and model of a used car. She researched prices from dealers and private sellers and made the graph shown. �
� D�� Describe the relationship in the data. � E�� Use the line of fit to predict the price of a car that is 7 years old. � F�� Is it reasonable to use this line of fit to predict the price of a 10-year old car? Explain.
62/87,21���a. Because y decreases as x increases, there is a negative correlation in the data. � b. Find x = 7 on the graph and follow the line up to the line of fit. According to the graph, the price of a car that is 7 years old would be about $3600. � c. No, it would not be reasonable to use this line of fit to predict the price of a 10-year old car, because according to the line of fit, the cost would be $0 and that doesn¶t make sense.
����*(20(75<� A quadrilateral has sides with equations y = í2x, 2x + y = 6, , and x í 2y = 9. Is the figure a rectangle? Explain your reasoning.
62/87,21���Write all of the equations in slope-intercept form. � Equation 1: y = í2x � (TXDWLRQ���� �
� (TXDWLRQ����
������������������y = x + 6 � Equation 4:� �
� Find the slope of each line �
� The slope of opposite sides are equal (±2 and ±���DQG�����DQG�������VR�WKH\�DUH�SDUDOOHO��$OVR��WKH�VORSH�RI�consecutive sides are opposite reciprocals (±2 and 0.5; and ±2 and 0.5), so they are perpendicular. So, the figure is a rectangle.
y = í2x í2y = ±2x +6 í2
y = 0.5x + 6
y = 0.5x ± 4.5
Write each equation in standard form.����y í 2 = 3(x í 1)
62/87,21���
����y í 5 = 6(x + 1)
62/87,21���
����y + 2 = í2(x í 5)
62/87,21���
����
62/87,21���
����
62/87,21���
����
62/87,21���
Find the slope of the line that passes through each pair of points.����(3, 4), (10, 8)
62/87,21���
����(í4, 7), (3, 5)
62/87,21���
����(3, 7), (í2, 4)
62/87,21���
����(í3, 2), (í3, 4)
62/87,21���
The slope is undefined.
If f (x) = x2 í x + 1, find each value.����f (í1)
62/87,21���
����f (5) í3
62/87,21���
����f (a)
62/87,21���
����f (b2)
62/87,21���
Graph each equation.����y = x + 2
62/87,21���To graph the equation, plot the y-intercept (0, 2). Then move up 1 unit and right 1 unit. Plot the point. Draw a line through the two points.
����x + 5y = 4
62/87,21���Write the equation in slope-intercept form. �
To graph the equation, plot the y-LQWHUFHSW�� . Then move down 1 unit and right 5 units. Plot the point. Draw a
line through the two points. �
����2x í 3y = 6
62/87,21���Write the equation in slope-intercept form. �
� To graph the equation, plot the y-intercept (0, ±2). Then move up 2 units and right 3 units. Plot the point. Draw a line through the two points. �
����5x + 2y = 6
62/87,21���Write the equation in slope-intercept form. �
� To graph the equation, plot the y-intercept (0, 3). Then move down 5 units and right 2 units. Plot the point. Draw a line through the two points. �
Another line of fit may pass through (2, 15) and (7, 25). The equation of this line of fit is y = 2x + 11. More lines of fit that come close to the points could be drawn.
eSolutions Manual - Powered by Cognero Page 26
4-6 Regression and Median-Fit Lines

���3277(5<� $�ORFDO�XQLYHUVLW\�LV�NHHSLQJ�WUDFN�RI�WKH�QXPEHU�RI�DUW�VWXGHQWV�ZKR�XVH�WKH�SRWWHU\�VWXGLR�HDFK�GD\�� �
� a. Write an equation of the regression line and find the correlation coefficient. � b. Graph the residual plot and determine if the regression line models the data well.
62/87,21���D��Use a calculator to find the equation of the regression line. � Step 1: Enter the data by pressing STAT and selecting the EDIT option. . Enter the day into List 1 (L1). These willrepresent the x-values. Enter the number of students into List 2 (L2). These will represent the y-values. � Step 2: Perform the regression by pressing STAT �DQG�VHOHFWLQJ�WKH�CALC option. Scroll down to LinReg(ax+ b) and press ENTER. �
� Substitute the values in for a and b to write the equation of the regression line. So, the equation is y = 1.18x + 11. � Identify the value of r on the calculator to find the correlation coefficient. So, 0.7181 is the correlation coefficient. � b.�7XUQ�RQ�Plot2 under the STAT PLOT menu and choose scatter plot. Use L1 for the Xlist and RESID for the Ylist. You can obtain RESID by pressing 2nd STAT and selecting RESID from the list of names. Graph the scatter plot of the residuals by pressing ZOOM and choosing ZoomStat. �
� The residuals appear to be randomly scattered, so the regression line fits the data reasonably well. �
���&20387(56� The table below shows the percent of Americans with a broadband connection at home in a recentyear. Use linear extrapolation and a regression equation to estimate the percentage of 60-year-olds with broadband at home. �
62/87,21���Use a calculator to find the equation of the regression line.�
� y = ±0.34x + 49.48 � Substitute 60 into the equation. �
� So, about 29% of 60-year-olds have broadband at home.
���9$&$7,21� The Smiths want to rent a house on the lake that sleeps eight people. The cost of the house per night is based on how close it is to the water. �
� D�� Find and graph an equation for the median-fit line. � E�� What would you estimate is the cost of a rental 1.75 miles from the lake?
62/87,21���a. Use a calculator to find and graph the equation of the median fit line. �
y = í271.88x + 554.48
� b. To estimate the cost of a rental 1.75 miles from the lake, evaluate the equation of the median-fit line for x = 1.75.�
� An estimate of the cost of a rental 1.75 miles from the lake is $78.69.
Write an equation of the regression line for the data in each table. Then find the correlation coefficient.���6.<6&5$3(56� The table ranks the ten tallest buildings in the world. �
62/87,21���Use a calculator to find the equation of the regression line.�
� y = í2.75x + 102.53 � Use a calculator to find the correlation coefficient. � í0.6071
���086,&� 7KH�WDEOH�JLYHV�WKH�QXPEHU�RI�DQQXDO�YLROLQ�DXGLWLRQV�KHOG�E\�D�\RXWK�V\PSKRQ\�HDFK�\HDU�VLQFH��������/HW�x be the number of years since 2004. �
�
62/87,21���Use a calculator to find the equation of the regression line.�
� y = 3.54x + 19.68 � Use a calculator to find the correlation coefficient. � 0.9007
���5(7$,/� 7KH�WDEOH�JLYHV�WKH�VDOHV�RI�MHDQV�DW�D�FORWKLQJ�FKDLQ�VLQFH��������/HW�x be the number of years since ������ �
� a. Write an equation of the regression line. � b. Graph and analyze the residual plot.
62/87,21���a. Use a calculator to find the equation of the regression line. �
� The equation is about��\ = 3.32x + 5.20. � E��Use a calculator to graph the residual plot for the data. �
� The residuals appear to be randomly scattered. Therefore, the regression line fits the data well.
���0$5$7+21� 7KH�QXPEHU�RI�HQWUDQWV�LQ�WKH�%RVWRQ�0DUDWKRQ�HYHU\�ILYH�\HDUV�VLQFH������LV�VKRZQ���/HW�x be thenumber of years since 1975. �
� � D�� Find an equation for the median-fit line. � E�� According to the equation, how many entrants were there in 2003?
62/87,21���a. Let x = 0 for 1975. Use a calculator to find the equation of the median fit line. �
� y = 601.44x + 1236.13 � b. To estimate the number of entrants in 2003, evaluate the equation for the median-fit line for x = 2003 ± 1975 = 28.�
� There were about 18,076 entrants in 2003.
���&$03,1*� A campground kept a record of the number of campsites rented over the week of July 4 for several \HDUV���/HW�x be the number of years since 2000. �
� D�� Find an equation for the regression line. � E�� Predict the number of campsites that will be rented in 2012. � F�� Predict the number of campsites that will be rented in 2020.
62/87,21���a. Use a calculator to find an equation for the regression line. �
� y = 3.07x + 32.71 � b. To predict the number of campsites that will be rented in 2012, evaluate the regression equation for x = 12�
� There will be about 70 campsites rented in 2012. � c. To predict the number of campsites that will be rented in 2020, evaluate the regression equation for x = 20.�
� There will be about 94 campsites rented in 2020.
���,&(�&5($0� An ice cream company keeps a count of the tubs of cookie dough ice cream delivered to each of their stores in a particular area. ��
� D�� Find an equation for the median-fit line. � E�� Graph the points and the median-fit line. � F�� How many tubs would be delivered to a 1500-square-foot store? a 5000-square-foot store?
62/87,21���a. Use a calculator to find an equation for the median-fit line. �
� y = 0.095x í 94.58 � b. Plot the points and the equation. �
� c. To estimate the number of tubs to be delivered to a 1500-square-foot store, evaluate the regression equation for x = 1500. �
� There are about 48 tubs delivered to a 1500-square-foot store. To estimate the number of tubs to be delivered to a 5000-square-foot store, evaluate the regression equation for x = 5000. �
� There are about 380 tubs delivered to a 5000-square-foot store.
����CCSS SENSE-0$.,1*� The prices of the eight top-selling brands of jeans at Jeanie¶s Jeans are given in the table below. �
� D�� Find the equation for the regression line. � E�� According to the equation, what would be the price of a pair of the 12th best-selling brand? � F�� Is this a reasonable prediction? Explain.
62/87,21���a. Use a calculator to find an equation for the regression line. �
Step 1: Enter the data by pressing and selecting the EDIT option. Enter the sales rank into List 1 (L1). These will represent the x-values. Enter the price into List 2 (L2). These will represent the y-values. �
Step 2: Perform the regression by pressing �DQG�VHOHFWLQJ�WKH�CALC option. Scroll down to LinReg(ax+
b) and press . �
� y = 9.8x + 28.79 � b. To predict the price of a pair of the 12th bestselling brands of jeans, evaluate the regression equation for x = 12. �
� The price of a pair of the 12th bestselling brands of jeans would be about $146.39. � F�� Sample answer: No; the correlation between sales rank and price is too weak to make any reasonable prediction. The 12th bestselling brand of jeans could just as easily be a poorly made pair of jeans selling for $15.
����67$7(�)$,56� The table shows the total attendance, in millions of people, at the Minnesota State Fair from 2005 to 2009. �
� D��Graph a scatter plot of the data, where x = 1 represents 2005. Then find and graph the equation for the best-fit line. � b. Graph and analyze the residual plot. � c.��3UHGLFW�WKH�WRWDO�DWWHQGDQFH�LQ������ �
62/87,21���a. Enter the data from the table into the lists. Let x be the years starting with x = 1 for 2005 and let y = the attendence (in millions). Then graph the scatter plot. �
�
[0, 6] scl: 1 by [0, 3] scl: 0.5 � Perform the linear regression using the data in the lists. Find the equation of the best-fit line. �
� The equation is about y = 0.0326x + 1.598. � Use Y= to enter the equation into the calculator and graph the best-fit line with the scatter plot. �
[0, 6] scl: 1 by [0, 3] scl: 0.5 � b. Use the calculator to graph the residual plot for the data. �
� All the residuals appear to almost be on the line. Therefore, the regression line is a good fit for the data. � F���0HWKRG����To find the number of people in 2020, substitute 16 for x��
� Method 2: Copy the equation to the Y= list and graph. Use the value option to find the value of y when x = 16. �
[0, 17] scl: 1 by [0, 3] scl: 0.5 � 6R��WKHUH�ZLOO�EH�DERXW������PLOOLRQ�SHRSOH�LQ�������
����),5(),*+7(56� 7KH�WDEOH�VKRZV�VWDWLVWLFV�IURP�WKH�8�6��)LUH�$GPLQLVWUDWLRQ�� �
� D�� Find an equation for the median-fit line. � E�� Graph the points and the median-fit line. � F�� Does the median-fit line give you an accurate picture of the number of firefighters? Explain.
62/87,21���a. Use a calculator to find an equation for the median-fit line. �
Step 1: Enter the data by pressing and selecting the EDIT option. Enter age into List 1 (L1). These will represent the x-values. Enter the number of firefighters into List 2 (L2). These will represent the y-values. �
Step 2: Perform the regression by pressing and selecting the CALC option. Scroll down to Med-Med
and press �� �
� y = í841.42x + 223288 � b. Plot the points and graph the median fit line. �
� c. No, the median-fit line does not give an accurate picture of the number of firefighters. The points show no linear correlation; therefore a line cannot accurately portray the data.
����$7+/(7,&6� The table shows the total number of teens who participated in high school athletics in various years. �
� � D�� Find an equation for the regression line. � E�� According to the equation, how many participated in 1988?
62/87,21���a. Use a calculator to find an equation for the regression line. �
Step 1: Enter the data by pressing and selecting the EDIT option. Let the year 1970 be represented by 0. Enter the years since 1970 into List 1 (L1). These will represent the x-values. Enter the number of athletes into List 2 (L2). These will represent the y-values. �
Step 2: Perform the regression by pressing and selecting the CALC option. Scroll down to LinReg(ax+
b) and press . �
� y = 87,390.5x + 4,018,431 � b. To estimate the number of participants in 1988, evaluate the regression equation for x = 18 because 1988 is 18 years after 1970. �
� There were about 5,591,460 participants in 1988.
����$57� $�FRXQW�ZDV�NHSW�RQ�WKH�QXPEHU�RI�SDLQWLQJV�WKDW�VROG�DW�DQ�DXFWLRQ�E\�WKH�\HDU�LQ�ZKLFK�WKH\�ZHUH�SDLQWHG���Let x be the number of years since 1950. �
� D�� Find the equation for the linear regression line. � E�� How many paintings were sold that were painted in 1961? � F�� Is the linear regression equation an accurate model of the data? Explain why or why not.
62/87,21���a. 8VH�D�FDOFXODWRU�WR�ILQG�DQ�HTXDWLRQ�IRU�WKH�UHJUHVVLRQ�OLQH�� �
Step 1: Enter the data by pressing and selecting the EDIT option. Let x =0 for the year 1950.. Enter the years since 1950 into List 1 (L1). These will represent the x-values. Enter the number of painting sold into List 2 (L2). These will represent the y-values. �
Step 2: Perform the regression by pressing �DQG�VHOHFWLQJ�WKH�CALC option. Scroll down to LinReg(ax+
b) and press . � �
� y = 0.446x +9.43 � b. 7R�HVWLPDWH�WKH�QXPEHU�RI�SDLQWLQJV�VROG�LQ�������HYDOXDWH�WKH�UHJUHVVLRQ�HTXDWLRQ�IRU������ZKHQ��x =11. �
� There were about 14 paintings sold in 1961. � F�� No, the correlation coefficient is 0.48, so the linear model is not a good fit for the data. It does not appear from the data that there is a relationship between the number of paintings sold and the year they were painted.
����&&66�$5*80(176� Below are the results of the World Superpipe Championships in 2008.\ �
� � Find an equation of the regression line for each, and graph them on the same coordinate plane. Compare and contrast the men¶s and women's graphs.
62/87,21���Use a calculator to find an equation of the regression line for each set of data.� Men: y = í2.92x + 95.92 Women: y = í7x+106 � Graph the equations on the same coordinate plane. �
� The women¶s scores are typically lower than the men¶s.
����5($621,1*� For a class project, the scores that 10 randomly selected students earned on the first 8 tests of the VFKRRO�\HDU�DUH�JLYHQ��([SODLQ�KRZ�WR�ILQG�D�OLQH�RI��EHVW�ILW���&RXOG�LW�EH�XVHG�WR�SUHGLFW�WKH�VFRUHV�RI�RWKHU�VWXGHQWV"Explain your reasoning.
62/87,21���Apply a linear regression model to the data. Use the number of each test as the independent variable and the score on each test as the dependent variable. If there is no correlation, the r value will not be close to 1 or í1. If this is the case, the line of fit could not be used to predict the scores of the other students.
����23(1�(1'('� For 10 different people, measure their heights and the lengths of their heads from chin to top. Use these data to generate a linear regression equation and a median-fit equation. Make a prediction using both of the equations.
62/87,21���Student should gather and record data and use a calculator to find the equation of linear regression and a median-fit equation. Students should make predictions based on both equations. � 6DPSOH�GDWD��
� Median-fit (Store in Y1)
y = 8.31x ± 3.12 � /LQHDU�UHJUHVVLRQ���6WRUH�LQ Y2)
y = 7.39x + 5.22 � Find the height of a student with chin to top of head measure of 8.1. Use the value option from the CALC menu. Use the up arrow to move from one line to another. �
�
� The median-fit line predicts a student¶s height of 64.17 inches and the linear regression line predicts a height of 65.07.
Chin to 7RS��RI�
Head Measure Height8.8 70.99.1 72.89.3 73.87.5 61.08.4 66.37.8 62.08.5 67.38.8 68.98.3 68.78.9 71.5
����WRITING IN MATH How are lines of fit and linear regression similar? different?
62/87,21���Sample answer: Both lines of fit and linear regression are used to model data. However, you could have numerous lines of fit, while linear regression results in one line of best fit. If linear regression is used, you can also use the correlation coefficient to see how closely the model fits the data. For example, the scatter plot below displays the points (1, 10), (2, 17), (3, 15), (4, 20), (5, 28), (6, 19), and (7, 25). �
$�OLQH�RI�ILW�FRXOG�EH�GUDZQ�WKURXJK���������DQG����������7KH�HTXDWLRQ�RI�WKLV�OLQH�RI�ILW�LV�� .
� Use a calculator to find the equation of the regression line for this data. �
� The only regression line for this data has an equation of about y = 2.2x����������
����*(20(75<� Sam is putting a border around a poster. x represents the poster¶s width, and y represents the poster¶s length. Which equation represents how much border Sam will use if he doubles the length and the width? � $� 4xy � %� (x + y)4 � &� 4(x + y) � '� 16(x + y)
62/87,21���The perimeter of the room is found by . y is the length and x is the width, so . But Sam wants to double the border, so the perimeter becomes: �
� So, the correct choice is C.
����6+257�5(63216(� Tatiana wants to run 5 miles at an average pace of 9 minutes per mile. After 4 miles, her average pace is 9 minutes 10 seconds. In how many minutes must she complete the final mile to reach her goal?
62/87,21���Tatiana ran each of the first 4 miles in 10 more seconds than she planned. So to reach her goal, she must run the lastmile in 40 seconds less than she planned. 9 min ± 40 s = 8 min and 20 s.
����What is the slope of the line that passes through (1, 3) and (í3, 1)?� )� í2 �
*��
�
+��
� -� 2
62/87,21���
� So, the correct choice is H.
����What is an equation of the line that passes through (0, 1) and has a slope of 3?� $� y = 3x í 1 � %� y = 3x í 2 � &� y = 3x + 4 � '� y = 3x + 1
62/87,21���Find the y-intercept. �
� The equation is y = 3x + 1. So, the correct choice is D.
����86('�&$56� Gianna wants to buy a specific make and model of a used car. She researched prices from dealers and private sellers and made the graph shown. �
� D�� Describe the relationship in the data. � E�� Use the line of fit to predict the price of a car that is 7 years old. � F�� Is it reasonable to use this line of fit to predict the price of a 10-year old car? Explain.
62/87,21���a. Because y decreases as x increases, there is a negative correlation in the data. � b. Find x = 7 on the graph and follow the line up to the line of fit. According to the graph, the price of a car that is 7 years old would be about $3600. � c. No, it would not be reasonable to use this line of fit to predict the price of a 10-year old car, because according to the line of fit, the cost would be $0 and that doesn¶t make sense.
����*(20(75<� A quadrilateral has sides with equations y = í2x, 2x + y = 6, , and x í 2y = 9. Is the figure a rectangle? Explain your reasoning.
62/87,21���Write all of the equations in slope-intercept form. � Equation 1: y = í2x � (TXDWLRQ���� �
� (TXDWLRQ����
������������������y = x + 6 � Equation 4:� �
� Find the slope of each line �
� The slope of opposite sides are equal (±2 and ±���DQG�����DQG�������VR�WKH\�DUH�SDUDOOHO��$OVR��WKH�VORSH�RI�consecutive sides are opposite reciprocals (±2 and 0.5; and ±2 and 0.5), so they are perpendicular. So, the figure is a rectangle.
y = í2x í2y = ±2x +6 í2
y = 0.5x + 6
y = 0.5x ± 4.5
Write each equation in standard form.����y í 2 = 3(x í 1)
62/87,21���
����y í 5 = 6(x + 1)
62/87,21���
����y + 2 = í2(x í 5)
62/87,21���
����
62/87,21���
����
62/87,21���
����
62/87,21���
Find the slope of the line that passes through each pair of points.����(3, 4), (10, 8)
62/87,21���
����(í4, 7), (3, 5)
62/87,21���
����(3, 7), (í2, 4)
62/87,21���
����(í3, 2), (í3, 4)
62/87,21���
The slope is undefined.
If f (x) = x2 í x + 1, find each value.����f (í1)
62/87,21���
����f (5) í3
62/87,21���
����f (a)
62/87,21���
����f (b2)
62/87,21���
Graph each equation.����y = x + 2
62/87,21���To graph the equation, plot the y-intercept (0, 2). Then move up 1 unit and right 1 unit. Plot the point. Draw a line through the two points.
����x + 5y = 4
62/87,21���Write the equation in slope-intercept form. �
To graph the equation, plot the y-LQWHUFHSW�� . Then move down 1 unit and right 5 units. Plot the point. Draw a
line through the two points. �
����2x í 3y = 6
62/87,21���Write the equation in slope-intercept form. �
� To graph the equation, plot the y-intercept (0, ±2). Then move up 2 units and right 3 units. Plot the point. Draw a line through the two points. �
����5x + 2y = 6
62/87,21���Write the equation in slope-intercept form. �
� To graph the equation, plot the y-intercept (0, 3). Then move down 5 units and right 2 units. Plot the point. Draw a line through the two points. �
Another line of fit may pass through (2, 15) and (7, 25). The equation of this line of fit is y = 2x + 11. More lines of fit that come close to the points could be drawn.
eSolutions Manual - Powered by Cognero Page 27
4-6 Regression and Median-Fit Lines

���3277(5<� $�ORFDO�XQLYHUVLW\�LV�NHHSLQJ�WUDFN�RI�WKH�QXPEHU�RI�DUW�VWXGHQWV�ZKR�XVH�WKH�SRWWHU\�VWXGLR�HDFK�GD\�� �
� a. Write an equation of the regression line and find the correlation coefficient. � b. Graph the residual plot and determine if the regression line models the data well.
62/87,21���D��Use a calculator to find the equation of the regression line. � Step 1: Enter the data by pressing STAT and selecting the EDIT option. . Enter the day into List 1 (L1). These willrepresent the x-values. Enter the number of students into List 2 (L2). These will represent the y-values. � Step 2: Perform the regression by pressing STAT �DQG�VHOHFWLQJ�WKH�CALC option. Scroll down to LinReg(ax+ b) and press ENTER. �
� Substitute the values in for a and b to write the equation of the regression line. So, the equation is y = 1.18x + 11. � Identify the value of r on the calculator to find the correlation coefficient. So, 0.7181 is the correlation coefficient. � b.�7XUQ�RQ�Plot2 under the STAT PLOT menu and choose scatter plot. Use L1 for the Xlist and RESID for the Ylist. You can obtain RESID by pressing 2nd STAT and selecting RESID from the list of names. Graph the scatter plot of the residuals by pressing ZOOM and choosing ZoomStat. �
� The residuals appear to be randomly scattered, so the regression line fits the data reasonably well. �
���&20387(56� The table below shows the percent of Americans with a broadband connection at home in a recentyear. Use linear extrapolation and a regression equation to estimate the percentage of 60-year-olds with broadband at home. �
62/87,21���Use a calculator to find the equation of the regression line.�
� y = ±0.34x + 49.48 � Substitute 60 into the equation. �
� So, about 29% of 60-year-olds have broadband at home.
���9$&$7,21� The Smiths want to rent a house on the lake that sleeps eight people. The cost of the house per night is based on how close it is to the water. �
� D�� Find and graph an equation for the median-fit line. � E�� What would you estimate is the cost of a rental 1.75 miles from the lake?
62/87,21���a. Use a calculator to find and graph the equation of the median fit line. �
y = í271.88x + 554.48
� b. To estimate the cost of a rental 1.75 miles from the lake, evaluate the equation of the median-fit line for x = 1.75.�
� An estimate of the cost of a rental 1.75 miles from the lake is $78.69.
Write an equation of the regression line for the data in each table. Then find the correlation coefficient.���6.<6&5$3(56� The table ranks the ten tallest buildings in the world. �
62/87,21���Use a calculator to find the equation of the regression line.�
� y = í2.75x + 102.53 � Use a calculator to find the correlation coefficient. � í0.6071
���086,&� 7KH�WDEOH�JLYHV�WKH�QXPEHU�RI�DQQXDO�YLROLQ�DXGLWLRQV�KHOG�E\�D�\RXWK�V\PSKRQ\�HDFK�\HDU�VLQFH��������/HW�x be the number of years since 2004. �
�
62/87,21���Use a calculator to find the equation of the regression line.�
� y = 3.54x + 19.68 � Use a calculator to find the correlation coefficient. � 0.9007
���5(7$,/� 7KH�WDEOH�JLYHV�WKH�VDOHV�RI�MHDQV�DW�D�FORWKLQJ�FKDLQ�VLQFH��������/HW�x be the number of years since ������ �
� a. Write an equation of the regression line. � b. Graph and analyze the residual plot.
62/87,21���a. Use a calculator to find the equation of the regression line. �
� The equation is about��\ = 3.32x + 5.20. � E��Use a calculator to graph the residual plot for the data. �
� The residuals appear to be randomly scattered. Therefore, the regression line fits the data well.
���0$5$7+21� 7KH�QXPEHU�RI�HQWUDQWV�LQ�WKH�%RVWRQ�0DUDWKRQ�HYHU\�ILYH�\HDUV�VLQFH������LV�VKRZQ���/HW�x be thenumber of years since 1975. �
� � D�� Find an equation for the median-fit line. � E�� According to the equation, how many entrants were there in 2003?
62/87,21���a. Let x = 0 for 1975. Use a calculator to find the equation of the median fit line. �
� y = 601.44x + 1236.13 � b. To estimate the number of entrants in 2003, evaluate the equation for the median-fit line for x = 2003 ± 1975 = 28.�
� There were about 18,076 entrants in 2003.
���&$03,1*� A campground kept a record of the number of campsites rented over the week of July 4 for several \HDUV���/HW�x be the number of years since 2000. �
� D�� Find an equation for the regression line. � E�� Predict the number of campsites that will be rented in 2012. � F�� Predict the number of campsites that will be rented in 2020.
62/87,21���a. Use a calculator to find an equation for the regression line. �
� y = 3.07x + 32.71 � b. To predict the number of campsites that will be rented in 2012, evaluate the regression equation for x = 12�
� There will be about 70 campsites rented in 2012. � c. To predict the number of campsites that will be rented in 2020, evaluate the regression equation for x = 20.�
� There will be about 94 campsites rented in 2020.
���,&(�&5($0� An ice cream company keeps a count of the tubs of cookie dough ice cream delivered to each of their stores in a particular area. ��
� D�� Find an equation for the median-fit line. � E�� Graph the points and the median-fit line. � F�� How many tubs would be delivered to a 1500-square-foot store? a 5000-square-foot store?
62/87,21���a. Use a calculator to find an equation for the median-fit line. �
� y = 0.095x í 94.58 � b. Plot the points and the equation. �
� c. To estimate the number of tubs to be delivered to a 1500-square-foot store, evaluate the regression equation for x = 1500. �
� There are about 48 tubs delivered to a 1500-square-foot store. To estimate the number of tubs to be delivered to a 5000-square-foot store, evaluate the regression equation for x = 5000. �
� There are about 380 tubs delivered to a 5000-square-foot store.
����CCSS SENSE-0$.,1*� The prices of the eight top-selling brands of jeans at Jeanie¶s Jeans are given in the table below. �
� D�� Find the equation for the regression line. � E�� According to the equation, what would be the price of a pair of the 12th best-selling brand? � F�� Is this a reasonable prediction? Explain.
62/87,21���a. Use a calculator to find an equation for the regression line. �
Step 1: Enter the data by pressing and selecting the EDIT option. Enter the sales rank into List 1 (L1). These will represent the x-values. Enter the price into List 2 (L2). These will represent the y-values. �
Step 2: Perform the regression by pressing �DQG�VHOHFWLQJ�WKH�CALC option. Scroll down to LinReg(ax+
b) and press . �
� y = 9.8x + 28.79 � b. To predict the price of a pair of the 12th bestselling brands of jeans, evaluate the regression equation for x = 12. �
� The price of a pair of the 12th bestselling brands of jeans would be about $146.39. � F�� Sample answer: No; the correlation between sales rank and price is too weak to make any reasonable prediction. The 12th bestselling brand of jeans could just as easily be a poorly made pair of jeans selling for $15.
����67$7(�)$,56� The table shows the total attendance, in millions of people, at the Minnesota State Fair from 2005 to 2009. �
� D��Graph a scatter plot of the data, where x = 1 represents 2005. Then find and graph the equation for the best-fit line. � b. Graph and analyze the residual plot. � c.��3UHGLFW�WKH�WRWDO�DWWHQGDQFH�LQ������ �
62/87,21���a. Enter the data from the table into the lists. Let x be the years starting with x = 1 for 2005 and let y = the attendence (in millions). Then graph the scatter plot. �
�
[0, 6] scl: 1 by [0, 3] scl: 0.5 � Perform the linear regression using the data in the lists. Find the equation of the best-fit line. �
� The equation is about y = 0.0326x + 1.598. � Use Y= to enter the equation into the calculator and graph the best-fit line with the scatter plot. �
[0, 6] scl: 1 by [0, 3] scl: 0.5 � b. Use the calculator to graph the residual plot for the data. �
� All the residuals appear to almost be on the line. Therefore, the regression line is a good fit for the data. � F���0HWKRG����To find the number of people in 2020, substitute 16 for x��
� Method 2: Copy the equation to the Y= list and graph. Use the value option to find the value of y when x = 16. �
[0, 17] scl: 1 by [0, 3] scl: 0.5 � 6R��WKHUH�ZLOO�EH�DERXW������PLOOLRQ�SHRSOH�LQ�������
����),5(),*+7(56� 7KH�WDEOH�VKRZV�VWDWLVWLFV�IURP�WKH�8�6��)LUH�$GPLQLVWUDWLRQ�� �
� D�� Find an equation for the median-fit line. � E�� Graph the points and the median-fit line. � F�� Does the median-fit line give you an accurate picture of the number of firefighters? Explain.
62/87,21���a. Use a calculator to find an equation for the median-fit line. �
Step 1: Enter the data by pressing and selecting the EDIT option. Enter age into List 1 (L1). These will represent the x-values. Enter the number of firefighters into List 2 (L2). These will represent the y-values. �
Step 2: Perform the regression by pressing and selecting the CALC option. Scroll down to Med-Med
and press �� �
� y = í841.42x + 223288 � b. Plot the points and graph the median fit line. �
� c. No, the median-fit line does not give an accurate picture of the number of firefighters. The points show no linear correlation; therefore a line cannot accurately portray the data.
����$7+/(7,&6� The table shows the total number of teens who participated in high school athletics in various years. �
� � D�� Find an equation for the regression line. � E�� According to the equation, how many participated in 1988?
62/87,21���a. Use a calculator to find an equation for the regression line. �
Step 1: Enter the data by pressing and selecting the EDIT option. Let the year 1970 be represented by 0. Enter the years since 1970 into List 1 (L1). These will represent the x-values. Enter the number of athletes into List 2 (L2). These will represent the y-values. �
Step 2: Perform the regression by pressing and selecting the CALC option. Scroll down to LinReg(ax+
b) and press . �
� y = 87,390.5x + 4,018,431 � b. To estimate the number of participants in 1988, evaluate the regression equation for x = 18 because 1988 is 18 years after 1970. �
� There were about 5,591,460 participants in 1988.
����$57� $�FRXQW�ZDV�NHSW�RQ�WKH�QXPEHU�RI�SDLQWLQJV�WKDW�VROG�DW�DQ�DXFWLRQ�E\�WKH�\HDU�LQ�ZKLFK�WKH\�ZHUH�SDLQWHG���Let x be the number of years since 1950. �
� D�� Find the equation for the linear regression line. � E�� How many paintings were sold that were painted in 1961? � F�� Is the linear regression equation an accurate model of the data? Explain why or why not.
62/87,21���a. 8VH�D�FDOFXODWRU�WR�ILQG�DQ�HTXDWLRQ�IRU�WKH�UHJUHVVLRQ�OLQH�� �
Step 1: Enter the data by pressing and selecting the EDIT option. Let x =0 for the year 1950.. Enter the years since 1950 into List 1 (L1). These will represent the x-values. Enter the number of painting sold into List 2 (L2). These will represent the y-values. �
Step 2: Perform the regression by pressing �DQG�VHOHFWLQJ�WKH�CALC option. Scroll down to LinReg(ax+
b) and press . � �
� y = 0.446x +9.43 � b. 7R�HVWLPDWH�WKH�QXPEHU�RI�SDLQWLQJV�VROG�LQ�������HYDOXDWH�WKH�UHJUHVVLRQ�HTXDWLRQ�IRU������ZKHQ��x =11. �
� There were about 14 paintings sold in 1961. � F�� No, the correlation coefficient is 0.48, so the linear model is not a good fit for the data. It does not appear from the data that there is a relationship between the number of paintings sold and the year they were painted.
����&&66�$5*80(176� Below are the results of the World Superpipe Championships in 2008.\ �
� � Find an equation of the regression line for each, and graph them on the same coordinate plane. Compare and contrast the men¶s and women's graphs.
62/87,21���Use a calculator to find an equation of the regression line for each set of data.� Men: y = í2.92x + 95.92 Women: y = í7x+106 � Graph the equations on the same coordinate plane. �
� The women¶s scores are typically lower than the men¶s.
����5($621,1*� For a class project, the scores that 10 randomly selected students earned on the first 8 tests of the VFKRRO�\HDU�DUH�JLYHQ��([SODLQ�KRZ�WR�ILQG�D�OLQH�RI��EHVW�ILW���&RXOG�LW�EH�XVHG�WR�SUHGLFW�WKH�VFRUHV�RI�RWKHU�VWXGHQWV"Explain your reasoning.
62/87,21���Apply a linear regression model to the data. Use the number of each test as the independent variable and the score on each test as the dependent variable. If there is no correlation, the r value will not be close to 1 or í1. If this is the case, the line of fit could not be used to predict the scores of the other students.
����23(1�(1'('� For 10 different people, measure their heights and the lengths of their heads from chin to top. Use these data to generate a linear regression equation and a median-fit equation. Make a prediction using both of the equations.
62/87,21���Student should gather and record data and use a calculator to find the equation of linear regression and a median-fit equation. Students should make predictions based on both equations. � 6DPSOH�GDWD��
� Median-fit (Store in Y1)
y = 8.31x ± 3.12 � /LQHDU�UHJUHVVLRQ���6WRUH�LQ Y2)
y = 7.39x + 5.22 � Find the height of a student with chin to top of head measure of 8.1. Use the value option from the CALC menu. Use the up arrow to move from one line to another. �
�
� The median-fit line predicts a student¶s height of 64.17 inches and the linear regression line predicts a height of 65.07.
Chin to 7RS��RI�
Head Measure Height8.8 70.99.1 72.89.3 73.87.5 61.08.4 66.37.8 62.08.5 67.38.8 68.98.3 68.78.9 71.5
����WRITING IN MATH How are lines of fit and linear regression similar? different?
62/87,21���Sample answer: Both lines of fit and linear regression are used to model data. However, you could have numerous lines of fit, while linear regression results in one line of best fit. If linear regression is used, you can also use the correlation coefficient to see how closely the model fits the data. For example, the scatter plot below displays the points (1, 10), (2, 17), (3, 15), (4, 20), (5, 28), (6, 19), and (7, 25). �
$�OLQH�RI�ILW�FRXOG�EH�GUDZQ�WKURXJK���������DQG����������7KH�HTXDWLRQ�RI�WKLV�OLQH�RI�ILW�LV�� .
� Use a calculator to find the equation of the regression line for this data. �
� The only regression line for this data has an equation of about y = 2.2x����������
����*(20(75<� Sam is putting a border around a poster. x represents the poster¶s width, and y represents the poster¶s length. Which equation represents how much border Sam will use if he doubles the length and the width? � $� 4xy � %� (x + y)4 � &� 4(x + y) � '� 16(x + y)
62/87,21���The perimeter of the room is found by . y is the length and x is the width, so . But Sam wants to double the border, so the perimeter becomes: �
� So, the correct choice is C.
����6+257�5(63216(� Tatiana wants to run 5 miles at an average pace of 9 minutes per mile. After 4 miles, her average pace is 9 minutes 10 seconds. In how many minutes must she complete the final mile to reach her goal?
62/87,21���Tatiana ran each of the first 4 miles in 10 more seconds than she planned. So to reach her goal, she must run the lastmile in 40 seconds less than she planned. 9 min ± 40 s = 8 min and 20 s.
����What is the slope of the line that passes through (1, 3) and (í3, 1)?� )� í2 �
*��
�
+��
� -� 2
62/87,21���
� So, the correct choice is H.
����What is an equation of the line that passes through (0, 1) and has a slope of 3?� $� y = 3x í 1 � %� y = 3x í 2 � &� y = 3x + 4 � '� y = 3x + 1
62/87,21���Find the y-intercept. �
� The equation is y = 3x + 1. So, the correct choice is D.
����86('�&$56� Gianna wants to buy a specific make and model of a used car. She researched prices from dealers and private sellers and made the graph shown. �
� D�� Describe the relationship in the data. � E�� Use the line of fit to predict the price of a car that is 7 years old. � F�� Is it reasonable to use this line of fit to predict the price of a 10-year old car? Explain.
62/87,21���a. Because y decreases as x increases, there is a negative correlation in the data. � b. Find x = 7 on the graph and follow the line up to the line of fit. According to the graph, the price of a car that is 7 years old would be about $3600. � c. No, it would not be reasonable to use this line of fit to predict the price of a 10-year old car, because according to the line of fit, the cost would be $0 and that doesn¶t make sense.
����*(20(75<� A quadrilateral has sides with equations y = í2x, 2x + y = 6, , and x í 2y = 9. Is the figure a rectangle? Explain your reasoning.
62/87,21���Write all of the equations in slope-intercept form. � Equation 1: y = í2x � (TXDWLRQ���� �
� (TXDWLRQ����
������������������y = x + 6 � Equation 4:� �
� Find the slope of each line �
� The slope of opposite sides are equal (±2 and ±���DQG�����DQG�������VR�WKH\�DUH�SDUDOOHO��$OVR��WKH�VORSH�RI�consecutive sides are opposite reciprocals (±2 and 0.5; and ±2 and 0.5), so they are perpendicular. So, the figure is a rectangle.
y = í2x í2y = ±2x +6 í2
y = 0.5x + 6
y = 0.5x ± 4.5
Write each equation in standard form.����y í 2 = 3(x í 1)
62/87,21���
����y í 5 = 6(x + 1)
62/87,21���
����y + 2 = í2(x í 5)
62/87,21���
����
62/87,21���
����
62/87,21���
����
62/87,21���
Find the slope of the line that passes through each pair of points.����(3, 4), (10, 8)
62/87,21���
����(í4, 7), (3, 5)
62/87,21���
����(3, 7), (í2, 4)
62/87,21���
����(í3, 2), (í3, 4)
62/87,21���
The slope is undefined.
If f (x) = x2 í x + 1, find each value.����f (í1)
62/87,21���
����f (5) í3
62/87,21���
����f (a)
62/87,21���
����f (b2)
62/87,21���
Graph each equation.����y = x + 2
62/87,21���To graph the equation, plot the y-intercept (0, 2). Then move up 1 unit and right 1 unit. Plot the point. Draw a line through the two points.
����x + 5y = 4
62/87,21���Write the equation in slope-intercept form. �
To graph the equation, plot the y-LQWHUFHSW�� . Then move down 1 unit and right 5 units. Plot the point. Draw a
line through the two points. �
����2x í 3y = 6
62/87,21���Write the equation in slope-intercept form. �
� To graph the equation, plot the y-intercept (0, ±2). Then move up 2 units and right 3 units. Plot the point. Draw a line through the two points. �
����5x + 2y = 6
62/87,21���Write the equation in slope-intercept form. �
� To graph the equation, plot the y-intercept (0, 3). Then move down 5 units and right 2 units. Plot the point. Draw a line through the two points. �
Another line of fit may pass through (2, 15) and (7, 25). The equation of this line of fit is y = 2x + 11. More lines of fit that come close to the points could be drawn.
eSolutions Manual - Powered by Cognero Page 28
4-6 Regression and Median-Fit Lines

���3277(5<� $�ORFDO�XQLYHUVLW\�LV�NHHSLQJ�WUDFN�RI�WKH�QXPEHU�RI�DUW�VWXGHQWV�ZKR�XVH�WKH�SRWWHU\�VWXGLR�HDFK�GD\�� �
� a. Write an equation of the regression line and find the correlation coefficient. � b. Graph the residual plot and determine if the regression line models the data well.
62/87,21���D��Use a calculator to find the equation of the regression line. � Step 1: Enter the data by pressing STAT and selecting the EDIT option. . Enter the day into List 1 (L1). These willrepresent the x-values. Enter the number of students into List 2 (L2). These will represent the y-values. � Step 2: Perform the regression by pressing STAT �DQG�VHOHFWLQJ�WKH�CALC option. Scroll down to LinReg(ax+ b) and press ENTER. �
� Substitute the values in for a and b to write the equation of the regression line. So, the equation is y = 1.18x + 11. � Identify the value of r on the calculator to find the correlation coefficient. So, 0.7181 is the correlation coefficient. � b.�7XUQ�RQ�Plot2 under the STAT PLOT menu and choose scatter plot. Use L1 for the Xlist and RESID for the Ylist. You can obtain RESID by pressing 2nd STAT and selecting RESID from the list of names. Graph the scatter plot of the residuals by pressing ZOOM and choosing ZoomStat. �
� The residuals appear to be randomly scattered, so the regression line fits the data reasonably well. �
���&20387(56� The table below shows the percent of Americans with a broadband connection at home in a recentyear. Use linear extrapolation and a regression equation to estimate the percentage of 60-year-olds with broadband at home. �
62/87,21���Use a calculator to find the equation of the regression line.�
� y = ±0.34x + 49.48 � Substitute 60 into the equation. �
� So, about 29% of 60-year-olds have broadband at home.
���9$&$7,21� The Smiths want to rent a house on the lake that sleeps eight people. The cost of the house per night is based on how close it is to the water. �
� D�� Find and graph an equation for the median-fit line. � E�� What would you estimate is the cost of a rental 1.75 miles from the lake?
62/87,21���a. Use a calculator to find and graph the equation of the median fit line. �
y = í271.88x + 554.48
� b. To estimate the cost of a rental 1.75 miles from the lake, evaluate the equation of the median-fit line for x = 1.75.�
� An estimate of the cost of a rental 1.75 miles from the lake is $78.69.
Write an equation of the regression line for the data in each table. Then find the correlation coefficient.���6.<6&5$3(56� The table ranks the ten tallest buildings in the world. �
62/87,21���Use a calculator to find the equation of the regression line.�
� y = í2.75x + 102.53 � Use a calculator to find the correlation coefficient. � í0.6071
���086,&� 7KH�WDEOH�JLYHV�WKH�QXPEHU�RI�DQQXDO�YLROLQ�DXGLWLRQV�KHOG�E\�D�\RXWK�V\PSKRQ\�HDFK�\HDU�VLQFH��������/HW�x be the number of years since 2004. �
�
62/87,21���Use a calculator to find the equation of the regression line.�
� y = 3.54x + 19.68 � Use a calculator to find the correlation coefficient. � 0.9007
���5(7$,/� 7KH�WDEOH�JLYHV�WKH�VDOHV�RI�MHDQV�DW�D�FORWKLQJ�FKDLQ�VLQFH��������/HW�x be the number of years since ������ �
� a. Write an equation of the regression line. � b. Graph and analyze the residual plot.
62/87,21���a. Use a calculator to find the equation of the regression line. �
� The equation is about��\ = 3.32x + 5.20. � E��Use a calculator to graph the residual plot for the data. �
� The residuals appear to be randomly scattered. Therefore, the regression line fits the data well.
���0$5$7+21� 7KH�QXPEHU�RI�HQWUDQWV�LQ�WKH�%RVWRQ�0DUDWKRQ�HYHU\�ILYH�\HDUV�VLQFH������LV�VKRZQ���/HW�x be thenumber of years since 1975. �
� � D�� Find an equation for the median-fit line. � E�� According to the equation, how many entrants were there in 2003?
62/87,21���a. Let x = 0 for 1975. Use a calculator to find the equation of the median fit line. �
� y = 601.44x + 1236.13 � b. To estimate the number of entrants in 2003, evaluate the equation for the median-fit line for x = 2003 ± 1975 = 28.�
� There were about 18,076 entrants in 2003.
���&$03,1*� A campground kept a record of the number of campsites rented over the week of July 4 for several \HDUV���/HW�x be the number of years since 2000. �
� D�� Find an equation for the regression line. � E�� Predict the number of campsites that will be rented in 2012. � F�� Predict the number of campsites that will be rented in 2020.
62/87,21���a. Use a calculator to find an equation for the regression line. �
� y = 3.07x + 32.71 � b. To predict the number of campsites that will be rented in 2012, evaluate the regression equation for x = 12�
� There will be about 70 campsites rented in 2012. � c. To predict the number of campsites that will be rented in 2020, evaluate the regression equation for x = 20.�
� There will be about 94 campsites rented in 2020.
���,&(�&5($0� An ice cream company keeps a count of the tubs of cookie dough ice cream delivered to each of their stores in a particular area. ��
� D�� Find an equation for the median-fit line. � E�� Graph the points and the median-fit line. � F�� How many tubs would be delivered to a 1500-square-foot store? a 5000-square-foot store?
62/87,21���a. Use a calculator to find an equation for the median-fit line. �
� y = 0.095x í 94.58 � b. Plot the points and the equation. �
� c. To estimate the number of tubs to be delivered to a 1500-square-foot store, evaluate the regression equation for x = 1500. �
� There are about 48 tubs delivered to a 1500-square-foot store. To estimate the number of tubs to be delivered to a 5000-square-foot store, evaluate the regression equation for x = 5000. �
� There are about 380 tubs delivered to a 5000-square-foot store.
����CCSS SENSE-0$.,1*� The prices of the eight top-selling brands of jeans at Jeanie¶s Jeans are given in the table below. �
� D�� Find the equation for the regression line. � E�� According to the equation, what would be the price of a pair of the 12th best-selling brand? � F�� Is this a reasonable prediction? Explain.
62/87,21���a. Use a calculator to find an equation for the regression line. �
Step 1: Enter the data by pressing and selecting the EDIT option. Enter the sales rank into List 1 (L1). These will represent the x-values. Enter the price into List 2 (L2). These will represent the y-values. �
Step 2: Perform the regression by pressing �DQG�VHOHFWLQJ�WKH�CALC option. Scroll down to LinReg(ax+
b) and press . �
� y = 9.8x + 28.79 � b. To predict the price of a pair of the 12th bestselling brands of jeans, evaluate the regression equation for x = 12. �
� The price of a pair of the 12th bestselling brands of jeans would be about $146.39. � F�� Sample answer: No; the correlation between sales rank and price is too weak to make any reasonable prediction. The 12th bestselling brand of jeans could just as easily be a poorly made pair of jeans selling for $15.
����67$7(�)$,56� The table shows the total attendance, in millions of people, at the Minnesota State Fair from 2005 to 2009. �
� D��Graph a scatter plot of the data, where x = 1 represents 2005. Then find and graph the equation for the best-fit line. � b. Graph and analyze the residual plot. � c.��3UHGLFW�WKH�WRWDO�DWWHQGDQFH�LQ������ �
62/87,21���a. Enter the data from the table into the lists. Let x be the years starting with x = 1 for 2005 and let y = the attendence (in millions). Then graph the scatter plot. �
�
[0, 6] scl: 1 by [0, 3] scl: 0.5 � Perform the linear regression using the data in the lists. Find the equation of the best-fit line. �
� The equation is about y = 0.0326x + 1.598. � Use Y= to enter the equation into the calculator and graph the best-fit line with the scatter plot. �
[0, 6] scl: 1 by [0, 3] scl: 0.5 � b. Use the calculator to graph the residual plot for the data. �
� All the residuals appear to almost be on the line. Therefore, the regression line is a good fit for the data. � F���0HWKRG����To find the number of people in 2020, substitute 16 for x��
� Method 2: Copy the equation to the Y= list and graph. Use the value option to find the value of y when x = 16. �
[0, 17] scl: 1 by [0, 3] scl: 0.5 � 6R��WKHUH�ZLOO�EH�DERXW������PLOOLRQ�SHRSOH�LQ�������
����),5(),*+7(56� 7KH�WDEOH�VKRZV�VWDWLVWLFV�IURP�WKH�8�6��)LUH�$GPLQLVWUDWLRQ�� �
� D�� Find an equation for the median-fit line. � E�� Graph the points and the median-fit line. � F�� Does the median-fit line give you an accurate picture of the number of firefighters? Explain.
62/87,21���a. Use a calculator to find an equation for the median-fit line. �
Step 1: Enter the data by pressing and selecting the EDIT option. Enter age into List 1 (L1). These will represent the x-values. Enter the number of firefighters into List 2 (L2). These will represent the y-values. �
Step 2: Perform the regression by pressing and selecting the CALC option. Scroll down to Med-Med
and press �� �
� y = í841.42x + 223288 � b. Plot the points and graph the median fit line. �
� c. No, the median-fit line does not give an accurate picture of the number of firefighters. The points show no linear correlation; therefore a line cannot accurately portray the data.
����$7+/(7,&6� The table shows the total number of teens who participated in high school athletics in various years. �
� � D�� Find an equation for the regression line. � E�� According to the equation, how many participated in 1988?
62/87,21���a. Use a calculator to find an equation for the regression line. �
Step 1: Enter the data by pressing and selecting the EDIT option. Let the year 1970 be represented by 0. Enter the years since 1970 into List 1 (L1). These will represent the x-values. Enter the number of athletes into List 2 (L2). These will represent the y-values. �
Step 2: Perform the regression by pressing and selecting the CALC option. Scroll down to LinReg(ax+
b) and press . �
� y = 87,390.5x + 4,018,431 � b. To estimate the number of participants in 1988, evaluate the regression equation for x = 18 because 1988 is 18 years after 1970. �
� There were about 5,591,460 participants in 1988.
����$57� $�FRXQW�ZDV�NHSW�RQ�WKH�QXPEHU�RI�SDLQWLQJV�WKDW�VROG�DW�DQ�DXFWLRQ�E\�WKH�\HDU�LQ�ZKLFK�WKH\�ZHUH�SDLQWHG���Let x be the number of years since 1950. �
� D�� Find the equation for the linear regression line. � E�� How many paintings were sold that were painted in 1961? � F�� Is the linear regression equation an accurate model of the data? Explain why or why not.
62/87,21���a. 8VH�D�FDOFXODWRU�WR�ILQG�DQ�HTXDWLRQ�IRU�WKH�UHJUHVVLRQ�OLQH�� �
Step 1: Enter the data by pressing and selecting the EDIT option. Let x =0 for the year 1950.. Enter the years since 1950 into List 1 (L1). These will represent the x-values. Enter the number of painting sold into List 2 (L2). These will represent the y-values. �
Step 2: Perform the regression by pressing �DQG�VHOHFWLQJ�WKH�CALC option. Scroll down to LinReg(ax+
b) and press . � �
� y = 0.446x +9.43 � b. 7R�HVWLPDWH�WKH�QXPEHU�RI�SDLQWLQJV�VROG�LQ�������HYDOXDWH�WKH�UHJUHVVLRQ�HTXDWLRQ�IRU������ZKHQ��x =11. �
� There were about 14 paintings sold in 1961. � F�� No, the correlation coefficient is 0.48, so the linear model is not a good fit for the data. It does not appear from the data that there is a relationship between the number of paintings sold and the year they were painted.
����&&66�$5*80(176� Below are the results of the World Superpipe Championships in 2008.\ �
� � Find an equation of the regression line for each, and graph them on the same coordinate plane. Compare and contrast the men¶s and women's graphs.
62/87,21���Use a calculator to find an equation of the regression line for each set of data.� Men: y = í2.92x + 95.92 Women: y = í7x+106 � Graph the equations on the same coordinate plane. �
� The women¶s scores are typically lower than the men¶s.
����5($621,1*� For a class project, the scores that 10 randomly selected students earned on the first 8 tests of the VFKRRO�\HDU�DUH�JLYHQ��([SODLQ�KRZ�WR�ILQG�D�OLQH�RI��EHVW�ILW���&RXOG�LW�EH�XVHG�WR�SUHGLFW�WKH�VFRUHV�RI�RWKHU�VWXGHQWV"Explain your reasoning.
62/87,21���Apply a linear regression model to the data. Use the number of each test as the independent variable and the score on each test as the dependent variable. If there is no correlation, the r value will not be close to 1 or í1. If this is the case, the line of fit could not be used to predict the scores of the other students.
����23(1�(1'('� For 10 different people, measure their heights and the lengths of their heads from chin to top. Use these data to generate a linear regression equation and a median-fit equation. Make a prediction using both of the equations.
62/87,21���Student should gather and record data and use a calculator to find the equation of linear regression and a median-fit equation. Students should make predictions based on both equations. � 6DPSOH�GDWD��
� Median-fit (Store in Y1)
y = 8.31x ± 3.12 � /LQHDU�UHJUHVVLRQ���6WRUH�LQ Y2)
y = 7.39x + 5.22 � Find the height of a student with chin to top of head measure of 8.1. Use the value option from the CALC menu. Use the up arrow to move from one line to another. �
�
� The median-fit line predicts a student¶s height of 64.17 inches and the linear regression line predicts a height of 65.07.
Chin to 7RS��RI�
Head Measure Height8.8 70.99.1 72.89.3 73.87.5 61.08.4 66.37.8 62.08.5 67.38.8 68.98.3 68.78.9 71.5
����WRITING IN MATH How are lines of fit and linear regression similar? different?
62/87,21���Sample answer: Both lines of fit and linear regression are used to model data. However, you could have numerous lines of fit, while linear regression results in one line of best fit. If linear regression is used, you can also use the correlation coefficient to see how closely the model fits the data. For example, the scatter plot below displays the points (1, 10), (2, 17), (3, 15), (4, 20), (5, 28), (6, 19), and (7, 25). �
$�OLQH�RI�ILW�FRXOG�EH�GUDZQ�WKURXJK���������DQG����������7KH�HTXDWLRQ�RI�WKLV�OLQH�RI�ILW�LV�� .
� Use a calculator to find the equation of the regression line for this data. �
� The only regression line for this data has an equation of about y = 2.2x����������
����*(20(75<� Sam is putting a border around a poster. x represents the poster¶s width, and y represents the poster¶s length. Which equation represents how much border Sam will use if he doubles the length and the width? � $� 4xy � %� (x + y)4 � &� 4(x + y) � '� 16(x + y)
62/87,21���The perimeter of the room is found by . y is the length and x is the width, so . But Sam wants to double the border, so the perimeter becomes: �
� So, the correct choice is C.
����6+257�5(63216(� Tatiana wants to run 5 miles at an average pace of 9 minutes per mile. After 4 miles, her average pace is 9 minutes 10 seconds. In how many minutes must she complete the final mile to reach her goal?
62/87,21���Tatiana ran each of the first 4 miles in 10 more seconds than she planned. So to reach her goal, she must run the lastmile in 40 seconds less than she planned. 9 min ± 40 s = 8 min and 20 s.
����What is the slope of the line that passes through (1, 3) and (í3, 1)?� )� í2 �
*��
�
+��
� -� 2
62/87,21���
� So, the correct choice is H.
����What is an equation of the line that passes through (0, 1) and has a slope of 3?� $� y = 3x í 1 � %� y = 3x í 2 � &� y = 3x + 4 � '� y = 3x + 1
62/87,21���Find the y-intercept. �
� The equation is y = 3x + 1. So, the correct choice is D.
����86('�&$56� Gianna wants to buy a specific make and model of a used car. She researched prices from dealers and private sellers and made the graph shown. �
� D�� Describe the relationship in the data. � E�� Use the line of fit to predict the price of a car that is 7 years old. � F�� Is it reasonable to use this line of fit to predict the price of a 10-year old car? Explain.
62/87,21���a. Because y decreases as x increases, there is a negative correlation in the data. � b. Find x = 7 on the graph and follow the line up to the line of fit. According to the graph, the price of a car that is 7 years old would be about $3600. � c. No, it would not be reasonable to use this line of fit to predict the price of a 10-year old car, because according to the line of fit, the cost would be $0 and that doesn¶t make sense.
����*(20(75<� A quadrilateral has sides with equations y = í2x, 2x + y = 6, , and x í 2y = 9. Is the figure a rectangle? Explain your reasoning.
62/87,21���Write all of the equations in slope-intercept form. � Equation 1: y = í2x � (TXDWLRQ���� �
� (TXDWLRQ����
������������������y = x + 6 � Equation 4:� �
� Find the slope of each line �
� The slope of opposite sides are equal (±2 and ±���DQG�����DQG�������VR�WKH\�DUH�SDUDOOHO��$OVR��WKH�VORSH�RI�consecutive sides are opposite reciprocals (±2 and 0.5; and ±2 and 0.5), so they are perpendicular. So, the figure is a rectangle.
y = í2x í2y = ±2x +6 í2
y = 0.5x + 6
y = 0.5x ± 4.5
Write each equation in standard form.����y í 2 = 3(x í 1)
62/87,21���
����y í 5 = 6(x + 1)
62/87,21���
����y + 2 = í2(x í 5)
62/87,21���
����
62/87,21���
����
62/87,21���
����
62/87,21���
Find the slope of the line that passes through each pair of points.����(3, 4), (10, 8)
62/87,21���
����(í4, 7), (3, 5)
62/87,21���
����(3, 7), (í2, 4)
62/87,21���
����(í3, 2), (í3, 4)
62/87,21���
The slope is undefined.
If f (x) = x2 í x + 1, find each value.����f (í1)
62/87,21���
����f (5) í3
62/87,21���
����f (a)
62/87,21���
����f (b2)
62/87,21���
Graph each equation.����y = x + 2
62/87,21���To graph the equation, plot the y-intercept (0, 2). Then move up 1 unit and right 1 unit. Plot the point. Draw a line through the two points.
����x + 5y = 4
62/87,21���Write the equation in slope-intercept form. �
To graph the equation, plot the y-LQWHUFHSW�� . Then move down 1 unit and right 5 units. Plot the point. Draw a
line through the two points. �
����2x í 3y = 6
62/87,21���Write the equation in slope-intercept form. �
� To graph the equation, plot the y-intercept (0, ±2). Then move up 2 units and right 3 units. Plot the point. Draw a line through the two points. �
����5x + 2y = 6
62/87,21���Write the equation in slope-intercept form. �
� To graph the equation, plot the y-intercept (0, 3). Then move down 5 units and right 2 units. Plot the point. Draw a line through the two points. �
Another line of fit may pass through (2, 15) and (7, 25). The equation of this line of fit is y = 2x + 11. More lines of fit that come close to the points could be drawn.
eSolutions Manual - Powered by Cognero Page 29
4-6 Regression and Median-Fit Lines

���3277(5<� $�ORFDO�XQLYHUVLW\�LV�NHHSLQJ�WUDFN�RI�WKH�QXPEHU�RI�DUW�VWXGHQWV�ZKR�XVH�WKH�SRWWHU\�VWXGLR�HDFK�GD\�� �
� a. Write an equation of the regression line and find the correlation coefficient. � b. Graph the residual plot and determine if the regression line models the data well.
62/87,21���D��Use a calculator to find the equation of the regression line. � Step 1: Enter the data by pressing STAT and selecting the EDIT option. . Enter the day into List 1 (L1). These willrepresent the x-values. Enter the number of students into List 2 (L2). These will represent the y-values. � Step 2: Perform the regression by pressing STAT �DQG�VHOHFWLQJ�WKH�CALC option. Scroll down to LinReg(ax+ b) and press ENTER. �
� Substitute the values in for a and b to write the equation of the regression line. So, the equation is y = 1.18x + 11. � Identify the value of r on the calculator to find the correlation coefficient. So, 0.7181 is the correlation coefficient. � b.�7XUQ�RQ�Plot2 under the STAT PLOT menu and choose scatter plot. Use L1 for the Xlist and RESID for the Ylist. You can obtain RESID by pressing 2nd STAT and selecting RESID from the list of names. Graph the scatter plot of the residuals by pressing ZOOM and choosing ZoomStat. �
� The residuals appear to be randomly scattered, so the regression line fits the data reasonably well. �
���&20387(56� The table below shows the percent of Americans with a broadband connection at home in a recentyear. Use linear extrapolation and a regression equation to estimate the percentage of 60-year-olds with broadband at home. �
62/87,21���Use a calculator to find the equation of the regression line.�
� y = ±0.34x + 49.48 � Substitute 60 into the equation. �
� So, about 29% of 60-year-olds have broadband at home.
���9$&$7,21� The Smiths want to rent a house on the lake that sleeps eight people. The cost of the house per night is based on how close it is to the water. �
� D�� Find and graph an equation for the median-fit line. � E�� What would you estimate is the cost of a rental 1.75 miles from the lake?
62/87,21���a. Use a calculator to find and graph the equation of the median fit line. �
y = í271.88x + 554.48
� b. To estimate the cost of a rental 1.75 miles from the lake, evaluate the equation of the median-fit line for x = 1.75.�
� An estimate of the cost of a rental 1.75 miles from the lake is $78.69.
Write an equation of the regression line for the data in each table. Then find the correlation coefficient.���6.<6&5$3(56� The table ranks the ten tallest buildings in the world. �
62/87,21���Use a calculator to find the equation of the regression line.�
� y = í2.75x + 102.53 � Use a calculator to find the correlation coefficient. � í0.6071
���086,&� 7KH�WDEOH�JLYHV�WKH�QXPEHU�RI�DQQXDO�YLROLQ�DXGLWLRQV�KHOG�E\�D�\RXWK�V\PSKRQ\�HDFK�\HDU�VLQFH��������/HW�x be the number of years since 2004. �
�
62/87,21���Use a calculator to find the equation of the regression line.�
� y = 3.54x + 19.68 � Use a calculator to find the correlation coefficient. � 0.9007
���5(7$,/� 7KH�WDEOH�JLYHV�WKH�VDOHV�RI�MHDQV�DW�D�FORWKLQJ�FKDLQ�VLQFH��������/HW�x be the number of years since ������ �
� a. Write an equation of the regression line. � b. Graph and analyze the residual plot.
62/87,21���a. Use a calculator to find the equation of the regression line. �
� The equation is about��\ = 3.32x + 5.20. � E��Use a calculator to graph the residual plot for the data. �
� The residuals appear to be randomly scattered. Therefore, the regression line fits the data well.
���0$5$7+21� 7KH�QXPEHU�RI�HQWUDQWV�LQ�WKH�%RVWRQ�0DUDWKRQ�HYHU\�ILYH�\HDUV�VLQFH������LV�VKRZQ���/HW�x be thenumber of years since 1975. �
� � D�� Find an equation for the median-fit line. � E�� According to the equation, how many entrants were there in 2003?
62/87,21���a. Let x = 0 for 1975. Use a calculator to find the equation of the median fit line. �
� y = 601.44x + 1236.13 � b. To estimate the number of entrants in 2003, evaluate the equation for the median-fit line for x = 2003 ± 1975 = 28.�
� There were about 18,076 entrants in 2003.
���&$03,1*� A campground kept a record of the number of campsites rented over the week of July 4 for several \HDUV���/HW�x be the number of years since 2000. �
� D�� Find an equation for the regression line. � E�� Predict the number of campsites that will be rented in 2012. � F�� Predict the number of campsites that will be rented in 2020.
62/87,21���a. Use a calculator to find an equation for the regression line. �
� y = 3.07x + 32.71 � b. To predict the number of campsites that will be rented in 2012, evaluate the regression equation for x = 12�
� There will be about 70 campsites rented in 2012. � c. To predict the number of campsites that will be rented in 2020, evaluate the regression equation for x = 20.�
� There will be about 94 campsites rented in 2020.
���,&(�&5($0� An ice cream company keeps a count of the tubs of cookie dough ice cream delivered to each of their stores in a particular area. ��
� D�� Find an equation for the median-fit line. � E�� Graph the points and the median-fit line. � F�� How many tubs would be delivered to a 1500-square-foot store? a 5000-square-foot store?
62/87,21���a. Use a calculator to find an equation for the median-fit line. �
� y = 0.095x í 94.58 � b. Plot the points and the equation. �
� c. To estimate the number of tubs to be delivered to a 1500-square-foot store, evaluate the regression equation for x = 1500. �
� There are about 48 tubs delivered to a 1500-square-foot store. To estimate the number of tubs to be delivered to a 5000-square-foot store, evaluate the regression equation for x = 5000. �
� There are about 380 tubs delivered to a 5000-square-foot store.
����CCSS SENSE-0$.,1*� The prices of the eight top-selling brands of jeans at Jeanie¶s Jeans are given in the table below. �
� D�� Find the equation for the regression line. � E�� According to the equation, what would be the price of a pair of the 12th best-selling brand? � F�� Is this a reasonable prediction? Explain.
62/87,21���a. Use a calculator to find an equation for the regression line. �
Step 1: Enter the data by pressing and selecting the EDIT option. Enter the sales rank into List 1 (L1). These will represent the x-values. Enter the price into List 2 (L2). These will represent the y-values. �
Step 2: Perform the regression by pressing �DQG�VHOHFWLQJ�WKH�CALC option. Scroll down to LinReg(ax+
b) and press . �
� y = 9.8x + 28.79 � b. To predict the price of a pair of the 12th bestselling brands of jeans, evaluate the regression equation for x = 12. �
� The price of a pair of the 12th bestselling brands of jeans would be about $146.39. � F�� Sample answer: No; the correlation between sales rank and price is too weak to make any reasonable prediction. The 12th bestselling brand of jeans could just as easily be a poorly made pair of jeans selling for $15.
����67$7(�)$,56� The table shows the total attendance, in millions of people, at the Minnesota State Fair from 2005 to 2009. �
� D��Graph a scatter plot of the data, where x = 1 represents 2005. Then find and graph the equation for the best-fit line. � b. Graph and analyze the residual plot. � c.��3UHGLFW�WKH�WRWDO�DWWHQGDQFH�LQ������ �
62/87,21���a. Enter the data from the table into the lists. Let x be the years starting with x = 1 for 2005 and let y = the attendence (in millions). Then graph the scatter plot. �
�
[0, 6] scl: 1 by [0, 3] scl: 0.5 � Perform the linear regression using the data in the lists. Find the equation of the best-fit line. �
� The equation is about y = 0.0326x + 1.598. � Use Y= to enter the equation into the calculator and graph the best-fit line with the scatter plot. �
[0, 6] scl: 1 by [0, 3] scl: 0.5 � b. Use the calculator to graph the residual plot for the data. �
� All the residuals appear to almost be on the line. Therefore, the regression line is a good fit for the data. � F���0HWKRG����To find the number of people in 2020, substitute 16 for x��
� Method 2: Copy the equation to the Y= list and graph. Use the value option to find the value of y when x = 16. �
[0, 17] scl: 1 by [0, 3] scl: 0.5 � 6R��WKHUH�ZLOO�EH�DERXW������PLOOLRQ�SHRSOH�LQ�������
����),5(),*+7(56� 7KH�WDEOH�VKRZV�VWDWLVWLFV�IURP�WKH�8�6��)LUH�$GPLQLVWUDWLRQ�� �
� D�� Find an equation for the median-fit line. � E�� Graph the points and the median-fit line. � F�� Does the median-fit line give you an accurate picture of the number of firefighters? Explain.
62/87,21���a. Use a calculator to find an equation for the median-fit line. �
Step 1: Enter the data by pressing and selecting the EDIT option. Enter age into List 1 (L1). These will represent the x-values. Enter the number of firefighters into List 2 (L2). These will represent the y-values. �
Step 2: Perform the regression by pressing and selecting the CALC option. Scroll down to Med-Med
and press �� �
� y = í841.42x + 223288 � b. Plot the points and graph the median fit line. �
� c. No, the median-fit line does not give an accurate picture of the number of firefighters. The points show no linear correlation; therefore a line cannot accurately portray the data.
����$7+/(7,&6� The table shows the total number of teens who participated in high school athletics in various years. �
� � D�� Find an equation for the regression line. � E�� According to the equation, how many participated in 1988?
62/87,21���a. Use a calculator to find an equation for the regression line. �
Step 1: Enter the data by pressing and selecting the EDIT option. Let the year 1970 be represented by 0. Enter the years since 1970 into List 1 (L1). These will represent the x-values. Enter the number of athletes into List 2 (L2). These will represent the y-values. �
Step 2: Perform the regression by pressing and selecting the CALC option. Scroll down to LinReg(ax+
b) and press . �
� y = 87,390.5x + 4,018,431 � b. To estimate the number of participants in 1988, evaluate the regression equation for x = 18 because 1988 is 18 years after 1970. �
� There were about 5,591,460 participants in 1988.
����$57� $�FRXQW�ZDV�NHSW�RQ�WKH�QXPEHU�RI�SDLQWLQJV�WKDW�VROG�DW�DQ�DXFWLRQ�E\�WKH�\HDU�LQ�ZKLFK�WKH\�ZHUH�SDLQWHG���Let x be the number of years since 1950. �
� D�� Find the equation for the linear regression line. � E�� How many paintings were sold that were painted in 1961? � F�� Is the linear regression equation an accurate model of the data? Explain why or why not.
62/87,21���a. 8VH�D�FDOFXODWRU�WR�ILQG�DQ�HTXDWLRQ�IRU�WKH�UHJUHVVLRQ�OLQH�� �
Step 1: Enter the data by pressing and selecting the EDIT option. Let x =0 for the year 1950.. Enter the years since 1950 into List 1 (L1). These will represent the x-values. Enter the number of painting sold into List 2 (L2). These will represent the y-values. �
Step 2: Perform the regression by pressing �DQG�VHOHFWLQJ�WKH�CALC option. Scroll down to LinReg(ax+
b) and press . � �
� y = 0.446x +9.43 � b. 7R�HVWLPDWH�WKH�QXPEHU�RI�SDLQWLQJV�VROG�LQ�������HYDOXDWH�WKH�UHJUHVVLRQ�HTXDWLRQ�IRU������ZKHQ��x =11. �
� There were about 14 paintings sold in 1961. � F�� No, the correlation coefficient is 0.48, so the linear model is not a good fit for the data. It does not appear from the data that there is a relationship between the number of paintings sold and the year they were painted.
����&&66�$5*80(176� Below are the results of the World Superpipe Championships in 2008.\ �
� � Find an equation of the regression line for each, and graph them on the same coordinate plane. Compare and contrast the men¶s and women's graphs.
62/87,21���Use a calculator to find an equation of the regression line for each set of data.� Men: y = í2.92x + 95.92 Women: y = í7x+106 � Graph the equations on the same coordinate plane. �
� The women¶s scores are typically lower than the men¶s.
����5($621,1*� For a class project, the scores that 10 randomly selected students earned on the first 8 tests of the VFKRRO�\HDU�DUH�JLYHQ��([SODLQ�KRZ�WR�ILQG�D�OLQH�RI��EHVW�ILW���&RXOG�LW�EH�XVHG�WR�SUHGLFW�WKH�VFRUHV�RI�RWKHU�VWXGHQWV"Explain your reasoning.
62/87,21���Apply a linear regression model to the data. Use the number of each test as the independent variable and the score on each test as the dependent variable. If there is no correlation, the r value will not be close to 1 or í1. If this is the case, the line of fit could not be used to predict the scores of the other students.
����23(1�(1'('� For 10 different people, measure their heights and the lengths of their heads from chin to top. Use these data to generate a linear regression equation and a median-fit equation. Make a prediction using both of the equations.
62/87,21���Student should gather and record data and use a calculator to find the equation of linear regression and a median-fit equation. Students should make predictions based on both equations. � 6DPSOH�GDWD��
� Median-fit (Store in Y1)
y = 8.31x ± 3.12 � /LQHDU�UHJUHVVLRQ���6WRUH�LQ Y2)
y = 7.39x + 5.22 � Find the height of a student with chin to top of head measure of 8.1. Use the value option from the CALC menu. Use the up arrow to move from one line to another. �
�
� The median-fit line predicts a student¶s height of 64.17 inches and the linear regression line predicts a height of 65.07.
Chin to 7RS��RI�
Head Measure Height8.8 70.99.1 72.89.3 73.87.5 61.08.4 66.37.8 62.08.5 67.38.8 68.98.3 68.78.9 71.5
����WRITING IN MATH How are lines of fit and linear regression similar? different?
62/87,21���Sample answer: Both lines of fit and linear regression are used to model data. However, you could have numerous lines of fit, while linear regression results in one line of best fit. If linear regression is used, you can also use the correlation coefficient to see how closely the model fits the data. For example, the scatter plot below displays the points (1, 10), (2, 17), (3, 15), (4, 20), (5, 28), (6, 19), and (7, 25). �
$�OLQH�RI�ILW�FRXOG�EH�GUDZQ�WKURXJK���������DQG����������7KH�HTXDWLRQ�RI�WKLV�OLQH�RI�ILW�LV�� .
� Use a calculator to find the equation of the regression line for this data. �
� The only regression line for this data has an equation of about y = 2.2x����������
����*(20(75<� Sam is putting a border around a poster. x represents the poster¶s width, and y represents the poster¶s length. Which equation represents how much border Sam will use if he doubles the length and the width? � $� 4xy � %� (x + y)4 � &� 4(x + y) � '� 16(x + y)
62/87,21���The perimeter of the room is found by . y is the length and x is the width, so . But Sam wants to double the border, so the perimeter becomes: �
� So, the correct choice is C.
����6+257�5(63216(� Tatiana wants to run 5 miles at an average pace of 9 minutes per mile. After 4 miles, her average pace is 9 minutes 10 seconds. In how many minutes must she complete the final mile to reach her goal?
62/87,21���Tatiana ran each of the first 4 miles in 10 more seconds than she planned. So to reach her goal, she must run the lastmile in 40 seconds less than she planned. 9 min ± 40 s = 8 min and 20 s.
����What is the slope of the line that passes through (1, 3) and (í3, 1)?� )� í2 �
*��
�
+��
� -� 2
62/87,21���
� So, the correct choice is H.
����What is an equation of the line that passes through (0, 1) and has a slope of 3?� $� y = 3x í 1 � %� y = 3x í 2 � &� y = 3x + 4 � '� y = 3x + 1
62/87,21���Find the y-intercept. �
� The equation is y = 3x + 1. So, the correct choice is D.
����86('�&$56� Gianna wants to buy a specific make and model of a used car. She researched prices from dealers and private sellers and made the graph shown. �
� D�� Describe the relationship in the data. � E�� Use the line of fit to predict the price of a car that is 7 years old. � F�� Is it reasonable to use this line of fit to predict the price of a 10-year old car? Explain.
62/87,21���a. Because y decreases as x increases, there is a negative correlation in the data. � b. Find x = 7 on the graph and follow the line up to the line of fit. According to the graph, the price of a car that is 7 years old would be about $3600. � c. No, it would not be reasonable to use this line of fit to predict the price of a 10-year old car, because according to the line of fit, the cost would be $0 and that doesn¶t make sense.
����*(20(75<� A quadrilateral has sides with equations y = í2x, 2x + y = 6, , and x í 2y = 9. Is the figure a rectangle? Explain your reasoning.
62/87,21���Write all of the equations in slope-intercept form. � Equation 1: y = í2x � (TXDWLRQ���� �
� (TXDWLRQ����
������������������y = x + 6 � Equation 4:� �
� Find the slope of each line �
� The slope of opposite sides are equal (±2 and ±���DQG�����DQG�������VR�WKH\�DUH�SDUDOOHO��$OVR��WKH�VORSH�RI�consecutive sides are opposite reciprocals (±2 and 0.5; and ±2 and 0.5), so they are perpendicular. So, the figure is a rectangle.
y = í2x í2y = ±2x +6 í2
y = 0.5x + 6
y = 0.5x ± 4.5
Write each equation in standard form.����y í 2 = 3(x í 1)
62/87,21���
����y í 5 = 6(x + 1)
62/87,21���
����y + 2 = í2(x í 5)
62/87,21���
����
62/87,21���
����
62/87,21���
����
62/87,21���
Find the slope of the line that passes through each pair of points.����(3, 4), (10, 8)
62/87,21���
����(í4, 7), (3, 5)
62/87,21���
����(3, 7), (í2, 4)
62/87,21���
����(í3, 2), (í3, 4)
62/87,21���
The slope is undefined.
If f (x) = x2 í x + 1, find each value.����f (í1)
62/87,21���
����f (5) í3
62/87,21���
����f (a)
62/87,21���
����f (b2)
62/87,21���
Graph each equation.����y = x + 2
62/87,21���To graph the equation, plot the y-intercept (0, 2). Then move up 1 unit and right 1 unit. Plot the point. Draw a line through the two points.
����x + 5y = 4
62/87,21���Write the equation in slope-intercept form. �
To graph the equation, plot the y-LQWHUFHSW�� . Then move down 1 unit and right 5 units. Plot the point. Draw a
line through the two points. �
����2x í 3y = 6
62/87,21���Write the equation in slope-intercept form. �
� To graph the equation, plot the y-intercept (0, ±2). Then move up 2 units and right 3 units. Plot the point. Draw a line through the two points. �
����5x + 2y = 6
62/87,21���Write the equation in slope-intercept form. �
� To graph the equation, plot the y-intercept (0, 3). Then move down 5 units and right 2 units. Plot the point. Draw a line through the two points. �
Another line of fit may pass through (2, 15) and (7, 25). The equation of this line of fit is y = 2x + 11. More lines of fit that come close to the points could be drawn.
eSolutions Manual - Powered by Cognero Page 30
4-6 Regression and Median-Fit Lines

���3277(5<� $�ORFDO�XQLYHUVLW\�LV�NHHSLQJ�WUDFN�RI�WKH�QXPEHU�RI�DUW�VWXGHQWV�ZKR�XVH�WKH�SRWWHU\�VWXGLR�HDFK�GD\�� �
� a. Write an equation of the regression line and find the correlation coefficient. � b. Graph the residual plot and determine if the regression line models the data well.
62/87,21���D��Use a calculator to find the equation of the regression line. � Step 1: Enter the data by pressing STAT and selecting the EDIT option. . Enter the day into List 1 (L1). These willrepresent the x-values. Enter the number of students into List 2 (L2). These will represent the y-values. � Step 2: Perform the regression by pressing STAT �DQG�VHOHFWLQJ�WKH�CALC option. Scroll down to LinReg(ax+ b) and press ENTER. �
� Substitute the values in for a and b to write the equation of the regression line. So, the equation is y = 1.18x + 11. � Identify the value of r on the calculator to find the correlation coefficient. So, 0.7181 is the correlation coefficient. � b.�7XUQ�RQ�Plot2 under the STAT PLOT menu and choose scatter plot. Use L1 for the Xlist and RESID for the Ylist. You can obtain RESID by pressing 2nd STAT and selecting RESID from the list of names. Graph the scatter plot of the residuals by pressing ZOOM and choosing ZoomStat. �
� The residuals appear to be randomly scattered, so the regression line fits the data reasonably well. �
���&20387(56� The table below shows the percent of Americans with a broadband connection at home in a recentyear. Use linear extrapolation and a regression equation to estimate the percentage of 60-year-olds with broadband at home. �
62/87,21���Use a calculator to find the equation of the regression line.�
� y = ±0.34x + 49.48 � Substitute 60 into the equation. �
� So, about 29% of 60-year-olds have broadband at home.
���9$&$7,21� The Smiths want to rent a house on the lake that sleeps eight people. The cost of the house per night is based on how close it is to the water. �
� D�� Find and graph an equation for the median-fit line. � E�� What would you estimate is the cost of a rental 1.75 miles from the lake?
62/87,21���a. Use a calculator to find and graph the equation of the median fit line. �
y = í271.88x + 554.48
� b. To estimate the cost of a rental 1.75 miles from the lake, evaluate the equation of the median-fit line for x = 1.75.�
� An estimate of the cost of a rental 1.75 miles from the lake is $78.69.
Write an equation of the regression line for the data in each table. Then find the correlation coefficient.���6.<6&5$3(56� The table ranks the ten tallest buildings in the world. �
62/87,21���Use a calculator to find the equation of the regression line.�
� y = í2.75x + 102.53 � Use a calculator to find the correlation coefficient. � í0.6071
���086,&� 7KH�WDEOH�JLYHV�WKH�QXPEHU�RI�DQQXDO�YLROLQ�DXGLWLRQV�KHOG�E\�D�\RXWK�V\PSKRQ\�HDFK�\HDU�VLQFH��������/HW�x be the number of years since 2004. �
�
62/87,21���Use a calculator to find the equation of the regression line.�
� y = 3.54x + 19.68 � Use a calculator to find the correlation coefficient. � 0.9007
���5(7$,/� 7KH�WDEOH�JLYHV�WKH�VDOHV�RI�MHDQV�DW�D�FORWKLQJ�FKDLQ�VLQFH��������/HW�x be the number of years since ������ �
� a. Write an equation of the regression line. � b. Graph and analyze the residual plot.
62/87,21���a. Use a calculator to find the equation of the regression line. �
� The equation is about��\ = 3.32x + 5.20. � E��Use a calculator to graph the residual plot for the data. �
� The residuals appear to be randomly scattered. Therefore, the regression line fits the data well.
���0$5$7+21� 7KH�QXPEHU�RI�HQWUDQWV�LQ�WKH�%RVWRQ�0DUDWKRQ�HYHU\�ILYH�\HDUV�VLQFH������LV�VKRZQ���/HW�x be thenumber of years since 1975. �
� � D�� Find an equation for the median-fit line. � E�� According to the equation, how many entrants were there in 2003?
62/87,21���a. Let x = 0 for 1975. Use a calculator to find the equation of the median fit line. �
� y = 601.44x + 1236.13 � b. To estimate the number of entrants in 2003, evaluate the equation for the median-fit line for x = 2003 ± 1975 = 28.�
� There were about 18,076 entrants in 2003.
���&$03,1*� A campground kept a record of the number of campsites rented over the week of July 4 for several \HDUV���/HW�x be the number of years since 2000. �
� D�� Find an equation for the regression line. � E�� Predict the number of campsites that will be rented in 2012. � F�� Predict the number of campsites that will be rented in 2020.
62/87,21���a. Use a calculator to find an equation for the regression line. �
� y = 3.07x + 32.71 � b. To predict the number of campsites that will be rented in 2012, evaluate the regression equation for x = 12�
� There will be about 70 campsites rented in 2012. � c. To predict the number of campsites that will be rented in 2020, evaluate the regression equation for x = 20.�
� There will be about 94 campsites rented in 2020.
���,&(�&5($0� An ice cream company keeps a count of the tubs of cookie dough ice cream delivered to each of their stores in a particular area. ��
� D�� Find an equation for the median-fit line. � E�� Graph the points and the median-fit line. � F�� How many tubs would be delivered to a 1500-square-foot store? a 5000-square-foot store?
62/87,21���a. Use a calculator to find an equation for the median-fit line. �
� y = 0.095x í 94.58 � b. Plot the points and the equation. �
� c. To estimate the number of tubs to be delivered to a 1500-square-foot store, evaluate the regression equation for x = 1500. �
� There are about 48 tubs delivered to a 1500-square-foot store. To estimate the number of tubs to be delivered to a 5000-square-foot store, evaluate the regression equation for x = 5000. �
� There are about 380 tubs delivered to a 5000-square-foot store.
����CCSS SENSE-0$.,1*� The prices of the eight top-selling brands of jeans at Jeanie¶s Jeans are given in the table below. �
� D�� Find the equation for the regression line. � E�� According to the equation, what would be the price of a pair of the 12th best-selling brand? � F�� Is this a reasonable prediction? Explain.
62/87,21���a. Use a calculator to find an equation for the regression line. �
Step 1: Enter the data by pressing and selecting the EDIT option. Enter the sales rank into List 1 (L1). These will represent the x-values. Enter the price into List 2 (L2). These will represent the y-values. �
Step 2: Perform the regression by pressing �DQG�VHOHFWLQJ�WKH�CALC option. Scroll down to LinReg(ax+
b) and press . �
� y = 9.8x + 28.79 � b. To predict the price of a pair of the 12th bestselling brands of jeans, evaluate the regression equation for x = 12. �
� The price of a pair of the 12th bestselling brands of jeans would be about $146.39. � F�� Sample answer: No; the correlation between sales rank and price is too weak to make any reasonable prediction. The 12th bestselling brand of jeans could just as easily be a poorly made pair of jeans selling for $15.
����67$7(�)$,56� The table shows the total attendance, in millions of people, at the Minnesota State Fair from 2005 to 2009. �
� D��Graph a scatter plot of the data, where x = 1 represents 2005. Then find and graph the equation for the best-fit line. � b. Graph and analyze the residual plot. � c.��3UHGLFW�WKH�WRWDO�DWWHQGDQFH�LQ������ �
62/87,21���a. Enter the data from the table into the lists. Let x be the years starting with x = 1 for 2005 and let y = the attendence (in millions). Then graph the scatter plot. �
�
[0, 6] scl: 1 by [0, 3] scl: 0.5 � Perform the linear regression using the data in the lists. Find the equation of the best-fit line. �
� The equation is about y = 0.0326x + 1.598. � Use Y= to enter the equation into the calculator and graph the best-fit line with the scatter plot. �
[0, 6] scl: 1 by [0, 3] scl: 0.5 � b. Use the calculator to graph the residual plot for the data. �
� All the residuals appear to almost be on the line. Therefore, the regression line is a good fit for the data. � F���0HWKRG����To find the number of people in 2020, substitute 16 for x��
� Method 2: Copy the equation to the Y= list and graph. Use the value option to find the value of y when x = 16. �
[0, 17] scl: 1 by [0, 3] scl: 0.5 � 6R��WKHUH�ZLOO�EH�DERXW������PLOOLRQ�SHRSOH�LQ�������
����),5(),*+7(56� 7KH�WDEOH�VKRZV�VWDWLVWLFV�IURP�WKH�8�6��)LUH�$GPLQLVWUDWLRQ�� �
� D�� Find an equation for the median-fit line. � E�� Graph the points and the median-fit line. � F�� Does the median-fit line give you an accurate picture of the number of firefighters? Explain.
62/87,21���a. Use a calculator to find an equation for the median-fit line. �
Step 1: Enter the data by pressing and selecting the EDIT option. Enter age into List 1 (L1). These will represent the x-values. Enter the number of firefighters into List 2 (L2). These will represent the y-values. �
Step 2: Perform the regression by pressing and selecting the CALC option. Scroll down to Med-Med
and press �� �
� y = í841.42x + 223288 � b. Plot the points and graph the median fit line. �
� c. No, the median-fit line does not give an accurate picture of the number of firefighters. The points show no linear correlation; therefore a line cannot accurately portray the data.
����$7+/(7,&6� The table shows the total number of teens who participated in high school athletics in various years. �
� � D�� Find an equation for the regression line. � E�� According to the equation, how many participated in 1988?
62/87,21���a. Use a calculator to find an equation for the regression line. �
Step 1: Enter the data by pressing and selecting the EDIT option. Let the year 1970 be represented by 0. Enter the years since 1970 into List 1 (L1). These will represent the x-values. Enter the number of athletes into List 2 (L2). These will represent the y-values. �
Step 2: Perform the regression by pressing and selecting the CALC option. Scroll down to LinReg(ax+
b) and press . �
� y = 87,390.5x + 4,018,431 � b. To estimate the number of participants in 1988, evaluate the regression equation for x = 18 because 1988 is 18 years after 1970. �
� There were about 5,591,460 participants in 1988.
����$57� $�FRXQW�ZDV�NHSW�RQ�WKH�QXPEHU�RI�SDLQWLQJV�WKDW�VROG�DW�DQ�DXFWLRQ�E\�WKH�\HDU�LQ�ZKLFK�WKH\�ZHUH�SDLQWHG���Let x be the number of years since 1950. �
� D�� Find the equation for the linear regression line. � E�� How many paintings were sold that were painted in 1961? � F�� Is the linear regression equation an accurate model of the data? Explain why or why not.
62/87,21���a. 8VH�D�FDOFXODWRU�WR�ILQG�DQ�HTXDWLRQ�IRU�WKH�UHJUHVVLRQ�OLQH�� �
Step 1: Enter the data by pressing and selecting the EDIT option. Let x =0 for the year 1950.. Enter the years since 1950 into List 1 (L1). These will represent the x-values. Enter the number of painting sold into List 2 (L2). These will represent the y-values. �
Step 2: Perform the regression by pressing �DQG�VHOHFWLQJ�WKH�CALC option. Scroll down to LinReg(ax+
b) and press . � �
� y = 0.446x +9.43 � b. 7R�HVWLPDWH�WKH�QXPEHU�RI�SDLQWLQJV�VROG�LQ�������HYDOXDWH�WKH�UHJUHVVLRQ�HTXDWLRQ�IRU������ZKHQ��x =11. �
� There were about 14 paintings sold in 1961. � F�� No, the correlation coefficient is 0.48, so the linear model is not a good fit for the data. It does not appear from the data that there is a relationship between the number of paintings sold and the year they were painted.
����&&66�$5*80(176� Below are the results of the World Superpipe Championships in 2008.\ �
� � Find an equation of the regression line for each, and graph them on the same coordinate plane. Compare and contrast the men¶s and women's graphs.
62/87,21���Use a calculator to find an equation of the regression line for each set of data.� Men: y = í2.92x + 95.92 Women: y = í7x+106 � Graph the equations on the same coordinate plane. �
� The women¶s scores are typically lower than the men¶s.
����5($621,1*� For a class project, the scores that 10 randomly selected students earned on the first 8 tests of the VFKRRO�\HDU�DUH�JLYHQ��([SODLQ�KRZ�WR�ILQG�D�OLQH�RI��EHVW�ILW���&RXOG�LW�EH�XVHG�WR�SUHGLFW�WKH�VFRUHV�RI�RWKHU�VWXGHQWV"Explain your reasoning.
62/87,21���Apply a linear regression model to the data. Use the number of each test as the independent variable and the score on each test as the dependent variable. If there is no correlation, the r value will not be close to 1 or í1. If this is the case, the line of fit could not be used to predict the scores of the other students.
����23(1�(1'('� For 10 different people, measure their heights and the lengths of their heads from chin to top. Use these data to generate a linear regression equation and a median-fit equation. Make a prediction using both of the equations.
62/87,21���Student should gather and record data and use a calculator to find the equation of linear regression and a median-fit equation. Students should make predictions based on both equations. � 6DPSOH�GDWD��
� Median-fit (Store in Y1)
y = 8.31x ± 3.12 � /LQHDU�UHJUHVVLRQ���6WRUH�LQ Y2)
y = 7.39x + 5.22 � Find the height of a student with chin to top of head measure of 8.1. Use the value option from the CALC menu. Use the up arrow to move from one line to another. �
�
� The median-fit line predicts a student¶s height of 64.17 inches and the linear regression line predicts a height of 65.07.
Chin to 7RS��RI�
Head Measure Height8.8 70.99.1 72.89.3 73.87.5 61.08.4 66.37.8 62.08.5 67.38.8 68.98.3 68.78.9 71.5
����WRITING IN MATH How are lines of fit and linear regression similar? different?
62/87,21���Sample answer: Both lines of fit and linear regression are used to model data. However, you could have numerous lines of fit, while linear regression results in one line of best fit. If linear regression is used, you can also use the correlation coefficient to see how closely the model fits the data. For example, the scatter plot below displays the points (1, 10), (2, 17), (3, 15), (4, 20), (5, 28), (6, 19), and (7, 25). �
$�OLQH�RI�ILW�FRXOG�EH�GUDZQ�WKURXJK���������DQG����������7KH�HTXDWLRQ�RI�WKLV�OLQH�RI�ILW�LV�� .
� Use a calculator to find the equation of the regression line for this data. �
� The only regression line for this data has an equation of about y = 2.2x����������
����*(20(75<� Sam is putting a border around a poster. x represents the poster¶s width, and y represents the poster¶s length. Which equation represents how much border Sam will use if he doubles the length and the width? � $� 4xy � %� (x + y)4 � &� 4(x + y) � '� 16(x + y)
62/87,21���The perimeter of the room is found by . y is the length and x is the width, so . But Sam wants to double the border, so the perimeter becomes: �
� So, the correct choice is C.
����6+257�5(63216(� Tatiana wants to run 5 miles at an average pace of 9 minutes per mile. After 4 miles, her average pace is 9 minutes 10 seconds. In how many minutes must she complete the final mile to reach her goal?
62/87,21���Tatiana ran each of the first 4 miles in 10 more seconds than she planned. So to reach her goal, she must run the lastmile in 40 seconds less than she planned. 9 min ± 40 s = 8 min and 20 s.
����What is the slope of the line that passes through (1, 3) and (í3, 1)?� )� í2 �
*��
�
+��
� -� 2
62/87,21���
� So, the correct choice is H.
����What is an equation of the line that passes through (0, 1) and has a slope of 3?� $� y = 3x í 1 � %� y = 3x í 2 � &� y = 3x + 4 � '� y = 3x + 1
62/87,21���Find the y-intercept. �
� The equation is y = 3x + 1. So, the correct choice is D.
����86('�&$56� Gianna wants to buy a specific make and model of a used car. She researched prices from dealers and private sellers and made the graph shown. �
� D�� Describe the relationship in the data. � E�� Use the line of fit to predict the price of a car that is 7 years old. � F�� Is it reasonable to use this line of fit to predict the price of a 10-year old car? Explain.
62/87,21���a. Because y decreases as x increases, there is a negative correlation in the data. � b. Find x = 7 on the graph and follow the line up to the line of fit. According to the graph, the price of a car that is 7 years old would be about $3600. � c. No, it would not be reasonable to use this line of fit to predict the price of a 10-year old car, because according to the line of fit, the cost would be $0 and that doesn¶t make sense.
����*(20(75<� A quadrilateral has sides with equations y = í2x, 2x + y = 6, , and x í 2y = 9. Is the figure a rectangle? Explain your reasoning.
62/87,21���Write all of the equations in slope-intercept form. � Equation 1: y = í2x � (TXDWLRQ���� �
� (TXDWLRQ����
������������������y = x + 6 � Equation 4:� �
� Find the slope of each line �
� The slope of opposite sides are equal (±2 and ±���DQG�����DQG�������VR�WKH\�DUH�SDUDOOHO��$OVR��WKH�VORSH�RI�consecutive sides are opposite reciprocals (±2 and 0.5; and ±2 and 0.5), so they are perpendicular. So, the figure is a rectangle.
y = í2x í2y = ±2x +6 í2
y = 0.5x + 6
y = 0.5x ± 4.5
Write each equation in standard form.����y í 2 = 3(x í 1)
62/87,21���
����y í 5 = 6(x + 1)
62/87,21���
����y + 2 = í2(x í 5)
62/87,21���
����
62/87,21���
����
62/87,21���
����
62/87,21���
Find the slope of the line that passes through each pair of points.����(3, 4), (10, 8)
62/87,21���
����(í4, 7), (3, 5)
62/87,21���
����(3, 7), (í2, 4)
62/87,21���
����(í3, 2), (í3, 4)
62/87,21���
The slope is undefined.
If f (x) = x2 í x + 1, find each value.����f (í1)
62/87,21���
����f (5) í3
62/87,21���
����f (a)
62/87,21���
����f (b2)
62/87,21���
Graph each equation.����y = x + 2
62/87,21���To graph the equation, plot the y-intercept (0, 2). Then move up 1 unit and right 1 unit. Plot the point. Draw a line through the two points.
����x + 5y = 4
62/87,21���Write the equation in slope-intercept form. �
To graph the equation, plot the y-LQWHUFHSW�� . Then move down 1 unit and right 5 units. Plot the point. Draw a
line through the two points. �
����2x í 3y = 6
62/87,21���Write the equation in slope-intercept form. �
� To graph the equation, plot the y-intercept (0, ±2). Then move up 2 units and right 3 units. Plot the point. Draw a line through the two points. �
����5x + 2y = 6
62/87,21���Write the equation in slope-intercept form. �
� To graph the equation, plot the y-intercept (0, 3). Then move down 5 units and right 2 units. Plot the point. Draw a line through the two points. �
Another line of fit may pass through (2, 15) and (7, 25). The equation of this line of fit is y = 2x + 11. More lines of fit that come close to the points could be drawn.
eSolutions Manual - Powered by Cognero Page 31
4-6 Regression and Median-Fit Lines

���3277(5<� $�ORFDO�XQLYHUVLW\�LV�NHHSLQJ�WUDFN�RI�WKH�QXPEHU�RI�DUW�VWXGHQWV�ZKR�XVH�WKH�SRWWHU\�VWXGLR�HDFK�GD\�� �
� a. Write an equation of the regression line and find the correlation coefficient. � b. Graph the residual plot and determine if the regression line models the data well.
62/87,21���D��Use a calculator to find the equation of the regression line. � Step 1: Enter the data by pressing STAT and selecting the EDIT option. . Enter the day into List 1 (L1). These willrepresent the x-values. Enter the number of students into List 2 (L2). These will represent the y-values. � Step 2: Perform the regression by pressing STAT �DQG�VHOHFWLQJ�WKH�CALC option. Scroll down to LinReg(ax+ b) and press ENTER. �
� Substitute the values in for a and b to write the equation of the regression line. So, the equation is y = 1.18x + 11. � Identify the value of r on the calculator to find the correlation coefficient. So, 0.7181 is the correlation coefficient. � b.�7XUQ�RQ�Plot2 under the STAT PLOT menu and choose scatter plot. Use L1 for the Xlist and RESID for the Ylist. You can obtain RESID by pressing 2nd STAT and selecting RESID from the list of names. Graph the scatter plot of the residuals by pressing ZOOM and choosing ZoomStat. �
� The residuals appear to be randomly scattered, so the regression line fits the data reasonably well. �
���&20387(56� The table below shows the percent of Americans with a broadband connection at home in a recentyear. Use linear extrapolation and a regression equation to estimate the percentage of 60-year-olds with broadband at home. �
62/87,21���Use a calculator to find the equation of the regression line.�
� y = ±0.34x + 49.48 � Substitute 60 into the equation. �
� So, about 29% of 60-year-olds have broadband at home.
���9$&$7,21� The Smiths want to rent a house on the lake that sleeps eight people. The cost of the house per night is based on how close it is to the water. �
� D�� Find and graph an equation for the median-fit line. � E�� What would you estimate is the cost of a rental 1.75 miles from the lake?
62/87,21���a. Use a calculator to find and graph the equation of the median fit line. �
y = í271.88x + 554.48
� b. To estimate the cost of a rental 1.75 miles from the lake, evaluate the equation of the median-fit line for x = 1.75.�
� An estimate of the cost of a rental 1.75 miles from the lake is $78.69.
Write an equation of the regression line for the data in each table. Then find the correlation coefficient.���6.<6&5$3(56� The table ranks the ten tallest buildings in the world. �
62/87,21���Use a calculator to find the equation of the regression line.�
� y = í2.75x + 102.53 � Use a calculator to find the correlation coefficient. � í0.6071
���086,&� 7KH�WDEOH�JLYHV�WKH�QXPEHU�RI�DQQXDO�YLROLQ�DXGLWLRQV�KHOG�E\�D�\RXWK�V\PSKRQ\�HDFK�\HDU�VLQFH��������/HW�x be the number of years since 2004. �
�
62/87,21���Use a calculator to find the equation of the regression line.�
� y = 3.54x + 19.68 � Use a calculator to find the correlation coefficient. � 0.9007
���5(7$,/� 7KH�WDEOH�JLYHV�WKH�VDOHV�RI�MHDQV�DW�D�FORWKLQJ�FKDLQ�VLQFH��������/HW�x be the number of years since ������ �
� a. Write an equation of the regression line. � b. Graph and analyze the residual plot.
62/87,21���a. Use a calculator to find the equation of the regression line. �
� The equation is about��\ = 3.32x + 5.20. � E��Use a calculator to graph the residual plot for the data. �
� The residuals appear to be randomly scattered. Therefore, the regression line fits the data well.
���0$5$7+21� 7KH�QXPEHU�RI�HQWUDQWV�LQ�WKH�%RVWRQ�0DUDWKRQ�HYHU\�ILYH�\HDUV�VLQFH������LV�VKRZQ���/HW�x be thenumber of years since 1975. �
� � D�� Find an equation for the median-fit line. � E�� According to the equation, how many entrants were there in 2003?
62/87,21���a. Let x = 0 for 1975. Use a calculator to find the equation of the median fit line. �
� y = 601.44x + 1236.13 � b. To estimate the number of entrants in 2003, evaluate the equation for the median-fit line for x = 2003 ± 1975 = 28.�
� There were about 18,076 entrants in 2003.
���&$03,1*� A campground kept a record of the number of campsites rented over the week of July 4 for several \HDUV���/HW�x be the number of years since 2000. �
� D�� Find an equation for the regression line. � E�� Predict the number of campsites that will be rented in 2012. � F�� Predict the number of campsites that will be rented in 2020.
62/87,21���a. Use a calculator to find an equation for the regression line. �
� y = 3.07x + 32.71 � b. To predict the number of campsites that will be rented in 2012, evaluate the regression equation for x = 12�
� There will be about 70 campsites rented in 2012. � c. To predict the number of campsites that will be rented in 2020, evaluate the regression equation for x = 20.�
� There will be about 94 campsites rented in 2020.
���,&(�&5($0� An ice cream company keeps a count of the tubs of cookie dough ice cream delivered to each of their stores in a particular area. ��
� D�� Find an equation for the median-fit line. � E�� Graph the points and the median-fit line. � F�� How many tubs would be delivered to a 1500-square-foot store? a 5000-square-foot store?
62/87,21���a. Use a calculator to find an equation for the median-fit line. �
� y = 0.095x í 94.58 � b. Plot the points and the equation. �
� c. To estimate the number of tubs to be delivered to a 1500-square-foot store, evaluate the regression equation for x = 1500. �
� There are about 48 tubs delivered to a 1500-square-foot store. To estimate the number of tubs to be delivered to a 5000-square-foot store, evaluate the regression equation for x = 5000. �
� There are about 380 tubs delivered to a 5000-square-foot store.
����CCSS SENSE-0$.,1*� The prices of the eight top-selling brands of jeans at Jeanie¶s Jeans are given in the table below. �
� D�� Find the equation for the regression line. � E�� According to the equation, what would be the price of a pair of the 12th best-selling brand? � F�� Is this a reasonable prediction? Explain.
62/87,21���a. Use a calculator to find an equation for the regression line. �
Step 1: Enter the data by pressing and selecting the EDIT option. Enter the sales rank into List 1 (L1). These will represent the x-values. Enter the price into List 2 (L2). These will represent the y-values. �
Step 2: Perform the regression by pressing �DQG�VHOHFWLQJ�WKH�CALC option. Scroll down to LinReg(ax+
b) and press . �
� y = 9.8x + 28.79 � b. To predict the price of a pair of the 12th bestselling brands of jeans, evaluate the regression equation for x = 12. �
� The price of a pair of the 12th bestselling brands of jeans would be about $146.39. � F�� Sample answer: No; the correlation between sales rank and price is too weak to make any reasonable prediction. The 12th bestselling brand of jeans could just as easily be a poorly made pair of jeans selling for $15.
����67$7(�)$,56� The table shows the total attendance, in millions of people, at the Minnesota State Fair from 2005 to 2009. �
� D��Graph a scatter plot of the data, where x = 1 represents 2005. Then find and graph the equation for the best-fit line. � b. Graph and analyze the residual plot. � c.��3UHGLFW�WKH�WRWDO�DWWHQGDQFH�LQ������ �
62/87,21���a. Enter the data from the table into the lists. Let x be the years starting with x = 1 for 2005 and let y = the attendence (in millions). Then graph the scatter plot. �
�
[0, 6] scl: 1 by [0, 3] scl: 0.5 � Perform the linear regression using the data in the lists. Find the equation of the best-fit line. �
� The equation is about y = 0.0326x + 1.598. � Use Y= to enter the equation into the calculator and graph the best-fit line with the scatter plot. �
[0, 6] scl: 1 by [0, 3] scl: 0.5 � b. Use the calculator to graph the residual plot for the data. �
� All the residuals appear to almost be on the line. Therefore, the regression line is a good fit for the data. � F���0HWKRG����To find the number of people in 2020, substitute 16 for x��
� Method 2: Copy the equation to the Y= list and graph. Use the value option to find the value of y when x = 16. �
[0, 17] scl: 1 by [0, 3] scl: 0.5 � 6R��WKHUH�ZLOO�EH�DERXW������PLOOLRQ�SHRSOH�LQ�������
����),5(),*+7(56� 7KH�WDEOH�VKRZV�VWDWLVWLFV�IURP�WKH�8�6��)LUH�$GPLQLVWUDWLRQ�� �
� D�� Find an equation for the median-fit line. � E�� Graph the points and the median-fit line. � F�� Does the median-fit line give you an accurate picture of the number of firefighters? Explain.
62/87,21���a. Use a calculator to find an equation for the median-fit line. �
Step 1: Enter the data by pressing and selecting the EDIT option. Enter age into List 1 (L1). These will represent the x-values. Enter the number of firefighters into List 2 (L2). These will represent the y-values. �
Step 2: Perform the regression by pressing and selecting the CALC option. Scroll down to Med-Med
and press �� �
� y = í841.42x + 223288 � b. Plot the points and graph the median fit line. �
� c. No, the median-fit line does not give an accurate picture of the number of firefighters. The points show no linear correlation; therefore a line cannot accurately portray the data.
����$7+/(7,&6� The table shows the total number of teens who participated in high school athletics in various years. �
� � D�� Find an equation for the regression line. � E�� According to the equation, how many participated in 1988?
62/87,21���a. Use a calculator to find an equation for the regression line. �
Step 1: Enter the data by pressing and selecting the EDIT option. Let the year 1970 be represented by 0. Enter the years since 1970 into List 1 (L1). These will represent the x-values. Enter the number of athletes into List 2 (L2). These will represent the y-values. �
Step 2: Perform the regression by pressing and selecting the CALC option. Scroll down to LinReg(ax+
b) and press . �
� y = 87,390.5x + 4,018,431 � b. To estimate the number of participants in 1988, evaluate the regression equation for x = 18 because 1988 is 18 years after 1970. �
� There were about 5,591,460 participants in 1988.
����$57� $�FRXQW�ZDV�NHSW�RQ�WKH�QXPEHU�RI�SDLQWLQJV�WKDW�VROG�DW�DQ�DXFWLRQ�E\�WKH�\HDU�LQ�ZKLFK�WKH\�ZHUH�SDLQWHG���Let x be the number of years since 1950. �
� D�� Find the equation for the linear regression line. � E�� How many paintings were sold that were painted in 1961? � F�� Is the linear regression equation an accurate model of the data? Explain why or why not.
62/87,21���a. 8VH�D�FDOFXODWRU�WR�ILQG�DQ�HTXDWLRQ�IRU�WKH�UHJUHVVLRQ�OLQH�� �
Step 1: Enter the data by pressing and selecting the EDIT option. Let x =0 for the year 1950.. Enter the years since 1950 into List 1 (L1). These will represent the x-values. Enter the number of painting sold into List 2 (L2). These will represent the y-values. �
Step 2: Perform the regression by pressing �DQG�VHOHFWLQJ�WKH�CALC option. Scroll down to LinReg(ax+
b) and press . � �
� y = 0.446x +9.43 � b. 7R�HVWLPDWH�WKH�QXPEHU�RI�SDLQWLQJV�VROG�LQ�������HYDOXDWH�WKH�UHJUHVVLRQ�HTXDWLRQ�IRU������ZKHQ��x =11. �
� There were about 14 paintings sold in 1961. � F�� No, the correlation coefficient is 0.48, so the linear model is not a good fit for the data. It does not appear from the data that there is a relationship between the number of paintings sold and the year they were painted.
����&&66�$5*80(176� Below are the results of the World Superpipe Championships in 2008.\ �
� � Find an equation of the regression line for each, and graph them on the same coordinate plane. Compare and contrast the men¶s and women's graphs.
62/87,21���Use a calculator to find an equation of the regression line for each set of data.� Men: y = í2.92x + 95.92 Women: y = í7x+106 � Graph the equations on the same coordinate plane. �
� The women¶s scores are typically lower than the men¶s.
����5($621,1*� For a class project, the scores that 10 randomly selected students earned on the first 8 tests of the VFKRRO�\HDU�DUH�JLYHQ��([SODLQ�KRZ�WR�ILQG�D�OLQH�RI��EHVW�ILW���&RXOG�LW�EH�XVHG�WR�SUHGLFW�WKH�VFRUHV�RI�RWKHU�VWXGHQWV"Explain your reasoning.
62/87,21���Apply a linear regression model to the data. Use the number of each test as the independent variable and the score on each test as the dependent variable. If there is no correlation, the r value will not be close to 1 or í1. If this is the case, the line of fit could not be used to predict the scores of the other students.
����23(1�(1'('� For 10 different people, measure their heights and the lengths of their heads from chin to top. Use these data to generate a linear regression equation and a median-fit equation. Make a prediction using both of the equations.
62/87,21���Student should gather and record data and use a calculator to find the equation of linear regression and a median-fit equation. Students should make predictions based on both equations. � 6DPSOH�GDWD��
� Median-fit (Store in Y1)
y = 8.31x ± 3.12 � /LQHDU�UHJUHVVLRQ���6WRUH�LQ Y2)
y = 7.39x + 5.22 � Find the height of a student with chin to top of head measure of 8.1. Use the value option from the CALC menu. Use the up arrow to move from one line to another. �
�
� The median-fit line predicts a student¶s height of 64.17 inches and the linear regression line predicts a height of 65.07.
Chin to 7RS��RI�
Head Measure Height8.8 70.99.1 72.89.3 73.87.5 61.08.4 66.37.8 62.08.5 67.38.8 68.98.3 68.78.9 71.5
����WRITING IN MATH How are lines of fit and linear regression similar? different?
62/87,21���Sample answer: Both lines of fit and linear regression are used to model data. However, you could have numerous lines of fit, while linear regression results in one line of best fit. If linear regression is used, you can also use the correlation coefficient to see how closely the model fits the data. For example, the scatter plot below displays the points (1, 10), (2, 17), (3, 15), (4, 20), (5, 28), (6, 19), and (7, 25). �
$�OLQH�RI�ILW�FRXOG�EH�GUDZQ�WKURXJK���������DQG����������7KH�HTXDWLRQ�RI�WKLV�OLQH�RI�ILW�LV�� .
� Use a calculator to find the equation of the regression line for this data. �
� The only regression line for this data has an equation of about y = 2.2x����������
����*(20(75<� Sam is putting a border around a poster. x represents the poster¶s width, and y represents the poster¶s length. Which equation represents how much border Sam will use if he doubles the length and the width? � $� 4xy � %� (x + y)4 � &� 4(x + y) � '� 16(x + y)
62/87,21���The perimeter of the room is found by . y is the length and x is the width, so . But Sam wants to double the border, so the perimeter becomes: �
� So, the correct choice is C.
����6+257�5(63216(� Tatiana wants to run 5 miles at an average pace of 9 minutes per mile. After 4 miles, her average pace is 9 minutes 10 seconds. In how many minutes must she complete the final mile to reach her goal?
62/87,21���Tatiana ran each of the first 4 miles in 10 more seconds than she planned. So to reach her goal, she must run the lastmile in 40 seconds less than she planned. 9 min ± 40 s = 8 min and 20 s.
����What is the slope of the line that passes through (1, 3) and (í3, 1)?� )� í2 �
*��
�
+��
� -� 2
62/87,21���
� So, the correct choice is H.
����What is an equation of the line that passes through (0, 1) and has a slope of 3?� $� y = 3x í 1 � %� y = 3x í 2 � &� y = 3x + 4 � '� y = 3x + 1
62/87,21���Find the y-intercept. �
� The equation is y = 3x + 1. So, the correct choice is D.
����86('�&$56� Gianna wants to buy a specific make and model of a used car. She researched prices from dealers and private sellers and made the graph shown. �
� D�� Describe the relationship in the data. � E�� Use the line of fit to predict the price of a car that is 7 years old. � F�� Is it reasonable to use this line of fit to predict the price of a 10-year old car? Explain.
62/87,21���a. Because y decreases as x increases, there is a negative correlation in the data. � b. Find x = 7 on the graph and follow the line up to the line of fit. According to the graph, the price of a car that is 7 years old would be about $3600. � c. No, it would not be reasonable to use this line of fit to predict the price of a 10-year old car, because according to the line of fit, the cost would be $0 and that doesn¶t make sense.
����*(20(75<� A quadrilateral has sides with equations y = í2x, 2x + y = 6, , and x í 2y = 9. Is the figure a rectangle? Explain your reasoning.
62/87,21���Write all of the equations in slope-intercept form. � Equation 1: y = í2x � (TXDWLRQ���� �
� (TXDWLRQ����
������������������y = x + 6 � Equation 4:� �
� Find the slope of each line �
� The slope of opposite sides are equal (±2 and ±���DQG�����DQG�������VR�WKH\�DUH�SDUDOOHO��$OVR��WKH�VORSH�RI�consecutive sides are opposite reciprocals (±2 and 0.5; and ±2 and 0.5), so they are perpendicular. So, the figure is a rectangle.
y = í2x í2y = ±2x +6 í2
y = 0.5x + 6
y = 0.5x ± 4.5
Write each equation in standard form.����y í 2 = 3(x í 1)
62/87,21���
����y í 5 = 6(x + 1)
62/87,21���
����y + 2 = í2(x í 5)
62/87,21���
����
62/87,21���
����
62/87,21���
����
62/87,21���
Find the slope of the line that passes through each pair of points.����(3, 4), (10, 8)
62/87,21���
����(í4, 7), (3, 5)
62/87,21���
����(3, 7), (í2, 4)
62/87,21���
����(í3, 2), (í3, 4)
62/87,21���
The slope is undefined.
If f (x) = x2 í x + 1, find each value.����f (í1)
62/87,21���
����f (5) í3
62/87,21���
����f (a)
62/87,21���
����f (b2)
62/87,21���
Graph each equation.����y = x + 2
62/87,21���To graph the equation, plot the y-intercept (0, 2). Then move up 1 unit and right 1 unit. Plot the point. Draw a line through the two points.
����x + 5y = 4
62/87,21���Write the equation in slope-intercept form. �
To graph the equation, plot the y-LQWHUFHSW�� . Then move down 1 unit and right 5 units. Plot the point. Draw a
line through the two points. �
����2x í 3y = 6
62/87,21���Write the equation in slope-intercept form. �
� To graph the equation, plot the y-intercept (0, ±2). Then move up 2 units and right 3 units. Plot the point. Draw a line through the two points. �
����5x + 2y = 6
62/87,21���Write the equation in slope-intercept form. �
� To graph the equation, plot the y-intercept (0, 3). Then move down 5 units and right 2 units. Plot the point. Draw a line through the two points. �
Another line of fit may pass through (2, 15) and (7, 25). The equation of this line of fit is y = 2x + 11. More lines of fit that come close to the points could be drawn.
eSolutions Manual - Powered by Cognero Page 32
4-6 Regression and Median-Fit Lines


![Variable Damage For Fenris 2d6 - thetrove.is 2d6 (osr)/Fenris 2d6 R2000-1 Errata... · Fenris 2d6 Optional Variable Damage Calculation Errata[PI] By Gregory B. MacKenzie ©2013 Fenris](https://static.fdocuments.us/doc/165x107/60ad8d51a5b83c51091f6193/variable-damage-for-fenris-2d6-2d6-osrfenris-2d6-r2000-1-errata-fenris.jpg)