4.2 Air Quality - Metro
32
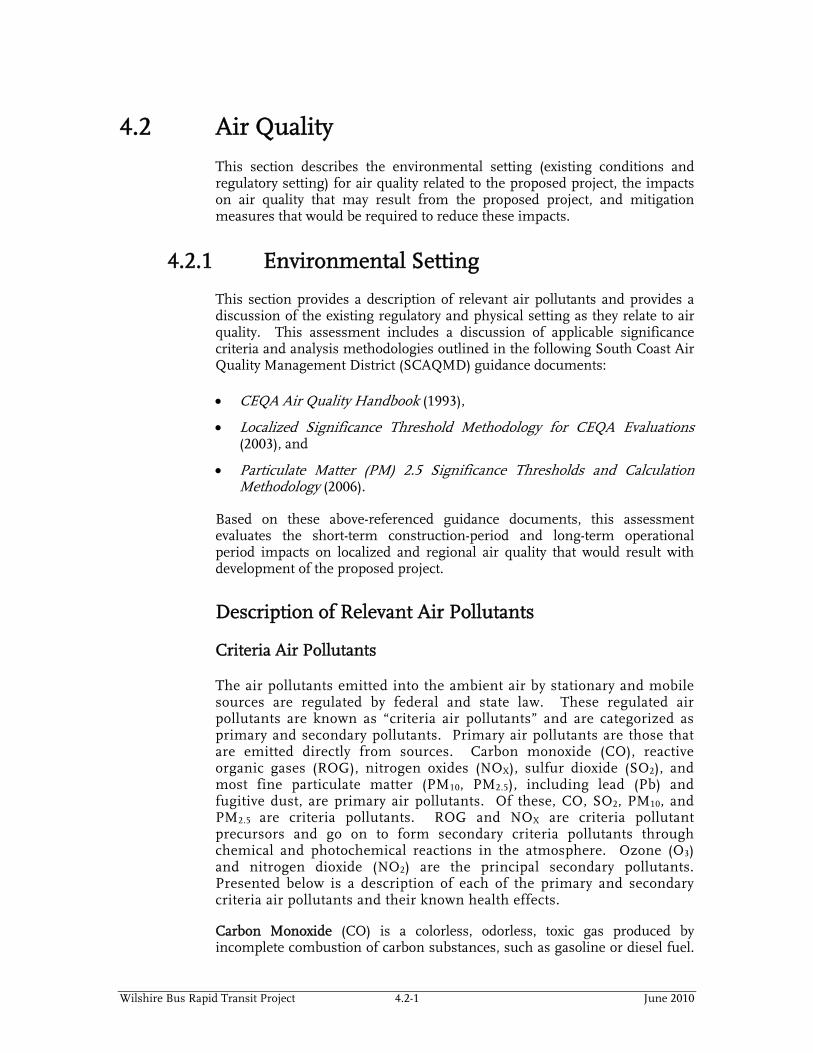
Wilshire Bus Rapid Transit Project 4.2-1 June 2010 4.2 Air Quality This section describes the environmental setting (existing conditions and regulatory setting) for air quality related to the proposed project, the impacts on air quality that may result from the proposed project, and mitigation measures that would be required to reduce these impacts. 4.2.1 Environmental Setting This section provides a description of relevant air pollutants and provides a discussion of the existing regulatory and physical setting as they relate to air quality. This assessment includes a discussion of applicable significance criteria and analysis methodologies outlined in the following South Coast Air Quality Management District (SCAQMD) guidance documents: • CEQA Air Quality Handbook (1993), • Localized Significance Threshold Methodology for CEQA Evaluations (2003), and • Particulate Matter (PM) 2.5 Significance Thresholds and Calculation Methodology (2006). Based on these above-referenced guidance documents, this assessment evaluates the short-term construction-period and long-term operational period impacts on localized and regional air quality that would result with development of the proposed project. Description of Relevant Air Pollutants Criteria Air Pollutants The air pollutants emitted into the ambient air by stationary and mobile sources are regulated by federal and state law. These regulated air pollutants are known as “criteria air pollutants” and are categorized as primary and secondary pollutants. Primary air pollutants are those that are emitted directly from sources. Carbon monoxide (CO), reactive organic gases (ROG), nitrogen oxides (NO X ), sulfur dioxide (SO 2 ), and most fine particulate matter (PM 10 , PM 2.5 ), including lead (Pb) and fugitive dust, are primary air pollutants. Of these, CO, SO 2 , PM 10 , and PM 2.5 are criteria pollutants. ROG and NO X are criteria pollutant precursors and go on to form secondary criteria pollutants through chemical and photochemical reactions in the atmosphere. Ozone (O 3 ) and nitrogen dioxide (NO 2 ) are the principal secondary pollutants. Presented below is a description of each of the primary and secondary criteria air pollutants and their known health effects. Carbon Monoxide (CO) is a colorless, odorless, toxic gas produced by incomplete combustion of carbon substances, such as gasoline or diesel fuel.
Transcript of 4.2 Air Quality - Metro
Wilshire Bus Rapid Transit Project 4.2-1 June 2010
4.2 Air Quality This section describes the environmental setting (existing conditions and regulatory setting) for air quality related to the proposed project, the impacts on air quality that may result from the proposed project, and mitigation measures that would be required to reduce these impacts.
4.2.1 Environmental Setting
This section provides a description of relevant air pollutants and provides a discussion of the existing regulatory and physical setting as they relate to air quality. This assessment includes a discussion of applicable significance criteria and analysis methodologies outlined in the following South Coast Air Quality Management District (SCAQMD) guidance documents:
• CEQA Air Quality Handbook (1993),
• Localized Significance Threshold Methodology for CEQA Evaluations (2003), and
• Particulate Matter (PM) 2.5 Significance Thresholds and Calculation Methodology (2006).
Based on these above-referenced guidance documents, this assessment evaluates the short-term construction-period and long-term operational period impacts on localized and regional air quality that would result with development of the proposed project.
Description of Relevant Air Pollutants
Criteria Air Pollutants
The air pollutants emitted into the ambient air by stationary and mobile sources are regulated by federal and state law. These regulated air pollutants are known as “criteria air pollutants” and are categorized as primary and secondary pollutants. Primary air pollutants are those that are emitted directly from sources. Carbon monoxide (CO), reactive organic gases (ROG), nitrogen oxides (NOX), sulfur dioxide (SO2), and most fine particulate matter (PM10, PM2.5), including lead (Pb) and fugitive dust, are primary air pollutants. Of these, CO, SO2, PM10, and PM2.5 are criteria pollutants. ROG and NOX are criteria pollutant precursors and go on to form secondary criteria pollutants through chemical and photochemical reactions in the atmosphere. Ozone (O3) and nitrogen dioxide (NO2) are the principal secondary pollutants. Presented below is a description of each of the primary and secondary criteria air pollutants and their known health effects.
Carbon Monoxide (CO) is a colorless, odorless, toxic gas produced by incomplete combustion of carbon substances, such as gasoline or diesel fuel.

Los Angeles County Metropolitan Transportation Authority Section 4.2 Air Quality Federal Transit Administration
Wilshire Bus Rapid Transit Project 4.2-2 June 2010
The primary adverse health effect associated with CO is interference with normal oxygen transfer to the blood, which may result in tissue oxygen deprivation.3 Reactive Organic Gases (ROG) are compounds made up primarily of atoms of hydrogen and carbon. Internal combustion associated with motor vehicle usage is the major source of hydrocarbons. Other sources of ROG are emissions associated with the use of paints and solvents, the application of asphalt paving, and the use of household consumer products such as aerosols. Adverse effects on human health are not caused directly by ROG but rather by reactions of ROG to form secondary pollutants such as ozone.4
Nitrogen Oxides (NOX) serve as integral participants in the process of photochemical smog production. The two major forms of NOX are nitric oxide (NO) and nitrogen dioxide (NO2). NO is a colorless, odorless gas formed from atmospheric nitrogen and oxygen when combustion takes place under high temperature and/or high pressure. NO2 is a reddish-brown irritating gas formed by the combination of NO and oxygen. NOX acts as an acute respiratory irritant and increases susceptibility to respiratory pathogens.
Nitrogen Dioxide (NO2) is a by-product of fuel combustion. The principal form of NO2 produced by combustion is NO, but NO reacts with oxygen to form NO2, creating the mixture of NO and NO2 commonly called NOX. NO2 acts as an acute irritant and, in equal concentrations, is more injurious than NO. At atmospheric concentrations, however, NO2 is only potentially irritating. There is some indication of a relationship between NO2 and chronic pulmonary fibrosis. Some increase in bronchitis in children (two and three years old) has also been observed at concentrations below 0.3 parts per million (ppm). NO2 absorbs blue light; the result is a brownish-red cast to the atmosphere and reduced visibility. NO2 also contributes to the formation of PM10. NOX are also precursors to the formation of both O3 and PM2.5.5,6
Sulfur Dioxide (SO2) is a colorless, pungent, irritating gas formed by the combustion of sulfurous fossil fuels. Fuel combustion is the primary source of SO2. At high concentrations SO2 may irritate the upper respiratory tract. At lower concentrations and when combined with particulates, SO2 may do greater harm by injuring lung tissue. A primary source of SO2 emissions is high sulfur content coal. Gasoline and natural gas have very low sulfur content and hence do not release significant quantities of SO2.7
Particulate Matter (PM) consists of finely divided solids or liquids such as soot, dust, aerosols, fumes, and mists. Two forms of fine particulates are now recognized. Inhalable course particles, or PM10, include the particulate
3 South Coast Air Quality Management District. 2005. Guidance Document for Addressing Air
Quality Issues in General Plans and Local Planning. 4 Ibid. 5 Ibid; South Coast Air Quality Management District. 2007 Air Quality Management Plan. 6 South Coast Air Quality Management District, Guidance Document for Addressing Air Quality
Issues. 7 Ibid.

Los Angeles County Metropolitan Transportation Authority Section 4.2 Air Quality Federal Transit Administration
Wilshire Bus Rapid Transit Project 4.2-3 June 2010
matter with a diameter of 10 microns (10 millionths of a meter or 0.0004 inch) or less. Inhalable fine particles, or PM2.5, have a diameter of 2.5 microns (i.e., 2.5 millionths of a meter or 0.0001 inch) or less. Particulate discharge into the atmosphere results primarily from industrial, agricultural, construction, and transportation activities. However, wind on arid landscapes also contributes substantially to local particulate loading. Both PM10 and PM2.5 may adversely affect the human respiratory system, especially in those people who are naturally sensitive or susceptible to breathing problems.8
Fugitive dust primarily poses two public health and safety concerns. The first concern is that of respiratory problems attributable to the particulates suspended in the air. The second concern is that of motor vehicle accidents caused by reduced visibility during severe wind conditions. Fugitive dust may also cause significant property damage during strong windstorms by acting as an abrasive material agent (much like sandblasting).9
Ozone (O3), or smog, is one of a number of substances called photochemical oxidants that are formed when ROG and NOX (both by-products of the internal combustion engine) react with sunlight. O3 is present in relatively high concentrations in the South Coast Air Basin (Basin or SCAB), and the damaging effects of photochemical smog are generally related to the concentrations of O3. O3 poses a health threat to those who already suffer from respiratory diseases as well as to healthy people. Additionally, O3 has been tied to crop damage, typically in the form of stunted growth and premature death. O3 can also act as a corrosive, resulting in property damage such as the degradation of rubber products.10
Toxic Air Contaminants
With respect to criteria pollutants, federal and State ambient air quality standards (AAQS) represent the exposure level (with an adequate margin of safety) deemed safe for humans. No AAQS exist for toxic air contaminants (TACs), because there is no exposure level deemed safe for humans. Pollutants are identified as TACs because of their potential to increase the risk of developing cancer or because of their acute or chronic health risks. For TACs that are known or suspected carcinogens, the California Air Resources Board (ARB) has consistently found that there are no levels or thresholds below which exposure is risk-free. Individual TACs vary greatly in the risk they present. At a given level of exposure, one TAC may pose a hazard that is many times greater than another. For certain TACs, a unit risk factor can be developed to evaluate cancer risk. For acute and chronic health risks, a similar factor, called a Hazard Index, is used to evaluate risk. In the early 1980s, ARB established a statewide comprehensive air toxics program to reduce exposure to air toxics. The Toxic Air Contaminant Identification and Control Act (AB 1807, ARB 1999) created California’s program to reduce exposure to air toxics. The Air Toxics “Hot Spots” Information and Assessment Act (AB 2588, ARB 1999) supplements the AB 1807 program by
8 Ibid. 9 Ibid. 10 Ibid.

Los Angeles County Metropolitan Transportation Authority Section 4.2 Air Quality Federal Transit Administration
Wilshire Bus Rapid Transit Project 4.2-4 June 2010
requiring a statewide air toxics inventory, notification of people exposed to a significant health risk, and facility plans to reduce these risks.
In August 1998, ARB identified particulate emissions from diesel-fueled engines as TACs. In September 2000, ARB approved a comprehensive diesel risk reduction plan to reduce emissions from both new and existing diesel-fueled engines and vehicles. The goal of the plan is to reduce diesel PM10 emissions and the associated health risk by 75% in 2010 and by 85% by 2020.
Greenhouse Gases
Greenhouse gases (GHG) include carbon dioxide (CO2), methane (CH4), nitrous oxide (N2O), and fluorinated gases. Presented below is a description of each GHG and their known sources.
Carbon Dioxide (CO2) enters the atmosphere through the burning of fossil fuels (oil, natural gas, and coal), solid waste, trees and wood products, respiration, and also as a result of other chemical reactions (e.g., manufacture of cement). Carbon dioxide is also removed from the atmosphere (or “sequestered”) when it is absorbed by plants as part of the biological carbon cycle.
Methane (CH4) is emitted during the production and transport of coal, natural gas, and oil. Methane emissions also result from livestock and other agricultural practices and by the decay of organic waste in municipal solid waste landfills. 11
Nitrous Oxide (N2O) is emitted during agricultural and industrial activities, as well as during combustion of fossil fuels and solid waste. 12
Fluorinated Gases are synthetic, strong greenhouse gases that are emitted from a variety of industrial processes. Fluorinated gases are sometimes used as substitutes for ozone-depleting substances. These gases are typically emitted in smaller quantities, but because they are potent greenhouse gases, they are sometimes referred to as High Global Warming Potential gases. 13
• Chlorofluorocarbons (CFCs) are greenhouse gases covered under the 1987 Montreal Protocol and used for refrigeration, air conditioning, packaging, insulation, solvents, or aerosol propellants. Since they are not destroyed in the lower atmosphere (troposphere, stratosphere), CFCs drift into the upper atmosphere where, given suitable conditions, they break down ozone. These gases are being replaced by other compounds that are greenhouse gases covered under the Kyoto Protocol.
• Perfluorocarbons (PFCs) are a group of human-made chemicals composed of carbon and fluorine only. These chemicals (predominantly perfluoromethane [CF4] and perfluoroethane [C2F6]) were introduced as
11 Ibid. 12 Ibid. 13 Ibid.

Los Angeles County Metropolitan Transportation Authority Section 4.2 Air Quality Federal Transit Administration
Wilshire Bus Rapid Transit Project 4.2-5 June 2010
alternatives, along with HFCs, to the ozone-depleting substances. In addition, PFCs are emitted as by-products of industrial processes and are also used in manufacturing. PFCs do not harm the stratospheric ozone layer, but they are strong greenhouse gases.
• Sulfur Hexafluoride (SF6) is a colorless gas soluble in alcohol and ether, slightly soluble in water. SF6 is a strong greenhouse gas used primarily in electrical transmission and distribution systems as a dielectric.14
• Hydrochlorofluorocarbons (HCFCs) contain hydrogen, fluorine, chlorine, and carbon atoms. Although ozone-depleting substances, they are less potent than CFCs. They have been introduced as temporary replacements for CFCs and are also greenhouse gases.
• Hydrofluorocarbons (HFCs) contain only hydrogen, fluorine, and carbon atoms. They were introduced as alternatives to ozone-depleting substances in serving many industrial, commercial, and personal needs. HFCs are emitted as by-products of industrial processes and are also used in manufacturing. They do not significantly deplete the stratospheric ozone layer, but they are strong greenhouse gases.
4.2.2 Regulatory Setting
A number of statutes, regulations, plans, and policies have been adopted that address air quality issues. The project site and vicinity are subject to air quality regulations developed and implemented at the federal, State, and local levels. At the federal level, the USEPA is responsible for implementation of the federal Clean Air Act (CAA). Some portions of the CAA (e.g., certain mobile-source and other requirements) are implemented directly by the USEPA. Other portions of the CAA (e.g., stationary-source requirements) are implemented by state and local agencies.
Federal Clean Air Act
The CAA was first enacted in 1955 and has been amended numerous times in subsequent years (1963, 1965, 1967, 1970, 1977, and 1990). The CAA establishes federal air quality standards, known as National Ambient Air Quality Standards (NAAQS), and specifies future dates for achieving compliance. The CAA also mandates that the state submit and implement a State Implementation Plan (SIP) for local areas not meeting those standards. The plans must include pollution control measures that demonstrate how the standards will be met. The City of Los Angeles is within the Basin and, as such, is in an area designated a nonattainment area for certain pollutants that are regulated under the CAA.
The 1990 amendments to the CAA identify specific emission-reduction goals for areas not meeting the NAAQS. These amendments require both a demonstration of reasonable further progress toward attainment and incorporation of additional sanctions for failure to attain or meet interim
14 An electrical insulator that is highly resistant to the flow of an electric current.

Los Angeles County Metropolitan Transportation Authority Section 4.2 Air Quality Federal Transit Administration
Wilshire Bus Rapid Transit Project 4.2-6 June 2010
milestones. The sections of the CAA that would most substantially affect the development of the proposed project include Title I (Nonattainment Provisions) and Title II (Mobile-Source Provisions).
Title I provisions were established with the goal of attaining the NAAQS for criteria pollutants. Table 4.2-1 shows the NAAQS currently in effect for each criteria pollutant. The NAAQS were amended in July 1997 to include an 8-hour standard for ozone (O3) and adopt a NAAQS for fine particulate matter (PM2.5). The Basin fails to meet national standards for O3, inhalable particulate matter (PM10, and PM2.5 and therefore is considered a federal nonattainment area for those pollutants. Table 4.2-2 lists each criteria pollutant and their related attainment status.
Federal Climate Change Policy
Twelve U.S. states and cities (including California), in conjunction with several environmental organizations, sued to force the USEPA to regulate GHGs as a pollutant pursuant to the federal Clean Air Act (CAA) (Massachusetts vs. Environmental Protection Agency et al. [U.S. Supreme Court No. 05–1120; argued November 29, 2006; decided April 2, 2007). The court ruled that the plaintiffs had standing to sue, that GHGs fit within the CAA’s definition of a pollutant, and that the USEPA’s reasons for not regulating GHGs were insufficiently grounded in the CAA. This prompted the Administrator of the USEPA to sign a proposal April 24, 2009. The proposal contained two distinct findings regarding greenhouse gases under section 202(a) of the CAA.
The Administrator is proposing to find that the current and projected concentrations of the mix of six key greenhouse gases (carbon dioxide [CO2], methane [CH4], nitrous oxide [N2O], hydrofluorocarbons [HFCs], perfluorocarbons [PFCs], and sulfur hexafluoride [SF6]) in the atmosphere threaten the public health and welfare of current and future generations. This is referred to as the Endangerment Finding.
The Administrator is further proposing to find that the combined emissions of CO2, CH4, N2O, and HFCs from new motor vehicles and motor vehicle engines contribute to the atmospheric concentrations of these key greenhouse gases and hence to the threat of climate change. This is referred to as the Cause or Contribute Finding.
California Clean Air Act
The California Clean Air Act (CCAA), signed into law in 1988, requires all areas of the State to achieve and maintain the California Ambient Air Quality Standards (CAAQS) by the earliest practical date. The CAAQS incorporate additional standards for most of the criteria pollutants and set standards for

Los Angeles County Metropolitan Transportation Authority Section 4.2 Air Quality Federal Transit Administration
Wilshire Bus Rapid Transit Project 4.2-7 June 2010
Table 4.2-1. Federal and State Ambient Air Quality Standards
Pollutant Averaging Time CAAQSa NAAQSb
Ozone (O3) 1 hour 8 hour
0.09 ppmc 0.070 ppm
-- 0.075 ppm
Carbon Monoxide (CO) 1 hour 20.0 ppm 35.0 ppm
8 hour 9.0 ppm 9 ppm
Nitrogen Dioxide (NO2) 1 hour 0.18 ppm 0.100 ppm
Annual 0.030 ppm 0.053 ppm
Sulfur Dioxide (SO2) 1 hour 0.25 ppm --
3 hour -- 0.5 ppm
24 hour 0.04 ppm 0.14 ppm
Annual -- 0.030 ppm
Respirable Particulate Matter (PM10)
24 hour 50 μg/m3c 150 μg/m3
Annual 20 μg/m3 --
Fine Particulate Matter (PM2.5)
24 hour -- 35 μg/m3
Annual 12 μg/m3 15.0 μg/m3
Sulfates 24 hour 25 μg/m3 --
Lead (Pb) 30 day 1.5 μg/m3 --
Calendar quarter -- 1.5 μg/m3
Rolling 3-month Average -- 0.15 μg/m3
Hydrogen Sulfide 1 hour 0.03 ppm --
Vinyl Chloride 24 hour 0.01 ppm --
Notes: aThe CAAQS for O3, CO, SO2 (1-hour and 24-hour), NO2, PM10, and PM2.5 are values not to be exceeded. All other California standards shown are values not to be equaled or exceeded. bThe NAAQS, other than O3 and those based on annual averages, are not to be exceeded more than once a year. The O3 standard is attained when the expected number of days per calendar year with maximum hourly average concentrations above the standard is equal to or less than one. cppm = parts per million by volume; μg/m3 = micrograms per cubic meter
Source: California Air Resources Board, February 16, 2010.
other pollutants recognized by the State. In general, the California standards are more health protective than the corresponding NAAQS. California has also set standards for sulfates, hydrogen sulfide, vinyl chloride, and visibility- reducing particles. The Basin is in compliance with these California standards for sulfates, hydrogen sulfide, visibility-reducing particles, and vinyl chloride. Table 4.2-1 details the current NAAQS and CAAQS, while Table 4.2-2 provides the Basin’s attainment status with respect to federal and State standards.

Los Angeles County Metropolitan Transportation Authority Section 4.2 Air Quality Federal Transit Administration
Wilshire Bus Rapid Transit Project 4.2-8 June 2010
Table 4.2-2. Federal and State Attainment Status for South Coast Air Basin
Pollutants Federal Classification State Classification
O3 (1-hour standard) -- Nonattainment
O3 (8-hour standard) Nonattainment, Severe-17 --
PM10 Serious Nonattainment Nonattainment
PM2.5 Nonattainment Nonattainment
CO Attainment/Maintenance Attainment
NO2 Unclassified/Attainment Attainment
SO2 Attainment Attainment Source: California Air Resources Board, compiled by ICF International, January 2010.
California Climate Change Policy
California’s major initiatives for reducing climate change or greenhouse gas (GHG) emissions are outlined in the 2006 legislation Assembly Bill 32 (AB 32), 2005 Executive Order S-3-05, and a 2004 ARB regulation to reduce passenger car GHG emissions (AB 1493). These efforts aim at reducing GHG emissions to 1990 levels by 2020 - a reduction of about 25 percent, and then an 80 percent reduction below 1990 levels by 2050. On June 1, 2005, Governor Arnold Schwarzenegger signed Executive Order S-3-05. The goal of this executive order is to reduce California’s GHG emissions to (1) 2000 levels by 2010, (2) 1990 levels by the 2020, and (3) 80percent below the 1990 levels by the year 2050. In 2006, this goal was further reinforced with the passage of AB 32, the Global Warming Solutions Act of 2006. AB 32 sets the same overall GHG emissions reduction goals while further mandating that ARB create a plan, which includes market mechanisms, and implement rules to achieve “real, quantifiable, cost-effective reductions of greenhouse gases.” In response to the State’s efforts to reduce GHG emissions, the Secretary of the California Environmental Protection Agency (Cal/EPA) created the Climate Action Team (CAT), which, in March 2006, published the first Climate Action Team Report to Governor Schwarzenegger and the Legislature (the “2006 CAT Report”). The 2006 CAT Report identifies a recommended list of strategies that the State could pursue to reduce climate change greenhouse gas emissions. These are strategies that could be implemented by various State agencies to ensure that the Governor’s targets are met and can be met with existing authority of the State agencies. Executive Order S-20-06 further directs state agencies to begin implementing AB 32, including the recommendations made by the state’s Climate Action Team. In consultation with ARB and California Public Utilities Commission (CPUC), the California Energy Commission (CEC) is currently establishing a GHG emission performance standard for local, public-owned electric utilities (pursuant to Senate Bill [SB] 1368). This standard will limit the rate of GHG
Los Angeles County Metropolitan Transportation Authority Section 4.2 Air Quality Federal Transit Administration
Wilshire Bus Rapid Transit Project 4.2-9 June 2010
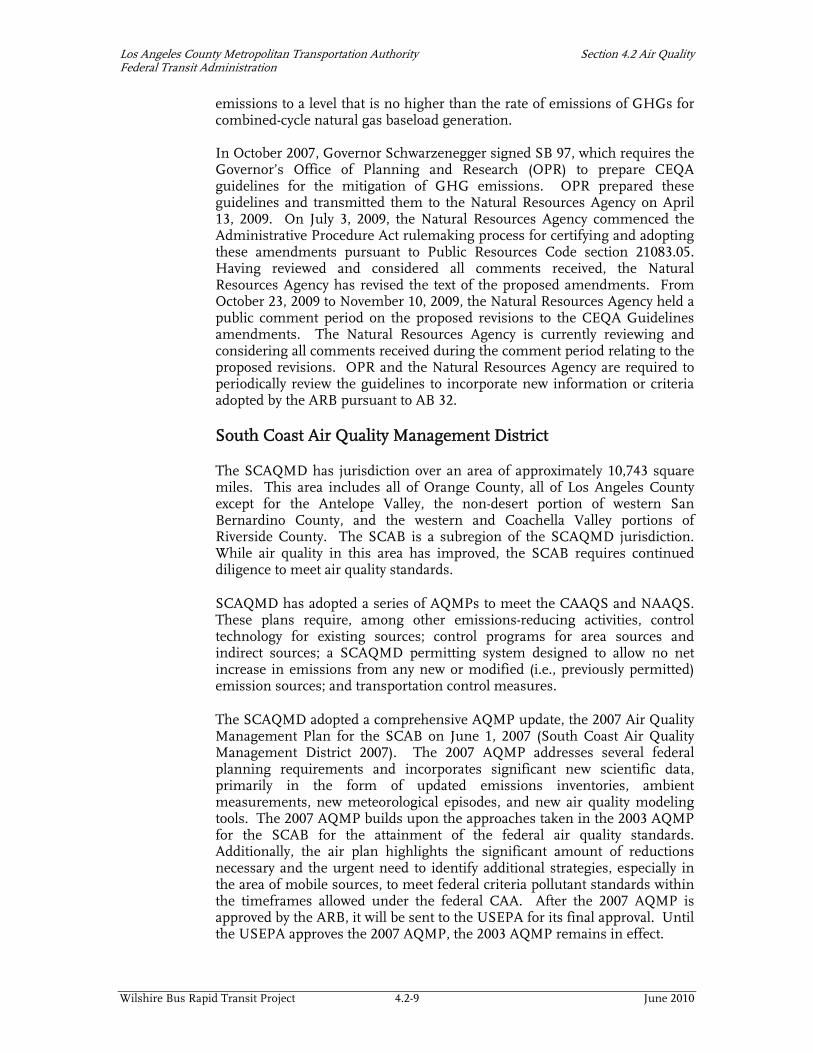
emissions to a level that is no higher than the rate of emissions of GHGs for combined-cycle natural gas baseload generation. In October 2007, Governor Schwarzenegger signed SB 97, which requires the Governor’s Office of Planning and Research (OPR) to prepare CEQA guidelines for the mitigation of GHG emissions. OPR prepared these guidelines and transmitted them to the Natural Resources Agency on April 13, 2009. On July 3, 2009, the Natural Resources Agency commenced the Administrative Procedure Act rulemaking process for certifying and adopting these amendments pursuant to Public Resources Code section 21083.05. Having reviewed and considered all comments received, the Natural Resources Agency has revised the text of the proposed amendments. From October 23, 2009 to November 10, 2009, the Natural Resources Agency held a public comment period on the proposed revisions to the CEQA Guidelines amendments. The Natural Resources Agency is currently reviewing and considering all comments received during the comment period relating to the proposed revisions. OPR and the Natural Resources Agency are required to periodically review the guidelines to incorporate new information or criteria adopted by the ARB pursuant to AB 32.
South Coast Air Quality Management District
The SCAQMD has jurisdiction over an area of approximately 10,743 square miles. This area includes all of Orange County, all of Los Angeles County except for the Antelope Valley, the non-desert portion of western San Bernardino County, and the western and Coachella Valley portions of Riverside County. The SCAB is a subregion of the SCAQMD jurisdiction. While air quality in this area has improved, the SCAB requires continued diligence to meet air quality standards.
SCAQMD has adopted a series of AQMPs to meet the CAAQS and NAAQS. These plans require, among other emissions-reducing activities, control technology for existing sources; control programs for area sources and indirect sources; a SCAQMD permitting system designed to allow no net increase in emissions from any new or modified (i.e., previously permitted) emission sources; and transportation control measures.
The SCAQMD adopted a comprehensive AQMP update, the 2007 Air Quality Management Plan for the SCAB on June 1, 2007 (South Coast Air Quality Management District 2007). The 2007 AQMP addresses several federal planning requirements and incorporates significant new scientific data, primarily in the form of updated emissions inventories, ambient measurements, new meteorological episodes, and new air quality modeling tools. The 2007 AQMP builds upon the approaches taken in the 2003 AQMP for the SCAB for the attainment of the federal air quality standards. Additionally, the air plan highlights the significant amount of reductions necessary and the urgent need to identify additional strategies, especially in the area of mobile sources, to meet federal criteria pollutant standards within the timeframes allowed under the federal CAA. After the 2007 AQMP is approved by the ARB, it will be sent to the USEPA for its final approval. Until the USEPA approves the 2007 AQMP, the 2003 AQMP remains in effect.

Los Angeles County Metropolitan Transportation Authority Section 4.2 Air Quality Federal Transit Administration
Wilshire Bus Rapid Transit Project 4.2-10 June 2010
SCAQMD adopts rules and regulations to implement portions of the AQMP. Several of these rules may apply to construction or operation of the proposed project. For example, SCAQMD Rule 403 requires implementing the best available fugitive dust control measures during active operations capable of generating fugitive dust emissions from on-site earth-moving activities, construction/demolition activities, and construction equipment travel on paved and unpaved roads. SCAQMD has published a handbook (CEQA Air Quality Handbook 1993) to help local governments analyze and mitigate project-specific air quality impacts. This handbook provides standards, methodologies, and procedures for conducting air quality analyses in environmental impact reports and was used extensively in the preparation of this report. In addition, SCAQMD has published two additional documents (Localized Significance Threshold Methodology for CEQA Evaluations in 2003, and Particulate Matter (PM) 2.5 Significance Thresholds and Calculation Methodology in 2006) that provide guidance in evaluating localized effects from mass emissions during construction. Both were used in the preparation of this report.
Regional Comprehensive Plan and Guide
The Southern California Association of Governments (SCAG) is the regional planning agency for Los Angeles, Orange, Ventura, Riverside, San Bernardino, and Imperial Counties. It addresses regional issues relating to transportation, economy, community development, and environment. SCAG is the federally designated metropolitan planning organization (MPO) for the majority of the southern California region and is the largest MPO in the nation. With respect to air quality planning, SCAG has prepared the Regional Comprehensive Plan and Guide (RCPG) for the SCAG region, which includes Growth Management and Regional Mobility chapters, which form the basis for the land use and transportation components of the AQMP. These chapters are utilized in the preparation of air quality forecasts and the consistency analysis that is included in the AQMP.
Existing Conditions
State Greenhouse Gas Emissions
California is the second largest emitter of GHG in the United States (Texas is the largest GHG emitter) and the sixteenth largest GHG emitter in the world.15 However, because of more stringent air pollutant emission regulations and mild climate, in 2001 California ranked fourth lowest in carbon emissions per capita and fifth lowest among states in CO2 emissions from fossil fuel consumption per unit of Gross State Product (total economic
15 California Energy Commission. 2006b. Our Changing Climate, Assessing the Risks to California,
2006 Biennial Report. California Climate Change Center, California Energy Commission Staff Paper, Report CEC-500-2006-077. Sacramento, CA.

Los Angeles County Metropolitan Transportation Authority Section 4.2 Air Quality Federal Transit Administration
Wilshire Bus Rapid Transit Project 4.2-11 June 2010
output of goods and services). In 2004, California produced 492 MMT-CO2e16 GHG emissions, of which 81 percent are CO2 from the combustion of fossil fuels, 2.8 percent were from other sources of CO2, 5.7 percent were from methane, and 6.8 percent were from N2O. 17 The remaining 2.9 percent of GHG emissions were from High Global Warming Potential (GWP) gases.18
CO2 emissions from human activities represent 84 percent of the total GHG emissions. California’s transportation sector is the single largest generator of GHG emissions, producing 40.7 percent of the state’s total emissions. Electricity generation for in-state consumption is the second largest source, with 22.2 percent. While out-of-state electricity generation comprises one-fifth to one-third of California’s total electricity supply, it contributes 39 to 57 percent of the GHG emissions associated with electricity consumption in the state. Industrial activities are California’s third largest source of GHG emissions, producing 20.5 percent of state’s total emissions. Other major sources of GHG emissions include mineral production, waste combustion and land use, and forestry changes. Agriculture, forestry, commercial, and residential activities comprise the balance of California’s greenhouse gas emissions.19
Climate change could impact the natural environment in California in the following ways, among others:
• rising sea levels along the California coastline, particularly in San Francisco and the San Joaquin Delta due to ocean expansion;
• extreme-heat conditions, such as heat waves and very high temperatures, which could last longer and become more frequent;
• an increase in heat-related human deaths, infectious diseases, and a higher risk of respiratory problems caused by deteriorating air quality;
• reduced snow pack and stream flow in the Sierra Nevada mountains, affecting winter recreation and water supplies;
• potential increase in the severity of winter storms, affecting peak stream flows and flooding;
16 Greenhouse gas emissions other than carbon dioxide are commonly converted into carbon dioxide
equivalents, which take into account the differing global warming potential (310) of different gases. For example, the Intergovernmental Panel on Climate Change (IPCC) finds that nitrous oxide has a global warming potential (GWP) of 310 and methane has a GWP of 21. Thus, emission of one ton of nitrous oxide and one ton of methane is represented as the emission of 310 tons of CO2e and 21 tons of CO2e, respectively. This allows for the summation of different greenhouse gas emissions into a single total.
17 CO2 equivalence is used to show the relative potential that different GHG have to retain infrared radiation in the atmosphere and contribute to the greenhouse effect. This potential, the global warming potential of a GHG, is also dependent on the lifetime, or persistence, of the gas molecule in the atmosphere.
18 California Energy Commission. 2006a. Inventory of California Greenhouse Gas Emissions and Sinks 1990 to 2004. California Energy Commission Staff Paper, Report CEC-600-2006-013. Sacramento, CA.
19 Ibid.

Los Angeles County Metropolitan Transportation Authority Section 4.2 Air Quality Federal Transit Administration
Wilshire Bus Rapid Transit Project 4.2-12 June 2010
• changes in growing season conditions that could affect California agriculture, causing variations in crop quality and yield; and
• changes in distribution of plant and wildlife species due to changes in temperature, competition from colonizing species, changes in hydrologic cycles, changes in sea levels, and other climate-related effects.
These changes in California’s climate and ecosystems are occurring at a time when California’s population is expected to increase from 34 million to 59 million by the year 2040.
As such, the number of people potentially affected by climate change, as well as the amount of anthropogenic GHG emissions expected under a “business as usual” scenario, is expected to increase. Similar changes as those noted above for California would also occur in other parts of the world with regional variations in resources affected and vulnerability to adverse effects. GHG emissions in California are attributable to human activities associated with industrial/manufacturing, utilities, transportation, residential, and agricultural sectors as well as natural processes.
Regional Context
The project site is located within the SCAB, an approximately 6,745-square-mile area bounded by the Pacific Ocean to the west and the San Gabriel, San Bernardino, and San Jacinto Mountains to the north and east. The SCAB includes all of Orange County and the non-desert portions of Los Angeles, Riverside, and San Bernardino Counties, in addition to the San Gorgonio Pass area in Riverside County. The terrain and geographical location determine the distinctive climate of the SCAB, which is a coastal plain with connecting broad valleys and low hills.
The southern California region lies in the semi-permanent high-pressure zone of the eastern Pacific. As a result, the climate is mild, tempered by cool sea breezes. The usually mild climatological pattern is interrupted infrequently by periods of extremely hot weather, winter storms, or Santa Ana winds. The extent and severity of the air pollution problem in the SCAB is a function of the area’s natural physical characteristics (weather and topography) and human influences (development patterns and lifestyle). Factors such as wind, sunlight, temperature, humidity, rainfall, and topography all affect the accumulation and dispersion of pollutants throughout the SCAB, making it an area of high pollution potential.
The greatest air pollution impacts throughout the SCAB occur from June through September. These are attributed to the large amount of pollutant emissions, light winds, and shallow vertical atmospheric mixing, which frequently reduce pollutant dispersion, thus causing elevated air pollution levels. Pollutant concentrations in the SCAB vary with location, season, and time of day. O3 concentrations, for example, tend to be lower along the coast, higher in the near inland valleys, and lower in the far inland areas of the SCAB and adjacent desert. Over the past 30 years, substantial progress has been made in reducing air pollution levels in southern California.

Los Angeles County Metropolitan Transportation Authority Section 4.2 Air Quality Federal Transit Administration
Wilshire Bus Rapid Transit Project 4.2-13 June 2010
The SCAQMD has recently completed the Multiple Air Toxics Exposure Study III (MATES III), which was an ambient air monitoring and evaluation study conducted in the Basin. MATES III was a follow on to previous air toxics studies in the Basin and is part of the SCAQMD Governing Board Environmental Justice Initiative.
Compared to previous studies of air toxics in the Basin, MATES III found a decreasing risk for air toxics exposure, with the population weighted risk down by 17% from the analysis in MATES II. While there has been improvement in air quality regarding air toxics, the risks are still unacceptable and are higher near sources of emissions such as ports and transportation corridors. Diesel particulate continues to dominate the risk from air toxics, and the portion of air toxic risk attributable to diesel exhaust is increased compared to the MATES II Study. The highest risks are found near the port area, an area near central Los Angeles, and near transportation corridors. The results from the MATES III study underscore that a continued focus on reduction of toxic emissions, particularly from diesel engines, is needed to reduce air toxics exposure.
The MATES III study concluded that the average carcinogenic risk throughout the Basin, attributed to toxic air contaminants, is approximately 1,194 in one million. Mobile sources (e.g., cars, trucks, trains, ships, aircraft, etc.) represent the greatest contributors. About 83.6% of all risk is attributed to DPM emissions.
Local Area Conditions
Local Climate Data from the Western Regional Climate Center's Los Angeles Civic Center climate monitoring station was used to characterize the eastern project vicinity climate conditions because it is nearest to the eastern end of the project site. The average project area summer (August) high and low temperatures are 83.2 degrees Fahrenheit (°F) and 64.0°F, respectively, while the average winter (January) high and low temperatures are 66.4°F and 48.4°F, respectively. The average annual rainfall is 14.91 inches.20
Data from the Western Regional Climate Center's University of California – Los Angeles climate monitoring station was used to characterize the western project vicinity climate conditions because it is nearest to the western end of the project site. The average project area summer (August) high and low temperatures are 77.8 degrees Fahrenheit (°F) and 61.9°F, respectively, while the average winter (January) high and low temperatures are 65.7°F and 49.9°F, respectively. The average annual rainfall is 17.64 inches.21
The wind monitoring station located nearest to the project site is in downtown Los Angeles; therefore, data from the downtown Los Angeles wind monitoring station was used to characterize study area wind conditions.
20 Western Regional Climate Center. n.d. Los Angeles Area, California Climate Summaries, Los
Angeles Civic Center, California (045115). Available: <http://www.wrcc.dri.edu/cgi-bin/cliRECtM.pl?calacc>. Accessed: December 1, 2008.
21 Western Regional Climate Center. n.d. Los Angeles Area, California Climate Summaries, UCLA – Los Angeles, California (049152). Available: <http://www.wrcc.dri.edu/cgi-bin/cliRECtM.pl?caucla>. Accessed: December 1, 2008.

Los Angeles County Metropolitan Transportation Authority Section 4.2 Air Quality Federal Transit Administration
Wilshire Bus Rapid Transit Project 4.2-14 June 2010
Wind patterns in the project vicinity display a nearly unidirectional flow, primarily from the west–southwest, at an average speed of 4.94 miles per hour. Calm wind conditions are present 8% of the time.22
Existing Pollutant Levels at Nearby Monitoring Station The SCAQMD has divided the Basin into air monitoring areas and maintains a network of air quality monitoring stations located throughout the Basin. The project site’s eastern half is located in the Central Los Angeles County Monitoring Area (i.e., Source Receptor Area [SRA] Number 1), while the western half is located in the Northwest Los Angeles County Coastal Monitoring Area (SRA 2). The nearest monitoring stations to the project site are the Los Angeles – North Main Street station to the east and the West Los Angeles VA Hospital station to the west. The North Main Street station monitors O3, PM10, and PM2.5, while the VA Hospital station monitors only O3.
Monitoring data, shown in Table 4.2-3, show the following pollutant trends: both State 1-hour and 8-hour O3 standards were exceeded an average of four times each year at both stations. Particulate (PM10 and PM2.5) concentrations are largely affected by meteorology and show some variability during the 3-year reporting period. The State 24-hour PM10 standard was exceeded three times in 2006, five times in 2007, and twice in 2008, while the national standard was not exceeded during the 3-year reporting period. The national PM2.5 standard was exceeded 11 times in 2006, 20 times in 2007, and 10 times in 2008.
Existing Health Risk in the Surrounding Area According to the most current SCAQMD inhalation cancer risk data (MATES III Carcinogenic Interactive Map), the project area is located within a cancer risk zone of approximately 800 to 1,100 in one million.23 This is largely due to the project area’s proximity to the Interstate 10 freeway that is located just south of the project site. For comparison, the average cancer risk in the Basin is 1,194 per million.
Sensitive Receptors and Locations Some population groups, such as children, the elderly, and acutely and chronically ill persons, especially those with cardio-respiratory diseases, are considered more sensitive to air pollution than others. Sensitive receptors within the project vicinity include multi-family residential land uses and schools located along the route.
Proposed construction activity would occur within 25 meters of these sensitive land uses. As such, the evaluation of localized impacts during construction activity will focus on these land uses.
22 South Coast Air Quality Management District. n.d. Agency web site. Available:
<ftp://ftp.aqmd/pub/metdatadla.exe>. Accessed: December 1, 2008. 23 South Coast Air Quality Management District. n.d. MATES III Carcinogenic Risk Interactive
Map. Available: <http://www2.aqmd.gov/webappl/matesiii/>. Accessed: July 25, 2008.

Los Angeles County Metropolitan Transportation Authority Section 4.2 Air Quality Federal Transit Administration
Wilshire Bus Rapid Transit Project 4.2-15 June 2010
Table 4.2-3. Air Quality Data from Los Angeles – North Main Street Station (ARB 70087) and West Los Angeles - VA Hospital Station (ARB 70091)
Pollutant Standards 2006 2007 2008
Ozone (O3)
State standard (1-hour average = 0.09 ppm)
National standard (8-hour average = 0.075 ppm)
Maximum concentration 1-hour period (ppm) 0.108/0.099 0.115/0.117 0.109/0.111
Maximum concentration 8-hour period (ppm) 0.079/0.074 0.102/0.088 0.090/0.097
Days state 1-hour standard exceeded 8/3 3/2 3/3
Days state 8-hour standard exceeded 7/2 6/2 6/2
Suspended Particulates (PM10)
State standard (24-hour average = 50 μg/m3)
National standard (24-hour average = 150 μg/m3)
Maximum state 24-hour concentration 58.0/NA 77.0/NA 64.0/NA
Maximum national 24-hour concentration 59.0/NA 78.0/NA 66.0/NA
Days exceeding state standard 3/NA 5/NA 2/NA
Days exceeding national standard 0/NA 0/NA 0/NA
Suspended Particulates (PM2.5)
National standard (24-hour average = 35 μg/m3)
Maximum 24-hour concentration 56.2/NA 64.1/NA 78.3/NA
Days exceeding national standarda 11/NA 20/NA 10/NA
Notes: aNumber of exceedances based on NAAQS applicable during period shown (65 μg/m3). Standard was changed to 35 μg/m3 in November 2006, to be applied to 2007. Numbers for both stations are given where applicable with the North Main Street Station values first. Ex; (North Main / VA Hospital).
Source: California Air Resources Board, compiled by ICF International, May 2008.
4.2.3 Thresholds of Significance
Based on Appendix G of the State CEQA Guidelines, the proposed project would have a potentially significant effect on air quality if it would:
• conflict with or obstruct implementation of the applicable air quality management plan,
• violate any air quality standard or contribute substantially to an existing or projected air quality violation,
• result in a cumulatively considerable net increase of any criteria pollutant for which the project region is in nonattainment under an applicable federal or state ambient air quality standard (including releasing emissions that exceed quantitative thresholds for ozone precursors),
• expose sensitive receptors to substantial pollutant concentrations,

Los Angeles County Metropolitan Transportation Authority Section 4.2 Air Quality Federal Transit Administration
Wilshire Bus Rapid Transit Project 4.2-16 June 2010
• create objectionable odors affecting a substantial number of people,
• generate greenhouse gas emissions, either directly or indirectly, that may have a significant impact on the environment, or
• conflict with an applicable plan, policy or regulation adopted for the purpose of reducing the emissions of greenhouse gases.
The CEQA Guidelines also state that the significance criteria established by the applicable air quality management district or air pollution control district may be relied upon to make the determinations above.
Based on the SCAQMD’s regulatory role in the Basin, the significance thresholds and analysis methodologies outlined in the SCAQMD CEQA Air Quality Handbook (as updated per their website), Final Localized Significance Threshold Methodology and Final—Methodology to Calculate Particulate Matter (PM) 2.5 and PM 2.5 Significance Thresholds guidance documents were used in evaluating project impacts.
Construction Emissions
According to criteria set forth in the SCAQMD CEQA Air Quality Handbook, Localized Significance Threshold Methodology for CEQA Evaluations, and Particulate Matter (PM) 2.5 Significance Thresholds and Calculation Methodology guidance documents, the project would have a significant impact on construction emissions if any of the following were to occur.
• Regional emissions from both direct and indirect sources exceed any of the following SCAQMD prescribed threshold levels: (1) 75 pounds a day for reactive organic gases (ROG), (2) 100 pounds per day for NOX, (3) 550 pounds per day for CO, (4) 150 pounds per day for PM10 or SOX, and (5) 55 pounds per day for PM2.5.
• Localized emissions from on-site construction equipment and site disturbance activity exceed any of the following SCAQMD-prescribed threshold levels: (1) 74 pounds per day for NOX, (2) 562 pounds per day for CO, (3) 4 pounds per day for PM10, and (4) 2 pounds per day for PM2.5.24
Operational Emissions
According to criteria set forth in the SCAQMD CEQA Air Quality Handbook, the project would have a significant impact with regard to operational emissions if:
• regional emissions from both direct and indirect sources would exceed any of the following SCAQMD prescribed threshold levels: (1) 55 pounds a day for ROG, (2) 55 pounds per day for NOX, (3) 550 pounds per day for
24 Derived from SCAQMD Localized Significance Threshold Tables—SRA 1 (Central Los Angeles
County) and SRA 2 (Northwest Los Angeles County Coastal), 1-acre site, 25-meter receptor distance.
Los Angeles County Metropolitan Transportation Authority Section 4.2 Air Quality Federal Transit Administration
Wilshire Bus Rapid Transit Project 4.2-17 June 2010
CO, (4) 150 pounds per day for PM10 or SOX, and (5) 55 pounds per day for PM2.5 (South Coast Air Quality Management District 1993 and 2006).
• localized emissions from on-site sources exceed any of the following SCAQMD prescribed threshold levels: (1) 74 pounds per day for NOX, (2) 562 pounds per day for CO, (3) 1 pounds per day for PM10, and (4) 1 pounds per day for PM2.5.25
• the project would cause an exceedance of the California 1-hour or 8-hour CO standards of 20 or 9 ppm, respectively, at an intersection or roadway within 0.25 mile of a sensitive receptor.26
Toxic Air Contaminants
According to guidelines provided in the SCAQMD CEQA Air Quality Handbook, the project would have a significant impact from TACs if:
• on-site stationary sources emit carcinogenic or TACs that individually or cumulatively exceed the maximum individual cancer risk of ten in one million (1.0 x 10⁻⁵) or an acute or chronic hazard index of 1.0 (South Coast Air Quality Management District 1998);27
• hazardous materials associated with on-site stationary sources result in an accidental release of air toxic emissions or acutely hazardous materials, posing a threat to public health and safety; or
• the project would be occupied primarily by sensitive individuals within 0.25 mile of any existing facility that emits TACs, which could result in a health risk from pollutants identified in District Rule 1401 (South Coast Air Quality Management District 1993).
Climate Change/Greenhouse Gas Emissions
No federal, State, or regional air quality agency has adopted a methodology or quantitative threshold that can be applied to evaluate the significance of an individual project’s contribution to GHG emissions, such as the quantitative thresholds that exist for criteria pollutants. Rather, the proposed project is evaluated for consistency with the state goal of reducing GHG emissions in California to 1990 levels by 2020, as set forth by the timetable established in AB 32 (California Global Warming Solutions Act of 2006).
25 Derived from SCAQMD Localized Significance Threshold Tables – SRA 1 (Central Los Angeles
County) and SRA 2 (Northwest Los Angeles County Coastal), 1-acre site, 25-meter receptor distance.
26 Where the CO standard is exceeded at the intersection, a project would result in a significant impact if the incremental increase due to the project is equal to or greater than 1.0 ppm for the California 1-hour CO standard or 0.45 ppm for the 8-hour CO standard.
27 SCAQMD Risk Assessment Procedures for Rules 1401 and 212, November 1998.

Los Angeles County Metropolitan Transportation Authority Section 4.2 Air Quality Federal Transit Administration
Wilshire Bus Rapid Transit Project 4.2-18 June 2010
4.2.4 Environmental Impacts
Methodology
Construction
Mass daily combustion emissions, fugitive PM10 and PM2.5, and off-gassing emissions were compiled using URBEMIS 2007, which is an emissions estimation/evaluation model developed by ARB that is based, in part, on SCAQMD CEQA Air Quality Handbook guidelines and methodologies.
The URBEMIS 2007 model separates the construction process into multiple phases that account for everything from structure demolition and site clearing to asphalt paving and the application of architectural coatings. For example, demolition-period emissions would include fugitive dust emissions from jut-out removal, as well as combustion exhaust emissions from on-site construction equipment, haul truck trips, and worker commute trips. Construction and finishing emissions would include combustion exhaust emissions from on-site construction equipment, haul truck trips, and worker commute trips, as well as fugitive off-gassing emissions (i.e., ROG) from the application of architectural coatings and asphalt paving.
Construction equipment, by phase, was estimated based on the proposed scope of work. A complete listing of the construction equipment by phase, construction phase duration assumptions, and changes to modeling default values used in this analysis is included within the URBEMIS 2007 printout sheets that are provided in Appendix C of this EIR.
Operations
The proposed project has the potential to create local operational impacts as a result of local traffic redistribution. With respect to the evaluation of localized impacts, local area CO concentrations for roadways were evaluated using the CALINE-4 line-source dispersion model developed by the California Department of Transportation (Caltrans) combined with EMFAC2007 emission factors. The analysis of roadway CO impacts followed the protocol recommended by Caltrans and published in the document Transportation Project-Level Carbon Monoxide Protocol, December 1997. It is also consistent with procedures identified through the SCAQMD’s CO modeling protocol. All emissions calculation worksheets and air quality modeling output files are provided in Appendix C.
Toxic Air Contaminants Impacts (Construction and Operations)
Potential toxic air contaminant (TAC) impacts are evaluated by conducting a screening-level analysis followed by a more detailed analysis (i.e., dispersion modeling) if necessary. The screening-level analysis consists of reviewing the proposed project’s description and site plan to identify any new or modified TAC emissions sources. If it is determined that the proposed project would introduce a new source, or modify an existing TAC emissions source, then

Los Angeles County Metropolitan Transportation Authority Section 4.2 Air Quality Federal Transit Administration
Wilshire Bus Rapid Transit Project 4.2-19 June 2010
downwind sensitive-receptor locations are identified, and site-specific dispersion modeling is conducted to determine proposed project impacts.
Climate Change/Greenhouse Gas Emissions
Project-related GHG emissions were estimated using the following methodology: 1) the URBEMIS 2007 software was utilized to calculate project-related CO2 emissions, and 2) methane (CH4) and N2O emissions were compiled using the calculation formulas provided in the California Climate Action Registry, General Reporting Protocol, Reporting Entity-Wide Greenhouse Gas Emissions, version 3.0.
Impact AQ1: Conflict with or obstruct implementation of the applicable air quality management plan.
The proposed project would be consistent with the projections in the AQMP, resulting in a less-than-significant impact. SCAQMD is required, pursuant to the CAA, to reduce emissions of criteria pollutants for which the Basin is in non-attainment (i.e., O3, PM10, and PM2.5). The proposed project would be subject to SCAQMD’s AQMP. The AQMP contains a comprehensive list of pollution control strategies directed at reducing emissions and achieving ambient air quality standards. These strategies are developed, in part, based on regional population, housing, and employment projections prepared by SCAG. The proposed project would be consistent with all local general plans and compatible with the surrounding uses. Because the proposed project would be consistent with the local general plan, pursuant to SCAQMD guidelines, the proposed project would be considered consistent with the region’s AQMP. As such, project-related emissions are accounted for in the AQMP, which is crafted to bring the Basin into attainment for all criteria pollutants. Accordingly, the proposed project would be consistent with the projections in the AQMP, thereby resulting in a less-than-significant impact.
The SCAQMD is required, pursuant to the Clean Air Act, to reduce emissions of criteria pollutants for which the Basin is in non-attainment (i.e., O3, PM10, and PM2.5). The project would be subject to the SCAQMD’s AQMP. The AQMP contains a comprehensive list of pollution control strategies directed at reducing emissions and achieving ambient air quality standards. These strategies are developed, in part, based on regional population, housing, and employment projections prepared by SCAG.

Los Angeles County Metropolitan Transportation Authority Section 4.2 Air Quality Federal Transit Administration
Wilshire Bus Rapid Transit Project 4.2-20 June 2010
Impact AQ2: Violate any air quality standard or contribute substantially to an existing or projected air quality violation.
Criteria pollutant emissions for both construction and operation of the proposed project would result in a less-than-significant regional air quality impact.
Construction Impacts
Construction of the proposed project has the potential to create air quality impacts through the use of heavy-duty construction equipment and through vehicle trips generated from construction workers traveling to and from the project site. In addition, fugitive dust emissions would result from demolition and construction activities. Mobile-source emissions, primarily NOX, would result from the use of construction equipment.
Construction emissions can vary substantially from day to day, depending on the level of activity, the specific type of operation, and, for dust, the prevailing weather conditions. The assessment of construction air quality impacts considers each of these potential sources. The equipment mix and duration for each construction stage is detailed in the URBEMIS 2007 printout sheets provided in Appendix C.
To present a conservative worst-case impact analysis, it was assumed, for modeling purposes, that construction would last approximately 4 months. The total amount of construction, the duration of construction, and the intensity of construction activity could have a substantial effect upon the amount of construction emissions, the concentrations, and the resulting impacts occurring at any one time. As such, the emission forecasts provided herein reflect a specific set of conservative assumptions based on the expected construction scenario wherein a relatively large amount of construction is occurring in a relatively intensive manner. Because of this conservative assumption, actual emissions could be less than those forecasted. If construction is delayed or occurs over a longer time period, emissions could be reduced because of (1) a more modern and cleaner burning construction equipment fleet mix, and/or (2) a less intensive buildout schedule (i.e., fewer daily emissions occurring over a longer time interval).
Table 4.2-4 shows the emissions calculated for the proposed project. As shown therein, criteria pollutant emissions would be less than the applicable SCAQMD significance thresholds, and as such, would result in a less than significant regional air quality impact.
Operations Impacts
Regional air pollutant emissions associated with project operations would be generated by operation of on-road vehicles. Mobile-source emissions are proportional to the vehicle miles traveled, or VMT, which are proportional to new vehicle trips. The proposed project would not generate new trips.

Los Angeles County Metropolitan Transportation Authority Section 4.2 Air Quality Federal Transit Administration
Wilshire Bus Rapid Transit Project 4.2-21 June 2010
Table 4.2-4. Worst-Case Construction Emissions (pounds per day)
Construction Activity ROG NOx CO SOx PM10 PM2.5
Jut-out removal 1.25 8.71 6.10 <0.01 1.39 0.58
Paving and Restriping 3.00 16.47 10.93 <0.01 1.37 1.25
Maximum Daily Emissions 3 16 11 <1 1 1
Regional Significance Threshold 75 100 550 150 150 55
Exceed Threshold? No No No No No No
Notes: Construction emission calculation worksheets and URBEMIS2007 printouts are included in Appendix C.
Source: ICF International, January 2010.
However, it would facilitate the movement of existing traffic through the study corridor, as well as other traffic generated by new development in the area. Consequently, the proposed project may result in local traffic redistribution. These potential impacts are discussed under Impact AQ3, below.
Impact AQ3: Expose sensitive receptors to substantial pollutant concentrations.
The proposed project would result in less than significant impacts in exposing sensitive receptors to substantial pollutant concentrations.
Construction Impacts
Criteria Pollutants In addition to regional emissions, the SCAQMD has developed a set of mass emissions rate look-up tables that can be used to evaluate localized impacts that may result from construction-period emissions. If the on-site emissions from proposed construction activities are below the Localized Significance Threshold (LST) emission levels found in the LST mass rate look-up tables for the project site’s SRA, then project emissions would not have the potential to cause a significant localized air quality impact.
When quantifying mass emissions for LST analysis, only emissions that occur on site are considered. Consistent with SCAQMD LST guidelines, emissions related to offsite delivery/haul truck activity and employee trips are not considered in the evaluation of localized impacts. A conservative estimate of the project’s construction-period on-site mass emissions is presented in Table 4.2-5. As shown therein, the worst-case maximum emissions for all criteria pollutants would remain below their respective SCAQMD LST significance thresholds. As such, localized impacts that may result from construction-period air pollutant emissions would be less than significant.

Los Angeles County Metropolitan Transportation Authority Section 4.2 Air Quality Federal Transit Administration
Wilshire Bus Rapid Transit Project 4.2-22 June 2010
Table 4.2-5. Worst-Case Localized Construction Emissions (pounds per day)
Construction Activity NOx CO PM10a PM2.5a
Jut-out removal 7.68 4.68 1.34 0.70
Paving and Restriping 14.87 8.27 1.28 1.18
Localized Significance Thresholdsb 74 562 4 2
Exceed Threshold No No No No
Notes: Construction emission calculation worksheets are included in the URBEMIS2007 printouts. aPM10 emissions estimates are based on compliance with SCAQMD Rule 403 requirements for fugitive dust suppression, which require that no visible dust be present beyond the site boundaries. bThe project site is located in SCAQMD SRA No. 1/2. These LSTs are based on the site location SRA, distance to nearest sensitive receptor location from the project site (25 meters), and project area that could be under construction on any given day (1 acre).
Source: ICF International, January 2010.
Toxic Air Contaminants The greatest potential for TAC emissions would be related to diesel particulate emissions associated with heavy equipment operations during site grading activities. The SCAQMD does not consider diesel-related cancer risks from construction equipment to be an issue due to the short-term nature of construction activities. Construction activities associated with the proposed project would be sporadic, transitory, and short term in nature. The assessment of cancer risk is typically based on a 70-year exposure period. Because exposure to diesel exhaust would be well below the 70-year exposure period, construction of the proposed project is not anticipated to result in an elevated cancer risk to exposed persons due to the short-term nature of construction. As such, project-related toxic emission impacts during construction would not be significant under the proposed project.
Operational Impacts
Criteria Pollutants Within an urban setting, vehicle exhaust is the primary source of CO. Consequently, the highest CO concentrations are generally found close to congested intersections. Under typical meteorological conditions, CO concentrations tend to decrease as the distance from the emissions source (i.e., congested intersection) increases. For purposes of providing a conservative worst-case impact analysis, CO concentrations are typically analyzed at congested intersection locations. If impacts are less than significant close to congested intersections, impacts will also be less than significant at more distant sensitive-receptor locations.
Project traffic during the operational phase of the project would have the potential to create local area CO impacts. To ascertain the proposed project’s potential to generate localized air quality impacts, the Wilshire Bus Rapid Transit Project Traffic Impact Analysis (Iteris, December 2009) was reviewed to determine the potential for the creation of localized carbon monoxide (CO) hot spots at congested intersection locations. The SCAQMD recommends a
Los Angeles County Metropolitan Transportation Authority Section 4.2 Air Quality Federal Transit Administration
Wilshire Bus Rapid Transit Project 4.2-23 June 2010
hot spot evaluation of potential localized CO impacts when vehicle to capacity (V/C) ratios are increased by two percent or more at intersections with a level of service (LOS) of C or worse. The traffic impact analysis identified 74 key intersection locations along routes that accommodate much of the traffic traveling within the project area. Of the 74 key intersection locations, the traffic analysis concluded that for the year 2012, 38 intersections could potentially create a localized CO hot spot with the proposed project and 36 intersections could potentially create a localized CO hot spot with the project alternative. For the year 2020, it was concluded that 43 intersections could potentially create a localized CO hot spot with the proposed project and 37 intersections could potentially create a localized CO hot spot with the project alternative.28
Local area CO concentrations were projected using the CALINE 4 traffic pollutant dispersion model. The analysis of CO impacts followed the protocol recommended by the California Department of Transportation, published as Transportation Project-Level Carbon Monoxide Protocol, December 1997. It is also consistent with procedures identified through the SCAQMD’s CO modeling protocol, with all four corners of each intersection analyzed to determine whether project development would result in a CO concentration that exceeds federal or state CO standards.
The project’s CO contributions to AM and PM 1- and 8-hour CO levels for project buildout year 2012 and horizon year 2020 are presented in Tables 4.2-6 and 4.2-7, respectively. As shown therein, the proposed project would not have a significant impact on 1-hour or 8-hour local CO concentrations due to mobile source emissions.
Because significant impacts would not occur at the intersections adjacent to sensitive receptors with the highest traffic volumes under the proposed project, no significant impacts are anticipated to occur at any other locations in the study area because the conditions yielding CO hotspots would not be worse than those occurring at the analyzed intersections. Consequently, the sensitive receptors that are included in this analysis would not be significantly affected by CO emissions generated by the net increase in traffic that would occur under the proposed project. Because the proposed project would cause an exceedance or exacerbate an existing exceedance of an AAQS, localized operational air quality impacts would be less than significant. No mitigation measures are necessary.
28 Based on SCAQMD-recommended screening criteria, any intersection that would 1) operate at LOS
C or worse and 2) experience an increase in the peak-hour volume-to-capacity ratio of 2% or more as a result of project-related traffic should be evaluated for the potential to create a localized CO hot spot.

Los Angeles County Metropolitan Transportation Authority Section 4.2 Air Quality Federal Transit Administration
Wilshire Bus Rapid Transit Project 4.2-24 June 2010
Table 4.2-6. Project Buildout (Year 2012)—Local Area Carbon Monoxide Dispersion Analysis
Intersection Peak
Perioda
Maximum 1-Hour
2012 Base Concentration
(ppm)b
Maximum 1-Hour
2012 w/ Project Concentration
(ppm)c
Significant 1-Hour
Concentration Impact?d
Maximum 8-Hour
2012 Base Concentration
(ppm)e
Maximum 8-Hour
2012 w/ Project Concentration
(ppm)f
Significant 8-Hour
Concentration Impact?d
Alvarado @ 6th AM 7.3 7.5 No 4.8 5.0 No
PM 7.5 7.3 No 5.0 4.8 No
Alvarado @ Olympic AM 7.6 7.7 No 5.0 5.1 No
PM 7.9 8.0 No 5.3 5.3 No
Barrington @ Wilshire AM 7.2 7.1 No 4.8 4.7 No
PM 7.1 7.0 No 4.7 4.6 No
Beverly Glen @ Olympic AM 8.7 8.7 No 5.8 5.8 No
PM 8.6 8.7 No 5.7 5.8 No
Beverly Glen @ Santa Monica
AM 8.2 8.4 No 5.5 5.6 No
PM 8.3 8.7 No 5.5 5.8 No
Bundy @ Olympic AM 8.7 8.8 No 5.8 5.9 No
PM 8.5 8.6 No 5.7 5.7 No
Bundy @ Wilshire AM 7.3 7.3 No 4.8 4.8 No
PM 7.5 7.5 No 5.0 5.0 No
Crenshaw @ Olympic AM 8.5 8.6 No 5.7 5.7 No
PM 8.3 8.3 No 5.5 5.5 No
Crenshaw @ Wilshire AM 7.4 7.2 No 4.9 4.8 No
PM 7.4 7.4 No 4.9 4.9 No
Fairfax @ 3rd AM 7.9 7.9 No 5.3 5.3 No
PM 7.8 7.7 No 5.2 5.1 No
Fairfax @ Olympic AM 7.9 8.0 No 5.3 5.3 No
PM 7.9 7.9 No 5.3 5.3 No
Fairfax @ San Vicente AM 7.7 7.8 No 5.1 5.2 No
PM 7.3 7.4 No 4.8 4.9 No
Fairfax @ Wilshire AM 8.2 8.0 No 5.5 5.3 No
PM 8.2 8.4 No 5.5 5.6 No
Federal @ Santa Monica AM 6.5 6.6 No 4.3 4.3 No
PM 6.4 6.4 No 4.2 4.2 No
Highland @ 3rd AM 7.8 7.9 No 5.2 5.3 No
PM 7.6 7.6 No 5.0 5.0 No
Highland @ Olympic AM 7.5 7.5 No 5.0 5.0 No
PM 7.6 7.6 No 5.0 5.0 No
Highland @ Wilshire AM 7.9 7.7 No 5.3 5.1 No
PM 7.8 7.6 No 5.2 5.0 No
I-405 SB Ramps @ Santa Monica
AM 7.4 7.4 No 4.9 4.9 No
PM 7.4 7.4 No 4.9 4.9 No
La Brea @ 3rd AM 8.3 8.3 No 5.5 5.5 No
PM 7.8 7.8 No 5.2 5.2 No
La Brea @ Olympic AM 8.4 8.4 No 5.6 5.6 No
PM 8.6 8.6 No 5.7 5.7 No
La Brea @ Wilshire AM 7.8 7.6 No 5.2 5.0 No
PM 8.3 8.1 No 5.5 5.4 No

Los Angeles County Metropolitan Transportation Authority Section 4.2 Air Quality Federal Transit Administration
Wilshire Bus Rapid Transit Project 4.2-25 June 2010
Table 4.2-6. Project Buildout (Year 2012)—Local Area Carbon Monoxide Dispersion Analysis (Continued)
Intersection Peak
Perioda
Maximum 1-Hour
2012 Base Concentration
(ppm)b
Maximum 1-Hour
2012 w/ Project Concentration
(ppm)c
Significant 1-Hour
Concentration Impact?d
Maximum 8-Hour
2012 Base Concentration
(ppm)e
Maximum 8-Hour
2012 w/ Project Concentration
(ppm)f
Significant 8-Hour
Concentration Impact?d
Overland @ Olympic AM 7.9 7.9 No 5.3 5.3 No
PM 8.4 8.6 No 5.6 5.7 No
Overland @ Pico AM 8.7 8.6 No 5.8 5.7 No
PM 8.8 8.8 No 5.9 5.9 No
Overland @ Santa Monica AM 7.3 7.4 No 4.8 4.9 No
PM 7.4 7.4 No 4.9 4.9 No
San Vicente @ Olympic AM 8.4 8.4 No 5.6 5.6 No
PM 7.9 7.9 No 5.3 5.3 No
San Vicente @ Wilshire AM 8.4 8.3 No 5.6 5.5 No
PM 8.8 8.7 No 5.9 5.8 No
Sepulveda @ Pico AM 8.2 8.3 No 5.5 5.5 No
PM 8.2 8.2 No 5.5 5.5 No
Vermont @ 8th AM 7.2 7.2 No 4.8 4.8 No
PM 7.8 7.8 No 5.2 5.2 No
Vermont @ Olympic AM 8.1 8.1 No 5.4 5.4 No
PM 8.4 8.4 No 5.6 5.6 No
Veteran @ Santa Monica AM 7.3 7.3 No 4.8 4.8 No
PM 7.4 7.4 No 4.9 4.9 No
Veteran @ Sunset AM 7.5 7.6 No 5.0 5.0 No
PM 7.1 7.1 No 4.7 4.7 No
Veteran @ Wilshire AM 10.0 9.6 No 6.7 6.4 No
PM 9.0 8.7 No 6.0 5.8 No
W Century Park @ Olympic
AM 8.5 8.5 No 5.7 5.7 No
PM 7.7 7.8 No 5.1 5.2 No
Western @ 3rd AM 7.6 7.7 No 5.0 5.1 No
PM 7.7 7.7 No 5.1 5.1 No
Western @ Olympic AM 8.0 8.1 No 5.3 5.4 No
PM 8.1 8.2 No 5.4 5.5 No
Westwood @ Olympic AM 8.1 8.1 No 5.4 5.4 No
PM 9.3 9.3 No 6.2 6.2 No
Westwood @ Pico AM 7.7 7.7 No 5.1 5.1 No
PM 8.2 8.3 No 5.5 5.5 No
Westwood @ Santa Monica
AM 8.2 8.2 No 5.5 5.5 No
PM 8.5 8.6 No 5.7 5.7 No Notes: CALINE4 dispersion model output sheets and Emfac2007 emission factors are provided in Appendix C. ppm = parts per million aPeak-hour traffic volumes are based on the Wilshire Boulevard Bus Rapid Transit Project Traffic Impact Analysis prepared for the project by Iteris, 2009. bSCAQMD 2012 1-hour ambient background concentration (4.4 ppm) + 2012 base traffic CO 1-hour contribution. cSCAQMD 2012 1-hour ambient background concentration (4.4 ppm) + 2012 with-project traffic CO 1-hour contribution. dThe state standard for the 1-hour average CO concentration is 20 ppm, and the 8-hour average concentration is 9.0 ppm. eSCAQMD 2012 8-hour ambient background concentration (2.8 ppm) + 2012 base traffic CO 8-hour contribution. fSCAQMD 2012 8-hour ambient background concentration (2.8 ppm) + 2012 with-project traffic CO 8-hour contribution. Source: ICF International, January 2010.

Los Angeles County Metropolitan Transportation Authority Section 4.2 Air Quality Federal Transit Administration
Wilshire Bus Rapid Transit Project 4.2-26 June 2010
Table 4.2-7. Project Horizon (Year 2020)—Local Area Carbon Monoxide Dispersion Analysis
Intersection Peak
Perioda
Maximum 1-Hour 2020
Base Concentration
(ppm)b
Maximum 1-Hour 2020
w/ Project Concentration
(ppm)c
Significant 1-Hour
Concentration Impact?d
Maximum 8-Hour 2020
Base Concentration
(ppm)e
Maximum 8-Hour 2020
w/ Project Concentration
(ppm)f
Significant 8-Hour
Concentration Impact?d
Alvarado @ 6th AM 6.0 6.1 No 3.9 4.0 No
PM 6.1 6.1 No 4.0 4.0 No
Alvarado @ Olympic AM 6.2 6.1 No 4.1 4.0 No
PM 6.3 6.3 No 4.1 4.1 No
Barrington @ Olympic AM 6.4 6.4 No 4.2 4.2 No
PM 6.6 6.6 No 4.3 4.3 No
Barrington @ Wilshire AM 5.9 5.9 No 3.9 3.9 No
PM 5.9 5.8 No 3.9 3.8 No
Beverly Glen @ Olympic AM 6.7 6.7 No 4.4 4.4 No
PM 6.7 6.7 No 4.4 4.4 No
Beverly Glen @ Santa Monica
AM 6.5 6.5 No 4.3 4.3 No
PM 6.5 6.5 No 4.3 4.3 No
Bundy @ Wilshire AM 6.0 5.9 No 3.9 3.9 No
PM 6.0 6.0 No 3.9 3.9 No
Crenshaw @ Olympic AM 6.6 6.6 No 4.3 4.3 No
PM 6.5 6.5 No 4.3 4.3 No
Crenshaw @ Wilshire AM 5.9 6.0 No 3.9 3.9 No
PM 6.1 6.0 No 4.0 3.9 No
E Century Park @ Olympic
AM 6.8 6.9 No 4.5 4.6 No
PM 6.6 6.6 No 4.3 4.3 No
Fairfax @ 3rd AM 6.2 6.2 No 4.1 4.1 No
PM 6.2 6.2 No 4.1 4.1 No
Fairfax @ Olympic AM 6.9 6.3 No 4.6 4.1 No
PM 6.3 6.3 No 4.1 4.1 No
Fairfax @ San Vicente AM 6.2 6.3 No 4.1 4.1 No
PM 5.9 6.0 No 3.9 3.9 No
Fairfax @ Wilshire AM 6.4 6.3 No 4.2 4.1 No
PM 6.6 6.5 No 4.3 4.3 No
Highland @ 3rd AM 6.2 6.2 No 4.1 4.1 No
PM 6.1 6.1 No 4.0 4.0 No
Highland @ 6th AM 5.8 6.0 No 3.8 3.9 No
PM 6.1 6.1 No 4.0 4.0 No
Highland @ Olympic AM 6.1 6.0 No 4.0 3.9 No
PM 6.1 6.1 No 4.0 4.0 No
Highland @ Wilshire AM 6.3 6.1 No 4.1 4.0 No
PM 6.2 6.2 No 4.1 4.1 No
La Brea @ 3rd AM 6.5 6.5 No 4.3 4.3 No
PM 6.3 6.3 No 4.1 4.1 No
La Brea @ Olympic AM 6.5 6.6 No 4.3 4.3 No
PM 6.7 6.6 No 4.4 4.3 No
La Brea @ Wilshire AM 6.5 6.4 No 4.3 4.2 No
PM 6.5 6.4 No 4.3 4.2 No

Los Angeles County Metropolitan Transportation Authority Section 4.2 Air Quality Federal Transit Administration
Wilshire Bus Rapid Transit Project 4.2-27 June 2010
Table 4.2-7. Project Horizon (Year 2020)—Local Area Carbon Monoxide Dispersion Analysis (Continued)
Intersection Peak
Perioda
Maximum 1-Hour 2020
Base Concentration
(ppm)b
Maximum 1-Hour 2020
w/ Project Concentration
(ppm)c
Significant 1-Hour
Concentration Impact?d
Maximum 8-Hour 2020
Base Concentration
(ppm)e
Maximum 8-Hour 2020
w/ Project Concentration
(ppm)f
Significant 8-Hour
Concentration Impact?d
Overland @ Olympic AM 6.3 6.3 No 4.1 4.1 No
PM 6.6 6.6 No 4.3 4.3 No
Overland @ Pico AM 6.7 6.7 No 4.4 4.4 No
PM 6.7 6.7 No 4.4 4.4 No
Overland @ Santa Monica AM 6.0 6.0 No 3.9 3.9 No
PM 6.0 6.0 No 3.9 3.9 No
S. Beverly Glen @ Sunset AM 5.9 5.9 No 3.9 3.9 No
PM 5.9 5.9 No 3.9 3.9 No
San Vicente @ Olympic AM 6.5 6.5 No 4.3 4.3 No
PM 6.3 6.3 No 4.1 4.1 No
San Vicente @ Wilshire AM 6.6 6.5 No 4.3 4.3 No
PM 6.7 6.5 No 4.4 4.3 No
Sepulveda @ Olympic AM 6.4 6.5 No 4.2 4.3 No
PM 6.8 6.8 No 4.5 4.5 No
Sepulveda @ Pico AM 6.4 6.5 No 4.2 4.3 No
PM 6.4 6.4 No 4.2 4.2 No
Vermont @ 6th AM 6.3 6.2 No 4.1 4.1 No
PM 6.5 6.5 No 4.3 4.3 No
Vermont @ 8th AM 5.9 5.9 No 3.9 3.9 No
PM 6.2 6.2 No 4.1 4.1 No
Vermont @ Olympic AM 6.4 6.4 No 4.2 4.2 No
PM 6.5 6.5 No 4.3 4.3 No
Veteran @ Olympic AM 6.1 6.1 No 4.0 4.0 No
PM 6.4 6.4 No 4.2 4.2 No
Veteran @ Santa Monica AM 5.9 6.0 No 3.9 3.9 No
PM 6.0 6.0 No 3.9 3.9 No
Veteran @ Sunset AM 6.1 6.1 No 4.0 4.0 No
PM 5.9 5.9 No 3.9 3.9 No
Veteran @ Wilshire AM 7.4 7.2 No 4.9 4.8 No
PM 6.9 6.8 No 4.6 4.5 No
W Century Park @ Olympic
AM 6.6 6.6 No 4.3 4.3 No
PM 6.2 6.2 No 4.1 4.1 No
Western @ 3rd AM 6.1 6.1 No 4.0 4.0 No
PM 6.1 6.2 No 4.0 4.1 No
Western @ 6th AM 5.9 6.0 No 3.9 3.9 No
PM 6.1 6.1 No 4.0 4.0 No
Western @ Olympic AM 6.3 6.4 No 4.1 4.2 No
PM 6.4 6.4 No 4.2 4.2 No
Westwood @ Olympic AM 6.4 6.5 No 4.2 4.3 No
PM 7.0 7.0 No 4.6 4.6 No
Westwood @ Pico AM 6.2 6.2 No 4.1 4.1 No
PM 6.5 6.5 No 4.3 4.3 No

Los Angeles County Metropolitan Transportation Authority Section 4.2 Air Quality Federal Transit Administration
Wilshire Bus Rapid Transit Project 4.2-28 June 2010
Table 4.2-7. Project Horizon (Year 2020)—Local Area Carbon Monoxide Dispersion Analysis (Continued)
Intersection Peak
Perioda
Maximum 1-Hour 2020
Base Concentration
(ppm)b
Maximum 1-Hour 2020
w/ Project Concentration
(ppm)c
Significant 1-Hour
Concentration Impact?d
Maximum 8-Hour 2020
Base Concentration
(ppm)e
Maximum 8-Hour 2020
w/ Project Concentration
(ppm)f
Significant 8-Hour
Concentration Impact?d
Westwood @ Santa Monica
AM 6.4 6.5 No 4.2 4.3 No
PM 6.5 6.6 No 4.3 4.3 No
Notes: CALINE4 dispersion model output sheets and Emfac2007 emission factors are provided in Appendix C. ppm = parts per million aPeak hour traffic volumes are based on the Wilshire Boulevard Bus Rapid Transit Project Traffic Impact Analysis prepared for the project by Iteris, 2009.. bSCAQMD 2020 1-hour ambient background concentration (4.4 ppm) + 2020 base traffic CO 1-hour contribution. cSCAQMD 2020 1-hour ambient background concentration (4.4 ppm) + 2020 with-project traffic CO 1-hour contribution. dThe State standard for the 1-hour average CO concentration is 20 ppm, and the 8-hour average concentration is 9.0 ppm. eSCAQMD 2020 8-hour ambient background concentration (2.8 ppm) + 2020 base traffic CO 8-hour contribution. fSCAQMD 2020 8-hour ambient background concentration (2.8 ppm) + 2020 with-project traffic CO 8-hour contribution. Source: ICF International, January 2010.
Toxic Air Contaminants Regarding potential TAC emissions associated with the buildout and long-term operation of the proposed project, SCAQMD recommends that a health risk assessment (HRA) be conducted for projects that emit substantial diesel particulate emissions (e.g., truck stops and warehouse distribution facilities) or certain industrial projects that result in the emitting of acute and/or chronically hazardous TAC pollutants. Since the proposed project would operate CNG buses rather than diesel buses and would not result in the emission of acute and/or chronically hazardous TAC pollutants, an air toxics HRA is not warranted. Potential project-generated air toxic impacts on surrounding land uses would be less than significant. No mitigation measures are necessary.
Impact AQ4: Create objectionable odors affecting a substantial number of people.
The proposed project would result in less than significant odor impacts.
According to the SCAQMD CEQA Air Quality Handbook (South Coast Air Quality Management District 1993), land uses associated with odor complaints typically include agricultural uses, wastewater treatment plants, food processing plants, chemical plants, composting, refineries, landfills, dairies, and fiberglass molding. The proposed project not would include any uses identified by the SCAQMD as being associated with odors and therefore would not produce objectionable odors. As such, potential impacts would be less than significant with respect to objectionable odors.
Potential sources that may emit odors during construction activities include asphalt paving. SCAQMD Rule 1108 limits the amount of volatile organic compounds from cutback asphalt. Via mandatory compliance with SCAQMD

Los Angeles County Metropolitan Transportation Authority Section 4.2 Air Quality Federal Transit Administration
Wilshire Bus Rapid Transit Project 4.2-29 June 2010
Rules, no construction activities or materials are proposed which would create a significant level of objectionable odors. As such, potential impacts during construction would be less than significant.
Impact AQ5: Generate greenhouse gas emissions, either directly or indirectly, that may have a significant impact on the environment.
The proposed project would result in less than significant greenhouse gas emissions impacts. Global climate change is caused by combined worldwide greenhouse gas emissions, and mitigating global climate change will require worldwide solutions. GHGs play a critical role in the Earth’s radiation budget by trapping infrared radiation emitted from the Earth’s surface, which could have otherwise escaped to space. Prominent GHGs contributing to this process include water vapor, CO2, N2O, CH4, O3, and certain hydro- and fluorocarbons. This phenomenon, known as the “greenhouse effect”, keeps the Earth’s atmosphere near the surface warmer than it would be otherwise and allows for successful habitation by humans and other forms of life. Increases in these gases lead to more absorption of radiation and warm the lower atmosphere further, thereby increasing evaporation rates and temperatures near the surface. Emissions of GHGs in excess of natural ambient concentrations are thought to be responsible for the enhancement of the greenhouse effect and to contribute to what is termed “global warming,” a trend of unnatural warming of the Earth’s natural climate. Climate change is a global problem, and GHGs are global pollutants, unlike criteria air pollutants (such as O3 precursors) and TACs, which are pollutants of regional and local concern. The California Department of Transportation (Caltrans) and its parent agency, the Business, Transportation, and Housing Agency, have taken an active role in addressing GHG emissions reduction and climate change. Recognizing that 98% of California’s GHG emissions are from the burning of fossil fuels and 40% of all human-made GHG emissions are from transportation, Caltrans has created and is implementing the Climate Action Program at Caltrans (December 2006).
Caltrans’ primary strategy for reducing state GHG emissions is to make the state’s transportation system more efficient. The highest levels of CO2 from mobile sources, such as automobiles, occur at stop-and-go speeds (0–25 mph and speeds over 55 mph. Relieving congestion by enhancing operations and improving travel times in high-congestion travel corridors will lead to an overall reduction in GHG emissions. Because the objective of the proposed project is to reduce congestion and improve operational efficiency within the immediate project vicinity, GHG emissions after completion of the proposed project would be reduced when compared to existing conditions.
During construction, existing ARB regulations (Title 13 of the California Code of Regulations, Sections 2480 and 2485), which limit idling time for

Los Angeles County Metropolitan Transportation Authority Section 4.2 Air Quality Federal Transit Administration
Wilshire Bus Rapid Transit Project 4.2-30 June 2010
diesel-fueled commercial motor vehicles, would help to limit GHG emissions associated with project-related construction vehicles. Table 4.2-8 presents an estimate of project-related GHG emissions of CO2e. As shown therein, the proposed project’s contribution to GHG emissions during short-term construction activities is estimated to be 62 metric tons. In an effort to put this number into perspective, statewide CO2e emissions for 2006 were estimated to be 479.8 million metric tons. As such, the relative amounts of GHG emissions associated with this project are negligible. The amount of emissions from the proposed project, without considering other cumulative global emissions, would not be enough to cause substantial climate change directly. Thus, project emissions, in isolation, are considered less than significant. However, climate change is a global cumulative impact, and the proper context for analysis of this issue is not a project’s emissions in isolation but, rather, its contribution to cumulative GHG emissions.
Table 4.2-8. Estimate of Project-Related Greenhouse Gas Emissions (tons per year) a
CO2e
California State-wide Average Daily Emissions (year 2006) 479,800,000
Project Emissions
Construction-period Emissions (2010) 61.93
SCAQMD Daily Significance Threshold N/A
Exceed Significance Threshold? N/A
Notes: a URBEMIS 2007 output and energy emissions calculation worksheets are provided in the Air Quality Appendix.
Source: ICF Jones & Stokes, August 2008.
Because quantitative GHG guidelines, including relevant thresholds, have not been developed by the SCAQMD, these emissions are provided for informational purposes only. According to a recent white paper by the Association of Environmental Professionals, “an individual project does not generate enough GHG emissions to significantly influence global climate change. Global climate change is a cumulative impact; a project participates in this potential impact through its incremental contribution combined with the cumulative increase of all other sources of GHG emissions.” Project-related impacts are expected to be less than significant because climate change would not occur directly from project emissions. Nevertheless, mitigation measures to reduce project-related GHG emissions by the greatest extent feasible are prescribed below.
4.2.5 Mitigation Measures
Mitigation measures to reduce project-related GHG emissions by the greatest extent feasible are prescribed below.

Los Angeles County Metropolitan Transportation Authority Section 4.2 Air Quality Federal Transit Administration
Wilshire Bus Rapid Transit Project 4.2-31 June 2010
AQ-1 To the extent applicable and practicable, minimize, reuse, and recycle construction-related waste.
AQ-2 To the extent applicable and practicable, minimize grading, earth-moving, and other energy-intensive construction practices.
AQ-3 To the extent applicable and practicable, replacement trees or landscaping shall be provided.
AQ-4 To the extent applicable and practicable, use solar power or electricity from power poles rather than temporary diesel power generators.
4.2.6 Level of Significance After Mitigation
As described above, the proposed project would reduce GHG emissions, compared with existing conditions, by improving traffic circulation and relieving local congestion. Implementation of prescribed mitigation measures during construction would further reduce the proposed project’s GHG emissions. As such, the proposed project would not conflict with the state’s goal of reducing GHG emissions to 1990 levels by 2020. Project impacts relative to GHG emissions and climate change would be less than significant.
Under the proposed project, all impacts, including those related to criteria pollutants, TACs, and potential odor emissions, would be less than significant.

This page left intentionally blank.