4.14 ECOLOGY 4.14.1 F LORA - European Investment … · Agave sisaliana Agavaceae Fiber, hedge,...
62
ESIA: Greenfield Derba Cement Project: DMC, Ethiopia 07150 4.51 4.14 ECOLOGY 4.14.1 FLORA A reconnaissance survey and detailed data collection of the vegetation composition, abundance, cover, physionomy and other relevant ecological information of the core and buffer area was conducted at different locations in August 2007. The study has been carried out by experts from the University of Addis Ababa. The following activities were conducted during the field investigation: 1. Extensive survey and sampling of the vegetation 2. Formal and informal discussions with the local communities living in and around the project area 3. Review of published literature and other relevant documents. Transects were laid across the valley and twenty three plots representing the core and buffer zones were established to collect base line vegetation data. In each plot, the plant species encountered and percent cover of each species were recorded. Exotic plant species found in the area were also recorded. Cultivated plants on the field and those cultivated at other times were recorded with the help of informants. A total of 241 plant species in 79 families were encountered. These were compared with the IUCN database for endemism and threat status. GPS coordinates of each plot together with altitude were also recorded. Contour Map of the area was obtained and both the GPS coordinates and the map were projected to UTM Adindan 37N. 4.14.1.1 Landscape Description The landscape and associated vegetation of the core (plant and quarry sites) and the buffer areas can be classified into the following: 1. Highland plateau 2. Valleys dissecting the plateaus 3. River and Stream tributaries of River Muger 4.14.1.2 Highland Plateau The plateau, which is found in the range between 2300-2450 m above MSL is composed of rolling landscape covering both the core and buffer impact zones. This altitudinal range is favorable for highland mixed cereal-livestock agriculture and supports a high population density. The farmlands are adjacent to each other and there is very little open land. There are grazing areas dotted among the farmlands. The dominant crops such as barley, beans, peas, wheat, and nigerseed are cultivated on the plateau and cattle, sheep, goats and equines are the common livestock component. The crops that are cultivated both in the highlands and the lowlands are presented in Table 4.22.
Transcript of 4.14 ECOLOGY 4.14.1 F LORA - European Investment … · Agave sisaliana Agavaceae Fiber, hedge,...
ESIA: Greenfield Derba Cement Project: DMC, Ethiopia
07150 4.51
4.14 ECOLOGY
4.14.1 FLORA
A reconnaissance survey and detailed data collection of the vegetation composition, abundance, cover, physionomy and other relevant ecological information of the core and buffer area was conducted at different locations in August 2007. The study has been carried out by experts from the University of Addis Ababa.
The following activities were conducted during the field investigation:
1. Extensive survey and sampling of the vegetation 2. Formal and informal discussions with the local communities living in and around
the project area 3. Review of published literature and other relevant documents.
Transects were laid across the valley and twenty three plots representing the core and buffer zones were established to collect base line vegetation data. In each plot, the plant species encountered and percent cover of each species were recorded. Exotic plant species found in the area were also recorded. Cultivated plants on the field and those cultivated at other times were recorded with the help of informants. A total of 241 plant species in 79 families were encountered.
These were compared with the IUCN database for endemism and threat status. GPS coordinates of each plot together with altitude were also recorded. Contour Map of the area was obtained and both the GPS coordinates and the map were projected to UTM Adindan 37N.
4.14.1.1 Landscape Description
The landscape and associated vegetation of the core (plant and quarry sites) and the buffer areas can be classified into the following:
1. Highland plateau
2. Valleys dissecting the plateaus
3. River and Stream tributaries of River Muger
4.14.1.2 Highland Plateau The plateau, which is found in the range between 2300-2450 m above MSL is composed of rolling landscape covering both the core and buffer impact zones. This altitudinal range is favorable for highland mixed cereal-livestock agriculture and supports a high population density. The farmlands are adjacent to each other and there is very little open land. There are grazing areas dotted among the farmlands. The dominant crops such as barley, beans, peas, wheat, and nigerseed are cultivated on the plateau and cattle, sheep, goats and equines are the common livestock component. The crops that are cultivated both in the highlands and the lowlands are presented in Table 4.22.

ESIA: Greenfield Derba Cement Project: DMC, Ethiopia
07150 4.52
Sn Species Family Status 1 Allium sativum Alliaceae Cultivated 2 Allium sepa Alliaceae Cultivated 3 Guizotia abyssinicum Asteraceae Cultivated 4 Cartamus tinctoria Asteraceae Cultivated 5 Helianthus anuus Asteraceae Cultivated 6 Ipomoea batatas Convolvulaceae Cultivated 7 Vicia faba Fabaceae Cultivated 8 Pisum sativum Fabaceae Cultivated 9 Ciser arietimum Fabaceae Cultivated 10 Lens culinaris Fabaceae Cultivated 11 Vicia benghalensis Fabaceae Cultivated 12 Trigonella foenicum-graecum Fabaceae Cultivated 13 Linum urtisssimum Linaceae Cultivated 14 Musa paradisiaca Musaceae Cultivated 15 Sesamum orietale Pedaliaceae Cultivated 16 Hordeum vulgare Poaceae Cultivated 17 Triticum aestivum Poaceae Cultivated 18 Sorghum bicolor Poaceae Cultivated 19 Eragrostis teff Poaceae Cultivated 20 Zea mays Poaceae Cultivated 21 Avena abyssinica Poaceae Cultivated 22 Solaum tuberosum Poaceae Cultivated 23 Lycopersicon esculentum Solanaceae Cultivated
Table 4.22 : Cultivated Species in the Core and Buffer Zones There is no continuous vegetation cover on the plateau except some patches or isolated trees, which are planted for various purposes. The plateau was covered by dry evergreen montane forest before human settlement. The current vegetation in this area is mainly dominated by herbaceous genera including Pennisetum, Sporobolus, Eleusine, Chloris, Aristida, Phalaris, Commelina, Trifolium, Alchemilla and Cyperus. Most of these are
Fig. 4.29 : Barley farm on the plateau with eucalyptus trees in the background

ESIA: Greenfield Derba Cement Project: DMC, Ethiopia
07150 4.53
highly valuable pasture species. Trees species on the plateau are restricted to churchyards and isolated patches around homesteads such as Euphorbia candelabrum, Juniperus procera, Acacia abyssinica, Hagenia abyssinica, Olea europaea ssp. Cuspidata, and Podocarpus falcatus. There are about 12 exotic species including Eucalyptus globulus, E. camaldulensis and Cupressus lusitianica plantation sites in the plateau (Table 4.23). Species Family Use and Status Agave americana Agavaceae Fiber, hedge, cultivated Agave sisaliana Agavaceae Fiber, hedge, cultivated Schinus molle Anacardiaceae Shade, construction Casuarina equisetifolia Casuarinaceae Construction Cupressus lusitianica Cupressaceae Construction Acacia decurrens Fabaceae Nitrogen fixation, construction, fodder Acacia melanoxylon Fabaceae Nitrogen fixation, construction, fodder Sesbania sesban Fabaceae Nitrogen fixation, construction, fodder Musa paradisiaca Musaceae Food Bouganveillia sp. Nyctaginaceae Ornamental Eucalyptus camaldulensis Myrtaceae Construction, fuelwood Eucalyptus globulus Myrtaceae Construction, fuelwood Grevellia robusta Sapotaceae Construction, fuelwood
Table 4.23 : Exotic Species Grown in the Study Area
4.14.1.3 The Valley and Inaccessible Hill Slopes
The steep slope of the valley precludes intensive agricultural activities except in some places where the slope is gentle. The vegetation cover is composed of dry evergreen thicket and shrubs and a few species of larger trees. This vegetation type is remnant of the degraded vegetation type found on the plateau.
Fig. 4.30 : Vegetation cover on the inaccessible hill-slope
and farmlands on the more gentle slope of the Muger Valley

ESIA: Greenfield Derba Cement Project: DMC, Ethiopia
07150 4.54
In the valleys and hill slopes, the vegetation is dominated by shrub lands and scrublands with an average canopy height of 1.5 m. In most places of the valley, the vegetation is highly exploited for charcoal production and fuel wood. The valleys are major suppliers of charcoal to the highlands and the neighboring towns including Addis Ababa. Agriculture has encroached into the valleys and hill-slopes and marginal lands that are not favorable for crop cultivation reducing the vegetation cover in the hillsides.
The vegetation in the valley varies in composition and abundance depending on altitude. The top of the valley is covered mainly by herbaceous and scrubby species such as Carissa spinarum, Osyris lanceolata, Euclea racemosa, and Dodonaea angustifolia. At lower elevations, there is a decline in herbaceous cover and an increase in woody shrubs such as Rhus natalensis, Acacia spp., Balanites aegyptiaca; and succulents such as Opuntia-ficus indica and Euphorbia candelabrum. The detailed description of the vegetation along the altitudinal range is given below. The species composition and abundance in the plots sampled both on the plateau and the steep slopes of the Muger valley are shown in Annex 4.7. The map showing the altitudinal range is enclosed as Fig. 4.32.
Fig. 4.31 : Charcoal Production in the Valley

ESIA: Greenfield Derba Cement Project: DMC, Ethiopia
07150 4.55
1. 1500 - 1600 m altitudinal range - Average altitude for the plots is 1557 m.
Acacia ehrenbergiana, Acacia gerrardi, Acacia tortilis, Acacia etbaica, Acokanthera schimperi, Balanites aegyptiaca, Cadaba farinosa, Calpurnia aurea, Clerodendrom myricoides, Combretum molle, Commicarpus grandiflorus, Commiphora schimperi, Euclea racemosa, Euphorbia candelabrum, Euphorbia tirucalii, Maerua triphylla, Maytenus arbutifoilia, Opuntia ficus indica, Plectranthus sp., Rhus natalensis and Senna singuinea were encountered in the plots.
Dominant species in this altitudinal range are Acacia gerrardi, A. tortilis, Opuntia ficus-indica and Acacia etbaica.
Ficus sur, Ficus vasta, Acacia lahai, Coccinia abyssinica, Ficus thonningi, Urtica simensis, Grewia velutina, Acacia lahai, Calpurnia aurea, Maytenus senegalensis, Croton macrostachyus, Dichrostachys cinerea, Opuntia ficus indica, Acalypha sp. , Euphorbia tirucalii, Achyranthes aspera, Albizia gummifera, Ficus thonningi, Grewia trichocarpa, Grewia flavescens, Commelina benghalensis, Grewia villosa, Commicarpus grandiflorus, Grewia ferruguinea, Ziziphus mauritania, Lannea rivae, Acacia nilotica, Stereospermum kunthianum, Grewia arborea, Cadaba farinosa, Dichrostachys cinerea, Oxygonum sinuatum, species of Trifolium and Crotalaria, Abutilon sp., Euphorbia dumalis, and Justicia ladanoides are also found around the plots in this range.
2. 1600-1700 m altitudinal range - Average altitude for the plots is 1647 m.
Fig. 4.32 : Altitudinal ranges and sample plots of the project area

ESIA: Greenfield Derba Cement Project: DMC, Ethiopia
07150 4.56
The species encountered in this range are Acacia etbaica, Acacia gerrardi, Acokanthera schimperi, Asparagus africanus, Cadaba farinosa, Capparis tomentosa, Cissus rotundifolia, Combretum molle, Commiphora schimperi, Crorton macrostachyus, Dombeya torrida, Euphorbia candelabrum, Ficus sur, Grewia ferruguinea, Hibiscus micranthus, Lannea sp., Maerua triphylla, Opuntia ficus indica, Senna singuinea and Trema guneensis.
Dominant species in this altitudinal class are Euphorbia candelabrum, Commiphora schimperi, Opuntia ficus indica, Acacia gerrardi, and Combretum molle.
3. 1700-1800 m altitudinal range - Average altitude for the plots is 1714 m.
Balanites aegyptiaca, Schrebera alata and Senna singuinea were found in this plot.
4. 1800-1900 m altitudinal range - Average altitude for the plots is 1840 m.
The species encountered in this range are Ficus vasta, Ocimum lamiifolium, Schrebera alata and Impatiens rothii. Agave sisaliana, Salix subserrata, Erythrina abyssinica, Cordia africana, Acacia tortilis and Euphorbia tirucalii are found around settlement places.
5. 1900-2000 m altitudinal range - Average altitude for plots is 1951 m.
The species encountered in this range are Acacia gerrardi, Acacia etbaica, Calpurnia aurea, Calpurnia aurea, Capparis tomentosa, Clerodendrom myricoides, Combretum molle, Commiphora schimperi, Dodonaea angustifolia, Euclea racemosa, Ficus sur, Maytenus arbutifoilia, Osyris quadripartita, Pentas lanceolata, Premna resinosa, Rhus retinnorhea, Scheffleria abyssinica, and Ximenia Americana.
Acacia gerrardi, Acacia etbaica and Maytenus arbutifoilia have dominant cover in this altitudinal range. Stephania abyssinica, Maytenus heteromorpha, Euphorbia tirucalii, Acacia tortilis, Cordia africana, Croton macrostachyus, Commiphora schimperi, Pilostigma thonningi and Erythrina abyssinica are also found around the plots in this elevation range.
6. 2000- 2100 m altitudinal range - No plots were established in this altitudinal range.
7. 2100 - 2200 m altitudinal range
The species encountered in this range are Albizia gummifera, Alchemilla sp., Calpurnia aurea, Carissa spinarum, Clerodendrom myricoides, Clutia abyssinica, Dichrostachys cinerea, Helinus mystacinus, Hibiscus sp., Hypericum quartitianum, Phyllanthes sepialis, Rhus retinnorhea, Rhus glutinosa, Rumex nervosus, Senna singuinea, and Tagetes minuta.
8. 2200-2300 m altitudinal range - Average altitude for the plots of this range is 2240 m.
The species encountered in this range are Aloe sp., Carissa spinarum, Combretum molle, Commiphora schimperi, Impatiens rothii, Kalanchoe sp., Lantana trifolia, Lippea adoensis, Ocimum gratissimum, Ocimum lamifolium, Olea europaea, Otostegia integrifolia, Rhocissus tridentate and Rumex nervosus.

ESIA: Greenfield Derba Cement Project: DMC, Ethiopia
07150 4.57
Impatiens rothii, Lantana trifolia, Lippea adoensis, Otostegia integrifolia, Rumex nervosus, Ocimum lamiifolium and Ocimum gratissimum are relatively dominant in this altitudinal range. Oputia ficus-imdica, Euclea racemosa, Arthraxon species, Olea europaea, Ficus sur, Rhocissus tridentate, Schrebera alata and Abutilon sp. are also found around the plots in this range.
9. 2300 -2400 m altitudinal range - Average altitude for the plots of this range is 2351 m.
Acacia brevispica, Albizia gummifera, Calpurnia aurea, Carissa spinarum, Carissa spinarum, Epilobium hirusutum, Clerodendrom myricoides, Dodonaea angustifolia, Euclea racemosa, Heteromorpha trifoliata, Jasminum floribundum, Lantana trifolia, Maytenus addat, Maytenus arbutifoilia, Osyris quadripartite, Premna schimperi, Pterolobium stellatum, Rhus natalensis, Rhus glutinosa, Rosa abyssinica, Rumex nervosus, Senna singuinea, and Steganotaenia araliaceae are encountered in the plots. The species relatively dominating in this altitudinal range are Albizia gummifera, Calpurnia aurea, Heteromorpha trifoliata, Dodonaea angustifolia, and Steganotaenia araliaceae.
Olea europaea, Solanum somalense, Solanum incanum, Verbascum sinauticum, Cordia africana, Scheffleria abyssinica, Ricinus communis, Hypericum quartitianum, Phoenix reclinata, Ficus sur, Croton macrostachyus, Clutia abyssinica, Salix subserrata, Otostegia abyssinica, Aloe sp., Asparagus sp., Bersama abyssinica, Podocarpus falcatus, Clematis sinensis, Clausenia anisata, Plantago lanceolata, Rosa abyssinica, Eucalyptus globulus, Eucalytus camaldulensis, Acacia melanoxylon, Sesbania sesban, Cupressus lusitianica, Acacia decurrens, Schinus molle, Croton dichrogamus, Leucaenia leocarpa, Ricinus communis, Bouganvellia sp., Solanum marginatum, Agave sisaliana, Pterolobium stellatum, Agave americana, Grevellia robusta, Hagenia abyssinica, Casuarina equisetifolia, Vernonia amygdalina, Vernonia abyssinica, Senna singuinea, Ficus sycomorus, Rhus glutinosa, Ekebergia capensis, Embellia schimperi and Stephania abyssinica are also observed in different spots.
9. 2400-2500 m altitudinal range - Average elevation of the plots established in this range is 2431 m.
The species encountered in this range are Acacia abyssinica, Asparagus sp., Carissa spinarum, Crorton macrostachyus, Dovyalis abyssinica, Euclea racemosa, Euphorbia candelabrum, Hibiscus micranthus, Impatiens rothii, Lannea sp., Lippea adoensis, Olea europaea, Osyris quadripartita, Plectranthus sp., Rhus retinnorhea, Rubus steudneri, Rumex nervosus, Salix subserrata and Scheffleria abyssinica. The species occurring with high dominance are Euclea racemosa, Rumex nervosus, Rhus retinnorhea, Acacia abyssinica, and Lippea adoensis. Other species observed around the plots in this range are Cupressus lusitianica, Eucalyptus camaldulensis, E. globulus, Salix subserrata, Arundo donax, and Eucalyptus globulus.
4.14.1.4 Medicinal Plants
A total of 60 medicinal plants were recorded in the study area. Table 4.24 gives a list of the medicinal plants found in the area.

ESIA: Greenfield Derba Cement Project: DMC, Ethiopia
07150 4.58
Sn Species Family Status 1 Justicia schimperiana Acanthaceae M 2 Otostegia integrifolia Acanthaceae M 3 Otostegia tomemtosa Acanthaceae M 4 Allium sativum Alliaceae M 5 Allium sepa Alliaceae M 6 Achyranthes aspera Amaranthaceae M 7 Agrocharis melanantha Apiaceae M 8 Ferula communis Apiaceae M 9 Acokanthera schimperi Apocynaceae M 10 Carissa spinarum Apocynaceae M 11 Artemisia abyssinica Asteraceae M 12 Vernonia abyssinica Asteraceae M 13 Vernonia amygdalina Asteraceae M 14 Vernonia leopoldii Asteraceae M 15 Balanites aegyptiaca Balanitaceae M 16 Impatiens rothii Balsaminaceae M 17 Stereospermum kunthianum Bignoniacea M 18 Cordia africana Boraginaceae M 19 Datura strumarium Boraginaceae M 20 Opuntia ficus-indica Cactaceae M 21 Maerua angolensis Capparidaceae M 2 22 Combretum molle Combretaceae M 23 Commelina benghalensis Commelinaceae M 24 Kalanchoe sp. Crassulaceae M 25 Coccinia abyssinica Cucurbitaceae M 26 Croton dichrogamus Euphorbiaceae M 27 Croton macrostachyus Euphorbiaceae M 28 Euphorbia candelabrum Euphorbiaceae M 1 29 Euphorbia dumalis Euphorbiaceae M1 30 Euphorbia tirucalii Euphorbiaceae M2 31 Calpurnia aurea Fabaceae M 32 Senna occidentalis Fabaceae M 33 Senna singuinea Fabaceae M 34 Trigonella foenicum-graecum Fabaceae M 2 35 Clerodendrum myricoides Lamiaceae M 36 Leucas martinicencis Lamiaceae M 37 Ocimum gratissimum Lamiaceae M 38 Ocimum lamiifolim Lamiaceae M

ESIA: Greenfield Derba Cement Project: DMC, Ethiopia
07150 4.59
Sn Species Family Status 39 Premna resinosa Lamiaceae M 40 Premna schimperi Lamiaceae M 41 Verbascum sinauticum Lamiaceae M 42 Bersama abyssinica Melianthaceae M 43 Stephania abyssinica Menispermaceae M 44 Myrica salicifolia Myricaceae M 45 Maesa lanceolata Myrsinaceae M 46 Ximenia americana Olaccacaceae M 47 Olea europaea Oleaceae M 48 Phytolacca dodocandera Phytolaccaceae M 49 Rumex abyssinicus Polygonaceae M 50 Hagenia abyssinica Rosaceae M 51 Rosa abyssinica Rosaceae M 52 Clausenia anisata Rutaceae M 53 Brucea antidysentrica Simabouraceae M 54 Solanum incanum Solanaceae M 55 Solanum marginatum Solanaceae M 56 Solanum nigrum Solanaceae M 57 Solanum somalense Solanaceae M 58 Lantana trifolia Verbenaceae M 59 Lippea adoensis Verbenaceae M 60 Rhocissus tridentata Vitaceae M
Note M: Medicinal, M1= Medicinal and widely distributed, M2= Medicinal in other places
Table 4.24 : Medicinal Plants in the Study Area
Fig. 4.33: Impetiens rothii, a widely distributed medicinal and
cosmetic plant species found in the area

ESIA: Greenfield Derba Cement Project: DMC, Ethiopia
07150 4.60
4.14.1.5. Endemic and Threatened Species in the Area
The plant species encountered in the buffer zone include 15 endemic species of which 5 are highly endangered and 10 are of least concern. Table 4.25 gives a list of endemic species found in the area. The species are designated as threatened as per Ethiopian classification.
Endemic threatened Least concern endemics Crotalaria rosenni Dombeya aethiopica Hypericum gnidiifolium Echnomps longisetus Indigofera rothii Erythrina brucei Maytenus addat Euphorbia dumalis Satureja puncata Lippea adoensis Milletia ferruguinea Rhus glutinosa Senecio myriocephalus Vepris dainellii Vernonia leopoldi
Table 4.25 : Endemic and Threatened Species in the Study Area
The Plant families and the number of species in the project area are given in Table 4.26 the detailed list of flora species occurring in the area is enclosed as Annex 4.8.

ESIA: Greenfield Derba Cement Project: DMC, Ethiopia
07150 4.61
Family No. of species Acanthaceae 6 Agavaceae 2 Alliaceae 2 Aloaceae 1 Amaranthaceae 1 Anacardiaceae 8 Apiaceae 6 Apocynaceae 2 Aquifoliaceae 1 Araceae 1 Arecaceae 1 Asparagaceae 1 Asphodelaceae 2 Asteraceae 20 Balanitaceae 1 Balsaminaceae 1 Bignoniacea 1 Boraginaceae 3 Burseraceae 1 Cactaceae 1 Capparidaceae 4 Caryophyllaceae 1 Casuarinaceae 1 Celasteraceae 3 Combretaceae 1 Commelinaceae 2 Convolvulaceae 2 Crassulaceae 1 Cucurbitaceae 1 Cupressaceae 2 Cyperaceae 2 Ebenaceae 1 Euphorbiaceae 10 Fabaceae 40 Flacourtiaceae 1 Hypericaceae 2 Iacinaceae 1 Lamiaceae 8 Lamiceae 1 Linaceae 1 Malvaceae 4 Meliaceae 1
Family No. of species Melianthaceae 1 Menispermaceae 1 Moraceae 4 Musaceae 1 Myricaceae 1 Myrsinaceae 2 Myrtaceae 4 Nyctaginaceae 2 Ochnaceae 1 Olaccacaceae 1 Oleaceae 3 Onagaraceae 1 Pedaliaceae 1 Phytolaccaceae 1 Pittosporaceae 1 Plantaginaceae 1 Poaceae 15 Podocarpaceae 1 Polygonaceae 3 Ranunculaceae 2 Rhamnaceae 2 Rosaceae 5 Rubiaceae 6 Rutaceae 1 Salicaceae 1 Santalaceae 1 Sapindaceae 5 Sapotaceae 1 Simabouraceae 1 Solanaceae 5 Sterculiaceae 1 Tiliaceae 7 Ulmaceae 1 Urticaceae 1 Verbenaceae 2 Vitaceae 2 Total 79
Table 4.26 : Plant Families and number of Species in the Study Area

ESIA Report: Greenfield Derba Cement Project: Ethiopia
07150 4.62
4.14.1.6 Protected Areas
Ethiopia is making efforts to protect biodiversity and conserve resources through the creation of protected parks, wildlife resources, controlled hunting areas and Regional Priority Forest Areas. Based on the review of available national and regional conservation area maps issued by the Government and other competent authorities, it has been confirmed that the project area is neither contiguous with, nor in close proximity with any of these nationally protected areas.
There are many birds in the project area. However, according to Ethiopian Wildlife and Natural History Society (EWNHS, 1996), none of the 78 nationally designated Important Bird Areas are found anywhere near the project area.
4.14.1.7 Conclusions
The study area of 10 km radius around the plant and mining sites is rich in species composition though the abundance and distribution is highly influenced by anthropogenic factors such as crop cultivation, grazing, charcoal production and wood cutting for domestic use. A total of 241 species in 79 families have been recorded. Most of these species are indigenous while a few others are exotic or naturalized. A total of 23 cultivated plant species were recorded. A total of 60 medicinal plants were recorded. The plant species encountered include 15 endemic species of which 5 are highly endangered and 10 are of least concern.
4.14.2 FAUNA
A detailed faunal study has been carried out in the area by experts from the University of Addis Ababa. The general objective of the faunal study is to make a baseline survey of the fauna at the proposed DMC plant and mining site and:
To inventorize and identify the faunal composition of wildlife, insects, birds, amphibians, reptiles, domestic animals and aquatic invertebrates at the proposed plant and quarry core and buffer zones of the project area
To distinguish between the fauna found in the core zones (plant and quarry sites) and the buffer zones (around 10 km radius from the core centers)
To determine the ecological status of the fauna according to the IUCN/ Ethiopian guidelines as endangered (critically), threatened, vulnerable, extinct, rare, etc
4.14.2.1 Methodology
On-site observations were made and recorded at the plant and quarry sites, in both the core and buffer zones.
Birds - Birds were identified based on direct observation and calls on site. For species identification, the guide of Williams and Arlott (1980) was referred.
Wildlife - Local informants were interviewed about the past and present status of wildlife in the buffer zones. The quarry core area is very small and inhabited by the workers of Mugher factory; so no wildlife exists there. The plant core site is close to Adero village and inhabitants of the village reported that the wildlife in the area was long ago decimated. The taxonomy of wildlife was checked with Kingdon (1997).
Insects and butterflies - These were recorded from the valley and by the river banks and a few specimens were collected for verification. Cross checking was done with the

ESIA Report: Greenfield Derba Cement Project: Ethiopia
07150 4.63
reference insect and butterfly collection of the Zoological Natural History Museum, Biology Department, Addis Ababa University.
Reptiles - Informants were requested to describe the snakes they encounter as poisonous/ non-poisonous and using the local names, an educated guess was made about the scientific identity of the snakes. Lizards and turtles were rarely observed. Reference was made for further authentication to the draft paper prepared by Mohammed et al. (2001) on the terrestrial wild animals and protected areas in Ethiopia.
Amphibians - Both on site observation and local information was used. Frog croaking was common in the Mugher River in the late afternoon.
Fish - The rivers were in high flood at the time of the survey, so no fish was directly sampled. The local people confirmed that fish tend to hide in the riverbed or migrate elsewhere at this time. In the long dry season, however, local informants said that the rivers were full of fish. The scientific identity of the fish could easily be deduced from the fine description of the informants.
People also claimed that they prepared different types of food from fish - dried and pound fish-soup, fillet, cooked, fried, but never ate raw fish as is commonly observed in the rift valley lakes.
Other mammals - Besides wildlife, a lot of domestic animals were observed, including cattle, goats, sheep, chicken, donkeys, horses and dogs/cats.
The ecological status of the fauna was determined according to the criteria recommended by IUCN using Internet resources and literature.
Plankton samples - Algal samples were collected and preserved in Lugol's Iodine from backpools of some rivers, and ditches in Derba.
4.14.2.2 Fauna in Project Core Areas
Core Plant Site - Becho
Table 4.27 shows the faunal composition at the core area of the proposed plant site. Because of human incursion in the area, most of the wild fauna has disappeared. Intensive cultivation has removed most of the original forest and the natural habitat of birds, insects, and butterflies has almost disappeared, which explains the poor faunal diversity in this area in general. There is a small spring from which the village of Adero draws water. It had no amphibian, reptile or fish specimens.
The fauna existing in the core zone of plant is given in Table 4.27.
Scientific Name Common name Status as per IUCN
Status as per Eth. Wildlife
Mammals Tragelaphus seriptus Geneta abyssinicus Theropitecus gelada Canis mesomelas Crococta crococta
Bush diuker Genet cat Anubis baboon, Gelada baboon Vervet monkey Jackal Hyaena
R R C R R R C
R R C R R R C

ESIA Report: Greenfield Derba Cement Project: Ethiopia
07150 4.64
Scientific Name Common name Status as per IUCN
Status as per Eth. Wildlife
Aves (Birds)
Francolinus clappertoni
Corvus albus Accipiter rufiventris
Vidua paradisea Placoeus baglafechi Terpisiphone viridis
Francolin Pied crow Sparrow Paradise whydah Weaver Paradise flycatcher Guinea fowl Tawny eagle Starling Yellow-billed Oxpecker
R R C R C R R R C R
R R C R C R R R C R
Pisces (Fish)
None in the Adero spring
Amphibians None observed Reptiles Poisonous snakes Insects Butterflies
Grasshoppers (Acrididae) Family Lycaenidae Popillionidae Hesperidae Daniidae,
C C
C C
Plankton Not sampled R = Rare; C = Common
Table 4.27 : Faunal Composition at the Core Plant Site
Core Zone of Quarry Site at Mugher Valley
Table 4.28 gives the faunal composition at the quarry core site in the Mugher valley. This excavation site is 1.4 km away from the old quarry site of the state-owned Mugher factory. The area is a sparsely populated farmland with the rivers flowing far below on the north-eastern side. The long history of human encroachment for farming and charcoal production has decimated the forest and wildlife. Birds and insects are rare because of the deforestation. The area can be described as already depauperate in fauna.
Core zone (Quarry)
Scientific name Common name Status as per IUCN
Status as per Eth. Wildlife
Mammals
Vervet monkey Anubis baboon Jackal Leopard
C C R R
C C R R

ESIA Report: Greenfield Derba Cement Project: Ethiopia
07150 4.65
Scientific name Common name Status as per IUCN
Status as per Eth. Wildlife
Aves (Birds) Ploceus baglafechi Accipiter rufiventris
Weaver Sparrow
R R
R R
Pisces (Fish) None observed Amphibians None Reptiles None Insects Butterflies
Butterflies, beetles (scarabid) and meadow grasshoppers
C
C
Plankton Not sampled R = Rare; C = Common
Table 4.28 : Faunal Composition at the Core Quarry site (Mugher valley)
River Floodplain
The five rivers in the Muger valley - Lebu, Bole, Duketu, Jemma, Sibilu and Muger - were at high flood season at the time of the survey. Therefore no plankton or macroinvertebrate collection was made, except for a few phytoplankton samples collected from backpools. Fish were not directly observed also; instead, the local people were interviewed about the status of fish during the long dry season.
The river floodplain is rich in both aquatic and terrestrial fauna. The presence of riparian vegetation and forest contribute to diverse insect and butterfly species. Fish and amphibians are common in the rivers. The Nile lizard (Varanus niloticus) is common in the Muger River, but the people say that crocodiles are absent, which explains why the local people frequently water their livestock, bath and even graze their cattle near the riverbanks. Some parts of the floodplain have even been converted into banana plantations and sorghum fields. Many farmers make charcoal by indiscriminately cutting the forest, thereby exposing the soil to erosion into the rivers and exacerbating habitat loss for birds and insects.
The bird diversity is high in the floodplain, and most of these birds migrate locally to the escarpment. The surrounding land is intensively farmed and attracts a lot of birds and monkeys. The heavy human encroachment may pose the most serious ecological challenge in the river floodplain than the operation of limestone quarries by the old and the new cement projects.
In general, this is a biodiversity-rich area, but already, this has been compromised by the intensive deforestation, wildlife hunting and other human activities, which have affected the natural resources in a very negative way.
Buffer zone (Mine/Quarry)
Scientific name Common name Status as per IUCN
Status as per Eth. Wildlife
Mammals Theropithecus geladaCanis mesolamis
Anubis monkey Gelada baboon Jackal
C R R
C R R

ESIA Report: Greenfield Derba Cement Project: Ethiopia
07150 4.66
Scientific name Common name Status as per IUCN
Status as per Eth. Wildlife
Potamochoerus porcus Panthera pardus
Hystrix cristata Felis serval
Bush pig Leopard Porcupine Serval Goats, sheep, donkeys, horses, chicken and cats/dogs
R R R R C
R R R R C
Aves (Birds)
Francolinus clappertoni Numida meleagris Euplects franchiscus Ploceus baglafechi Terpsiphone viridis Streptopelia senegalensis Vidua paradisea Lagonosticta rufopicta Serinus tristrianus Uragenthis bengalus
Francoline
Guinea fowl Red-headed bishop Weavers Paradise flycatcher Dove Paradise whydah Swallows (Nesting) Finches Seed-eaters Red-checked cordon blue Starlings, etc
C
R R R C R C C R C
Same category as IUCN
Pisces (Fish)
4 species of Labeo, Barbus, Oreochromis and Clarias (catfish)
C
C
Amphibians Frogs (Bufo sp.)
Reptiles
(Family Boidae and Viperidae), Lizards (Agamidae) Crocodile in Muger downstream
C C R
C C R
Insects Butterflies
Insects: Odonata (dragonflies and damselflies), Beetles (Cuculionidae, Scarabidae, Elateridae), Crickets, Grasshoppers (Acrididae - Acrida and Oxya sp.) Praying mantis Colotis butterflies Millipedes Burrowing beetles (Noteridae),
C C C R C C C C
C C C R C C C C

ESIA Report: Greenfield Derba Cement Project: Ethiopia
07150 4.67
Scientific name Common name Status as per IUCN
Status as per Eth. Wildlife
Velvet ants (Mutilidae) etc Plankton Algae in backpools
Macroinvertebrates and plankton not sampled
C
C
Table 4.29 : Faunal Composition at the Buffer River Floodplain (Muger valley)
4.14.2.3 Habitat Integrity Rating of the Rivers
Rapid habitat integrity assessment was made of the five rivers using the criteria developed for the Rapid Bioassessment Protocol (RBP) of Barbour et al., (1999). A few criteria were modified to suit the local conditions, such as pollution by dung and human wastes. Weights are assigned to different in-stream and riparian characters of the river reaches such as flow modification, exotic macrophytes, solid waste disposal, bank erosion and vegetation cover. The ten most important habitat components are considered for analysis with each component having a score of 10 points, adding up to a total of 100%. A range of score points describe the habitat integrity status of the river. High scores describe pristine or unimpaired conditions and low percentages apply to impacted rivers.
Table 4.30 gives the criteria and the score of the habitat components considered for the ecological integrity assessment of the five rivers in the Muger valley. Rapid habitat assessment was done by visual scoring of both in-stream and channel features of each river and each component was assessed out of 10 points to make a total of 100 points. Category and interpretation was done according to Barbour et al., (1999).
Habitat component (instream and riparian)
Lebu River
Bole River
Duketu River
Jemma River
Muger River
Substrate quality and quantity Sediment and sand deposition Channel alteration (modification) Bank stability (canopy and erosion) Riparian vegetation zone width Frequency of riffles/bends Manure/dung wastes Velocity/depth regime Water quality (appearance) Exotic plants and animals introduction
10 9 10 8 9 10 9 10 10 10
10 8 10 8 8 10 9 10 10 10
10 8 10 8 8
10 8
10 10 10
10 9 9 8 8
10 8
10 10 10
10 7 7 8 7 9 6
10 10 10
Total habitat score 95 93 96 92 84 Interpretation Largely pristine with few modifications. A small change in natural habitats and biota may have occurred, but the basic ecosystem functions are predominantly unchanged (80-99% score)
B B B B B
Table 4.30 : Habitat Integrity rating for the five rivers at the Muger Valley

ESIA Report: Greenfield Derba Cement Project: Ethiopia
07150 4.68
The main reasons for the lowered score of the habitat integrity of some of these rivers (especially Muger) could be the following:
Bank erosion and modification due to cultivation on the river banks
Channel modification for excavation purposes
High level of cattle dung due to the large livestock and their daily watering at different sites of the rivers
Some human encroachment especially at Muger river
Impact of the Muger old town at upstream site
Removal of riparian vegetation for cultivation and charcoal making.
Adjoining Buffer Weredas
Wildlife data was collected from the local community and the Wereda offices of four adjoining buffer zone areas - Yayu Gulele, Adaberga, Wuchale and Sululta Weredas and shown in Table 4.31.
Common name Scientific name IUCN status Ethiopian Statutes
Bush buck Tragelaphus seriptus R R Bush diuker Sylviacapra grimma R R Leopard Panthera pardus R R Civet Viverra civetta R R Vervet monkey C C Gelada Baboon Therophitecus gelada R R Aardvark Orycteropus afer R R Serval Felis serval R R Warthog Phacochoerus aethipicus R R Colobus monkey Colobus abyssinicus R R Porcupine Hystrix cristata C C Jackal Canis mesomelas R R Hyaena Crococta crocota C C Genet cat Geneta abyssinica R R Hamadryas Baboon Papio hamadryas C C Bush pig Potamochoerus porcus R R Cheetah Acinomyx jubatus R R Rock hyrax R R Abyssinian hare Lepus abyssinicus R R
R = Rare; C = Common
Table 4.31 : Fauna in the Adjoining Buffer Weredas
Algal samples were recovered from rock pools and mud slicks. The major groups found in their order of dominance, were filamentous green algae, especially Cladophora and Spirogyra sp. and some diatom species. These are the only plankton samples collected during this time of the year. During the dry season, they could potentially form algal blooms in backpools and impounded waters (perhaps causing problems for livestock and wildlife watering). The tangled mass of such algae can be a nuisance in potable water filters and can clog pipes and plant installations.

ESIA Report: Greenfield Derba Cement Project: Ethiopia
07150 4.69
4.14.2.4 Conclusions
Far fewer fauna were observed in the core zones as opposed to the buffer zones, even if the latter was already highly impacted by deforestation and wildlife hunting.
There are no faunal species recorded from the Muger valley area that can be categorized as endangered, threatened or vulnerable. The species encountered are common forms that are observed in other parts of Ethiopia. The adjacent Sululta plains on the other hand harbour the globally threatened white-winged flufftail and corncrake and the near-threatened Rouget's Rail, Pallid Harrier, Great Snipe and Abyssinian Long claw. The open plains are an important feeding area for blue-winged goose, spot-breasted plover, wattled ibis and red-chested swallows. The last were reported roosting in the Muger valley in addition to a few Egyptian geese in the Muger River. The Muger area could be a potential migration route (at least locally) for these threatened species from the Sululta plains. The endemic birds present in the Sululta plains (spot-breasted plover, Abyssinian longclaw and Abyssinian catbird) were not observed in the Muger valley.
People indicate that the forest cover and wildlife numbers were very high even as recently as three decades ago. The last few remaining forests on the escarpment should be supplemented with revegetation programs around the quarry and plant sites. This will help both to mitigate the impact of dust and noise emissions and enhance biodiversity level resulting in an improved situation from the baseline status.
4.15 CULTURAL, HISTORICAL & ARCHAEOLOGICAL FEATURES
A rapid archaeological survey was carried out in the project plant site and quarry area, and their environs from August 29 to September 1, 2007.
4.15.1 PRIMARY DATA
The archaeological survey was carried out using the following methodology:
Site Survey was conducted to search archaeological materials on the surface of the project area and its environs.
Site recording of the study area by GPS and existing topographic maps.
Photographic recordings of the landscape, sites and identified materials.
Tape measurements of identified sites, artifacts and ruined structures.
Informal Interview with local elders and officials.
Secondary data was obtained from written historic sources, maps, previous archaeological works, reports, and archival materials particularly from ARCCH (Authority for Research and Conservation of Cultural Heritage, Ethiopia).
The gathered data was analyzed qualitatively with standard risk assessment and evaluating format of preventive archaeology.
4.15.2 BACKGROUND OF THE PROJECT AREA
Although a number of rivers are found in northwest of Addis Ababa in the environs of the study site, Sibilu and Gerbi Rivers, which converge and enter into Muger river, are the major ones. Muger River is one of the main tributaries of Abbay (Blue Nile) River. These rivers are located southwest of Debre Libanos Monastery of Abuna Teklehymanot. Abuna

ESIA Report: Greenfield Derba Cement Project: Ethiopia
07150 4.70
Teklehymanot was a thirteenth century Saint of Ethiopian Orthodox Church, who carried out evangelical activities with his disciples in this part of the region.
The predominant population of the region is Oromo.
History of the Region
Ancient Period : 2800 BC – 1270 AD
During the ancient period (ca 2800 BC-1270 AD) the region was occupied by the ancient and medieval states, which were outside the occupation of the Aksumite Empire and the Zagwe dynasty. Though there are no available historic sources that mention that the region was under the two kingdoms during ancient time, other sources indicate that the region was partly the Shewa state and partly the anonymous state of Damot.
Medieval Period : 1270 AD – 1524 AD
Historical references to the position of the study area and the medieval district of Muger indicate that the region was at the strategic position of Shewa where the fertile districts of Waj, Enarea, Indagabatan, Warab, and Damot were found. Tradition and written documents mention that the treasury and wealth of the medieval Emperors of Ethiopia were deposited in this part of Shewa. References to the region were available in relation to the invasion of Ahmad Gran and the movement of the Oromo.
Historical written sources indicate that the western side of Debra Libanos and the whole region of Muger were highly dominated by pagan religious practices before the advent of Christianity to the region. Indagebtan, Warab, Tsegagen, Slalish, Waj and Damot were most probably pagan. Of these the most widely known pagan kingdom was Damot. The rulers of Damot, and Meteolomi had fought against the Christian king in this region near Sibilu River.
Christianity was introduced in the region by Aba Tekele Haymanot in the thirteenth century.
Medieval historical sources indicate that the region northwest of Addis Ababa has occupied an important place in the history of Ethiopia. The region of Showa became the very centre of the Christian kingdom. The fertile districts of Muger attracted Christian settlers from the north. The region became the seat of the king and the abbot. Therefore palaces, churches, monasteries and residential houses flourished in the region. Still there are ancient monasteries in the region. A good example of these is Debra Semona, northwest of Sibilu River in the district of Wizero.
The region of Derba and Muger was a seat of the medieval emperors. Yekuno Amlak (1270-1283 AD) and his successors established their royal courts and important towns in this part of the region. The mountainous region of the north, which is traversed by Muger River, holds the town of Baquellat and the venerated church of Tekle Hawaiat. In this part of the region the lost town of Zaraah, where the Egyptian and Syrian Christian merchants dwelled was also found.
To sum up, oral tradition and historic written sources testify that the fertile districts of northwest Showa such as Muger, Wagda, Dinbi, Waj, Warab, Indagabtan and others, were located between Muger River and Indagabtan. Indagabtan was stretched eastward from the source of Awash to Debra Berhan. These districts were the seat of church and state. Thus royal palaces, churches, monasteries, markets and residential houses were highly concentrated in the region during the medieval period.

ESIA Report: Greenfield Derba Cement Project: Ethiopia
07150 4.71
The Oromo Movement
Since the sixteenth century, the Oromo tribes, Mecha and Tulema, have moved to and settled in the region of Derba and Muger. This movement has resulted in the assimilation and intermingling of the ancient settlers of the region with the Oromo.
4.15.3 PREVIOUS ARCHAEOLOGICAL RESEARCH IN THE AREA
Since the 16th century the map of the project area has changed dramatically. The ancient and medieval place names appear to be changed or distorted. The original inhabitants of the region might have been pushed further north, or assimilated into the present inhabitants of the area. Most inhabitants of the region neither remember nor claim the location and stories of the old monasteries, palaces and churches of the region. The only remnants that could testify the existence of the wealth and powerful states in this part of Ethiopia are archaeological materials, such as ruins of palaces, churches or monasteries, burial places and artifacts.
Based on these assumptions, experts from the ARCCH conducted archaeological survey and impact assessment in the environs of Chancho in connection with the Sibilu and Garbi dam sites reservoir and transmission lines. The study was conducted in 1996 based on the mutual agreement between AAWSA Stage III Water Supply Project and the Department of Archaeology and Anthropology of the CRCCH (now ARCCH).
The ARCCH survey team discovered largely two distinct cultural remains. These are megalithic and medieval cultures. Megalithic, which stretches back to the Neolithic, consists of standing stone (Stelae), tumulus and dolmen. Medieval structures consist of wall structures most probably constructed between the 10th to the 16th century. The team discovered traces of archaeological elements at Deneba, Gulele (probably Dinbi); Awaso-Daka, Fita, Didibe, Birbirtu (probably Barara), and Galiye Mana Abichu-Burka, Bodo and Boru.
The team finally concludes that they do not certainly know to whom these monuments belonged. They recommend proper investigation and excavation so as to trace their originator and reach to know their social, economic and political organizations, which in turn contribute a new knowledge to the history of Ethiopia.
In 2006, a team of Preventive Archaeology carried out field survey in two major archaeological areas: Dibdibe and Ochi Luncha, which are located in the environs of the project area. In Dibdibe the team found a total of ten archaeological areas. In Dibdibe the team discovered red and black potsherd, obsidians, tumuli and ruined structures. However, this site is nearly 40 km away from the DMC plant and mining sites.
Like Dibdibe the team also spent some days in Ochi Luncha area to carry out an archaeological ground survey. Six archaeological areas were found concentrated on farming and grazing areas with plain and slope land morphology. Five of these archaeological areas have potsherds and obsidians of different colour and thickness.
A tumuli and stelae have been found here. The standing basaltic rocks are found to the north of Dibdibe. It is the effect of natural phenomena. However, it seems that in the long past people were living on those basaltic rocks, managed part of the spaces and left some traces of archaeological elements on the surface; example, potsherd, obsidians. The stones were used by the people in the natural state. Here tumuli with standing stones were observed.
The locations of Dibdibe and Ochi archaeological sites are shown in Fig. 4.34.

ESIA Report: Greenfield Derba Cement Project: Ethiopia
07150 4.72
Fig. 4.34 : Archaeological Sites in the Area
4.15.4 ARCHAEOLOGICAL SURVEY RESULTS
4.15.4.1 Plant Area
The plant and camp sites were surveyed extensively on foot from south to north direction. The survey result revealed that there are no observable artifacts, features, and fossils in the plant site. Consultations with the project constructors and local farmers also justified that no observable ruined structure, standing stones, obsidian stone tools or ceramic fragments in the project area. Investigation was carrying out on the excavated materials, which were dug out for construction purposes. In some part of the plant site 2-4m deep trenches are observed. Excavated soils are also visible. Analysis on the excavated soils also confirmed no visible archaeological materials in the site.
Further survey was also conducted outside the plant site around the hills of Dibdibe. At a place called Gulbe, unknown age stone structure, which is similar to the ruined structure discovered by the preventive archaeology team in the other side of Dibdibe Mountain, is observed.
4.15.4.2 Mining Area
Archaeological survey and observation of the landscape were carried out over the 1km2 × 2km2 quarry site and its buffer zone. Investigations were also conducted in 11 boreholes, drilled in the mining area.

ESIA Report: Greenfield Derba Cement Project: Ethiopia
07150 4.73
The excavated soils and sediments are thoroughly investigated. No stone artifacts, organic and inorganic archaeological materials are observed. No mega structures are also seen. Local informants also confirmed that there is no observable cultural remains in their region. Although the Church of Aba Tekle Haimanot is located outside the quarry site, it is close to it. According to locals, the villages surrounding the church might be evacuated soon, which may isolate the church from the villagers. Since the church is placed close to the quarry site, the process of quarrying, transportation and other related activities would be affected directly or indirectly the church. Currently new construction is going on inside the church compound.
4.15.5 CONCLUSIONS
The results of methodical surface survey and evaluation in the actual plant and quarry sites of DMC demonstrate that no visible archaeological remains, which have scientific, cultural, public, economic, ethnic and historic significances, are discovered.
The construction of the plant as well as the excavations in the quarry site have no direct impact on the archaeological materials, which are placed particularly in the hills of Dibdibe, which are about 40 km away.
The risks value in both the plant and the quarry sites are very low, where no significant observable archaeological evidence is found. The sites have no archaeological importance. Thus, the preservation of the sites is not mandatory.
It may be advisable to consult with the authorities of Mugar Tekle Haymanot church about the future fate of the church and about the ongoing construction inside the church compound. It is recommended that the old church might be preserved as it is. But the site of the new church could be transferred to the nearby village.
Church of Aba Tekle Haimanot Foundation of the new church

ESIA: Greenfield Derba Cement Project: DMC, Ethiopia
07150 4.74
4.16 SOCIO-ECONOMIC SCENARIO The plant and quarry sites are located within the Sululta Wereda and the buffer zone covers a total of five administrative Weredas from two zonal administrations, namely, Sululta, Mullo, Yaya Gulele and Wichale from North Shoa zone and Adaberga from West Shoa zone (Refer Fig. 4.35). Within these Weredas there are twenty-eight Peasant Associations (PAs).
Although the Weredas consist of both urban and rural sections, the core zone (plant and mining sites) and the buffer zone (area within 10 km radius of plant and mining sites) are located in the rural settings of these Weredas. Therefore, the study focuses mainly on the associated rural parts of the Weredas.
4.16.1 STUDY OBJECTIVES
Basic demographic and socio-economic information on population and settlements that would be affected by the construction and operation of the proposed project have been gathered by a primary survey. The study area has been divided into core and buffer (within 10 km radius from center of plan and mining areas) zones.
4.16.2 METHODOLOGY
A combination of various methods, techniques and materials were used in this study, which aims to determine the socio-economic profile of the proposed project. Methods and materials used in this study include the following:
4.16.2.1 Review of Literature and Maps
Various statistical and analytical reports published by Central Statistical Authority were extensively used to determine the socio-economic and demographic profile of population and settlements in the project area. Furthermore, topographic maps (Ethiopian Mapping Agency [EMA] 1984 and CSA 1994) were also used to identify and delineate villages, resources and facilities that are located within the core and buffer areas of the proposed cement plant scheme.
4.16.2.2 Quantitative Level Survey
The quantitative survey has been carried out at Wereda, PA and Household level. The collection of baseline data from this focused groups had the following objectives:
To collect statistical information on the socio-economic conditions and livelihoods bases of the households found within their respective administrations To identify and locate historical, religious, cultural and other important sites located
around the immediate surroundings of the project area To identify current and planned public and private investments taking place within the
project core and buffer areas As stakeholders, to make the local communities and their leaders aware about the
proposed project To assess the response, expectations, fear and propose corrective measures for the
negative impacts.

ESIA: Greenfield Derba Cement Project: DMC, Ethiopia
07150 4.75
Fig. 4.35 : Administrative boundaries (Kebeles) in the Study Area

ESIA: Greenfield Derba Cement Project: DMC, Ethiopia
07150 4.76
4.16.2.3 Quantitative Wereda Level Survey
All the five Weredas affected by the potential impacts of the project were surveyed by a structured set of questionnaires (Questionnaire is enclosed as Annex 4.9). The Wereda administrative bodies are the immediate and the primary responsible governmental bodies for any development activities taking place within their administrative boundaries. The participation of these governmental administrative bodies from the initial baseline survey through the construction and operation phases of the project benefits both the project affected communities and the project developer.
4.16.2.4 Quantitative PA Level Survey
All twenty-eight administration offices of the Peasant Associations (PAs) located within the potential impact zones of the project were surveyed through a structured set of questionnaires (Questionnaire is enclosed Annex 4.10).
4.16.2.5 Quantitative Household Level Survey
A quantitative survey was conducted using a structured set of Questionnaires (See Annex 4.11) on a statistically representative stratified random sample of about 1,000 households. The information was collected by random selection of households from various locations and topographical set up from the core and buffer areas.
4.16.2.6 Qualitative Survey: Key Informant Interviews and Discussion
In order to assess knowledge, perception and attitude of the communities about the proposed project and its potential impacts, several meetings, interviews and discussion were held with a number of community leaders and representatives of various offices. Moreover, discussions were held with local officials to assess official response and examine prospects and challenges for various mitigation strategies.
4.17 SOCIO-ECONOMIC PROFILE OF THE WEREDAS
4.17.1 DEMOGRAPHIC CHARACTERISTICS
4.17.1.1 Population and Settlement
The population in the year 2007 within the five Weredas is estimated to be about 435,829 living in 76,562 families of which 50.1% were males and 49.9% were females. The estimated household size for the Weredas is 5.7 persons per family. Within the Weredas, household size ranges from 4.6 in Wuchale to 9.0 persons per family in Mulo Wereda.
The population is predominantly rural based with nearly 91.9% living in rural areas. The urban population is estimated to be only about 8.9%.
The average population density for the whole Weredas is 103.4 persons/ km2 against a national population density of 50 persons/ km2. Within the Weredas, population density ranges from 91.3 persons/ km2 in Wuchale to 110.3 persons/ km2 in Ada Berga Wereda.
4.17.1.2 Ethnic Composition
According to the Wereda survey results, population of the project area is almost entirely of the Oromo ethnic group (97.2%) and Oromiffa is the major, if not the sole, language spoken in the area. Perhaps due to very low level of urbanization along with its

ESIA: Greenfield Derba Cement Project: DMC, Ethiopia
07150 4.77
concomitants and predominantly agrarian nature of the local economy, among others, social intermingling of the population with other ethnic groups is very limited in the project area.
There are no known ethnic minorities that might require special protection effort by the proposed project.
4.17.1.3 Religion
Inhabitants of the proposed project area are predominantly followers of the Orthodox Christian religion (95.3%). Followers of the Muslim religion are only 2.6% and traditional believers are only 2.1% of the total population of the project area.
Traditionally, most of the houses in the project area were round-shaped wooden houses plastered with mud and roofs covered with grass. A recent development in the housing pattern in the project area is that farmers have moved away from construction of houses with thatched roofs to corrugated iron sheets perhaps due to rise in income and to save grass for livestock fodder.
4.17.2 EDUCATION
4.17.2.1 General
In the global poverty alleviation attempt education has become one major area of development intervention. As part of the Millennium Development Goals (MDG), by 2015 children everywhere will be able to complete a full course of primary schooling. Besides, under the MDG programme, gender disparity in primary and secondary education is expected to be eliminated.
The Government of Ethiopia has given due emphasis to the education sector with the introduction of new policy, strategy and sector program. Since 1994, after the new policy was enacted, the Government is pursuing a policy of regional decentralisation based on identified priorities. The policy is mainly geared towards re-addressing the problems of access, equity, quality and relevance of the entire education and training activities within the country.
The general situation in the project area indicates that most parts lack basic social infrastructure like education services. Inadequate access to schooling is a major socio-economic problem of the area.
4.17.2.2 Literacy Rate
The average literacy rate for the total population above the age of 10 years is very low (less than 31%) and this figure is 42% for urban and 30% for rural population. The literacy rate within the buffer area ranges from 22% to 60%. Yaya Gulele Wereda has a better education coverage compared to other Weredas, which have a very poor coverage level.
There is gender discrimination in education. About 33% of male and less than 28% of female population is reported to be literate.
4.17.2.3 Education Facilities
Under the newly adopted education policy, the entire education system is classified as basic, general, higher and specialised education in formal and non-formal education.
There are a total of 95 schools, 838 teachers and 43,915 students in the study area. Most of the schools are first and second cycle schools. At the project area level, student/ teacher

ESIA: Greenfield Derba Cement Project: DMC, Ethiopia
07150 4.78
ratio is 52. The country level student/ teacher ratios are 60 and 46 for primary and secondary level education respectively.
In reference to the nation wide ratio, most Weredas in the project area have achieved a better student/ teacher ratio.
From the assessment of the school facilities in the project areas the following problems were observed:
Though educational facilities are being expanded still they seem inadequate to cater to the needs of the growing student population within reasonable access distance, especially post primary schools. Insufficient class rooms Most of the existing schools are poorly equipped and lack adequate materials like
desks, learning materials etc. Besides, absence of facilities like drinking water and toilets is common in several of these schools. Lack of budget for maintenance and proper handling of day to day activities Though there is an encouraging trend to enroll girls in schools, there is still gender
imbalance between enrolment levels of boys and girls Due to poor access to services, there is a scarcity of good teachers, especially in post
primary schools around the quarry site.
4.17.3 PUBLIC SERVICES AND INFRASTRUCTURES
4.17.3.1 Roads
In general, the road network in the project area is very poor. Apart from some dry and link roads to the main towns, most of the areas are inaccessible. The main Addis –Debremarkos highway is one trunk road leading to and passing through the Sululta and Wichale Weredas. This is an asphalt road of 73 km length. Currently, there are a total of 585 km of roads (i.e. 321 km of dry weather road, 191 km of all weather road and 73 km of asphalt road).
The lack of an adequate transport network of all–weather roads and scattered settlements have left a majority of the people in and around the project area isolated. This has been an obstacle in the development of the area. Lack of access to basic domestic needs, social services and economic facilities has imposed unreliable transport burden and wastage of time, which could be otherwise used to productive activities.
4.17.3.2 Type of Institutions
On the basis of the estimates made on the data obtained from some Weredas, there are 37 Farmers’ Service Cooperatives and five Farmers’ Producer Cooperatives in the Weredas.
4.17.4 ECONOMIC ACTIVITIES
As in most parts of rural Ethiopia, subsistence agriculture with production of crops, cereals, pulses, oil seeds, fruit, vegetables and livestock characterizes the economic activities of the Weredas. Off-farm income generation and employment options are extremely limited primarily due to limited skills, experience, educational background, and small market.
95.7% of the economically active population of more than 10 years of age relies on mixed farming as their major source of employment and income. About 0.1% of the population is

ESIA: Greenfield Derba Cement Project: DMC, Ethiopia
07150 4.79
employed as daily labourers while 1.9% are reported to have earned some level of income through trading. Other sources of income options contribute the remaining percentage.
4.17.4.1 Agriculture
Ethiopia is a predominantly agrarian country and the majority of the population is engaged in agriculture contributing a substantial amount to the gross domestic product and export revenues. In general in Ethiopia, agriculture is characterised by a high fragmentation of land holdings, low productivity and traditional system of production. The Weredas in this project area are agricultural crop producers dominated by annual crops of mainly cereals, pulses, oilseeds, and spices.
4.17.4.2 Agricultural Systems
The agricultural land in the five Weredas of the study area is mainly cultivated by means of traditional rainfed subsistence farming. The average farmland holding per household in the Weredas is about 1.9 ha. The total land utilization in the area by the type of crops grown in the area is given in Table 4.32.
Agricultural Lands of the Weredas (ha) No Major crops Sululta Wichale Yaya Gulele Mullo Adaberga Total
1 Cereals 35,183 22,585 24,644 12,889 38,608 133,909 2 Pulses 5,406 7,724 5,589 3,200 2,610 24,529 3 Oil Seeds 991 1,521 413 1,086 1,660 5,671 4 Spices 94 - 61 - - 155 5 Vegetables 369 - 474 1,119 469 2,432 Utilized 42,044 31,830 31,181 18,294 43,347 166,696 Unallocated 6,929 1,327 1,920 10,176 Excess 3,335 1,398 4,733
Total Farm Lands 38,709 38,759 32,508 16,896 45,267 172,139
Table 4.32 : Wereda wise Area covered by Agricultural Crops in the Project Area
4.17.4.3 Agricultural Crops Production
The agricultural production in the Weredas is dominated by cereals and pulses while spices, oil seeds and vegetables are available in relatively small quantities. Various cereals, namely, teff, maize, sorghum, wheat, barley, millets and oats are grown in the area. The production of crops also includes chickpeas, haricot beans, peas, beans, lentil and vetch. With regard to the production of oilseeds, sesame, nug, linseed, sunflower and rapeseeds are grown on a limited scale. The cultivation of spices (mainly Pepper) is also done on a small scale.
Vegetables are grown for local consumption. Potato, cabbage, onion and garlic are grown in the area.
The estimated annual volume of crop production amounts to 2,192,943 qt and the summary of the estimated volume of crop production is presented in the Table 4.33.

ESIA: Greenfield Derba Cement Project: DMC, Ethiopia
07150 4.80
Production (qt) Sn Major Crops Sululta Wichale Yaya Gulele Mulo Adaberga
Total
1 Cereals 407,437 168,713 330,902 177,514 746,217 1,830,7832 Pulses 45,941 49,976 62,452 57 40,415 198,8413 Oil Seeds 7,081 8,367 1,642 15 16,363 33,4684 Spices 4,500 - 2,781 - - 7,2815 Vegetables 34,033 - 23,259 22,852 42,427 122,570 Total 498,992 227,056 421,036 200,438 845,422 2,192,943
Table 4.33 : Wereda wise Volume of Crop Production
4.17.4.4 Crop Productivity and Price
Peasants in the project area grow more than 28 types of crops of which cereals and pulse account for the majority. All of the five Weredas do not necessarily produce the same types of crops. The common crops grown in all Weredas are teff, which is a staple food crop of the area and for most of the population of the country, wheat and barley. The production of spices, pulses, oil seeds and vegetables is limited.
The price of agricultural products fluctuates over different months of a year. Peasants dispose many of the crops immediately after harvesting to meet their financial requirements and prices are lower at these post harvesting periods. The prices then increase and show significant increment from month to month. The prices furnished here relate to the average marketing price prevailing within the current time period. Table 4.34 presents the yield and price level of the various types of crops grown in the five Weredas.

ESIA: Greenfield Derba Cement Project: DMC, Ethiopia
07150 4.81
Sululta Wichale Yaya Gulele Mulo Adaberga Average Sn Major Crops Productiv
ity (Q/ha.) Unit Price (Birr)
Productivity
(Q/ha.)
Unit Price (Birr)
Productivity (Q/ha.)
Unit Price (Birr)
Productivity (Q/ha.)
Unit Price (Birr)
Productivity
(Q/ha.)
Unit Price (Birr)
Productivity (Q/ha.)
Unit Price (Birr)
1 Teff 8.0 450.0 5.2 450.0 10.5 450.0 9.7 450.0 7.7 480.0 8.2 456.0 2 Maize 15.4 260.0 21.2 260.0 0.5 260.0 33.0 180.0 14.0 192.0 3 Sorghum 15.2 350.0 6.4 350.0 18.9 350.0 10.6 350.0 14.7 190.0 13.2 318.0 4 Wheat 12.0 330.0 7.7 330.0 12.4 330.0 6.0 330.0 28.3 280.0 13.3 320.0 5 Barley 21.9 316.0 11.5 316.0 12.3 316.0 21.9 316.0 27.9 250.0 19.1 302.8 6 Millet 8.0 300.0 1.6 60.0 7 Oats 8.0 250.0 6.8 250.0 0.8 250.0 3.1 150.0 8 Chickpeas 16.2 440.0 11.0 - 13.5 440.0 0.6 440.0 8.7 600.0 10.0 384.0
9 Haricot Bean 8.0 390.0 12.0 390.0 4.0 156.0
10 Peas 8.0 390.0 12.0 390.0 0.1 390.0 8.7 400.0 5.8 314.0 11 Bean 8.0 363.0 4.9 - 10.6 363.0 0.0 363.0 17.5 400.0 8.2 297.8 12 Lentil 12.0 500.0 8.0 - 6.0 500.0 0.0 500.0 8.7 600.0 6.9 420.0 13 Vetch 8.0 290.0 6.4 - 11.6 290.0 0.1 290.0 10.4 320.0 7.3 238.0 14 Sesame 5.5 700.0 4.0 700.0 1.9 280.0 15 Nug 7.0 540.0 3.8 540.0 4.0 540.0 1.0 540.0 10.4 700.0 5.2 572.0 16 Linseed 7.0 536.0 5.6 536.0 4.0 536.0 0.0 536.0 8.7 650.0 5.1 558.8 17 Sunflower 5.0 600.0 3.5 600.0 1.7 240.0 18 Rape Seed 14.0 600.0 4.0 400.0 10.4 500.0 5.7 300.0
19 Red Pepper
37.2 1,176.5 7.4 235.3
20 Bessobila 48.5 13.3 9.0 3.0 11.5 3.3 21 Green
Pepper 47.5 80.0 66.8 3.0 22.9 16.6

ESIA: Greenfield Derba Cement Project: DMC, Ethiopia
07150 4.82
Sululta Wichale Yaya Gulele Mulo Adaberga Average Sn Major Crops Productiv
ity (Q/ha.) Unit Price (Birr)
Productivity
(Q/ha.)
Unit Price (Birr)
Productivity (Q/ha.)
Unit Price (Birr)
Productivity (Q/ha.)
Unit Price (Birr)
Productivity
(Q/ha.)
Unit Price (Birr)
Productivity (Q/ha.)
Unit Price (Birr)
22 Others 82.1 3.0 16.4 0.6 23 Sweet
potato 43.3 - 25.0 116.0 13.7 23.2
24 Potato 88.2 167.3 29.1 - 100.0 167.3 120.0 7.0 67.5 68.3 23 Cabbage 136.1 70.0 59.3 - 0.9 70.0 127.5 188.6 64.8 65.7 26 Onion 77.6 35.0 - 71.1 225.3 29.7 52.1 27 Garlic 26.7 - 198.5 1,273.5 45.0 70.0 54.0 268.7
Table 4.34 : Estimated Crop Productivity and Unit Price

ESIA: Greenfield Derba Cement Project: DMC, Ethiopia
07150 4.83
The annual estimated value of agricultural crops is Birr 672,595,326 with a significant contribution (86.6%) coming from cereals and pulses. Table 4.35 depicts the value of the agricultural produces.
Value (Birr) Sn Major Crops Sululta Wichale Yaya
Gulele Mulo Adaberga
Total (Birr)
1 Cereals 132,158,772 59,665,414 121,364,890 58,511,025 210,551,120 582,251,221 2 Pulses 17,705,520 - 22,539,598 22,055 16,334,400 56,601,573 3 Oil Seeds 3,857,168 4,485,708 889,448 8,064 10,828,350 20,068,738 4 Spices 288,020 - 1,950,437 - - 2,238,457 5 Vegetables 4,670,633 - - 5,062,135 1,702,570 11,435,337 Total 158,680,113 64,151,122 146,744,373 63,603,278 239,416,440 672,595,326
Table 4.35 : Value of the Crops
4.17.4.5 Agro-Forestry
Fruit orchards are limited in the area. Bananas, oranges, papayas, coffee, chat, apples and inset are grown on a relatively small scale.
As in most of the country, eucalyptus is grown on a large scale and is highly preferred due its fast maturing and multipurpose economical benefits. There are around 8,875,000 eucalyptus trees in these Weredas and people generate substantial economic benefits from them.
4.17.5 CONSTRAINTS IN CROP PRODUCTION
Various interrelated reasons are identified to be the causes of low productivity of crops in the area. The various constraints in crop production include.
Insufficient land holdings Lack of improved farm implements Insufficient and uneven distribution of rainfall Inaccessible surface and ground water irrigation Lack of agro-chemicals and fertilizer Lack of improved seeds Weak agricultural extension services Loss of soil fertility Crop diseases and insects Weed infestation Lack of improved seed practices
4.18 LIVESTOCK
4.18.1 LIVESTOCK POPULATION
The main livestock populations found in the five Weredas are cattle, sheep, goats, poultry and equines. The largest type of livestock population consists of oxen, cows, bulls and calves and their presence is vital for undertaking agricultural activities.

ESIA: Greenfield Derba Cement Project: DMC, Ethiopia
07150 4.84
Table 4.36 presents the type and number of livestock population of the Weredas. As presented in Table 2.5 among the five Weredas of the project area the highest livestock holding per family (5.0) is found in Wuchale Wereda and the lowest (2.3) is in Adaberga Wereda. The average livestock holding per family is 3.4.
Sn Livestock Sululta Wichale Yaya Gulele Adaberga Mulo Total
1
Cattle (Oxen, Cows, Bulls, Calves)
180,566 135,092 75,262 116,331 66,852 574,103
2 Sheep 82,130 132,032 48,014 39,702 66,517 368,395 3 Goats 15,070 2,234 15,065 19,145 2,739 54,253
4 Equines (Horse, Donkey, Mule)
37,030 36,729 9,102 27,020 8,114 117,995
5 Poultry (Mainly Chicken)
77,230 149,401 28,458 63,175 45,901 364,165
Total 392,026 455,488 175,901 265,373 190,123 1,478,911
Table 4.36 : Livestock Population of the Weredas The predominant varieties of livestock belong to the indigenous type but lately exogenous varieties are also being introduced. Livestock are raised as an important part of the mixed farming system in the Weredas. Cattle as a dominant livestock group are kept primarily for the production of draft oxen, replacement stock and milk. Sheep and goats are kept as source of cash income and sometimes for meat during holidays and festivals. Other products obtained from livestock include dung used for fuel, skin and hides.
The common characteristic of the indigenous cattle is their low productivity. It takes about 4-5 years for calves to reach maturity with calving intervals of 1.5-2 years. Milk production does not exceed about 1.5 lt/day/cow and average maturity live weight is about 250 kg/head. Sheep and goats have smaller live weight ranging between 25-40 kg/head. Average kidding rate is about 1.5/year, and reproduction rate for sheep does not exceed 1/year.
4.18.1.1 Livestock Feed
Livestock in the five Weredas entirely depend on grazing and browsing in low crop areas and crop residues. Grazing sources and their condition ranges from fair to good. There is no seasonal migration of livestock in the five Weredas of the two Zones.
Based on the current available livestock population and the grazing land the average carrying capacity of the land for the five Weredas indicates that there is relatively higher number of livestock population as compared to the grazing land at present. One possible reason for the large number of livestock especially that of cattle in these Weredas could be directly associated with mixed crop livestock farming system whereby large numbers of cattle/oxen are used for crop cultivation. Greater cultivation of cropland, which necessitated the use of more cattle/oxen for draft power, has been a common feature. This has been because of increase in human settlement over the last few years.
4.18.1.2 Livestock Diseases
The prevalence of livestock diseases is a serious concern in the area of study. The major livestock diseases in terms of economic importance are internal parasites, external parasites and infectious diseases.

ESIA: Greenfield Derba Cement Project: DMC, Ethiopia
07150 4.85
At present, taking the livestock resources into account, the animal health services rendered in the five Weredas are not adequate. In general, veterinary personnel and facilities are inadequate for the livestock population that requires these health services.
4.18.1.3 Livestock Marketing
Livestock and livestock products are marketed in small sized open markets where buyers and sellers bargain on specific items. Animals are usually taken to the market when farmers have surplus to their requirement or when they are in need of cash for home expenditure, such as purchase of agricultural inputs, consumer goods as well as payment of taxes. In addition, farmers, also sell livestock either when prices are attractive or during severe drought and animal disease outbreaks in order to avert and minimize their risk.
4.18.1.4 Constraints to Livestock Raising
The major constraints to livestock in the area include inadequate feed, poor genetic make-up, animal health and diseases, lack of adequate health services, lack of market infrastructure, increased population pressure, lack of finance, and shortage of trained manpower.
4.18.2 APICULTURAL PRODUCTION AND INCOME
Apiculture, i.e., bee keeping is also being practiced in the study area on a small scale. Existence of such off farm activities assists the population in generating additional annual income. The methods of production include both the traditional and the modern system and bee keeping has a good prospect for growth in the future. Honey consumption and the associated price are increasing with time especially in the urban centres of the Wereda and other places. This demand arises from the multipurpose usage of the product including the manufacture of a local drink called Tej. The apicultural production and income is given in Table 4.37.
Quantity and Income of Honey Production Quantity in kg Income in Birr Sn Description
Urban Rural Total Urban Rural Total I Apiculture production 595 23,035 23,630 10,710 345,525 356,2351 Number of Local Beehives 560 11,410 11,970 10,080 171,150 181,2302 Number of Unimproved
Beehives 35 11,625 11,660 630 174,375 175,005
II Average Apiculture Products 3,000 37,460 40,460 54,000 561,900 615,9001 Honey in Kg 2,800 37,110 39,910 50,400 556,650 607,0502 Wax in Kg 200 350 550 3,600 5,250 8,850 Total 3,595 60,495 64,090 64,710 907,425 972,135
Table 4.37 : Quantity and Income from Apiculture Production

ESIA: Greenfield Derba Cement Project: DMC, Ethiopia
07150 4.86
4.19 SOCIO-ECONOMIC SCENARIO OF THE STUDY AREA
4.19.1 BACKGROUND
The population, settlements, social service facilities and infrastructure in the twenty eight PAs falling within the study area of 10 km around the proposed project site and villages of the five Weredas will be partially affected by the realization of the proposed project.
The household level socio-economic baseline survey of the project area has been conducted during August 2007 through random sampling. The overall sample size is 956 households and this represents over 7% of the households in the buffer area. Larger sample size is taken from the quarry, plant and access road sites whereas the sample size is lower in the other places relatively distant from these core areas. The 85.5% of the surveyed household heads are male and the remaining 14.5% are female. The age category of the surveyed household heads ranges from the minimum of 15 to over 65 years and 90% of the surveyed household heads are economically active (having less than 65 years of age).
The findings of the primary survey are presented below.
4.19.2 DEMOGRAPHIC CHARACTERISTICS
4.19.2.1 Population
The total population within the buffer area f 10 km radius around the plant and mining sites is estimated to be about 76,228 of which 49.6% were males and 50.4% were females in the year 2007.
The average family size of 5.5 persons per household for the surveyed households is considerably higher than the national average and slightly smaller than the Wereda average. The details of the population are given in Annex 4.16. The average population density for the buffer area is 153.7 persons/km2 against the Wereda and national population density of 103.4 and 50 persons/km2 respectively. Within the buffer area, population density ranges from 31.6 persons/km2 in Becho Kidane Mihiret to 818.6 persons/km2 in Kerkercha PA (Refer Fig. 4.36).
A total number of 52 births and 23 deaths occurred during the previous year. The corresponding birth, mortality and natural growth rate thus amounts to 5.44%, 2.41% and 3.03% respectively. At the current growth rate, secondary impact zone/ buffer area’s population is expected to reach from 76,228 in 2007 to more than 155,000 by the year 2025.

ESIA: Greenfield Derba Cement Project: DMC, Ethiopia
07150 4.87
Fig. 4.36 : Population Density of the Study Area

ESIA: Greenfield Derba Cement Project: DMC, Ethiopia
07150 4.88
Population Number HHH Number
Sn
Wer
eda
PA
Mal
e
Fem
ale
Tota
l
Mal
e
Fem
ale
Tota
l
Ave
rage
Fa
mily
Siz
e
Popu
latio
n de
nsity
(Pop
/k
m2 )
63,149 64,103 127,252 14,057 2,365 16,422 7.7 101.9
1 Becho Kidane Mehret 804 872 1,676 269 18 287 5.8 31.59
2 Handa Weizero 891 1,611 2,502 514 235 749 3.3 33.62
3 Ada Ginbichu 1,318 1,520 2,838 576 556 1,132 2.7 54.87
4 Gorfo 1,453 866 2,319 350 65 415 5.6 223.57
5 Beku Golba 1,268 1,468 2,736 104 56 160 14.2 435.33
6 Lilo Chebeka 1,392 1,424 2,816 370 97 467 6.0 92.88
7 Derba Gulele Beresa 1,825 2,065 3,890 1,161 107 1,268 3.1 147.46
8
Sululta
Eko Efo Babo 524 430 954 287 253 540 2.1 258.78
TOTAL 9475 10256 19731 3631 1387 5018 3.9
17,761 18,021 35,782 3,178 783 3,961 9.0 101.9
9 Amuma Bebisa Dunburi 1,038 1,214 2,252 286 48 334 7.0 185.44
10 Mulo Fale 800 600 1,400 169 30 199 5.2 196.96
Mulo Wereda
1838 1814 3652 455 78 533 6.9
47,740 43,486 91,226 16,474 3,174 19,648 4.6 91.3
11 Bole Becho 1,370 1,375 2,745 580 155 735 3.7 100.26
12 Becho Faneli 1,360 1,400 2,760 410 110 520 5.3 91.33
13
Wichale
Nono 1,690 1,570 3,260 617 128 745 4.4 56.50
TOTAL 4420 4345 8765 1607 393 2000 4.4
32,967 34,377 67,344 11,224 1,797 13,021 5.2 113.4
14 Arere 529 771 1,300 204 55 259 5.0 92.79
15 Gobolana katila 119 121 240 40 8 48 4.9 500.00
16 Goda Jaba 1,005 905 1,910 317 63 380 5.0 63.43
17 Gyna Sole 3,592 3,338 6,930 437 30 467 14.8 362.64
18 Kuchuna Tengego 983 947 1,930 284 39 323 5.8 305.18
19 Guyamana Kuwat 3,324 2,436 5,760 556 556 1,112 5.2 223.60
20 Sole Gibe 817 573 1,390 242 36 278 5.0 86.01
21 Dede Diftu 987 842 1,829 248 172 420 4.4 122.92
22 Yasa Gode Wereke 1,207 1,105 2,312 457 60 517 4.5 76.86
Yaya Gulele
TOTAL 12563 11038 23601 2785 1019 3804 6.2
56,755 57,470 114,225 19,999 3,511 23,510 4.9 110.3
23 Kerkerecha 2,031 1,830 3,861 390 30 420 15.3 818.57
24 Elu Keteba 1,910 3,570 5,480 399 40 439 12.5 289.03
25 Elu Tosigne 1,699 1,679 3,378 405 118 523 6.5 107.68
26 Dire Medale 130 125 255 40 8 48 4.8 210.70
27 Elu Werebo 746 588 1,334 187 23 210 6.4 113.15
28 Debisa Agasa 2,992 3,179 6,171 853 82 935 6.6 152.03
Adea berga
TOTAL 9508 10971 20479 2274 301 2575 8.0
TOTAL OF ALL PAs 37,804 38,424 76,228 10,752 3,178 13,930 5.6 153.7
TOTAL OF ALL WEREDAS 18,372 17,457 435,829 64,932 1,630 76,562 5.7
Table 4.38 : Population, Family size & Density of the Study Area by PAs & Weredas

ESIA: Greenfield Derba Cement Project: DMC, Ethiopia
07150 4.89
4.19.2.2 Marital Status
95.9% of the household heads were married and the remaining 1.4 and 0.8% were single and widowed respectively. Marriage in the study area could be considered stable with reported divorce cases being less than 1.9%.
Male household heads is the dominants the households by about 77.2% while female headed households constituted only 22.8%. Male to female ratio is nearly 1:1 for the whole buffer area.
4.19.2.3 Religion
Residents of the project area are predominantly followers of the Orthodox Christian Religion (99.9) and only 0.1% are followers of Islam.
4.19.2.4 Ethnicity
According to surveyed results, population of the buffer area is almost entirely of the Oromo ethnic group (97.3%) and Oromiffa is the major, if not the sole, language spoken in the area. The remaining 2.7% of the total households belong to Amhara ethnic group. None of the Project Affected Persons belong to ethnic minority groups.
4.19.3 EDUCATIONAL STATUS OF THE POPULATION
According to findings of the survey results, overall literacy rate is very low for the surveyed population. 67.3% of the total population was illiterate and only the remaining 32.7% were literate. Of this, less than a quarter of the population had formal education of which the majority was only at the primary level.
Literacy rates were also disproportionate between sexes. For instance, while 69.4% of females were illiterate, the figure was 65.2% for males. This figure is very low compared to the Wereda average. Literacy rates were consistently higher for men than women throughout all levels of education.
4.19.4 HOUSING AND SETTLEMENT
On the basis of the sample survey result, there are an estimated 15,081 residential main houses that belong to the 13,930 household heads. The majority of surveyed household heads own only one main house and the remaining household heads have got more than a single main house (1.1 houses per household).
An estimated 32.7% of the households surveyed had a separate guesthouse. The presence of separate houses for kitchen and cattle shed purposes is one indicator of better sanitation practices. In addition to this, people have got houses for other unspecified purposes.
View of the houses in Adero village

ESIA: Greenfield Derba Cement Project: DMC, Ethiopia
07150 4.90
4.19.4.1 Housing Conditions
Traditionally, most of the housings in rural areas are ‘tukuls’ and temporary shelters/structures made of twigs, rugs, mud and roofs covered with grass. A recent development in the housing pattern in the project area is that farmers have moved away from construction of houses with thatched roofs to corrugated iron sheets perhaps due to rise in income. Most of the houses are without partitioned rooms and poorly constructed windows for ventilation and daylight. They are often smoke-filled and dark inside and with earth floors.
There are over 5 persons living in such one-roomed, smoke-filled, earth-floored and unventilated tukuls and shelter-like structures. These unhealthy dwelling houses are favourable environment for the transmission of communicable diseases like pulmonary tuberculosis, ARI, louse-borne diseases (typhus and relapsing fever), skin infections, etc.
4.19.5 AGRICULTURE
4.19.5.1 Average Landholding
Further analyses of the survey results revealed that land is a scarce resource in the project area and accordingly, a total of 956 households had 2418.7 ha of farmland. This translates into an average of 2.58 ha per household.
Both landlessness and inequality in landholding is still a serious problem in the project area. For instance, the size of the maximum landholdings reaches 24.5 ha of farming land whereas the minimum being only 0.125 ha. While the land-poor 36.5% of the households owned only 15.0% and the land-rich 36.6% of the households owned nearly 63.7% of the total farmland available (see Table 4.39).
The majority of landless people gain access to land through some internal arrangements including leasing, share-cropping and other land sharing arrangements at family level. In response to the growing problem of landlessness, parents allot small plots of land from their scarce resource, to their children.
Households Total Landholding Landholding (hectares) Number Percent Hectares Percent
Landless 2 0.002 <= 1 116 12.3 76.1 2.6 1.1 to 2.0 231 24.2 359.8 12.4 2.1 to 3.0 257 26.9 621.6 21.4 3.1 & More 350 36.6 1853.6 63.7 Total 956 100.0 2811.1 100.0
Table 4.39 : Size of Landholding among the Surveyed Households
4.19.5.2 Agricultural System
Agriculture (crop production and livestock rearing) is the sole economic opportunity available to farmers in the project area. Despite some efforts launched recently to introduce improved agriculture, agricultural techniques adopted in the study area were by and large traditional rainfed subsistence farming.

ESIA: Greenfield Derba Cement Project: DMC, Ethiopia
07150 4.91
The land use in the buffer area is dominated by the production of annual crops and followed by grazing land. The proportion of land used for agro-forestry, is comparatively very small. Exact land utilisation pattern as collected from the surveyed households is presented in Table 4.40 and is believed to give a comparable picture for the rest of the project area.
Land Use Total (ha) Average Farming 2418.7 2.58 Grazing 913.8 1.14 Residential 337.4 0.39 Tree 0.58 0.58 Others 11.33 0.6
Table 4.40 : Land Use Pattern in the Buffer Area (in ha) The total area of land utilized for the production of crops is estimated to be 74,228 ha of land exceeding the estimated 55,732 ha of farmland by 18,556 ha or by 133%. The possible reason for this increment is that people use the same area of land more than once during the two different production seasons in a give year. It is also possible that people owning land along rivers could produce more than once using river waters. With respect to crop production, people grow almost sixteen types of crops dominated by cereals.
The average farmland holding of about 2.58 ha per household and is greater than the 1.9 ha per household average for the total Weredas. The major crops of the buffer zones are as shown in Table 4.41. The main crops in the buffer areas are cereals in crop rotation after two or three cereal cultivation periods. The amount of cereal crops is about 87.6% of the area occupied by the individual farms.
Sampled Village Te
ff
Mai
ze
Sorg
hum
Whe
at
Bar
ley
Oat
s
Chi
ckpe
as
Bea
n
Nug
Gar
lic
Oth
ers
Tota
l Becho Dibdbe 1.29 0.03 0.15 0.35 0.01 0.03 0.16 0.2 0.05 0.03 0.01 2.3
Botoro 1.00 0.24 1.26 0.21 0.01 2.7 Gimbchu 1.13 0.50 1.00 - 2.7 Average 1.09 0.35 1.03 0.12 0.0 0.02 0.02 0.01 2.6 % of crop utilization
41.4 13.3 38.9 4.5 0.1 0.7 0.7 0.2 0.1 100.0
Table 4.41 : Areas under Major Crops in the Buffer Area (ha)
The average yield of crops is given in Annex 4.14. The average selling price of crops is given in Annex 4.15.
4.19.5.3 Agro-forestry Practices
There are different kinds of perennial trees (banana, orange, mango, coffee, chat and eucalyptus) under the ownership of the surveyed households and eucalyptus tree is the dominant tree species. However, the estimated volume of production and associated level of income from tree production per surveyed households is only 1,948 birr/ year. The

ESIA: Greenfield Derba Cement Project: DMC, Ethiopia
07150 4.92
estimated volume of production and associated level of income from tree production is estimated and presented in Table 4.42.
Production Sn Type of Trees Number of Trees Unit of
Measurement Quantity
Income in Birr
1 Banana 137,508 kg 112,241 396,6702 Mandarin 102 kg - 2,1863 Orange 12,152 kg 25,198 61,4794 Papaya 131 kg 1,137 4,1535 Avocado 175 kg 58 5836 Mango 146 kg 4,080 5,3917 Coffee 27,641 kg 22,925 395,3448 Chat 1,661 Zurba 3,497 30,6729 Eucalyptus 9,137,118 Nr 1,427,796 7,619,233 Total 9,316,635 1,596,932 8,515,711
Table 4.42 : Estimated Number of Trees and Income On the basis of the survey result, there are several constraints facing tree production within the buffer area and these include:
Shortage or absence of improved seedling variety and nursery. Landslides and cracking caused by difficult topography. Attack from worms, ants, fire ants and other insects. In such places, the area is
marginally appropriate for Eucalyptus trees only. Most of the land area is rocky and not suitable for tree planting Scarcity of land. The awareness of the people towards the importance of tree plantations is very low at
large.
4.19.5.4 Constraints to Crop Production
It was also reported that the sector's productivity has been in a steady downward spiral for decades now. According to some farmers, the problem of agricultural productivity in the area is so severe that produce of the majority of the farmers (80%) is inadequate to support their families throughout the year.
The majority of farmers in the surveyed households perceived the following as the most pressing agricultural problem in the buffer area.
Shortage of finance for the purchase of farming inputs, lack of improved agricultural inputs and these include seeds, fertilizers (UREA and DAP), insecticides and miscellaneous inputs. The reasons accountable for this limitation are mainly higher purchase price as well as transportation cost. Human labour is used in crop production and most of it comes from family members.
During the seasonal peaks, they generally help one another on a non-cash basis while in the mean time seek hired labour. However, shortage of labour is acute especially for the elders and women headed households. Major use of the unskilled labour is accounted for by land preparation, weeding, harvesting and post harvesting operations. Use of traditional farming methods- The predominant technology used by farmers is the
traditional plough drawn by pair of oxen. The farmers use the bullock power mainly for
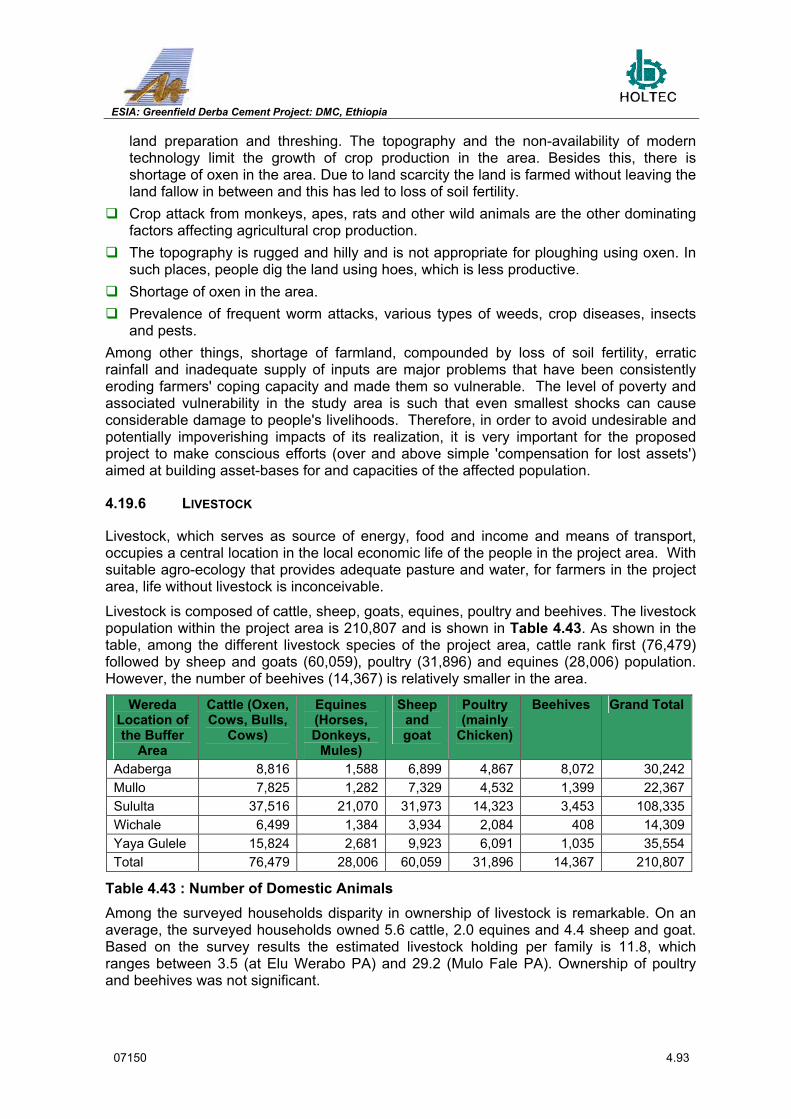
ESIA: Greenfield Derba Cement Project: DMC, Ethiopia
07150 4.93
land preparation and threshing. The topography and the non-availability of modern technology limit the growth of crop production in the area. Besides this, there is shortage of oxen in the area. Due to land scarcity the land is farmed without leaving the land fallow in between and this has led to loss of soil fertility. Crop attack from monkeys, apes, rats and other wild animals are the other dominating
factors affecting agricultural crop production. The topography is rugged and hilly and is not appropriate for ploughing using oxen. In
such places, people dig the land using hoes, which is less productive. Shortage of oxen in the area. Prevalence of frequent worm attacks, various types of weeds, crop diseases, insects
and pests. Among other things, shortage of farmland, compounded by loss of soil fertility, erratic rainfall and inadequate supply of inputs are major problems that have been consistently eroding farmers' coping capacity and made them so vulnerable. The level of poverty and associated vulnerability in the study area is such that even smallest shocks can cause considerable damage to people's livelihoods. Therefore, in order to avoid undesirable and potentially impoverishing impacts of its realization, it is very important for the proposed project to make conscious efforts (over and above simple 'compensation for lost assets') aimed at building asset-bases for and capacities of the affected population.
4.19.6 LIVESTOCK
Livestock, which serves as source of energy, food and income and means of transport, occupies a central location in the local economic life of the people in the project area. With suitable agro-ecology that provides adequate pasture and water, for farmers in the project area, life without livestock is inconceivable.
Livestock is composed of cattle, sheep, goats, equines, poultry and beehives. The livestock population within the project area is 210,807 and is shown in Table 4.43. As shown in the table, among the different livestock species of the project area, cattle rank first (76,479) followed by sheep and goats (60,059), poultry (31,896) and equines (28,006) population. However, the number of beehives (14,367) is relatively smaller in the area.
Wereda Location of the Buffer
Area
Cattle (Oxen, Cows, Bulls,
Cows)
Equines (Horses, Donkeys,
Mules)
Sheep and goat
Poultry (mainly
Chicken)
Beehives Grand Total
Adaberga 8,816 1,588 6,899 4,867 8,072 30,242Mullo 7,825 1,282 7,329 4,532 1,399 22,367Sululta 37,516 21,070 31,973 14,323 3,453 108,335Wichale 6,499 1,384 3,934 2,084 408 14,309Yaya Gulele 15,824 2,681 9,923 6,091 1,035 35,554Total 76,479 28,006 60,059 31,896 14,367 210,807
Table 4.43 : Number of Domestic Animals Among the surveyed households disparity in ownership of livestock is remarkable. On an average, the surveyed households owned 5.6 cattle, 2.0 equines and 4.4 sheep and goat. Based on the survey results the estimated livestock holding per family is 11.8, which ranges between 3.5 (at Elu Werabo PA) and 29.2 (Mulo Fale PA). Ownership of poultry and beehives was not significant.

ESIA: Greenfield Derba Cement Project: DMC, Ethiopia
07150 4.94
The overall livestock density of the project area is 298.6 cattle/ km2. The highest livestock concentration is observed in Dire Medale (854.9 cattle/ km2) with the least in Elu Werebo (62.3 cattle/ km2).
There are many factors that limit the quantity and quality production of domestic animals in the area and the respondents have reported the following constraints:
The major constraints for livestock development in the area include inadequate feed, poor genetic make-up, animal health and diseases, low standard management, lack of market infrastructure, increased population pressure, lack of finance, drought and shortage of trained manpower. On the other hand, the resource base, previous project experience, market outlet etc. are potential aspects that could be exploited for the benefit of livestock development.
The majority of the surveyed households perceived the following as the most pressing livestock problems:
Shortage of animal feed and grazing land. The grazing area is located far from the residential houses requiring more travel time. There are various types of cattle diseases such as Aba-Gorba and Abasenga, sheep
and goat fox, foot-mouth that result mostly in their deaths. The cattle do not get immediate medical treatment due to the shortage of veterinary clinics. There are also various types of worms (Leach, Mice, Black leg, Anthrax and bacterial diseases) that suck their blood as well as flies that attack the cattle. Lack of improved variety of cattle and also lack of awareness towards the importance of
modern cattle raising system. Shortage of drinking water. Difficult topography and lack of access to potential grazing lands has caused frequent
deaths and injuries to cattle. Inaccessibility of the grazing land i.e. roads get frequently damaged by floods prohibiting easy access to cattle. Frequent attack by wild animals.
4.19.7 EMPLOYMENT AND SKILL
4.19.7.1 Primary Occupation
Mixed agriculture (crop production and livestock rearing) is the sole source of employment, and hence, livelihood in the project area. Results of the survey clearly confirmed that not only 98.5% of the heads of households interviewed were farmers, but also 92.5% of them had neither the experience nor the opportunity to work and earn a living outside agriculture. Agriculture is the only source of employment and livelihood and it plays a pivotal role in the local economy.
There are limited types of economic activities taking place by the households. The identified primary occupations of the people include farming, factory employment in the Mugher cement factory, guards and trading activity. The majority of the households comprising of over 98.5% are engaged in the primary occupation of farming whereas the remaining 1.5% are involved in factory employment, guards and trading.
4.19.7.2 Secondary Occupation
An estimated 7.5% of the households have got supplementary activity like carpentry, daily labour, guarding, priest, trading, tailoring, etc. other than their primary occupation. These

ESIA: Greenfield Derba Cement Project: DMC, Ethiopia
07150 4.95
are a source of additional income to the people. The implementation of the project can also bring more type of economic activities to the people located near the project area.
4.19.7.2 Division of Works
Due to the fact that the population is mainly agricultural based, the division of labour relates to the types of activities of the rural communities. Various types of economic activities are performed by family members at different levels of magnitude. All of these activities involve the participation of male and female population of the household heads, children and hired people and is done with all the groups of society.
Ploughing and seed sowing are largely performed by male population with marginal assistance received from child and female labour. In particular, females cover only about 0.5% of the labour requirements of these activities. The types of activities in which all types of the available labour of the family are involved are land preparation, crop harvesting, hoeing/ weeding, threshing/ shelling crops, fodder collection, marketing of agricultural products and conducting of trading activities of any kind. Caring of children, food preparations, marketing of household items, milking of animals and cleaning of livestock sheds are largely the responsibility of the females. In all types of the activities, child labour has an important place.
4.19.8 TYPE OF HUMAN FEED AND ANNUAL CONSUMPTION LEVEL
People in the area like the rest of the country depend mainly on agricultural products for their daily meal. The level of consumption depends on the interaction of the family size and the economic status of the particular family. However, the average consumption level was computed and estimated from the collected sample size. The result shows that the annual per capita consumption level amounts to about 2.5 quintals of crops, one poultry, one sheep or goat, 3 kg of beef, one kg of butter, 5 litre of milk, 1.4 kg of cheese, 3.9 kg of vegetables and 1.3 kg of fruits. The listed types of food consumption contain balanced nutritional contents.
The people were also interviewed whether they are food deficit or not. Accordingly, the majority of the respondents (68%) experience food shortages and the remaining 32% stated that they don’t have food shortages.
4.19.9 ANNUAL HOUSEHOLD INCOME
The major source of employment and income in the project area is mixed farming, i.e. crop production and livestock. However, apart from the heads of the households who are often the breadwinners of the family, other family members also contribute to family income through employment in farming and off-farm activities.
The most important income accounting for over 90% originates from agricultural and related activities mainly from the production of crops and vegetables, perennial crops, domestic animals and its products, agro-forestry products and renting of farming lands. The remaining activities i.e. trading, employment, handicrafts and others represent the remaining income of the people. On the bases of the survey result, the annual per capita income of the people is computed as Birr 12,450.84 (refer Table 4.44).
Income Source Average Annual Per capita Income (Birr/HHH)
%
Crop (Grain and Vegetables) 8,696.75 69.8 Perennial crops 611.32 4.9 Animals 1163.04 9.3
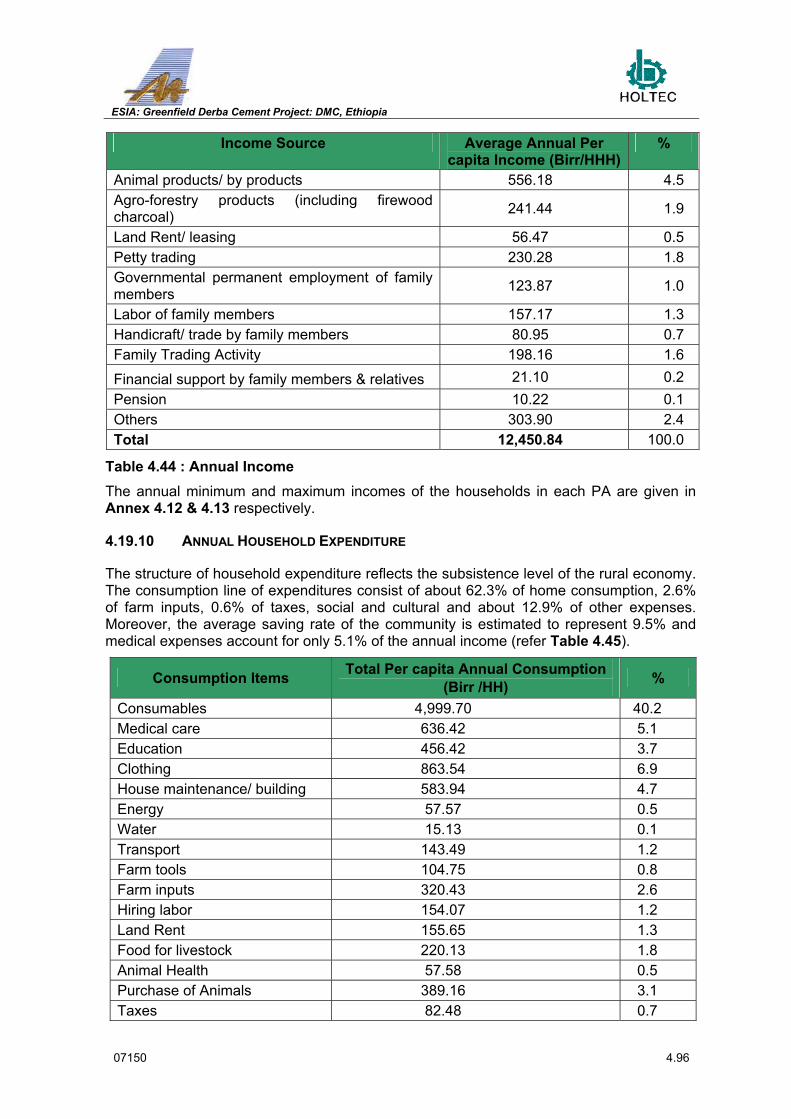
ESIA: Greenfield Derba Cement Project: DMC, Ethiopia
07150 4.96
Income Source Average Annual Per capita Income (Birr/HHH)
%
Animal products/ by products 556.18 4.5 Agro-forestry products (including firewood charcoal) 241.44 1.9
Land Rent/ leasing 56.47 0.5 Petty trading 230.28 1.8 Governmental permanent employment of family members 123.87 1.0
Labor of family members 157.17 1.3 Handicraft/ trade by family members 80.95 0.7 Family Trading Activity 198.16 1.6
Financial support by family members & relatives 21.10 0.2 Pension 10.22 0.1 Others 303.90 2.4 Total 12,450.84 100.0
Table 4.44 : Annual Income The annual minimum and maximum incomes of the households in each PA are given in Annex 4.12 & 4.13 respectively.
4.19.10 ANNUAL HOUSEHOLD EXPENDITURE
The structure of household expenditure reflects the subsistence level of the rural economy. The consumption line of expenditures consist of about 62.3% of home consumption, 2.6% of farm inputs, 0.6% of taxes, social and cultural and about 12.9% of other expenses. Moreover, the average saving rate of the community is estimated to represent 9.5% and medical expenses account for only 5.1% of the annual income (refer Table 4.45).
Consumption Items Total Per capita Annual Consumption (Birr /HH) %
Consumables 4,999.70 40.2 Medical care 636.42 5.1 Education 456.42 3.7 Clothing 863.54 6.9 House maintenance/ building 583.94 4.7 Energy 57.57 0.5 Water 15.13 0.1 Transport 143.49 1.2 Farm tools 104.75 0.8 Farm inputs 320.43 2.6 Hiring labor 154.07 1.2 Land Rent 155.65 1.3 Food for livestock 220.13 1.8 Animal Health 57.58 0.5 Purchase of Animals 389.16 3.1 Taxes 82.48 0.7

ESIA: Greenfield Derba Cement Project: DMC, Ethiopia
07150 4.97
Consumption Items Total Per capita Annual Consumption (Birr /HH) %
Debt Repayment 159.79 1.3 Saving 1187.72 9.5 Social/ Religious Ceremonies 258.82 2.1 Others 1604.04 12.9 Total 12,450.84 100.0
Table 4.45 : Annual Consumption and Saving
4.20 SOCIO-ECONOMIC CHARACTERISTICS OF THE CORE AREA
4.20.1 BACKGROUND
In the previous section global demographic profile of population of the project area based on the Wereda level survey results was presented. As the information from the survey was available only at higher level and it does not also cover key areas of interest, it was found necessary to conduct fresh and thorough survey that is focused on population and settlements that would be affected by the proposed project. Thus, a quantitative household survey was conducted on a carefully selected stratified random sample of 244 households from the project affected villages.
This section describes the social and demographic characteristics of the would-be affected population in more detail.
4.20.2 DEMOGRAPHIC CHARACTERISTICS OF THE HOUSEHOLDS
4.20.2.1 Population
The Plant and Quarry sites are located close to Becho Dibdibe and Gimbchu villages within Becho Kidane Mehret and Handa Weizero PAs respectively (see Fig. 4.35).
Results of the household survey showed that there were a total of 2,027 people living in the 619 households surveyed. Females constitute 62.4% of the total population. Out of the total 244 heads of households interviewed only 12.3% were female-headed households. Proportion of female-headed households here is considerably higher compared to 2.1% average for the Weredas as a whole.
Average family size of 5.3 persons per household for the survey households is slightly lower than the average of 5.7 persons per family for rural households in the Weredas.
Population Household Heads
Sn
Proj
ect
Com
pone
nt
PA
Affe
cted
Vi
llage
Mal
e
Fem
ale
Tota
l
Mal
e
Fem
ale
Tota
l
1 Plant Site Becho Kidane Mehret Dibdibe 88 90 178 21 2 23 2 Quarry Site Handa Weizero Botero 290 272 562 81 18 99 3 Access Road Ada Gimbchu Gimbchu 257 308 565 112 10 122
Total 635 670 1,305 214 30 244 Table 4.46 : Population of the Project Area

ESIA: Greenfield Derba Cement Project: DMC, Ethiopia
07150 4.98
4.20.2.2 Marital Status
98% of the households surveyed were married and the remaining 0.8% and 1.2% were divorced and widowed respectively.
4.20.2.3 Religion
Residents of the project area are predominantly followers of the Orthodox Christian Religion (98.4%).
4.20.2.3 Ethnicity
According to surveyed results, population of the project affected area is almost entirely of the Oromo ethnic group (97.5%) and Oromiffa is the major, if not the sole, language spoken in the area. The remaining 2.5% of the total households belong to Amhara ethnic group. None of the Project Affected Persons belong to ethnic minority groups.
4.20.2.4 Education
According to findings of the survey results, the overall literacy rate is very low for the surveyed population and 81.5% of the people were illiterate and only 18.5% were literate. Of this, less than a quarter of the population had formal education of which the majority was only at primary level.
Literacy rates were also disproportionate between sexes. For instance, while 88.5% of females were illiterate, the figure was 69.8% for males. This figure is very low compared to the Wereda average. Literacy rates were consistently higher for men than women throughout all levels of education.
4.20.2.5 Housing and Settlement
On the basis of the sample survey result, there are an estimated 2,007 residential main houses that belong to the 619 household heads. The majority of surveyed household heads own only one main house and the remaining household heads have more than a single main house.
The people usually construct separate house entirely reserved for the guests coming from distant places. These people could be relatives, friends or having any type of relationship. An estimated 20% of the households had separate guesthouses. The presence of separate houses for kitchen and cattle shed purposes is one indicator of better sanitation practices. In addition to this, people have got houses for other unspecified purposes.
Traditionally, most of the houses in the project area were round-shaped wooden houses plastered with mud and roofs covered with grass. A recent development in the housing pattern in the project area is that farmers have moved away from construction of houses with thatched roofs to corrugated iron sheets perhaps due to rise in income.
4.20.3 AGRICULTURE
4.20.3.1 Average Landholding
Further analyses of the survey results revealed that land is very scarce resource in the project area. According to the survey results, a total of 244 households had 680.1ha (refer Table 4.47) of farmland. This translates into an average of 2.8ha per household. However,

ESIA: Greenfield Derba Cement Project: DMC, Ethiopia
07150 4.99
this figure does not include landless farmers and those households who share their land with their family members. The majority of landless people gain access to land through some internal arrangements including leasing, share-cropping and other land sharing arrangements at family level. In response to the growing problem of landlessness, parents had allotted small plots of land from their scarce resource, to their children. Both landlessness and inequality in landholding is still a serious problem in the project area. For instance, while the land-poor 21.7% of the households owned only 15% and the land-rich 43.9% of the households owned nearly 62.3% of the total farmland available.
Households Total Landholding Landholding (ha) Number % Hectares %
Landless <= 1 15 6.1 7.0 1.0 1.1 to 2.0 38 15.6 55.3 8.1 2.1 to 3.0 84 34.4 194.3 28.6 3.1 & More 107 43.9 423.6 62.3 Total 244 680.1
Table 4.47 : Size of Landholding among the Surveyed Households 4.20.3.2 Agriculture System The land use in the core area is dominated by the production of annual crops and followed by grazing. The proportion of land used for agro-forestry, is comparatively very small. Exact land utilisation pattern as collected from the surveyed households is presented in Table 4.48 and is believed to give a comparable picture for the rest of the Project Area.
Sub PA Farming (ha)
Grazing (ha)
Residential (ha)
Tree & Others (ha)
Total (ha)
Becho Dibdbe 2.2 0.5 0.3 0.1 2.5 Botoro 2.5 0.5 0.2 0.0 2.7 Gimbchu 2.6 0.7 0.0 0.3 2.9 % 2.5 0.6 0.1 0.2 2.8
Table 4.48 : Land Use Pattern in the Core Area The project area is mainly cultivated by means of traditional rainfed subsistence farming. The average farmland holding of about 2.5 ha per household and it is higher than the Weredas (1.9 ha). The major crops of the core area are as shown in Table 4.49. The main crops in the core areas are cereals in crop rotation after two or three cereal cultivation periods. The amount of perennial crops is about 98.2% of the area occupied by the individual farms.

ESIA: Greenfield Derba Cement Project: DMC, Ethiopia
07150 4.100
Sampled Village
Teff (ha)
Maize (ha)
Sorghum (ha)
Wheat (ha)
Barley (ha)
Oats (ha)
Chickpeas (ha)
Bean (ha)
Nug (ha)
Garlic (ha)
Others (ha)
Total (ha)
Becho Dibdbe 1.29 0.03 0.15 0.35 0.01 0.03 0.16 0.2 0.05 0.03 0.01 2.3
Botoro 1.00 0.24 1.26 0.21 0.01 2.7
Gimbchu 1.13 0.50 1.00 - 2.7
Average 1.09 0.35 1.03 0.12 0.0 0.02 0.02 0.01 2.6
% of crop utilization
41.4 13.3 38.9 4.5 0.1 0.7 0.7 0.2 0.1 100.0
Table 4.49 : Areas under Major Crops in the Core Area It goes without saying that agriculture (crop production and livestock rearing) is the sole economic opportunity available to farmers in the project area. Despite some efforts launched recently to introduce irrigation, agricultural techniques adopted in the study area were by and large traditional.
The majority of farmers in the surveyed households perceived shortage of farmland as one of the most pressing agricultural problem in the proposed project area. Among other things, shortage of farmland, compounded by loss of soil fertility, erratic rainfall and inadequate supply of inputs are major problems that have been consistently eroding farmers' coping capacity and made them so vulnerable. The level of poverty and associated vulnerability in the study area is such that even smallest disturbances can cause considerable damage to people's livelihoods. Therefore, the proposed project could help in building up asset base in the area to address the prevalent problems of:
Shortage of finance for the purchase of farming inputs, absence of improved inputs and these include seeds, fertilizers (UREA and DAP), insecticides and miscellaneous inputs. The reasons accountable for this limitation is mainly higher purchase price as well as transportation cost. Shortage of labour- Human labour is used in crop production. Most of the labour comes
from family. However, during the seasonal peaks, they temporarily help one another generally on a non-cash basis while in the mean time seek hired labour. Shortage of labour is acute especially for elder and women headed households provided that there is an active family member in it. Major use of the unskilled labour is accounted for by land preparation, weeding, harvesting and post harvesting operations. Use of traditional farming methods- The predominant technology used by farmers is the
traditional plough drawn by a pair of oxen. The farmers use the bullock power mainly for land preparation and threshing. The topography and the non-availability of modern technology limit the growth of crop production in the area. Besides this, there is shortage of oxen in the area. Due to land scarcity the land is farmed without any gap to leave the land fallow and this leads to loss of soil fertility. Crop attack from monkeys, apes, rats and other wild animals are the other dominating
factors affecting agricultural crop production.
4.20.3.3 Agro-forestry Practices There are different kinds of perennial trees (banana, orange, mango, coffee, chat and eucalyptus trees) under the ownership of the surveyed households and eucalyptus tree is

ESIA: Greenfield Derba Cement Project: DMC, Ethiopia
07150 4.101
the dominant tree species. However, the estimated volume of production and associated level of income from tree production per surveyed households is only 178 Birr/ year.
On the basis of the survey results, there are constraints facing agro-forestry practices and these include scarcity of land and shortage or absence of improved seedling variety and nursery.
4.20.4 LIVESTOCK
Livestock, which serves as source of energy, food and income and means of transport, occupies an important place in the local economic life of the people in the project area. With suitable agro-ecology that provides adequate pasture and water for farmers in the project area, life without livestock is inconceivable. As discussed above, among the surveyed households farming techniques are traditional and disparity in ownership of livestock is remarkable. On the average, the surveyed households owned 5.6 cattle, 1.0 equines and 4.5 sheep and goats. Based on the survey results the estimated livestock holding per family is 11.2. Ownership of poultry and beehives was not significant.
4.20.5 TYPE OF HUMAN FEED AND ANNUAL CONSUMPTION LEVEL
People in the core zone like the rest of the country depend mainly on agricultural products for their daily meal. The level of consumption depends on the interaction of the family size and the economic status of the particular family. However, the average consumption level was computed and estimated from the collected sample size level. The result shows that the annual per capita consumption level amounts to about 2 quintals of crops, one poultry, one sheep and goat, 7 kg of beef, 1.8 kg of butter, 6 litre of milk, 2.3 kg of cheese, 12 kg of vegetables and 5 kg of fruits. This type of food consumption contains balanced nutritional contents. During the primary survey, 61% of the people responded that they experience food shortages.
4.20.6 DIVISION OF WORKS
The population of the area is mainly agricultural based. Ploughing and seed sowing are largely performed by the male population with marginal assistance received from child and female labour. Land preparation, crop harvesting, hoeing/ weeding, threshing/ shelling crops, fodder collection, marketing of agricultural products and trading activities are carried out by all members of the family. Caring for children, food preparation, milking of animals and cleaning of livestock sheds are largely the responsibility of the female. In all types of the activities, child labour input has a great place of importance.
4.20.7 ANNUAL HOUSEHOLD INCOME
The major source of employment and income in the project area is mixed farming, i.e. crop production and livestock. However, apart from the heads of the households who are often the breadwinners of the family, other family members also contribute to family income through employment in farming and off-farm activities.
The most important part of income accounting to over 88.5% originates from agricultural and related activities mainly from the production of crops and vegetables, perennial crops, domestic animals and its products, agro-forestry products and renting of farming lands. The remaining activities, i.e., trading, employment, handicrafts and others account for the remaining income of the people. On the bases of the survey result, the annual per capita income of the people is computed as Birr 10,287.62. (Refer Table 4.50).

ESIA: Greenfield Derba Cement Project: DMC, Ethiopia
07150 4.102
Income Source Average Annual Per capita Income
(Birr/HH) % Crops (Grains & Vegetables) 8,093.32 78.7 Perennial crops 177.72 1.7 Animals 649.28 6.3 Animal products/ by products 184.96 1.8 Agro-forestry products (including firewood charcoal) 325.36 3.2
Land Rent/ leasing 4.57 0.4 Petty trading 33.32 0.3 Governmental permanent employment of family members 0.38 0.0
Labor of family members 75.34 0.7 Handicraft/ trade of family members 17.70 0.2 Trading Activity 1.89 0.0 Financial support by family members and relatives 1.23 0.0
Pension Others 686.54 6.7
HH : Household
Table 4.50 : Annual Income
4.20.8 ANNUAL HOUSEHOLD EXPENDITURE
Structure of household expenditure reflects the subsistence level of the rural economy. The consumption line of expenditures consist of about 50.5% of home consumption, 1.8% of farm inputs, 0.6% of taxes, social and cultural expenses and about 2.8% of other expenses. Moreover, the average saving rate of the community is estimated to represent 7.6% and medical expenses account to only 3.6% of the annual income (refer Table 4.51).
Consumption Items Total Per capita Annual Consumption (Birr /HH) %
Consumables 5,190.58 50.5 Medical care 370.89 3.6 Education 75.06 0.7 Clothing 959.43 9.3 House maintenance/ building 796.97 7.7 Energy 53.35 0.5 Water 13.96 0.1 Transport 68.52 0.7 Farm tools 92.24 0.9 Farm inputs 189.96 1.8 Hiring labor 146.50 1.4

ESIA: Greenfield Derba Cement Project: DMC, Ethiopia
07150 4.103
Consumption Items Total Per capita Annual Consumption (Birr /HH) %
Land Rent 69.84 0.7 Food livestock 111.89 1.1 Animal Health 21.06 0.2 Buying Animals 465.76 4.5 Taxes 59.42 0.6 Debt Repayment 236.50 2.3 Saving 777.33 7.6 Social/ Religious Ceremonies 300.62 2.9 Others 287.74 2.8 Total 10,287.62 100.0
HH : Household
Table 4.51 : Annual Consumption and Savings
4.21 POVERTY PROFILE OF THE STUDY AREA
4.21.1 INCOME/ CONSUMPTION DIMENSION OF POVERTY 4.21.1.1 Consumption/ Expenditure The results of the household survey reveal that the per capita consumption expenditure of the household and the population in the project area is estimated to be Birr 9214.37 and Birr 1722.77 respectively. According to the 2002 Development and Poverty Profile of Ethiopia the real per capita consumption expenditure of North and West Shoa zone, the area where the project is located, amounts to Birr 1087.2. The figure revealed by the primary survey is higher than the figure recorded for North and West Shoa Zones. This may partly be attributed to the time gap and price used in the calculation of the data.
In accordance with the 2002 Development and Poverty Profile of Ethiopia, the proportion of people in absolute poverty is about 31.7% in North and West Shoa Zones. From this it can be inferred that a substantial portion of the households in the study area live in absolute poverty. This is by far better than the National and Oromiya region absolute poverty figures (39.9%and 44.2%).
As indicated by the survey a significant portion of the expenditure in incurred on food. Food expenditure on average accounted for 56.4% of the household budget. The other expenses make up 43.6% of the household budget. Within non-food category, clothing and house maintenance accounted for greater share of total expenditure (10.5 and 8.7%). Medical care and education budget contributed 4.0 and 0.8 % of the total household budget respectively. 4.21.1.2 Income The major source of employment and income in the project area is mixed farming, i.e. crop production and livestock. However, apart from the heads of the households who are often the breadwinners of the family, other family members also contribute to family income through employment in farming and off-farm activities.
The most important income accounting to over 88.5% originates from agricultural and related activities mainly from the production of cereals and vegetables, perennial crops,

ESIA: Greenfield Derba Cement Project: DMC, Ethiopia
07150 4.104
domestic animals and its products, agro-forestry products and renting of farming lands. The remaining activities, i.e., trading, employment, handicrafts and others represent the remaining income of the people. On the bases of the survey result, the annual per capita income of the house hold and population is computed to be Birr 10,287.62 and 1923.4 respectively. 4.21.2 NON-INCOME/ CONSUMPTION DIMENSION OF POVERTY 4.21.2.1 Education Level According to findings of the socio-economic survey results, overall literacy rate in the project area is very low, about 81.5% of the surveyed household heads are illiterate whereas the remaining 18.5% are literate. Of this, less than a quarter of the household heads had formal education of which the majority was only till primary level.
Literacy rates are also disproportionate between sexes. For instance, while 88.5% of females are illiterate, the figure is 69.8% for males. This figure is very low compared to the Wereda average (31%). Literacy rates are consistently higher for men than women throughout all levels of education.
Of the total household heads in the project area, 3.5%, 4.0%, 7.6%, and 1.5% and1.5% have attained Lower Primary (1-4), Primary (5-8), and Secondary (9-10), Technical school and above grade 10 level education respectively.
4.21.2.2 Demography Females constitute 51.3% of the total population. Out of the total surveyed household heads (244) only 12.3% were female-headed households.
Average family size of the project area is about 5.3. This is classified as larger family size, which mostly indicates the character of a poor family. About 98% of the households surveyed were married and the remaining 0.8% and 1.2% were divorced and widowed respectively.
4.21.2.3 Farm Assets The main source of livelihood in the project area is agriculture. Under such circumstances, therefore, land ownership in the project area becomes an important determinant of welfare. According to the survey results, the total interviewed households had 680.1ha of farmland. An average size of land of the surveyed household is found to be 2.8 ha. The majority, nearly 90.9% of the surveyed household own more than 2 ha of land. The entire surveyed households in the project area own land. In general the size of individual land holding of the farmer in the study area is better than the region and country. This implies that the farmers in the study area are likely to have better welfare status. Another important input in the agricultural production in the Ethiopian context is the availability of traction power. This is mainly done with the use of oxen in the country. Thus, a household owning oxen would be in a better position in cultivating the land. The results of the socio-economic survey indicate, on an average the surveyed households own 5.6 cattle. Majority of the surveyed households, i.e., about 95% the farmers in the project area own cattle. 4.21.2.4 Housing and Sanitation Status of shelter is one of the indicators of well being of society. The average number of rooms per household in the study area is 1.2. This is very low for an average family size of 5.3 people per household.

ESIA: Greenfield Derba Cement Project: DMC, Ethiopia
07150 4.105
The sanitation situation of the area is very poor. An overwhelming majority (97.5%) of the surveyed households in the study area use open fields while only the remaining 2.5% use dry pit latrines.
4.22 PUBLIC HEALTH IN THE STUDY AREA
A detailed Public Health survey has been carried out in the project area during the period Aug-Sept 07 to assess the existing health situation within the various Weredas in and around the project area.
4.22.1 METHODOLOGY
The following study methods were utilised.
Literature Review: Before the study relevant documents, official reports, etc. were reviewed. In addition, documents related to National policies and strategies, annual reports of the Ministry of Health (MoH), etc. were also assessed and reviewed thoroughly.
Questionnaires: Prior to the launching of this study, a questionnaire was designed to collect data at the Wereda-level governmental offices, particularly from Wereda Health Offices and individual health facilities.
4.22.2 PREVAILING HEALTH SITUATION IN THE PROJECT AREA
TEN TOP DISEASES AND ENDEMIC DISEASES
In general, the health status of the community especially children below five years and pregnant women can be described as poor. Due to deficient sanitation, and crowded and low cost housing, communicable diseases are prevalent in the project area (both rural and urban). The situation is related, either directly or indirectly, to a lack of adequate and safe drinking water and sanitation, low living standards and poor nutrition.
Prevalent communicable diseases in the project areas, as diagnosed by the existing different health facilities, mainly hospitals and health centres, are as follows.
Upper acute respiratory tract infections (URTI) Intestinal parasites (all types) Diarrhoea (all types), including bacillary dysentery (bloody diarrhoea) Typhoid fever Infection of the skin and subcutaneous tissue HIV/ AIDS
These diseases are not only among the top-ten diseases diagnosed in the health facilities, but most of them are also the leading causes of hospital admissions and hospital deaths.
The ten top diseases reported by the health institutions in the five Weredas are presented in Table 4.52. However, the prevalence of the disease differs from one Wereda to the other.
Adaberga Wereda Wuchale Wereda Type of Diseases No. % Type of Diseases No. % 1 Pneumonia 1020 17.3 1 Pneumonia 4655 35.7
2 URTI / Other Respiratory Infection
1001 17.0 2 Diarrhea 1794 13.7

ESIA: Greenfield Derba Cement Project: DMC, Ethiopia
07150 4.106
Adaberga Wereda Wuchale Wereda Type of Diseases No. % Type of Diseases No. %
3 Skin and subcutaneous tissue infection
869 14.7 3 Intestinal Parasites 1357 10.4
4 Intestinal Parasites 632 10.1 4 Rheumatism 1044 8.05 Gastric 561 9.5 5 Infection Wound 900 7.06 Injuries due to fights 539 9.0 6 Gastric 898 6.97 Typhoid 513 8.7 7 Tonsillitis 680 5.28 EPTB 448 7.9 8 Injuries 636 4.99 UTI 308 5.2 9 Eye Diseases 612 4.7
10 Anemia 464 3.5Mulo Wereda Yaya Gullele Wereda
1 Injuries due to fights 806 27.2 1 URTI and other Respiratory Infection
792 24.8
2 URTI/ other Respiratory Infection
783 26.5 2 Injuries due to fights 484 15.1
3 Diarrhea 369 12.5 3 Intestinal Parasites 457 14.34 Intestinal parasites 228 7.7 4 Diarrhea 408 12.85 Eye Disease 171 5.8 5 Gastric 343 10.76 Gastric 165 5.6 6 Tooth disease 274 8.6 Type of Diseases No. % Type of Diseases No. % 7 Tonsillitis 147 5.0 7 Arthritis 259 8.1
8 Rheumatic Pain 112 3.8 8 Skin and subcutaneous tissue Infection
178 5.6
9 Tooth disease 95 3.210 Common cold 80 2.7
Sululta Wereda 1 Pneumonia 2007 24.0
2 URTI/ other Respiratory Infection
1531 18.3
3 Gastric 1531 18.34 Intestinal Parasite 617 7.45 Bacillary Dysentery (CDD) 521 6.26 Conjunctivitis 467 5.67 Anaemia 467 5.6
8 Skin and subcutaneous tissue infection
426 5.1
9 Tonsillitis 451 5.010 Rheumatism 397 4.5Source: Wereda Health Office of each Wereda
Table 4.52 : Ten Top Diseases Diagnosed in the Five Weredas in the Study Area

ESIA: Greenfield Derba Cement Project: DMC, Ethiopia
07150 4.107
4.22.1.1 HIV/ AIDS HIV/ AIDS is one of the fastest growing diseases in Ethiopia. The number of persons living with HIV/ AIDS in the country (Ethiopia) and Oromiya region is estimated to be 1,320,000 and 318,000 respectively in the year 2005. (“AIDS in Ethiopia”, Sixth Report Fact sheets). The same sources indicate that the prevalence rate of HIV/ AIDS stood at 3.5 and 2.4% in the country and Oromiya region respectively.
The available information also shows the prevalence of the disease in the five Weredas of the project area. However, the blood test result figures may not be representative and can show only the overall picture of the project area because these figures represent only those patients who visited the Health Centre and some volunteers. The blood test results obtained from the project area are presented in Table 4.53.
Positive Results Sn Wereda Total Blood Samples Examined in 2006 No. %
1 Ada Berga 753 245 33.0 2 Mulu 368 5 1.4 3 Yaya Gulele 596 18 3.0 4 Sululta 2,035
Source: Wereda Health Offices
Table 4.53 : Prevalence of HIV/ AIDS & Results of Blood Tests in the Study Area The Weredas in the project area are carrying out the following activities to control and prevent the spread of STDs particularly HIV/ AIDS:
Provision of education and creating awareness Early Diagnosis and Treatment of STD Condom distribution Provision of VCT services
4.22.1.2 Malaria Due to the elevation of the area, malaria is not a major health problem in the project area and not reported around the plant site (on the plateau). 44% of the Peasant Associations located within the 10 km radius are identified as malaria free area.
However, in the Muger valley malaria is a threat to the population farming and residing in the area. In year 2006 about 621 malaria cases were identified in Yaya Gulele Wereda and few additional cases were also reported from Ada Berga Wereda.
4.22.1.3 Malnutrition Food insecurity and malnutrition are chronic health problems in the project area. Malnutrition weakens resistance to infection and makes recovery from infection more difficult. Malnutrition afflicts the poorest sections of the community and children who are especially at risk. Malnutrition related diseases, (such as Kwashiorkor, Marasmus, vitamin A and mineral deficiencies) are one of the major continuing health problems in Ethiopia. Extensive studies conducted by the Ethiopian Nutrition Institute (ENI) found underweight rates between 40-60% of children <5 years of age. The MoH statistical report shows that malnutrition is one of the ten leading national health problems and is the seventh leading cause of hospital deaths.
Malnutrition together with poor environmental health conditions (poor water quality and inadequate sanitation) further exacerbates the already poor health conditions within the

ESIA: Greenfield Derba Cement Project: DMC, Ethiopia
07150 4.108
population, pre-disposing the population to a range of serious epidemic diseases such as typhus, relapsing fever and other house-borne diseases.
4.22.1.4 Diseases of Women and Children The survey attempted to assess the common diseases related to women and children prevalent in the area. The most common diseases affecting the women (age 15-49 years) include the following: STDs and HIV/ AIDS Malnutrition Intestinal parasites Anaemia (due to iron deficiency) Diseases associated with complication of pregnancy and child delivery Pneumonia Urinary tract Infection (UTI)
The most common diseases affecting children (< 5 years of age) include the following:
Measles Pert sis (Whooping cough) Diarrhea Malnutrition (Kwashiorkor, Marasmus, etc) Intestinal parasites (e.g. Amoebiasis, Giardiasis, Ascriasis, Hookworm, etc) Pneumonia Eye diseases Tonsillitis
4.22.1.5 Harmful Practices of the Communities The findings of the survey revealed the existence of harmful practices in the project area, which is mainly attributed to the lack of awareness and wrong belief of the people. Some of these harmful practices prevalent in the project area are:
Cauterization of body (with very hot metal rod/ knife), incising the skin and letting out blood as a treatment for pyrexia, headache, chest pain, etc Scrubbing of tonsils and tonsillectomy for children when they develop diarrhoea Uvuloectomy, i.e., cutting of the uvulae of children as a treatment for fever and,
diarrhoea Rape and pre-marital sexual practices Early marriage and abduction Massage of pregnant women Using local medicine and tattooing Extramarital sex and unsafe sexual practices Female circumcision and genital mutilation
4.22.1.6 Problem of Health Services in the Study Area The results of the survey identified and outlined the major constraints prevailing in the health facilities of the project areas. These include:

ESIA: Greenfield Derba Cement Project: DMC, Ethiopia
07150 4.109
Shortage, high attrition rate and uneven distribution of health professionals (in quality and quantity). Shortage / lack of buildings and rooms for medical procedures (e.g. laboratory and X-
ray rooms, drug stores, offices, etc.). Shortage of drugs, equipment, laboratory reagents and chemicals, X-ray films and
other medical supplies. Lack of adequate budget for drugs. Lack/ shortage of Vehicles/ Ambulance
4.23 EXISTING HEALTH FACILITIES AND PROFESSIONALS
4.23.1 HEALTH SERVICES
The Health Bureau is responsible for providing health care in the region and operates a comprehensive health care network within the limits of the available resources. In addition to the Health Bureau, some NGOs and Other Governmental Agencies (OGAs) are involved in the Region.
The general policy of the Ministry of Health proposes the following basic health services to be installed in each Zone in order to allow minimum health services to be provided to the population.
Central referral hospital Regional hospitals Rural hospitals Health care centres
The health professionals working in different health facilities of the project area are mandated to carry out routinely preventive, curative and rehabilitative health services to the community they are assigned to serve according to the information gathered from the Wereda Health Offices. These services comprise all of the following specific types of health care for the community:
1. Medical Services: For outpatients and inpatients, medical and physical examination, diagnosis and treatment of the diagnosed ailments, Advice/ therapy, etc.
2. Family Health Services: The family health services include antenatal and postnatal care for the women during their pregnancies and deliveries, Family planning services, which include advice and convincing the couples and administration of different contraceptive methods and treatment of sick children (under 5 years of age) and child growth monitoring services.
3. Expanded Programme for Immunisation (EPI) 4. Laboratory Diagnostic and Radiography (X-ray) 5. Communicable Diseases Prevention and Control Services: Treatment and control
measures of diseases such as HIV/ AIDS /STDs, tuberculosis, leprosy, trachoma (prevention of blindness).
6. Information, Education and Communication (IEC): The services are rendered regularly to create community awareness on the prevention and control of diseases, childcare and child nutrition, personal and domestic hygiene and Sanitation, family planning, etc. Malaria and Other Vector-Borne Diseases Control Services

ESIA: Greenfield Derba Cement Project: DMC, Ethiopia
07150 4.110
7. Environmental Health and Sanitation Services: In these services, communities are given health education and training, demonstration on the construction and proper use of pit latrines, ventilated-improved-pit (VIP) latrines, proper disposal of refuse, protection of springs for safe water supply with community participation in the protection work, and inspection of public eating and drinking establishments, like hotels, bars, tea-shops, abattoirs, meat-shops, etc. The workers in such establishments are also given medical examination for any infectious and communicable disease; and those found to have the disease are treated immediately.
Besides the above listed activities, the health professionals in the Wereda provide health education in relation to HIV/ AIDS, STDs, communicable diseases, environmental, sanitation, personal hygiene and family health in school and prisons. They also give some other health program/activities related to TT vaccination program in school.
Pills, injections and condoms are commonly promoted contraceptive methods in the health units of the project area. The contraceptive prevalence rate for Yaya Gulele, Mulu, and Sululta Wereda estimated to be 17%, 40.4%, and 26% respectively.
4.23.2 HEALTH FACILITIES
Currently available health facilities in the project areas are depicted in Table 4.54. As shown, there is no hospital in all of the five-surveyed Weredas. The result of the survey indicates that 6 Health Centres, 20 clinics, 27 health posts, 19 pharmacies and 5 drug stores exist in the five Weredas of the study area.
Wereda in the project area Description Ada
Berga Wuchale Mulu Yaya
Gullele Sululta
Total
Health Facilities: Population 126,832 95,756 39,417 75,464 140,694 478,163
Health Centre 2 1 1 1 1 6 -Health Station (Clinic)(Govt. & NGO) -Private Clinic
2 6
2 3
- 1
2 2
2 8 12
Health Post 5 3 5 2 12 27 -Pharmacy (Govt) -Pharmacy (Private)
1 6
1 2
- -
- -
1 8
2 16
-Drug Stores (Shops) (Govt) -Drug Store (Private)
1 -
- 1
1 1 -
1 4 1
Ratios Population to Health Centre Ratio (Target: 1 Health Centre to serve 25,000)
63416 95756 39417 75464 140694 79693
Population to Health post Ratio (Target: 1 Health Post to serve 5,000 people)
25366 31919 7883 37732 11725 17709
Health Service Coverage Ratio 100% 52.2% 24.1% 63% 68%
Source: Wereda Health Office and primary survey Table 4.54 : Existing Health Facilities in Weredas within the Study Area
According to the information obtained from Wereda offices, the total population that is served by these existing health facilities and drug-outlets in the five Weredas is estimated to be 478,163. The result of the ratios of population to health centre is indicated in Table

ESIA: Greenfield Derba Cement Project: DMC, Ethiopia
07150 4.111
4.55. The available health facilities are far below the standards stipulated by the Ministry of Health (MOH). This shows that the health facilities in the project area are poor.
In terms of health facilities, Sululta and Ada Berga Wereda have relatively better health service than the other Weredas in the study area and Mulu Wereda registered the lowest health service coverage.
4.23.3 HEALTH PROFESSIONALS
The total number of currently available health professionals and the ratios of population to health professional in the five Weredas of the project area are given in Table 4.55 below. The number of health facilities and workers is unevenly distributed among the Weredas in the project area. For instance, the Sululta Wereda has relatively larger number of health workers and facilities than the other Weredas.
Except the Ada Berga Wereda, all the other Weredas in the project area have no physicians (Medical Doctor). As indicated in the table the ratios of population to doctor, nurses and sanitarians in the five Weredas of the study area is also far less than the standard set by the Ministry of Health (MOH). This figure indicates the serious shortage of health workers in the project area. This implies that much remains to be done to attain the standard set by the MOH.
Zones in the project area Description Ada
Berga Wuchale Mulu Yaya
Gullele Sululta Total
Population 126,832 95,756 39,417 75,464 140,694 478,163 Health Facilities: Physicians (all types) 1 - 1 Health Officers 1 1 1 1 4 Nurses (all types) 13 11 5 8 17 54 Sanitarians 1 1 1 1 2 6 Lab. Technicians Pharmacists Technicians 2 1 1 2 2 8 Health Assistants 6 2 2 2 6 18 Community Health Workers 85 18 103 Health Extension program workers 26 19 7 16 26 94
Ratios Population to Doctor Ratio (Target: 1 Doctor to serve 10,000 population)
63,416 95,756 39,417 75,464 140,694 95,633
Population to Nurse Ratio (Target: 1 Nurse to serve 5,000 Population)
9,756 8,705 7,833 9,433 8,276 8,854
Population to Sanitarian Ratio 126,832 95,756 39,417 75,464 70,347 79,693
Source: Wereda Health Office (2007) and Own calculation Note: The calculated result of population to Doctor Ratio include Health officers
Table 4.55: Currently Available Health Professionals in the Study Area
4.23.4 PROPOSED HEALTH FACILITIES

ESIA: Greenfield Derba Cement Project: DMC, Ethiopia
07150 4.112
The Weredas in the project area have planned to build various health facilities so as to improve health coverage and the quality of health service in the project area. As depicted in Table 4.56 a total of 14 different types of health facilities will be constructed within the next five years. It is expected that these health facilities will serve an estimated 317,776 people living in and around the project area. This will significantly improve the health coverage and quality of health services in the project area.
Type of Health Facility Health Centre
Upgrade Clinic to Health Centre
Upgrade Health Centre to Hospital
Health Post Sn
Wereda
No. No. No. No. 1 Yaya Gulele 1 1 2 Wuchale 1 1 2 3 Mulu 2 4 Sululuta 1 1 4 Total 3 1 1 9
Table 4.56 : Health Facilities Planned in the next 2-5 years in the Study Area