4.1.1 Federal Debt Held by the Public - Front page · 4.1.1 Federal Debt Held by the Public. Note:...
155
0 30 60 90 120 150 0 30 60 90 120 150 1940 1950 1960 1970 1980 1990 2000 2010 2020 Source: CBO, Haver Analytics As Of: 2016 Percent of GDP 4.1.1 Federal Debt Held by the Public Note: Data for fiscal years. Years after 2016 are projected. Percent of GDP CBO Baseline Projection
Transcript of 4.1.1 Federal Debt Held by the Public - Front page · 4.1.1 Federal Debt Held by the Public. Note:...

0
30
60
90
120
150
0
30
60
90
120
150
1940 1950 1960 1970 1980 1990 2000 2010 2020
Source: CBO, Haver Analytics
As Of: 2016Percent of GDP4.1.1 Federal Debt Held by the Public
Note: Data for fiscal years. Years after 2016 are projected.
Percent of GDP
CBO Baseline Projection

Percent As Of: 31-Oct-20174.1.2 10-Year Treasury Yields
Source: U.S. Department of the Treasury
-2
-1
0
1
2
3
4
5
-2
-1
0
1
2
3
4
5
2009 2010 2011 2012 2013 2014 2015 2016 2017
Percent
Treasury Notes
Treasury Inflation-Protected Securities

Percent As Of: 31-Oct-20174.1.3 2-Year Treasury Yields
Source: U.S. Department of the Treasury
0.00
0.25
0.50
0.75
1.00
1.25
1.50
1.75
0.00
0.25
0.50
0.75
1.00
1.25
1.50
1.75
2009 2010 2011 2012 2013 2014 2015 2016 2017
Percent

0
50
100
150
200
250
300
0
50
100
150
200
250
300
2005 2007 2009 2011 2013 2015 2017
Merrill Lynch Option Volatility Estimate
(MOVE) Index
1994-PresentMOVE Average
4.1.4 Fixed Income Implied VolatilityBasis Points Basis Points
Source: Bloomberg, L.P.
As Of: 31-Oct-2017
Note: Implied volatility is calculated using a yield curve-weighted index of the normalized implied volatility on 1-month Treasury options.

-1
0
1
2
3
4
5
-1
0
1
2
3
4
5
2015Q1
2015Q2
2015Q3
2015Q4
2016Q1
2016Q2
2016Q3
2016Q4
2017Q1
2017Q2
2017Q3
4.2.1 Advanced Economies Real GDP GrowthPercent PercentAs Of: 2017 Q3
Source: Eurostat, CAO, BEA, Haver Analytics
Note: Data represents seasonally adjusted quarter-over-quarter annualized real GDP growth rates.
United KingdomJapan
Euro Area
United States

-4
-2
0
2
4
6
8
10
-4
-2
0
2
4
6
8
10
2000 2004 2008 2012 2016 2020
Source: IMF, Haver Analytics
As Of: 2016Percent4.2.2 Real GDP Growth
Note: Year-over-year percent change.Data after 2016 are projected.
Percent
Advanced Economies
EmergingEconomies

-6
-4
-2
0
2
4
6
-6
-4
-2
0
2
4
6
2002 2005 2008 2011 2014 2017 2020
Source: IMF, Haver Analytics
As Of: 2016Percent4.2.3 Euro Area Real GDP Growth
Note: Year-over-year percent change. Data after 2016 are projected.
Percent
SpainFranceEuro AreaItalyGermany

-8
0
8
16
24
32
40
-4
0
4
8
12
16
20
2010 2011 2012 2013 2014 2015 2016 2017
Source: Bloomberg, L.P.
As Of: 31-Oct-2017Percent4.2.4 European 10-Year Yields
Percent
Greece (right axis)Portugal (left axis)Spain (left axis)Italy (left axis)United Kingdom (left axis)Germany (left axis)

-18
-12
-6
0
6
12
-18
-12
-6
0
6
12
2014Q1
2014Q3
2015Q1
2015Q3
2016Q1
2016Q3
2017Q1
2017Q3
4.2.5 Contributions to Japanese GDP GrowthPercent Percent
Source: Cabinet Office of Japan, Haver Analytics
As Of: 2017 Q3
Private DemandPublic Demand
GDP
Net ExportsInventories
Note: Data represents seasonally adjusted quarter-over-quarter annualized real GDP growth rates.

-3
-2
-1
0
1
2
3
-3
-2
-1
0
1
2
3
1998 2001 2004 2007 2010 2013 2016
4.2.6 Japanese Consumer Price InflationPercent Percent
Source: Bank of Japan, Haver Analytics
As Of: Sep-2017
Note: Data represents year-over-year percent change. CPI is adjusted for the consumption tax increase that took effect in April 2014.

0
10
20
30
40
50
0
10
20
30
40
50
A.1 European Non-Performing Loan RatiosPercent Percent
Source: European Banking Authority
As Of: Jun-2017
Note: Ratio of non-performing loans and advances to total gross loans and advances. Weighted averages by country.
Weighted Average

0
3
6
9
12
15
18
0
3
6
9
12
15
18
2000 2003 2006 2009 2012 2015
4.2.7 Chinese Real GDP GrowthPercent Percent
Source: China National Bureau of Statistics, Haver Analytics
As Of: 2016
Note: Year-over-year percent change.

Percent As Of: 20164.2.8 Chinese Manufacturing and Services Growth
Source: China National Bureau of Statistics, Haver Analytics
5
8
11
14
17
5
8
11
14
17
2000 2003 2006 2009 2012 2015
Percent
Manufacturing
Services
Note: Year-over-year percent change.

As Of: 31-Oct-20174.2.9 Chinese Equity Market (CSI 300 Index)
Source: Capital IQ
1000
2000
3000
4000
5000
6000
1000
2000
3000
4000
5000
6000
2010 2011 2012 2013 2014 2015 2016 2017
Index Index

Percent As Of: Oct-20174.2.10 Chinese Credit Growth
Source: The People’s Bank of China, Haver Analytics
0
10
20
30
40
50
0
10
20
30
40
50
2010 2011 2012 2013 2014 2015 2016 2017
Total Social Financing
Percent
Note: Year-over-year monthly change. Total credit is defined as the sum of total social financing (TSF) and local government bond issuance. TSF refers to the total volume of financing provided by the financial system to the real economy.
+ Local Gov’t Bond Issuance

0
40
80
120
160
200
240
0
40
80
120
160
200
240
2008 2009 2010 2011 2012 2013 2014 2015 2016 2017
4.2.11 Credit to the Chinese Nonfinancial Private Sector Percent of GDP Percent of GDPAs Of: 2017 Q1
Source: China National Bureau of Statistics, BIS, Haver Analytics Note: Rolling 4-quarter sum of GDP.

-300
-100
100
300
500
-300
-100
100
300
500
2006 2008 2010 2012 2014 2016
Net Flows
Portfolio InflowsBank Inflows
Foreign Direct Investment
4.2.12 Gross Foreign Investor Capital Inflows to EMEsBillions of US$ Billions of US$
Source: IMF, Haver Analytics
As Of: 2017 Q2

0
100
200
300
400
500
600
700
0
100
200
300
400
500
600
700
2005 2007 2009 2011 2013 2015 2017
4.2.13 Emerging Market Gross Global Bond IssuanceBillions of US$ Billions of US$
Source: Dealogic
As Of: 31-Oct-2017
Note: Bonds have maturities greater than one year and have been internationally marketed or placed. “ Public” includes issuance by municipal and state-owned enterprises.
PrivatePublic
Sovereign
YTD

0
200
400
600
800
1000
0
200
400
600
800
1000
2008 2010 2012 2014 2016Source: JP Morgan,Haver Analytics
As Of: 31-Oct-2017Basis Points4.2.14 Emerging Market Bond Spreads
Note: JP Morgan EMBI+ Sovereign Spreads indices for each region.
Basis Points
Latin AmericaEuropeAsia

-6
-3
0
3
6
9
12
-6
-3
0
3
6
9
12
1998 2001 2004 2007 2010 2013 2016
4.2.15 Change in State and Local Government Tax RevenuesPercent Percent
Source: Census Bureau
Note: Data represents year-over-year change. Revenue measures includes revenues from property, individual income, corporate income, and sales taxes. Gray bars signify NBER recessions.
As Of: 2017 Q2

-20
-15
-10
-5
0
5
10
15
-20
-15
-10
-5
0
5
10
15
2007 2009 2011 2013 2015 2017
Source: ICI, Haver Analytics
As Of: Sep-2017Billions of US$ Billions of US$4.2.16 Long-Term Mutual Fund Flows: Municipal Bonds

4.2.17 Municipal Bond Spreads
Source: Thomson Reuters MMD, Haver Analytics
-200
0
200
400
600
-200
0
200
400
600
2005 2007 2009 2011 2013 2015 2017
Basis Points Basis PointsAs Of: 31-Oct-2017
Note: Spreads between municipal and Treasury securities of comparable maturities.
10-Year AAA GO
10-Year BBB GO30-Year BBB GO
30-Year AAA GO

Billions of US$
0
100
200
300
400
500
600
0
100
200
300
400
500
600
2005 2007 2009 2011 2013 2015 2017YTD
New CapitalRefunding
4.2.18 Municipal Bond IssuanceBillions of US$
Source: Thomson Reuters, SIFMA
As Of: Oct-2017
Note: Excludes maturities of 13 months or less and private placements.

25
30
35
40
45
50
16
18
20
22
24
26
28
1980 1985 1990 1995 2000 2005 2010 2015Source: Federal Reserve, Haver Analytics
As Of: 2017 Q2Percent4.3.1 Debt Ratios for Nonfinancial Corporations
Note: Gray bars signify NBER recessions.
Percent
Debt to GDP (right axis)
Debt to Total Assets (left axis)

0
1
2
3
4
5
6
7
0
1
2
3
4
5
6
7
1980 1985 1990 1995 2000 2005 2010 2015
4.3.2 Liquid Assets to Assets for Nonfinancial CorporationsPercent Percent
Source: Federal Reserve, Haver Analytics
Note: Liquid assets includes foreign deposits, checkable deposits and currency, time and savings deposits, money market fund shares, security repurchase agreements, debt securities, and mutual fund shares.
As Of: 2017 Q2
-100
-50
0
50
100
-100
-50
0
50
100
2000 2003 2006 2009 2012 2015Source: SLOOS, Haver Analytics
As Of: Oct-2017Net Percentage4.3.3 Bank Business Lending Standards and Demand
Note: Data includes firms with annual sales of $50 million or more over the last 3 months. Net percentage balance of responses. Gray bars signify NBER recessions.
Net Percentage
Reporting Stronger Demand from Large and
Medium-Sized Firms
Reporting Tighter Standards for Large and
Medium-Sized Firms

0
1
2
3
4
0
1
2
3
4
2000 2003 2006 2009 2012 2015
Source: FDIC, Haver Analytics
As Of: 2017 Q2Percent4.3.4 Noncurrent Commercial and Industrial Loans
Note: Percent of total C&I loans. Gray bars signify NBER recessions.
Percent

0
3
6
9
12
15
18
0
3
6
9
12
15
18
2001 2003 2005 2007 2009 2011 2013 2015 2017
4.3.5 Rolling 12-Month Speculative-Grade Default RatePercent PercentAs Of: Oct-2017
Source: Moody’s Investors Service
Note: Issuer-weighted default rate. “Speculative-grade” refers to non-investment grade instruments.
BondsLoans

Trillions of US$
0.0
0.4
0.8
1.2
1.6
2.0
0.0
0.4
0.8
1.2
1.6
2.0
2005 2007 2009 2011 2013 2015 2017YTD
Investment GradeHigh-Yield
4.3.6 Corporate Bond IssuanceTrillions of US$
Source: Thomson Reuters, SIFMA
As Of: Oct-2017
Note: Includes all non-convertible corporate debt, MTNs, and Yankee bonds, but excludes all issues with maturities of 1 year or less and CDs.

0
200
400
600
800
1000
0
100
200
300
400
2010 2011 2012 2013 2014 2015 2016 2017
4.3.7 U.S. Cash Corporate Credit Spreads
Source: Bank of America Merrill Lynch, Federal Reserve, S&P LCD
As Of: 31-Oct-2017
Leveraged Loans (right axis)High-Yield (right axis)Investment Grade (left axis)
Basis Points Basis Points
Note: Secondary market spreads. Investment grade and high-yield data represent option-adjusted spreads. Dotted lines represent 1997-present median.

0
20
40
60
80
100
0
20
40
60
80
100
1997 2001 2005 2009 2013 2017
4.3.8 Distressed RatiosPercent Percent
Source: S&P LCD, Merrill Lynch
Note: S&P LSTA Index Distress Ratio depicts the percentage of performing loans trading below 80. Merrill Lynch High-Yield Index Distress Ratio depicts the percentage of performing high-yield bonds with yields over Treasuries of 1,000 or more basis points. The high-yield index uses data from the Merrill Lynch High-Yield Index from Jan-1997 through Jul-2017 and data from the S&P U.S. High-Yield Corporate Bond Index from Aug-2017 to present.
As Of: Oct-2017
High-Yield Index Distress RatioS&P LSTA Index Distress Ratio

0
20
40
60
80
100
120
140
0
20
40
60
80
100
120
140
2001 2005 2009 2013 2017
4.3.9 CLO IssuanceBillions of US$ Billions of US$
Source: S&P LCD
As Of: Oct-2017
YTD

4.3.10 Leveraged Loan Primary Market by Investor Type
Source: S&P LCD
0
10
20
30
40
50
60
70
0
10
20
30
40
50
60
70
2005 2007 2009 2011 2013 2015
Percent Percent
Finance & Security Companies
As Of: 2017 Q3
CLOs
Insurance CompaniesLoan Mutual Funds Hedge Funds
Banks

0
25
50
75
100
125
150
0
25
50
75
100
125
150
1992 1996 2000 2004 2008 2012 2016
Source: BEA, Federal Reserve, Haver Analytics
As Of: 2017 Q2Percent
4.4.1 Household Debt as a Percent of Disposable Personal Income
Note: Other Household Credit includes debts of both households and nonprofits.
Percent
Other Household CreditConsumer CreditMortgages

0
200
400
600
800
1000
1200
1400
0
200
400
600
800
1000
1200
1400
2003 2006 2009 2012 2015Source: FRBNY Consumer Credit Panel/Equifax, Haver Analytics
As Of: 2017 Q3Billions of US$4.4.2 Components of Consumer Credit
Note: Gray bar signifies NBER recession.
Billions of US$
Credit Card Debt
Auto Loans
Student Loans
Other HouseholdDebt

9
10
11
12
13
14
9
10
11
12
13
14
1980 1986 1992 1998 2004 2010 2016
Source: Federal Reserve,Haver Analytics
As Of: 2017 Q2Percent4.4.3 Household Debt Service Ratio
Note: Ratio of debt-service payments to disposable personal income. Seasonally adjusted. Gray bars signify NBER recessions.
Percent

30
40
50
60
70
30
40
50
60
70
1990 1994 1998 2002 2006 2010 2014
1990-Present Average
4.4.4 Owners’ Equity as Share of Household Real EstatePercent Percent
Source: Federal Reserve, Haver Analytics
Note: Gray bars signify NBER recessions.
As Of: 2017 Q2

0
3
6
9
12
15
0
3
6
9
12
15
2003 2005 2007 2009 2011 2013 2015 2017
Source: FRBNY Consumer CreditPanel/Equifax, Haver Analytics
As Of: 2017 Q3Percent4.4.5 Share of Household Debt by Delinquency Status
Note: Severely derogatory loans are loans for which there are reports of a repossession, charge off to bad debt, or foreclosure.
Percent
Severely Derogatory120+ Days Late90 Days Late60 Days Late30 Days Late

Index As Of: Aug-20174.5.1 House Prices by Census Region
Source: FHFA, Haver Analytics
50
100
150
200
250
300
350
50
100
150
200
250
300
350
1991 1995 1999 2003 2007 2011 2015
Index
MountainPacificWest South CentralSouth AtlanticWest North CentralTotal U.S.New EnglandEast South CentralMiddle AtlanticEast North Central
Note: Purchase-only price index. Jan-1991 = 100.

0
2
4
6
8
10
12
0
200
400
600
800
1000
1200
1992 1996 2000 2004 2008 2012 2016
30-Year Mortgage Rate (right axis)
4.5.2 Mortgage Originations and RatesBillions of US$ Percent
Source: Mortgage Bankers Association, Freddie Mac Primary Mortgage Market Survey
As Of: 2017 Q3
Refinance (left axis)Purchase (left axis)
Note: Originations represent all 1-4 family homes. Originations calculated as 4-quarter moving averages. Mortgage rates calculated as quarterly averages.

0
1
2
3
4
5
6
0
1
2
3
4
5
6
2000 2003 2006 2009 2012 2015Source: Mortgage Bankers Association, Haver Analytics
As Of: 2017 Q3Percent4.5.3 Mortgage Delinquency and Foreclosure
Note: Percent of all mortgages.
Percent
MortgageForeclosure
InventoryMortgage Payments90+ Days Past Due

0
5
10
15
20
25
30
0
150
300
450
600
750
900
2010 2011 2012 2013 2014 2015 2016 2017
Value of Negative Equity in Residential Mortgages
(left axis)
Percent of Residential
Mortgages with Negative Equity
(right axis)
4.5.4 Mortgages with Negative EquityBillions of US$ Percent
Source: CoreLogic
As Of: 2017 Q2

0
20
40
60
80
100
0
20
40
60
80
100
2000 2002 2004 2006 2008 2010 2012 2014 2016
4.5.5 Purchase Origination Volume by Credit ScorePercent of Originations Percent of Originations
Source: McDash, FHFA calculations
As Of: 2016
Note: Includes first lien purchases only.
<600
600-659
660-699
700-719
720-759
>760

0
20
40
60
80
100
0
20
40
60
80
100
2000 2003 2006 2009 2012 2015
4.5.6 Mortgage Originations by ProductPercent of Originations Percent of Originations
Source: Inside Mortgage Finance
As Of: 2017 Q3
FHA / VA
GSE
Private Portfolio and Securitized

0.0
0.5
1.0
1.5
2.0
2.5
3.0
3.5
0.0
0.5
1.0
1.5
2.0
2.5
3.0
3.5
2002 2005 2008 2011 2014 2017
4.5.7 RMBS IssuanceTrillions of US$ Trillions of US$
Source: Fannie Mae, Freddie Mac, Ginnie Mae, Bloomberg, L.P., Thomson Reuters, SIFMA
As Of: Oct-2017
Non-AgencyAgency
YTD

0
2
4
6
8
10
0
2
4
6
8
10
2011 2012 2013 2014 2015 2016 2017
4.5.8 Mortgage Servicing MarketTrillions of US$ Trillions of US$
Source: Inside Mortgage Finance
As Of: 2017 Q3
NonbankBank
Note: Data covers top 25 servicers in each quarter.

40
60
80
100
120
140
160
40
60
80
100
120
140
160
2008 2010 2012 2014 2016
4.5.9 Commercial Property Price IndicesIndex Index
Source: Real Capital Analytics
National
Note: Jan-2008 = 100.
Major Markets
As Of: Oct-2017

0
1
2
3
4
0
1
2
3
4
2000 2003 2006 2009 2012 2015
4.5.10 CRE Loans by Institution Trillions of US$ Trillions of US$As Of: 2017 Q2
Source: Federal Reserve, Haver Analytics
Government AgenciesCMBS Issuers and REITsInsurers
Banks

-100
-75
-50
-25
0
25
50
75
100
-100
-75
-50
-25
0
25
50
75
100
2000 2003 2006 2009 2012 2015
4.5.11 Percent of Banks Tightening Loan StandardsNet Percentage Net PercentageAs Of: Oct-2017
All CRE Loans
Source: Federal Reserve, Haver Analytics
Other CRE TypesConstr./Land Dev.Multifamily
Net % Banks Reporting Stronger
Demand

0
50
100
150
200
250
0
50
100
150
200
250
2001 2003 2005 2007 2009 2011 2013 2015 2017YTD
4.5.12 CMBS IssuanceBillions of US$ Billions of US$
Source: Inside Mortgage Finance
As Of: 2017 Q3
AgencyNon-Agency

4.5.13 CMBS Senior Debt SpreadsBasis Points Basis Points
Source: J.P. Morgan
As Of: 27-Oct-2017
Note: Spreads are 10-year Swaps to Senior AAA CMBS.
0
50
100
150
200
0
50
100
150
200
2012 2013 2014 2015 2016 2017

0
100
200
300
400
500
600
2
4
6
8
10
12
1995 1998 2001 2004 2007 2010 2013 2016
B.1 CRE Capitalization Rates and SpreadsPercent Basis Points
Source: CoStar Group
Aggregate CRE Cap Rate
(left axis)
CRE Cap Rate Spread to 10-Year Treasury
(right axis)
As Of: 2017 Q2
Note: Dotted lines represent 1995-present average.

0
2
4
6
8
0
2
4
6
8
2002 2004 2006 2008 2010 2012 2014 2016
B.2 CRE Loan Levels to GDPPercent Percent
Source: FDIC, BEA, Haver Analytics
As Of: 2017 Q3
Construction and Land Development
Multifamily
Nonfarm Nonresidential
Note: Loans held at FDIC-insured commercial banks.

90
100
110
120
130
140
90
100
110
120
130
140
1998 2001 2004 2007 2010 2013 2016
Source: Federal Reserve, Haver Analytics
As Of: Oct-2017Index4.6.1 Nominal U.S. Dollar Trade-Weighted Index
Note: Nominal U.S. Dollar Trade-Weighted Index is a weighted average of the foreign exchange value of the U.S. dollar against the currencies of a broad group of major U.S. trading partners.
Index

50
70
90
110
130
150
50
70
90
110
130
150
2008 2010 2012 2014 2016
Source: Federal Reserve, Haver Analytics
As Of: 31-Oct-2017Index4.6.2 U.S. Dollar Performance
Note: 1-Jan-2008 = 100. EM is a weighted average of the FX values of the dollar against a subset of currencies in the broad index that do not circulate widely outside the country of issue.
Index
Vs. EuroBroad Dollar IndexVs. EMVs. Yen

-60
-40
-20
0
20
40
-60
-40
-20
0
20
40
4.6.3 Change in U.S. Dollar Exchange RatesPercent Percent
Source: Wall Street Journal, Haver Analytics
As Of: 31-Oct-2017
Year-over-Year ChangeChange Since Mid-2014

Change from31-Oct-2016 to 31-Oct-2017
Annual growth rate from 31-Oct-2012 to
31-Oct-2017Major EconomiesU.S. (S&P) 21.1% 12.8%Euro (Euro Stoxx) 20.9% 9.9%Japan (Nikkei) 26.3% 19.8%U.K. (FTSE) 7.7% 5.3%Selected EuropeGermany (DAX) 24.0% 12.7%France (CAC) 22.0% 9.9%Italy (FTSE MIB) 33.1% 8.0%Spain (IBEX) 15.1% 6.1%Emerging MarketsMSCI Emerging Market Index 23.3% 2.3%Brazil (Bovespa) 14.5% 5.4%Russia (MICEX) 3.8% 7.7%India (Sensex) 18.9% 12.4%China (Shanghai SE) 9.4% 10.4%Hong Kong (Hang Seng) 23.2% 5.5%South Korea (KOSPI) 25.7% 5.7%
4.7.1 Returns in Selected Equities Indices
Source: Capital IQ

1.0
1.5
2.0
2.5
3.0
3.5
10
15
20
25
30
2007 2009 2011 2013 2015 2017
4.7.2 S&P 500 Key RatiosRatio Ratio
Source: Bloomberg, L.P.
P/B Ratio (right axis)
Trailing P/E Ratio (left axis)
As Of: 31-Oct-2017
Note: Dotted lines represent Sep 1997-present median.

0
20
40
60
80
100
0
20
40
60
80
100
2007 2009 2011 2013 2015 2017
4.7.3 S&P 500 VolatilityIndex Index
Source: Capital IQ
As Of: 31-Oct-2017
Note: In Sep 2003, CBOE revised the methodology to calculate VIX.
Oct 1997 -Present Average
VIX

0
25
50
75
100
125
150
175
200
0
25
50
75
100
125
150
175
200
2008 2010 2012 2014 2016Source: Energy Information Administration, S&P, Haver Analytics
As Of: 31-Oct-2017Index4.8.1 Commodities
Note: 02-Jan-2008 = 100.
Index
Agriculture (S&P GSCI Agricultural Spot Index)Industrial Metals (S&P GSCI Industrial Metals Spot Index)Crude Oil (WTI)Natural Gas

0.0
0.5
1.0
1.5
2.0
2.5
0.0
0.5
1.0
1.5
2.0
2.5
2001 2004 2007 2010 2013 2016
4.9.1 Commercial Paper OutstandingTrillions of US$ Trillions of US$As Of: 25-Oct-2017
Domestic FinancialDomestic NonfinancialForeign Financial
Asset-Backed
OtherForeign Nonfinancial
Source: Federal ReserveNote: Domestic includes CP issued in the U.S. by entities with foreign parents.

0.0
0.3
0.6
0.9
1.2
1.5
0.0
0.3
0.6
0.9
1.2
1.5
Jan:15 Jul:15 Jan:16 Jul:16 Jan:17 Jul:17
4.9.2 Commercial Paper Interest RatesPercent PercentAs Of: 31-Oct-2017
90-Day AA-Rated ABCP90-Day AA-Rated Financial90-Day AA-Rated NonfinancialOvernight AA-Rated ABCPOvernight AA-Rated FinancialOvernight AA-Rated Nonfinancial
Source: Federal Reserve Bank of St. Louis

0
1
2
3
4
5
0
1
2
3
4
5
2000 2003 2006 2009 2012 2015
4.9.3 Primary Dealer Repo AgreementsTrillions of US$ Trillions of US$As Of: 25-Oct-2017
Source: FRBNY
Overnight/ContinuingTerm

1.0
1.2
1.4
1.6
1.8
2.0
1.0
1.2
1.4
1.6
1.8
2.0
2011 2012 2013 2014 2015 2016 2017
4.9.4 Value of the Tri-Party Repo MarketTrillions of US$ Trillions of US$
Source: FRBNY, Haver Analytics
As Of: Oct-2017

0.0
0.5
1.0
1.5
2.0
2.5
3.0
0.0
0.5
1.0
1.5
2.0
2.5
3.0
2011 2012 2013 2014 2015 2016 2017
4.9.5 Collateral in the Tri-Party Repo MarketTrillions of US$ Trillions of US$
Source: FRBNY, Haver Analytics
As Of: Oct-2017
Note: Other includes CDOs, international securities, money markets, municipal debt, and whole loans.
U.S. Treasury StripsAgency MBSAgency Debentures and Strips
U.S. Treasuries excluding StripsCorporatesABSPrivate Label CMOs
Equities
OtherAgency CMOs

0
1
2
3
4
5
0
1
2
3
4
5
2008 2010 2012 2014 2016
4.9.6 Value of Securities on LoanTrillions of US$ Trillions of US$
Source: Markit Group Limited
Global Market (including U.S.)
U.S. Market
As Of: 31-Oct-2017
Note: Data is based on a survey of agent-based lenders.

9
10
11
12
13
0
300
600
900
1200
1500
Oct 9, 2015 Nov 10, 2015 Dec 31, 2015
4.9.7 Securities on Loan Against Cash and Noncash CollateralBillions of US$ PercentAs Of: 31-Dec-2015
Cash Collateral (left axis)Noncash Collateral (left axis) Percent of Total Assets
Available for Lending(right axis)
Source: OFR/Federal Reserve/SEC Securities Lending Data Collection Pilot

4.9.8 Securities on Loan by Owner Type
Source: OFR/Federal Reserve/SEC Securities Lending Data Collection Pilot
Investment Firms ($174)
Pension Funds and
Endowments($332)
Governmental Entities ($327)
Insurance Companies
($36)
Other($134)Banks and
Broker-Dealers ($16)
Note: All figures in billions of US$. Averages of data collected on three reporting dates. Other includes securities owners not identified by pilot participants.
As Of: 31-Dec-2015

4.9.9 Securities on Loan by Asset Class
Source: OFR/Federal Reserve/SEC Securities Lending Data Collection Pilot, Markit Group Limited
U.S. Corporate Bonds($62)
U.S. Treasury and AgencySecurities
($302)
U.S. Equities($315)
ForeignSovereign and Supranational
Securities($121)
Foreign Corporate Bonds($17)
Foreign Equities ($156)
Note: All figures in billions of US$. Averages of data collected on three reporting dates. Not Available includes securities that could not be classified.
As Of: 31-Dec-2015
Not Available($46)

4.9.10 Securities Lending Cash Collateral Reinvestment
Money Market Funds(9.3%)
Repo(36.6%)
Money Market Securities(20.1%)
Cash Delivered to Securities
Lender (8.6%)
Liquidity Funds (6.0%)
Short-Term Investment Funds
(6.8%)
Note: Averages of data collected on three reporting dates. Other includes private structured debt, corporate bonds, sovereign bonds, and agency securities.
As Of: 31-Dec-2015
Other(12.6%)
Source: OFR/Federal Reserve/SEC Securities Lending Data Collection Pilot

4.10.1 Normalized Futures Prices
Source: Bloomberg, L.P.
0.2
0.4
0.6
0.8
1.0
1.2
1.4
1.6
0.2
0.4
0.6
0.8
1.0
1.2
1.4
1.6
Jan:14 Jul:14 Jan:15 Jul:15 Jan:16 Jul:16 Jan:17 Jul:17
Index IndexAs Of: 31-Oct-2017
U.S. DollarE-mini S&P 50010-Year Treasury FuturesS&P Commodity Index
Note: 2-Jan-2014 = 1.0.

4.10.2 Market Volatility Indices
Source: Bloomberg, L.P.
0
10
20
30
40
50
60
70
80
0
3
6
9
12
15
Jan:14 Jul:14 Jan:15 Jul:15 Jan:16 Jul:16 Jan:17 Jul:17
Index IndexAs Of: 31-Oct-2017
Treasury VIX (left axis)VIX (right axis)Crude Oil VIX (right axis)

4.10.3 Normalized Futures Exchange Volume
Source: CFTC
0.8
1.0
1.2
1.4
1.6
0.8
1.0
1.2
1.4
1.6
2010 2011 2012 2013 2014 2015 2016
Index IndexAs Of: 2016
New York Mercantile ExchangeICE Futures U.S.Commodity Exchange Inc.Chicago Mercantile ExchangeChicago Board of Trade

4.10.4 Normalized Futures Exchange Open Interest
Source: CFTC
0.6
0.8
1.0
1.2
1.4
1.6
1.8
2.0
0.6
0.8
1.0
1.2
1.4
1.6
1.8
2.0
2010 2011 2012 2013 2014 2015 2016
Index IndexAs Of: 2016
New York Mercantile ExchangeICE Futures U.S.Commodity Exchange Inc.Chicago Mercantile ExchangeChicago Board of Trade

4.10.5 Normalized Futures Exchange Number of Products
Source: CFTC
0.6
0.8
1.0
1.2
1.4
1.6
1.8
2.0
0.6
0.8
1.0
1.2
1.4
1.6
1.8
2.0
2010 2011 2012 2013 2014 2015 2016
Index IndexAs Of: 2016
New York Mercantile ExchangeICE Futures U.S.Commodity Exchange Inc.Chicago Mercantile ExchangeChicago Board of Trade

4.10.6 Automation in Futures Markets
Source: CFTC
40
50
60
70
80
40
50
60
70
80
2012 2013 2014 2015 2016
Percent PercentAs Of: 2016
New York Mercantile ExchangeCommodity Exchange Inc.Chicago Mercantile ExchangeChicago Board of Trade

4.10.7 Automation in Options Markets
Source: CFTC
20
30
40
50
60
70
80
20
30
40
50
60
70
80
2012 2013 2014 2015 2016
Percent PercentAs Of: 2016
New York Mercantile ExchangeCommodity Exchange Inc.Chicago Mercantile ExchangeChicago Board of Trade
0
2
4
6
8
0
2
4
6
8
1998 2001 2004 2007 2010 2013 2016
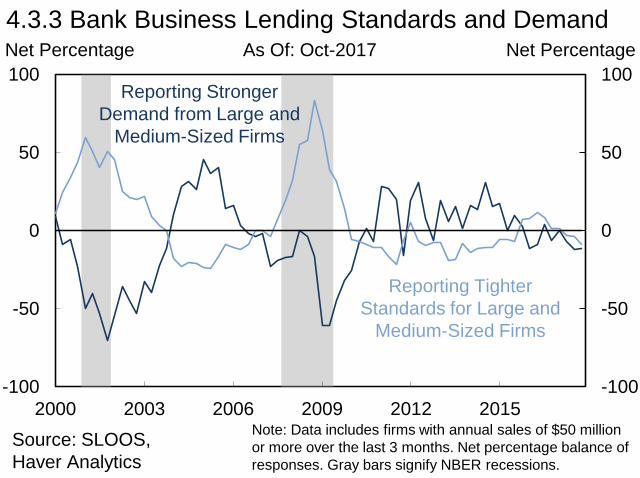
4.10.8 OTC Equity Options: Global Notional OutstandingTrillions of US$ Trillions of US$
Source: BIS, Haver Analytics
As Of: 2017 Q2
Other Financial InstitutionsNon-Financial Customers
Reporting Dealers

As Of: 2017 Q24.10.9 OTC Equity Option Share of All OTC Derivatives
Source: BIS, Haver Analytics
0.0
0.5
1.0
1.5
2.0
0.0
0.5
1.0
1.5
2.0
1998 2001 2004 2007 2010 2013 2016
Percent Percent

0
200
400
600
800
1000
1200
0
200
400
600
800
1000
1200
1998 2001 2004 2007 2010 2013 2016
4.10.10 OTC Equity Options: Global Market ValueBillions of US$ Billions of US$
Source: BIS, Haver Analytics
As Of: 2017 Q2
Other Financial InstitutionsNon-Financial Customers
Reporting Dealers
0
100
200
300
400
0
2
4
6
8
10
Jan:14 Jul:14 Jan:15 Jul:15 Jan:16 Jul:16 Jan:17 Jul:17
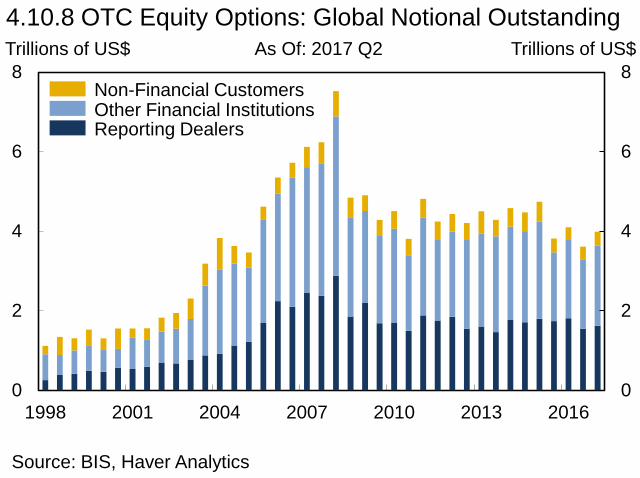
4.10.11 Derivatives Notional Amount OutstandingTrillions of US$ Trillions of US$
Source: CFTC
Interest Rate Derivatives(right axis)
Credit Index(left axis)
As Of: 27-Oct-2017
0
1
2
3
4
5
6
7
8
0.0
0.2
0.4
0.6
0.8
1.0
Mar:14 Sep:14 Mar:15 Sep:15 Mar:16 Sep:16 Mar:17 Sep:17
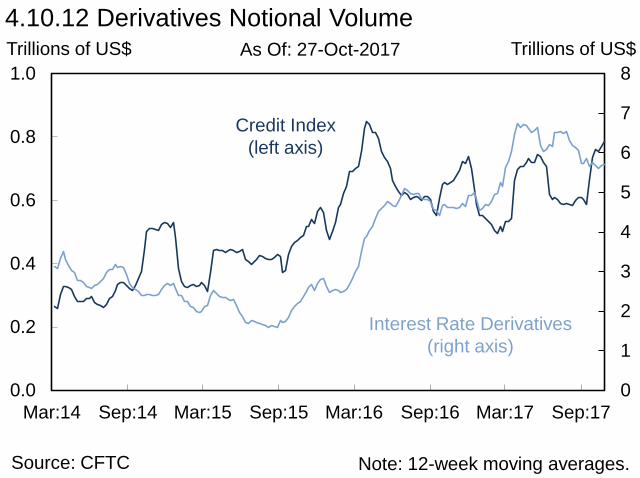
4.10.12 Derivatives Notional VolumeTrillions of US$ Trillions of US$
Source: CFTC
Interest Rate Derivatives(right axis)
As Of: 27-Oct-2017
Note: 12-week moving averages.
Credit Index(left axis)

0
100
200
300
400
500
600
700
800
900
1000
0
100
200
300
400
500
600
700
800
900
1000
2000 2004 2008 2012 2016
Source: BIS, Haver Analytics
As Of: 2017 Q2Trillions of US$4.10.13 Global OTC Derivatives Market
Note: Notional amounts.
Trillions of US$
Unallocated
Interest Rate Contracts
Commodity ContractsCredit Default Swaps
Equity-linked Contracts
FX Contracts

Trillions of US$
0
100
200
300
400
500
600
700
0
100
200
300
400
500
600
700
2012 2013 2014 2015 2016
4.10.14 Interest Rate Derivatives: Global Notional OutstandingTrillions of US$
Source: BIS, Haver Analytics
As Of: 2017 Q2
Q4 Q4 Q4 Q4 Q4

Trillions of US$
0
50
100
150
200
250
0
50
100
150
200
250
2003 2005 2007 2009 2011 2013 2015 2017
CCPNon-CCP
4.10.15 Interest Rate Derivative Compression VolumeTrillions of US$
Source: TriOptima
As Of: Oct-2017
Note: Gross notional is represented as single-counted for notional compressed outside of a CCP and double-counted for notional compressed inside of a CCP.

Trillions of US$4.10.16 Global Cleared OTC Interest Rate Derivatives
Trillions of US$
Source: ClarusFT CCPView, TriOptima, LCH.SwapClear
As Of: Oct-2017
Note: Maturity weighted cumulative compression volume is calculated as the sum of the current and previous year’s compression volume, estimating with two year average maturity for the compressed trades. 2017 data is year-to-date.
0
200
400
600
800
0
200
400
600
800
2008 2010 2012 2014 2016
Cleared NotionalMaturity Weighted Cum. Compression Volume

Trillions of US$4.10.17 Credit Derivatives by Counterparty
Trillions of US$As Of: Oct-2017
0
5
10
15
20
25
0
5
10
15
20
25
2013 2014 2015 2016 2017
Dealer to Non-DealerNon-Dealer to Non-DealerCCP to Dealer
Interdealer
CCP to Non-Dealer
YTDNote: Gross notional outstanding.Source: DTCC
Trillions of US$
0
10
20
30
40
0
10
20
30
40
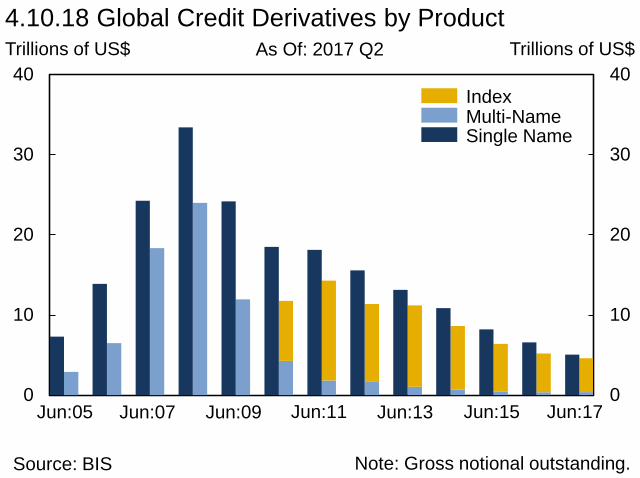
Jun:05 Jun:07 Jun:09 Jun:11 Jun:13 Jun:15 Jun:17
4.10.18 Global Credit Derivatives by ProductTrillions of US$
Source: BIS
As Of: 2017 Q2
Note: Gross notional outstanding.
Multi-NameIndex
Single Name

0
10
20
30
40
0
400
800
1200
1600
Jul:15 Jan:16 Jul:16 Jan:17 Jul:17
4.10.19 Interest Rate Derivatives Inflation Swap ClearingBillions of US$ Billions of US$
Cleared Volume
(right axis)
Cleared Notional Outstanding
(left axis)
As Of: 27-Oct-2017
Uncleared Swap Margin Rule Implementation Date
Source: ClarusFT CCPViewNote: 12-week moving averages for volume data.

0
50
100
150
0
300
600
900
Jul:15 Jan:16 Jul:16 Jan:17 Jul:17
4.10.20 FX Non-Deliverable-Forward ClearingBillions of US$ Billions of US$
Cleared Volume
(right axis)
Cleared Notional Outstanding
(left axis)
As Of: 27-Oct-2017
Uncleared Swap Margin Rule Implementation Date
Source: ClarusFT CCPViewNote: 12-week moving averages for volume data.

0
100
200
300
400
500
0.0
0.2
0.4
0.6
0.8
1.0
IRD FX Credit Equity
Not Cleared (left axis)Cleared (left axis)
4.10.21 Global OTC Central Clearing Market ShareShare Trillions of US$
Source: BIS
As Of: Jun-2017
Total Notional Outstanding (right axis)

Percent As Of: 2017 Q34.10.22 U.S. Central Clearing Market Share
Source: CFTC
0
20
40
60
80
100
0
20
40
60
80
100
Dec:13 Jun:14 Dec:14 Jun:15 Dec:15 Jun:16 Dec:16 Jun:17
Percent
Cleared Interest Rate Derivatives
Note: Percentage of transaction dollar volume.
Cleared CDS Index Swaps

0
50
100
150
200
250
300
350
0
50
100
150
200
250
300
350
2002 2004 2006 2008 2010 2012 2014 2016
4.10.23 Margin Funds Held at FCMsBillions of US$ Billions of US$
Source: CFTC, FIA
Part 30Swaps
Futures
As Of: Sep-2017

Count As Of: Sep-20174.10.24 FCMs Holding Client Funds
Source: CFTC, FIA
0
25
50
75
100
125
150
0
25
50
75
100
125
150
2002 2004 2006 2008 2010 2012 2014 2016
Count
SwapsPart 30Futures
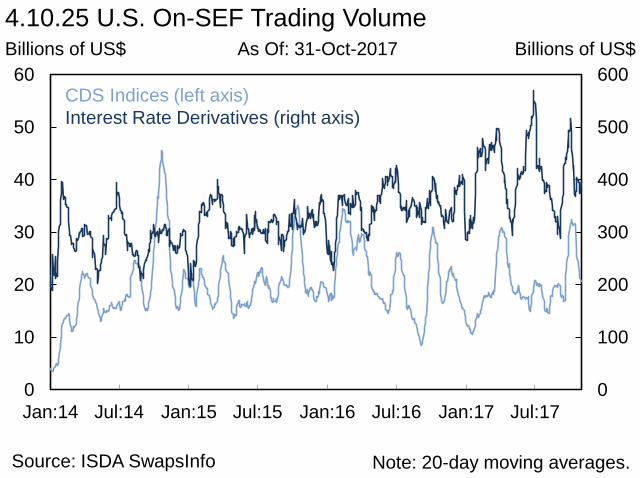
Billions of US$ As Of: 31-Oct-20174.10.25 U.S. On-SEF Trading Volume
Source: ISDA SwapsInfo
0
100
200
300
400
500
600
0
10
20
30
40
50
60
Jan:14 Jul:14 Jan:15 Jul:15 Jan:16 Jul:16 Jan:17 Jul:17
Billions of US$
CDS Indices (left axis)Interest Rate Derivatives (right axis)
Note: 20-day moving averages.

Percent As Of: 31-Oct-20174.10.26 U.S. On-SEF Trading Share
Source: ISDA SwapsInfo
0
20
40
60
80
100
0
20
40
60
80
100
Jan:14 Jul:14 Jan:15 Jul:15 Jan:16 Jul:16 Jan:17 Jul:17
Percent
CDS IndicesInterest Rate Derivatives
Note: Share of notional volume. 20-day moving averages.

0
4
8
12
16
0
4
8
12
16
CCAR banks Other banks withassets greater than
$10B
Banks with assetsless than $10B
4.11.1 BHC Total AssetsTrillions of US$ Trillions of US$
Source: FR Y-9C
As Of: 2017 Q2

4
6
8
10
12
14
4
6
8
10
12
14
2001 2003 2005 2007 2009 2011 2013 2015 2017
4.11.2 Common Equity Tier 1 RatiosPercent PercentAs Of: 2017 Q2
Greater than $50B
Less than $50B
Source: FR Y-9C
Note: Prior to 2014:Q1, the numerator of the common equity tier 1 ratio is tier 1 common capital. Beginning in 2014:Q1 for advanced approaches BHCs and in 2015:Q1 for all other BHCs, the numerator is common equity tier 1 capital.

0
10
20
30
40
50
60
0
10
20
30
40
50
60
2001 2003 2005 2007 2009 2011 2013 2015 2017
4.11.3 Selected Sources of Funding at CCAR BanksPercent of Total Assets Percent of Total AssetsAs Of: 2017 Q2
Long-Term FundingDeposits Excluding Foreign Deposits and Large Time Deposits
Source: FR Y-9C
Note: Long-term funding includes other borrowed money, subordinated notes, and large time deposits with maturities >1 year. Short-term funding includes such liabilities with maturities <1 year plus trading liabilities, repos, CP, and foreign deposits.
Short-Term Funding
0
50
100
150
200
250
0
50
100
150
200
250
Jan:13 Oct:13 Jul:14 Apr:15 Jan:16 Oct:16 Jul:17
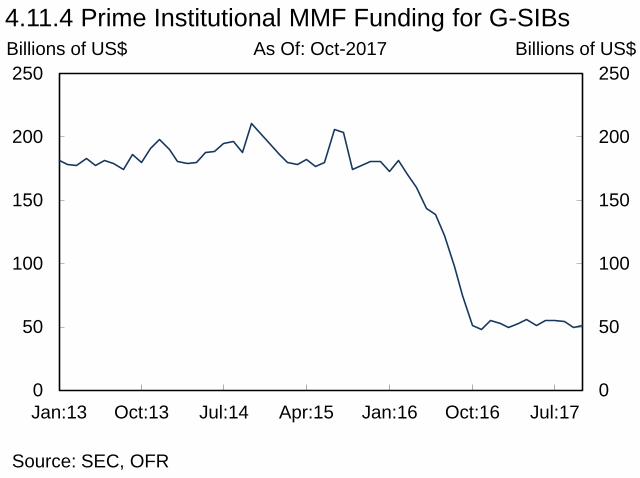
4.11.4 Prime Institutional MMF Funding for G-SIBsBillions of US$ Billions of US$
Source: SEC, OFR
As Of: Oct-2017

-125
-100
-75
-50
-25
0
25
50
-125
-100
-75
-50
-25
0
25
50
2013 2014 2015 2016 2017
4.11.5 LIBOR and Deposit Rate Spreads to OISBasis Points Basis PointsAs Of: 30-Oct-2017
Source: FDIC, Federal Reserve Bank of St. Louis, Bloomberg, L.P.
Small Retail CD SpreadJumbo Retail CD SpreadLIBOR-OIS Spread
Note: 3-month CD and LIBOR spreads to OIS.

-30
-15
0
15
30
-2
-1
0
1
2
1997 2000 2003 2006 2009 2012 2015
4.11.6 Return on Equity and Return on AssetsPercent PercentAs Of: 2017 Q2
ROE (right axis)
ROA (left axis)
Source: FR Y-9C
Note: Return on equity is equal to net income divided by average equity. Return on assets is equal to net income divided by average assets.

2.0
2.5
3.0
3.5
4.0
4.5
5.0
2.0
2.5
3.0
3.5
4.0
4.5
5.0
2000 2003 2006 2009 2012 2015
4.11.7 Net Interest MarginsPercent PercentAs Of: 2017 Q2
Greater than $50B
Less than $50B
Source: FR Y-9C
Note: Net interest margin is equal to net interest income divided by the quarterly average of interest-earning assets.

0
2
4
6
8
10
12
14
0
2
4
6
8
10
12
14
2011 2012 2013 2014 2015 2016 2017
4.11.8 Legal Expenses at Largest BHCsBillions of US$ Billions of US$As Of: 2017 Q2
Note: Legal expenses includes litigation expense and legal fees and expenses. Includes legal expenses at BAC, C, GS, JPM, MS, and WFC.Source: FR Y-9C

0
2
4
6
8
0
2
4
6
8
1997 2000 2003 2006 2009 2012 2015
Greater than $50B
4.11.9 Non-Performing LoansPercent of Total Loans Percent of Total LoansAs Of: 2017 Q2
Less than $50B
Source: FR Y-9C

0
50
100
150
200
250
0
50
100
150
200
250
1997 2000 2003 2006 2009 2012 2015
4.11.10 Loan-Loss ReservesPercent of NPLs Percent of NPLsAs Of: 2017 Q2
Less than $50B
Greater than $50B
Source: FR Y-9C

0
10
20
30
40
50
0
10
20
30
40
50
2001 2003 2005 2007 2009 2011 2013 2015 2017
4.11.11 Higher-Risk SecuritiesPercent of Total Securities Percent of Total Securities
Source: FR Y-9C
As Of: 2017 Q2
Greater than $50B
Less than $50B

0
1
2
3
4
5
6
0
1
2
3
4
5
6
2010 2011 2012 2013 2014 2015 2016 2017
4.11.12 Loans to Nondepository Financial Institutions Percent of Total Loans Percent of Total LoansAs Of: 2017 Q2
Greater than $50B
Less than $50B
Source: FR Y-9C

4
8
12
16
20
24
4
8
12
16
20
24
2010 2011 2012 2013 2014 2015 2016 2017
4.11.13 Selected High-Quality Liquid Assets at BHCsPercent of Assets Percent of Assets
Source: FR Y-9C, FR 2900
As Of: 2017 Q2
Standard LCR BHCs
Note: HQLA is estimated by adding excess reserves to an estimate of securities that qualify for HQLA. Securities are estimated from the FR Y-9C. Haircuts and level 2 asset limitations are incorporated into the estimate.
Modified LCR BHCsOther

0
2
4
6
8
10
0
2
4
6
8
10
2010 2011 2012 2013 2014 2015 2016 2017
4.11.14 Selected Liquid Assets at Standard LCR BHCsPercent of Assets Percent of Assets
Source: FR Y-9C, FR 2900
As Of: 2017 Q2
Reserves
Treasury Securities
Fannie Mae and Freddie Mac MBS

4.11.15 Weighted-Average Duration Gap
Source: FR Y-9C
0.0
0.5
1.0
1.5
2.0
2.5
3.0
0.0
0.5
1.0
1.5
2.0
2.5
3.0
2001 2003 2005 2007 2009 2011 2013 2015 2017
Years Years
Between $50B and $250B
As Of: 2017 Q2
Less than $50B
Greater than $250B
Note: Duration gap is the approximate weighted-average time of cash inflows less the approximate weighted-average time of cash outflows.

4.11.16 P/B and P/E Ratios of Six Large Complex BHCs
Source: Bloomberg, L.P.
0
10
20
30
40
50
60
0
1
2
3
4
5
2000 2003 2006 2009 2012 2015
Ratio RatioAs Of: 31-Oct-2017
P/B Ratio (left axis) P/E Ratio
(right axis)
Note: Market cap-weighted average of BAC, C, GS, JPM, MS, and WFC.

Basis Points
0
100
200
300
400
500
600
700
0
100
200
300
400
500
600
700
2009 2010 2011 2012 2013 2014 2015 2016 2017
4.11.17 CDS Spreads of Six Large Complex BHCsBasis PointsAs Of: 31-Oct-2017
Source: Markit Group LimitedNote: CDS spreads of BAC, C, GS, JPM, MS, and WFC.
Maximum ValueEqual-Weighted AverageMinimum Value

0
2
4
6
8
10
12
14
0
2
4
6
8
10
12
14Pre-StressPost-Stress Minimum
4.11.18 Initial and Stressed Tier 1 Common Capital RatiosPercent Percent
Source: Federal Reserve
As Of: Jun-2017
Note: DFAST 2013-2015 bars depict Tier 1 Common Capital Ratio. DFAST 2016-2017 bars depict Common Equity Tier 1 Ratio.
DFAST 2013 2014 2015 2016 2017

4.11.19 Federal Reserve's Actions in CCAR 2016
Source: Federal Reserve
Non-Objection to Capital PlanAlly Financial Citizens Financial MUFG AmericasAmerican Express Comerica Northern TrustBancWest Discover Financial PNC FinancialBank of America Fifth Third Bancorp Regions FinancialBank of New York Mellon Goldman Sachs State StreetBB&T HSBC North America SunTrustBBVA Compass Huntington Bancshares TD Group U.S.BMO Financial JPMorgan Chase U.S. BancorpCapital One Financial KeyCorp Wells FargoCitigroup M&T Bank Zions
Conditional Non-Objection to Capital PlanMorgan Stanley
Objection to Capital PlanDeutsche Bank Santander Holdings USA
Note: Morgan Stanley’s capital plan received a non-objection upon resubmission.

4.11.20 Federal Reserve's Actions in CCAR 2017
Source: Federal Reserve
Non-Objection to Capital PlanAlly Financial Comerica MUFG AmericasAmerican Express Deutsche Bank Northern TrustBancWest Discover Financial PNC FinancialBank of America Fifth Third Bancorp Regions FinancialBank of New York Mellon Goldman Sachs Santander Holdings USABB&T HSBC North America State StreetBBVA Compass Huntington Bancshares SunTrustBMO Financial JPMorgan Chase TD Group U.S.CIT Group KeyCorp U.S. BancorpCitigroup M&T Bank Wells FargoCitizens Financial Morgan Stanley Zions
Conditional Non-Objection to Capital PlanCapital One Financial

0
1
2
3
4
5
0
100
200
300
400
500
600
1980 1985 1990 1995 2000 2005 2010 2015
Source: BEA, FDIC, Haver Analytics
As Of: 2017 Q2Number of Institutions4.11.21 FDIC-Insured Failed Institutions
Note: No FDIC-insured institutions failed during 2005 and 2006. Failed institutions in 2017 through June 30.
Percent
Number of Institutions (left axis)
Assets of Failed Institutions as a Percent
of Nominal GDP (right axis)

-1000
-750
-500
-250
0
250
500
750
1000
-1000
-750
-500
-250
0
250
500
750
1000
2009 2011 2013 2015 2017
Noninterest IncomeNet Interest Income
Noninterest ExpenseProvisions
4.11.22 Commercial Bank and Thrift Pre-Tax IncomeBillions of US$ Billions of US$
Source: FDICNote: Includes all FDIC-insured commercial banks and thrifts.
As Of: 2017 Q2
Total Pre-Tax Income
Realized Gains/Losses on Investments

0.0
0.5
1.0
1.5
2.0
2.5
3.0
3.5
4.0
0.0
0.5
1.0
1.5
2.0
2.5
3.0
3.5
4.0
2004 2006 2008 2010 2012 2014 2016Source: Federal Reserve, Haver Analytics
As Of: 2017 Q2Trillions of US$
4.11.23 U.S. Branches and Agencies of Foreign Banks: Assets
Note: Other assets includes government securities, asset-backed securities, and other trading assets.
Trillions of US$
Cash and Balances Due from Depository Institutions (excluding Reserve Balances)Non-C&I Loans
C&I LoansNet Due From Related Depository Institutions
Reserve Balances
Other Assets
Securities Purchased with Repos & Fed Funds Sold

0.0
0.2
0.4
0.6
0.8
0.6
0.8
1.0
1.2
1.4
1.6
2013 2014 2015 2016 2017
4.11.24 Cash Assets and Net Due to Related EntitiesTrillions of US$ Trillions of US$
Source: Federal Reserve
As Of: 25-Oct-2017
Cash Assets (left axis)
Net Due to Related Entities(right axis)

0.0
0.5
1.0
1.5
2.0
2.5
3.0
3.5
4.0
0.0
0.5
1.0
1.5
2.0
2.5
3.0
3.5
4.0
2004 2006 2008 2010 2012 2014 2016Source: Federal Reserve, Haver Analytics
As Of: 2017 Q2Trillions of US$
4.11.25 U.S. Branches and Agencies of Foreign Banks: Liabilities
Note: Other liabilities includes transaction accounts, non-transaction accounts, and other borrowed money.
Trillions of US$
Deposits & Credit BalancesNet Due to Related Depository Institutions
Other LiabilitiesSecurities Sold with Repos & Fed Funds Purchased

-60
-45
-30
-15
0
15
30
45
60
-60
-45
-30
-15
0
15
30
45
60
2007 2009 2011 2013 2015 2017
Net Income
4.11.26 Credit Union IncomeBillions of US$ Billions of US$
Source: NCUA
As Of: 2017 Q2
Noninterest IncomeNet Interest Income
Note: Federally-insured credit unions.
Noninterest ExpenseProvisions Realized Gains/Losses
on Investments

45
50
55
60
65
20
24
28
32
36
2005 2007 2009 2011 2013 2015 2017
4.11.27 Credit Union DepositsPercent Percent
Source: NCUA
As Of: 2017 Q2
Money Market and IRA Deposit Share
(left axis)
Interest-Sensitive Deposit Share
(right axis)
Note: Federally-insured credit unions. Interest-sensitive deposit share includes money market and IRA deposit share, share certificates, and certain other deposits.

0
10
20
30
40
50
0
10
20
30
40
50
2005 2007 2009 2011 2013 2015 2017
4.11.28 Credit Union Net Long-Term AssetsPercent of Total Assets Percent of Total Assets
Source: NCUA
As Of: 2017 Q2
Mortgage Loans Maturing in 5+ Years
Long-Term InvestmentsBusiness LoansFixed Assets
Note: Federally-insured credit unions. Long-term investments mature in three or more years.

0
5
10
15
20
25
30
35
0
5
10
15
20
25
30
35
2007 Q2 2013 Q2 2015 Q2 2017 Q2
4.11.29 Credit Union Investments by MaturityPercent of Total Assets Percent of Total Assets
Source: NCUA
As Of: 2017 Q2
1-3 Years3-5 Years
5-10 Years<1 Year
>10 Years
Note: Federally-insured credit unions. Investments <1 year exclude securities with maturities <3 months.

0
10
20
30
40
50
3000
3500
4000
4500
5000
2009 2010 2011 2012 2013 2014 2015 2016
4.12.1 Number of Broker-Dealers and Industry Net Income Number of Firms Billions of US$As Of: 2016
Source: FINRA
Net Income (right axis)Number of Broker-Dealers (left axis)

0
100
200
300
400
0
100
200
300
400
2009 2010 2011 2012 2013 2014 2015 2016
Sale of Investment Company Shares
Margin InterestOther
Underwriting
Fees – Supervision, Advisory, Administration
Commissions
4.12.2 Broker-Dealer RevenuesBillions of US$ Billions of US$
Source: FINRA
As Of: 2016

0
1
2
3
4
5
6
7
2005 2007 2009 2011 2013 2015 20170
8
16
24
32
40
4.12.3 Broker-Dealer Assets and LeverageTrillions of US$ Ratio
Source: FINRA
As Of: 2017 Q2
Note: Leverage is the ratio of total assets to total ownership equity. 2017 data as of second quarter 2017.
Total Assets (left axis)
Leverage (right axis)

15
20
25
30
35
40
0
1
2
3
4
5
2010 2011 2012 2013 2014 2015 2016 2017
4.12.4 Large Broker-Dealer Assets and Leverage by AffiliationTrillions of US$ Ratio
Source: FINRA
As Of: 2017 Q2
Note: Data covers BHC- and FBO-affiliated broker-dealers that are among the 25 largest broker-dealers by assets as of second quarter 2017.
BHC-Affiliated Assets (left axis)FBO-Affiliated Assets (left axis)
BHC-Affiliated Leverage (right axis)FBO-Affiliated Leverage (right axis)

0
15
30
45
60
75
0
15
30
45
60
75
2010 2011 2012 2013 2014 2015 2016 2017YTD
4.12.5 Insurance Industry Net IncomeBillions of US$ Billions of US$
Source: SNL Financial
As Of: 2017 Q2
LifeP&C
Note: Life includes accident and health.

2
3
4
5
6
2010 2011 2012 2013 2014 2015 2016 20172
3
4
5
6
4.12.6 Net Yield on Invested AssetsPercent Percent
Source: SNL Financial, Bank of America Merrill Lynch, Haver Analytics
Life
P&C
Yield on A-Rated Corporate Debt
As Of: 2017 Q2
Note: Life includes accident and health.

0
250
500
750
1000
2010 2011 2012 2013 2014 2015 2016 2017YTD
0
10
20
30
40
50
60
4.12.7 Insurance Industry Capital and SurplusBillions of US$ Percent of Total Assets
Life Capital and Surplus / Assets (right axis)P&C Capital and Surplus / Assets (right axis)Life Capital and Surplus (left axis)P&C Capital and Surplus (left axis)
As Of: 2017 Q2
Note: C&S/Assets is calculated as capital and surplus as a percent of net admitted assets less net admitted separate account assets. Life includes accident and health.Source: SNL Financial

0.0
0.5
1.0
1.5
2.0
2.5
0.0
0.5
1.0
1.5
2.0
2.5
2001 2004 2007 2010 2013 2016
Source: Federal Reserve, Haver Analytics
As Of: Oct-2017Trillions of US$4.12.8 Consumer Loans and Leases Outstanding
Note: Loans and leases owned and securitized. Series breaks in December 2010 and 2014 due to change in data collection methodology. Gray bars signify NBER recessions.
Trillions of US$
Commercial Banks
Finance Companies

0.0
0.5
1.0
1.5
2.0
2.5
0.0
0.5
1.0
1.5
2.0
2.5
2001 2004 2007 2010 2013 2016
Source: Federal Reserve, Haver Analytics
As Of: Oct-2017Trillions of US$4.12.9 Business Loans and Leases Outstanding
Trillions of US$
Commercial Banks
Finance Companies
Note: Loans and leases owned and securitized. Series break in December 2010 due to change in data collection methodology. Gray bars signify NBER recessions.

0
50
100
150
200
250
300
350
400
450
0
50
100
150
200
250
300
350
400
450
2008 2010 2012 2014 2016
4.12.10 ABS IssuanceBillions of US$ Billions of US$
Source: Thomson Reuters, SIFMA
As Of: Oct-2017
Credit CardCDO
Auto
Student LoansOther
Equipment
Note: 2017 data is year-to-date.Note: 2017 data is year-to-date.

0
50
100
150
200
250
300
0
50
100
150
200
250
300
2010 2011 2012 2013 2014 2015 2016 2017
4.12.11 Selected ABS SpreadsBasis Points Basis Points
Source: J.P. Morgan
Prime Auto Fixed BBB 3-YearCredit Card Fixed BBB 3-YearPrime Auto Fixed AAA 3-YearCredit Card Fixed AAA 3-Year
As Of: 31-Oct-2017
Note: Spreads to swaps.

As Of: 2017 Q2
0
100
200
300
400
500
0
3
6
9
12
15
18
2000 2003 2006 2009 2012 2015
4.12.12 Agency REIT Assets and LeverageRatio Billions of US$
Source: Bloomberg, L.P.
Leverage(left axis)
Total Assets (right axis)
Note: Leverage is the ratio of total assets to equity. Not all agency REITs existed in all time periods in the figure.

0.0
0.5
1.0
1.5
2.0
0.0
0.5
1.0
1.5
2.0
2000 2003 2006 2009 2012 2015
4.12.13 Agency REIT Price-to-Book RatioRatio Ratio
Source: Bloomberg, L.P.
As Of: 2017 Q2
Note: Price-to-book ratio is weighted by market capitalization. Not all agency REITs existed in all time periods in the figure.

0
1
2
3
4
0
1
2
3
4
2011 2012 2013 2014 2015 2016 2017
C.1 MMF Assets by Fund TypeTrillions of US$ Trillions of US$
Source: SEC
As Of: Oct-2017
PrimeGovernment and TreasuryTax-Exempt

0
100
200
300
400
500
0
100
200
300
400
500
Jan:16 Apr:16 Jul:16 Oct:16 Jan:17 Apr:17
Billions of US$ Billions of US$
Source: FRBNY
As Of: 30-Jun-2017C.2 ON RRP Take-Up by MMFs

20
30
40
50
60
70
20
30
40
50
60
70
2011 2012 2013 2014 2015 2016 2017
C.3 Liquid Asset Shares of Prime MMFsPercent of Total Assets Percent of Total Assets
Source: SEC
As Of: Oct-2017
Daily Liquidity
Weekly Liquidity
Note: Weighted by fund size.

0
10
20
30
40
50
0
10
20
30
40
50
Jan:16 Apr:16 Jul:16 Oct:16 Jan:17 Apr:17 Jul:17 Oct:17
Basis Points Basis Points
Source: Bloomberg L.P.
As Of: 31-Oct-2017C.4 LIBOR-OIS Spread

0
5
10
15
20
25
0
5
10
15
20
25
1996 1999 2002 2005 2008 2011 2014 2017YTD
4.13.1 Net Assets of the Investment Company IndustryTrillions of US$ Trillions of US$As Of: 2017 Q3
ETFsOther
Equity Mutual FundsBond/Hybrid Mutual FundsMMFs
Note: Other is composed of unit investment trusts and closed-end funds. 2017 YTD figures include 2016 UIT data, which is reported annually. Source: ICI, Haver Analytics

-80
-60
-40
-20
0
20
40
-80
-60
-40
-20
0
20
40
2013 2014 2015 2016 2017
Source: ICI, Haver Analytics
As Of: Sep-2017Billions of US$4.13.2 Monthly Bond Mutual Fund Flows
Billions of US$
Tax-ExemptTaxable

-40
-30
-20
-10
0
10
20
30
40
-40
-30
-20
-10
0
10
20
30
40
2013 2014 2015 2016 2017
Source: ICI, Haver Analytics
As Of: Sep-2017Billions of US$4.13.3 Monthly Equity Mutual Fund Flows
Billions of US$

-30
-15
0
15
30
45
60
75
-30
-15
0
15
30
45
60
75
2005 2007 2009 2011 2013 2015 2017
4.13.4 Bank Loan Mutual Funds: Annual FlowsBillions of US$ Billions of US$
Source: Morningstar, Inc.
As Of: Oct-2017
YTD

-30
-20
-10
0
10
20
30
-30
-20
-10
0
10
20
30
2005 2007 2009 2011 2013 2015 2017
4.13.5 High-Yield Mutual Funds: Annual FlowsBillions of US$ Billions of US$
Source: Morningstar, Inc.
As Of: Oct-2017
YTD

-10
0
10
20
30
40
50
60
-10
0
10
20
30
40
50
60
2005 2007 2009 2011 2013 2015 2017
4.13.6 Alternative Mutual Funds: Annual FlowsBillions of US$ Billions of US$
Source: Morningstar, Inc.
As Of: Oct-2017
YTD

-1.2
-0.8
-0.4
0
0.4
0.8
1.2
-1.2
-0.8
-0.4
0
0.4
0.8
1.2
2009 2010 2011 2012 2013 2014 2015 2016 2017
4.13.7 Cumulative Equity Fund FlowsTrillions of US$ Trillions of US$
Source: Morningstar, Inc.
As Of: Oct-2017
Note: Includes ETFs and mutual funds.
International Passively ManagedU.S. Passively ManagedInternational Actively ManagedU.S. Actively Managed

-0.5
0.5
1.5
2.5
3.5
-0.5
0.5
1.5
2.5
3.5
2009 2010 2011 2012 2013 2014 2015 2016 2017
4.13.8 U.S.-Listed ETP AUMTrillions of US$ Trillions of US$
Source: Morningstar, Inc.
As Of: Oct-2017
Cumulative Flows to ETFsCumulative Market AppreciationAUM

0
4
8
12
16
20
24
28
0
4
8
12
16
20
24
28
2007 2009 2011 2013 2015 2017
Source: Federal Reserve, Haver Analytics
As Of: 2017 Q1Trillions of US$4.13.9 Retirement Fund Assets by Plan Type
Trillions of US$
Private Defined Benefit Plans
Individual AccountsPrivate Defined Contribution Plans
State and LocalFederal

60
70
80
90
100
110
120
60
70
80
90
100
110
120
2002 2004 2006 2008 2010 2012 2014 2016
4.13.10 Public and Private Pension Funding Levels
Source: Public Fund Survey, Milliman 2016 Pension Funding Study
Percent Percent
Public Defined Benefit Plans
Private Defined Benefit Plans
As Of: 2016

0.0
0.4
0.8
1.2
1.6
0.0
0.4
0.8
1.2
1.6
2005 2007 2009 2011 2013 2015 2017
4.13.11 North American Private Equity AUMTrillions of US$ Trillions of US$
Source: Preqin
As Of: 2017 Q1
YTD
Undeployed CapitalExisting Investments

0
50
100
150
200
0
50
100
150
200
2011 2012 2013 2014 2015 2016 2017 YTD
4.13.12 M&A Loan Volume for Private Equity-Backed IssuersBillions of US$ Billions of US$
Source: S&P LCD
As Of: Oct-2017
LBONon-LBO

0
20
40
60
80
100
0
20
40
60
80
100
1989 1993 1997 2001 2005 2009 2013
4.14.1 U.S. Consumer Adoption of Payment InstrumentsPercent of Consumers Percent of ConsumersAs Of: 2014
Source: Federal Reserve Bank of Boston
Note: Survey of Consumer Finances data from 1989 to 2007. Survey of Consumer Payment Choice data from 2008 to 2014.
CashCheckOnline Banking Bill PaymentsChecking AccountCreditDebit