401(k) Plus Plank) Plus Plan All-in-One Life Cycle Funds About the Target Risk and Target Retirement...
78
Index to the Fund Flyers First Half 2018 We are pleased to present the IBM 401(k) Plus Plan Fund Flyers for the period ending June 30, 2018. The flyers in this packet are organized by tier and then by their asset class – they are also numbered from 1 to 38. To assist you in finding funds of particular interest to you, the second page of the index to the fund flyers, provides the fund offerings sorted in two ways: sorted alphabetically and sorted in risk order, from least to most risky. See reverse for “A Guide to the Style Boxes” ALL-IN-ONE LIFE CYCLE FUNDS Life Cycle Funds Overview 1 Target Retirement 2010 2 Balanced Fund 4.21% 4.68% 4.48% 0.08% 4.22 Multiple Managers (1,2) Target Retirement 2015 3 Balanced Fund 5.31% 5.58% 4.88% 0.09% 4.95 Multiple Managers (1,2) Target Retirement 2020 4 Balanced Fund 6.52% 6.52% 5.32% 0.09% 5.81 Multiple Managers (1,2) Target Retirement 2025 5 Balanced Fund 7.81% 7.49% 5.82% 0.09% 6.74 Multiple Managers (1,2) Target Retirement 2030 6 Balanced Fund 9.06% 8.31% 6.30% 0.09% 7.66 Multiple Managers (1,2) Target Retirement 2035 7 Balanced Fund 9.87% 8.64% 6.49% 0.09% 8.06 Multiple Managers (1,2) Target Retirement 2040 8 Balanced Fund 10.08% 8.71% 6.52% 0.09% 8.10 Multiple Managers (1,2) Target Retirement 2045 9 Balanced Fund 10.11% 8.72% 6.53% 0.09% 8.10 Multiple Managers (1,2) Target Retirement 2050 10 Balanced Fund 10.24% 8.76% 6.54% 0.09% 8.10 Multiple Managers (1) Target Retirement 2055 11 Balanced Fund 10.26% — — 0.07% (7) 8.10 (7) Multiple Managers (1,2) Income Plus 12 Balanced Fund 4.00% 3.94% 4.27% 0.09% 3.31 Multiple Managers (1,2) Conservative 13 Balanced Fund 6.00% 5.60% 5.16% 0.10% 4.83 Multiple Managers (1,2) Moderate 14 Balanced Fund 7.53% 6.74% 5.67% 0.09% 5.98 Multiple Managers (1,2) Aggressive 15 Balanced Fund 10.24% 8.75% 6.54% 0.09% 8.08 Multiple Managers (1,2) CORE BUILDING BLOCK FUNDS Interest Income 16 Other 3.00% 2.94% 3.26% 0.35% 0.05 Multiple Managers (2) Inflation Protected Bond 17 Bond Fund 2.14% 1.66% 2.97% 0.02% 3.70 State Street Global Advisors Total Bond Market 18 Bond Fund -0.45% 2.23% 2.79% 0.04% 2.74 Neuberger Berman High Yield & Emerging Markets Bond 19 Bond Fund 0.61% 2.60% 5.30% 0.23% 6.61 Multiple Managers (3) Total Stock Market Index 20 Stock Fund 14.83% 13.24% 10.37% 0.02% 9.96 The Vanguard Group Total International Stock Market Index 21 Stock Fund 7.75% 6.72% 3.26% 0.04% 11.46 State Street Global Advisors Global Real Estate Stock Index 22 Stock Fund 5.18% — — 0.10% (7) 11.65 (7) BlackRock Balanced Exposure (4) 23 Other 8.42% 5.83% — 0.39% 6.60 Multiple Managers (5) Commodities (4) 24 Stock Fund 27.77% -7.10% -11.35% 0.38% 16.12 PIMCO EXPANDED CHOICE – INSTITUTIONAL FUNDS Long-Term Corporate Bond 25 Bond Fund -1.22% 5.45% 7.77% 0.10% 6.94 Multiple Managers (6) Large Company Index 26 Stock Fund 14.36% 13.41% 10.21% 0.02% 9.81 The Vanguard Group Large-Cap Value Index 27 Stock Fund 6.76% 10.34% 8.51% 0.03% 9.96 The Vanguard Group Large-Cap Growth Index 28 Stock Fund 22.49% 16.33% 11.82% 0.03% 10.47 The Vanguard Group Small/Mid-Cap Stock Index 29 Stock Fund 16.78% 12.71% 10.49% 0.02% 11.98 State Street Global Advisors Small-Cap Value Index 30 Stock Fund 13.25% 11.27% 10.01% 0.04% 14.01 The Vanguard Group Small-Cap Growth Index 31 Stock Fund 22.05% 13.88% 11.53% 0.04% 14.46 The Vanguard Group European Stock Index 32 Stock Fund 5.16% 6.49% 2.80% 0.07% 12.53 The Vanguard Group Pacific Stock Index 33 Stock Fund 9.82% 7.07% 4.10% 0.07% 11.20 The Vanguard Group Emerging Markets Stock Index 34 Stock Fund 6.31% 4.35% — 0.11% 14.85 The Vanguard Group Real Estate Investment Trust Index 35 Stock Fund 3.44% 8.13% 7.73% 0.08% 13.91 BlackRock International Real Estate Index 36 Stock Fund 9.88% 6.93% 4.38% 0.13% 11.53 BlackRock IBM Stock 37 Company Stock -5.47% -3.07% 4.16% 0.02% 16.98 State Street Bank & Trust Co. EXPANDED CHOICE – MUTUAL FUNDS Mutual Funds Overview 38 see fund flyer for details FUNDS SORTED BY TIERS AVERAGE ANNUAL TOTAL 5-YEAR FUND NAME FLYER TYPE OF RETURN AS OF 6/30/18 EXPENSE STANDARD NO. OPTION 1 YR 5 YR 10 YR RATIO DEVIATION MANAGER (1) All-in-One Life Cycle Funds are funds of funds. See fund flyer for allocation to underlying funds. (2) IBM Retirement Funds and underlying managers. (3) JPMorgan Investment Management, PIMCO, and Prudential. (4) The Commodities and Balanced Exposure funds are available only as components of the All-in-One Life Cycle Funds. (5) Bridgewater Associates & AQR Capital Management. (6) Loomis Sayles and WAMCO (7) Fund does not have 5 years of performance data. Performance returns, expense ratio, and 5 year standard deviation has been provided using actual and proxy data. 401(k) Plus Plan
Transcript of 401(k) Plus Plank) Plus Plan All-in-One Life Cycle Funds About the Target Risk and Target Retirement...
Index to the Fund FlyersFirst Half 2018We are pleased to present the IBM 401(k) Plus Plan Fund Flyers for the period ending June 30, 2018. The flyers in this packet are organized by tier and then by their asset class – they are also numbered from 1 to 38. To assist you in finding funds of particular interest to you, the second page of the index to the fund flyers, provides the fund offerings sorted in two ways: sorted alphabetically and sorted in risk order, from least to most risky.
See reverse for “A Guide to the Style Boxes”
ALL-IN-ONE LIFE CYCLE FUNDSLife Cycle Funds Overview 1Target Retirement 2010 2 Balanced Fund 4.21% 4.68% 4.48% 0.08% 4.22 Multiple Managers(1,2)
Target Retirement 2015 3 Balanced Fund 5.31% 5.58% 4.88% 0.09% 4.95 Multiple Managers(1,2)
Target Retirement 2020 4 Balanced Fund 6.52% 6.52% 5.32% 0.09% 5.81 Multiple Managers(1,2)
Target Retirement 2025 5 Balanced Fund 7.81% 7.49% 5.82% 0.09% 6.74 Multiple Managers(1,2)
Target Retirement 2030 6 Balanced Fund 9.06% 8.31% 6.30% 0.09% 7.66 Multiple Managers(1,2)
Target Retirement 2035 7 Balanced Fund 9.87% 8.64% 6.49% 0.09% 8.06 Multiple Managers(1,2)
Target Retirement 2040 8 Balanced Fund 10.08% 8.71% 6.52% 0.09% 8.10 Multiple Managers(1,2)
Target Retirement 2045 9 Balanced Fund 10.11% 8.72% 6.53% 0.09% 8.10 Multiple Managers(1,2)
Target Retirement 2050 10 Balanced Fund 10.24% 8.76% 6.54% 0.09% 8.10 Multiple Managers(1)
Target Retirement 2055 11 Balanced Fund 10.26% — — 0.07%(7) 8.10(7) Multiple Managers(1,2)
Income Plus 12 Balanced Fund 4.00% 3.94% 4.27% 0.09% 3.31 Multiple Managers(1,2)
Conservative 13 Balanced Fund 6.00% 5.60% 5.16% 0.10% 4.83 Multiple Managers(1,2)
Moderate 14 Balanced Fund 7.53% 6.74% 5.67% 0.09% 5.98 Multiple Managers(1,2)
Aggressive 15 Balanced Fund 10.24% 8.75% 6.54% 0.09% 8.08 Multiple Managers(1,2)
CORE BUILDING BLOCK FUNDSInterest Income 16 Other 3.00% 2.94% 3.26% 0.35% 0.05 Multiple Managers(2)
Inflation Protected Bond 17 Bond Fund 2.14% 1.66% 2.97% 0.02% 3.70 State Street Global AdvisorsTotal Bond Market 18 Bond Fund -0.45% 2.23% 2.79% 0.04% 2.74 Neuberger BermanHigh Yield & Emerging Markets Bond 19 Bond Fund 0.61% 2.60% 5.30% 0.23% 6.61 Multiple Managers(3)
Total Stock Market Index 20 Stock Fund 14.83% 13.24% 10.37% 0.02% 9.96 The Vanguard GroupTotal International Stock Market Index 21 Stock Fund 7.75% 6.72% 3.26% 0.04% 11.46 State Street Global AdvisorsGlobal Real Estate Stock Index 22 Stock Fund 5.18% — — 0.10%(7) 11.65(7) BlackRockBalanced Exposure(4) 23 Other 8.42% 5.83% — 0.39% 6.60 Multiple Managers(5)
Commodities(4) 24 Stock Fund 27.77% -7.10% -11.35% 0.38% 16.12 PIMCO EXPANDED CHOICE – INSTITUTIONAL FUNDSLong-Term Corporate Bond 25 Bond Fund -1.22% 5.45% 7.77% 0.10% 6.94 Multiple Managers(6)
Large Company Index 26 Stock Fund 14.36% 13.41% 10.21% 0.02% 9.81 The Vanguard GroupLarge-Cap Value Index 27 Stock Fund 6.76% 10.34% 8.51% 0.03% 9.96 The Vanguard GroupLarge-Cap Growth Index 28 Stock Fund 22.49% 16.33% 11.82% 0.03% 10.47 The Vanguard GroupSmall/Mid-Cap Stock Index 29 Stock Fund 16.78% 12.71% 10.49% 0.02% 11.98 State Street Global AdvisorsSmall-Cap Value Index 30 Stock Fund 13.25% 11.27% 10.01% 0.04% 14.01 The Vanguard GroupSmall-Cap Growth Index 31 Stock Fund 22.05% 13.88% 11.53% 0.04% 14.46 The Vanguard GroupEuropean Stock Index 32 Stock Fund 5.16% 6.49% 2.80% 0.07% 12.53 The Vanguard GroupPacific Stock Index 33 Stock Fund 9.82% 7.07% 4.10% 0.07% 11.20 The Vanguard GroupEmerging Markets Stock Index 34 Stock Fund 6.31% 4.35% — 0.11% 14.85 The Vanguard GroupReal Estate Investment Trust Index 35 Stock Fund 3.44% 8.13% 7.73% 0.08% 13.91 BlackRockInternational Real Estate Index 36 Stock Fund 9.88% 6.93% 4.38% 0.13% 11.53 BlackRockIBM Stock 37 Company Stock -5.47% -3.07% 4.16% 0.02% 16.98 State Street Bank & Trust Co. EXPANDED CHOICE – MUTUAL FUNDSMutual Funds Overview 38 see fund flyer for details
FUNDS SORTED BY TIERS AVERAGE ANNUAL TOTAL 5-YEARFUND NAME FLYER TYPE OF RETURN AS OF 6/30/18 EXPENSE STANDARD NO. OPTION 1 YR 5 YR 10 YR RATIO DEVIATION MANAGER
(1) All-in-One Life Cycle Funds are funds of funds. See fund flyer for allocation to underlying funds.(2) IBM Retirement Funds and underlying managers.(3) JPMorgan Investment Management, PIMCO, and Prudential.(4) The Commodities and Balanced Exposure funds are available only as components of the All-in-One Life Cycle Funds.(5) Bridgewater Associates & AQR Capital Management.(6) Loomis Sayles and WAMCO(7) Fund does not have 5 years of performance data. Performance returns, expense ratio, and 5 year standard deviation
has been provided using actual and proxy data.
401(k) Plus Plan
A Guide to the Style BoxesIn the top right corner of each fund flyer, you will
find a grid (or, in some cases, two grids) comprised
of nine boxes. These boxes reflect the composition
of the funds in terms of equity style versus market
capitalization (for stock funds) or average weighted
maturity versus credit quality (for bond funds).
Shadings (dark, medium, and light) correspond to
the relative weightings of the stocks and/or bonds
held in the fund’s portfolio. Below are two examples
of style boxes and how they might be read.
The shading in this box indicates the fund has a large proportion of large-cap growth stocks.
The shading in this box indicates the fund has a medium-sized proportion of mid-cap growth stocks.
The shading in this box indicates the fund has a small proportion of small-cap growth stocks.
STOCK FUNDS
** Fund does not have 5 years of performance data. Estimate of 5 year standard deviation has been provided using actual and/or proxy data.
IBM® is a registered trademark of International Business Machines Corporation. All rights reserved.
© 2018 International Business Machines Corporation. All rights reserved.
15 Aggressive 23 Balanced Exposure24 Commodities 13 Conservative 34 Emerging Markets Stock Index32 European Stock Index 22 Global Real Estate Stock Index19 High Yield & Emerging Markets Bond 37 IBM Stock 12 Income Plus 17 Inflation Protected Bond 16 Interest Income 36 International Real Estate Index 26 Large Company Index 28 Large-Cap Growth Index 27 Large-Cap Value Index 25 Long-Term Corporate Bond 14 Moderate 33 Pacific Stock Index 35 Real Estate Investment Trust Index 29 Small / Mid-Cap Stock Index 31 Small-Cap Growth Index 30 Small-Cap Value Index 2 Target Retirement 2010 3 Target Retirement 2015 4 Target Retirement 2020 5 Target Retirement 2025 6 Target Retirement 2030 7 Target Retirement 2035 8 Target Retirement 2040 9 Target Retirement 2045 10 Target Retirement 2050 11 Target Retirement 205518 Total Bond Market 21 Total International Stock Market Index 20 Total Stock Market Index
16 Interest Income 0.05 18 Total Bond Market 2.74 12 Income Plus 3.31 17 Inflation Protected Bond 3.70 2 Target Retirement 2010 4.22 13 Conservative 4.83 3 Target Retirement 2015 4.95 4 Target Retirement 2020 5.81 14 Moderate 5.98 23 Balanced Exposure 6.60 19 High Yield & Emerging Markets Bond 6.61 5 Target Retirement 2025 6.74 25 Long-Term Corporate Bond 6.94 6 Target Retirement 2030 7.66 7 Target Retirement 2035 8.06 15 Aggressive 8.08 8 Target Retirement 2040 8.10 9 Target Retirement 2045 8.10 10 Target Retirement 2050 8.10 11 Target Retirement 2055* 8.10 26 Large Company Index 9.81 20 Total Stock Market Index 9.96 27 Large-Cap Value Index 9.96 28 Large-Cap Growth Index 10.47 33 Pacific Stock Index 11.20 21 Total International Stock Market Index 11.46 36 International Real Estate Index 11.53 22 Global Real Estate Stock Index* 11.65 29 Small/Mid-Cap Stock Index 11.98 32 European Stock Index 12.53 35 Real Estate Investment Trust Index 13.91 30 Small-Cap Value Index 14.01 31 Small-Cap Growth Index 14.46 34 Emerging Markets Stock Index 14.85 24 Commodities 16.12 37 IBM Stock 16.98
FUNDS SORTED ALPHABETICALLY
FUND FLYER FLYER NAME
FUNDS SORTED IN PURE RISK ORDER
FUND FLYER FLYER NAME 5 YEAR STANDARD DEVIATION
Equity Style Value Blend Growth
Market C
ap
Large
Med
ium
Sm
all
Avg. Weighted Maturity Short Intermediate Long
Cred
it Qu
ality
Treasury & Agency
Investment- Grade Corporate
Below Investment- Grade
The shading in this box indicates the fund has a small proportion of investment-grade corporate bonds with short-term maturities.
The shading in this box indicates the fund has a large proportion of investment-grade corporate bonds with intermediate-term maturities.
BOND FUNDS
Relatively light weighting
Medium weighting
Relatively heavy weighting
LEGEND

401(k) Plus PlanAll-in-One Life Cycle Funds
About the Target Risk and Target Retirement Funds
The Target Risk Funds and Target Retirement Funds offer a simple, one stop approach to retirement investing. These funds are balanced funds that invest in a diversified mix of stocks, bonds, and commodities geared to a particular investment style or life stage. All 14 funds invest in the Plan’s Core Building Block Funds plus the Balanced Exposure and Commodities funds to attain their given asset allocation. These blended funds can make it easier for you to diversify your holdings and are designed to be the primary investment in your portfolio.
These funds could serve as a sole or core investment for participants who prefer to have a professional asset allocation. The most important characteristic of the funds in this tier is that they provide diversification over broad asset classes. Diversification is one of the most important safeguards in investing because you avoid putting all of your eggs in one basket. As a result of the professional diversification of these funds, they seek to provide the highest expected long term return possible at any given risk level.
They also offer the convenience of periodic rebalancing in order to ensure that each fund retains its targeted investment mix. This tier also provides the flexibility to choose a Target Risk Fund, which is a portfolio that maintains a fixed allocation, or a Target Retirement Fund which gradually and automatically shifts to a more conservative asset allocation over time.
If you invest in an All-in-One Life Cycle fund,, consider making it your primary investment. If you own other Plan funds in addition to one of these investments, you may impact the overall asset allocation of your portfolio, possibly hindering your savings’ ability to grow efficiently.
Target Retirement Funds
The Target Retirement Funds offer portfolios with targeted retirement dates for the years 2010, 2015, 2020, 2025, 2030, 2035, 2040, 2045, 2050, and 2055. As with Target Risk Funds, these funds offer a convenient low-cost way to achieve a sophisticated diversification strategy, professional money management, and periodic rebalancing.
In addition, Target Retirement Funds offer another great advantage: Investment experts stress that the mix of stocks, bonds, and short-term reserves in your portfolio should be adjusted regularly to keep your asset allocation on track for retirement. Target Retirement Funds make this adjustment automatically by shifting semi-annually toward a more conservative allocation. All you have to do is select the fund that most closely matches the year you’ll retire, or the year you expect to start drawing on your retirement assets. If your risk tolerance is higher or lower than the fund’s allocation, adjust your selection accordingly.
Target Retirement Funds Glide Path
Based on your age, the following chart provides a pictorial view of the allocation to stocks for each Target Retirement fund. For those beginning a career, the Target Retirement funds provide a relatively high allocation to stocks. As you draw closer to retirement, your associated Target Retirement fund will gradually become more conservative by reducing its allocation to stocks. Each fund’s reduction to stocks continues through its “target retirement date” for another 10 years, until the fund’s allocation and risk profile matches that of the Income Plus Fund and will subsequently be merged into the Income Plus Fund. The Target Retirement funds assume a retirement age of 60.
Flyer 1 of 38
Target Retirement Funds’ Glide Path
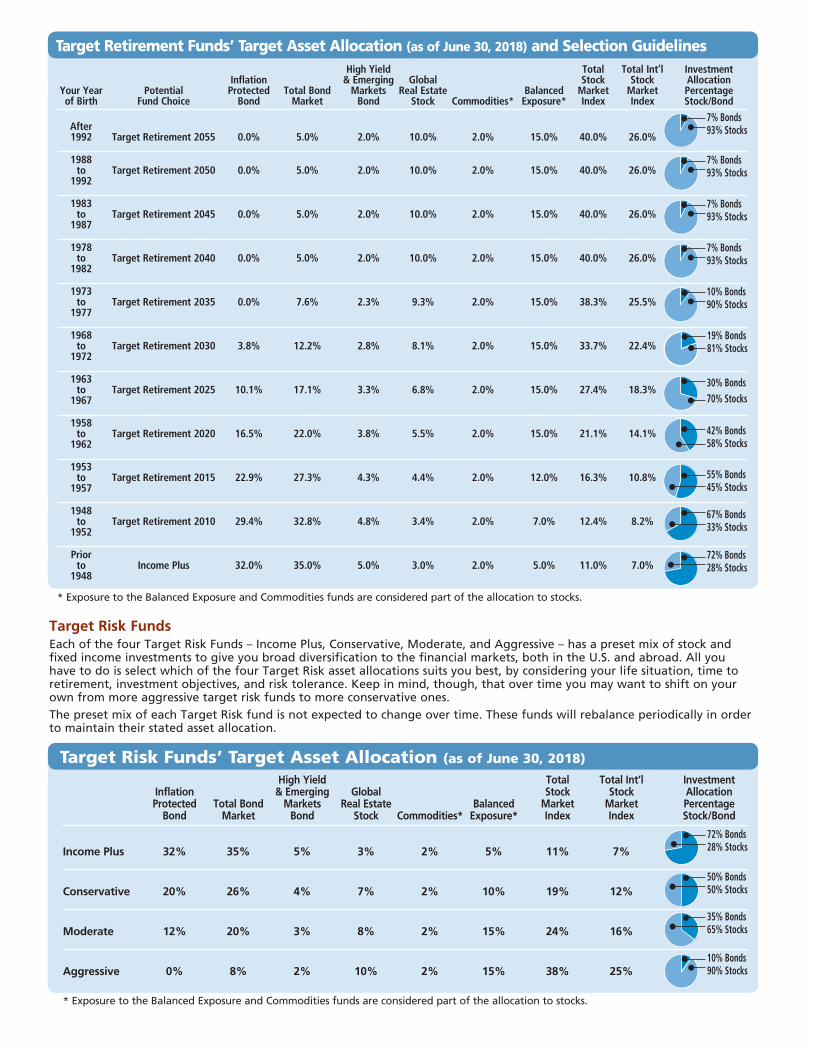
High Yield Total Total Int’l Investment Inflation & Emerging Global Stock Stock Allocation Your Year Potential Protected Total Bond Markets Real Estate Balanced Market Market Percentage of Birth Fund Choice Bond Market Bond Stock Commodities* Exposure* Index Index Stock/Bond
After 1992 Target Retirement 2055 0.0% 5.0% 2.0% 10.0% 2.0% 15.0% 40.0% 26.0%
1988 to Target Retirement 2050 0.0% 5.0% 2.0% 10.0% 2.0% 15.0% 40.0% 26.0% 1992
1983 to Target Retirement 2045 0.0% 5.0% 2.0% 10.0% 2.0% 15.0% 40.0% 26.0% 1987
1978 to Target Retirement 2040 0.0% 5.0% 2.0% 10.0% 2.0% 15.0% 40.0% 26.0% 1982
1973 to Target Retirement 2035 0.0% 7.6% 2.3% 9.3% 2.0% 15.0% 38.3% 25.5% 1977
1968 to Target Retirement 2030 3.8% 12.2% 2.8% 8.1% 2.0% 15.0% 33.7% 22.4% 1972
1963 to Target Retirement 2025 10.1% 17.1% 3.3% 6.8% 2.0% 15.0% 27.4% 18.3% 1967
1958 to Target Retirement 2020 16.5% 22.0% 3.8% 5.5% 2.0% 15.0% 21.1% 14.1% 1962
1953 to Target Retirement 2015 22.9% 27.3% 4.3% 4.4% 2.0% 12.0% 16.3% 10.8% 1957
1948 to Target Retirement 2010 29.4% 32.8% 4.8% 3.4% 2.0% 7.0% 12.4% 8.2% 1952
Prior to Income Plus 32.0% 35.0% 5.0% 3.0% 2.0% 5.0% 11.0% 7.0% 1948
* Exposure to the Balanced Exposure and Commodities funds are considered part of the allocation to stocks.
Target Retirement Funds’ Target Asset Allocation (as of June 30, 2018) and Selection Guidelines
Target Risk FundsEach of the four Target Risk Funds – Income Plus, Conservative, Moderate, and Aggressive – has a preset mix of stock and fixed income investments to give you broad diversification to the financial markets, both in the U.S. and abroad. All you have to do is select which of the four Target Risk asset allocations suits you best, by considering your life situation, time to retirement, investment objectives, and risk tolerance. Keep in mind, though, that over time you may want to shift on your own from more aggressive target risk funds to more conservative ones. The preset mix of each Target Risk fund is not expected to change over time. These funds will rebalance periodically in order to maintain their stated asset allocation.
High Yield Total Total Int’l Investment Inflation & Emerging Global Stock Stock Allocation Protected Total Bond Markets Real Estate Balanced Market Market Percentage Bond Market Bond Stock Commodities* Exposure* Index Index Stock/Bond
Income Plus 32% 35% 5% 3% 2% 5% 11% 7%
Conservative 20% 26% 4% 7% 2% 10% 19% 12%
Moderate 12% 20% 3% 8% 2% 15% 24% 16%
Aggressive 0% 8% 2% 10% 2% 15% 38% 25%
* Exposure to the Balanced Exposure and Commodities funds are considered part of the allocation to stocks.
Target Risk Funds’ Target Asset Allocation (as of June 30, 2018)
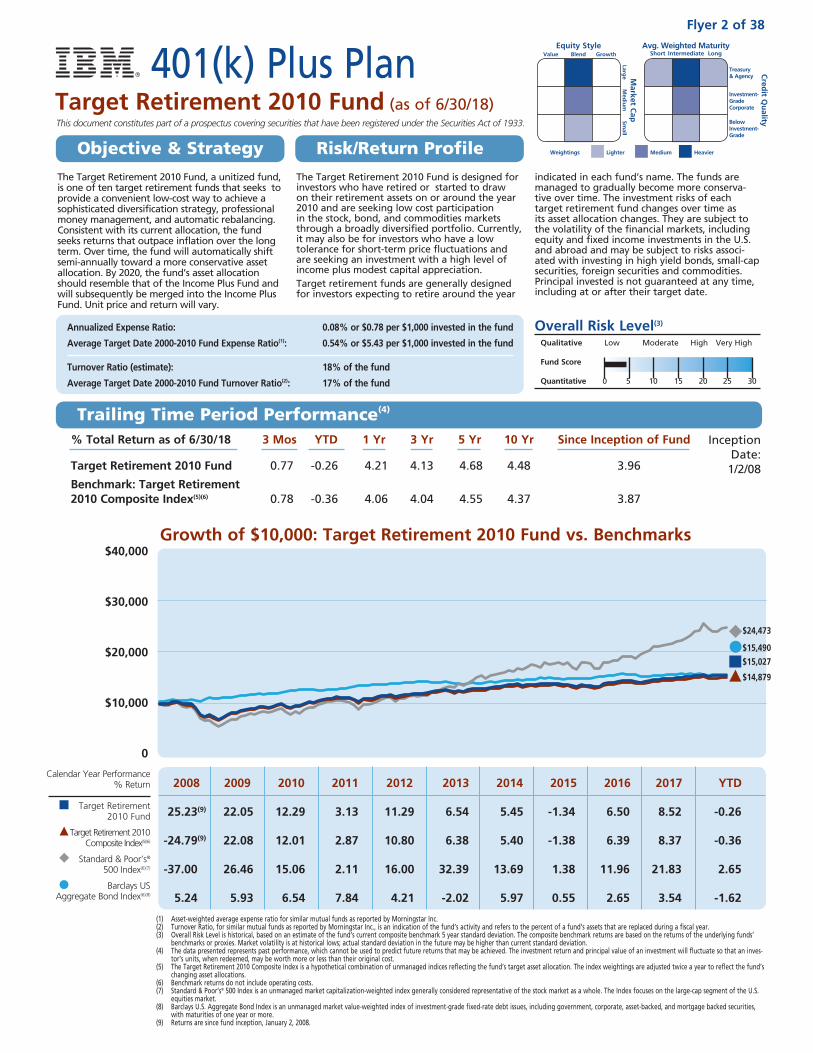
Growth of $10,000: Target Retirement 2010 Fund vs. Benchmarks $40,000
$30,000
$20,000
$10,000
0
% Total Return as of 6/30/18 3 Mos YTD 1 Yr 3 Yr 5 Yr 10 Yr Since Inception of Fund
Target Retirement 2010 Fund 0.77 -0.26 4.21 4.13 4.68 4.48 3.96
Benchmark: Target Retirement 2010 Composite Index(5)(6) 0.78 -0.36 4.06 4.04 4.55 4.37 3.87
The Target Retirement 2010 Fund is designed for investors who have retired or started to draw on their retirement assets on or around the year 2010 and are seeking low cost participation in the stock, bond, and commodities markets through a broadly diversified portfolio. Currently, it may also be for investors who have a low tolerance for short-term price fluctuations and are seeking an investment with a high level of income plus modest capital appreciation.Target retirement funds are generally designed for investors expecting to retire around the year
indicated in each fund’s name. The funds are managed to gradually become more conserva-tive over time. The investment risks of each target retirement fund changes over time as its asset allocation changes. They are subject to the volatility of the financial markets, including equity and fixed income investments in the U.S. and abroad and may be subject to risks associ-ated with investing in high yield bonds, small-cap securities, foreign securities and commodities. Principal invested is not guaranteed at any time, including at or after their target date.
Annualized Expense Ratio: 0.08% or $0.78 per $1,000 invested in the fund
Average Target Date 2000-2010 Fund Expense Ratio(1): 0.54% or $5.43 per $1,000 invested in the fund
Turnover Ratio (estimate): 18% of the fund
Average Target Date 2000-2010 Fund Turnover Ratio(2): 17% of the fund
Inception Date:
1/2/08
(1) Asset-weighted average expense ratio for similar mutual funds as reported by Morningstar Inc.(2) Turnover Ratio, for similar mutual funds as reported by Morningstar Inc., is an indication of the fund’s activity and refers to the percent of a fund’s assets that are replaced during a fiscal year.(3) Overall Risk Level is historical, based on an estimate of the fund’s current composite benchmark 5 year standard deviation. The composite benchmark returns are based on the returns of the underlying funds’
benchmarks or proxies. Market volatility is at historical lows; actual standard deviation in the future may be higher than current standard deviation.(4) The data presented represents past performance, which cannot be used to predict future returns that may be achieved. The investment return and principal value of an investment will fluctuate so that an inves-
tor’s units, when redeemed, may be worth more or less than their original cost.(5) The Target Retirement 2010 Composite Index is a hypothetical combination of unmanaged indices reflecting the fund’s target asset allocation. The index weightings are adjusted twice a year to reflect the fund’s
changing asset allocations.(6) Benchmark returns do not include operating costs.(7) Standard & Poor’s® 500 Index is an unmanaged market capitalization-weighted index generally considered representative of the stock market as a whole. The Index focuses on the large-cap segment of the U.S.
equities market.(8) Barclays U.S. Aggregate Bond Index is an unmanaged market value-weighted index of investment-grade fixed-rate debt issues, including government, corporate, asset-backed, and mortgage backed securities,
with maturities of one year or more.(9) Returns are since fund inception, January 2, 2008.
Overall Risk Level(3)
Qualitative Low Moderate High Very High
Fund Score
Quantitative 0 5 10 15 20 25 30
The Target Retirement 2010 Fund, a unitized fund, is one of ten target retirement funds that seeks to provide a convenient low-cost way to achieve a sophisticated diversification strategy, professional money management, and automatic rebalancing. Consistent with its current allocation, the fund seeks returns that outpace inflation over the long term. Over time, the fund will automatically shift semi-annually toward a more conservative asset allocation. By 2020, the fund’s asset allocation should resemble that of the Income Plus Fund and will subsequently be merged into the Income Plus Fund. Unit price and return will vary.
2008 2009 2010 2011 2012 2013 2014 2015 2016 2017 YTD
25.23(9) 22.05 12.29 3.13 11.29 6.54 5.45 -1.34 6.50 8.52 -0.26
-24.79(9) 22.08 12.01 2.87 10.80 6.38 5.40 -1.38 6.39 8.37 -0.36
-37.00 26.46 15.06 2.11 16.00 32.39 13.69 1.38 11.96 21.83 2.65
5.24 5.93 6.54 7.84 4.21 -2.02 5.97 0.55 2.65 3.54 -1.62
Calendar Year Performance % Return
Target Retirement 2010 Fund
Target Retirement 2010 Composite Index(5)(6)
Standard & Poor’s® 500 Index(6)(7)
Barclays US Aggregate Bond Index(6)(8)
This document constitutes part of a prospectus covering securities that have been registered under the Securities Act of 1933.
Avg. Weighted Maturity Short Intermediate Long
Equity Style Value Blend Growth
Market C
ap
Large
Med
ium
Sm
all
Cred
it Qu
ality
Treasury & Agency
Investment- Grade Corporate
Below Investment- Grade
LighterWeightings Medium Heavier
401(k) Plus PlanTarget Retirement 2010 Fund (as of 6/30/18)
Flyer 2 of 38
Objective & Strategy Risk/Return Profile
Trailing Time Period Performance(4)
$24,473
$15,027
$14,879
$15,490
The underlying funds may lend their holdings to qualified institutional investors to seek to enhance returns through fees earned related to the securities lent. Although all loans of securities are fully collateralized, there is some risk of loss if a borrower defaults on its obligation or losses occur related to the collateral received. Securities lending is performed in accordance with applicable law and regulations.The IBM 401(k) Plus Plan Trust (Trust) has claimed an exclusion from the definition of the term “commodity pool operator” under the Commodity Exchange Act (Act) and, therefore, the Trust is not subject to registration or regulation as a pool operator under the Act.IBM® is a registered trademark of International Business Machines Corporation. All rights reserved.Standard & Poors’®, S&P®, S&P 500®, Standard & Poor’s 500, and 500 are trademarks of The McGraw-Hill Companies, Inc.©2018 International Business Machines Corporation. All rights reserved.
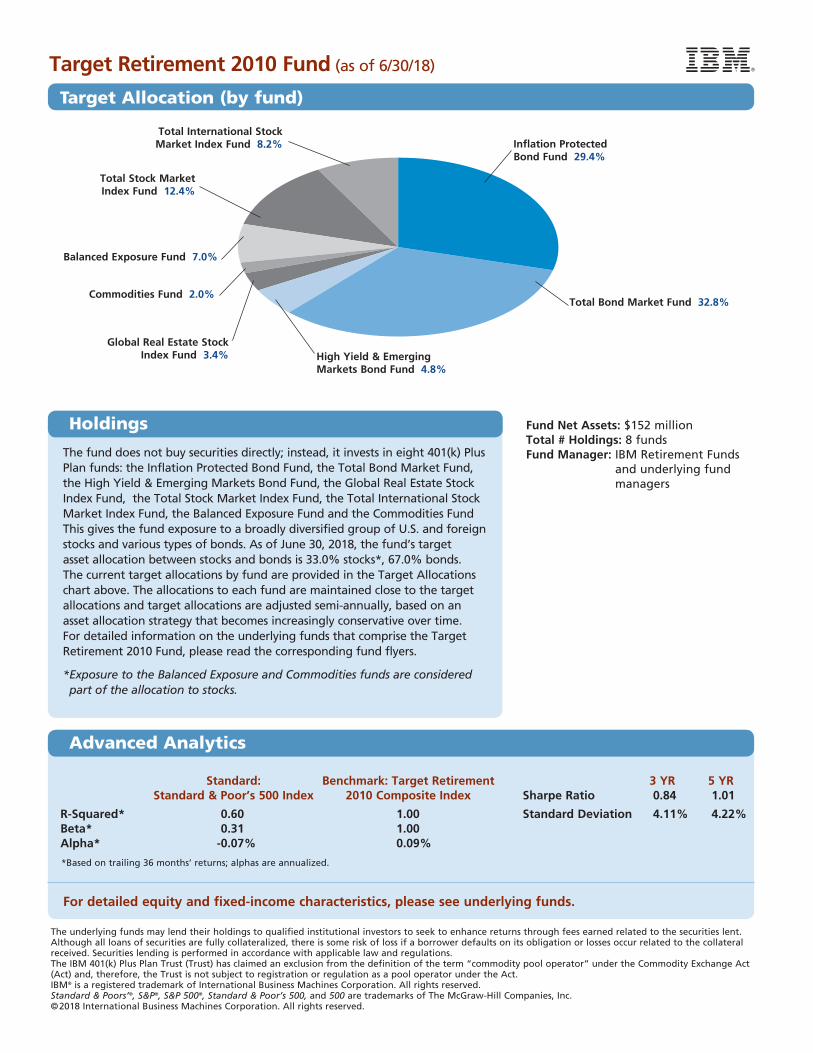
Fund Net Assets: $152 millionTotal # Holdings: 8 fundsFund Manager: IBM Retirement Funds
and underlying fund managers
Target Retirement 2010 Fund (as of 6/30/18)
Target Allocation (by fund)
Standard: Benchmark: Target Retirement 3 YR 5 YR Standard & Poor’s 500 Index 2010 Composite Index Sharpe Ratio 0.84 1.01
R-Squared* 0.60 1.00 Standard Deviation 4.11% 4.22% Beta* 0.31 1.00 Alpha* -0.07% 0.09%
*Based on trailing 36 months’ returns; alphas are annualized.
For detailed equity and fixed-income characteristics, please see underlying funds.
The fund does not buy securities directly; instead, it invests in eight 401(k) Plus Plan funds: the Inflation Protected Bond Fund, the Total Bond Market Fund, the High Yield & Emerging Markets Bond Fund, the Global Real Estate Stock Index Fund, the Total Stock Market Index Fund, the Total International Stock Market Index Fund, the Balanced Exposure Fund and the Commodities Fund This gives the fund exposure to a broadly diversified group of U.S. and foreign stocks and various types of bonds. As of June 30, 2018, the fund’s target asset allocation between stocks and bonds is 33.0% stocks*, 67.0% bonds. The current target allocations by fund are provided in the Target Allocations chart above. The allocations to each fund are maintained close to the target allocations and target allocations are adjusted semi-annually, based on an asset allocation strategy that becomes increasingly conservative over time. For detailed information on the underlying funds that comprise the Target Retirement 2010 Fund, please read the corresponding fund flyers.
* Exposure to the Balanced Exposure and Commodities funds are considered part of the allocation to stocks.
Holdings
Advanced Analytics
Commodities Fund 2.0%
Balanced Exposure Fund 7.0%
Total Stock Market Index Fund 12.4%
Total International Stock Market Index Fund 8.2%
High Yield & Emerging Markets Bond Fund 4.8%
Global Real Estate Stock Index Fund 3.4%
Total Bond Market Fund 32.8%
Inflation Protected Bond Fund 29.4%
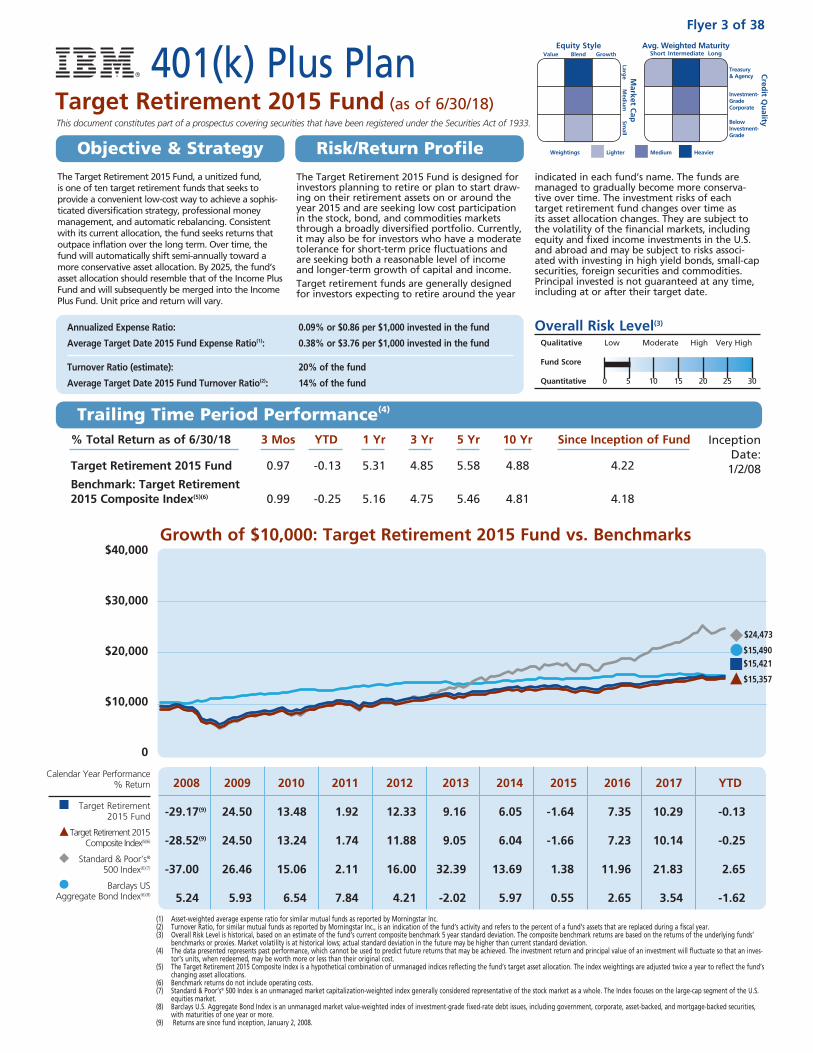
Growth of $10,000: Target Retirement 2015 Fund vs. Benchmarks $40,000
$30,000
$20,000
$10,000
0
% Total Return as of 6/30/18 3 Mos YTD 1 Yr 3 Yr 5 Yr 10 Yr Since Inception of Fund
Target Retirement 2015 Fund 0.97 -0.13 5.31 4.85 5.58 4.88 4.22
Benchmark: Target Retirement 2015 Composite Index(5)(6) 0.99 -0.25 5.16 4.75 5.46 4.81 4.18
The Target Retirement 2015 Fund is designed for investors planning to retire or plan to start draw-ing on their retirement assets on or around the year 2015 and are seeking low cost participation in the stock, bond, and commodities markets through a broadly diversified portfolio. Currently, it may also be for investors who have a moderate tolerance for short-term price fluctuations and are seeking both a reasonable level of income and longer-term growth of capital and income.Target retirement funds are generally designed for investors expecting to retire around the year
indicated in each fund’s name. The funds are managed to gradually become more conserva-tive over time. The investment risks of each target retirement fund changes over time as its asset allocation changes. They are subject to the volatility of the financial markets, including equity and fixed income investments in the U.S. and abroad and may be subject to risks associ-ated with investing in high yield bonds, small-cap securities, foreign securities and commodities. Principal invested is not guaranteed at any time, including at or after their target date.
Annualized Expense Ratio: 0.09% or $0.86 per $1,000 invested in the fund
Average Target Date 2015 Fund Expense Ratio(1): 0.38% or $3.76 per $1,000 invested in the fund
Turnover Ratio (estimate): 20% of the fund
Average Target Date 2015 Fund Turnover Ratio(2): 14% of the fund
Inception Date:
1/2/08
(1) Asset-weighted average expense ratio for similar mutual funds as reported by Morningstar Inc.(2) Turnover Ratio, for similar mutual funds as reported by Morningstar Inc., is an indication of the fund’s activity and refers to the percent of a fund’s assets that are replaced during a fiscal year.(3) Overall Risk Level is historical, based on an estimate of the fund’s current composite benchmark 5 year standard deviation. The composite benchmark returns are based on the returns of the underlying funds’
benchmarks or proxies. Market volatility is at historical lows; actual standard deviation in the future may be higher than current standard deviation.(4) The data presented represents past performance, which cannot be used to predict future returns that may be achieved. The investment return and principal value of an investment will fluctuate so that an inves-
tor’s units, when redeemed, may be worth more or less than their original cost.(5) The Target Retirement 2015 Composite Index is a hypothetical combination of unmanaged indices reflecting the fund’s target asset allocation. The index weightings are adjusted twice a year to reflect the fund’s
changing asset allocations.(6) Benchmark returns do not include operating costs. (7) Standard & Poor’s® 500 Index is an unmanaged market capitalization-weighted index generally considered representative of the stock market as a whole. The Index focuses on the large-cap segment of the U.S.
equities market.(8) Barclays U.S. Aggregate Bond Index is an unmanaged market value-weighted index of investment-grade fixed-rate debt issues, including government, corporate, asset-backed, and mortgage-backed securities,
with maturities of one year or more.(9) Returns are since fund inception, January 2, 2008.
Overall Risk Level(3)
Qualitative Low Moderate High Very High
Fund Score
Quantitative 0 5 10 15 20 25 30
The Target Retirement 2015 Fund, a unitized fund, is one of ten target retirement funds that seeks to provide a convenient low-cost way to achieve a sophis-ticated diversification strategy, professional money management, and automatic rebalancing. Consistent with its current allocation, the fund seeks returns that outpace inflation over the long term. Over time, the fund will automatically shift semi-annually toward a more conservative asset allocation. By 2025, the fund’s asset allocation should resemble that of the Income Plus Fund and will subsequently be merged into the Income Plus Fund. Unit price and return will vary.
2008 2009 2010 2011 2012 2013 2014 2015 2016 2017 YTD
-29.17(9) 24.50 13.48 1.92 12.33 9.16 6.05 -1.64 7.35 10.29 -0.13
-28.52(9) 24.50 13.24 1.74 11.88 9.05 6.04 -1.66 7.23 10.14 -0.25
-37.00 26.46 15.06 2.11 16.00 32.39 13.69 1.38 11.96 21.83 2.65
5.24 5.93 6.54 7.84 4.21 -2.02 5.97 0.55 2.65 3.54 -1.62
Calendar Year Performance % Return
Target Retirement 2015 Fund
Target Retirement 2015 Composite Index(5)(6)
Standard & Poor’s® 500 Index(6)(7)
Barclays US Aggregate Bond Index(6)(8)
This document constitutes part of a prospectus covering securities that have been registered under the Securities Act of 1933.
Avg. Weighted Maturity Short Intermediate Long
Equity Style Value Blend Growth
Market C
ap
Large
Med
ium
Sm
all
Cred
it Qu
ality
Treasury & Agency
Investment- Grade Corporate
Below Investment- Grade
LighterWeightings Medium Heavier
401(k) Plus PlanTarget Retirement 2015 Fund (as of 6/30/18)
Flyer 3 of 38
Objective & Strategy Risk/Return Profile
Trailing Time Period Performance(4)
$24,473
$15,421
$15,357
$15,490
The underlying funds may lend their holdings to qualified institutional investors to seek to enhance returns through fees earned related to the securities lent. Although all loans of securities are fully collateralized, there is some risk of loss if a borrower defaults on its obligation or losses occur related to the collateral received. Securities lending is performed in accordance with applicable law and regulations.The IBM 401(k) Plus Plan Trust (Trust) has claimed an exclusion from the definition of the term “commodity pool operator” under the Commodity Exchange Act (Act) and, therefore, the Trust is not subject to registration or regulation as a pool operator under the Act.IBM® is a registered trademark of International Business Machines Corporation. All rights reserved.Standard & Poors’®, S&P®, S&P 500®, Standard & Poor’s 500, and 500 are trademarks of The McGraw-Hill Companies, Inc.©2018 International Business Machines Corporation. All rights reserved.
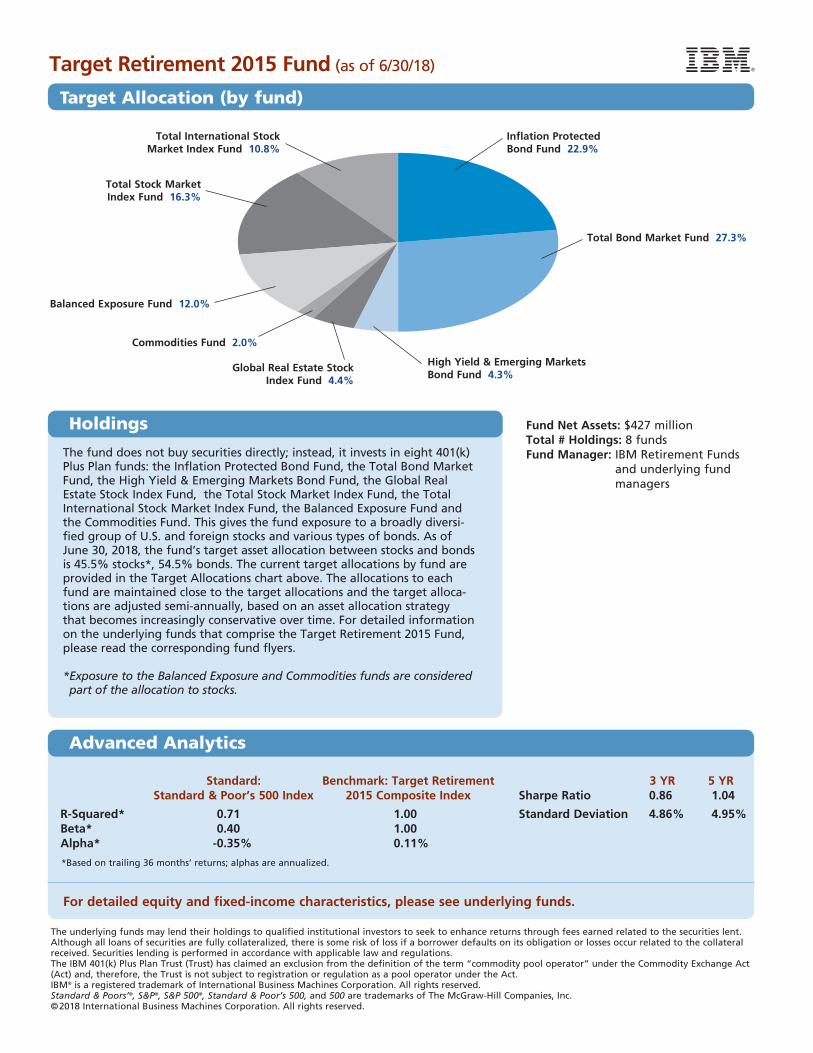
Fund Net Assets: $427 millionTotal # Holdings: 8 fundsFund Manager: IBM Retirement Funds
and underlying fund managers
Target Retirement 2015 Fund (as of 6/30/18)
Target Allocation (by fund)
Standard: Benchmark: Target Retirement 3 YR 5 YR Standard & Poor’s 500 Index 2015 Composite Index Sharpe Ratio 0.86 1.04
R-Squared* 0.71 1.00 Standard Deviation 4.86% 4.95% Beta* 0.40 1.00 Alpha* -0.35% 0.11%
*Based on trailing 36 months’ returns; alphas are annualized.
For detailed equity and fixed-income characteristics, please see underlying funds.
The fund does not buy securities directly; instead, it invests in eight 401(k) Plus Plan funds: the Inflation Protected Bond Fund, the Total Bond Market Fund, the High Yield & Emerging Markets Bond Fund, the Global Real Estate Stock Index Fund, the Total Stock Market Index Fund, the Total International Stock Market Index Fund, the Balanced Exposure Fund and the Commodities Fund. This gives the fund exposure to a broadly diversi-fied group of U.S. and foreign stocks and various types of bonds. As of June 30, 2018, the fund’s target asset allocation between stocks and bonds is 45.5% stocks*, 54.5% bonds. The current target allocations by fund are provided in the Target Allocations chart above. The allocations to each fund are maintained close to the target allocations and the target alloca-tions are adjusted semi-annually, based on an asset allocation strategy that becomes increasingly conservative over time. For detailed information on the underlying funds that comprise the Target Retirement 2015 Fund, please read the corresponding fund flyers.
* Exposure to the Balanced Exposure and Commodities funds are considered part of the allocation to stocks.
Holdings
Advanced Analytics
Commodities Fund 2.0%
Balanced Exposure Fund 12.0%
Total Stock Market Index Fund 16.3%
Total International Stock Market Index Fund 10.8%
High Yield & Emerging Markets Bond Fund 4.3%
Global Real Estate Stock Index Fund 4.4%
Total Bond Market Fund 27.3%
Inflation Protected Bond Fund 22.9%
Growth of $10,000: Target Retirement 2020 Fund vs. Benchmarks $40,000
$30,000
$20,000
$10,000
0
% Total Return as of 6/30/18 3 Mos YTD 1 Yr 3 Yr 5 Yr 10 Yr Since Inception of Fund
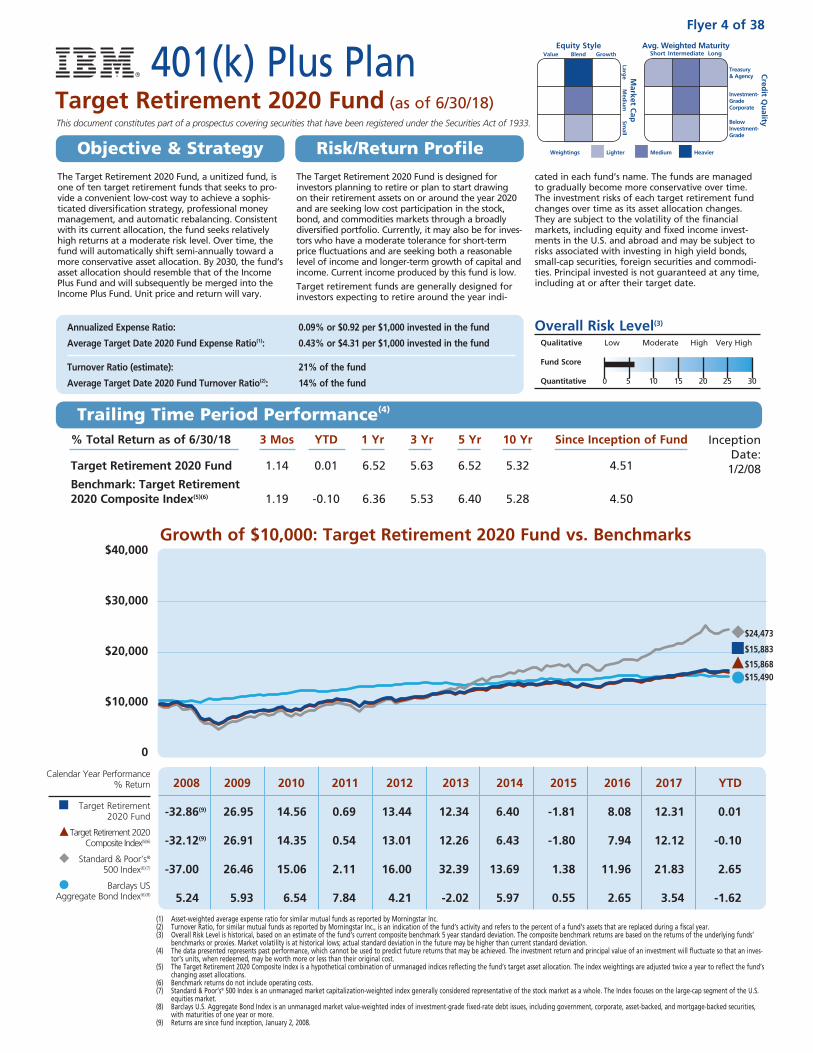
Target Retirement 2020 Fund 1.14 0.01 6.52 5.63 6.52 5.32 4.51
Benchmark: Target Retirement 2020 Composite Index(5)(6) 1.19 -0.10 6.36 5.53 6.40 5.28 4.50
The Target Retirement 2020 Fund is designed for investors planning to retire or plan to start drawing on their retirement assets on or around the year 2020 and are seeking low cost participation in the stock, bond, and commodities markets through a broadly diversified portfolio. Currently, it may also be for inves-tors who have a moderate tolerance for short-term price fluctuations and are seeking both a reasonable level of income and longer-term growth of capital and income. Current income produced by this fund is low.
Target retirement funds are generally designed for investors expecting to retire around the year indi-
cated in each fund’s name. The funds are managed to gradually become more conservative over time. The investment risks of each target retirement fund changes over time as its asset allocation changes. They are subject to the volatility of the financial markets, including equity and fixed income invest-ments in the U.S. and abroad and may be subject to risks associated with investing in high yield bonds, small-cap securities, foreign securities and commodi-ties. Principal invested is not guaranteed at any time, including at or after their target date.
Annualized Expense Ratio: 0.09% or $0.92 per $1,000 invested in the fund
Average Target Date 2020 Fund Expense Ratio(1): 0.43% or $4.31 per $1,000 invested in the fund
Turnover Ratio (estimate): 21% of the fund
Average Target Date 2020 Fund Turnover Ratio(2): 14% of the fund
Inception Date:
1/2/08
(1) Asset-weighted average expense ratio for similar mutual funds as reported by Morningstar Inc.(2) Turnover Ratio, for similar mutual funds as reported by Morningstar Inc., is an indication of the fund’s activity and refers to the percent of a fund’s assets that are replaced during a fiscal year.(3) Overall Risk Level is historical, based on an estimate of the fund’s current composite benchmark 5 year standard deviation. The composite benchmark returns are based on the returns of the underlying funds’
benchmarks or proxies. Market volatility is at historical lows; actual standard deviation in the future may be higher than current standard deviation.(4) The data presented represents past performance, which cannot be used to predict future returns that may be achieved. The investment return and principal value of an investment will fluctuate so that an inves-
tor’s units, when redeemed, may be worth more or less than their original cost.(5) The Target Retirement 2020 Composite Index is a hypothetical combination of unmanaged indices reflecting the fund’s target asset allocation. The index weightings are adjusted twice a year to reflect the fund’s
changing asset allocations.(6) Benchmark returns do not include operating costs.(7) Standard & Poor’s® 500 Index is an unmanaged market capitalization-weighted index generally considered representative of the stock market as a whole. The Index focuses on the large-cap segment of the U.S.
equities market.(8) Barclays U.S. Aggregate Bond Index is an unmanaged market value-weighted index of investment-grade fixed-rate debt issues, including government, corporate, asset-backed, and mortgage-backed securities,
with maturities of one year or more.(9) Returns are since fund inception, January 2, 2008.
Overall Risk Level(3)
Qualitative Low Moderate High Very High
Fund Score
Quantitative 0 5 10 15 20 25 30
The Target Retirement 2020 Fund, a unitized fund, is one of ten target retirement funds that seeks to pro-vide a convenient low-cost way to achieve a sophis-ticated diversification strategy, professional money management, and automatic rebalancing. Consistent with its current allocation, the fund seeks relatively high returns at a moderate risk level. Over time, the fund will automatically shift semi-annually toward a more conservative asset allocation. By 2030, the fund’s asset allocation should resemble that of the Income Plus Fund and will subsequently be merged into the Income Plus Fund. Unit price and return will vary.
2008 2009 2010 2011 2012 2013 2014 2015 2016 2017 YTD
-32.86(9) 26.95 14.56 0.69 13.44 12.34 6.40 -1.81 8.08 12.31 0.01
-32.12(9) 26.91 14.35 0.54 13.01 12.26 6.43 -1.80 7.94 12.12 -0.10
-37.00 26.46 15.06 2.11 16.00 32.39 13.69 1.38 11.96 21.83 2.65
5.24 5.93 6.54 7.84 4.21 -2.02 5.97 0.55 2.65 3.54 -1.62
Calendar Year Performance % Return
Target Retirement 2020 Fund
Target Retirement 2020 Composite Index(5)(6)
Standard & Poor’s® 500 Index(6)(7)
Barclays US Aggregate Bond Index(6)(8)
This document constitutes part of a prospectus covering securities that have been registered under the Securities Act of 1933.
Avg. Weighted Maturity Short Intermediate Long
Equity Style Value Blend Growth
Market C
ap
Large
Med
ium
Sm
all
Cred
it Qu
ality
Treasury & Agency
Investment- Grade Corporate
Below Investment- Grade
LighterWeightings Medium Heavier
401(k) Plus PlanTarget Retirement 2020 Fund (as of 6/30/18)
Flyer 4 of 38
Objective & Strategy Risk/Return Profile
Trailing Time Period Performance(4)
$15,490
$15,883
$15,868
$24,473
The underlying funds may lend their holdings to qualified institutional investors to seek to enhance returns through fees earned related to the securities lent. Although all loans of securities are fully collateralized, there is some risk of loss if a borrower defaults on its obligation or losses occur related to the collateral received. Securities lending is performed in accordance with applicable law and regulations.The IBM 401(k) Plus Plan Trust (Trust) has claimed an exclusion from the definition of the term “commodity pool operator” under the Commodity Exchange Act (Act) and, therefore, the Trust is not subject to registration or regulation as a pool operator under the Act.IBM® is a registered trademark of International Business Machines Corporation. All rights reserved.Standard & Poors’®, S&P®, S&P 500®, Standard & Poor’s 500, and 500 are trademarks of The McGraw-Hill Companies, Inc.©2018 International Business Machines Corporation. All rights reserved.
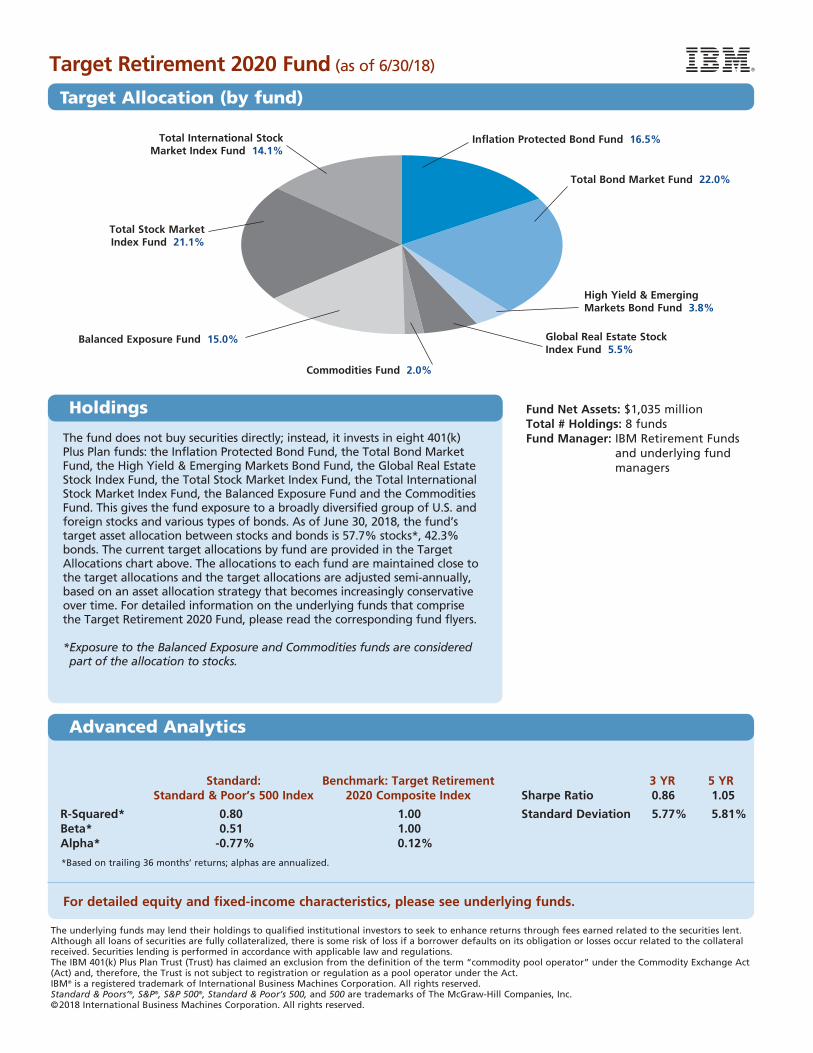
Fund Net Assets: $1,035 millionTotal # Holdings: 8 fundsFund Manager: IBM Retirement Funds
and underlying fund managers
Target Retirement 2020 Fund (as of 6/30/18)
Target Allocation (by fund)
Standard: Benchmark: Target Retirement 3 YR 5 YR Standard & Poor’s 500 Index 2020 Composite Index Sharpe Ratio 0.86 1.05
R-Squared* 0.80 1.00 Standard Deviation 5.77% 5.81% Beta* 0.51 1.00 Alpha* -0.77% 0.12%
*Based on trailing 36 months’ returns; alphas are annualized.
For detailed equity and fixed-income characteristics, please see underlying funds.
The fund does not buy securities directly; instead, it invests in eight 401(k) Plus Plan funds: the Inflation Protected Bond Fund, the Total Bond Market Fund, the High Yield & Emerging Markets Bond Fund, the Global Real Estate Stock Index Fund, the Total Stock Market Index Fund, the Total International Stock Market Index Fund, the Balanced Exposure Fund and the Commodities Fund. This gives the fund exposure to a broadly diversified group of U.S. and foreign stocks and various types of bonds. As of June 30, 2018, the fund’s target asset allocation between stocks and bonds is 57.7% stocks*, 42.3% bonds. The current target allocations by fund are provided in the Target Allocations chart above. The allocations to each fund are maintained close to the target allocations and the target allocations are adjusted semi-annually, based on an asset allocation strategy that becomes increasingly conservative over time. For detailed information on the underlying funds that comprise the Target Retirement 2020 Fund, please read the corresponding fund flyers.
* Exposure to the Balanced Exposure and Commodities funds are considered part of the allocation to stocks.
Holdings
Advanced Analytics
Commodities Fund 2.0%
Total Stock Market Index Fund 21.1%
Balanced Exposure Fund 15.0%
Total International Stock Market Index Fund 14.1%
High Yield & Emerging Markets Bond Fund 3.8%
Global Real Estate Stock Index Fund 5.5%
Total Bond Market Fund 22.0%
Inflation Protected Bond Fund 16.5%
Growth of $10,000: Target Retirement 2025 Fund vs. Benchmarks $40,000
$30,000
$20,000
$10,000
0
% Total Return as of 6/30/18 3 Mos YTD 1 Yr 3 Yr 5 Yr 10 Yr Since Inception of Fund
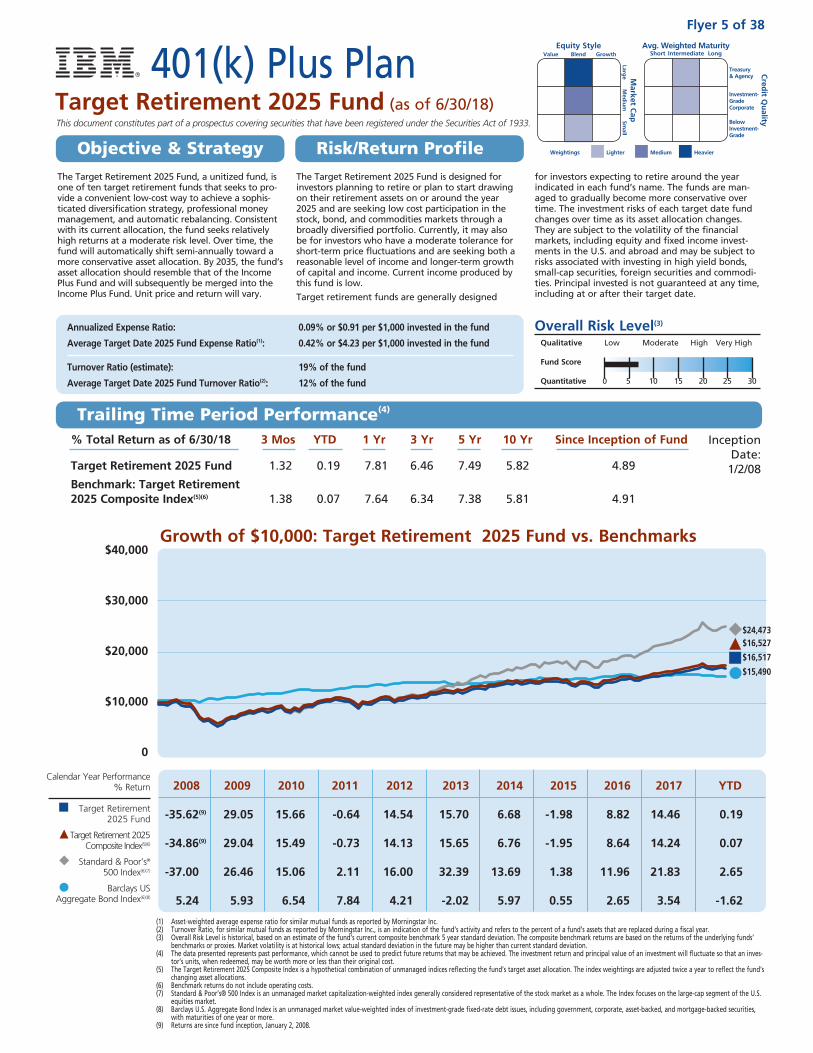
Target Retirement 2025 Fund 1.32 0.19 7.81 6.46 7.49 5.82 4.89
Benchmark: Target Retirement 2025 Composite Index(5)(6) 1.38 0.07 7.64 6.34 7.38 5.81 4.91
The Target Retirement 2025 Fund is designed for investors planning to retire or plan to start drawing on their retirement assets on or around the year 2025 and are seeking low cost participation in the stock, bond, and commodities markets through a broadly diversified portfolio. Currently, it may also be for investors who have a moderate tolerance for short-term price fluctuations and are seeking both a reasonable level of income and longer-term growth of capital and income. Current income produced by this fund is low.
Target retirement funds are generally designed
for investors expecting to retire around the year indicated in each fund’s name. The funds are man-aged to gradually become more conservative over time. The investment risks of each target date fund changes over time as its asset allocation changes. They are subject to the volatility of the financial markets, including equity and fixed income invest-ments in the U.S. and abroad and may be subject to risks associated with investing in high yield bonds, small-cap securities, foreign securities and commodi-ties. Principal invested is not guaranteed at any time, including at or after their target date.
Annualized Expense Ratio: 0.09% or $0.91 per $1,000 invested in the fund
Average Target Date 2025 Fund Expense Ratio(1): 0.42% or $4.23 per $1,000 invested in the fund
Turnover Ratio (estimate): 19% of the fund
Average Target Date 2025 Fund Turnover Ratio(2): 12% of the fund
Inception Date:
1/2/08
(1) Asset-weighted average expense ratio for similar mutual funds as reported by Morningstar Inc.(2) Turnover Ratio, for similar mutual funds as reported by Morningstar Inc., is an indication of the fund’s activity and refers to the percent of a fund’s assets that are replaced during a fiscal year.(3) Overall Risk Level is historical, based on an estimate of the fund’s current composite benchmark 5 year standard deviation. The composite benchmark returns are based on the returns of the underlying funds’
benchmarks or proxies. Market volatility is at historical lows; actual standard deviation in the future may be higher than current standard deviation.(4) The data presented represents past performance, which cannot be used to predict future returns that may be achieved. The investment return and principal value of an investment will fluctuate so that an inves-
tor’s units, when redeemed, may be worth more or less than their original cost.(5) The Target Retirement 2025 Composite Index is a hypothetical combination of unmanaged indices reflecting the fund’s target asset allocation. The index weightings are adjusted twice a year to reflect the fund’s
changing asset allocations.(6) Benchmark returns do not include operating costs. (7) Standard & Poor’s® 500 Index is an unmanaged market capitalization-weighted index generally considered representative of the stock market as a whole. The Index focuses on the large-cap segment of the U.S.
equities market.(8) Barclays U.S. Aggregate Bond Index is an unmanaged market value-weighted index of investment-grade fixed-rate debt issues, including government, corporate, asset-backed, and mortgage-backed securities,
with maturities of one year or more.(9) Returns are since fund inception, January 2, 2008.
Overall Risk Level(3)
Qualitative Low Moderate High Very High
Fund Score
Quantitative 0 5 10 15 20 25 30
The Target Retirement 2025 Fund, a unitized fund, is one of ten target retirement funds that seeks to pro-vide a convenient low-cost way to achieve a sophis-ticated diversification strategy, professional money management, and automatic rebalancing. Consistent with its current allocation, the fund seeks relatively high returns at a moderate risk level. Over time, the fund will automatically shift semi-annually toward a more conservative asset allocation. By 2035, the fund’s asset allocation should resemble that of the Income Plus Fund and will subsequently be merged into the Income Plus Fund. Unit price and return will vary.
2008 2009 2010 2011 2012 2013 2014 2015 2016 2017 YTD
-35.62(9) 29.05 15.66 -0.64 14.54 15.70 6.68 -1.98 8.82 14.46 0.19
-34.86(9) 29.04 15.49 -0.73 14.13 15.65 6.76 -1.95 8.64 14.24 0.07
-37.00 26.46 15.06 2.11 16.00 32.39 13.69 1.38 11.96 21.83 2.65
5.24 5.93 6.54 7.84 4.21 -2.02 5.97 0.55 2.65 3.54 -1.62
Calendar Year Performance % Return
Target Retirement 2025 Fund
Target Retirement 2025 Composite Index(5)(6)
Standard & Poor’s® 500 Index(6)(7)
Barclays US Aggregate Bond Index(6)(8)
This document constitutes part of a prospectus covering securities that have been registered under the Securities Act of 1933.
Equity Style Value Blend Growth
Market C
ap
Large
Med
ium
Sm
all
Avg. Weighted Maturity Short Intermediate Long
Cred
it Qu
ality
Treasury & Agency
Investment- Grade Corporate
Below Investment- Grade
LighterWeightings Medium Heavier
401(k) Plus PlanTarget Retirement 2025 Fund (as of 6/30/18)
Flyer 5 of 38
Objective & Strategy Risk/Return Profile
Trailing Time Period Performance(4)
$24,473
$16,517
$16,527
$15,490
The underlying funds may lend their holdings to qualified institutional investors to seek to enhance returns through fees earned related to the securities lent. Although all loans of securities are fully collateralized, there is some risk of loss if a borrower defaults on its obligation or losses occur related to the collateral received. Securities lending is performed in accordance with applicable law and regulations.The IBM 401(k) Plus Plan Trust (Trust) has claimed an exclusion from the definition of the term “commodity pool operator” under the Commodity Exchange Act (Act) and, therefore, the Trust is not subject to registration or regulation as a pool operator under the Act.IBM® is a registered trademark of International Business Machines Corporation. All rights reserved.Standard & Poors’®, S&P®, S&P 500®, Standard & Poor’s 500, and 500 are trademarks of The McGraw-Hill Companies, Inc.©2018 International Business Machines Corporation. All rights reserved.
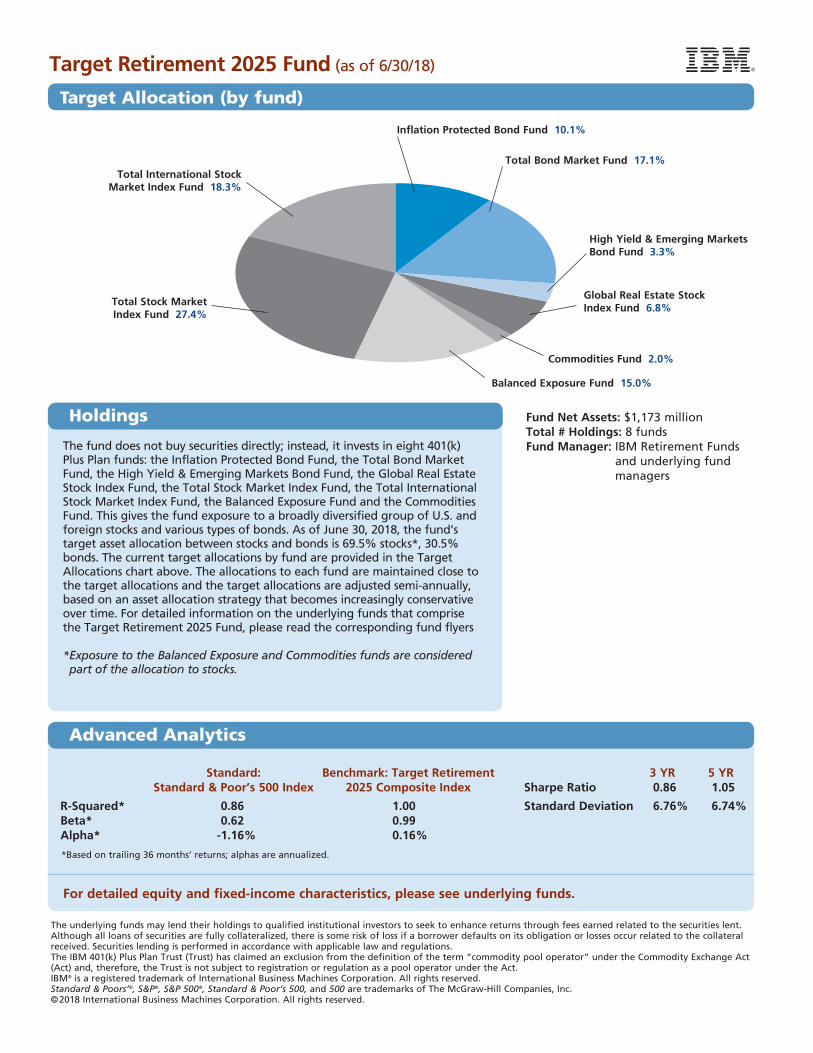
Fund Net Assets: $1,173 millionTotal # Holdings: 8 fundsFund Manager: IBM Retirement Funds
and underlying fund managers
Target Retirement 2025 Fund (as of 6/30/18)
Target Allocation (by fund)
Standard: Benchmark: Target Retirement 3 YR 5 YR Standard & Poor’s 500 Index 2025 Composite Index Sharpe Ratio 0.86 1.05
R-Squared* 0.86 1.00 Standard Deviation 6.76% 6.74% Beta* 0.62 0.99 Alpha* -1.16% 0.16%
*Based on trailing 36 months’ returns; alphas are annualized.
For detailed equity and fixed-income characteristics, please see underlying funds.
The fund does not buy securities directly; instead, it invests in eight 401(k) Plus Plan funds: the Inflation Protected Bond Fund, the Total Bond Market Fund, the High Yield & Emerging Markets Bond Fund, the Global Real Estate Stock Index Fund, the Total Stock Market Index Fund, the Total International Stock Market Index Fund, the Balanced Exposure Fund and the Commodities Fund. This gives the fund exposure to a broadly diversified group of U.S. and foreign stocks and various types of bonds. As of June 30, 2018, the fund’s target asset allocation between stocks and bonds is 69.5% stocks*, 30.5% bonds. The current target allocations by fund are provided in the Target Allocations chart above. The allocations to each fund are maintained close to the target allocations and the target allocations are adjusted semi-annually, based on an asset allocation strategy that becomes increasingly conservative over time. For detailed information on the underlying funds that comprise the Target Retirement 2025 Fund, please read the corresponding fund flyers
* Exposure to the Balanced Exposure and Commodities funds are considered part of the allocation to stocks.
Holdings
Advanced Analytics
Commodities Fund 2.0%
Balanced Exposure Fund 15.0%
Total Stock Market Index Fund 27.4%
Total International Stock Market Index Fund 18.3%
Total Bond Market Fund 17.1%
Global Real Estate Stock Index Fund 6.8%
High Yield & Emerging Markets Bond Fund 3.3%
Inflation Protected Bond Fund 10.1%
Growth of $10,000: Target Retirement 2030 Fund vs. Benchmarks $40,000
$30,000
$20,000
$10,000
0
% Total Return as of 6/30/18 3 Mos YTD 1 Yr 3 Yr 5 Yr 10 Yr Since Inception of Fund
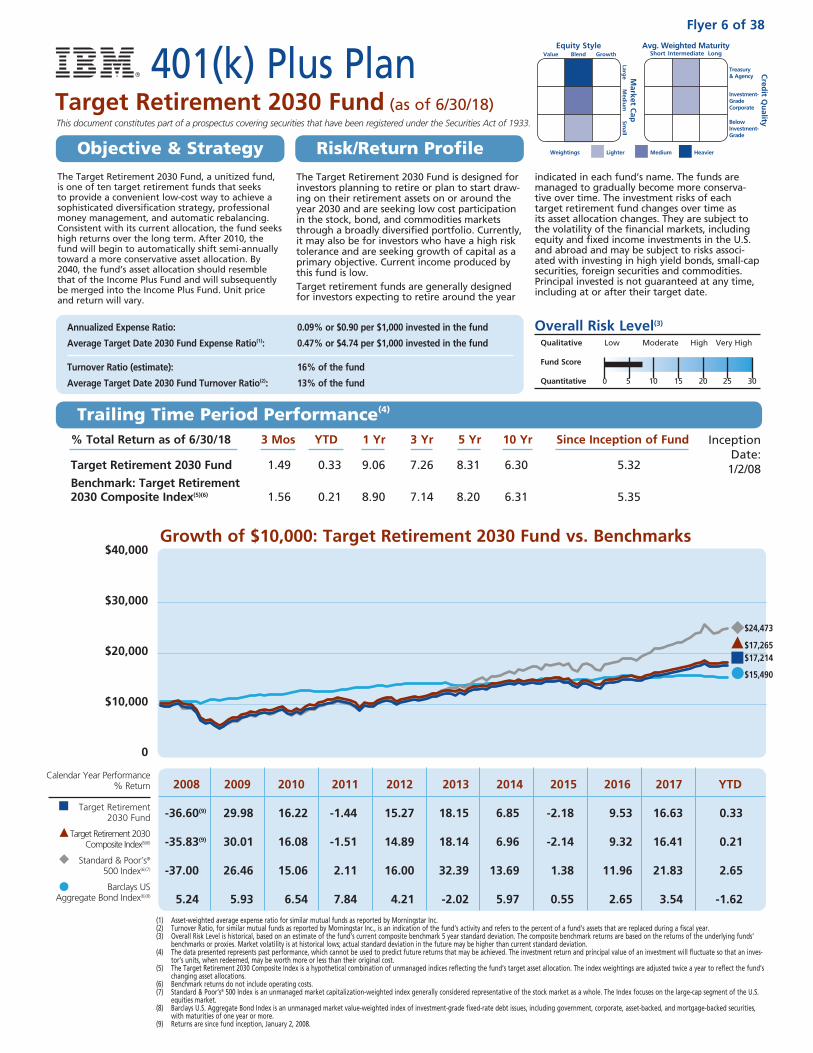
Target Retirement 2030 Fund 1.49 0.33 9.06 7.26 8.31 6.30 5.32
Benchmark: Target Retirement 2030 Composite Index(5)(6) 1.56 0.21 8.90 7.14 8.20 6.31 5.35
The Target Retirement 2030 Fund is designed for investors planning to retire or plan to start draw-ing on their retirement assets on or around the year 2030 and are seeking low cost participation in the stock, bond, and commodities markets through a broadly diversified portfolio. Currently, it may also be for investors who have a high risk tolerance and are seeking growth of capital as a primary objective. Current income produced by this fund is low.Target retirement funds are generally designed for investors expecting to retire around the year
indicated in each fund’s name. The funds are managed to gradually become more conserva-tive over time. The investment risks of each target retirement fund changes over time as its asset allocation changes. They are subject to the volatility of the financial markets, including equity and fixed income investments in the U.S. and abroad and may be subject to risks associ-ated with investing in high yield bonds, small-cap securities, foreign securities and commodities. Principal invested is not guaranteed at any time, including at or after their target date.
Annualized Expense Ratio: 0.09% or $0.90 per $1,000 invested in the fund
Average Target Date 2030 Fund Expense Ratio(1): 0.47% or $4.74 per $1,000 invested in the fund
Turnover Ratio (estimate): 16% of the fund
Average Target Date 2030 Fund Turnover Ratio(2): 13% of the fund
Inception Date:
1/2/08
(1) Asset-weighted average expense ratio for similar mutual funds as reported by Morningstar Inc.(2) Turnover Ratio, for similar mutual funds as reported by Morningstar Inc., is an indication of the fund’s activity and refers to the percent of a fund’s assets that are replaced during a fiscal year.(3) Overall Risk Level is historical, based on an estimate of the fund’s current composite benchmark 5 year standard deviation. The composite benchmark returns are based on the returns of the underlying funds’
benchmarks or proxies. Market volatility is at historical lows; actual standard deviation in the future may be higher than current standard deviation.(4) The data presented represents past performance, which cannot be used to predict future returns that may be achieved. The investment return and principal value of an investment will fluctuate so that an inves-
tor’s units, when redeemed, may be worth more or less than their original cost.(5) The Target Retirement 2030 Composite Index is a hypothetical combination of unmanaged indices reflecting the fund’s target asset allocation. The index weightings are adjusted twice a year to reflect the fund’s
changing asset allocations.(6) Benchmark returns do not include operating costs. (7) Standard & Poor’s® 500 Index is an unmanaged market capitalization-weighted index generally considered representative of the stock market as a whole. The Index focuses on the large-cap segment of the U.S.
equities market.(8) Barclays U.S. Aggregate Bond Index is an unmanaged market value-weighted index of investment-grade fixed-rate debt issues, including government, corporate, asset-backed, and mortgage-backed securities,
with maturities of one year or more.(9) Returns are since fund inception, January 2, 2008.
Overall Risk Level(3)
Qualitative Low Moderate High Very High
Fund Score
Quantitative 0 5 10 15 20 25 30
The Target Retirement 2030 Fund, a unitized fund, is one of ten target retirement funds that seeks to provide a convenient low-cost way to achieve a sophisticated diversification strategy, professional money management, and automatic rebalancing. Consistent with its current allocation, the fund seeks high returns over the long term. After 2010, the fund will begin to automatically shift semi-annually toward a more conservative asset allocation. By 2040, the fund’s asset allocation should resemble that of the Income Plus Fund and will subsequently be merged into the Income Plus Fund. Unit price and return will vary.
2008 2009 2010 2011 2012 2013 2014 2015 2016 2017 YTD
-36.60(9) 29.98 16.22 -1.44 15.27 18.15 6.85 -2.18 9.53 16.63 0.33
-35.83(9) 30.01 16.08 -1.51 14.89 18.14 6.96 -2.14 9.32 16.41 0.21
-37.00 26.46 15.06 2.11 16.00 32.39 13.69 1.38 11.96 21.83 2.65
5.24 5.93 6.54 7.84 4.21 -2.02 5.97 0.55 2.65 3.54 -1.62
Calendar Year Performance % Return
Target Retirement 2030 Fund
Target Retirement 2030 Composite Index(5)(6)
Standard & Poor’s® 500 Index(6)(7)
Barclays US Aggregate Bond Index(6)(8)
This document constitutes part of a prospectus covering securities that have been registered under the Securities Act of 1933.
Equity Style Value Blend Growth
Market C
ap
Large
Med
ium
Sm
all
Avg. Weighted Maturity Short Intermediate Long
Cred
it Qu
ality
Treasury & Agency
Investment- Grade Corporate
Below Investment- Grade
LighterWeightings Medium Heavier
401(k) Plus PlanTarget Retirement 2030 Fund (as of 6/30/18)
Flyer 6 of 38
Objective & Strategy Risk/Return Profile
Trailing Time Period Performance(4)
$24,473
$17,214$17,265
$15,490
The underlying funds may lend their holdings to qualified institutional investors to seek to enhance returns through fees earned related to the securities lent. Although all loans of securities are fully collateralized, there is some risk of loss if a borrower defaults on its obligation or losses occur related to the collateral received. Securities lending is performed in accordance with applicable law and regulations.The IBM 401(k) Plus Plan Trust (Trust) has claimed an exclusion from the definition of the term “commodity pool operator” under the Commodity Exchange Act (Act) and, therefore, the Trust is not subject to registration or regulation as a pool operator under the Act.IBM® is a registered trademark of International Business Machines Corporation. All rights reserved.Standard & Poors’®, S&P®, S&P 500®, Standard & Poor’s 500, and 500 are trademarks of The McGraw-Hill Companies, Inc.©2018 International Business Machines Corporation. All rights reserved.
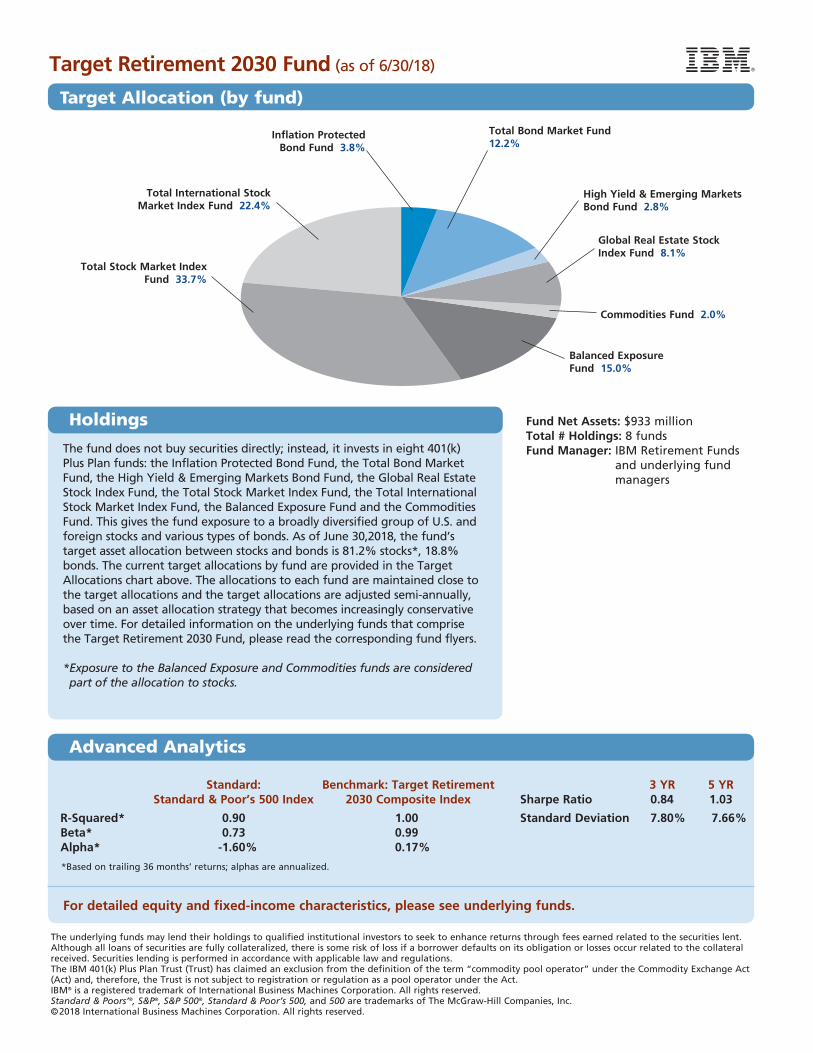
Fund Net Assets: $933 millionTotal # Holdings: 8 fundsFund Manager: IBM Retirement Funds
and underlying fund managers
Target Retirement 2030 Fund (as of 6/30/18)
Target Allocation (by fund)
Standard: Benchmark: Target Retirement 3 YR 5 YR Standard & Poor’s 500 Index 2030 Composite Index Sharpe Ratio 0.84 1.03
R-Squared* 0.90 1.00 Standard Deviation 7.80% 7.66% Beta* 0.73 0.99 Alpha* -1.60% 0.17%
*Based on trailing 36 months’ returns; alphas are annualized.
For detailed equity and fixed-income characteristics, please see underlying funds.
The fund does not buy securities directly; instead, it invests in eight 401(k) Plus Plan funds: the Inflation Protected Bond Fund, the Total Bond Market Fund, the High Yield & Emerging Markets Bond Fund, the Global Real Estate Stock Index Fund, the Total Stock Market Index Fund, the Total International Stock Market Index Fund, the Balanced Exposure Fund and the Commodities Fund. This gives the fund exposure to a broadly diversified group of U.S. and foreign stocks and various types of bonds. As of June 30,2018, the fund’s target asset allocation between stocks and bonds is 81.2% stocks*, 18.8% bonds. The current target allocations by fund are provided in the Target Allocations chart above. The allocations to each fund are maintained close to the target allocations and the target allocations are adjusted semi-annually, based on an asset allocation strategy that becomes increasingly conservative over time. For detailed information on the underlying funds that comprise the Target Retirement 2030 Fund, please read the corresponding fund flyers.
* Exposure to the Balanced Exposure and Commodities funds are considered part of the allocation to stocks.
Holdings
Advanced Analytics
Global Real Estate Stock Index Fund 8.1%
Balanced Exposure Fund 15.0%
Total Stock Market Index Fund 33.7%
Total International Stock Market Index Fund 22.4%
Total Bond Market Fund 12.2%
Inflation Protected Bond Fund 3.8%
Commodities Fund 2.0%
High Yield & Emerging Markets Bond Fund 2.8%
Growth of $10,000: Target Retirement 2035 Fund vs. Benchmarks $40,000
$30,000
$20,000
$10,000
0
% Total Return as of 6/30/18 3 Mos YTD 1 Yr 3 Yr 5 Yr 10 Yr Since Inception of Fund
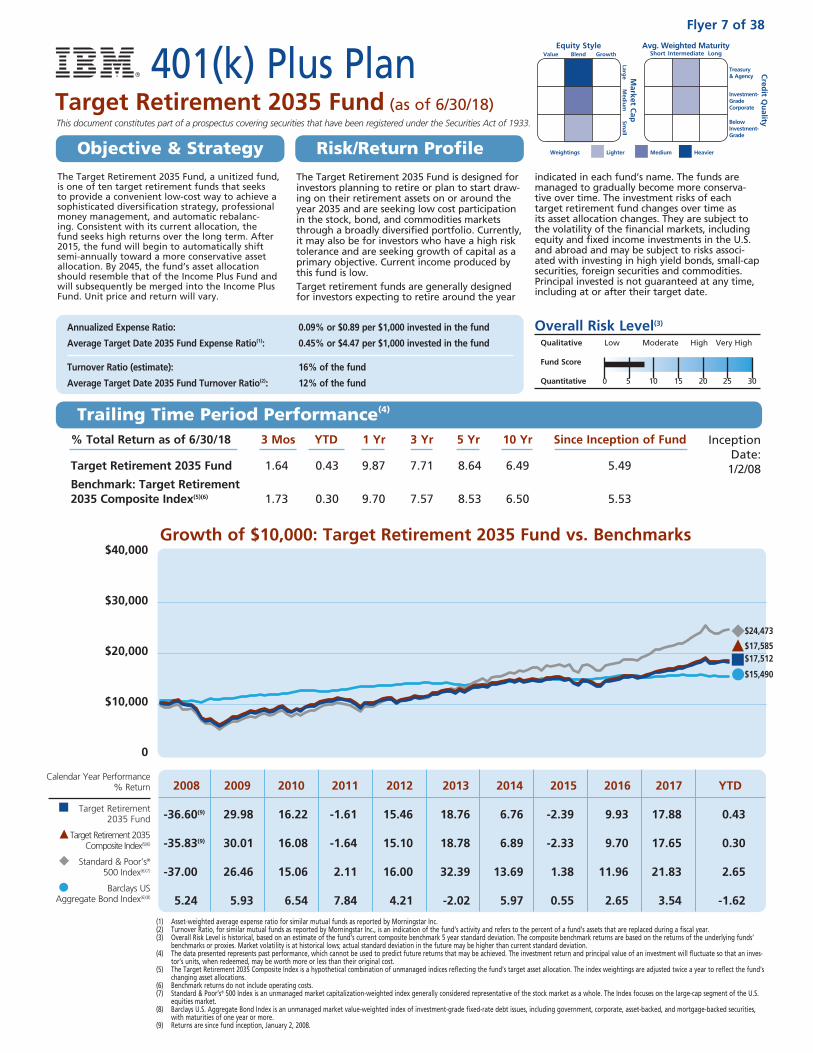
Target Retirement 2035 Fund 1.64 0.43 9.87 7.71 8.64 6.49 5.49
Benchmark: Target Retirement 2035 Composite Index(5)(6) 1.73 0.30 9.70 7.57 8.53 6.50 5.53
The Target Retirement 2035 Fund is designed for investors planning to retire or plan to start draw-ing on their retirement assets on or around the year 2035 and are seeking low cost participation in the stock, bond, and commodities markets through a broadly diversified portfolio. Currently, it may also be for investors who have a high risk tolerance and are seeking growth of capital as a primary objective. Current income produced by this fund is low.Target retirement funds are generally designed for investors expecting to retire around the year
indicated in each fund’s name. The funds are managed to gradually become more conserva-tive over time. The investment risks of each target retirement fund changes over time as its asset allocation changes. They are subject to the volatility of the financial markets, including equity and fixed income investments in the U.S. and abroad and may be subject to risks associ-ated with investing in high yield bonds, small-cap securities, foreign securities and commodities. Principal invested is not guaranteed at any time, including at or after their target date.
Annualized Expense Ratio: 0.09% or $0.89 per $1,000 invested in the fund
Average Target Date 2035 Fund Expense Ratio(1): 0.45% or $4.47 per $1,000 invested in the fund
Turnover Ratio (estimate): 16% of the fund
Average Target Date 2035 Fund Turnover Ratio(2): 12% of the fund
Inception Date:
1/2/08
(1) Asset-weighted average expense ratio for similar mutual funds as reported by Morningstar Inc.(2) Turnover Ratio, for similar mutual funds as reported by Morningstar Inc., is an indication of the fund’s activity and refers to the percent of a fund’s assets that are replaced during a fiscal year.(3) Overall Risk Level is historical, based on an estimate of the fund’s current composite benchmark 5 year standard deviation. The composite benchmark returns are based on the returns of the underlying funds’
benchmarks or proxies. Market volatility is at historical lows; actual standard deviation in the future may be higher than current standard deviation.(4) The data presented represents past performance, which cannot be used to predict future returns that may be achieved. The investment return and principal value of an investment will fluctuate so that an inves-
tor’s units, when redeemed, may be worth more or less than their original cost.(5) The Target Retirement 2035 Composite Index is a hypothetical combination of unmanaged indices reflecting the fund’s target asset allocation. The index weightings are adjusted twice a year to reflect the fund’s
changing asset allocations.(6) Benchmark returns do not include operating costs.(7) Standard & Poor’s® 500 Index is an unmanaged market capitalization-weighted index generally considered representative of the stock market as a whole. The Index focuses on the large-cap segment of the U.S.
equities market.(8) Barclays U.S. Aggregate Bond Index is an unmanaged market value-weighted index of investment-grade fixed-rate debt issues, including government, corporate, asset-backed, and mortgage-backed securities,
with maturities of one year or more.(9) Returns are since fund inception, January 2, 2008.
Overall Risk Level(3)
Qualitative Low Moderate High Very High
Fund Score
Quantitative 0 5 10 15 20 25 30
The Target Retirement 2035 Fund, a unitized fund, is one of ten target retirement funds that seeks to provide a convenient low-cost way to achieve a sophisticated diversification strategy, professional money management, and automatic rebalanc-ing. Consistent with its current allocation, the fund seeks high returns over the long term. After 2015, the fund will begin to automatically shift semi-annually toward a more conservative asset allocation. By 2045, the fund’s asset allocation should resemble that of the Income Plus Fund and will subsequently be merged into the Income Plus Fund. Unit price and return will vary.
2008 2009 2010 2011 2012 2013 2014 2015 2016 2017 YTD
-36.60(9) 29.98 16.22 -1.61 15.46 18.76 6.76 -2.39 9.93 17.88 0.43
-35.83(9) 30.01 16.08 -1.64 15.10 18.78 6.89 -2.33 9.70 17.65 0.30
-37.00 26.46 15.06 2.11 16.00 32.39 13.69 1.38 11.96 21.83 2.65
5.24 5.93 6.54 7.84 4.21 -2.02 5.97 0.55 2.65 3.54 -1.62
Calendar Year Performance % Return
Target Retirement 2035 Fund
Target Retirement 2035 Composite Index(5)(6)
Standard & Poor’s® 500 Index(6)(7)
Barclays US Aggregate Bond Index(6)(8)
This document constitutes part of a prospectus covering securities that have been registered under the Securities Act of 1933.
Equity Style Value Blend Growth
Market C
ap
Large
Med
ium
Sm
all
Avg. Weighted Maturity Short Intermediate Long
Cred
it Qu
ality
Treasury & Agency
Investment- Grade Corporate
Below Investment- Grade
LighterWeightings Medium Heavier
401(k) Plus PlanTarget Retirement 2035 Fund (as of 6/30/18)
Flyer 7 of 38
Objective & Strategy Risk/Return Profile
Trailing Time Period Performance(4)
$24,473
$17,512$17,585
$15,490
The underlying funds may lend their holdings to qualified institutional investors to seek to enhance returns through fees earned related to the securities lent. Although all loans of securities are fully collateralized, there is some risk of loss if a borrower defaults on its obligation or losses occur related to the collateral received. Securities lending is performed in accordance with applicable law and regulations.The IBM 401(k) Plus Plan Trust (Trust) has claimed an exclusion from the definition of the term “commodity pool operator” under the Commodity Exchange Act (Act) and, therefore, the Trust is not subject to registration or regulation as a pool operator under the Act.IBM® is a registered trademark of International Business Machines Corporation. All rights reserved.Standard & Poors’®, S&P®, S&P 500®, Standard & Poor’s 500, and 500 are trademarks of The McGraw-Hill Companies, Inc.©2018 International Business Machines Corporation. All rights reserved.
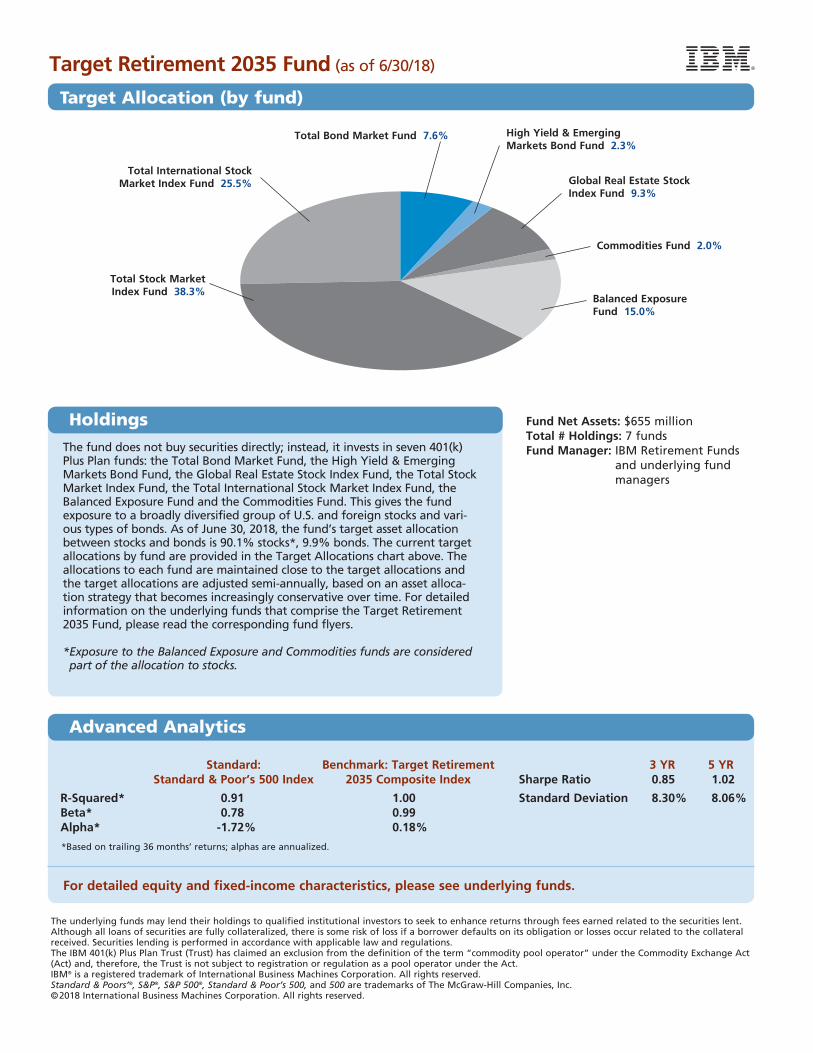
Fund Net Assets: $655 millionTotal # Holdings: 7 fundsFund Manager: IBM Retirement Funds
and underlying fund managers
Target Retirement 2035 Fund (as of 6/30/18)
Target Allocation (by fund)
Standard: Benchmark: Target Retirement 3 YR 5 YR Standard & Poor’s 500 Index 2035 Composite Index Sharpe Ratio 0.85 1.02
R-Squared* 0.91 1.00 Standard Deviation 8.30% 8.06% Beta* 0.78 0.99 Alpha* -1.72% 0.18%
*Based on trailing 36 months’ returns; alphas are annualized.
For detailed equity and fixed-income characteristics, please see underlying funds.
The fund does not buy securities directly; instead, it invests in seven 401(k) Plus Plan funds: the Total Bond Market Fund, the High Yield & Emerging Markets Bond Fund, the Global Real Estate Stock Index Fund, the Total Stock Market Index Fund, the Total International Stock Market Index Fund, the Balanced Exposure Fund and the Commodities Fund. This gives the fund exposure to a broadly diversified group of U.S. and foreign stocks and vari-ous types of bonds. As of June 30, 2018, the fund’s target asset allocation between stocks and bonds is 90.1% stocks*, 9.9% bonds. The current target allocations by fund are provided in the Target Allocations chart above. The allocations to each fund are maintained close to the target allocations and the target allocations are adjusted semi-annually, based on an asset alloca-tion strategy that becomes increasingly conservative over time. For detailed information on the underlying funds that comprise the Target Retirement 2035 Fund, please read the corresponding fund flyers.
* Exposure to the Balanced Exposure and Commodities funds are considered part of the allocation to stocks.
Holdings
Advanced Analytics
Commodities Fund 2.0%
Balanced Exposure Fund 15.0%
Total Stock Market Index Fund 38.3%
Total International Stock Market Index Fund 25.5%
Total Bond Market Fund 7.6%
Global Real Estate Stock Index Fund 9.3%
High Yield & Emerging Markets Bond Fund 2.3%
Growth of $10,000: Target Retirement 2040 Fund vs. Benchmarks $40,000
$30,000
$20,000
$10,000
0
% Total Return as of 6/30/18 3 Mos YTD 1 Yr 3 Yr 5 Yr 10 Yr Since Inception of Fund
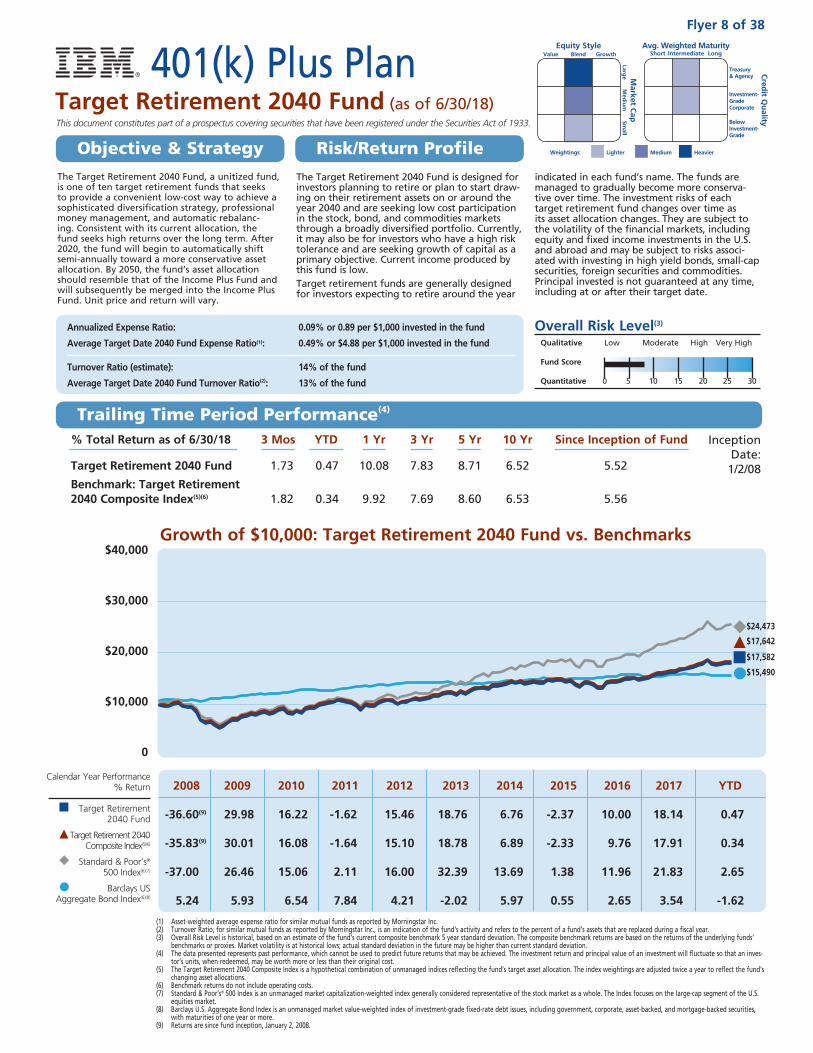
Target Retirement 2040 Fund 1.73 0.47 10.08 7.83 8.71 6.52 5.52
Benchmark: Target Retirement 2040 Composite Index(5)(6) 1.82 0.34 9.92 7.69 8.60 6.53 5.56
The Target Retirement 2040 Fund is designed for investors planning to retire or plan to start draw-ing on their retirement assets on or around the year 2040 and are seeking low cost participation in the stock, bond, and commodities markets through a broadly diversified portfolio. Currently, it may also be for investors who have a high risk tolerance and are seeking growth of capital as a primary objective. Current income produced by this fund is low.Target retirement funds are generally designed for investors expecting to retire around the year
indicated in each fund’s name. The funds are managed to gradually become more conserva-tive over time. The investment risks of each target retirement fund changes over time as its asset allocation changes. They are subject to the volatility of the financial markets, including equity and fixed income investments in the U.S. and abroad and may be subject to risks associ-ated with investing in high yield bonds, small-cap securities, foreign securities and commodities. Principal invested is not guaranteed at any time, including at or after their target date.
Annualized Expense Ratio: 0.09% or 0.89 per $1,000 invested in the fund
Average Target Date 2040 Fund Expense Ratio(1): 0.49% or $4.88 per $1,000 invested in the fund
Turnover Ratio (estimate): 14% of the fund
Average Target Date 2040 Fund Turnover Ratio(2): 13% of the fund
Inception Date:
1/2/08
(1) Asset-weighted average expense ratio for similar mutual funds as reported by Morningstar Inc.(2) Turnover Ratio, for similar mutual funds as reported by Morningstar Inc., is an indication of the fund’s activity and refers to the percent of a fund’s assets that are replaced during a fiscal year.(3) Overall Risk Level is historical, based on an estimate of the fund’s current composite benchmark 5 year standard deviation. The composite benchmark returns are based on the returns of the underlying funds’
benchmarks or proxies. Market volatility is at historical lows; actual standard deviation in the future may be higher than current standard deviation.(4) The data presented represents past performance, which cannot be used to predict future returns that may be achieved. The investment return and principal value of an investment will fluctuate so that an inves-
tor’s units, when redeemed, may be worth more or less than their original cost.(5) The Target Retirement 2040 Composite Index is a hypothetical combination of unmanaged indices reflecting the fund’s target asset allocation. The index weightings are adjusted twice a year to reflect the fund’s
changing asset allocations.(6) Benchmark returns do not include operating costs. (7) Standard & Poor’s® 500 Index is an unmanaged market capitalization-weighted index generally considered representative of the stock market as a whole. The Index focuses on the large-cap segment of the U.S.
equities market.(8) Barclays U.S. Aggregate Bond Index is an unmanaged market value-weighted index of investment-grade fixed-rate debt issues, including government, corporate, asset-backed, and mortgage-backed securities,
with maturities of one year or more.(9) Returns are since fund inception, January 2, 2008.
Overall Risk Level(3)
Qualitative Low Moderate High Very High
Fund Score
Quantitative 0 5 10 15 20 25 30
The Target Retirement 2040 Fund, a unitized fund, is one of ten target retirement funds that seeks to provide a convenient low-cost way to achieve a sophisticated diversification strategy, professional money management, and automatic rebalanc-ing. Consistent with its current allocation, the fund seeks high returns over the long term. After 2020, the fund will begin to automatically shift semi-annually toward a more conservative asset allocation. By 2050, the fund’s asset allocation should resemble that of the Income Plus Fund and will subsequently be merged into the Income Plus Fund. Unit price and return will vary.
2008 2009 2010 2011 2012 2013 2014 2015 2016 2017 YTD
-36.60(9) 29.98 16.22 -1.62 15.46 18.76 6.76 -2.37 10.00 18.14 0.47
-35.83(9) 30.01 16.08 -1.64 15.10 18.78 6.89 -2.33 9.76 17.91 0.34
-37.00 26.46 15.06 2.11 16.00 32.39 13.69 1.38 11.96 21.83 2.65
5.24 5.93 6.54 7.84 4.21 -2.02 5.97 0.55 2.65 3.54 -1.62
Calendar Year Performance % Return
Target Retirement 2040 Fund
Target Retirement 2040 Composite Index(5)(6)
Standard & Poor’s® 500 Index(6)(7)
Barclays US Aggregate Bond Index(6)(8)
This document constitutes part of a prospectus covering securities that have been registered under the Securities Act of 1933.
Equity Style Value Blend Growth
Market C
ap
Large
Med
ium
Sm
all
Avg. Weighted Maturity Short Intermediate Long
Cred
it Qu
ality
Treasury & Agency
Investment- Grade Corporate
Below Investment- Grade
LighterWeightings Medium Heavier
401(k) Plus PlanTarget Retirement 2040 Fund (as of 6/30/18)
Flyer 8 of 38
Objective & Strategy Risk/Return Profile
Trailing Time Period Performance(4)
$24,473
$17,582
$17,642
$15,490

The underlying funds may lend their holdings to qualified institutional investors to seek to enhance returns through fees earned related to the securities lent. Although all loans of securities are fully collateralized, there is some risk of loss if a borrower defaults on its obligation or losses occur related to the collateral received. Securities lending is performed in accordance with applicable law and regulations.The IBM 401(k) Plus Plan Trust (Trust) has claimed an exclusion from the definition of the term “commodity pool operator” under the Commodity Exchange Act (Act) and, therefore, the Trust is not subject to registration or regulation as a pool operator under the Act.IBM® is a registered trademark of International Business Machines Corporation. All rights reserved.Standard & Poors’®, S&P®, S&P 500®, Standard & Poor’s 500, and 500 are trademarks of The McGraw-Hill Companies, Inc.©2018 International Business Machines Corporation. All rights reserved.
Fund Net Assets: $458 millionTotal # Holdings: 7 fundsFund Manager: IBM Retirement Funds
and underlying fund managers
Target Retirement 2040 Fund (as of 6/30/18)
Target Allocation (by fund)
Standard: Benchmark: Target Retirement 3 YR 5 YR Standard & Poor’s 500 Index 2040 Composite Index Sharpe Ratio 0.86 1.02
R-Squared* 0.91 1.00 Standard Deviation 8.35% 8.10% Beta* 0.78 0.99 Alpha* -1.65% 0.19%
*Based on trailing 36 months’ returns; alphas are annualized.
For detailed equity and fixed-income characteristics, please see underlying funds.
The fund does not buy securities directly; instead, it invests in seven 401(k) Plus Plan funds: the Total Bond Market Fund, the High Yield & Emerging Markets Bond Fund, the Global Real Estate Stock Index Fund, the Total Stock Market Index Fund, the Total International Stock Market Index Fund, the Balanced Exposure Fund and the Commodities Fund. This gives the fund exposure to a broadly diversified group of U.S. and foreign stocks and vari-ous types of bonds. As of June 30, 2018, the fund’s target asset allocation between stocks and bonds is 93% stocks*, 7% bonds. The current target allocations by fund are provided in the Target Allocations chart above. The allocations to each fund are maintained close to the target allocations and the target allocations are adjusted semi-annually, based on an asset alloca-tion strategy that becomes increasingly conservative over time. For detailed information on the underlying funds that comprise the Target Retirement 2040 Fund, please read the corresponding fund flyers
* Exposure to the Balanced Exposure and Commodities funds are considered part of the allocation to stocks.
Holdings
Advanced Analytics
Commodities Fund 2.0%
Balanced Exposure Fund 15.0%
Total Stock Market Index Fund 40.0%
Total International Stock Market Index Fund 26.0%
Total Bond Market Fund 5.0%
Global Real Estate Stock Index Fund 10.0%
High Yield & Emerging Markets Bond Fund 2.0%
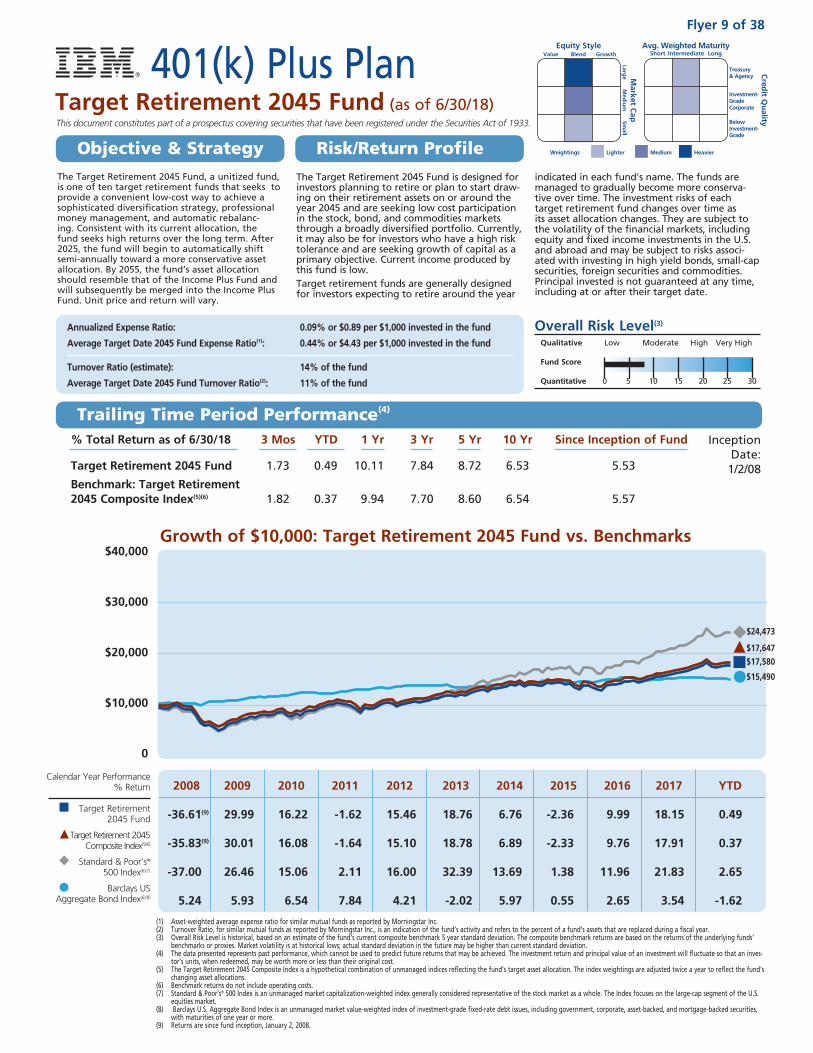
Growth of $10,000: Target Retirement 2045 Fund vs. Benchmarks $40,000
$30,000
$20,000
$10,000
0
% Total Return as of 6/30/18 3 Mos YTD 1 Yr 3 Yr 5 Yr 10 Yr Since Inception of Fund
Target Retirement 2045 Fund 1.73 0.49 10.11 7.84 8.72 6.53 5.53
Benchmark: Target Retirement 2045 Composite Index(5)(6) 1.82 0.37 9.94 7.70 8.60 6.54 5.57
The Target Retirement 2045 Fund is designed for investors planning to retire or plan to start draw-ing on their retirement assets on or around the year 2045 and are seeking low cost participation in the stock, bond, and commodities markets through a broadly diversified portfolio. Currently, it may also be for investors who have a high risk tolerance and are seeking growth of capital as a primary objective. Current income produced by this fund is low.Target retirement funds are generally designed for investors expecting to retire around the year
indicated in each fund’s name. The funds are managed to gradually become more conserva-tive over time. The investment risks of each target retirement fund changes over time as its asset allocation changes. They are subject to the volatility of the financial markets, including equity and fixed income investments in the U.S. and abroad and may be subject to risks associ-ated with investing in high yield bonds, small-cap securities, foreign securities and commodities. Principal invested is not guaranteed at any time, including at or after their target date.
Annualized Expense Ratio: 0.09% or $0.89 per $1,000 invested in the fund
Average Target Date 2045 Fund Expense Ratio(1): 0.44% or $4.43 per $1,000 invested in the fund
Turnover Ratio (estimate): 14% of the fund
Average Target Date 2045 Fund Turnover Ratio(2): 11% of the fund
Inception Date:
1/2/08
(1) Asset-weighted average expense ratio for similar mutual funds as reported by Morningstar Inc.(2) Turnover Ratio, for similar mutual funds as reported by Morningstar Inc., is an indication of the fund’s activity and refers to the percent of a fund’s assets that are replaced during a fiscal year.(3) Overall Risk Level is historical, based on an estimate of the fund’s current composite benchmark 5 year standard deviation. The composite benchmark returns are based on the returns of the underlying funds’
benchmarks or proxies. Market volatility is at historical lows; actual standard deviation in the future may be higher than current standard deviation.(4) The data presented represents past performance, which cannot be used to predict future returns that may be achieved. The investment return and principal value of an investment will fluctuate so that an inves-
tor’s units, when redeemed, may be worth more or less than their original cost.(5) The Target Retirement 2045 Composite Index is a hypothetical combination of unmanaged indices reflecting the fund’s target asset allocation. The index weightings are adjusted twice a year to reflect the fund’s
changing asset allocations.(6) Benchmark returns do not include operating costs. (7) Standard & Poor’s® 500 Index is an unmanaged market capitalization-weighted index generally considered representative of the stock market as a whole. The Index focuses on the large-cap segment of the U.S.
equities market.(8) Barclays U.S. Aggregate Bond Index is an unmanaged market value-weighted index of investment-grade fixed-rate debt issues, including government, corporate, asset-backed, and mortgage-backed securities,
with maturities of one year or more.(9) Returns are since fund inception, January 2, 2008.
Overall Risk Level(3)
Qualitative Low Moderate High Very High
Fund Score
Quantitative 0 5 10 15 20 25 30
The Target Retirement 2045 Fund, a unitized fund, is one of ten target retirement funds that seeks to provide a convenient low-cost way to achieve a sophisticated diversification strategy, professional money management, and automatic rebalanc-ing. Consistent with its current allocation, the fund seeks high returns over the long term. After 2025, the fund will begin to automatically shift semi-annually toward a more conservative asset allocation. By 2055, the fund’s asset allocation should resemble that of the Income Plus Fund and will subsequently be merged into the Income Plus Fund. Unit price and return will vary.
2008 2009 2010 2011 2012 2013 2014 2015 2016 2017 YTD
-36.61(9) 29.99 16.22 -1.62 15.46 18.76 6.76 -2.36 9.99 18.15 0.49
-35.83(9) 30.01 16.08 -1.64 15.10 18.78 6.89 -2.33 9.76 17.91 0.37
-37.00 26.46 15.06 2.11 16.00 32.39 13.69 1.38 11.96 21.83 2.65
5.24 5.93 6.54 7.84 4.21 -2.02 5.97 0.55 2.65 3.54 -1.62
Calendar Year Performance % Return
Target Retirement 2045 Fund
Target Retirement 2045 Composite Index(5)(6)
Standard & Poor’s® 500 Index(6)(7)
Barclays US Aggregate Bond Index(6)(8)
This document constitutes part of a prospectus covering securities that have been registered under the Securities Act of 1933.
Equity Style Value Blend Growth
Market C
ap
Large
Med
ium
Sm
all
Avg. Weighted Maturity Short Intermediate Long
Cred
it Qu
ality
Treasury & Agency
Investment- Grade Corporate
Below Investment- Grade
LighterWeightings Medium Heavier
401(k) Plus PlanTarget Retirement 2045 Fund (as of 6/30/18)
Flyer 9 of 38
Objective & Strategy Risk/Return Profile
Trailing Time Period Performance(4)
$24,473
$17,580
$17,647
$15,490
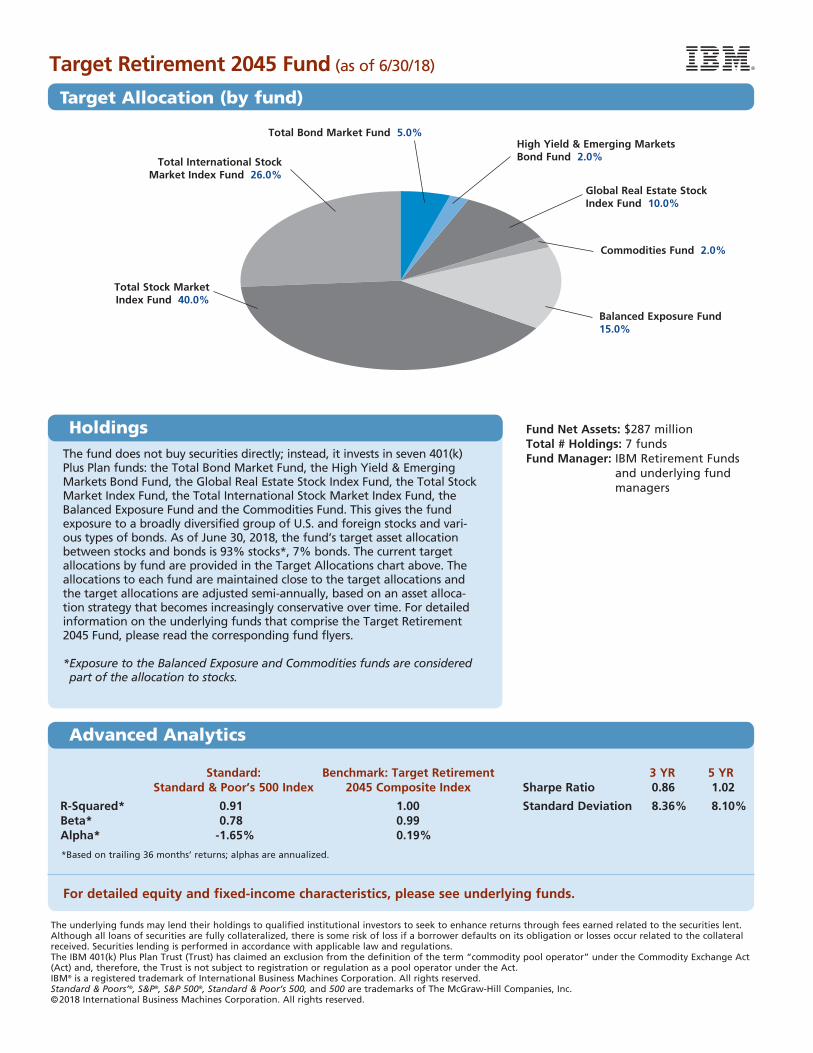
The underlying funds may lend their holdings to qualified institutional investors to seek to enhance returns through fees earned related to the securities lent. Although all loans of securities are fully collateralized, there is some risk of loss if a borrower defaults on its obligation or losses occur related to the collateral received. Securities lending is performed in accordance with applicable law and regulations.The IBM 401(k) Plus Plan Trust (Trust) has claimed an exclusion from the definition of the term “commodity pool operator” under the Commodity Exchange Act (Act) and, therefore, the Trust is not subject to registration or regulation as a pool operator under the Act.IBM® is a registered trademark of International Business Machines Corporation. All rights reserved.Standard & Poors’®, S&P®, S&P 500®, Standard & Poor’s 500, and 500 are trademarks of The McGraw-Hill Companies, Inc.©2018 International Business Machines Corporation. All rights reserved.
Fund Net Assets: $287 millionTotal # Holdings: 7 fundsFund Manager: IBM Retirement Funds
and underlying fund managers
Target Retirement 2045 Fund (as of 6/30/18)
Target Allocation (by fund)
Standard: Benchmark: Target Retirement 3 YR 5 YR Standard & Poor’s 500 Index 2045 Composite Index Sharpe Ratio 0.86 1.02
R-Squared* 0.91 1.00 Standard Deviation 8.36% 8.10% Beta* 0.78 0.99 Alpha* -1.65% 0.19%
*Based on trailing 36 months’ returns; alphas are annualized.
For detailed equity and fixed-income characteristics, please see underlying funds.
The fund does not buy securities directly; instead, it invests in seven 401(k) Plus Plan funds: the Total Bond Market Fund, the High Yield & Emerging Markets Bond Fund, the Global Real Estate Stock Index Fund, the Total Stock Market Index Fund, the Total International Stock Market Index Fund, the Balanced Exposure Fund and the Commodities Fund. This gives the fund exposure to a broadly diversified group of U.S. and foreign stocks and vari-ous types of bonds. As of June 30, 2018, the fund’s target asset allocation between stocks and bonds is 93% stocks*, 7% bonds. The current target allocations by fund are provided in the Target Allocations chart above. The allocations to each fund are maintained close to the target allocations and the target allocations are adjusted semi-annually, based on an asset alloca-tion strategy that becomes increasingly conservative over time. For detailed information on the underlying funds that comprise the Target Retirement 2045 Fund, please read the corresponding fund flyers.
* Exposure to the Balanced Exposure and Commodities funds are considered part of the allocation to stocks.
Holdings
Advanced Analytics
Commodities Fund 2.0%
Balanced Exposure Fund 15.0%
Total Stock Market Index Fund 40.0%
Total International Stock Market Index Fund 26.0%
Total Bond Market Fund 5.0%
Global Real Estate Stock Index Fund 10.0%
High Yield & Emerging Markets Bond Fund 2.0%
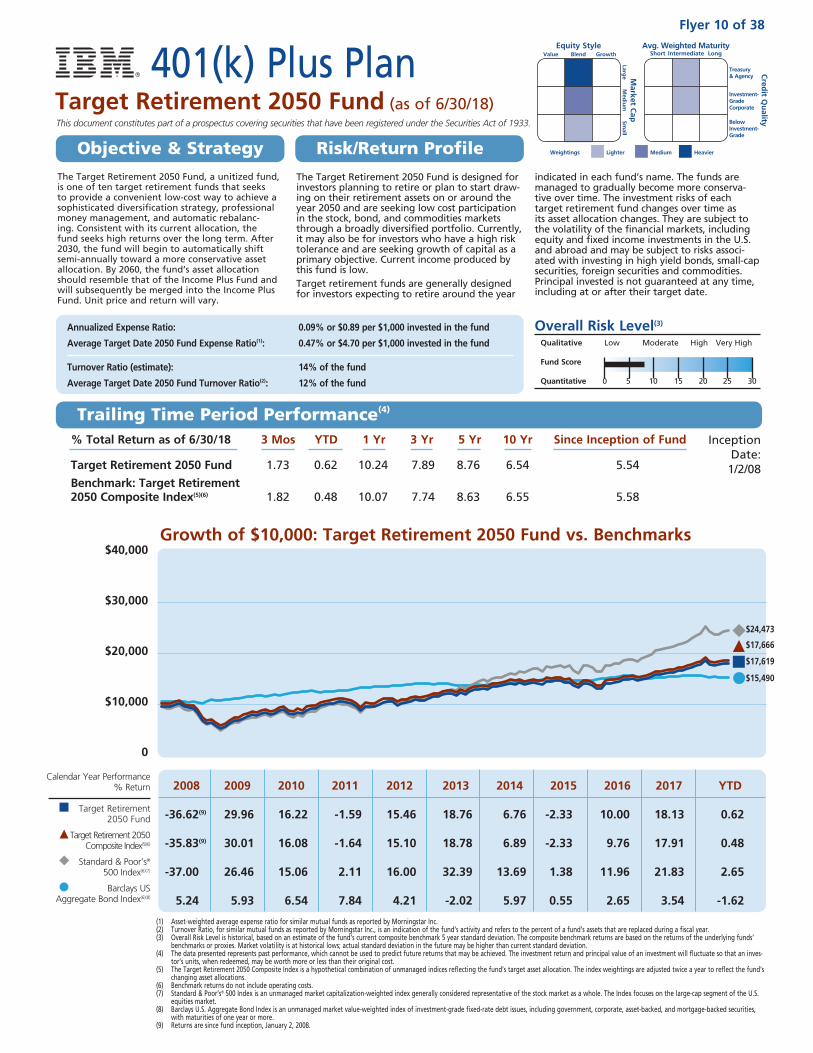
% Total Return as of 6/30/18 3 Mos YTD 1 Yr 3 Yr 5 Yr 10 Yr Since Inception of Fund
Target Retirement 2050 Fund 1.73 0.62 10.24 7.89 8.76 6.54 5.54
Benchmark: Target Retirement 2050 Composite Index(5)(6) 1.82 0.48 10.07 7.74 8.63 6.55 5.58
Growth of $10,000: Target Retirement 2050 Fund vs. Benchmarks $40,000
$30,000
$20,000
$10,000
0
The Target Retirement 2050 Fund is designed for investors planning to retire or plan to start draw-ing on their retirement assets on or around the year 2050 and are seeking low cost participation in the stock, bond, and commodities markets through a broadly diversified portfolio. Currently, it may also be for investors who have a high risk tolerance and are seeking growth of capital as a primary objective. Current income produced by this fund is low.Target retirement funds are generally designed for investors expecting to retire around the year
indicated in each fund’s name. The funds are managed to gradually become more conserva-tive over time. The investment risks of each target retirement fund changes over time as its asset allocation changes. They are subject to the volatility of the financial markets, including equity and fixed income investments in the U.S. and abroad and may be subject to risks associ-ated with investing in high yield bonds, small-cap securities, foreign securities and commodities. Principal invested is not guaranteed at any time, including at or after their target date.
Annualized Expense Ratio: 0.09% or $0.89 per $1,000 invested in the fund
Average Target Date 2050 Fund Expense Ratio(1): 0.47% or $4.70 per $1,000 invested in the fund
Turnover Ratio (estimate): 14% of the fund
Average Target Date 2050 Fund Turnover Ratio(2): 12% of the fund
Inception Date:
1/2/08
(1) Asset-weighted average expense ratio for similar mutual funds as reported by Morningstar Inc.(2) Turnover Ratio, for similar mutual funds as reported by Morningstar Inc., is an indication of the fund’s activity and refers to the percent of a fund’s assets that are replaced during a fiscal year.(3) Overall Risk Level is historical, based on an estimate of the fund’s current composite benchmark 5 year standard deviation. The composite benchmark returns are based on the returns of the underlying funds’
benchmarks or proxies. Market volatility is at historical lows; actual standard deviation in the future may be higher than current standard deviation.(4) The data presented represents past performance, which cannot be used to predict future returns that may be achieved. The investment return and principal value of an investment will fluctuate so that an inves-
tor’s units, when redeemed, may be worth more or less than their original cost.(5) The Target Retirement 2050 Composite Index is a hypothetical combination of unmanaged indices reflecting the fund’s target asset allocation. The index weightings are adjusted twice a year to reflect the fund’s
changing asset allocations.(6) Benchmark returns do not include operating costs.(7) Standard & Poor’s® 500 Index is an unmanaged market capitalization-weighted index generally considered representative of the stock market as a whole. The Index focuses on the large-cap segment of the U.S.
equities market.(8) Barclays U.S. Aggregate Bond Index is an unmanaged market value-weighted index of investment-grade fixed-rate debt issues, including government, corporate, asset-backed, and mortgage-backed securities,
with maturities of one year or more.(9) Returns are since fund inception, January 2, 2008.
Overall Risk Level(3)
Qualitative Low Moderate High Very High
Fund Score
Quantitative 0 5 10 15 20 25 30
The Target Retirement 2050 Fund, a unitized fund, is one of ten target retirement funds that seeks to provide a convenient low-cost way to achieve a sophisticated diversification strategy, professional money management, and automatic rebalanc-ing. Consistent with its current allocation, the fund seeks high returns over the long term. After 2030, the fund will begin to automatically shift semi-annually toward a more conservative asset allocation. By 2060, the fund’s asset allocation should resemble that of the Income Plus Fund and will subsequently be merged into the Income Plus Fund. Unit price and return will vary.
2008 2009 2010 2011 2012 2013 2014 2015 2016 2017 YTD
-36.62(9) 29.96 16.22 -1.59 15.46 18.76 6.76 -2.33 10.00 18.13 0.62
-35.83(9) 30.01 16.08 -1.64 15.10 18.78 6.89 -2.33 9.76 17.91 0.48
-37.00 26.46 15.06 2.11 16.00 32.39 13.69 1.38 11.96 21.83 2.65
5.24 5.93 6.54 7.84 4.21 -2.02 5.97 0.55 2.65 3.54 -1.62
Calendar Year Performance % Return
Target Retirement 2050 Fund
Target Retirement 2050 Composite Index(5)(6)
Standard & Poor’s® 500 Index(6)(7)
Barclays US Aggregate Bond Index(6)(8)
This document constitutes part of a prospectus covering securities that have been registered under the Securities Act of 1933.
Equity Style Value Blend Growth
Market C
ap
Large
Med
ium
Sm
all
Avg. Weighted Maturity Short Intermediate Long
Cred
it Qu
ality
Treasury & Agency
Investment- Grade Corporate
Below Investment- Grade
LighterWeightings Medium Heavier
401(k) Plus PlanTarget Retirement 2050 Fund (as of 6/30/18)
Flyer 10 of 38
Objective & Strategy Risk/Return Profile
Trailing Time Period Performance(4)
$24,473
$17,619
$17,666
$15,490
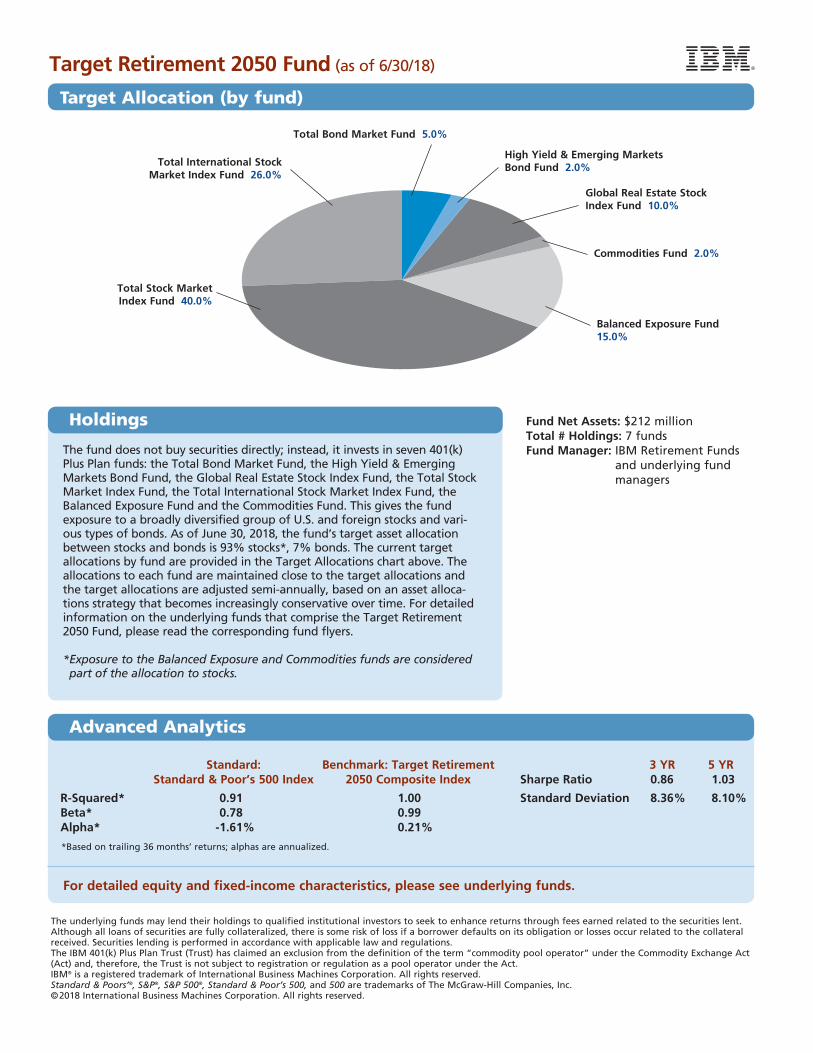
The underlying funds may lend their holdings to qualified institutional investors to seek to enhance returns through fees earned related to the securities lent. Although all loans of securities are fully collateralized, there is some risk of loss if a borrower defaults on its obligation or losses occur related to the collateral received. Securities lending is performed in accordance with applicable law and regulations.The IBM 401(k) Plus Plan Trust (Trust) has claimed an exclusion from the definition of the term “commodity pool operator” under the Commodity Exchange Act (Act) and, therefore, the Trust is not subject to registration or regulation as a pool operator under the Act.IBM® is a registered trademark of International Business Machines Corporation. All rights reserved.Standard & Poors’®, S&P®, S&P 500®, Standard & Poor’s 500, and 500 are trademarks of The McGraw-Hill Companies, Inc.©2018 International Business Machines Corporation. All rights reserved.
Fund Net Assets: $212 millionTotal # Holdings: 7 fundsFund Manager: IBM Retirement Funds
and underlying fund managers
Target Retirement 2050 Fund (as of 6/30/18)
Target Allocation (by fund)
Standard: Benchmark: Target Retirement 3 YR 5 YR Standard & Poor’s 500 Index 2050 Composite Index Sharpe Ratio 0.86 1.03
R-Squared* 0.91 1.00 Standard Deviation 8.36% 8.10% Beta* 0.78 0.99 Alpha* -1.61% 0.21%
*Based on trailing 36 months’ returns; alphas are annualized.
For detailed equity and fixed-income characteristics, please see underlying funds.
The fund does not buy securities directly; instead, it invests in seven 401(k) Plus Plan funds: the Total Bond Market Fund, the High Yield & Emerging Markets Bond Fund, the Global Real Estate Stock Index Fund, the Total Stock Market Index Fund, the Total International Stock Market Index Fund, the Balanced Exposure Fund and the Commodities Fund. This gives the fund exposure to a broadly diversified group of U.S. and foreign stocks and vari-ous types of bonds. As of June 30, 2018, the fund’s target asset allocation between stocks and bonds is 93% stocks*, 7% bonds. The current target allocations by fund are provided in the Target Allocations chart above. The allocations to each fund are maintained close to the target allocations and the target allocations are adjusted semi-annually, based on an asset alloca-tions strategy that becomes increasingly conservative over time. For detailed information on the underlying funds that comprise the Target Retirement 2050 Fund, please read the corresponding fund flyers.
* Exposure to the Balanced Exposure and Commodities funds are considered part of the allocation to stocks.
Holdings
Advanced Analytics
Commodities Fund 2.0%
Balanced Exposure Fund 15.0%
Total Stock Market Index Fund 40.0%
Total International Stock Market Index Fund 26.0%
Total Bond Market Fund 5.0%
High Yield & Emerging Markets Bond Fund 2.0%
Global Real Estate Stock Index Fund 10.0%
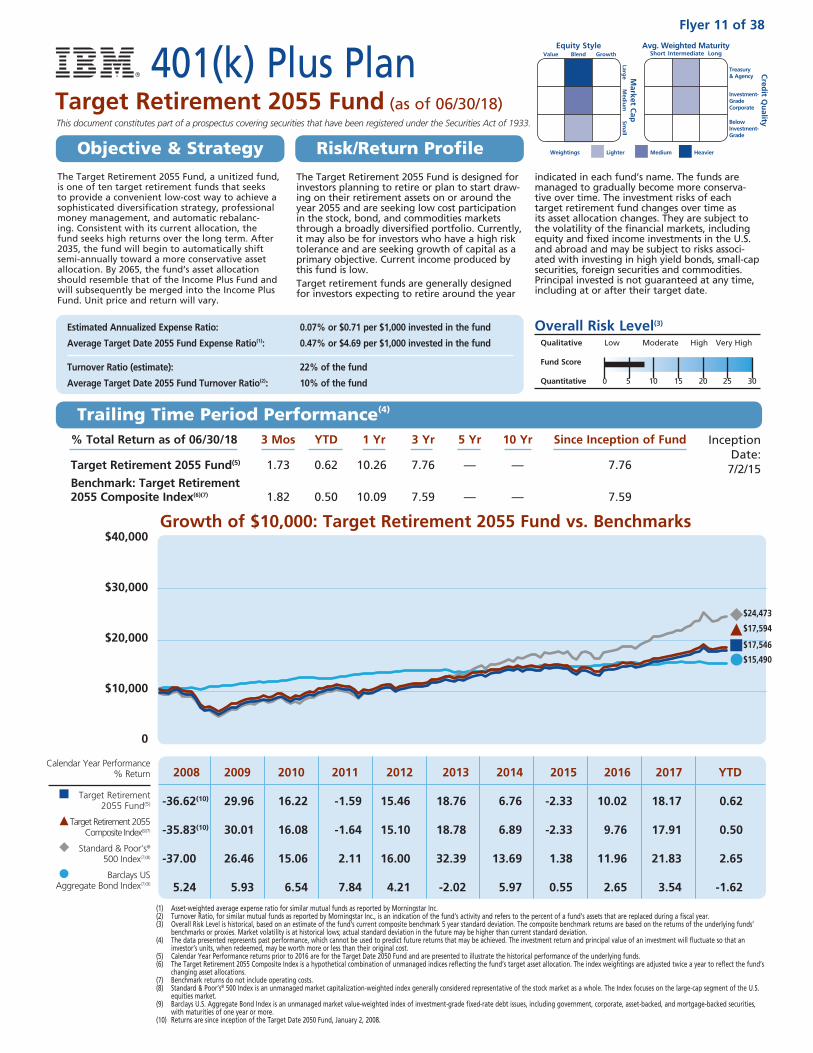
% Total Return as of 06/30/18 3 Mos YTD 1 Yr 3 Yr 5 Yr 10 Yr Since Inception of Fund
Target Retirement 2055 Fund(5) 1.73 0.62 10.26 7.76 — — 7.76
Benchmark: Target Retirement 2055 Composite Index(6)(7) 1.82 0.50 10.09 7.59 — — 7.59
Growth of $10,000: Target Retirement 2055 Fund vs. Benchmarks $40,000
$30,000
$20,000
$10,000
0
The Target Retirement 2055 Fund is designed for investors planning to retire or plan to start draw-ing on their retirement assets on or around the year 2055 and are seeking low cost participation in the stock, bond, and commodities markets through a broadly diversified portfolio. Currently, it may also be for investors who have a high risk tolerance and are seeking growth of capital as a primary objective. Current income produced by this fund is low.Target retirement funds are generally designed for investors expecting to retire around the year
indicated in each fund’s name. The funds are managed to gradually become more conserva-tive over time. The investment risks of each target retirement fund changes over time as its asset allocation changes. They are subject to the volatility of the financial markets, including equity and fixed income investments in the U.S. and abroad and may be subject to risks associ-ated with investing in high yield bonds, small-cap securities, foreign securities and commodities. Principal invested is not guaranteed at any time, including at or after their target date.
Estimated Annualized Expense Ratio: 0.07% or $0.71 per $1,000 invested in the fund
Average Target Date 2055 Fund Expense Ratio(1): 0.47% or $4.69 per $1,000 invested in the fund
Turnover Ratio (estimate): 22% of the fund
Average Target Date 2055 Fund Turnover Ratio(2): 10% of the fund
Inception Date:
7/2/15
(1) Asset-weighted average expense ratio for similar mutual funds as reported by Morningstar Inc.(2) Turnover Ratio, for similar mutual funds as reported by Morningstar Inc., is an indication of the fund’s activity and refers to the percent of a fund’s assets that are replaced during a fiscal year.(3) Overall Risk Level is historical, based on an estimate of the fund’s current composite benchmark 5 year standard deviation. The composite benchmark returns are based on the returns of the underlying funds’
benchmarks or proxies. Market volatility is at historical lows; actual standard deviation in the future may be higher than current standard deviation.(4) The data presented represents past performance, which cannot be used to predict future returns that may be achieved. The investment return and principal value of an investment will fluctuate so that an
investor’s units, when redeemed, may be worth more or less than their original cost.(5) Calendar Year Performance returns prior to 2016 are for the Target Date 2050 Fund and are presented to illustrate the historical performance of the underlying funds.(6) The Target Retirement 2055 Composite Index is a hypothetical combination of unmanaged indices reflecting the fund’s target asset allocation. The index weightings are adjusted twice a year to reflect the fund’s
changing asset allocations.(7) Benchmark returns do not include operating costs.(8) Standard & Poor’s® 500 Index is an unmanaged market capitalization-weighted index generally considered representative of the stock market as a whole. The Index focuses on the large-cap segment of the U.S.
equities market.(9) Barclays U.S. Aggregate Bond Index is an unmanaged market value-weighted index of investment-grade fixed-rate debt issues, including government, corporate, asset-backed, and mortgage-backed securities,
with maturities of one year or more.(10) Returns are since inception of the Target Date 2050 Fund, January 2, 2008.
Overall Risk Level(3)
Qualitative Low Moderate High Very High
Fund Score
Quantitative 0 5 10 15 20 25 30
The Target Retirement 2055 Fund, a unitized fund, is one of ten target retirement funds that seeks to provide a convenient low-cost way to achieve a sophisticated diversification strategy, professional money management, and automatic rebalanc-ing. Consistent with its current allocation, the fund seeks high returns over the long term. After 2035, the fund will begin to automatically shift semi-annually toward a more conservative asset allocation. By 2065, the fund’s asset allocation should resemble that of the Income Plus Fund and will subsequently be merged into the Income Plus Fund. Unit price and return will vary.
2008 2009 2010 2011 2012 2013 2014 2015 2016 2017 YTD
-36.62(10) 29.96 16.22 -1.59 15.46 18.76 6.76 -2.33 10.02 18.17 0.62
-35.83(10) 30.01 16.08 -1.64 15.10 18.78 6.89 -2.33 9.76 17.91 0.50
-37.00 26.46 15.06 2.11 16.00 32.39 13.69 1.38 11.96 21.83 2.65
5.24 5.93 6.54 7.84 4.21 -2.02 5.97 0.55 2.65 3.54 -1.62
Calendar Year Performance % Return
Target Retirement 2055 Fund(5)
Target Retirement 2055 Composite Index(6)(7)
Standard & Poor’s® 500 Index(7)(8)
Barclays US Aggregate Bond Index(7)(9)
This document constitutes part of a prospectus covering securities that have been registered under the Securities Act of 1933.
Equity Style Value Blend Growth
Market C
ap
Large
Med
ium
Sm
all
Avg. Weighted Maturity Short Intermediate Long
Cred
it Qu
ality
Treasury & Agency
Investment- Grade Corporate
Below Investment- Grade
LighterWeightings Medium Heavier
401(k) Plus PlanTarget Retirement 2055 Fund (as of 06/30/18)
Flyer 11 of 38
Objective & Strategy Risk/Return Profile
Trailing Time Period Performance(4)
$24,473
$17,546
$17,594
$15,490

The underlying funds may lend their holdings to qualified institutional investors to seek to enhance returns through fees earned related to the securities lent. Although all loans of securities are fully collateralized, there is some risk of loss if a borrower defaults on its obligation or losses occur related to the collateral received. Securities lending is performed in accordance with applicable law and regulations.The IBM 401(k) Plus Plan Trust (Trust) has claimed an exclusion from the definition of the term “commodity pool operator” under the Commodity Exchange Act (Act) and, therefore, the Trust is not subject to registration or regulation as a pool operator under the Act.IBM® is a registered trademark of International Business Machines Corporation. All rights reserved.Standard & Poors’®, S&P®, S&P 500®, Standard & Poor’s 500, and 500 are trademarks of The McGraw-Hill Companies, Inc.©2018 International Business Machines Corporation. All rights reserved.
Fund Net Assets: $45 millionTotal # Holdings: 7 fundsFund Manager: IBM Retirement Funds
and underlying fund managers
Target Retirement 2055 Fund (as of 06/30/18)
Target Allocation (by fund)
Standard: Benchmark: Target Retirement 3 YR 5 YR Standard & Poor’s 500 Index 2055 Composite Index Sharpe Ratio* 0.85 1.21
R-Squared** 0.91 1.00 Standard Deviation* 8.37% 8.02% Beta** 0.78 0.99 Alpha** -1.72 0.22%
*Target Date 2055 Fund returns are used from July 1, 2015 forward. Prior to July 1, 2015, returns for the Target Date 2050 Fund are used as a proxy. **Based on trailing 36 months’ returns; alphas are annualized.
For detailed equity and fixed-income characteristics, please see underlying funds.
The fund does not buy securities directly; instead, it invests in seven 401(k) Plus Plan funds: the Total Bond Market Fund, the High Yield & Emerging Markets Bond Fund, the Global Real Estate Stock Index Fund, the Total Stock Market Index Fund, the Total International Stock Market Index Fund, the Balanced Exposure Fund and the Commodities Fund. This gives the fund exposure to a broadly diversified group of U.S. and foreign stocks and vari-ous types of bonds. As of June 30, 2018, the fund’s target asset allocation between stocks and bonds is 93% stocks*, 7% bonds. The current target allocations by fund are provided in the Target Allocations chart above. The allocations to each fund are maintained close to the target allocations and the target allocations are adjusted semi-annually, based on an asset alloca-tions strategy that becomes increasingly conservative over time. For detailed information on the underlying funds that comprise the Target Retirement 2055 Fund, please read the corresponding fund flyers.
* Exposure to the Balanced Exposure and Commodities funds are considered part of the allocation to stocks.
Holdings
Advanced Analytics*
Commodities Fund 2.0%
Balanced Exposure Fund 15.0%
Total Stock Market Index Fund 40.0%
Total International Stock Market Index Fund 26.0%
Total Bond Market Fund 5.0%High Yield & Emerging Markets Bond Fund 2.0%
Global Real Estate Stock Index Fund 10.0%
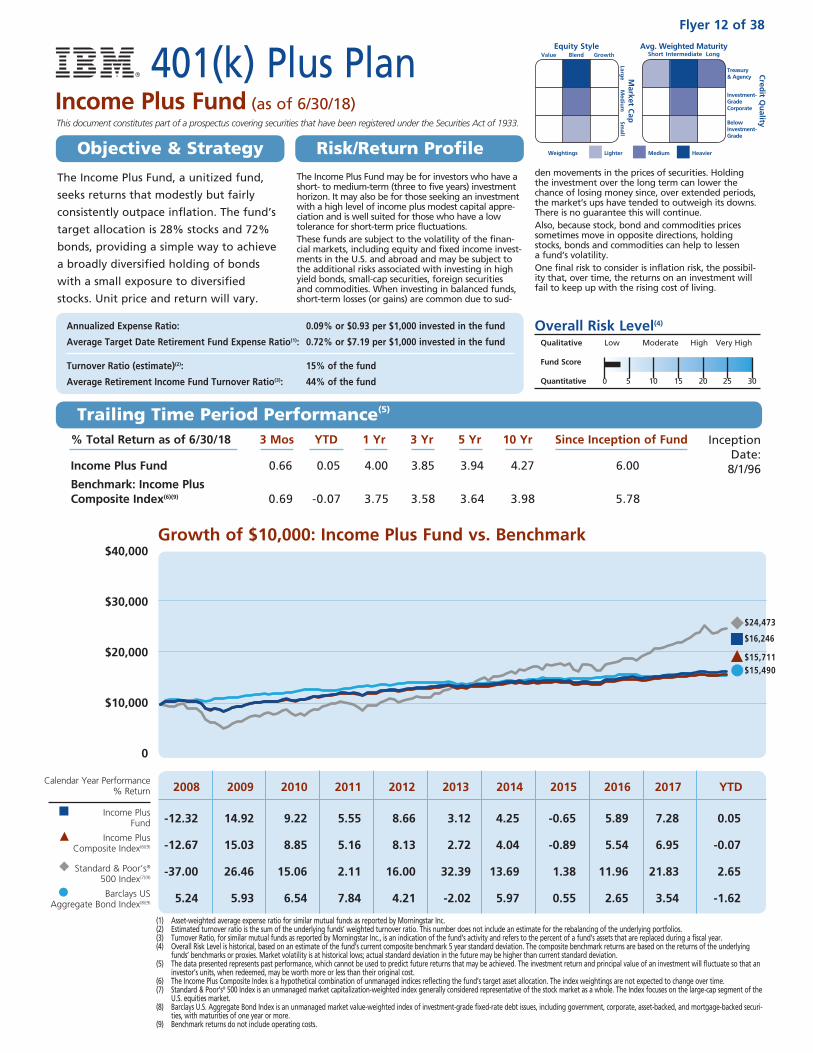
Growth of $10,000: Income Plus Fund vs. Benchmark
401(k) Plus PlanIncome Plus Fund (as of 6/30/18)
$40,000
$30,000
$20,000
$10,000
0
% Total Return as of 6/30/18 3 Mos YTD 1 Yr 3 Yr 5 Yr 10 Yr Since Inception of Fund
Income Plus Fund 0.66 0.05 4.00 3.85 3.94 4.27 6.00
Benchmark: Income Plus Composite Index(6)(9) 0.69 -0.07 3.75 3.58 3.64 3.98 5.78
The Income Plus Fund may be for investors who have a short- to medium-term (three to five years) investment horizon. It may also be for those seeking an investment with a high level of income plus modest capital appre-ciation and is well suited for those who have a low tolerance for short-term price fluctuations.These funds are subject to the volatility of the finan-cial markets, including equity and fixed income invest-ments in the U.S. and abroad and may be subject to the additional risks associated with investing in high yield bonds, small-cap securities, foreign securities and commodities. When investing in balanced funds, short-term losses (or gains) are common due to sud-
den movements in the prices of securities. Holding the investment over the long term can lower the chance of losing money since, over extended periods, the market’s ups have tended to outweigh its downs. There is no guarantee this will continue.Also, because stock, bond and commodities prices sometimes move in opposite directions, holding stocks, bonds and commodities can help to lessen a fund’s volatility.One final risk to consider is inflation risk, the possibil-ity that, over time, the returns on an investment will fail to keep up with the rising cost of living.
Annualized Expense Ratio: 0.09% or $0.93 per $1,000 invested in the fund
Average Target Date Retirement Fund Expense Ratio(1): 0.72% or $7.19 per $1,000 invested in the fund
Turnover Ratio (estimate)(2): 15% of the fund
Average Retirement Income Fund Turnover Ratio(3): 44% of the fund
Inception Date:
8/1/96
(1) Asset-weighted average expense ratio for similar mutual funds as reported by Morningstar Inc.(2) Estimated turnover ratio is the sum of the underlying funds’ weighted turnover ratio. This number does not include an estimate for the rebalancing of the underlying portfolios.(3) Turnover Ratio, for similar mutual funds as reported by Morningstar Inc., is an indication of the fund’s activity and refers to the percent of a fund’s assets that are replaced during a fiscal year.(4) Overall Risk Level is historical, based on an estimate of the fund’s current composite benchmark 5 year standard deviation. The composite benchmark returns are based on the returns of the underlying
funds’ benchmarks or proxies. Market volatility is at historical lows; actual standard deviation in the future may be higher than current standard deviation.(5) The data presented represents past performance, which cannot be used to predict future returns that may be achieved. The investment return and principal value of an investment will fluctuate so that an
investor’s units, when redeemed, may be worth more or less than their original cost.(6) The Income Plus Composite Index is a hypothetical combination of unmanaged indices reflecting the fund’s target asset allocation. The index weightings are not expected to change over time.(7) Standard & Poor’s® 500 Index is an unmanaged market capitalization-weighted index generally considered representative of the stock market as a whole. The Index focuses on the large-cap segment of the
U.S. equities market.(8) Barclays U.S. Aggregate Bond Index is an unmanaged market value-weighted index of investment-grade fixed-rate debt issues, including government, corporate, asset-backed, and mortgage-backed securi-
ties, with maturities of one year or more.(9) Benchmark returns do not include operating costs.
Overall Risk Level(4)
Qualitative Low Moderate High Very High
Fund Score
Quantitative 0 5 10 15 20 25 30
The Income Plus Fund, a unitized fund,
seeks returns that modestly but fairly
consistently outpace inflation. The fund’s
target allocation is 28% stocks and 72%
bonds, providing a simple way to achieve
a broadly diversified holding of bonds
with a small exposure to diversified
stocks. Unit price and return will vary.
2008 2009 2010 2011 2012 2013 2014 2015 2016 2017 YTD
-12.32 14.92 9.22 5.55 8.66 3.12 4.25 -0.65 5.89 7.28 0.05
-12.67 15.03 8.85 5.16 8.13 2.72 4.04 -0.89 5.54 6.95 -0.07
-37.00 26.46 15.06 2.11 16.00 32.39 13.69 1.38 11.96 21.83 2.65
5.24 5.93 6.54 7.84 4.21 -2.02 5.97 0.55 2.65 3.54 -1.62
Calendar Year Performance % Return
Income Plus Fund
Income Plus Composite Index(6)(9)
Standard & Poor’s® 500 Index(7)(9)
Barclays US Aggregate Bond Index(8)(9)
This document constitutes part of a prospectus covering securities that have been registered under the Securities Act of 1933.
Flyer 12 of 38
Objective & Strategy Risk/Return Profile
Trailing Time Period Performance(5)
Avg. Weighted Maturity Short Intermediate Long
Equity Style Value Blend Growth
Market C
ap
Large
Med
ium
Sm
all
Cred
it Qu
ality
Treasury & Agency
Investment- Grade Corporate
Below Investment- Grade
LighterWeightings Medium Heavier
$24,473
$15,711
$16,246
$15,490
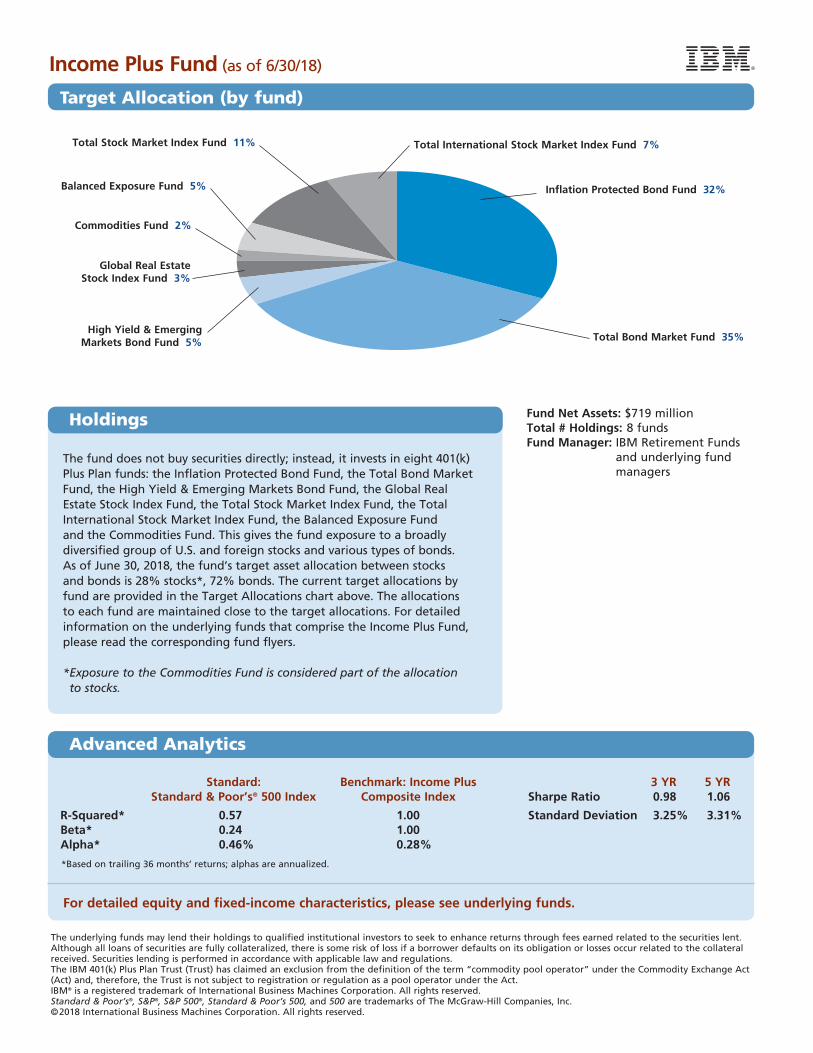
Income Plus Fund (as of 6/30/18)
Target Allocation (by fund)
Total International Stock Market Index Fund 7%Total Stock Market Index Fund 11%
Inflation Protected Bond Fund 32%
Total Bond Market Fund 35%
Global Real Estate Stock Index Fund 3%
High Yield & Emerging Markets Bond Fund 5%
Commodities Fund 2%
Balanced Exposure Fund 5%
Standard: Benchmark: Income Plus 3 YR 5 YR Standard & Poor’s® 500 Index Composite Index Sharpe Ratio 0.98 1.06
R-Squared* 0.57 1.00 Standard Deviation 3.25% 3.31% Beta* 0.24 1.00 Alpha* 0.46% 0.28%
*Based on trailing 36 months’ returns; alphas are annualized.
For detailed equity and fixed-income characteristics, please see underlying funds.
The underlying funds may lend their holdings to qualified institutional investors to seek to enhance returns through fees earned related to the securities lent. Although all loans of securities are fully collateralized, there is some risk of loss if a borrower defaults on its obligation or losses occur related to the collateral received. Securities lending is performed in accordance with applicable law and regulations.The IBM 401(k) Plus Plan Trust (Trust) has claimed an exclusion from the definition of the term “commodity pool operator” under the Commodity Exchange Act (Act) and, therefore, the Trust is not subject to registration or regulation as a pool operator under the Act.IBM® is a registered trademark of International Business Machines Corporation. All rights reserved.Standard & Poor’s®, S&P®, S&P 500®, Standard & Poor’s 500, and 500 are trademarks of The McGraw-Hill Companies, Inc.©2018 International Business Machines Corporation. All rights reserved.
Fund Net Assets: $719 millionTotal # Holdings: 8 fundsFund Manager: IBM Retirement Funds
and underlying fund managers
The fund does not buy securities directly; instead, it invests in eight 401(k) Plus Plan funds: the Inflation Protected Bond Fund, the Total Bond Market Fund, the High Yield & Emerging Markets Bond Fund, the Global Real Estate Stock Index Fund, the Total Stock Market Index Fund, the Total International Stock Market Index Fund, the Balanced Exposure Fund and the Commodities Fund. This gives the fund exposure to a broadly diversified group of U.S. and foreign stocks and various types of bonds. As of June 30, 2018, the fund’s target asset allocation between stocks and bonds is 28% stocks*, 72% bonds. The current target allocations by fund are provided in the Target Allocations chart above. The allocations to each fund are maintained close to the target allocations. For detailed information on the underlying funds that comprise the Income Plus Fund, please read the corresponding fund flyers.
* Exposure to the Commodities Fund is considered part of the allocation to stocks.
Holdings
Advanced Analytics
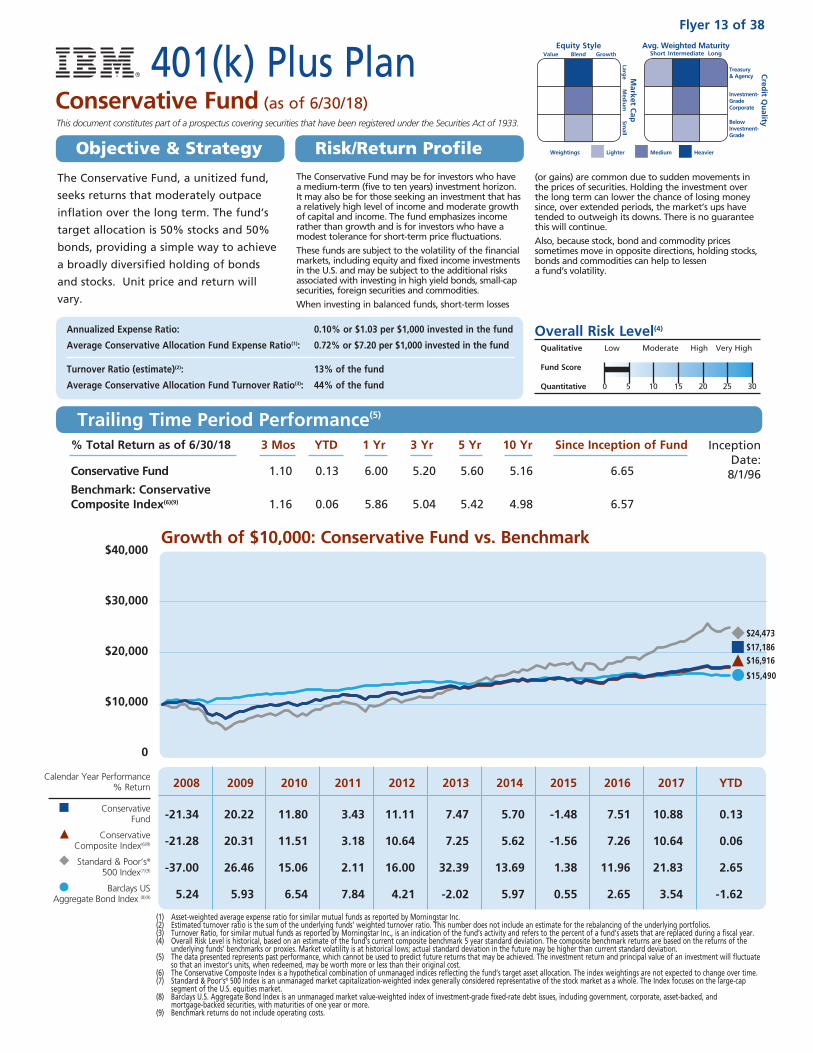
Growth of $10,000: Conservative Fund vs. Benchmark
401(k) Plus PlanConservative Fund (as of 6/30/18)
$40,000
$30,000
$20,000
$10,000
0
% Total Return as of 6/30/18 3 Mos YTD 1 Yr 3 Yr 5 Yr 10 Yr Since Inception of Fund
Conservative Fund 1.10 0.13 6.00 5.20 5.60 5.16 6.65
Benchmark: Conservative Composite Index(6)(9) 1.16 0.06 5.86 5.04 5.42 4.98 6.57
Trailing Time Period Performance(5)
The Conservative Fund may be for investors who have a medium-term (five to ten years) investment horizon. It may also be for those seeking an investment that has a relatively high level of income and moderate growth of capital and income. The fund emphasizes income rather than growth and is for investors who have a modest tolerance for short-term price fluctuations.
These funds are subject to the volatility of the financial markets, including equity and fixed income investments in the U.S. and may be subject to the additional risks associated with investing in high yield bonds, small-cap securities, foreign securities and commodities.
When investing in balanced funds, short-term losses
(or gains) are common due to sudden movements in the prices of securities. Holding the investment over the long term can lower the chance of losing money since, over extended periods, the market’s ups have tended to outweigh its downs. There is no guarantee this will continue.
Also, because stock, bond and commodity prices sometimes move in opposite directions, holding stocks, bonds and commodities can help to lessen a fund’s volatility.
Annualized Expense Ratio: 0.10% or $1.03 per $1,000 invested in the fund
Average Conservative Allocation Fund Expense Ratio(1): 0.72% or $7.20 per $1,000 invested in the fund
Turnover Ratio (estimate)(2): 13% of the fund
Average Conservative Allocation Fund Turnover Ratio(3): 44% of the fund
Inception Date:
8/1/96
(1) Asset-weighted average expense ratio for similar mutual funds as reported by Morningstar Inc.(2) Estimated turnover ratio is the sum of the underlying funds’ weighted turnover ratio. This number does not include an estimate for the rebalancing of the underlying portfolios.(3) Turnover Ratio, for similar mutual funds as reported by Morningstar Inc., is an indication of the fund’s activity and refers to the percent of a fund’s assets that are replaced during a fiscal year.(4) Overall Risk Level is historical, based on an estimate of the fund’s current composite benchmark 5 year standard deviation. The composite benchmark returns are based on the returns of the
underlying funds’ benchmarks or proxies. Market volatility is at historical lows; actual standard deviation in the future may be higher than current standard deviation.(5) The data presented represents past performance, which cannot be used to predict future returns that may be achieved. The investment return and principal value of an investment will fluctuate
so that an investor’s units, when redeemed, may be worth more or less than their original cost.(6) The Conservative Composite Index is a hypothetical combination of unmanaged indices reflecting the fund’s target asset allocation. The index weightings are not expected to change over time.(7) Standard & Poor’s® 500 Index is an unmanaged market capitalization-weighted index generally considered representative of the stock market as a whole. The Index focuses on the large-cap
segment of the U.S. equities market.(8) Barclays U.S. Aggregate Bond Index is an unmanaged market value-weighted index of investment-grade fixed-rate debt issues, including government, corporate, asset-backed, and
mortgage-backed securities, with maturities of one year or more.(9) Benchmark returns do not include operating costs.
Overall Risk Level(4)
Qualitative Low Moderate High Very High
Fund Score
Quantitative 0 5 10 15 20 25 30
The Conservative Fund, a unitized fund,
seeks returns that moderately outpace
inflation over the long term. The fund’s
target allocation is 50% stocks and 50%
bonds, providing a simple way to achieve
a broadly diversified holding of bonds
and stocks. Unit price and return will
vary.
2008 2009 2010 2011 2012 2013 2014 2015 2016 2017 YTD
-21.34 20.22 11.80 3.43 11.11 7.47 5.70 -1.48 7.51 10.88 0.13
-21.28 20.31 11.51 3.18 10.64 7.25 5.62 -1.56 7.26 10.64 0.06
-37.00 26.46 15.06 2.11 16.00 32.39 13.69 1.38 11.96 21.83 2.65
5.24 5.93 6.54 7.84 4.21 -2.02 5.97 0.55 2.65 3.54 -1.62
Calendar Year Performance % Return
Conservative Fund
Conservative Composite Index(6)(9)
Standard & Poor’s® 500 Index(7)(9)
Barclays US Aggregate Bond Index (8)(9)
This document constitutes part of a prospectus covering securities that have been registered under the Securities Act of 1933.
Flyer 13 of 38
Objective & Strategy Risk/Return Profile
Avg. Weighted Maturity Short Intermediate Long
Equity Style Value Blend Growth
Market C
ap
Large
Med
ium
Sm
all
Cred
it Qu
ality
Treasury & Agency
Investment- Grade Corporate
Below Investment- Grade
LighterWeightings Medium Heavier
$17,186
$24,473
$16,916
$15,490
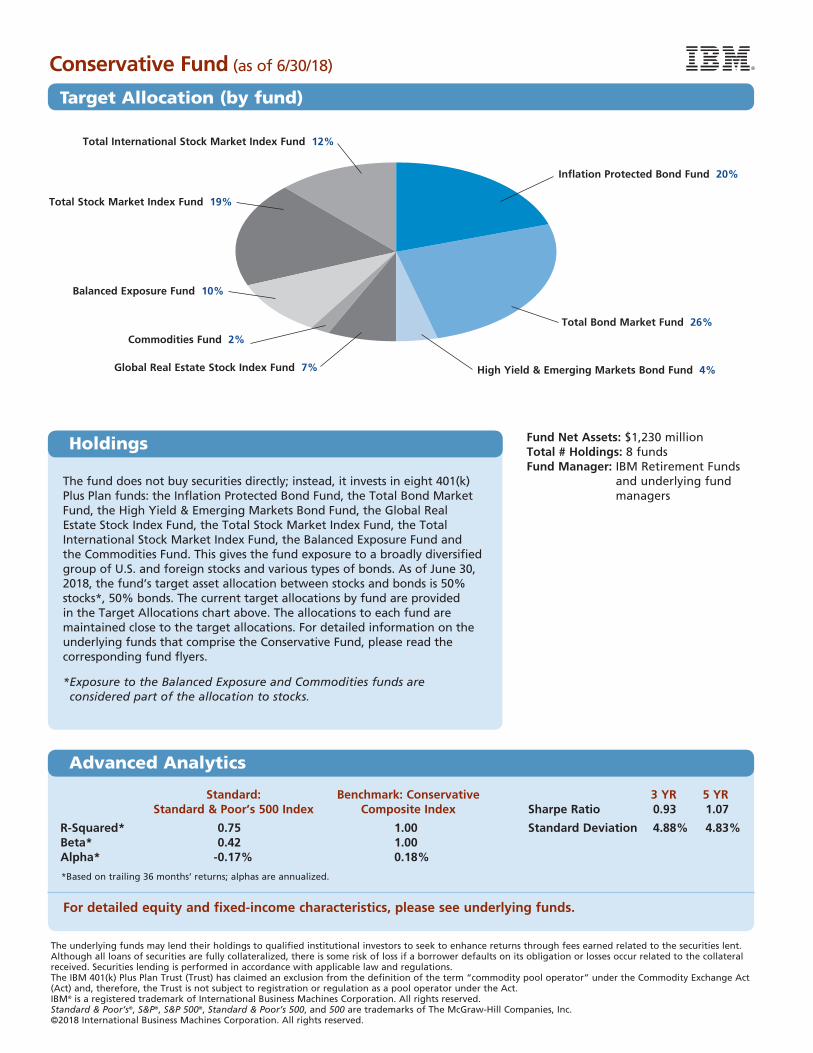
Advanced Analytics
Holdings
Conservative Fund (as of 6/30/18)
Total International Stock Market Index Fund 12%
Inflation Protected Bond Fund 20%
Total Stock Market Index Fund 19%
Balanced Exposure Fund 10%
Total Bond Market Fund 26%
High Yield & Emerging Markets Bond Fund 4%Global Real Estate Stock Index Fund 7%
Commodities Fund 2%
The underlying funds may lend their holdings to qualified institutional investors to seek to enhance returns through fees earned related to the securities lent. Although all loans of securities are fully collateralized, there is some risk of loss if a borrower defaults on its obligation or losses occur related to the collateral received. Securities lending is performed in accordance with applicable law and regulations.The IBM 401(k) Plus Plan Trust (Trust) has claimed an exclusion from the definition of the term “commodity pool operator” under the Commodity Exchange Act (Act) and, therefore, the Trust is not subject to registration or regulation as a pool operator under the Act.IBM® is a registered trademark of International Business Machines Corporation. All rights reserved.Standard & Poor’s®, S&P®, S&P 500®, Standard & Poor’s 500, and 500 are trademarks of The McGraw-Hill Companies, Inc.©2018 International Business Machines Corporation. All rights reserved.
Standard: Benchmark: Conservative 3 YR 5 YR Standard & Poor’s 500 Index Composite Index Sharpe Ratio 0.93 1.07
R-Squared* 0.75 1.00 Standard Deviation 4.88% 4.83% Beta* 0.42 1.00 Alpha* -0.17% 0.18%
*Based on trailing 36 months’ returns; alphas are annualized.
For detailed equity and fixed-income characteristics, please see underlying funds.
Fund Net Assets: $1,230 millionTotal # Holdings: 8 fundsFund Manager: IBM Retirement Funds
and underlying fund managers
The fund does not buy securities directly; instead, it invests in eight 401(k) Plus Plan funds: the Inflation Protected Bond Fund, the Total Bond Market Fund, the High Yield & Emerging Markets Bond Fund, the Global Real Estate Stock Index Fund, the Total Stock Market Index Fund, the Total International Stock Market Index Fund, the Balanced Exposure Fund and the Commodities Fund. This gives the fund exposure to a broadly diversified group of U.S. and foreign stocks and various types of bonds. As of June 30, 2018, the fund’s target asset allocation between stocks and bonds is 50% stocks*, 50% bonds. The current target allocations by fund are provided in the Target Allocations chart above. The allocations to each fund are maintained close to the target allocations. For detailed information on the underlying funds that comprise the Conservative Fund, please read the corresponding fund flyers.
* Exposure to the Balanced Exposure and Commodities funds are considered part of the allocation to stocks.
Target Allocation (by fund)
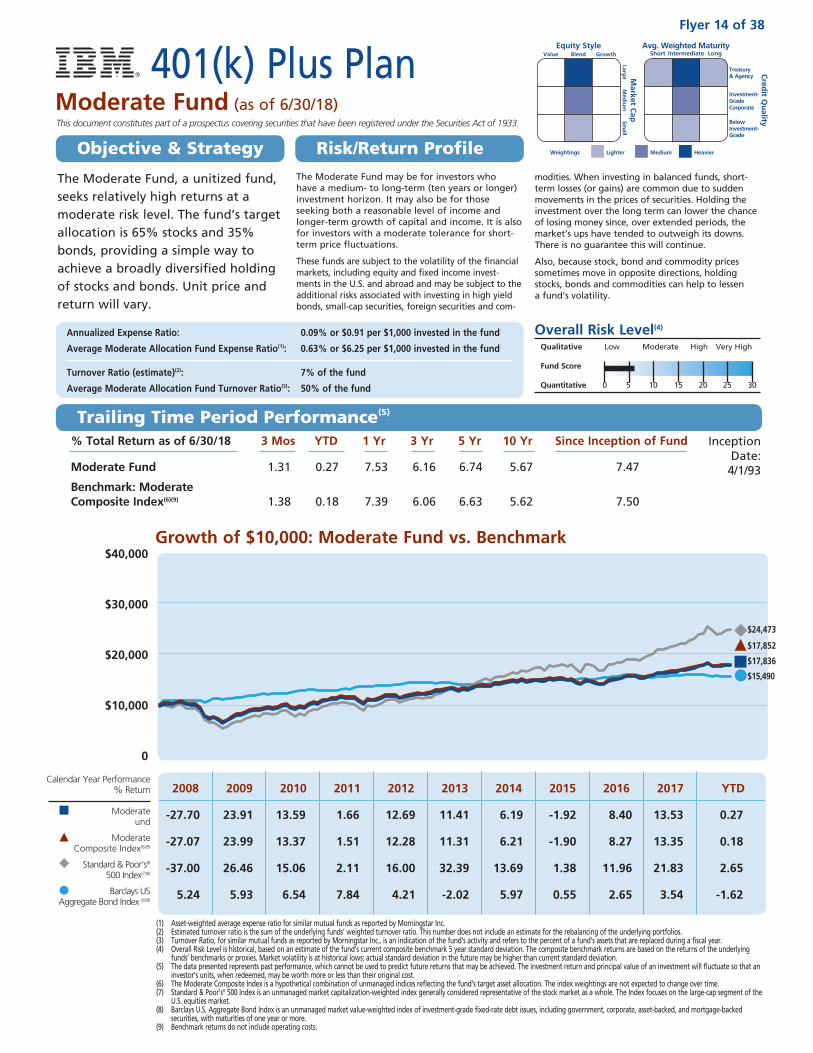
Trailing Time Period Performance(5)
Growth of $10,000: Moderate Fund vs. Benchmark
401(k) Plus PlanModerate Fund (as of 6/30/18)
$40,000
$30,000
$20,000
$10,000
0
% Total Return as of 6/30/18 3 Mos YTD 1 Yr 3 Yr 5 Yr 10 Yr Since Inception of Fund
Moderate Fund 1.31 0.27 7.53 6.16 6.74 5.67 7.47
Benchmark: Moderate Composite Index(6)(9) 1.38 0.18 7.39 6.06 6.63 5.62 7.50
The Moderate Fund may be for investors who have a medium- to long-term (ten years or longer) investment horizon. It may also be for those seeking both a reasonable level of income and longer-term growth of capital and income. It is also for investors with a moderate tolerance for short-term price fluctuations.
These funds are subject to the volatility of the financial markets, including equity and fixed income invest-ments in the U.S. and abroad and may be subject to the additional risks associated with investing in high yield bonds, small-cap securities, foreign securities and com-
modities. When investing in balanced funds, short-term losses (or gains) are common due to sudden movements in the prices of securities. Holding the investment over the long term can lower the chance of losing money since, over extended periods, the market’s ups have tended to outweigh its downs. There is no guarantee this will continue.
Also, because stock, bond and commodity prices sometimes move in opposite directions, holding stocks, bonds and commodities can help to lessen a fund’s volatility.
Annualized Expense Ratio: 0.09% or $0.91 per $1,000 invested in the fund
Average Moderate Allocation Fund Expense Ratio(1): 0.63% or $6.25 per $1,000 invested in the fund
Turnover Ratio (estimate)(2): 7% of the fund
Average Moderate Allocation Fund Turnover Ratio(3): 50% of the fund
Inception Date:
4/1/93
(1) Asset-weighted average expense ratio for similar mutual funds as reported by Morningstar Inc.(2) Estimated turnover ratio is the sum of the underlying funds’ weighted turnover ratio. This number does not include an estimate for the rebalancing of the underlying portfolios.(3) Turnover Ratio, for similar mutual funds as reported by Morningstar Inc., is an indication of the fund’s activity and refers to the percent of a fund’s assets that are replaced during a fiscal year.(4) Overall Risk Level is historical, based on an estimate of the fund’s current composite benchmark 5 year standard deviation. The composite benchmark returns are based on the returns of the underlying
funds’ benchmarks or proxies. Market volatility is at historical lows; actual standard deviation in the future may be higher than current standard deviation.(5) The data presented represents past performance, which cannot be used to predict future returns that may be achieved. The investment return and principal value of an investment will fluctuate so that an
investor’s units, when redeemed, may be worth more or less than their original cost.(6) The Moderate Composite Index is a hypothetical combination of unmanaged indices reflecting the fund’s target asset allocation. The index weightings are not expected to change over time.(7) Standard & Poor’s® 500 Index is an unmanaged market capitalization-weighted index generally considered representative of the stock market as a whole. The Index focuses on the large-cap segment of the
U.S. equities market.(8) Barclays U.S. Aggregate Bond Index is an unmanaged market value-weighted index of investment-grade fixed-rate debt issues, including government, corporate, asset-backed, and mortgage-backed
securities, with maturities of one year or more.(9) Benchmark returns do not include operating costs.
Overall Risk Level(4)
Qualitative Low Moderate High Very High
Fund Score
Quantitative 0 5 10 15 20 25 30
The Moderate Fund, a unitized fund, seeks relatively high returns at a moderate risk level. The fund’s target allocation is 65% stocks and 35% bonds, providing a simple way to achieve a broadly diversified holding of stocks and bonds. Unit price and return will vary.
2008 2009 2010 2011 2012 2013 2014 2015 2016 2017 YTD
-27.70 23.91 13.59 1.66 12.69 11.41 6.19 -1.92 8.40 13.53 0.27
-27.07 23.99 13.37 1.51 12.28 11.31 6.21 -1.90 8.27 13.35 0.18
-37.00 26.46 15.06 2.11 16.00 32.39 13.69 1.38 11.96 21.83 2.65
5.24 5.93 6.54 7.84 4.21 -2.02 5.97 0.55 2.65 3.54 -1.62
Calendar Year Performance % Return
Moderate und
Moderate Composite Index(6)(9)
Standard & Poor’s® 500 Index(7)(9)
Barclays US Aggregate Bond Index (8)(9)
This document constitutes part of a prospectus covering securities that have been registered under the Securities Act of 1933.
Flyer 14 of 38
Objective & Strategy Risk/Return Profile
Avg. Weighted Maturity Short Intermediate Long
Equity Style Value Blend Growth
Market C
ap
Large
Med
ium
Sm
all
Cred
it Qu
ality
Treasury & Agency
Investment- Grade Corporate
Below Investment- Grade
LighterWeightings Medium Heavier
$24,473
$15,490
$17,852
$17,836

Moderate Fund (as of 6/30/18)
Target Allocation (by fund)
Inflation Protected Bond Fund 12%
Total Stock Market Index Fund 24%
Total International Stock Market Index Fund 16%
Total Bond Market Fund 20%
High Yield & Emerging Markets Bond Fund 3%
Commodities Fund 2%Balanced Exposure Fund 15%
Global Real Estate Stock Index Fund 8%
The underlying funds may lend their holdings to qualified institutional investors to seek to enhance returns through fees earned related to the securities lent. Although all loans of securities are fully collateralized, there is some risk of loss if a borrower defaults on its obligation or losses occur related to the collateral received. Securities lending is performed in accordance with applicable law and regulations.The IBM 401(k) Plus Plan Trust (Trust) has claimed an exclusion from the definition of the term “commodity pool operator” under the Commodity Exchange Act (Act) and, therefore, the Trust is not subject to registration or regulation as a pool operator under the Act.IBM® is a registered trademark of International Business Machines Corporation. All rights reserved.Standard & Poor’s®, S&P®, S&P 500®, Standard & Poor’s 500, and 500 are trademarks of The McGraw-Hill Companies, Inc.©2018 International Business Machines Corporation. All rights reserved.
Fund Net Assets: $2,724 millionTotal # Holdings: 8 fundsFund Manager: IBM Retirement Funds
and underlying fund managers
The fund does not buy securities directly; instead, it invests in eight 401(k) Plus Plan funds: the Inflation Protected Bond Fund, the Total Bond Market Fund, the High Yield & Emerging Markets Bond Fund, the Global Real Estate Stock Index Fund, the Total Stock Market Index Fund, the Total International Stock Market Index Fund, the Balanced Exposure Fund and the Commodities Fund. This gives the fund exposure to a broadly diversified group of U.S. and foreign stocks and various types of bonds. As of June 30, 2018, the fund’s target asset allocation between stocks and bonds is 65% stocks*, 35% bonds. The current target allocations by fund are provided in the Target Allocations chart above. The allocations to each fund are maintained close to the target allocations. For detailed information on the underlying funds that comprise the Moderate Fund, please read the corresponding fund flyers.
* Exposure to the Balanced Exposure and Commodities funds are considered part of the allocation to stocks.
Holdings
Standard: Benchmark: Moderate 3 YR 5 YR Standard & Poor’s 500 Index Composite Index Sharpe Ratio 0.90 1.06
R-Squared* 0.83 1.00 Standard Deviation 6.11% 5.98% Beta* 0.55 0.99Alpha* -0.69% 0.13%
*Based on trailing 36 months’ returns; alphas are annualized.
For detailed equity and fixed-income characteristics, please see underlying funds.
Advanced Analytics
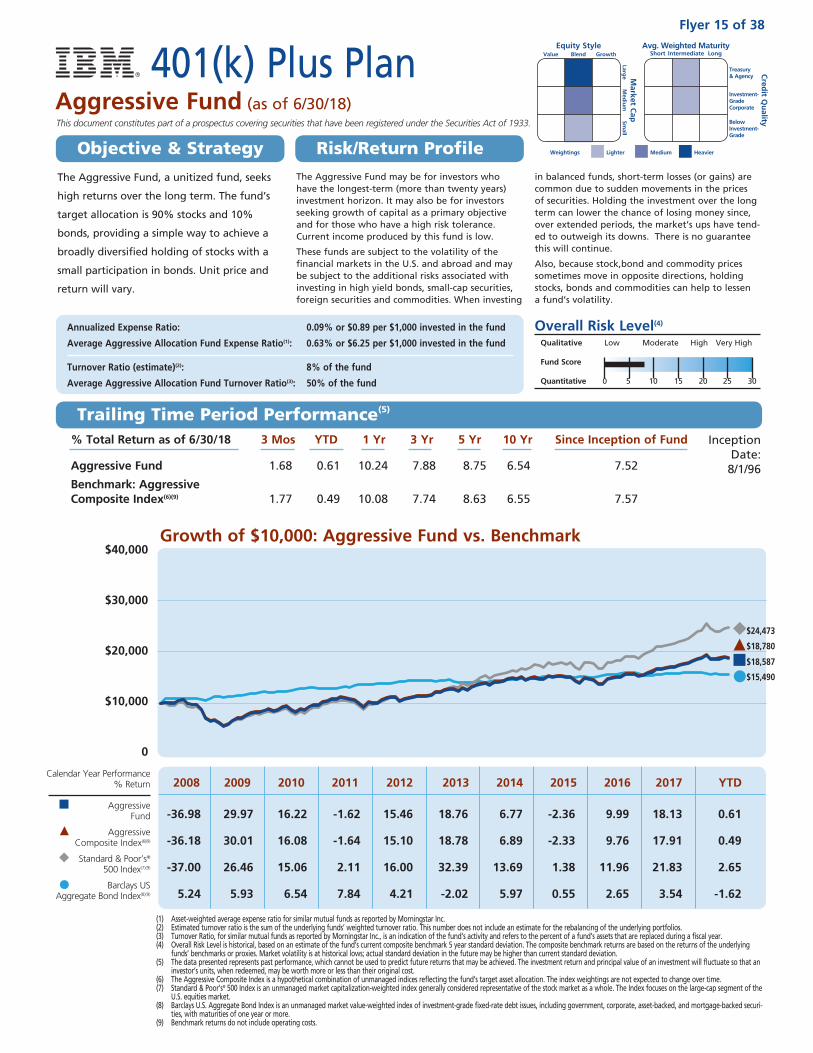
Growth of $10,000: Aggressive Fund vs. Benchmark $40,000
$30,000
$20,000
$10,000
0
% Total Return as of 6/30/18 3 Mos YTD 1 Yr 3 Yr 5 Yr 10 Yr Since Inception of Fund
Aggressive Fund 1.68 0.61 10.24 7.88 8.75 6.54 7.52
Benchmark: Aggressive Composite Index(6)(9) 1.77 0.49 10.08 7.74 8.63 6.55 7.57
The Aggressive Fund may be for investors who have the longest-term (more than twenty years) investment horizon. It may also be for investors seeking growth of capital as a primary objective and for those who have a high risk tolerance. Current income produced by this fund is low.
These funds are subject to the volatility of the financial markets in the U.S. and abroad and may be subject to the additional risks associated with investing in high yield bonds, small-cap securities, foreign securities and commodities. When investing
in balanced funds, short-term losses (or gains) are common due to sudden movements in the prices of securities. Holding the investment over the long term can lower the chance of losing money since, over extended periods, the market’s ups have tend-ed to outweigh its downs. There is no guarantee this will continue.
Also, because stock,bond and commodity prices sometimes move in opposite directions, holding stocks, bonds and commodities can help to lessen a fund’s volatility.
Annualized Expense Ratio: 0.09% or $0.89 per $1,000 invested in the fund
Average Aggressive Allocation Fund Expense Ratio(1): 0.63% or $6.25 per $1,000 invested in the fund
Turnover Ratio (estimate)(2): 8% of the fund
Average Aggressive Allocation Fund Turnover Ratio(3): 50% of the fund
Inception Date:
8/1/96
(1) Asset-weighted average expense ratio for similar mutual funds as reported by Morningstar Inc.(2) Estimated turnover ratio is the sum of the underlying funds’ weighted turnover ratio. This number does not include an estimate for the rebalancing of the underlying portfolios.(3) Turnover Ratio, for similar mutual funds as reported by Morningstar Inc., is an indication of the fund’s activity and refers to the percent of a fund’s assets that are replaced during a fiscal year.(4) Overall Risk Level is historical, based on an estimate of the fund’s current composite benchmark 5 year standard deviation. The composite benchmark returns are based on the returns of the underlying
funds’ benchmarks or proxies. Market volatility is at historical lows; actual standard deviation in the future may be higher than current standard deviation.(5) The data presented represents past performance, which cannot be used to predict future returns that may be achieved. The investment return and principal value of an investment will fluctuate so that an
investor’s units, when redeemed, may be worth more or less than their original cost.(6) The Aggressive Composite Index is a hypothetical combination of unmanaged indices reflecting the fund’s target asset allocation. The index weightings are not expected to change over time.(7) Standard & Poor’s® 500 Index is an unmanaged market capitalization-weighted index generally considered representative of the stock market as a whole. The Index focuses on the large-cap segment of the
U.S. equities market.(8) Barclays U.S. Aggregate Bond Index is an unmanaged market value-weighted index of investment-grade fixed-rate debt issues, including government, corporate, asset-backed, and mortgage-backed securi-
ties, with maturities of one year or more.(9) Benchmark returns do not include operating costs.
Overall Risk Level(4)
Qualitative Low Moderate High Very High
Fund Score
Quantitative 0 5 10 15 20 25 30
The Aggressive Fund, a unitized fund, seeks
high returns over the long term. The fund’s
target allocation is 90% stocks and 10%
bonds, providing a simple way to achieve a
broadly diversified holding of stocks with a
small participation in bonds. Unit price and
return will vary.
2008 2009 2010 2011 2012 2013 2014 2015 2016 2017 YTD
-36.98 29.97 16.22 -1.62 15.46 18.76 6.77 -2.36 9.99 18.13 0.61
-36.18 30.01 16.08 -1.64 15.10 18.78 6.89 -2.33 9.76 17.91 0.49
-37.00 26.46 15.06 2.11 16.00 32.39 13.69 1.38 11.96 21.83 2.65
5.24 5.93 6.54 7.84 4.21 -2.02 5.97 0.55 2.65 3.54 -1.62
Calendar Year Performance % Return
Aggressive Fund
Aggressive Composite Index(6)(9)
Standard & Poor’s® 500 Index(7)(9)
Barclays US Aggregate Bond Index(8)(9)
This document constitutes part of a prospectus covering securities that have been registered under the Securities Act of 1933.
Equity Style Value Blend Growth
Market C
ap
Large
Med
ium
Sm
all
Avg. Weighted Maturity Short Intermediate Long
Cred
it Qu
ality
Treasury & Agency
Investment- Grade Corporate
Below Investment- Grade
LighterWeightings Medium Heavier
401(k) Plus PlanAggressive Fund (as of 6/30/18)
Flyer 15 of 38
Objective & Strategy Risk/Return Profile
Trailing Time Period Performance(5)
$24,473
$18,587
$18,780
$15,490
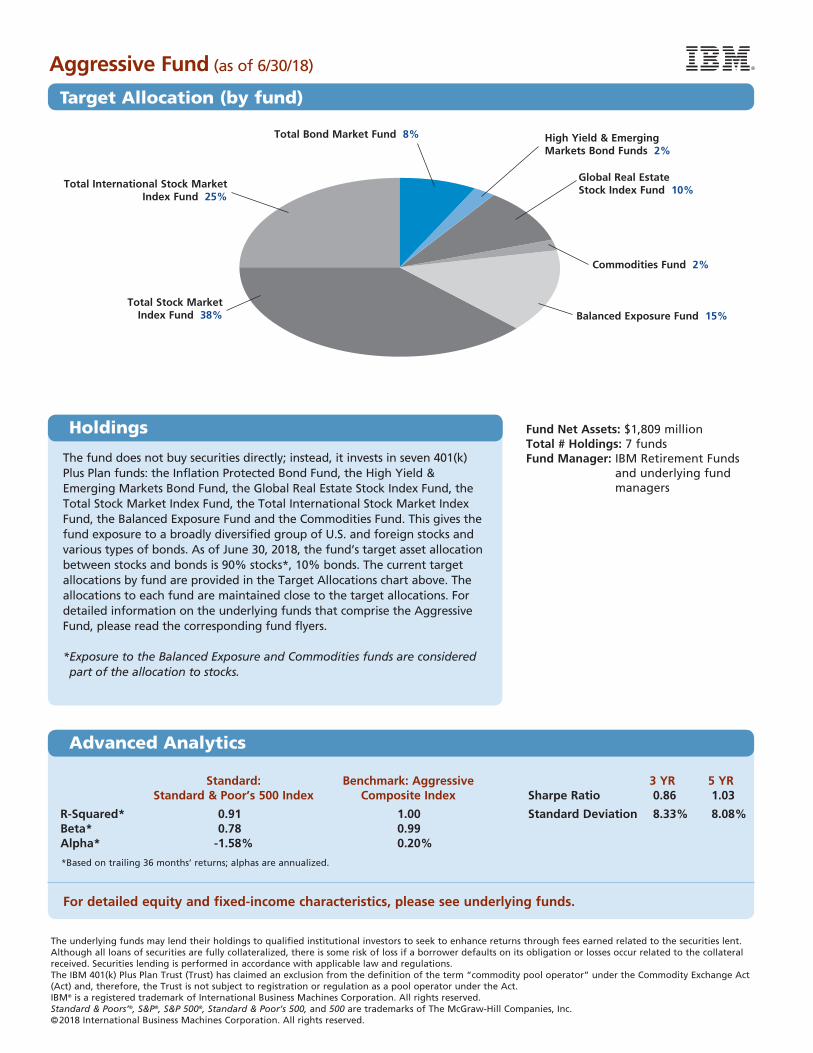
Total Bond Market Fund 8%
Total International Stock Market Index Fund 25%
Total Stock Market Index Fund 38%
High Yield & Emerging Markets Bond Funds 2%
Global Real Estate Stock Index Fund 10%
Commodities Fund 2%
Balanced Exposure Fund 15%
The underlying funds may lend their holdings to qualified institutional investors to seek to enhance returns through fees earned related to the securities lent. Although all loans of securities are fully collateralized, there is some risk of loss if a borrower defaults on its obligation or losses occur related to the collateral received. Securities lending is performed in accordance with applicable law and regulations.The IBM 401(k) Plus Plan Trust (Trust) has claimed an exclusion from the definition of the term “commodity pool operator” under the Commodity Exchange Act (Act) and, therefore, the Trust is not subject to registration or regulation as a pool operator under the Act.IBM® is a registered trademark of International Business Machines Corporation. All rights reserved.Standard & Poors’®, S&P®, S&P 500®, Standard & Poor’s 500, and 500 are trademarks of The McGraw-Hill Companies, Inc.©2018 International Business Machines Corporation. All rights reserved.
Fund Net Assets: $1,809 millionTotal # Holdings: 7 fundsFund Manager: IBM Retirement Funds
and underlying fund managers
Aggressive Fund (as of 6/30/18)
Target Allocation (by fund)
Standard: Benchmark: Aggressive 3 YR 5 YR Standard & Poor’s 500 Index Composite Index Sharpe Ratio 0.86 1.03
R-Squared* 0.91 1.00 Standard Deviation 8.33% 8.08% Beta* 0.78 0.99 Alpha* -1.58% 0.20%
*Based on trailing 36 months’ returns; alphas are annualized.
For detailed equity and fixed-income characteristics, please see underlying funds.
The fund does not buy securities directly; instead, it invests in seven 401(k) Plus Plan funds: the Inflation Protected Bond Fund, the High Yield & Emerging Markets Bond Fund, the Global Real Estate Stock Index Fund, the Total Stock Market Index Fund, the Total International Stock Market Index Fund, the Balanced Exposure Fund and the Commodities Fund. This gives the fund exposure to a broadly diversified group of U.S. and foreign stocks and various types of bonds. As of June 30, 2018, the fund’s target asset allocation between stocks and bonds is 90% stocks*, 10% bonds. The current target allocations by fund are provided in the Target Allocations chart above. The allocations to each fund are maintained close to the target allocations. For detailed information on the underlying funds that comprise the Aggressive Fund, please read the corresponding fund flyers.
* Exposure to the Balanced Exposure and Commodities funds are considered part of the allocation to stocks.
Holdings
Advanced Analytics
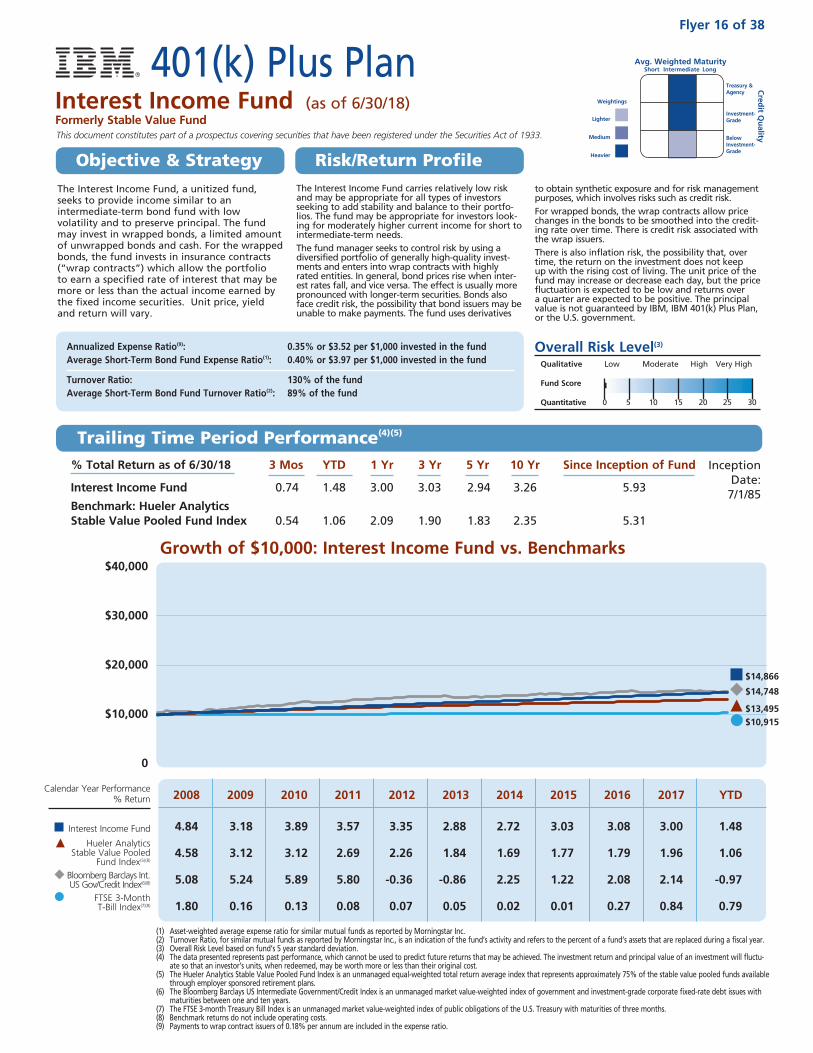
Growth of $10,000: Interest Income Fund vs. Benchmarks
401(k) Plus PlanInterest Income Fund (as of 6/30/18)Formerly Stable Value Fund
$40,000
$30,000
$20,000
$10,000
0
% Total Return as of 6/30/18 3 Mos YTD 1 Yr 3 Yr 5 Yr 10 Yr Since Inception of Fund
Interest Income Fund 0.74 1.48 3.00 3.03 2.94 3.26 5.93
Benchmark: Hueler Analytics Stable Value Pooled Fund Index 0.54 1.06 2.09 1.90 1.83 2.35 5.31
Trailing Time Period Performance(4)(5)
The Interest Income Fund carries relatively low risk and may be appropriate for all types of investors seeking to add stability and balance to their portfo-lios. The fund may be appropriate for investors look-ing for moderately higher current income for short to intermediate-term needs.The fund manager seeks to control risk by using a diversified portfolio of generally high-quality invest-ments and enters into wrap contracts with highly rated entities. In general, bond prices rise when inter-est rates fall, and vice versa. The effect is usually more pronounced with longer-term securities. Bonds also face credit risk, the possibility that bond issuers may be unable to make payments. The fund uses derivatives
to obtain synthetic exposure and for risk management purposes, which involves risks such as credit risk. For wrapped bonds, the wrap contracts allow price changes in the bonds to be smoothed into the credit-ing rate over time. There is credit risk associated with the wrap issuers. There is also inflation risk, the possibility that, over time, the return on the investment does not keep up with the rising cost of living. The unit price of the fund may increase or decrease each day, but the price fluctuation is expected to be low and returns over a quarter are expected to be positive. The principal value is not guaranteed by IBM, IBM 401(k) Plus Plan, or the U.S. government.
Annualized Expense Ratio(9): 0.35% or $3.52 per $1,000 invested in the fund Average Short-Term Bond Fund Expense Ratio(1): 0.40% or $3.97 per $1,000 invested in the fund
Turnover Ratio: 130% of the fund Average Short-Term Bond Fund Turnover Ratio(2): 89% of the fund
Inception Date:
7/1/85
(1) Asset-weighted average expense ratio for similar mutual funds as reported by Morningstar Inc.(2) Turnover Ratio, for similar mutual funds as reported by Morningstar Inc., is an indication of the fund’s activity and refers to the percent of a fund’s assets that are replaced during a fiscal year.(3) Overall Risk Level based on fund’s 5 year standard deviation.(4) The data presented represents past performance, which cannot be used to predict future returns that may be achieved. The investment return and principal value of an investment will fluctu-
ate so that an investor’s units, when redeemed, may be worth more or less than their original cost.(5) The Hueler Analytics Stable Value Pooled Fund Index is an unmanaged equal-weighted total return average index that represents approximately 75% of the stable value pooled funds available
through employer sponsored retirement plans.(6) The Bloomberg Barclays US Intermediate Government/Credit Index is an unmanaged market value-weighted index of government and investment-grade corporate fixed-rate debt issues with
maturities between one and ten years.(7) The FTSE 3-month Treasury Bill Index is an unmanaged market value-weighted index of public obligations of the U.S. Treasury with maturities of three months.(8) Benchmark returns do not include operating costs.(9) Payments to wrap contract issuers of 0.18% per annum are included in the expense ratio.
Overall Risk Level(3)
Qualitative Low Moderate High Very High
Fund Score
Quantitative 0 5 10 15 20 25 30
The Interest Income Fund, a unitized fund, seeks to provide income similar to an intermediate-term bond fund with low volatility and to preserve principal. The fund may invest in wrapped bonds, a limited amount of unwrapped bonds and cash. For the wrapped bonds, the fund invests in insurance contracts (“wrap contracts”) which allow the portfolio to earn a specified rate of interest that may be more or less than the actual income earned by the fixed income securities. Unit price, yield and return will vary.
2008 2009 2010 2011 2012 2013 2014 2015 2016 2017 YTD
4.84 3.18 3.89 3.57 3.35 2.88 2.72 3.03 3.08 3.00 1.48
4.58 3.12 3.12 2.69 2.26 1.84 1.69 1.77 1.79 1.96 1.06
5.08 5.24 5.89 5.80 -0.36 -0.86 2.25 1.22 2.08 2.14 -0.97
1.80 0.16 0.13 0.08 0.07 0.05 0.02 0.01 0.27 0.84 0.79
Calendar Year Performance % Return
Interest Income Fund
Hueler Analytics Stable Value Pooled
Fund Index(5)(8)
Bloomberg Barclays Int. US Gov/Credit Index(6)(8)
FTSE 3-Month T-Bill Index(7)(8)
Lighter
Medium
Heavier
Weightings
This document constitutes part of a prospectus covering securities that have been registered under the Securities Act of 1933.
Flyer 16 of 38
Avg. Weighted Maturity Short Intermediate Long
Cred
it Qu
ality
Treasury & Agency
Investment- Grade
Below Investment- Grade
Objective & Strategy Risk/Return Profile
$13,495
$14,866
$14,748
$10,915
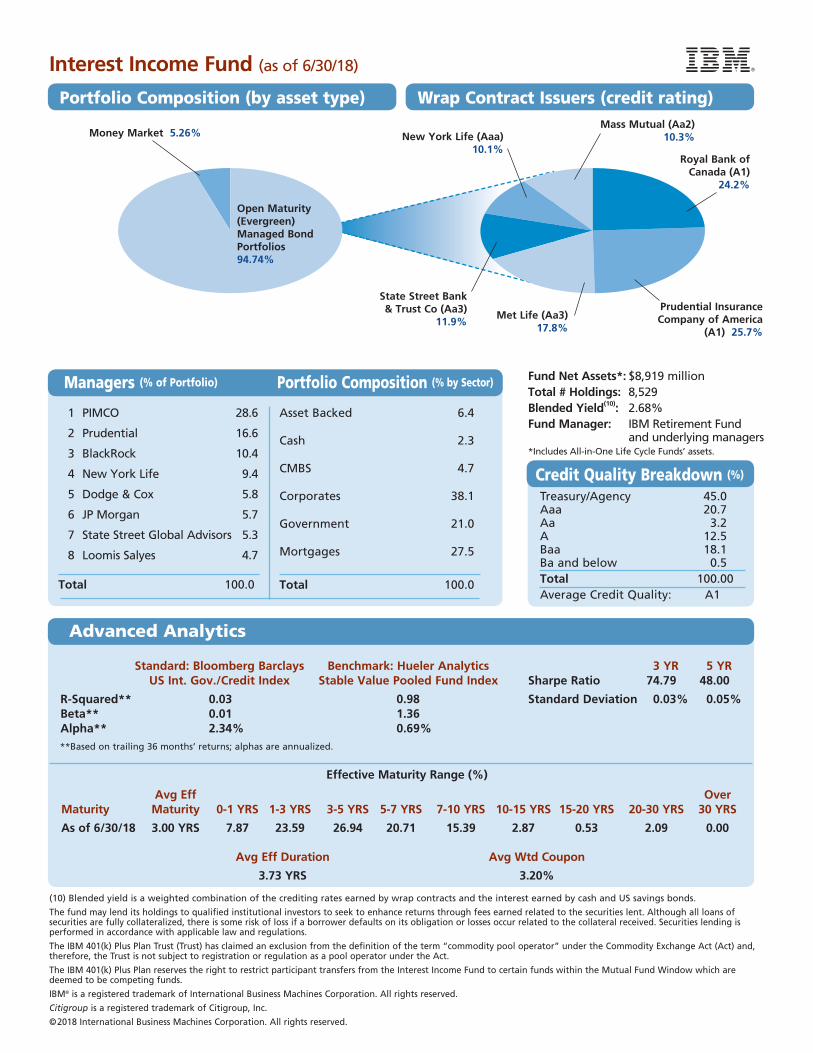
Standard: Bloomberg Barclays Benchmark: Hueler Analytics 3 YR 5 YR US Int. Gov./Credit Index Stable Value Pooled Fund Index Sharpe Ratio 74.79 48.00
R-Squared** 0.03 0.98 Standard Deviation 0.03% 0.05% Beta** 0.01 1.36 Alpha** 2.34% 0.69% **Based on trailing 36 months’ returns; alphas are annualized.
Effective Maturity Range (%)
Avg Eff Over Maturity Maturity 0-1 YRS 1-3 YRS 3-5 YRS 5-7 YRS 7-10 YRS 10-15 YRS 15-20 YRS 20-30 YRS 30 YRS
As of 6/30/18 3.00 YRS 7.87 23.59 26.94 20.71 15.39 2.87 0.53 2.09 0.00
Avg Eff Duration Avg Wtd Coupon
3.73 YRS 3.20%
1 PIMCO 28.6
2 Prudential 16.6
3 BlackRock 10.4
4 New York Life 9.4
5 Dodge & Cox 5.8
6 JP Morgan 5.7
7 State Street Global Advisors 5.3
8 Loomis Salyes 4.7
Total 100.0
Asset Backed 6.4
Cash 2.3
CMBS 4.7
Corporates 38.1
Government 21.0
Mortgages 27.5
Total 100.0
Treasury/Agency 45.0Aaa 20.7Aa 3.2A 12.5Baa 18.1Ba and below 0.5Total 100.00Average Credit Quality: A1
Credit Quality Breakdown (%)
Interest Income Fund (as of 6/30/18)
Fund Net Assets*: $8,919 millionTotal # Holdings: 8,529 Blended Yield(10): 2.68%Fund Manager: IBM Retirement Fund
and underlying managers*Includes All-in-One Life Cycle Funds’ assets.
(10) Blended yield is a weighted combination of the crediting rates earned by wrap contracts and the interest earned by cash and US savings bonds.
The fund may lend its holdings to qualified institutional investors to seek to enhance returns through fees earned related to the securities lent. Although all loans of securities are fully collateralized, there is some risk of loss if a borrower defaults on its obligation or losses occur related to the collateral received. Securities lending is performed in accordance with applicable law and regulations.
The IBM 401(k) Plus Plan Trust (Trust) has claimed an exclusion from the definition of the term “commodity pool operator” under the Commodity Exchange Act (Act) and, therefore, the Trust is not subject to registration or regulation as a pool operator under the Act.
The IBM 401(k) Plus Plan reserves the right to restrict participant transfers from the Interest Income Fund to certain funds within the Mutual Fund Window which are deemed to be competing funds.
IBM® is a registered trademark of International Business Machines Corporation. All rights reserved.
Citigroup is a registered trademark of Citigroup, Inc.
©2018 International Business Machines Corporation. All rights reserved.
Managers (% of Portfolio) Portfolio Composition (% by Sector)
Wrap Contract Issuers (credit rating)Portfolio Composition (by asset type)
Advanced Analytics
Royal Bank of Canada (A1)
24.2%
Mass Mutual (Aa2) 10.3%
State Street Bank & Trust Co (Aa3)
11.9%Prudential Insurance Company of America
(A1) 25.7%
New York Life (Aaa) 10.1%
Met Life (Aa3) 17.8%
Open Maturity (Evergreen) Managed Bond Portfolios 94.74%
Money Market 5.26%
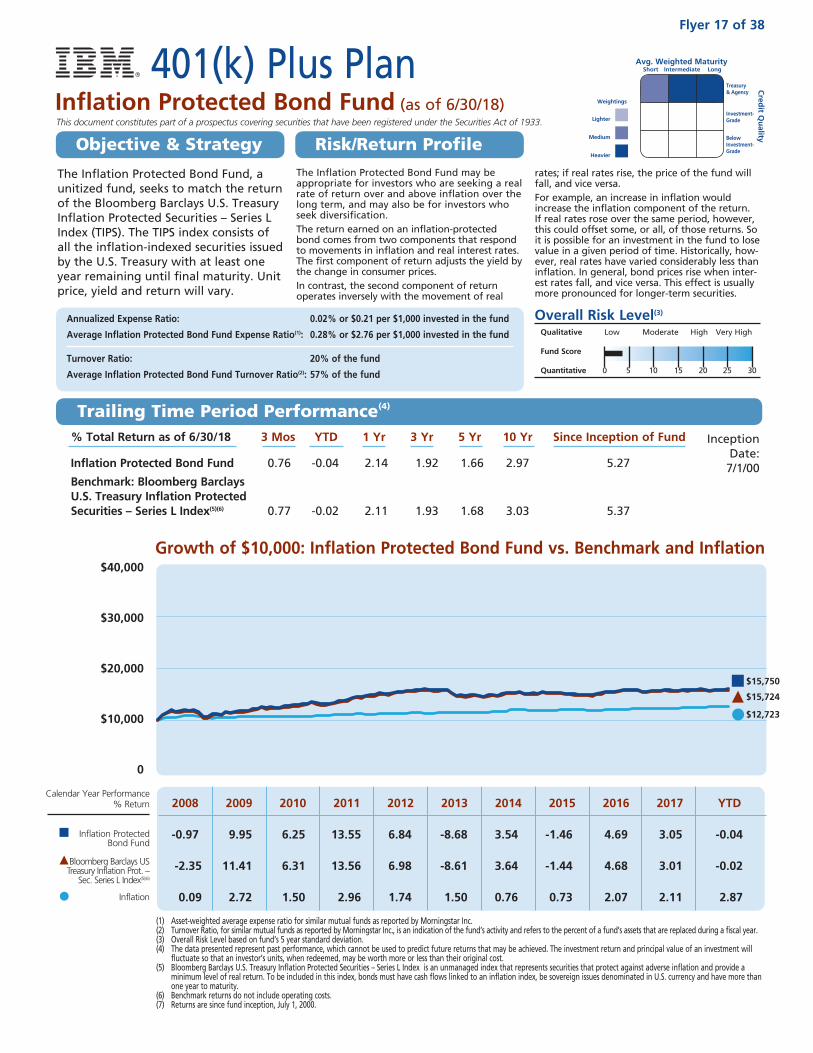
The Inflation Protected Bond Fund may be appropriate for investors who are seeking a real rate of return over and above inflation over the long term, and may also be for investors who seek diversification. The return earned on an inflation-protected bond comes from two components that respond to movements in inflation and real interest rates. The first component of return adjusts the yield by the change in consumer prices. In contrast, the second component of return operates inversely with the movement of real
rates; if real rates rise, the price of the fund will fall, and vice versa.For example, an increase in inflation would increase the inflation component of the return. If real rates rose over the same period, however, this could offset some, or all, of those returns. So it is possible for an investment in the fund to lose value in a given period of time. Historically, how-ever, real rates have varied considerably less than inflation. In general, bond prices rise when inter-est rates fall, and vice versa. This effect is usually more pronounced for longer-term securities.
Annualized Expense Ratio: 0.02% or $0.21 per $1,000 invested in the fund
Average Inflation Protected Bond Fund Expense Ratio(1): 0.28% or $2.76 per $1,000 invested in the fund
Turnover Ratio: 20% of the fund
Average Inflation Protected Bond Fund Turnover Ratio(2): 57% of the fund
Overall Risk Level(3)
Qualitative Low Moderate High Very High
Fund Score
Quantitative 0 5 10 15 20 25 30
The Inflation Protected Bond Fund, a unitized fund, seeks to match the return of the Bloomberg Barclays U.S. Treasury Inflation Protected Securities – Series L Index (TIPS). The TIPS index consists of all the inflation-indexed securities issued by the U.S. Treasury with at least one year remaining until final maturity. Unit price, yield and return will vary.
Lighter
Medium
Heavier
Weightings
This document constitutes part of a prospectus covering securities that have been registered under the Securities Act of 1933.
Flyer 17 of 38
Avg. Weighted Maturity Short Intermediate Long
Cred
it Qu
ality
Treasury & Agency
Investment- Grade
Below Investment- Grade
% Total Return as of 6/30/18 3 Mos YTD 1 Yr 3 Yr 5 Yr 10 Yr Since Inception of Fund
Inflation Protected Bond Fund 0.76 -0.04 2.14 1.92 1.66 2.97 5.27
Benchmark: Bloomberg Barclays U.S. Treasury Inflation Protected Securities – Series L Index(5)(6) 0.77 -0.02 2.11 1.93 1.68 3.03 5.37
Growth of $10,000: Inflation Protected Bond Fund vs. Benchmark and Inflation$40,000
$30,000
$20,000
$10,000
0
Calendar Year Performance % Return
Inflation Protected Bond Fund
Bloomberg Barclays US Treasury Inflation Prot. –
Sec. Series L Index(5)(6)
Inflation
2008 2009 2010 2011 2012 2013 2014 2015 2016 2017 YTD
-0.97 9.95 6.25 13.55 6.84 -8.68 3.54 -1.46 4.69 3.05 -0.04
-2.35 11.41 6.31 13.56 6.98 -8.61 3.64 -1.44 4.68 3.01 -0.02
0.09 2.72 1.50 2.96 1.74 1.50 0.76 0.73 2.07 2.11 2.87
(1) Asset-weighted average expense ratio for similar mutual funds as reported by Morningstar Inc.(2) Turnover Ratio, for similar mutual funds as reported by Morningstar Inc., is an indication of the fund’s activity and refers to the percent of a fund’s assets that are replaced during a fiscal year.(3) Overall Risk Level based on fund’s 5 year standard deviation.(4) The data presented represent past performance, which cannot be used to predict future returns that may be achieved. The investment return and principal value of an investment will
fluctuate so that an investor’s units, when redeemed, may be worth more or less than their original cost.(5) Bloomberg Barclays U.S. Treasury Inflation Protected Securities – Series L Index is an unmanaged index that represents securities that protect against adverse inflation and provide a
minimum level of real return. To be included in this index, bonds must have cash flows linked to an inflation index, be sovereign issues denominated in U.S. currency and have more than one year to maturity.
(6) Benchmark returns do not include operating costs.(7) Returns are since fund inception, July 1, 2000.
Inception Date:
7/1/00
Trailing Time Period Performance(4)
401(k) Plus PlanInflation Protected Bond Fund (as of 6/30/18)
Objective & Strategy Risk/Return Profile
$12,723
$15,750
$15,724
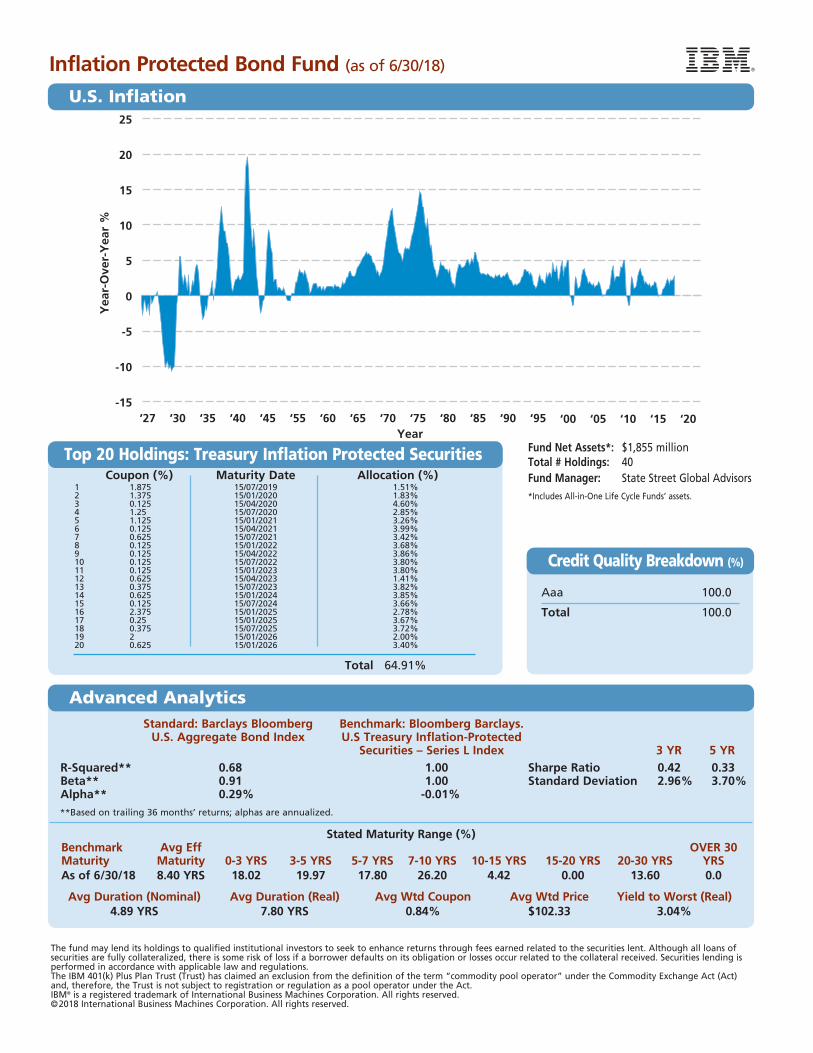
Top 20 Holdings: Treasury Inflation Protected Securities
Aaa 100.0
Total 100.0
Standard: Barclays Bloomberg Benchmark: Bloomberg Barclays. U.S. Aggregate Bond Index U.S Treasury Inflation-Protected Securities – Series L Index 3 YR 5 YRR-Squared** 0.68 1.00 Sharpe Ratio 0.42 0.33 Beta** 0.91 1.00 Standard Deviation 2.96% 3.70% Alpha** 0.29% -0.01%**Based on trailing 36 months’ returns; alphas are annualized.
Stated Maturity Range (%) Benchmark Avg Eff OVER 30 Maturity Maturity 0-3 YRS 3-5 YRS 5-7 YRS 7-10 YRS 10-15 YRS 15-20 YRS 20-30 YRS YRS
As of 6/30/18 8.40 YRS 18.02 19.97 17.80 26.20 4.42 0.00 13.60 0.0
Avg Duration (Nominal) Avg Duration (Real) Avg Wtd Coupon Avg Wtd Price Yield to Worst (Real) 4.89 YRS 7.80 YRS 0.84% $102.33 3.04%
Fund Net Assets*: $1,855 millionTotal # Holdings: 40Fund Manager: State Street Global Advisors*Includes All-in-One Life Cycle Funds’ assets.
The fund may lend its holdings to qualified institutional investors to seek to enhance returns through fees earned related to the securities lent. Although all loans of securities are fully collateralized, there is some risk of loss if a borrower defaults on its obligation or losses occur related to the collateral received. Securities lending is performed in accordance with applicable law and regulations.The IBM 401(k) Plus Plan Trust (Trust) has claimed an exclusion from the definition of the term “commodity pool operator” under the Commodity Exchange Act (Act) and, therefore, the Trust is not subject to registration or regulation as a pool operator under the Act.IBM® is a registered trademark of International Business Machines Corporation. All rights reserved.©2018 International Business Machines Corporation. All rights reserved.
Yea
r-O
ver-
Yea
r %
Coupon (%) Maturity Date Allocation (%)1 1.875 15/07/2019 1.51%2 1.375 15/01/2020 1.83%3 0.125 15/04/2020 4.60%4 1.25 15/07/2020 2.85%5 1.125 15/01/2021 3.26%6 0.125 15/04/2021 3.99%7 0.625 15/07/2021 3.42%8 0.125 15/01/2022 3.68%9 0.125 15/04/2022 3.86%10 0.125 15/07/2022 3.80%11 0.125 15/01/2023 3.80%12 0.625 15/04/2023 1.41%13 0.375 15/07/2023 3.82%14 0.625 15/01/2024 3.85%15 0.125 15/07/2024 3.66%16 2.375 15/01/2025 2.78%17 0.25 15/01/2025 3.67%18 0.375 15/07/2025 3.72%19 2 15/01/2026 2.00%20 0.625 15/01/2026 3.40%
Total 64.91%
Year
Credit Quality Breakdown (%)
Inflation Protected Bond Fund (as of 6/30/18)
U.S. Inflation
Advanced Analytics
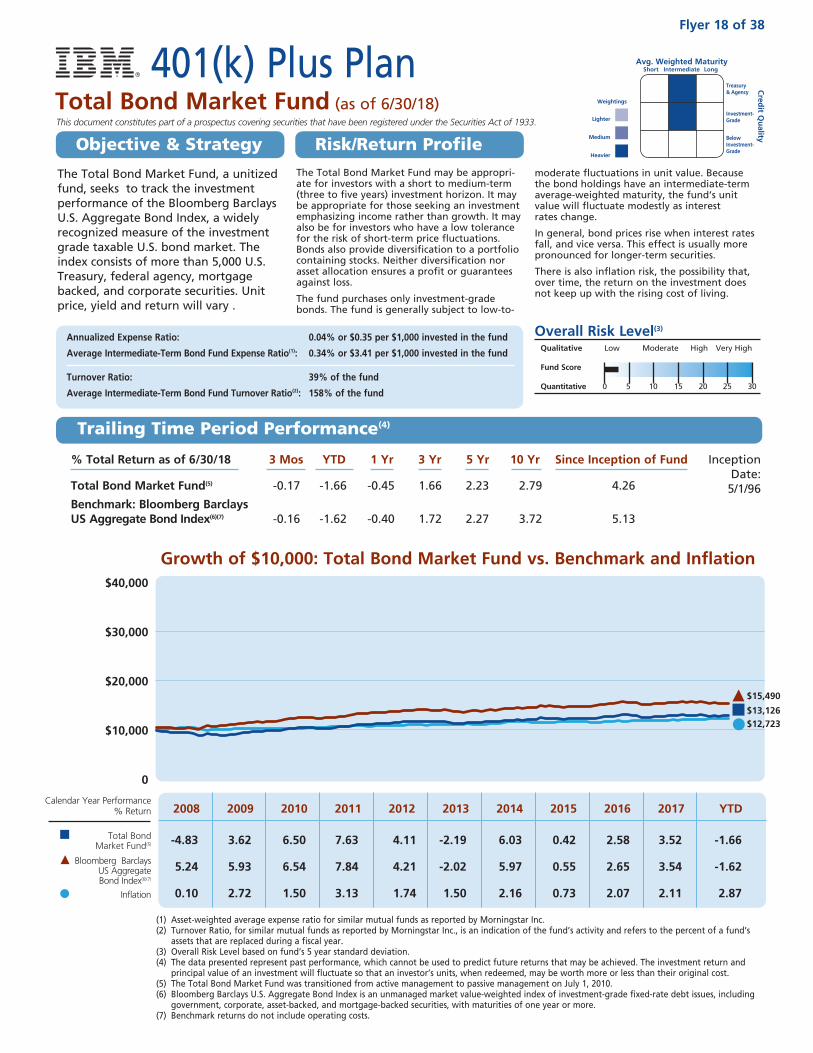
The Total Bond Market Fund may be appropri-ate for investors with a short to medium-term (three to five years) investment horizon. It may be appropriate for those seeking an investment emphasizing income rather than growth. It may also be for investors who have a low tolerance for the risk of short-term price fluctuations. Bonds also provide diversification to a portfolio containing stocks. Neither diversification nor asset allocation ensures a profit or guarantees against loss.
The fund purchases only investment-grade bonds. The fund is generally subject to low-to-
moderate fluctuations in unit value. Because the bond holdings have an intermediate-term average-weighted maturity, the fund’s unit value will fluctuate modestly as interest rates change.
In general, bond prices rise when interest rates fall, and vice versa. This effect is usually more pronounced for longer-term securities.
There is also inflation risk, the possibility that, over time, the return on the investment does not keep up with the rising cost of living.
Annualized Expense Ratio: 0.04% or $0.35 per $1,000 invested in the fund
Average Intermediate-Term Bond Fund Expense Ratio(1): 0.34% or $3.41 per $1,000 invested in the fund
Turnover Ratio: 39% of the fund
Average Intermediate-Term Bond Fund Turnover Ratio(2): 158% of the fund
Overall Risk Level(3)
Qualitative Low Moderate High Very High
Fund Score
Quantitative 0 5 10 15 20 25 30
The Total Bond Market Fund, a unitized fund, seeks to track the investment performance of the Bloomberg Barclays U.S. Aggregate Bond Index, a widely recognized measure of the investment grade taxable U.S. bond market. The index consists of more than 5,000 U.S. Treasury, federal agency, mortgage backed, and corporate securities. Unit price, yield and return will vary .
Lighter
Medium
Heavier
Weightings
This document constitutes part of a prospectus covering securities that have been registered under the Securities Act of 1933.
Flyer 18 of 38
Avg. Weighted Maturity Short Intermediate Long
Cred
it Qu
ality
Treasury & Agency
Investment- Grade
Below Investment- Grade
Growth of $10,000: Total Bond Market Fund vs. Benchmark and Inflation
% Total Return as of 6/30/18 3 Mos YTD 1 Yr 3 Yr 5 Yr 10 Yr Since Inception of Fund
Total Bond Market Fund(5) -0.17 -1.66 -0.45 1.66 2.23 2.79 4.26
Benchmark: Bloomberg Barclays US Aggregate Bond Index(6)(7) -0.16 -1.62 -0.40 1.72 2.27 3.72 5.13
Inception Date:
5/1/96
(1) Asset-weighted average expense ratio for similar mutual funds as reported by Morningstar Inc.(2) Turnover Ratio, for similar mutual funds as reported by Morningstar Inc., is an indication of the fund’s activity and refers to the percent of a fund’s
assets that are replaced during a fiscal year.(3) Overall Risk Level based on fund’s 5 year standard deviation.(4) The data presented represent past performance, which cannot be used to predict future returns that may be achieved. The investment return and
principal value of an investment will fluctuate so that an investor’s units, when redeemed, may be worth more or less than their original cost.(5) The Total Bond Market Fund was transitioned from active management to passive management on July 1, 2010.(6) Bloomberg Barclays U.S. Aggregate Bond Index is an unmanaged market value-weighted index of investment-grade fixed-rate debt issues, including
government, corporate, asset-backed, and mortgage-backed securities, with maturities of one year or more.(7) Benchmark returns do not include operating costs.
2008 2009 2010 2011 2012 2013 2014 2015 2016 2017 YTD
-4.83 3.62 6.50 7.63 4.11 -2.19 6.03 0.42 2.58 3.52 -1.66
5.24 5.93 6.54 7.84 4.21 -2.02 5.97 0.55 2.65 3.54 -1.62
0.10 2.72 1.50 3.13 1.74 1.50 2.16 0.73 2.07 2.11 2.87
Calendar Year Performance % Return
Total Bond Market Fund(5)
Bloomberg Barclays US Aggregate Bond Index(6)(7)
Inflation
$40,000
$30,000
$20,000
$10,000
0
Trailing Time Period Performance(4)
401(k) Plus PlanTotal Bond Market Fund (as of 6/30/18)
Objective & Strategy Risk/Return Profile
$13,126
$15,490
$12,723
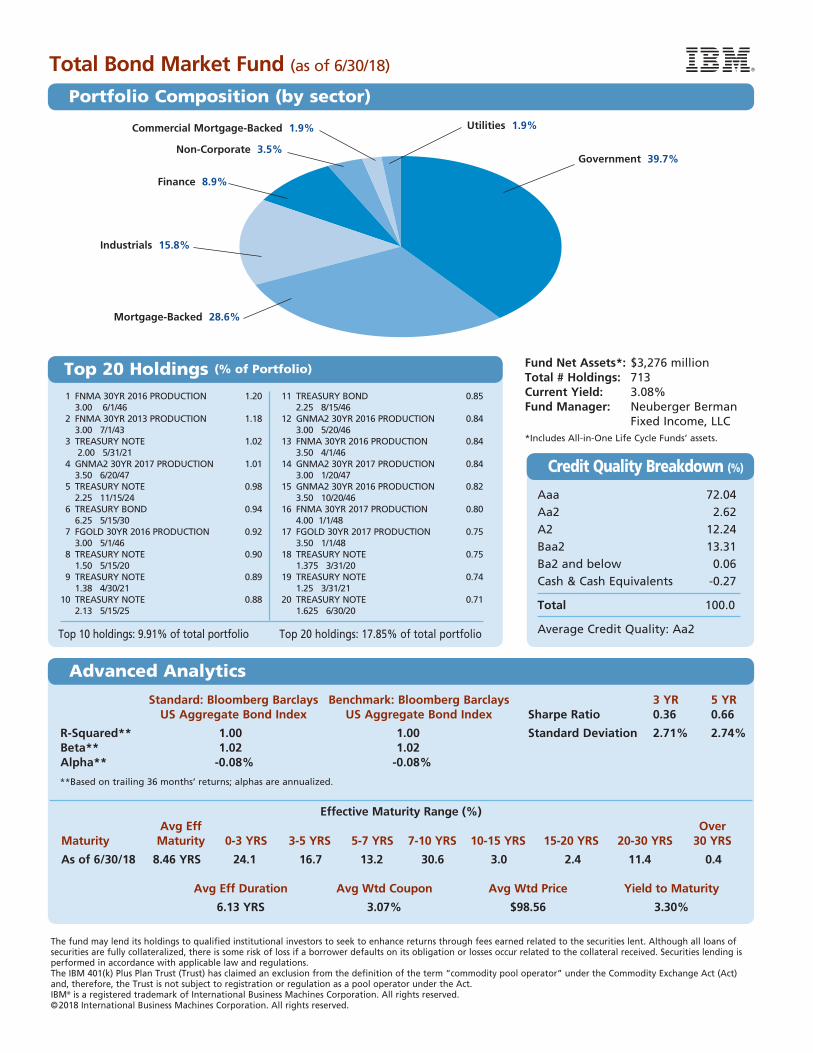
Mortgage-Backed 28.6%
Industrials 15.8%
Finance 8.9%
Non-Corporate 3.5%
Utilities 1.9%Commercial Mortgage-Backed 1.9%
1 FNMA 30YR 2016 PRODUCTION 1.20 3.00 6/1/46 2 FNMA 30YR 2013 PRODUCTION 1.18 3.00 7/1/43 3 TREASURY NOTE 1.02 2.00 5/31/21 4 GNMA2 30YR 2017 PRODUCTION 1.01 3.50 6/20/47 5 TREASURY NOTE 0.98 2.25 11/15/24 6 TREASURY BOND 0.94 6.25 5/15/30 7 FGOLD 30YR 2016 PRODUCTION 0.92 3.00 5/1/46 8 TREASURY NOTE 0.90 1.50 5/15/20 9 TREASURY NOTE 0.89 1.38 4/30/21 10 TREASURY NOTE 0.88 2.13 5/15/25
Top 10 holdings: 9.91% of total portfolio
Standard: Bloomberg Barclays Benchmark: Bloomberg Barclays 3 YR 5 YR US Aggregate Bond Index US Aggregate Bond Index Sharpe Ratio 0.36 0.66
R-Squared** 1.00 1.00 Standard Deviation 2.71% 2.74% Beta** 1.02 1.02 Alpha** -0.08% -0.08%
**Based on trailing 36 months’ returns; alphas are annualized.
Effective Maturity Range (%) Avg Eff Over Maturity Maturity 0-3 YRS 3-5 YRS 5-7 YRS 7-10 YRS 10-15 YRS 15-20 YRS 20-30 YRS 30 YRS
As of 6/30/18 8.46 YRS 24.1 16.7 13.2 30.6 3.0 2.4 11.4 0.4
Avg Eff Duration Avg Wtd Coupon Avg Wtd Price Yield to Maturity
6.13 YRS 3.07% $98.56 3.30%
The fund may lend its holdings to qualified institutional investors to seek to enhance returns through fees earned related to the securities lent. Although all loans of securities are fully collateralized, there is some risk of loss if a borrower defaults on its obligation or losses occur related to the collateral received. Securities lending is performed in accordance with applicable law and regulations.The IBM 401(k) Plus Plan Trust (Trust) has claimed an exclusion from the definition of the term “commodity pool operator” under the Commodity Exchange Act (Act) and, therefore, the Trust is not subject to registration or regulation as a pool operator under the Act.IBM® is a registered trademark of International Business Machines Corporation. All rights reserved.©2018 International Business Machines Corporation. All rights reserved.
Aaa 72.04Aa2 2.62A2 12.24Baa2 13.31Ba2 and below 0.06Cash & Cash Equivalents -0.27
Total 100.0
Average Credit Quality: Aa2
Fund Net Assets*: $3,276 millionTotal # Holdings: 713Current Yield: 3.08%Fund Manager: Neuberger Berman Fixed Income, LLC*Includes All-in-One Life Cycle Funds’ assets.
Government 39.7%
11 TREASURY BOND 0.85 2.25 8/15/46 12 GNMA2 30YR 2016 PRODUCTION 0.84 3.00 5/20/46 13 FNMA 30YR 2016 PRODUCTION 0.84 3.50 4/1/46 14 GNMA2 30YR 2017 PRODUCTION 0.84 3.00 1/20/47 15 GNMA2 30YR 2016 PRODUCTION 0.82 3.50 10/20/46 16 FNMA 30YR 2017 PRODUCTION 0.80 4.00 1/1/48 17 FGOLD 30YR 2017 PRODUCTION 0.75 3.50 1/1/48 18 TREASURY NOTE 0.75 1.375 3/31/20 19 TREASURY NOTE 0.74 1.25 3/31/21 20 TREASURY NOTE 0.71 1.625 6/30/20
Top 20 holdings: 17.85% of total portfolio
Credit Quality Breakdown (%)
Top 20 Holdings (% of Portfolio)
Total Bond Market Fund (as of 6/30/18)
Portfolio Composition (by sector)
Advanced Analytics
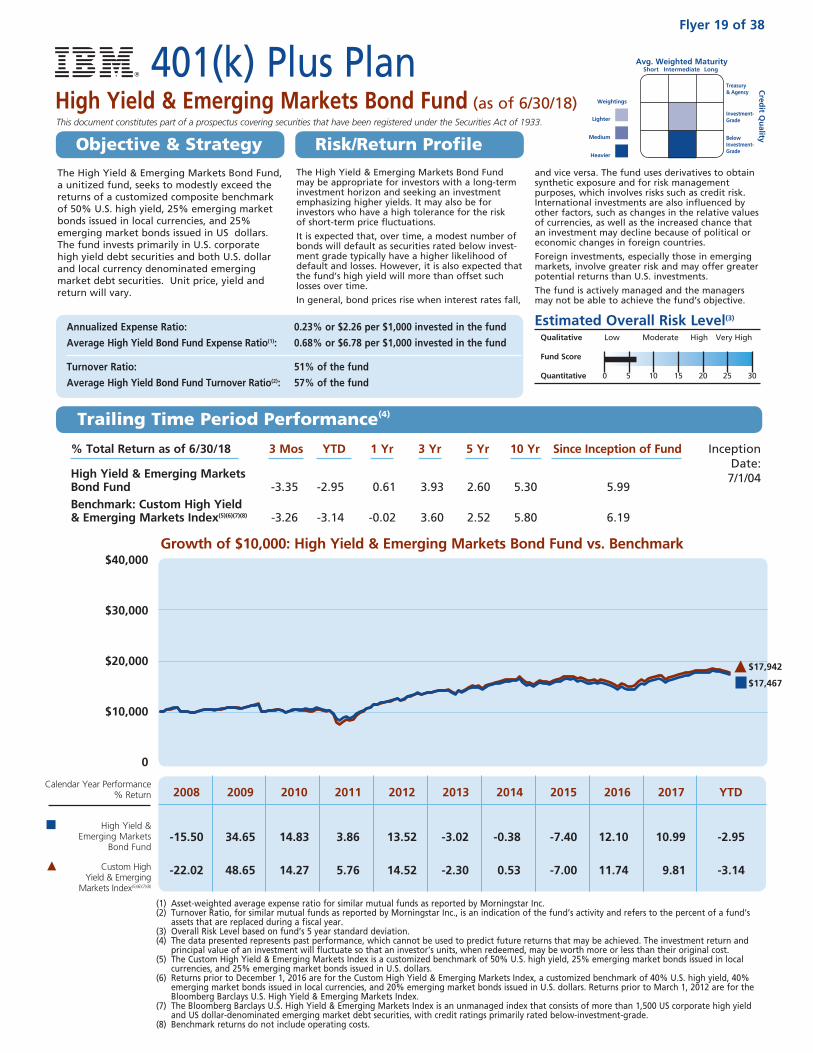
The High Yield & Emerging Markets Bond Fund may be appropriate for investors with a long-term investment horizon and seeking an investment emphasizing higher yields. It may also be for investors who have a high tolerance for the risk of short-term price fluctuations.
It is expected that, over time, a modest number of bonds will default as securities rated below invest-ment grade typically have a higher likelihood of default and losses. However, it is also expected that the fund’s high yield will more than offset such losses over time.
In general, bond prices rise when interest rates fall,
and vice versa. The fund uses derivatives to obtain synthetic exposure and for risk management purposes, which involves risks such as credit risk. International investments are also influenced by other factors, such as changes in the relative values of currencies, as well as the increased chance that an investment may decline because of political or economic changes in foreign countries.
Foreign investments, especially those in emerging markets, involve greater risk and may offer greater potential returns than U.S. investments.
The fund is actively managed and the managers may not be able to achieve the fund’s objective.
Annualized Expense Ratio: 0.23% or $2.26 per $1,000 invested in the fund
Average High Yield Bond Fund Expense Ratio(1): 0.68% or $6.78 per $1,000 invested in the fund
Turnover Ratio: 51% of the fund
Average High Yield Bond Fund Turnover Ratio(2): 57% of the fund
Estimated Overall Risk Level(3)
Qualitative Low Moderate High Very High
Fund Score
Quantitative 0 5 10 15 20 25 30
The High Yield & Emerging Markets Bond Fund, a unitized fund, seeks to modestly exceed the returns of a customized composite benchmark of 50% U.S. high yield, 25% emerging market bonds issued in local currencies, and 25% emerging market bonds issued in US dollars. The fund invests primarily in U.S. corporate high yield debt securities and both U.S. dollar and local currency denominated emerging market debt securities. Unit price, yield and return will vary.
Lighter
Medium
Heavier
Weightings
This document constitutes part of a prospectus covering securities that have been registered under the Securities Act of 1933.
Flyer 19 of 38
Avg. Weighted Maturity Short Intermediate Long
Cred
it Qu
ality
Treasury & Agency
Investment- Grade
Below Investment- Grade
% Total Return as of 6/30/18 3 Mos YTD 1 Yr 3 Yr 5 Yr 10 Yr Since Inception of Fund
High Yield & Emerging Markets Bond Fund -3.35 -2.95 0.61 3.93 2.60 5.30 5.99Benchmark: Custom High Yield & Emerging Markets Index(5)(6)(7)(8) -3.26 -3.14 -0.02 3.60 2.52 5.80 6.19
Inception Date:
7/1/04
(1) Asset-weighted average expense ratio for similar mutual funds as reported by Morningstar Inc.(2) Turnover Ratio, for similar mutual funds as reported by Morningstar Inc., is an indication of the fund’s activity and refers to the percent of a fund’s
assets that are replaced during a fiscal year.(3) Overall Risk Level based on fund’s 5 year standard deviation.(4) The data presented represents past performance, which cannot be used to predict future returns that may be achieved. The investment return and
principal value of an investment will fluctuate so that an investor’s units, when redeemed, may be worth more or less than their original cost.(5) The Custom High Yield & Emerging Markets Index is a customized benchmark of 50% U.S. high yield, 25% emerging market bonds issued in local
currencies, and 25% emerging market bonds issued in U.S. dollars.(6) Returns prior to December 1, 2016 are for the Custom High Yield & Emerging Markets Index, a customized benchmark of 40% U.S. high yield, 40%
emerging market bonds issued in local currencies, and 20% emerging market bonds issued in U.S. dollars. Returns prior to March 1, 2012 are for the Bloomberg Barclays U.S. High Yield & Emerging Markets Index.
(7) The Bloomberg Barclays U.S. High Yield & Emerging Markets Index is an unmanaged index that consists of more than 1,500 US corporate high yield and US dollar-denominated emerging market debt securities, with credit ratings primarily rated below-investment-grade.
(8) Benchmark returns do not include operating costs.
2008 2009 2010 2011 2012 2013 2014 2015 2016 2017 YTD
-15.50 34.65 14.83 3.86 13.52 -3.02 -0.38 -7.40 12.10 10.99 -2.95
-22.02 48.65 14.27 5.76 14.52 -2.30 0.53 -7.00 11.74 9.81 -3.14
Calendar Year Performance % Return
High Yield & Emerging Markets
Bond Fund
Custom High Yield & Emerging
Markets Index(5)(6)(7)(8)
$40,000
$30,000
$20,000
$10,000
0
Trailing Time Period Performance(4)
401(k) Plus PlanHigh Yield & Emerging Markets Bond Fund (as of 6/30/18)
Objective & Strategy Risk/Return Profile
Growth of $10,000: High Yield & Emerging Markets Bond Fund vs. Benchmark
$17,942
$17,467
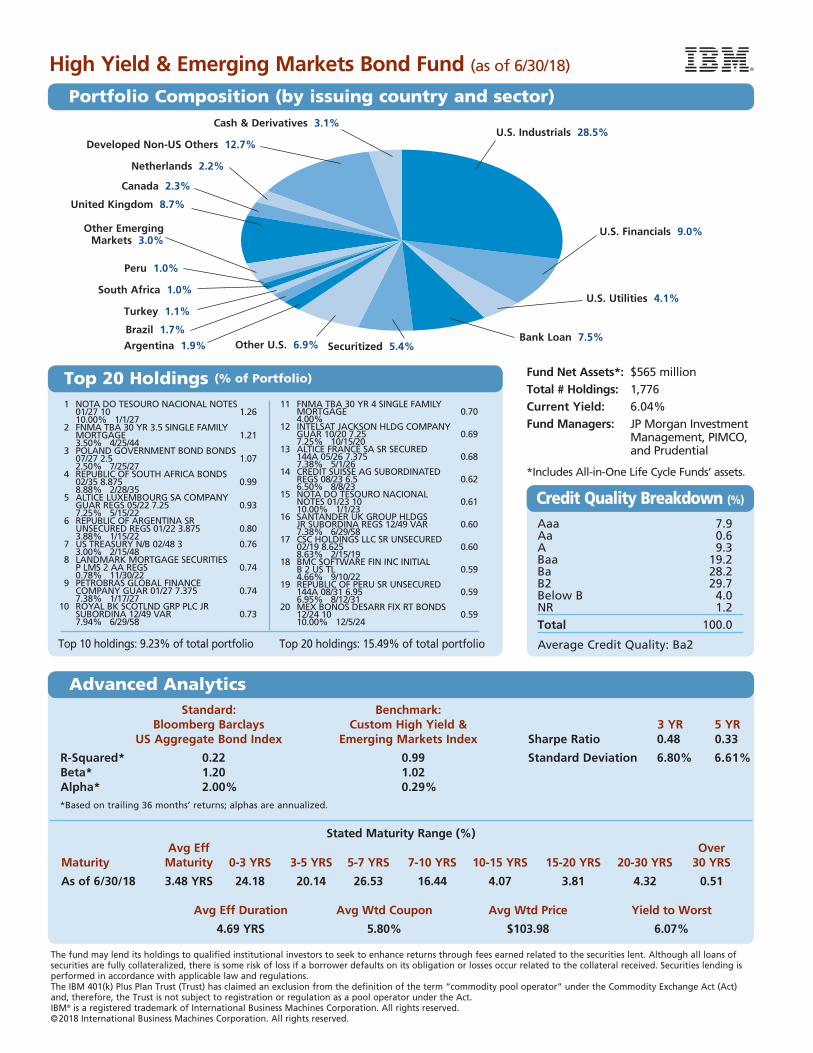
1 NOTA DO TESOURO NACIONAL NOTES 01/27 10 1.26 10.00% 1/1/27 2 FNMA TBA 30 YR 3.5 SINGLE FAMILY MORTGAGE 1.21 3.50% 4/25/44 3 POLAND GOVERNMENT BOND BONDS 07/27 2.5 1.07 2.50% 7/25/27 4 REPUBLIC OF SOUTH AFRICA BONDS 02/35 8.875 0.99 8.88% 2/28/35 5 ALTICE LUXEMBOURG SA COMPANY GUAR REGS 05/22 7.25 0.93 7.25% 5/15/22 6 REPUBLIC OF ARGENTINA SR UNSECURED REGS 01/22 3.875 0.80 3.88% 1/15/22 7 US TREASURY N/B 02/48 3 0.76 3.00% 2/15/48 8 LANDMARK MORTGAGE SECURITIES P LMS 2 AA REGS 0.74 0.78% 11/30/22 9 PETROBRAS GLOBAL FINANCE COMPANY GUAR 01/27 7.375 0.74 7.38% 1/17/27 10 ROYAL BK SCOTLND GRP PLC JR SUBORDINA 12/49 VAR 0.73 7.94% 6/29/58
Top 10 holdings: 9.23% of total portfolio
Standard: Benchmark: Bloomberg Barclays Custom High Yield & 3 YR 5 YR US Aggregate Bond Index Emerging Markets Index Sharpe Ratio 0.48 0.33
R-Squared* 0.22 0.99 Standard Deviation 6.80% 6.61% Beta* 1.20 1.02 Alpha* 2.00% 0.29%*Based on trailing 36 months’ returns; alphas are annualized.
Stated Maturity Range (%) Avg Eff Over Maturity Maturity 0-3 YRS 3-5 YRS 5-7 YRS 7-10 YRS 10-15 YRS 15-20 YRS 20-30 YRS 30 YRS
As of 6/30/18 3.48 YRS 24.18 20.14 26.53 16.44 4.07 3.81 4.32 0.51
Avg Eff Duration Avg Wtd Coupon Avg Wtd Price Yield to Worst
4.69 YRS 5.80% $103.98 6.07%
The fund may lend its holdings to qualified institutional investors to seek to enhance returns through fees earned related to the securities lent. Although all loans of securities are fully collateralized, there is some risk of loss if a borrower defaults on its obligation or losses occur related to the collateral received. Securities lending is performed in accordance with applicable law and regulations.The IBM 401(k) Plus Plan Trust (Trust) has claimed an exclusion from the definition of the term “commodity pool operator” under the Commodity Exchange Act (Act) and, therefore, the Trust is not subject to registration or regulation as a pool operator under the Act.IBM® is a registered trademark of International Business Machines Corporation. All rights reserved.©2018 International Business Machines Corporation. All rights reserved.
Aaa 7.9Aa 0.6A 9.3Baa 19.2Ba 28.2B2 29.7Below B 4.0NR 1.2
Total 100.0
Average Credit Quality: Ba2
Fund Net Assets*: $565 millionTotal # Holdings: 1,776Current Yield: 6.04%Fund Managers: JP Morgan Investment
Management, PIMCO, and Prudential
*Includes All-in-One Life Cycle Funds’ assets.
11 FNMA TBA 30 YR 4 SINGLE FAMILY MORTGAGE 0.70 4.00% 12 INTELSAT JACKSON HLDG COMPANY GUAR 10/20 7.25 0.69 7.25% 10/15/20 13 ALTICE FRANCE SA SR SECURED 144A 05/26 7.375 0.68 7.38% 5/1/26 14 CREDIT SUISSE AG SUBORDINATED REGS 08/23 6.5 0.62 6.50% 8/8/23 15 NOTA DO TESOURO NACIONAL NOTES 01/23 10 0.61 10.00% 1/1/23 16 SANTANDER UK GROUP HLDGS JR SUBORDINA REGS 12/49 VAR 0.60 7.38% 6/29/58 17 CSC HOLDINGS LLC SR UNSECURED 02/19 8.625 0.60 8.63% 2/15/19 18 BMC SOFTWARE FIN INC INITIAL B 2 US TL 0.59 4.66% 9/10/22 19 REPUBLIC OF PERU SR UNSECURED 144A 08/31 6.95 0.59 6.95% 8/12/31 20 MEX BONOS DESARR FIX RT BONDS 12/24 10 0.59 10.00% 12/5/24
Top 20 holdings: 15.49% of total portfolio
Credit Quality Breakdown (%)
Top 20 Holdings (% of Portfolio)
High Yield & Emerging Markets Bond Fund (as of 6/30/18)
Portfolio Composition (by issuing country and sector)
Advanced Analytics
Brazil 1.7%Bank Loan 7.5%
Securitized 5.4%
Turkey 1.1%
Argentina 1.9%
Developed Non-US Others 12.7%
Netherlands 2.2%
Peru 1.0%
South Africa 1.0%
United Kingdom 8.7%
Canada 2.3%
Other U.S. 6.9%
U.S. Financials 9.0%
U.S. Industrials 28.5%
U.S. Utilities 4.1%
Cash & Derivatives 3.1%
Other Emerging Markets 3.0%
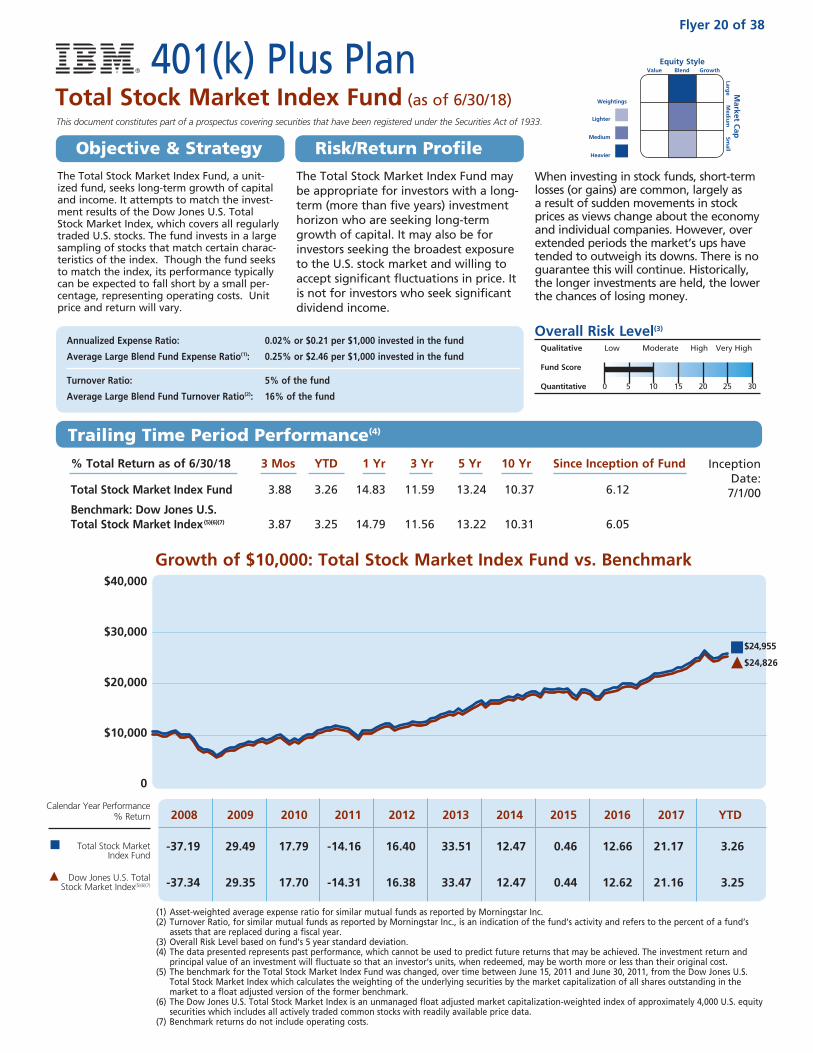
The Total Stock Market Index Fund may be appropriate for investors with a long-term (more than five years) investment horizon who are seeking long-term growth of capital. It may also be for investors seeking the broadest exposure to the U.S. stock market and willing to accept significant fluctuations in price. It is not for investors who seek significant dividend income.
When investing in stock funds, short-term losses (or gains) are common, largely as a result of sudden movements in stock prices as views change about the economy and individual companies. However, over extended periods the market’s ups have tended to outweigh its downs. There is no guarantee this will continue. Historically, the longer investments are held, the lower the chances of losing money.
Annualized Expense Ratio: 0.02% or $0.21 per $1,000 invested in the fund
Average Large Blend Fund Expense Ratio(1): 0.25% or $2.46 per $1,000 invested in the fund
Turnover Ratio: 5% of the fund
Average Large Blend Fund Turnover Ratio(2): 16% of the fund
Overall Risk Level(3)
Qualitative Low Moderate High Very High
Fund Score
Quantitative 0 5 10 15 20 25 30
The Total Stock Market Index Fund, a unit-ized fund, seeks long-term growth of capital and income. It attempts to match the invest-ment results of the Dow Jones U.S. Total Stock Market Index, which covers all regularly traded U.S. stocks. The fund invests in a large sampling of stocks that match certain charac-teristics of the index. Though the fund seeks to match the index, its performance typically can be expected to fall short by a small per-centage, representing operating costs. Unit price and return will vary.
Lighter
Medium
Heavier
Weightings
This document constitutes part of a prospectus covering securities that have been registered under the Securities Act of 1933.
Equity Style Value Blend Growth
Market C
ap
Large
Med
ium
Sm
all
% Total Return as of 6/30/18 3 Mos YTD 1 Yr 3 Yr 5 Yr 10 Yr Since Inception of Fund
Total Stock Market Index Fund 3.88 3.26 14.83 11.59 13.24 10.37 6.12
Benchmark: Dow Jones U.S. Total Stock Market Index(5)(6)(7) 3.87 3.25 14.79 11.56 13.22 10.31 6.05
Inception Date:
7/1/00
Growth of $10,000: Total Stock Market Index Fund vs. Benchmark
(1) Asset-weighted average expense ratio for similar mutual funds as reported by Morningstar Inc.(2) Turnover Ratio, for similar mutual funds as reported by Morningstar Inc., is an indication of the fund’s activity and refers to the percent of a fund’s
assets that are replaced during a fiscal year.(3) Overall Risk Level based on fund’s 5 year standard deviation.(4) The data presented represents past performance, which cannot be used to predict future returns that may be achieved. The investment return and
principal value of an investment will fluctuate so that an investor’s units, when redeemed, may be worth more or less than their original cost.(5) The benchmark for the Total Stock Market Index Fund was changed, over time between June 15, 2011 and June 30, 2011, from the Dow Jones U.S.
Total Stock Market Index which calculates the weighting of the underlying securities by the market capitalization of all shares outstanding in the market to a float adjusted version of the former benchmark.
(6) The Dow Jones U.S. Total Stock Market Index is an unmanaged float adjusted market capitalization-weighted index of approximately 4,000 U.S. equity securities which includes all actively traded common stocks with readily available price data.
(7) Benchmark returns do not include operating costs.
2008 2009 2010 2011 2012 2013 2014 2015 2016 2017 YTD
-37.19 29.49 17.79 -14.16 16.40 33.51 12.47 0.46 12.66 21.17 3.26
-37.34 29.35 17.70 -14.31 16.38 33.47 12.47 0.44 12.62 21.16 3.25
Calendar Year Performance % Return
Total Stock Market Index Fund
Dow Jones U.S. Total Stock Market Index(5)(6)(7)
$40,000
$30,000
$20,000
$10,000
0
Trailing Time Period Performance(4)
Flyer 20 of 38
Objective & Strategy Risk/Return Profile
401(k) Plus PlanTotal Stock Market Index Fund (as of 6/30/18)
$24,826
$24,955
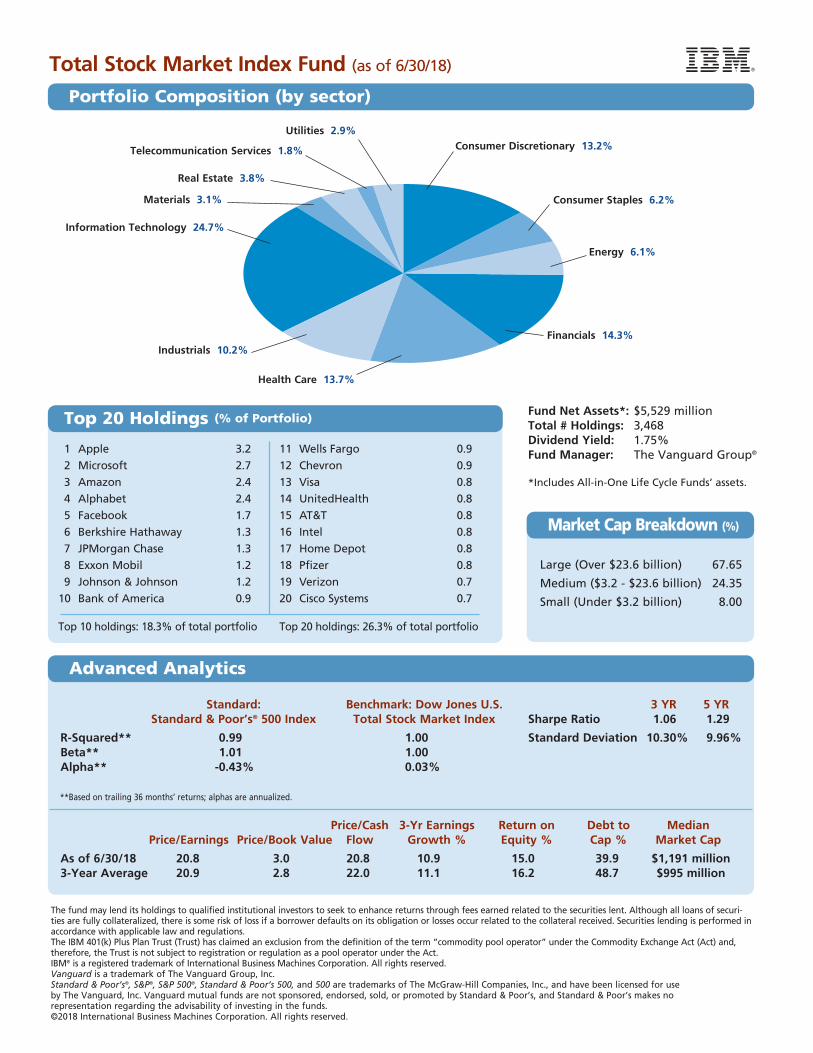
Financials 14.3%
Telecommunication Services 1.8%
Health Care 13.7%
Information Technology 24.7%
Consumer Discretionary 13.2%
Industrials 10.2%
Consumer Staples 6.2%
Real Estate 3.8%
Materials 3.1%
Energy 6.1%
Utilities 2.9%
Large (Over $23.6 billion) 67.65
Medium ($3.2 - $23.6 billion) 24.35
Small (Under $3.2 billion) 8.00
Standard: Benchmark: Dow Jones U.S. 3 YR 5 YR Standard & Poor’s® 500 Index Total Stock Market Index Sharpe Ratio 1.06 1.29
R-Squared** 0.99 1.00 Standard Deviation 10.30% 9.96% Beta** 1.01 1.00 Alpha** -0.43% 0.03%
**Based on trailing 36 months’ returns; alphas are annualized.
Price/Cash 3-Yr Earnings Return on Debt to Median Price/Earnings Price/Book Value Flow Growth % Equity % Cap % Market Cap
As of 6/30/18 20.8 3.0 20.8 10.9 15.0 39.9 $1,191 million 3-Year Average 20.9 2.8 22.0 11.1 16.2 48.7 $995 million
Fund Net Assets*: $5,529 millionTotal # Holdings: 3,468 Dividend Yield: 1.75%Fund Manager: The Vanguard Group®
*Includes All-in-One Life Cycle Funds’ assets.
The fund may lend its holdings to qualified institutional investors to seek to enhance returns through fees earned related to the securities lent. Although all loans of securi-ties are fully collateralized, there is some risk of loss if a borrower defaults on its obligation or losses occur related to the collateral received. Securities lending is performed in accordance with applicable law and regulations.The IBM 401(k) Plus Plan Trust (Trust) has claimed an exclusion from the definition of the term “commodity pool operator” under the Commodity Exchange Act (Act) and, therefore, the Trust is not subject to registration or regulation as a pool operator under the Act.IBM® is a registered trademark of International Business Machines Corporation. All rights reserved.Vanguard is a trademark of The Vanguard Group, Inc.Standard & Poor’s®, S&P®, S&P 500®, Standard & Poor’s 500, and 500 are trademarks of The McGraw-Hill Companies, Inc., and have been licensed for use by The Vanguard, Inc. Vanguard mutual funds are not sponsored, endorsed, sold, or promoted by Standard & Poor’s, and Standard & Poor’s makes no representation regarding the advisability of investing in the funds.©2018 International Business Machines Corporation. All rights reserved.
1 Apple 3.2
2 Microsoft 2.7
3 Amazon 2.4
4 Alphabet 2.4
5 Facebook 1.7
6 Berkshire Hathaway 1.3
7 JPMorgan Chase 1.3
8 Exxon Mobil 1.2
9 Johnson & Johnson 1.2
10 Bank of America 0.9
Top 10 holdings: 18.3% of total portfolio
11 Wells Fargo 0.9
12 Chevron 0.9
13 Visa 0.8
14 UnitedHealth 0.8
15 AT&T 0.8
16 Intel 0.8
17 Home Depot 0.8
18 Pfizer 0.8
19 Verizon 0.7
20 Cisco Systems 0.7
Top 20 holdings: 26.3% of total portfolio
Total Stock Market Index Fund (as of 6/30/18)
Portfolio Composition (by sector)
Advanced Analytics
Top 20 Holdings (% of Portfolio)
Market Cap Breakdown (%)
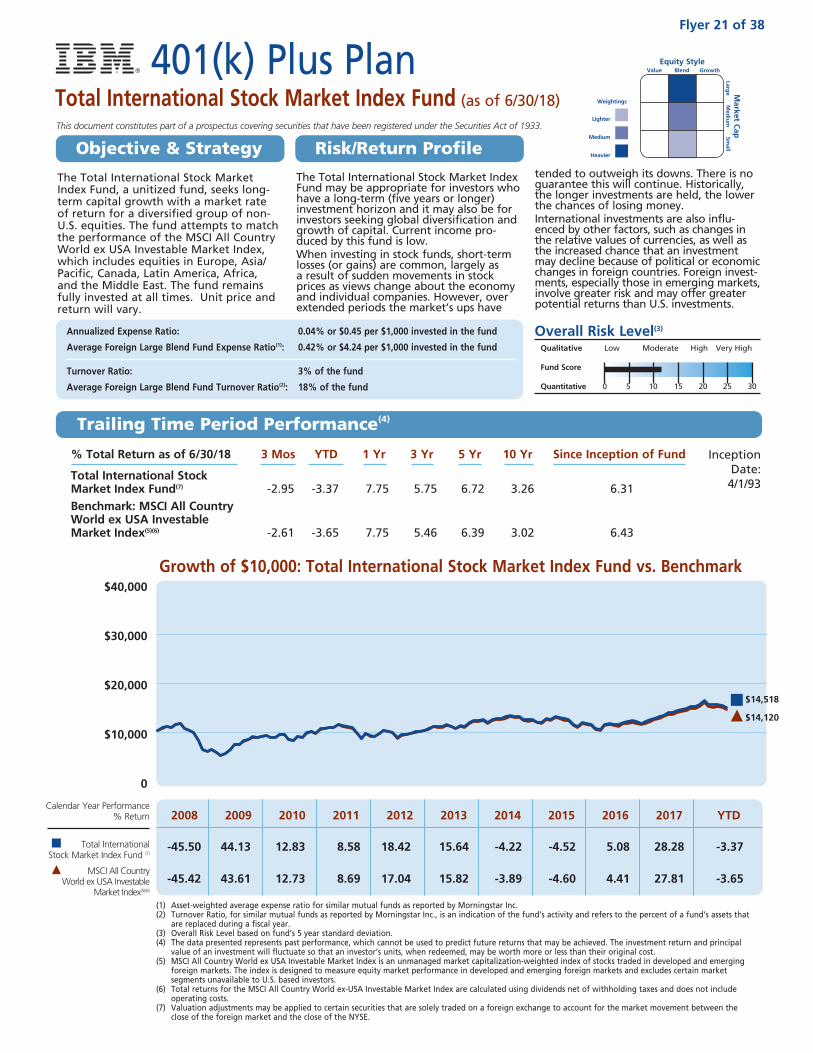
The Total International Stock Market Index Fund may be appropriate for investors who have a long-term (five years or longer) investment horizon and it may also be for investors seeking global diversification and growth of capital. Current income pro-duced by this fund is low.When investing in stock funds, short-term losses (or gains) are common, largely as a result of sudden movements in stock prices as views change about the economy and individual companies. However, over extended periods the market’s ups have
tended to outweigh its downs. There is no guarantee this will continue. Historically, the longer investments are held, the lower the chances of losing money.International investments are also influ-enced by other factors, such as changes in the relative values of currencies, as well as the increased chance that an investment may decline because of political or economic changes in foreign countries. Foreign invest-ments, especially those in emerging markets, involve greater risk and may offer greater potential returns than U.S. investments.
Annualized Expense Ratio: 0.04% or $0.45 per $1,000 invested in the fund
Average Foreign Large Blend Fund Expense Ratio(1): 0.42% or $4.24 per $1,000 invested in the fund
Turnover Ratio: 3% of the fund
Average Foreign Large Blend Fund Turnover Ratio(2): 18% of the fund
Overall Risk Level(3)
Qualitative Low Moderate High Very High
Fund Score
Quantitative 0 5 10 15 20 25 30
The Total International Stock Market Index Fund, a unitized fund, seeks long-term capital growth with a market rate of return for a diversified group of non-U.S. equities. The fund attempts to match the performance of the MSCI All Country World ex USA Investable Market Index, which includes equities in Europe, Asia/Pacific, Canada, Latin America, Africa, and the Middle East. The fund remains fully invested at all times. Unit price and return will vary.
Lighter
Medium
Heavier
Weightings
This document constitutes part of a prospectus covering securities that have been registered under the Securities Act of 1933.
Equity Style Value Blend Growth
Market C
ap
Large
Med
ium
Sm
all
Growth of $10,000: Total International Stock Market Index Fund vs. Benchmark$40,000
$30,000
$20,000
$10,000
0
Calendar Year Performance % Return
Total International Stock Market Index Fund (7)
MSCI All Country World ex USA Investable
Market Index(5)(6)
2008 2009 2010 2011 2012 2013 2014 2015 2016 2017 YTD
-45.50 44.13 12.83 8.58 18.42 15.64 -4.22 -4.52 5.08 28.28 -3.37
-45.42 43.61 12.73 8.69 17.04 15.82 -3.89 -4.60 4.41 27.81 -3.65
% Total Return as of 6/30/18 3 Mos YTD 1 Yr 3 Yr 5 Yr 10 Yr Since Inception of Fund
Total International Stock Market Index Fund(7) -2.95 -3.37 7.75 5.75 6.72 3.26 6.31Benchmark: MSCI All Country World ex USA Investable Market Index(5)(6) -2.61 -3.65 7.75 5.46 6.39 3.02 6.43
Inception Date:
4/1/93
(1) Asset-weighted average expense ratio for similar mutual funds as reported by Morningstar Inc. (2) Turnover Ratio, for similar mutual funds as reported by Morningstar Inc., is an indication of the fund’s activity and refers to the percent of a fund’s assets that
are replaced during a fiscal year. (3) Overall Risk Level based on fund’s 5 year standard deviation. (4) The data presented represents past performance, which cannot be used to predict future returns that may be achieved. The investment return and principal
value of an investment will fluctuate so that an investor’s units, when redeemed, may be worth more or less than their original cost. (5) MSCI All Country World ex USA Investable Market Index is an unmanaged market capitalization-weighted index of stocks traded in developed and emerging
foreign markets. The index is designed to measure equity market performance in developed and emerging foreign markets and excludes certain market segments unavailable to U.S. based investors.
(6) Total returns for the MSCI All Country World ex-USA Investable Market Index are calculated using dividends net of withholding taxes and does not include operating costs.
(7) Valuation adjustments may be applied to certain securities that are solely traded on a foreign exchange to account for the market movement between the close of the foreign market and the close of the NYSE.
Trailing Time Period Performance(4)
401(k) Plus PlanTotal International Stock Market Index Fund (as of 6/30/18)
Flyer 21 of 38
Objective & Strategy Risk/Return Profile
$14,518
$14,120

Australia 4.8%
Canada 6.8%
Consumer Discretionary 11.8%
Consumer Staples 9.2%
Energy 6.5%
Financials 20.2%Health Care 8.2%Industrials 12.8%
Information Technology
12.1%
Materials 8.5%
Real Estate 4.3%
Telecommunication Services 3.4%
Utilities 3.0%
France 6.9%
Finland 0.8%
Germany 6.2%
Japan 17.4%
Netherlands 2.4%
Italy 1.8%
Hong Kong 2.3%
Switzerland 5.1%
Spain 2.1%
Sweden 2.0%
United Kingdom 12.5%
Other-Developed 5.0%
Other-Emerging
Markets 23.9%
Large (Over $18.1 billion) 51.10
Medium ($2.4 - $18.1 billion) 36.20
Small (Under $2.4 billion) 12.70
The fund may lend its holdings to qualified institutional investors to seek to enhance returns through fees earned related to the securities lent. Although all loans of securi-ties are fully collateralized, there is some risk of loss if a borrower defaults on its obligation or losses occur related to the collateral received. Securities lending is performed in accordance with applicable law and regulations.The IBM 401(k) Plus Plan Trust (Trust) has claimed an exclusion from the definition of the term “commodity pool operator” under the Commodity Exchange Act (Act) and, therefore, the Trust is not subject to registration or regulation as a pool operator under the Act.IBM® is a registered trademark of International Business Machines Corporation. All rights reserved.MSCI and EAFE are registered trademarks of MSCI Inc.©2018 International Business Machines Corporation. All rights reserved.
1 Tencent Holdings 1.17
2 Nestle 0.99
3 Alibaba 0.88
4 Samsung 0.82
5 HSBC 0.77
6 Taiwan Semiconductor 0.72
7 Novartis 0.69
8 Royal Dutch Shell 0.64
9 Roche 0.64
10 BP 0.61
Top 10 holdings: 7.93% of total portfolio
11 Total 0.61
12 Toyota 0.60
13 Royal Dutch Shell 0.55
14 British American Tobacco 0.47
15 SAP 0.47
16 Naspers 0.45
17 Royal Bank of Canada 0.45
1 8 TD Bank 0.44
19 AIA Group 0.43
20 Siemens 0.42
Top 20 holdings: 12.82% of total portfolio
Standard: Benchmark: MSCI All Country World 3 YR 5 YR MSCI EAFE® Index ex USA Investable Market Index Sharpe Ratio 0.44 0.55
R-Squared** 0.92 0.98 Standard Deviation 11.61% 11.46% Beta** 0.92 0.95 Alpha** 1.20% 0.52%
**Based on trailing 36 months’ returns; alphas are annualized.
Price/ Price/Book Price/Cash 3-Yr Earnings Return on Debt to Median Earnings*** Value*** Flow*** Growth % Equity % Cap % Market Cap
As of 6/30/18 14.2 1.6 8.0 11.1 15.1 27.7 $3,423 million 3-Year Average 15.7 1.6 8.0 11.7 13.9 31.3 $3,615 million
***Uses MSCI calculations.
Fund Net Assets*: $4,599 millionTotal # Holdings: 3,749Dividend Yield: 2.90%Fund Manager: State Street Global Advisors
*Includes All-in-One Life Cycle Funds’ assets.
Market Cap Breakdown (%)
Top 20 Holdings (% of Portfolio)
Total International Stock Market Index Fund (as of 6/30/18)
Portfolio Composition (by country and sector)
Advanced Analytics
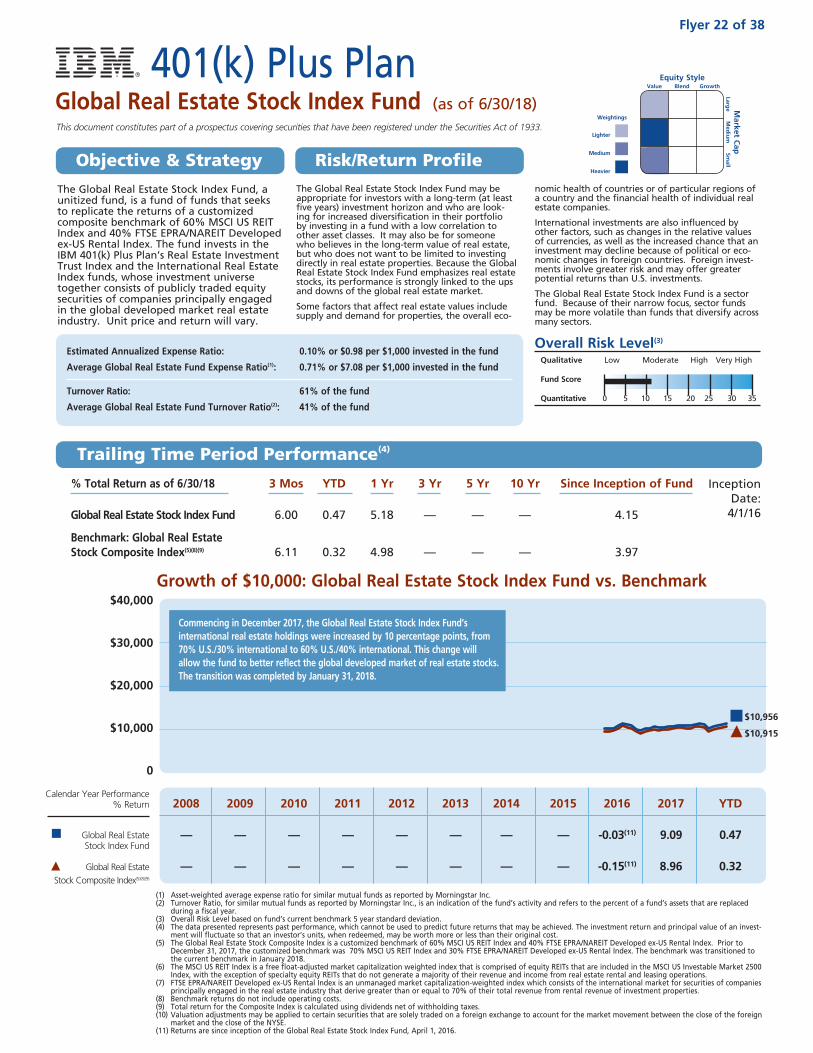
The Global Real Estate Stock Index Fund may be appropriate for investors with a long-term (at least five years) investment horizon and who are look-ing for increased diversification in their portfolio by investing in a fund with a low correlation to other asset classes. It may also be for someone who believes in the long-term value of real estate, but who does not want to be limited to investing directly in real estate properties. Because the Global Real Estate Stock Index Fund emphasizes real estate stocks, its performance is strongly linked to the ups and downs of the global real estate market.
Some factors that affect real estate values include supply and demand for properties, the overall eco-
nomic health of countries or of particular regions of a country and the financial health of individual real estate companies.
International investments are also influenced by other factors, such as changes in the relative values of currencies, as well as the increased chance that an investment may decline because of political or eco-nomic changes in foreign countries. Foreign invest-ments involve greater risk and may offer greater potential returns than U.S. investments.
The Global Real Estate Stock Index Fund is a sector fund. Because of their narrow focus, sector funds may be more volatile than funds that diversify across many sectors.
Estimated Annualized Expense Ratio: 0.10% or $0.98 per $1,000 invested in the fund
Average Global Real Estate Fund Expense Ratio(1): 0.71% or $7.08 per $1,000 invested in the fund
Turnover Ratio: 61% of the fund
Average Global Real Estate Fund Turnover Ratio(2): 41% of the fund
Overall Risk Level(3)
Qualitative Low Moderate High Very High
Fund Score
Quantitative 0 5 10 15 20 25 30 35
The Global Real Estate Stock Index Fund, a unitized fund, is a fund of funds that seeks to replicate the returns of a customized composite benchmark of 60% MSCI US REIT Index and 40% FTSE EPRA/NAREIT Developed ex-US Rental Index. The fund invests in the IBM 401(k) Plus Plan’s Real Estate Investment Trust Index and the International Real Estate Index funds, whose investment universe together consists of publicly traded equity securities of companies principally engaged in the global developed market real estate industry. Unit price and return will vary.
Lighter
Medium
Heavier
Weightings
This document constitutes part of a prospectus covering securities that have been registered under the Securities Act of 1933.
Equity Style Value Blend Growth
Market C
ap
Large
Med
ium
Sm
all
Growth of $10,000: Global Real Estate Stock Index Fund vs. Benchmark
% Total Return as of 6/30/18 3 Mos YTD 1 Yr 3 Yr 5 Yr 10 Yr Since Inception of Fund
Global Real Estate Stock Index Fund 6.00 0.47 5.18 — — — 4.15
Benchmark: Global Real Estate Stock Composite Index(5)(8)(9) 6.11 0.32 4.98 — — — 3.97
Inception Date:
4/1/16
401(k) Plus PlanGlobal Real Estate Stock Index Fund (as of 6/30/18)
Flyer 22 of 38
Objective & Strategy Risk/Return Profile
Trailing Time Period Performance(4)
$40,000
$30,000
$20,000
$10,000
0
Calendar Year Performance % Return
Global Real Estate Stock Index Fund
Global Real Estate
Stock Composite Index(5)(8)(9)
2008 2009 2010 2011 2012 2013 2014 2015 2016 2017 YTD
— — — — — — — — -0.03(11) 9.09 0.47
— — — — — — — — -0.15(11) 8.96 0.32
(1) Asset-weighted average expense ratio for similar mutual funds as reported by Morningstar Inc. (2) Turnover Ratio, for similar mutual funds as reported by Morningstar Inc., is an indication of the fund’s activity and refers to the percent of a fund’s assets that are replaced
during a fiscal year. (3) Overall Risk Level based on fund’s current benchmark 5 year standard deviation. (4) The data presented represents past performance, which cannot be used to predict future returns that may be achieved. The investment return and principal value of an invest-
ment will fluctuate so that an investor’s units, when redeemed, may be worth more or less than their original cost. (5) The Global Real Estate Stock Composite Index is a customized benchmark of 60% MSCI US REIT Index and 40% FTSE EPRA/NAREIT Developed ex-US Rental Index. Prior to
December 31, 2017, the customized benchmark was 70% MSCI US REIT Index and 30% FTSE EPRA/NAREIT Developed ex-US Rental Index. The benchmark was transitioned to the current benchmark in January 2018.
(6) The MSCI US REIT Index is a free float-adjusted market capitalization weighted index that is comprised of equity REITs that are included in the MSCI US Investable Market 2500 Index, with the exception of specialty equity REITs that do not generate a majority of their revenue and income from real estate rental and leasing operations.
(7) FTSE EPRA/NAREIT Developed ex-US Rental Index is an unmanaged market capitalization-weighted index which consists of the international market for securities of companies principally engaged in the real estate industry that derive greater than or equal to 70% of their total revenue from rental revenue of investment properties.
(8) Benchmark returns do not include operating costs. (9) Total return for the Composite Index is calculated using dividends net of withholding taxes. (10) Valuation adjustments may be applied to certain securities that are solely traded on a foreign exchange to account for the market movement between the close of the foreign
market and the close of the NYSE.(11) Returns are since inception of the Global Real Estate Stock Index Fund, April 1, 2016.
$10,956
$10,915
Commencing in December 2017, the Global Real Estate Stock Index Fund’s international real estate holdings were increased by 10 percentage points, from 70% U.S./30% international to 60% U.S./40% international. This change will allow the fund to better reflect the global developed market of real estate stocks. The transition was completed by January 31, 2018.

International Real Estate Index Fund 40%
Real Estate Investment Trust Index Fund 60%
Standard: Benchmark: Global Real Estate 3 YR 5 YR S&P 500® Index Stock Composite Index Sharpe Ratio — —
R-Squared** — — Standard Deviation — — Beta** — — Alpha** — —
**Based on trailing 36 months’ returns; alphas are annualized.
Fund Net Assets: $942 million
Total # Holdings: 2
Dividend Yield (Estimated): 4.00%
Fund Manager: BlackRock
The underlying funds may lend its holdings to qualified institutional investors to seek to enhance returns through fees earned related to the securities lent. Although all loans of securities are fully collateralized, there is some risk of loss if a borrower defaults on its obligation or losses occur related to the collateral received. Securities lending is per-formed in accordance with applicable law and regulations.The IBM 401(k) Plus Plan Trust (Trust) has claimed an exclusion from the definition of the term “commodity pool operator” under the Commodity Exchange Act (Act) and, therefore, the Trust is not subject to registration or regulation as a pool operator under the Act.IBM® is a registered trademark of International Business Machines Corporation. All rights reserved.Standard & Poor’s®, S&P®, S&P 500®, Standard & Poor’s 500, and 500 are trademarks of The McGraw-Hill Companies, Inc.©2018 International Business Machines Corporation. All rights reserved.
Global Real Estate Stock Index Fund (as of 6/30/18)
Target Allocation (by fund)
Advanced Analytics
The fund does not buy securities directly; instead, it invests in two 401(k) Plus Plan funds: the Real Estate Investment Trust Index Fund and the International Real Estate Index Fund. This gives the fund exposure to the global developed market for publicly traded equity securities of companies principally engaged in the real estate industry.
The fund’s target asset allocation between funds is 60% Real Estate Investment Trust Index Fund and 40% International Real Estate Index Fund. The allocations to each fund are maintained close to the target allocations.
For detailed information on the underlying funds that comprise the Global Real Estate Stock Index Fund, please read the corresponding fund flyers.
Holdings
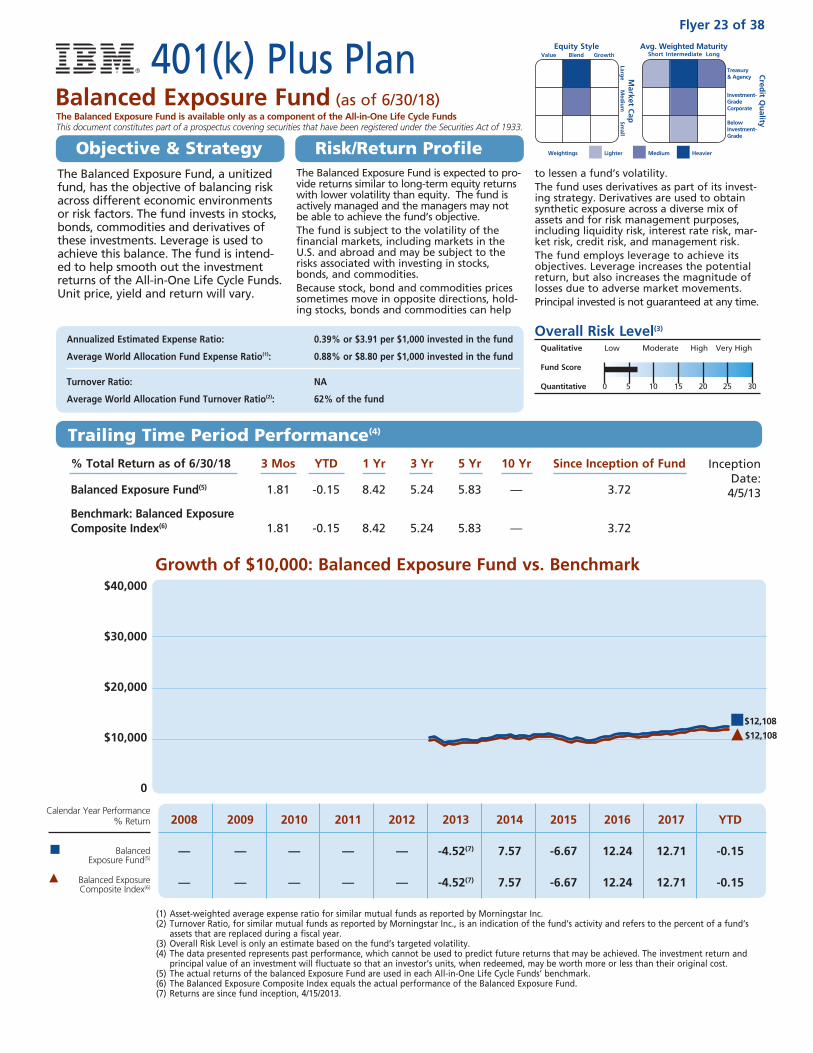
The Balanced Exposure Fund is expected to pro-vide returns similar to long-term equity returns with lower volatility than equity. The fund is actively managed and the managers may not be able to achieve the fund’s objective. The fund is subject to the volatility of the financial markets, including markets in the U.S. and abroad and may be subject to the risks associated with investing in stocks, bonds, and commodities.Because stock, bond and commodities prices sometimes move in opposite directions, hold-ing stocks, bonds and commodities can help
to lessen a fund’s volatility.The fund uses derivatives as part of its invest-ing strategy. Derivatives are used to obtain synthetic exposure across a diverse mix of assets and for risk management purposes, including liquidity risk, interest rate risk, mar-ket risk, credit risk, and management risk.The fund employs leverage to achieve its objectives. Leverage increases the potential return, but also increases the magnitude of losses due to adverse market movements.Principal invested is not guaranteed at any time.
Annualized Estimated Expense Ratio: 0.39% or $3.91 per $1,000 invested in the fund
Average World Allocation Fund Expense Ratio(1): 0.88% or $8.80 per $1,000 invested in the fund
Turnover Ratio: NA
Average World Allocation Fund Turnover Ratio(2): 62% of the fund
Overall Risk Level(3)
Qualitative Low Moderate High Very High
Fund Score
Quantitative 0 5 10 15 20 25 30
The Balanced Exposure Fund, a unitized fund, has the objective of balancing risk across different economic environments or risk factors. The fund invests in stocks, bonds, commodities and derivatives of these investments. Leverage is used to achieve this balance. The fund is intend-ed to help smooth out the investment returns of the All-in-One Life Cycle Funds. Unit price, yield and return will vary.
The Balanced Exposure Fund is available only as a component of the All-in-One Life Cycle FundsThis document constitutes part of a prospectus covering securities that have been registered under the Securities Act of 1933.
% Total Return as of 6/30/18 3 Mos YTD 1 Yr 3 Yr 5 Yr 10 Yr Since Inception of Fund
Balanced Exposure Fund(5) 1.81 -0.15 8.42 5.24 5.83 — 3.72
Benchmark: Balanced Exposure Composite Index(6) 1.81 -0.15 8.42 5.24 5.83 — 3.72
Inception Date:
4/5/13
Growth of $10,000: Balanced Exposure Fund vs. Benchmark
(1) Asset-weighted average expense ratio for similar mutual funds as reported by Morningstar Inc. (2) Turnover Ratio, for similar mutual funds as reported by Morningstar Inc., is an indication of the fund’s activity and refers to the percent of a fund’s
assets that are replaced during a fiscal year. (3) Overall Risk Level is only an estimate based on the fund’s targeted volatility.(4) The data presented represents past performance, which cannot be used to predict future returns that may be achieved. The investment return and
principal value of an investment will fluctuate so that an investor’s units, when redeemed, may be worth more or less than their original cost.(5) The actual returns of the balanced Exposure Fund are used in each All-in-One Life Cycle Funds’ benchmark.(6) The Balanced Exposure Composite Index equals the actual performance of the Balanced Exposure Fund. (7) Returns are since fund inception, 4/15/2013.
2008 2009 2010 2011 2012 2013 2014 2015 2016 2017 YTD
— — — — — -4.52(7) 7.57 -6.67 12.24 12.71 -0.15
— — — — — -4.52(7) 7.57 -6.67 12.24 12.71 -0.15
$40,000
$30,000
$20,000
$10,000
0
Trailing Time Period Performance(4)
Flyer 23 of 38
Objective & Strategy Risk/Return Profile
401(k) Plus PlanBalanced Exposure Fund (as of 6/30/18)
$12,108
Avg. Weighted Maturity Short Intermediate Long
Equity Style Value Blend Growth
Market C
ap
Large
Med
ium
Sm
all
Cred
it Qu
ality
Treasury & Agency
Investment- Grade Corporate
Below Investment- Grade
LighterWeightings Medium Heavier
Calendar Year Performance % Return
Balanced Exposure Fund(5)
Balanced Exposure Composite Index(6)
$12,108
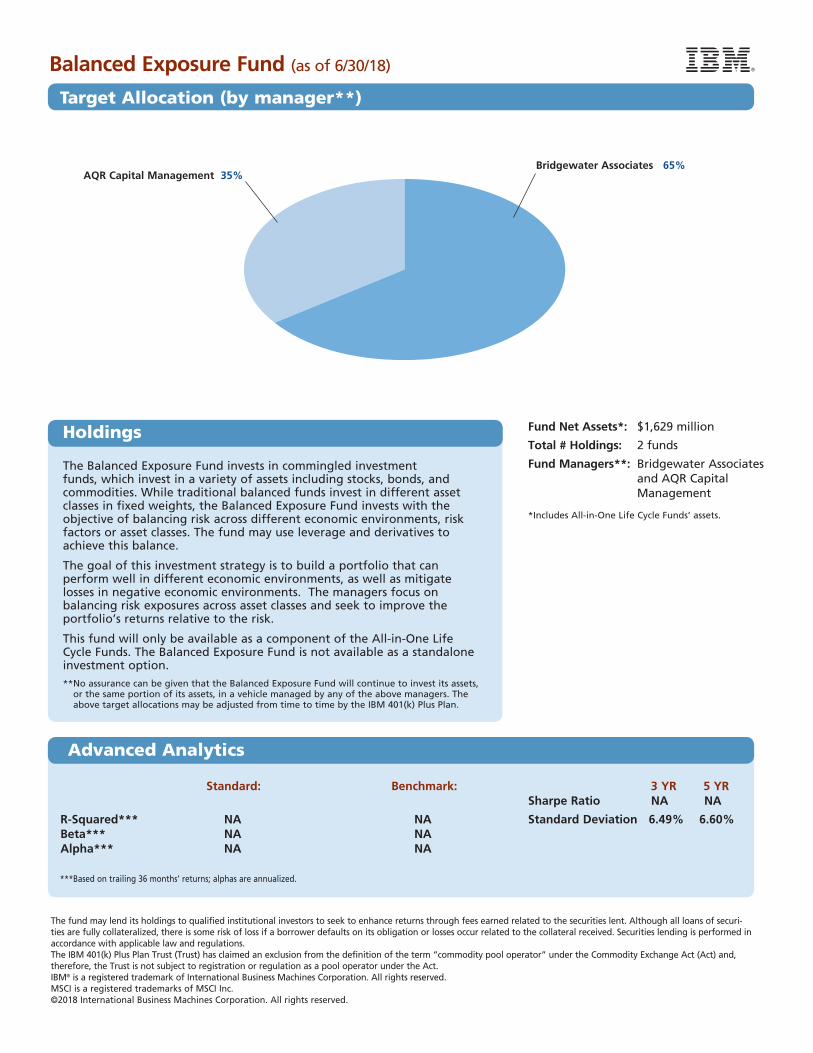
Standard: Benchmark: 3 YR 5 YR Sharpe Ratio NA NA
R-Squared*** NA NA Standard Deviation 6.49% 6.60% Beta*** NA NA Alpha*** NA NA
***Based on trailing 36 months’ returns; alphas are annualized.
Fund Net Assets*: $1,629 million
Total # Holdings: 2 funds
Fund Managers**: Bridgewater Associates and AQR Capital Management
*Includes All-in-One Life Cycle Funds’ assets.
The fund may lend its holdings to qualified institutional investors to seek to enhance returns through fees earned related to the securities lent. Although all loans of securi-ties are fully collateralized, there is some risk of loss if a borrower defaults on its obligation or losses occur related to the collateral received. Securities lending is performed in accordance with applicable law and regulations.The IBM 401(k) Plus Plan Trust (Trust) has claimed an exclusion from the definition of the term “commodity pool operator” under the Commodity Exchange Act (Act) and, therefore, the Trust is not subject to registration or regulation as a pool operator under the Act. IBM® is a registered trademark of International Business Machines Corporation. All rights reserved.MSCI is a registered trademarks of MSCI Inc.©2018 International Business Machines Corporation. All rights reserved.
Balanced Exposure Fund (as of 6/30/18)
Advanced Analytics
The Balanced Exposure Fund invests in commingled investment funds, which invest in a variety of assets including stocks, bonds, and commodities. While traditional balanced funds invest in different asset classes in fixed weights, the Balanced Exposure Fund invests with the objective of balancing risk across different economic environments, risk factors or asset classes. The fund may use leverage and derivatives to achieve this balance.
The goal of this investment strategy is to build a portfolio that can perform well in different economic environments, as well as mitigate losses in negative economic environments. The managers focus on balancing risk exposures across asset classes and seek to improve the portfolio’s returns relative to the risk.
This fund will only be available as a component of the All-in-One Life Cycle Funds. The Balanced Exposure Fund is not available as a standalone investment option.** No assurance can be given that the Balanced Exposure Fund will continue to invest its assets,
or the same portion of its assets, in a vehicle managed by any of the above managers. The above target allocations may be adjusted from time to time by the IBM 401(k) Plus Plan.
Holdings
Target Allocation (by manager**)
Bridgewater Associates 65%AQR Capital Management 35%
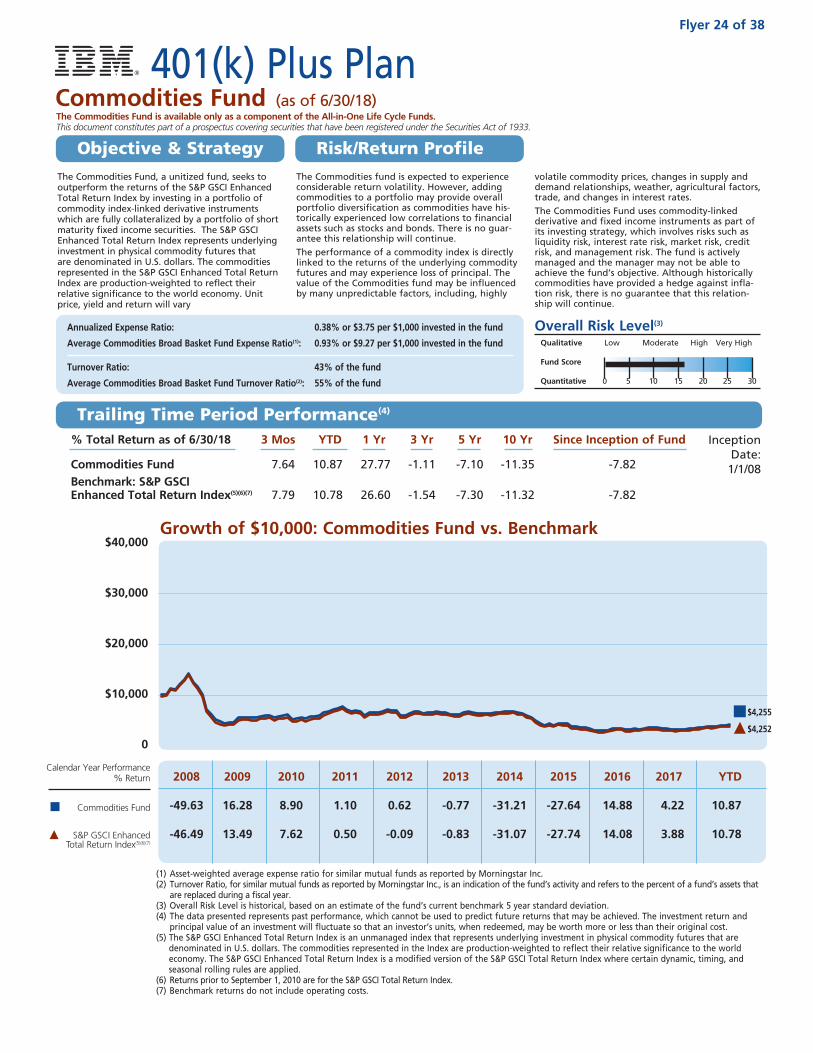
Growth of $10,000: Commodities Fund vs. Benchmark$40,000
$30,000
$20,000
$10,000
0
% Total Return as of 6/30/18 3 Mos YTD 1 Yr 3 Yr 5 Yr 10 Yr Since Inception of Fund
Commodities Fund 7.64 10.87 27.77 -1.11 -7.10 -11.35 -7.82Benchmark: S&P GSCI Enhanced Total Return Index(5)(6)(7) 7.79 10.78 26.60 -1.54 -7.30 -11.32 -7.82
The Commodities fund is expected to experience considerable return volatility. However, adding commodities to a portfolio may provide overall portfolio diversification as commodities have his-torically experienced low correlations to financial assets such as stocks and bonds. There is no guar-antee this relationship will continue.
The performance of a commodity index is directly linked to the returns of the underlying commodity futures and may experience loss of principal. The value of the Commodities fund may be influenced by many unpredictable factors, including, highly
volatile commodity prices, changes in supply and demand relationships, weather, agricultural factors, trade, and changes in interest rates.
The Commodities Fund uses commodity-linked derivative and fixed income instruments as part of its investing strategy, which involves risks such as liquidity risk, interest rate risk, market risk, credit risk, and management risk. The fund is actively managed and the manager may not be able to achieve the fund’s objective. Although historically commodities have provided a hedge against infla-tion risk, there is no guarantee that this relation-ship will continue.
Annualized Expense Ratio: 0.38% or $3.75 per $1,000 invested in the fund
Average Commodities Broad Basket Fund Expense Ratio(1): 0.93% or $9.27 per $1,000 invested in the fund
Turnover Ratio: 43% of the fund
Average Commodities Broad Basket Fund Turnover Ratio(2): 55% of the fund
Inception Date:
1/1/08
Overall Risk Level(3)
Qualitative Low Moderate High Very High
Fund Score
Quantitative 0 5 10 15 20 25 30
The Commodities Fund, a unitized fund, seeks to outperform the returns of the S&P GSCI Enhanced Total Return Index by investing in a portfolio of commodity index-linked derivative instruments which are fully collateralized by a portfolio of short maturity fixed income securities. The S&P GSCI Enhanced Total Return Index represents underlying investment in physical commodity futures that are denominated in U.S. dollars. The commodities represented in the S&P GSCI Enhanced Total Return Index are production-weighted to reflect their relative significance to the world economy. Unit price, yield and return will vary
401(k) Plus PlanCommodities Fund (as of 6/30/18)
Flyer 24 of 38
Objective & Strategy Risk/Return Profile
Trailing Time Period Performance(4)
(1) Asset-weighted average expense ratio for similar mutual funds as reported by Morningstar Inc.(2) Turnover Ratio, for similar mutual funds as reported by Morningstar Inc., is an indication of the fund’s activity and refers to the percent of a fund’s assets that
are replaced during a fiscal year.(3) Overall Risk Level is historical, based on an estimate of the fund’s current benchmark 5 year standard deviation.(4) The data presented represents past performance, which cannot be used to predict future returns that may be achieved. The investment return and
principal value of an investment will fluctuate so that an investor’s units, when redeemed, may be worth more or less than their original cost.(5) The S&P GSCI Enhanced Total Return Index is an unmanaged index that represents underlying investment in physical commodity futures that are
denominated in U.S. dollars. The commodities represented in the Index are production-weighted to reflect their relative significance to the world economy. The S&P GSCI Enhanced Total Return Index is a modified version of the S&P GSCI Total Return Index where certain dynamic, timing, and seasonal rolling rules are applied.
(6) Returns prior to September 1, 2010 are for the S&P GSCI Total Return Index.(7) Benchmark returns do not include operating costs.
2008 2009 2010 2011 2012 2013 2014 2015 2016 2017 YTD
-49.63 16.28 8.90 1.10 0.62 -0.77 -31.21 -27.64 14.88 4.22 10.87
-46.49 13.49 7.62 0.50 -0.09 -0.83 -31.07 -27.74 14.08 3.88 10.78
Calendar Year Performance % Return
Commodities Fund
S&P GSCI Enhanced Total Return Index(5)(6)(7)
The Commodities Fund is available only as a component of the All-in-One Life Cycle Funds.This document constitutes part of a prospectus covering securities that have been registered under the Securities Act of 1933.
$4,255
$4,252
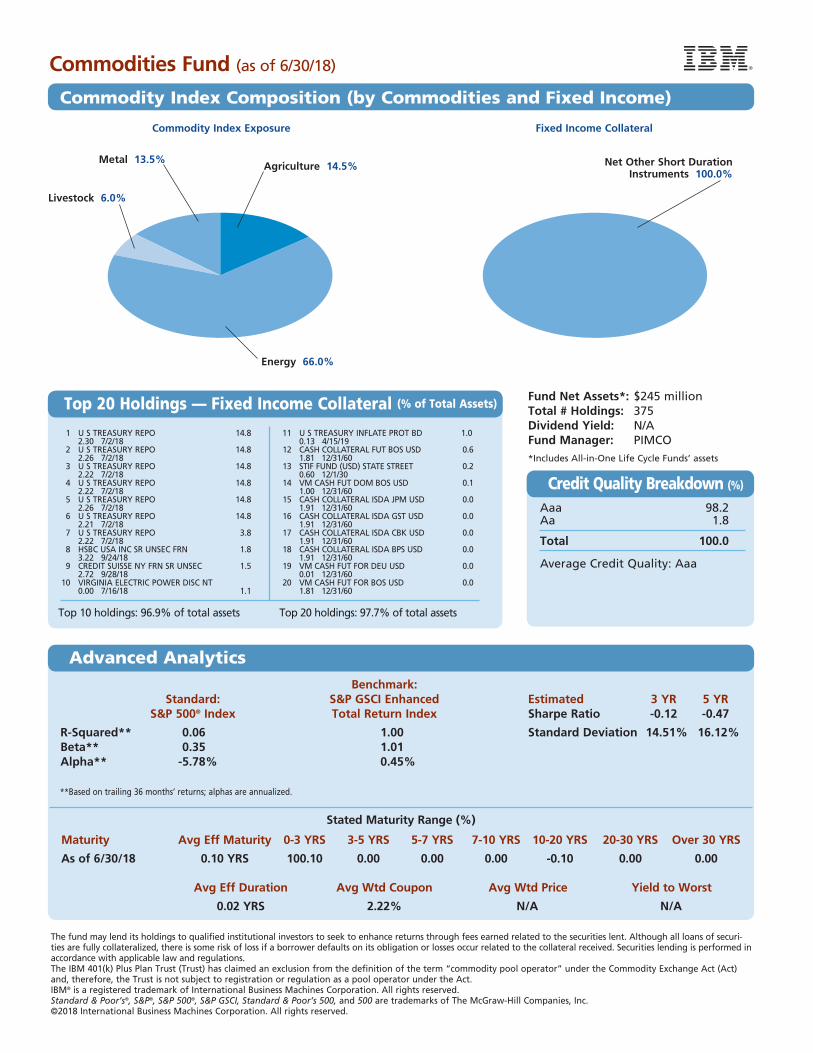
Commodities Fund (as of 6/30/18)
Commodity Index Composition (by Commodities and Fixed Income)
Benchmark: Standard: S&P GSCI Enhanced Estimated 3 YR 5 YR S&P 500® Index Total Return Index Sharpe Ratio -0.12 -0.47
R-Squared** 0.06 1.00 Standard Deviation 14.51% 16.12% Beta** 0.35 1.01 Alpha** -5.78% 0.45%
**Based on trailing 36 months’ returns; alphas are annualized.
Stated Maturity Range (%)
Maturity Avg Eff Maturity 0-3 YRS 3-5 YRS 5-7 YRS 7-10 YRS 10-20 YRS 20-30 YRS Over 30 YRS
As of 6/30/18 0.10 YRS 100.10 0.00 0.00 0.00 -0.10 0.00 0.00
Avg Eff Duration Avg Wtd Coupon Avg Wtd Price Yield to Worst
0.02 YRS 2.22% N/A N/A
Fund Net Assets*: $245 millionTotal # Holdings: 375 Dividend Yield: N/A Fund Manager: PIMCO*Includes All-in-One Life Cycle Funds’ assets
The fund may lend its holdings to qualified institutional investors to seek to enhance returns through fees earned related to the securities lent. Although all loans of securi-ties are fully collateralized, there is some risk of loss if a borrower defaults on its obligation or losses occur related to the collateral received. Securities lending is performed in accordance with applicable law and regulations.The IBM 401(k) Plus Plan Trust (Trust) has claimed an exclusion from the definition of the term “commodity pool operator” under the Commodity Exchange Act (Act) and, therefore, the Trust is not subject to registration or regulation as a pool operator under the Act.IBM® is a registered trademark of International Business Machines Corporation. All rights reserved.Standard & Poor’s®, S&P®, S&P 500®, S&P GSCI, Standard & Poor’s 500, and 500 are trademarks of The McGraw-Hill Companies, Inc.©2018 International Business Machines Corporation. All rights reserved.
1 U S TREASURY REPO 14.8 2.30 7/2/18 2 U S TREASURY REPO 14.8 2.26 7/2/18 3 U S TREASURY REPO 14.8 2.22 7/2/18 4 U S TREASURY REPO 14.8 2.22 7/2/18 5 U S TREASURY REPO 14.8 2.26 7/2/18 6 U S TREASURY REPO 14.8 2.21 7/2/18 7 U S TREASURY REPO 3.8 2.22 7/2/18 8 HSBC USA INC SR UNSEC FRN 1.8 3.22 9/24/18 9 CREDIT SUISSE NY FRN SR UNSEC 1.5 2.72 9/28/18 10 VIRGINIA ELECTRIC POWER DISC NT 0.00 7/16/18 1.1
Top 10 holdings: 96.9% of total assets
Advanced Analytics
Top 20 Holdings — Fixed Income Collateral (% of Total Assets)
Aaa 98.2Aa 1.8
Total 100.0
Average Credit Quality: Aaa
Credit Quality Breakdown (%)
Agriculture 14.5%
Livestock 6.0%
Energy 66.0%
Metal 13.5% Net Other Short Duration Instruments 100.0%
Fixed Income CollateralCommodity Index Exposure
11 U S TREASURY INFLATE PROT BD 1.0 0.13 4/15/19 12 CASH COLLATERAL FUT BOS USD 0.6 1.81 12/31/60 13 STIF FUND (USD) STATE STREET 0.2 0.60 12/1/30 14 VM CASH FUT DOM BOS USD 0.1 1.00 12/31/60 15 CASH COLLATERAL ISDA JPM USD 0.0 1.91 12/31/60 16 CASH COLLATERAL ISDA GST USD 0.0 1.91 12/31/60 17 CASH COLLATERAL ISDA CBK USD 0.0 1.91 12/31/60 18 CASH COLLATERAL ISDA BPS USD 0.0 1.91 12/31/60 19 VM CASH FUT FOR DEU USD 0.0 0.01 12/31/60 20 VM CASH FUT FOR BOS USD 0.0 1.81 12/31/60
Top 20 holdings: 97.7% of total assets
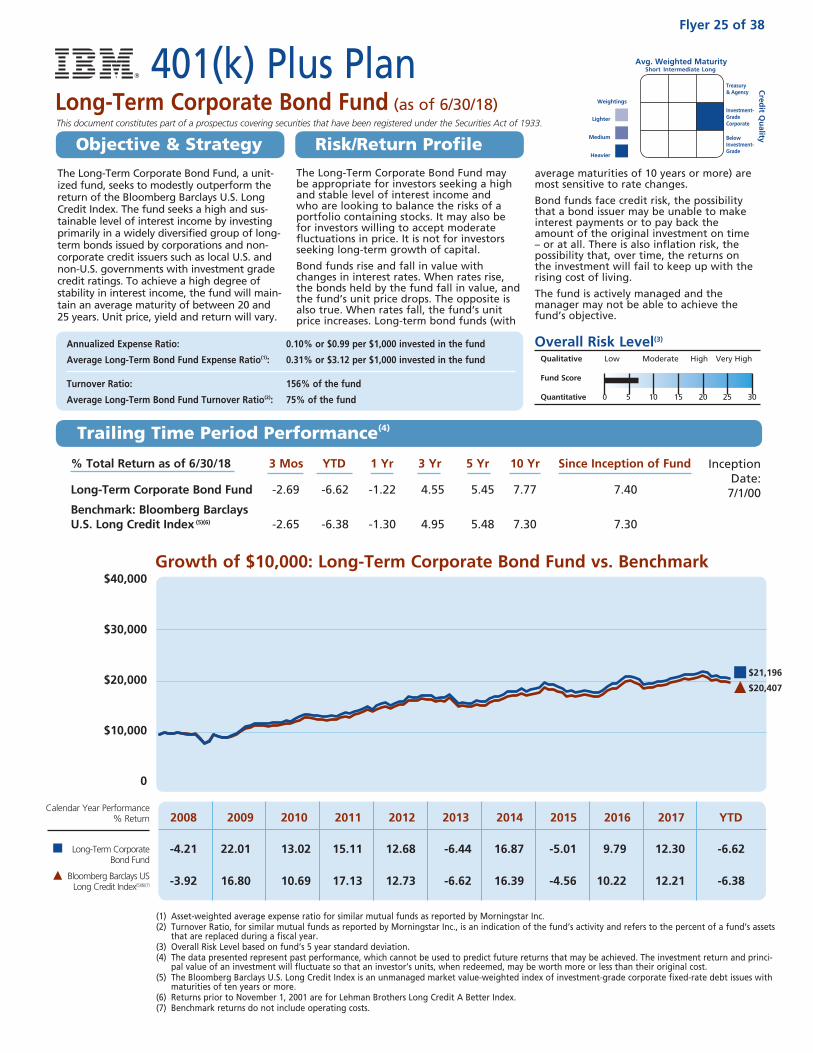
The Long-Term Corporate Bond Fund may be appropriate for investors seeking a high and stable level of interest income and who are looking to balance the risks of a portfolio containing stocks. It may also be for investors willing to accept moderate fluctuations in price. It is not for investors seeking long-term growth of capital.
Bond funds rise and fall in value with changes in interest rates. When rates rise, the bonds held by the fund fall in value, and the fund’s unit price drops. The opposite is also true. When rates fall, the fund’s unit price increases. Long-term bond funds (with
average maturities of 10 years or more) are most sensitive to rate changes.
Bond funds face credit risk, the possibility that a bond issuer may be unable to make interest payments or to pay back the amount of the original investment on time – or at all. There is also inflation risk, the possibility that, over time, the returns on the investment will fail to keep up with the rising cost of living.
The fund is actively managed and the manager may not be able to achieve the fund’s objective.
Annualized Expense Ratio: 0.10% or $0.99 per $1,000 invested in the fund
Average Long-Term Bond Fund Expense Ratio(1): 0.31% or $3.12 per $1,000 invested in the fund
Turnover Ratio: 156% of the fund
Average Long-Term Bond Fund Turnover Ratio(2): 75% of the fund
Overall Risk Level(3)
Qualitative Low Moderate High Very High
Fund Score
Quantitative 0 5 10 15 20 25 30
The Long-Term Corporate Bond Fund, a unit-ized fund, seeks to modestly outperform the return of the Bloomberg Barclays U.S. Long Credit Index. The fund seeks a high and sus-tainable level of interest income by investing primarily in a widely diversified group of long-term bonds issued by corporations and non-corporate credit issuers such as local U.S. and non-U.S. governments with investment grade credit ratings. To achieve a high degree of stability in interest income, the fund will main-tain an average maturity of between 20 and 25 years. Unit price, yield and return will vary.
Lighter
Medium
Heavier
Weightings
This document constitutes part of a prospectus covering securities that have been registered under the Securities Act of 1933.
Avg. Weighted Maturity Short Intermediate Long
Cred
it Qu
ality
Treasury & Agency
Investment- Grade Corporate
Below Investment- Grade
% Total Return as of 6/30/18 3 Mos YTD 1 Yr 3 Yr 5 Yr 10 Yr Since Inception of Fund
Long-Term Corporate Bond Fund -2.69 -6.62 -1.22 4.55 5.45 7.77 7.40
Benchmark: Bloomberg Barclays U.S. Long Credit Index (5)(6) -2.65 -6.38 -1.30 4.95 5.48 7.30 7.30
Inception Date:
7/1/00
(1) Asset-weighted average expense ratio for similar mutual funds as reported by Morningstar Inc.(2) Turnover Ratio, for similar mutual funds as reported by Morningstar Inc., is an indication of the fund’s activity and refers to the percent of a fund’s assets
that are replaced during a fiscal year.(3) Overall Risk Level based on fund’s 5 year standard deviation.(4) The data presented represent past performance, which cannot be used to predict future returns that may be achieved. The investment return and princi-
pal value of an investment will fluctuate so that an investor’s units, when redeemed, may be worth more or less than their original cost.(5) The Bloomberg Barclays U.S. Long Credit Index is an unmanaged market value-weighted index of investment-grade corporate fixed-rate debt issues with
maturities of ten years or more.(6) Returns prior to November 1, 2001 are for Lehman Brothers Long Credit A Better Index.(7) Benchmark returns do not include operating costs.
Growth of $10,000: Long-Term Corporate Bond Fund vs. Benchmark$40,000
$30,000
$20,000
$10,000
0
Calendar Year Performance % Return
Long-Term Corporate Bond Fund
Bloomberg Barclays US Long Credit Index(5)(6)(7)
2008 2009 2010 2011 2012 2013 2014 2015 2016 2017 YTD
-4.21 22.01 13.02 15.11 12.68 -6.44 16.87 -5.01 9.79 12.30 -6.62
-3.92 16.80 10.69 17.13 12.73 -6.62 16.39 -4.56 10.22 12.21 -6.38
401(k) Plus PlanLong-Term Corporate Bond Fund (as of 6/30/18)
Flyer 25 of 38
Objective & Strategy Risk/Return Profile
Trailing Time Period Performance(4)
$20,407
$21,196
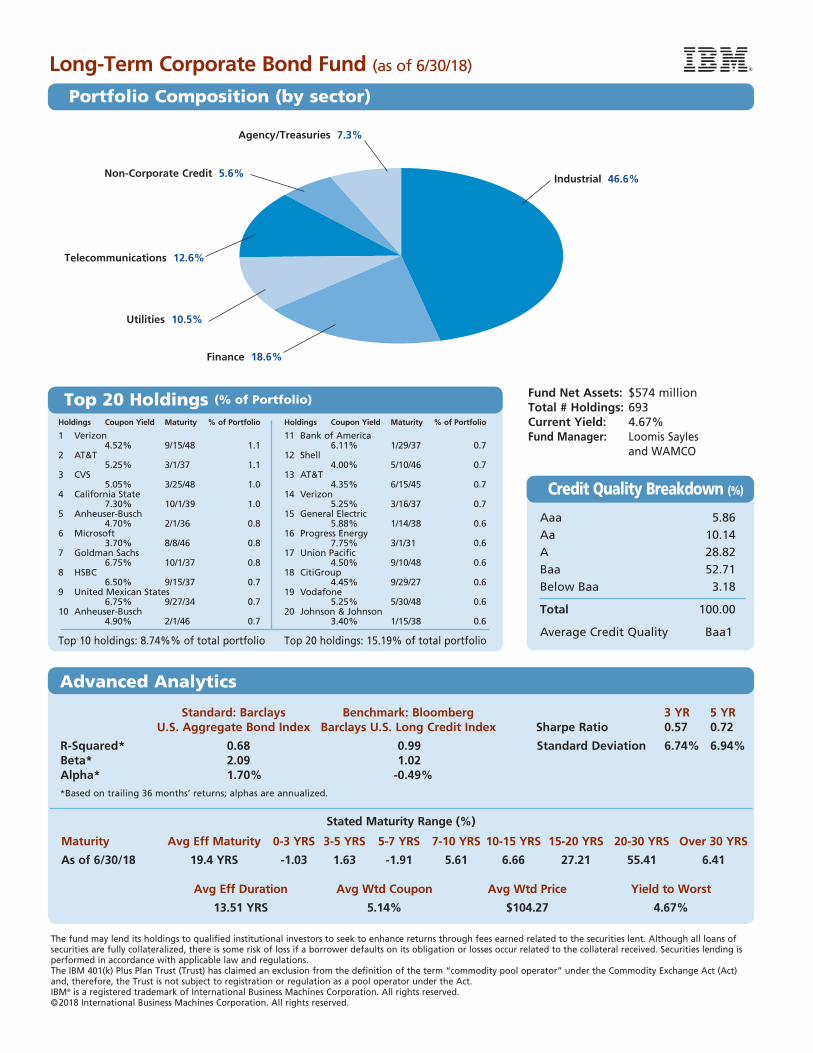
Agency/Treasuries 7.3%
Telecommunications 12.6%
Industrial 46.6%
Finance 18.6%
Utilities 10.5%
Non-Corporate Credit 5.6%
2
Holdings Coupon Yield Maturity % of Portfolio
11 Bank of America 6.11% 1/29/37 0.712 Shell 4.00% 5/10/46 0.713 AT&T 4.35% 6/15/45 0.714 Verizon 5.25% 3/16/37 0.715 General Electric 5.88% 1/14/38 0.616 Progress Energy 7.75% 3/1/31 0.617 Union Pacific 4.50% 9/10/48 0.618 CitiGroup 4.45% 9/29/27 0.619 Vodafone 5.25% 5/30/48 0.620 Johnson & Johnson 3.40% 1/15/38 0.6
Top 20 holdings: 15.19% of total portfolio
Fund Net Assets: $574 millionTotal # Holdings: 693Current Yield: 4.67%Fund Manager: Loomis Sayles
and WAMCO
The fund may lend its holdings to qualified institutional investors to seek to enhance returns through fees earned related to the securities lent. Although all loans of securities are fully collateralized, there is some risk of loss if a borrower defaults on its obligation or losses occur related to the collateral received. Securities lending is performed in accordance with applicable law and regulations.The IBM 401(k) Plus Plan Trust (Trust) has claimed an exclusion from the definition of the term “commodity pool operator” under the Commodity Exchange Act (Act) and, therefore, the Trust is not subject to registration or regulation as a pool operator under the Act.IBM® is a registered trademark of International Business Machines Corporation. All rights reserved.©2018 International Business Machines Corporation. All rights reserved.
Long-Term Corporate Bond Fund (as of 6/30/18)
Portfolio Composition (by sector)
Top 20 Holdings (% of Portfolio)
Advanced Analytics
Aaa 5.86Aa 10.14A 28.82Baa 52.71Below Baa 3.18
Total 100.00
Average Credit Quality Baa1
Credit Quality Breakdown (%)
Standard: Barclays Benchmark: Bloomberg 3 YR 5 YR U.S. Aggregate Bond Index Barclays U.S. Long Credit Index Sharpe Ratio 0.57 0.72
R-Squared* 0.68 0.99 Standard Deviation 6.74% 6.94% Beta* 2.09 1.02 Alpha* 1.70% -0.49% *Based on trailing 36 months’ returns; alphas are annualized.
Stated Maturity Range (%)
Maturity Avg Eff Maturity 0-3 YRS 3-5 YRS 5-7 YRS 7-10 YRS 10-15 YRS 15-20 YRS 20-30 YRS Over 30 YRS
As of 6/30/18 19.4 YRS -1.03 1.63 -1.91 5.61 6.66 27.21 55.41 6.41
Avg Eff Duration Avg Wtd Coupon Avg Wtd Price Yield to Worst
13.51 YRS 5.14% $104.27 4.67%
Holdings Coupon Yield Maturity % of Portfolio
1 Verizon 4.52% 9/15/48 1.12 AT&T 5.25% 3/1/37 1.13 CVS 5.05% 3/25/48 1.04 California State 7.30% 10/1/39 1.05 Anheuser-Busch 4.70% 2/1/36 0.86 Microsoft 3.70% 8/8/46 0.87 Goldman Sachs 6.75% 10/1/37 0.88 HSBC 6.50% 9/15/37 0.79 United Mexican States 6.75% 9/27/34 0.710 Anheuser-Busch 4.90% 2/1/46 0.7
Top 10 holdings: 8.74%% of total portfolio
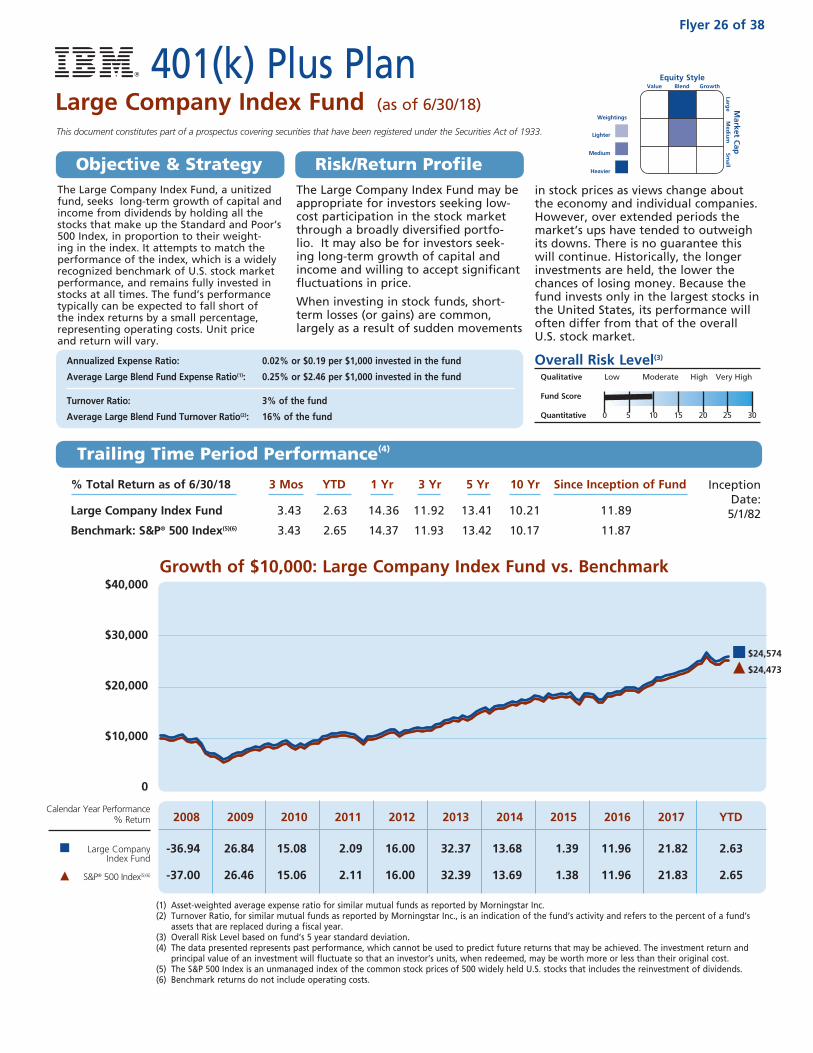
The Large Company Index Fund may be appropriate for investors seeking low-cost participation in the stock market through a broadly diversified portfo-lio. It may also be for investors seek-ing long-term growth of capital and income and willing to accept significant fluctuations in price.
When investing in stock funds, short-term losses (or gains) are common, largely as a result of sudden movements
in stock prices as views change about the economy and individual companies. However, over extended periods the market’s ups have tended to outweigh its downs. There is no guarantee this will continue. Historically, the longer investments are held, the lower the chances of losing money. Because the fund invests only in the largest stocks in the United States, its performance will often differ from that of the overall U.S. stock market.
Annualized Expense Ratio: 0.02% or $0.19 per $1,000 invested in the fund
Average Large Blend Fund Expense Ratio(1): 0.25% or $2.46 per $1,000 invested in the fund
Turnover Ratio: 3% of the fund
Average Large Blend Fund Turnover Ratio(2): 16% of the fund
Overall Risk Level(3)
Qualitative Low Moderate High Very High
Fund Score
Quantitative 0 5 10 15 20 25 30
The Large Company Index Fund, a unitized fund, seeks long-term growth of capital and income from dividends by holding all the stocks that make up the Standard and Poor’s 500 Index, in proportion to their weight-ing in the index. It attempts to match the performance of the index, which is a widely recognized benchmark of U.S. stock market performance, and remains fully invested in stocks at all times. The fund’s performance typically can be expected to fall short of the index returns by a small percentage, representing operating costs. Unit price and return will vary.
Lighter
Medium
Heavier
Weightings
This document constitutes part of a prospectus covering securities that have been registered under the Securities Act of 1933.
Equity Style Value Blend Growth
Market C
ap
Large
Med
ium
Sm
all
Growth of $10,000: Large Company Index Fund vs. Benchmark$40,000
$30,000
$20,000
$10,000
0
% Total Return as of 6/30/18 3 Mos YTD 1 Yr 3 Yr 5 Yr 10 Yr Since Inception of Fund
Large Company Index Fund 3.43 2.63 14.36 11.92 13.41 10.21 11.89
Benchmark: S&P® 500 Index(5)(6) 3.43 2.65 14.37 11.93 13.42 10.17 11.87
Inception Date:
5/1/82
(1) Asset-weighted average expense ratio for similar mutual funds as reported by Morningstar Inc. (2) Turnover Ratio, for similar mutual funds as reported by Morningstar Inc., is an indication of the fund’s activity and refers to the percent of a fund’s
assets that are replaced during a fiscal year. (3) Overall Risk Level based on fund’s 5 year standard deviation. (4) The data presented represents past performance, which cannot be used to predict future returns that may be achieved. The investment return and
principal value of an investment will fluctuate so that an investor’s units, when redeemed, may be worth more or less than their original cost. (5) The S&P 500 Index is an unmanaged index of the common stock prices of 500 widely held U.S. stocks that includes the reinvestment of dividends.(6) Benchmark returns do not include operating costs.
2008 2009 2010 2011 2012 2013 2014 2015 2016 2017 YTD
-36.94 26.84 15.08 2.09 16.00 32.37 13.68 1.39 11.96 21.82 2.63
-37.00 26.46 15.06 2.11 16.00 32.39 13.69 1.38 11.96 21.83 2.65
Calendar Year Performance % Return
Large Company Index Fund
S&P® 500 Index(5)(6)
401(k) Plus PlanLarge Company Index Fund (as of 6/30/18)
Flyer 26 of 38
Objective & Strategy Risk/Return Profile
Trailing Time Period Performance(4)
$24,574
$24,473
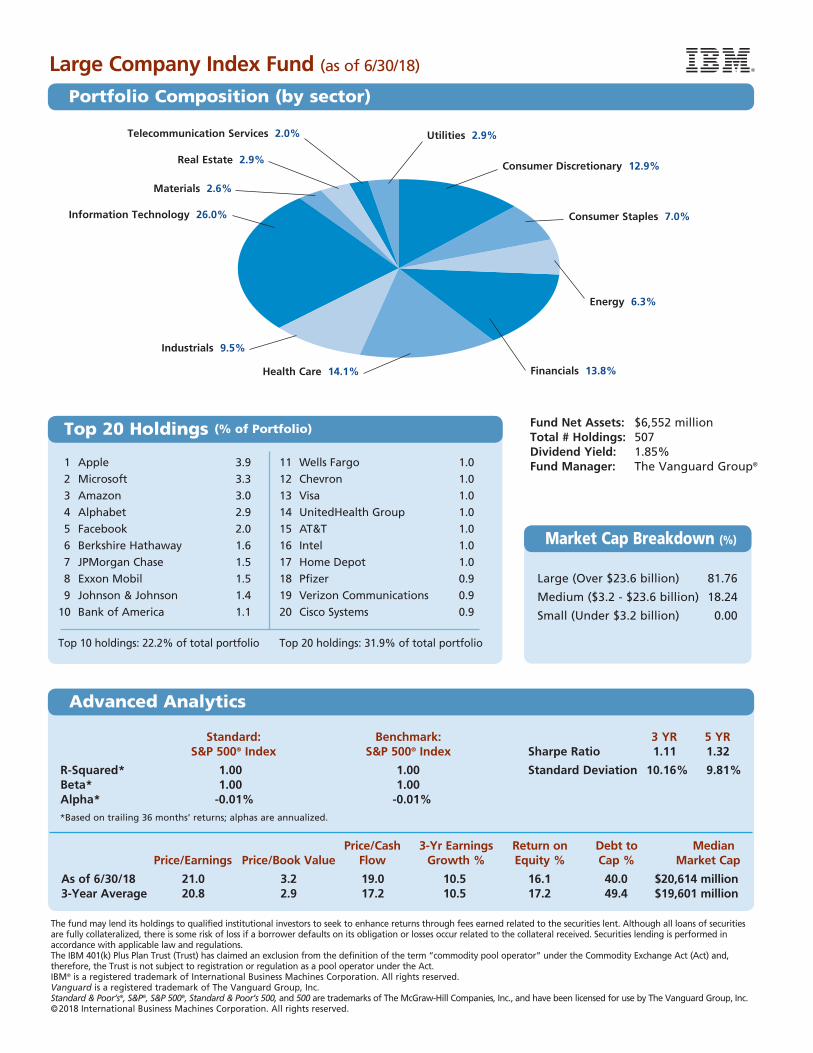
Financials 13.8%
Energy 6.3%
Utilities 2.9%
Real Estate 2.9%
Materials 2.6%
Industrials 9.5%
Telecommunication Services 2.0%
Consumer Staples 7.0%
1 Apple 3.9
2 Microsoft 3.3
3 Amazon 3.0
4 Alphabet 2.9
5 Facebook 2.0
6 Berkshire Hathaway 1.6
7 JPMorgan Chase 1.5
8 Exxon Mobil 1.5
9 Johnson & Johnson 1.4
10 Bank of America 1.1
Top 10 holdings: 22.2% of total portfolio
11 Wells Fargo 1.0
12 Chevron 1.0
13 Visa 1.0
14 UnitedHealth Group 1.0
15 AT&T 1.0
16 Intel 1.0
17 Home Depot 1.0
18 Pfizer 0.9
19 Verizon Communications 0.9
20 Cisco Systems 0.9
Top 20 holdings: 31.9% of total portfolio
Standard: Benchmark: 3 YR 5 YR S&P 500® Index S&P 500® Index Sharpe Ratio 1.11 1.32
R-Squared* 1.00 1.00 Standard Deviation 10.16% 9.81% Beta* 1.00 1.00 Alpha* -0.01% -0.01%*Based on trailing 36 months’ returns; alphas are annualized.
Price/Cash 3-Yr Earnings Return on Debt to Median Price/Earnings Price/Book Value Flow Growth % Equity % Cap % Market Cap
As of 6/30/18 21.0 3.2 19.0 10.5 16.1 40.0 $20,614 million 3-Year Average 20.8 2.9 17.2 10.5 17.2 49.4 $19,601 million
Fund Net Assets: $6,552 million Total # Holdings: 507Dividend Yield: 1.85%Fund Manager: The Vanguard Group®
The fund may lend its holdings to qualified institutional investors to seek to enhance returns through fees earned related to the securities lent. Although all loans of securities are fully collateralized, there is some risk of loss if a borrower defaults on its obligation or losses occur related to the collateral received. Securities lending is performed in accordance with applicable law and regulations.The IBM 401(k) Plus Plan Trust (Trust) has claimed an exclusion from the definition of the term “commodity pool operator” under the Commodity Exchange Act (Act) and, therefore, the Trust is not subject to registration or regulation as a pool operator under the Act.IBM® is a registered trademark of International Business Machines Corporation. All rights reserved.Vanguard is a registered trademark of The Vanguard Group, Inc.Standard & Poor’s®, S&P®, S&P 500®, Standard & Poor’s 500, and 500 are trademarks of The McGraw-Hill Companies, Inc.‚ and have been licensed for use by The Vanguard Group‚ Inc.©2018 International Business Machines Corporation. All rights reserved.
Information Technology 26.0%
Consumer Discretionary 12.9%
Large (Over $23.6 billion) 81.76
Medium ($3.2 - $23.6 billion) 18.24
Small (Under $3.2 billion) 0.00
Large Company Index Fund (as of 6/30/18)
Portfolio Composition (by sector)
Market Cap Breakdown (%)
Top 20 Holdings (% of Portfolio)
Advanced Analytics
Health Care 14.1%
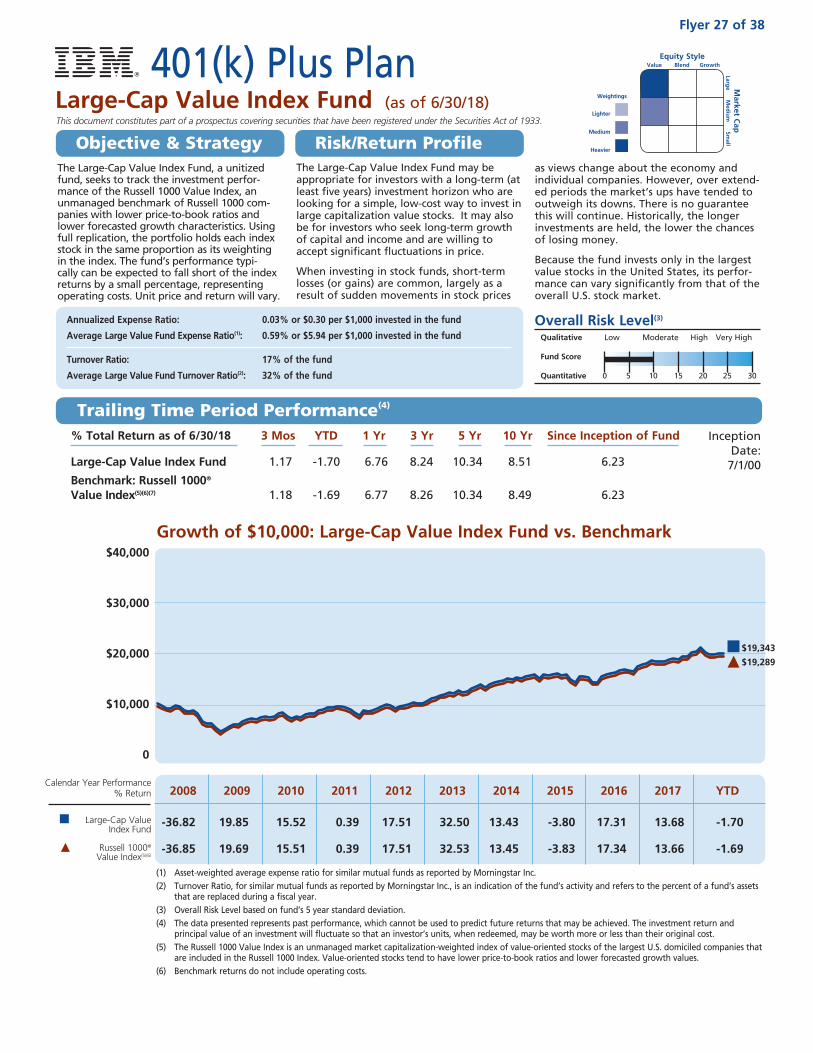
401(k) Plus PlanLarge-Cap Value Index Fund (as of 6/30/18)
The Large-Cap Value Index Fund may be appropriate for investors with a long-term (at least five years) investment horizon who are looking for a simple, low-cost way to invest in large capitalization value stocks. It may also be for investors who seek long-term growth of capital and income and are willing to accept significant fluctuations in price.
When investing in stock funds, short-term losses (or gains) are common, largely as a result of sudden movements in stock prices
as views change about the economy and individual companies. However, over extend-ed periods the market’s ups have tended to outweigh its downs. There is no guarantee this will continue. Historically, the longer investments are held, the lower the chances of losing money.
Because the fund invests only in the largest value stocks in the United States, its perfor-mance can vary significantly from that of the overall U.S. stock market.
Annualized Expense Ratio: 0.03% or $0.30 per $1,000 invested in the fund
Average Large Value Fund Expense Ratio(1): 0.59% or $5.94 per $1,000 invested in the fund
Turnover Ratio: 17% of the fund
Average Large Value Fund Turnover Ratio(2): 32% of the fund
Overall Risk Level(3)
Qualitative Low Moderate High Very High
Fund Score
Quantitative 0 5 10 15 20 25 30
The Large-Cap Value Index Fund, a unitized fund, seeks to track the investment perfor-mance of the Russell 1000 Value Index, an unmanaged benchmark of Russell 1000 com-panies with lower price-to-book ratios and lower forecasted growth characteristics. Using full replication, the portfolio holds each index stock in the same proportion as its weighting in the index. The fund’s performance typi-cally can be expected to fall short of the index returns by a small percentage, representing operating costs. Unit price and return will vary.
Lighter
Medium
Heavier
Weightings
Flyer 27 of 38
Equity Style Value Blend Growth
Market C
ap
Large
Med
ium
Sm
all
Growth of $10,000: Large-Cap Value Index Fund vs. Benchmark
% Total Return as of 6/30/18 3 Mos YTD 1 Yr 3 Yr 5 Yr 10 Yr Since Inception of Fund
Large-Cap Value Index Fund 1.17 -1.70 6.76 8.24 10.34 8.51 6.23
Benchmark: Russell 1000® Value Index(5)(6)(7) 1.18 -1.69 6.77 8.26 10.34 8.49 6.23
Inception Date:
7/1/00
(1) Asset-weighted average expense ratio for similar mutual funds as reported by Morningstar Inc. (2) Turnover Ratio, for similar mutual funds as reported by Morningstar Inc., is an indication of the fund’s activity and refers to the percent of a fund’s assets
that are replaced during a fiscal year. (3) Overall Risk Level based on fund’s 5 year standard deviation. (4) The data presented represents past performance, which cannot be used to predict future returns that may be achieved. The investment return and
principal value of an investment will fluctuate so that an investor’s units, when redeemed, may be worth more or less than their original cost. (5) The Russell 1000 Value Index is an unmanaged market capitalization-weighted index of value-oriented stocks of the largest U.S. domiciled companies that
are included in the Russell 1000 Index. Value-oriented stocks tend to have lower price-to-book ratios and lower forecasted growth values.(6) Benchmark returns do not include operating costs.
2008 2009 2010 2011 2012 2013 2014 2015 2016 2017 YTD
-36.82 19.85 15.52 0.39 17.51 32.50 13.43 -3.80 17.31 13.68 -1.70
-36.85 19.69 15.51 0.39 17.51 32.53 13.45 -3.83 17.34 13.66 -1.69
Calendar Year Performance % Return
Large-Cap Value Index Fund
Russell 1000® Value Index(5)(6)
$40,000
$30,000
$20,000
$10,000
0
Objective & Strategy Risk/Return Profile
Trailing Time Period Performance(4)
This document constitutes part of a prospectus covering securities that have been registered under the Securities Act of 1933.
$19,343
$19,289
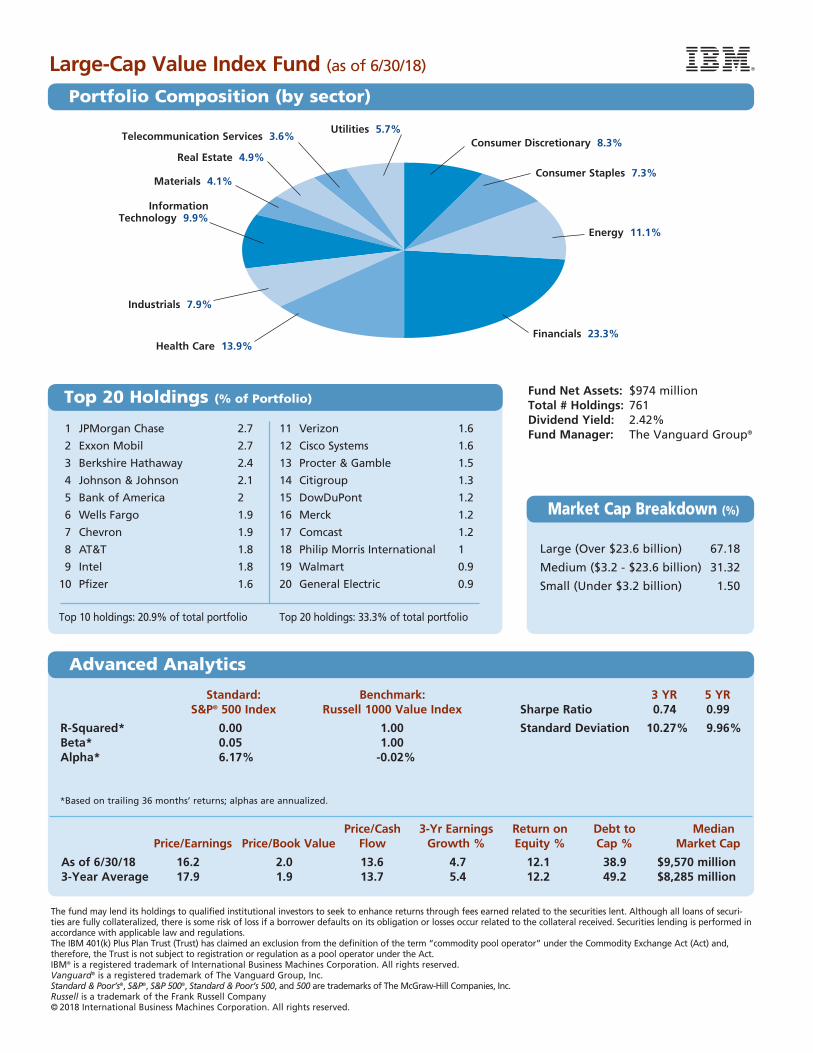
Large-Cap Value Index Fund (as of 6/30/18)
Telecommunication Services 3.6%
Financials 23.3%
Consumer Discretionary 8.3%
Energy 11.1%
Information Technology 9.9%
Industrials 7.9%
Real Estate 4.9%
Materials 4.1%
Utilities 5.7%
Consumer Staples 7.3%
Health Care 13.9%
Large (Over $23.6 billion) 67.18
Medium ($3.2 - $23.6 billion) 31.32
Small (Under $3.2 billion) 1.50
Standard: Benchmark: 3 YR 5 YR S&P® 500 Index Russell 1000 Value Index Sharpe Ratio 0.74 0.99
R-Squared* 0.00 1.00 Standard Deviation 10.27% 9.96% Beta* 0.05 1.00 Alpha* 6.17% -0.02%
* Based on trailing 36 months’ returns; alphas are annualized.
Price/Cash 3-Yr Earnings Return on Debt to Median Price/Earnings Price/Book Value Flow Growth % Equity % Cap % Market Cap
As of 6/30/18 16.2 2.0 13.6 4.7 12.1 38.9 $9,570 million 3-Year Average 17.9 1.9 13.7 5.4 12.2 49.2 $8,285 million
Fund Net Assets: $974 millionTotal # Holdings: 761Dividend Yield: 2.42%Fund Manager: The Vanguard Group®
The fund may lend its holdings to qualified institutional investors to seek to enhance returns through fees earned related to the securities lent. Although all loans of securi-ties are fully collateralized, there is some risk of loss if a borrower defaults on its obligation or losses occur related to the collateral received. Securities lending is performed in accordance with applicable law and regulations.The IBM 401(k) Plus Plan Trust (Trust) has claimed an exclusion from the definition of the term “commodity pool operator” under the Commodity Exchange Act (Act) and, therefore, the Trust is not subject to registration or regulation as a pool operator under the Act.IBM® is a registered trademark of International Business Machines Corporation. All rights reserved. Vanguard® is a registered trademark of The Vanguard Group, Inc.Standard & Poor’s®‚ S&P®‚ S&P 500®‚ Standard & Poor’s 500‚ and 500 are trademarks of The McGraw-Hill Companies‚ Inc.Russell is a trademark of the Frank Russell Company© 2018 International Business Machines Corporation. All rights reserved.
1 JPMorgan Chase 2.7
2 Exxon Mobil 2.7
3 Berkshire Hathaway 2.4
4 Johnson & Johnson 2.1
5 Bank of America 2
6 Wells Fargo 1.9
7 Chevron 1.9
8 AT&T 1.8
9 Intel 1.8
10 Pfizer 1.6
Top 10 holdings: 20.9% of total portfolio
11 Verizon 1.6
12 Cisco Systems 1.6
13 Procter & Gamble 1.5
14 Citigroup 1.3
15 DowDuPont 1.2
16 Merck 1.2
17 Comcast 1.2
18 Philip Morris International 1
19 Walmart 0.9
20 General Electric 0.9
Top 20 holdings: 33.3% of total portfolio
Portfolio Composition (by sector)
Market Cap Breakdown (%)
Top 20 Holdings (% of Portfolio)
Advanced Analytics

The Large-Cap Growth Index Fund may be appropriate for investors with a long-term (at least five years) investment horizon who are looking for a simple, low-cost way to invest in large capitalization growth stocks. It may also be for investors who seek long-term growth of capital and are willing to accept significant fluctuations in price. This fund is not for inves-tors who seek significant dividend income.
When investing in stock funds, short-term loss-es (or gains) are common, largely as a result
of sudden movements in stock prices as views change about the economy and individual companies. However, over extended periods the market’s ups have tended to outweigh its downs. There is no guarantee this will con-tinue. Historically, the longer investments are held, the lower the chances of losing money.
Because the fund invests only in the largest growth stocks in the United States, its perfor-mance will often differ from that of the over-all U.S. stock market.
Annualized Expense Ratio: 0.03% or $0.28 per $1,000 invested in the fund
Average Large Growth Fund Expense Ratio(1): 0.67% or $6.68 per $1,000 invested in the fund
Turnover Ratio: 17% of the fund
Average Large Growth Fund Turnover Ratio(2): 35% of the fund
Overall Risk Level(3)
Qualitative Low Moderate High Very High
Fund Score
Quantitative 0 5 10 15 20 25 30
The Large-Cap Growth Index Fund, a unitized fund, seeks to track the investment performance of the Russell 1000 Growth Index, an unman-aged benchmark of Russell 1000 companies with higher price-to-book ratios and higher forecasted growth characteristics. Using full replication, the portfolio holds each index stock in the same proportion as its weighting in the index. The fund’s performance typically can be expected to fall short of the index returns by a small percent-age, representing operating costs. Unit price and return will vary.
Lighter
Medium
Heavier
Weightings
This document constitutes part of a prospectus covering securities that have been registered under the Securities Act of 1933.
Equity Style Value Blend Growth
Market C
ap
Large
Med
ium
Sm
all
Growth of $10,000: Large-Cap Growth Index Fund vs. Benchmark$40,000
$30,000
$20,000
$10,000
0
% Total Return as of 6/30/18 3 Mos YTD 1 Yr 3 Yr 5 Yr 10 Yr Since Inception of Fund
Large-Cap Growth Index Fund 5.74 7.23 22.49 14.95 16.33 11.82 4.98Benchmark: Russell 1000® Growth Index(5)(6)(7) 5.76 7.25 22.51 14.98 16.36 11.83 5.02
Inception Date:
7/1/00
(1) Asset-weighted average expense ratio for similar mutual funds as reported by Morningstar Inc. (2) Turnover Ratio, for similar mutual funds as reported by Morningstar Inc., is an indication of the fund’s activity and refers to the percent of a fund’s assets
that are replaced during a fiscal year. (3) Overall Risk Level based on fund’s 5 year standard deviation. (4) The data presented represent past performance, which cannot be used to predict future returns that may be achieved. The investment return and princi-
pal value of an investment will fluctuate so that an investor’s units, when redeemed, may be worth more or less than their original cost. (5) The Russell 1000 Growth Index is an unmanaged market capitalization-weighted index of growth-oriented stocks of the largest U.S. domiciled companies
that are included in the Russell 1000 Index. Growth-oriented stocks tend to have higher price-to-book ratios and higher forecasted growth values. (6) Benchmark returns do not include operating costs.
2008 2009 2010 2011 2012 2013 2014 2015 2016 2017 YTD
-38.40 37.21 16.69 2.64 15.24 33.46 13.04 5.63 7.08 30.18 7.23
-38.44 37.21 16.71 2.64 15.26 33.48 13.05 5.67 7.08 30.21 7.25
Calendar Year Performance % Return
Large-Cap Growth Index Fund
Russell 1000®
Growth Index(5)(6)
401(k) Plus PlanLarge-Cap Growth Index Fund (as of 6/30/18)
Flyer 28 of 38
Objective & Strategy Risk/Return Profile
Trailing Time Period Performance(4)
$31,516$31,479
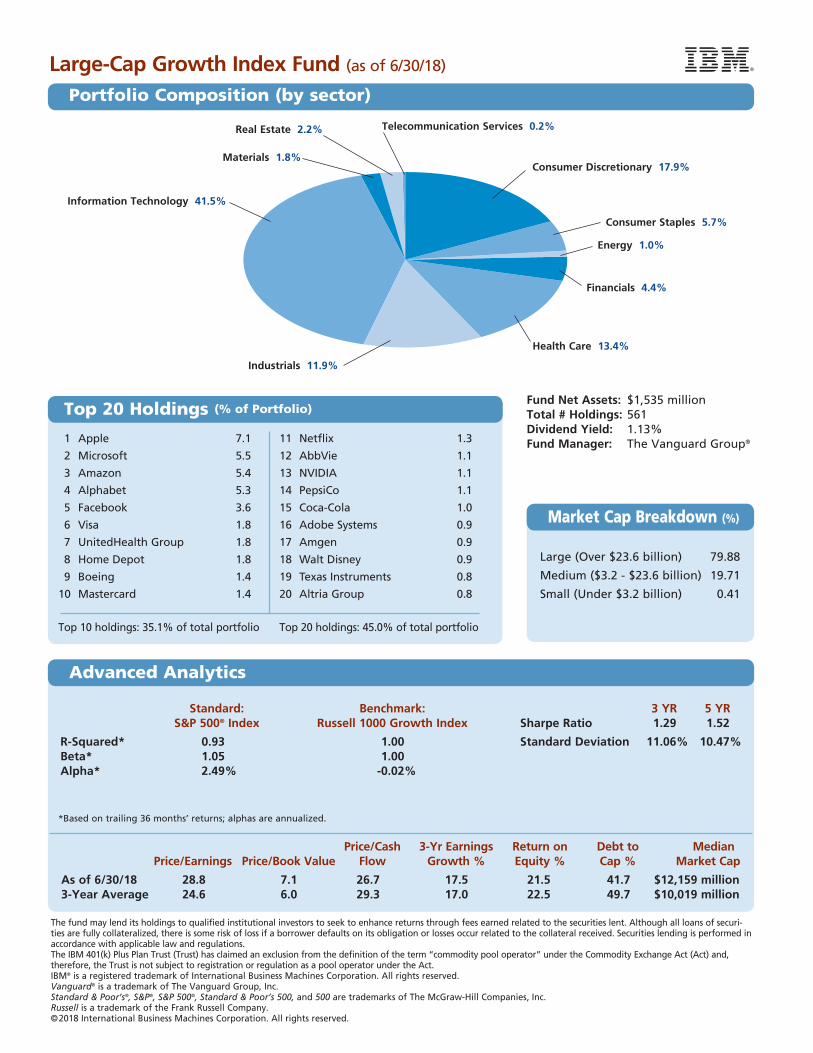
1 Apple 7.1
2 Microsoft 5.5
3 Amazon 5.4
4 Alphabet 5.3
5 Facebook 3.6
6 Visa 1.8
7 UnitedHealth Group 1.8
8 Home Depot 1.8
9 Boeing 1.4
10 Mastercard 1.4
Top 10 holdings: 35.1% of total portfolio
11 Netflix 1.3
12 AbbVie 1.1
13 NVIDIA 1.1
14 PepsiCo 1.1
15 Coca-Cola 1.0
16 Adobe Systems 0.9
17 Amgen 0.9
18 Walt Disney 0.9
19 Texas Instruments 0.8
20 Altria Group 0.8
Top 20 holdings: 45.0% of total portfolio
Standard: Benchmark: 3 YR 5 YR S&P 500® Index Russell 1000 Growth Index Sharpe Ratio 1.29 1.52
R-Squared* 0.93 1.00 Standard Deviation 11.06% 10.47% Beta* 1.05 1.00 Alpha* 2.49% -0.02%
* Based on trailing 36 months’ returns; alphas are annualized.
Price/Cash 3-Yr Earnings Return on Debt to Median Price/Earnings Price/Book Value Flow Growth % Equity % Cap % Market Cap
As of 6/30/18 28.8 7.1 26.7 17.5 21.5 41.7 $12,159 million 3-Year Average 24.6 6.0 29.3 17.0 22.5 49.7 $10,019 million
The fund may lend its holdings to qualified institutional investors to seek to enhance returns through fees earned related to the securities lent. Although all loans of securi-ties are fully collateralized, there is some risk of loss if a borrower defaults on its obligation or losses occur related to the collateral received. Securities lending is performed in accordance with applicable law and regulations.The IBM 401(k) Plus Plan Trust (Trust) has claimed an exclusion from the definition of the term “commodity pool operator” under the Commodity Exchange Act (Act) and, therefore, the Trust is not subject to registration or regulation as a pool operator under the Act.IBM® is a registered trademark of International Business Machines Corporation. All rights reserved.Vanguard® is a trademark of The Vanguard Group, Inc.Standard & Poor’s®‚ S&P®‚ S&P 500®‚ Standard & Poor’s 500‚ and 500 are trademarks of The McGraw-Hill Companies‚ Inc.Russell is a trademark of the Frank Russell Company.©2018 International Business Machines Corporation. All rights reserved.
Fund Net Assets: $1,535 millionTotal # Holdings: 561Dividend Yield: 1.13%Fund Manager: The Vanguard Group®
Large-Cap Growth Index Fund (as of 6/30/18)
Portfolio Composition (by sector)
Large (Over $23.6 billion) 79.88
Medium ($3.2 - $23.6 billion) 19.71
Small (Under $3.2 billion) 0.41
Market Cap Breakdown (%)
Top 20 Holdings (% of Portfolio)
Advanced Analytics
Telecommunication Services 0.2%
Financials 4.4%
Consumer Discretionary 17.9%
Energy 1.0%
Information Technology 41.5%
Industrials 11.9%
Materials 1.8%
Real Estate 2.2%
Consumer Staples 5.7%
Health Care 13.4%
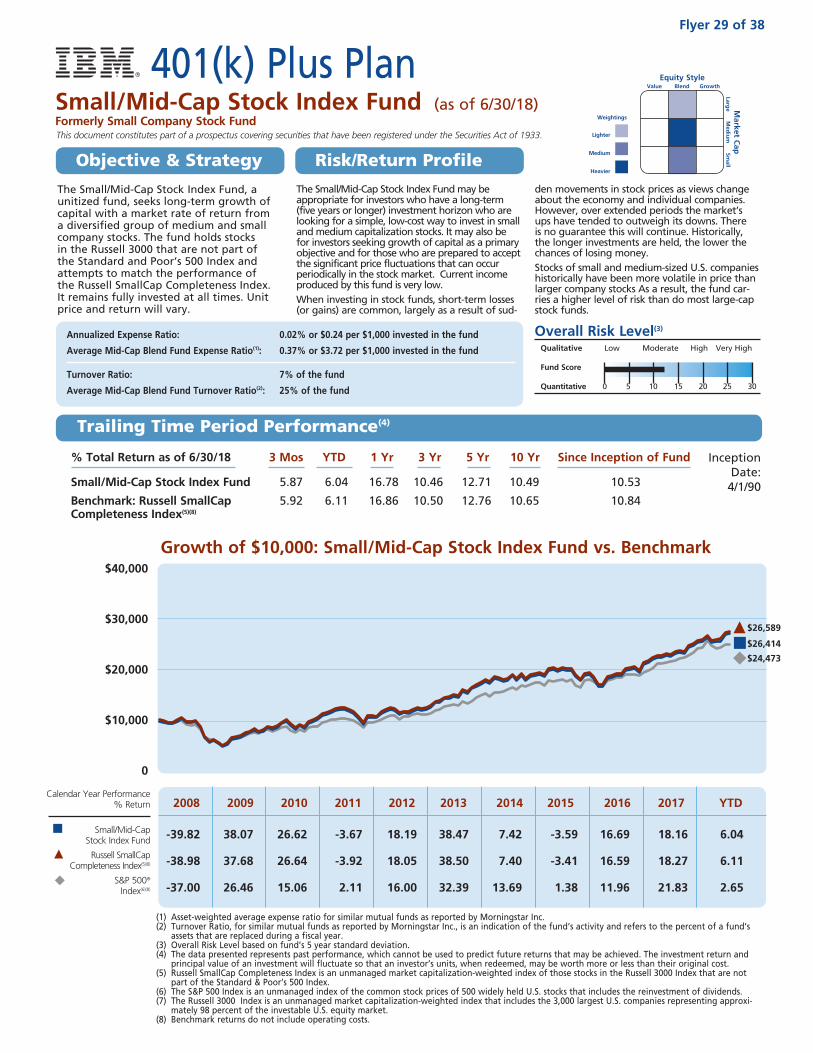
Growth of $10,000: Small/Mid-Cap Stock Index Fund vs. Benchmark$40,000
$30,000
$20,000
$10,000
0
The Small/Mid-Cap Stock Index Fund may be appropriate for investors who have a long-term (five years or longer) investment horizon who are looking for a simple, low-cost way to invest in small and medium capitalization stocks. It may also be for investors seeking growth of capital as a primary objective and for those who are prepared to accept the significant price fluctuations that can occur periodically in the stock market. Current income produced by this fund is very low. When investing in stock funds, short-term losses (or gains) are common, largely as a result of sud-
den movements in stock prices as views change about the economy and individual companies. However, over extended periods the market’s ups have tended to outweigh its downs. There is no guarantee this will continue. Historically, the longer investments are held, the lower the chances of losing money.Stocks of small and medium-sized U.S. companies historically have been more volatile in price than larger company stocks As a result, the fund car-ries a higher level of risk than do most large-cap stock funds.
Annualized Expense Ratio: 0.02% or $0.24 per $1,000 invested in the fund
Average Mid-Cap Blend Fund Expense Ratio(1): 0.37% or $3.72 per $1,000 invested in the fund
Turnover Ratio: 7% of the fund
Average Mid-Cap Blend Fund Turnover Ratio(2): 25% of the fund
Overall Risk Level(3)
Qualitative Low Moderate High Very High
Fund Score
Quantitative 0 5 10 15 20 25 30
The Small/Mid-Cap Stock Index Fund, a unitized fund, seeks long-term growth of capital with a market rate of return from a diversified group of medium and small company stocks. The fund holds stocks in the Russell 3000 that are not part of the Standard and Poor’s 500 Index and attempts to match the performance of the Russell SmallCap Completeness Index. It remains fully invested at all times. Unit price and return will vary.
Calendar Year Performance % Return
Small/Mid-Cap Stock Index Fund
Russell SmallCap Completeness Index(5)(8)
S&P 500® Index(6)(8)
Lighter
Medium
Heavier
Weightings
This document constitutes part of a prospectus covering securities that have been registered under the Securities Act of 1933.
Equity Style Value Blend Growth
Market C
ap
Large
Med
ium
Sm
all
% Total Return as of 6/30/18 3 Mos YTD 1 Yr 3 Yr 5 Yr 10 Yr Since Inception of Fund
Small/Mid-Cap Stock Index Fund 5.87 6.04 16.78 10.46 12.71 10.49 10.53
Benchmark: Russell SmallCap 5.92 6.11 16.86 10.50 12.76 10.65 10.84 Completeness Index(5)(8)
Inception Date:
4/1/90
(1) Asset-weighted average expense ratio for similar mutual funds as reported by Morningstar Inc. (2) Turnover Ratio, for similar mutual funds as reported by Morningstar Inc., is an indication of the fund’s activity and refers to the percent of a fund’s
assets that are replaced during a fiscal year. (3) Overall Risk Level based on fund’s 5 year standard deviation. (4) The data presented represents past performance, which cannot be used to predict future returns that may be achieved. The investment return and
principal value of an investment will fluctuate so that an investor’s units, when redeemed, may be worth more or less than their original cost. (5) Russell SmallCap Completeness Index is an unmanaged market capitalization-weighted index of those stocks in the Russell 3000 Index that are not
part of the Standard & Poor’s 500 Index.(6) The S&P 500 Index is an unmanaged index of the common stock prices of 500 widely held U.S. stocks that includes the reinvestment of dividends.(7) The Russell 3000 Index is an unmanaged market capitalization-weighted index that includes the 3,000 largest U.S. companies representing approxi-
mately 98 percent of the investable U.S. equity market. (8) Benchmark returns do not include operating costs.
2008 2009 2010 2011 2012 2013 2014 2015 2016 2017 YTD
-39.82 38.07 26.62 -3.67 18.19 38.47 7.42 -3.59 16.69 18.16 6.04
-38.98 37.68 26.64 -3.92 18.05 38.50 7.40 -3.41 16.59 18.27 6.11
-37.00 26.46 15.06 2.11 16.00 32.39 13.69 1.38 11.96 21.83 2.65
401(k) Plus PlanSmall/Mid-Cap Stock Index Fund (as of 6/30/18)Formerly Small Company Stock Fund
Flyer 29 of 38
Objective & Strategy Risk/Return Profile
Trailing Time Period Performance(4)
$26,589
$24,473
$26,414
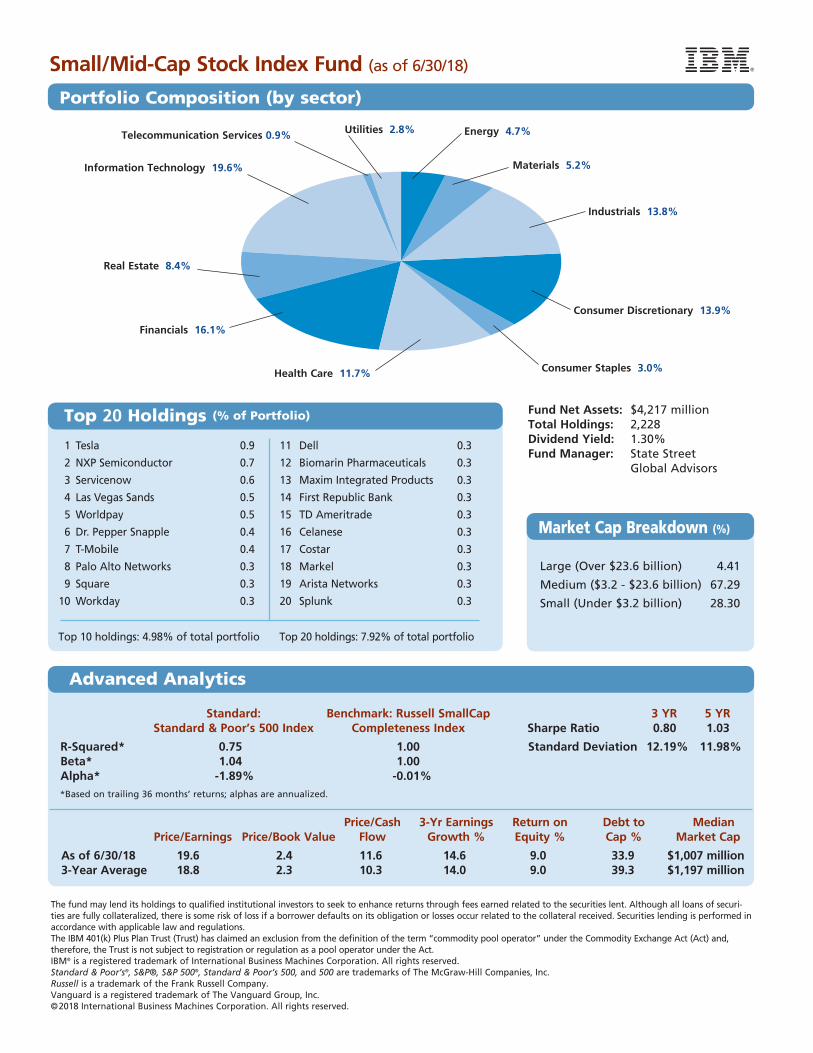
Financials 16.1%
Information Technology 19.6%
Industrials 13.8%
Health Care 11.7%
Materials 5.2%
Telecommunication Services 0.9%
Real Estate 8.4%
Energy 4.7%
Consumer Discretionary 13.9%
1 Tesla 0.9
2 NXP Semiconductor 0.7
3 Servicenow 0.6
4 Las Vegas Sands 0.5
5 Worldpay 0.5
6 Dr. Pepper Snapple 0.4
7 T-Mobile 0.4
8 Palo Alto Networks 0.3
9 Square 0.3
10 Workday 0.3
Top 10 holdings: 4.98% of total portfolio
11 Dell 0.3
12 Biomarin Pharmaceuticals 0.3
13 Maxim Integrated Products 0.3
14 First Republic Bank 0.3
15 TD Ameritrade 0.3
16 Celanese 0.3
17 Costar 0.3
18 Markel 0.3
19 Arista Networks 0.3
20 Splunk 0.3
Top 20 holdings: 7.92% of total portfolio
Standard: Benchmark: Russell SmallCap 3 YR 5 YR Standard & Poor’s 500 Index Completeness Index Sharpe Ratio 0.80 1.03
R-Squared* 0.75 1.00 Standard Deviation 12.19% 11.98% Beta* 1.04 1.00 Alpha* -1.89% -0.01% *Based on trailing 36 months’ returns; alphas are annualized.
Price/Cash 3-Yr Earnings Return on Debt to Median Price/Earnings Price/Book Value Flow Growth % Equity % Cap % Market Cap
As of 6/30/18 19.6 2.4 11.6 14.6 9.0 33.9 $1,007 million 3-Year Average 18.8 2.3 10.3 14.0 9.0 39.3 $1,197 million
The fund may lend its holdings to qualified institutional investors to seek to enhance returns through fees earned related to the securities lent. Although all loans of securi-ties are fully collateralized, there is some risk of loss if a borrower defaults on its obligation or losses occur related to the collateral received. Securities lending is performed in accordance with applicable law and regulations. The IBM 401(k) Plus Plan Trust (Trust) has claimed an exclusion from the definition of the term “commodity pool operator” under the Commodity Exchange Act (Act) and, therefore, the Trust is not subject to registration or regulation as a pool operator under the Act.IBM® is a registered trademark of International Business Machines Corporation. All rights reserved.Standard & Poor’s®, S&P®, S&P 500®, Standard & Poor’s 500, and 500 are trademarks of The McGraw-Hill Companies, Inc.Russell is a trademark of the Frank Russell Company.Vanguard is a registered trademark of The Vanguard Group, Inc.©2018 International Business Machines Corporation. All rights reserved.
Fund Net Assets: $4,217 million Total Holdings: 2,228Dividend Yield: 1.30%Fund Manager: State Street
Global Advisors
Large (Over $23.6 billion) 4.41
Medium ($3.2 - $23.6 billion) 67.29
Small (Under $3.2 billion) 28.30
Small/Mid-Cap Stock Index Fund (as of 6/30/18)
Portfolio Composition (by sector)
Market Cap Breakdown (%)
Top 20 Holdings (% of Portfolio)
Advanced Analytics
Utilities 2.8%
Consumer Staples 3.0%
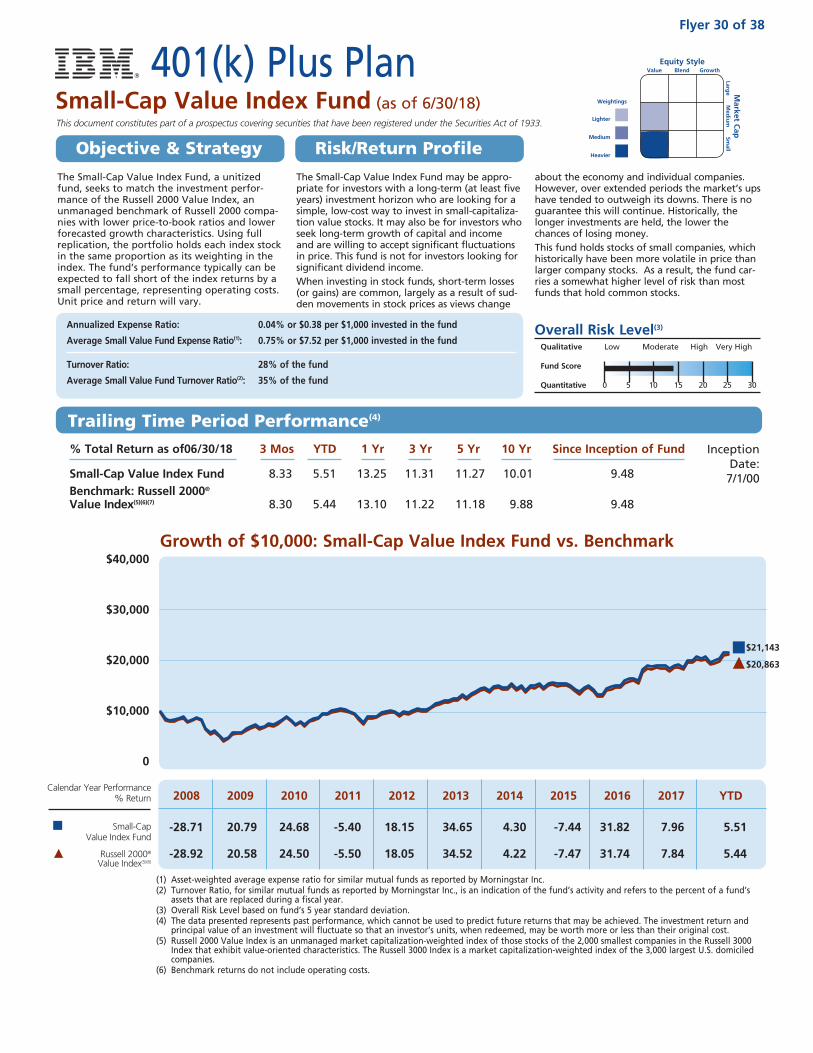
The Small-Cap Value Index Fund may be appro-priate for investors with a long-term (at least five years) investment horizon who are looking for a simple, low-cost way to invest in small-capitaliza-tion value stocks. It may also be for investors who seek long-term growth of capital and income and are willing to accept significant fluctuations in price. This fund is not for investors looking for significant dividend income.When investing in stock funds, short-term losses (or gains) are common, largely as a result of sud-den movements in stock prices as views change
about the economy and individual companies. However, over extended periods the market’s ups have tended to outweigh its downs. There is no guarantee this will continue. Historically, the longer investments are held, the lower the chances of losing money.This fund holds stocks of small companies, which historically have been more volatile in price than larger company stocks. As a result, the fund car-ries a somewhat higher level of risk than most funds that hold common stocks.
Overall Risk Level(3)
Qualitative Low Moderate High Very High
Fund Score
Quantitative 0 5 10 15 20 25 30
Lighter
Medium
Heavier
Weightings
This document constitutes part of a prospectus covering securities that have been registered under the Securities Act of 1933.
Equity Style Value Blend Growth
Market C
ap
Large
Med
ium
Sm
all
The Small-Cap Value Index Fund, a unitized fund, seeks to match the investment perfor-mance of the Russell 2000 Value Index, an unmanaged benchmark of Russell 2000 compa-nies with lower price-to-book ratios and lower forecasted growth characteristics. Using full replication, the portfolio holds each index stock in the same proportion as its weighting in the index. The fund’s performance typically can be expected to fall short of the index returns by a small percentage, representing operating costs. Unit price and return will vary.
Annualized Expense Ratio: 0.04% or $0.38 per $1,000 invested in the fund
Average Small Value Fund Expense Ratio(1): 0.75% or $7.52 per $1,000 invested in the fund
Turnover Ratio: 28% of the fund
Average Small Value Fund Turnover Ratio(2): 35% of the fund
Growth of $10,000: Small-Cap Value Index Fund vs. Benchmark
% Total Return as of06/30/18 3 Mos YTD 1 Yr 3 Yr 5 Yr 10 Yr Since Inception of Fund
Small-Cap Value Index Fund 8.33 5.51 13.25 11.31 11.27 10.01 9.48Benchmark: Russell 2000® Value Index(5)(6)(7) 8.30 5.44 13.10 11.22 11.18 9.88 9.48
Inception Date:
7/1/00
(1) Asset-weighted average expense ratio for similar mutual funds as reported by Morningstar Inc. (2) Turnover Ratio, for similar mutual funds as reported by Morningstar Inc., is an indication of the fund’s activity and refers to the percent of a fund’s
assets that are replaced during a fiscal year. (3) Overall Risk Level based on fund’s 5 year standard deviation. (4) The data presented represents past performance, which cannot be used to predict future returns that may be achieved. The investment return and
principal value of an investment will fluctuate so that an investor’s units, when redeemed, may be worth more or less than their original cost. (5) Russell 2000 Value Index is an unmanaged market capitalization-weighted index of those stocks of the 2,000 smallest companies in the Russell 3000
Index that exhibit value-oriented characteristics. The Russell 3000 Index is a market capitalization-weighted index of the 3,000 largest U.S. domiciled companies.
(6) Benchmark returns do not include operating costs.
2008 2009 2010 2011 2012 2013 2014 2015 2016 2017 YTD
-28.71 20.79 24.68 -5.40 18.15 34.65 4.30 -7.44 31.82 7.96 5.51
-28.92 20.58 24.50 -5.50 18.05 34.52 4.22 -7.47 31.74 7.84 5.44
Calendar Year Performance % Return
Small-Cap Value Index Fund
Russell 2000® Value Index(5)(6)
$40,000
$30,000
$20,000
$10,000
0
401(k) Plus PlanSmall-Cap Value Index Fund (as of 6/30/18)
Flyer 30 of 38
Objective & Strategy Risk/Return Profile
Trailing Time Period Performance(4)
$20,863
$21,143
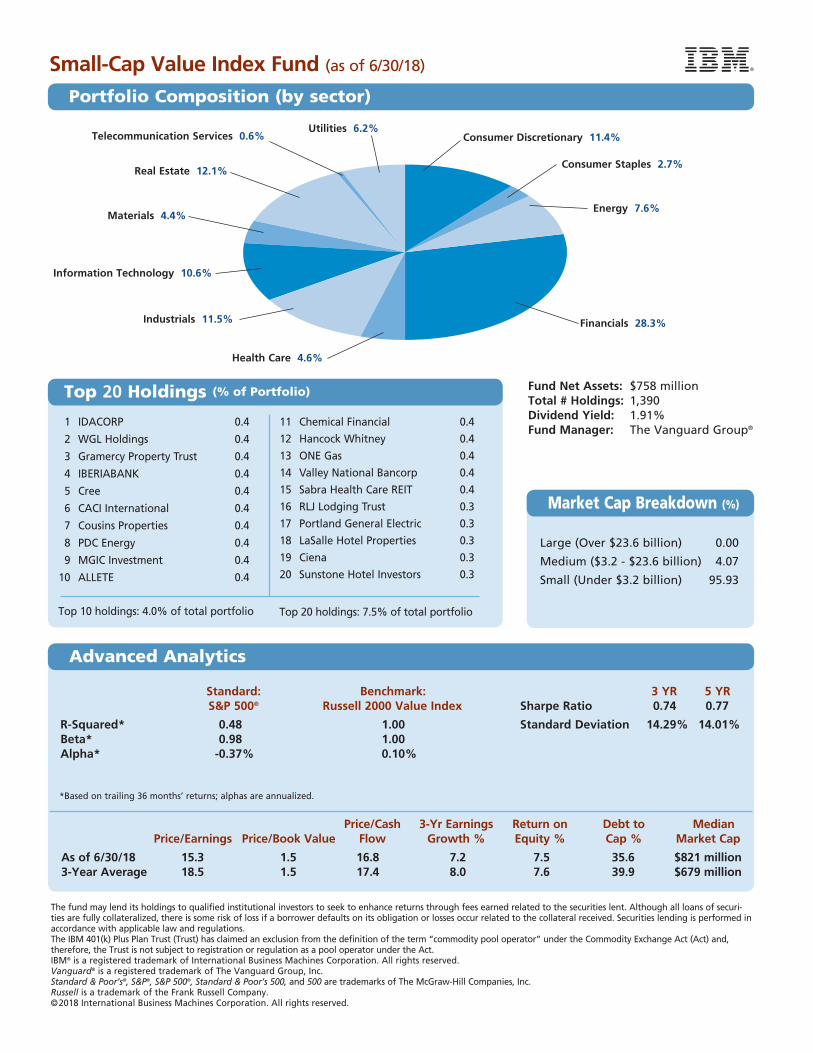
Telecommunication Services 0.6%
Health Care 4.6%
Financials 28.3%
Information Technology 10.6%
Real Estate 12.1%
Materials 4.4%
Consumer Staples 2.7%
Utilities 6.2%
1 IDACORP 0.4
2 WGL Holdings 0.4
3 Gramercy Property Trust 0.4
4 IBERIABANK 0.4
5 Cree 0.4
6 CACI International 0.4
7 Cousins Properties 0.4
8 PDC Energy 0.4
9 MGIC Investment 0.4
10 ALLETE 0.4
Top 10 holdings: 4.0% of total portfolio
11 Chemical Financial 0.4
12 Hancock Whitney 0.4
13 ONE Gas 0.4
14 Valley National Bancorp 0.4
15 Sabra Health Care REIT 0.4
16 RLJ Lodging Trust 0.3
17 Portland General Electric 0.3
18 LaSalle Hotel Properties 0.3
19 Ciena 0.3
20 Sunstone Hotel Investors 0.3
Top 20 holdings: 7.5% of total portfolio
Standard: Benchmark: 3 YR 5 YR S&P 500® Russell 2000 Value Index Sharpe Ratio 0.74 0.77
R-Squared* 0.48 1.00 Standard Deviation 14.29% 14.01% Beta* 0.98 1.00 Alpha* -0.37% 0.10%
* Based on trailing 36 months’ returns; alphas are annualized.
Price/Cash 3-Yr Earnings Return on Debt to Median Price/Earnings Price/Book Value Flow Growth % Equity % Cap % Market Cap
As of 6/30/18 15.3 1.5 16.8 7.2 7.5 35.6 $821 million 3-Year Average 18.5 1.5 17.4 8.0 7.6 39.9 $679 million
Fund Net Assets: $758 millionTotal # Holdings: 1,390Dividend Yield: 1.91%Fund Manager: The Vanguard Group®
The fund may lend its holdings to qualified institutional investors to seek to enhance returns through fees earned related to the securities lent. Although all loans of securi-ties are fully collateralized, there is some risk of loss if a borrower defaults on its obligation or losses occur related to the collateral received. Securities lending is performed in accordance with applicable law and regulations. The IBM 401(k) Plus Plan Trust (Trust) has claimed an exclusion from the definition of the term “commodity pool operator” under the Commodity Exchange Act (Act) and, therefore, the Trust is not subject to registration or regulation as a pool operator under the Act.IBM® is a registered trademark of International Business Machines Corporation. All rights reserved.Vanguard® is a registered trademark of The Vanguard Group, Inc. Standard & Poor’s®, S&P®, S&P 500®, Standard & Poor’s 500, and 500 are trademarks of The McGraw-Hill Companies, Inc.Russell is a trademark of the Frank Russell Company.©2018 International Business Machines Corporation. All rights reserved.
Large (Over $23.6 billion) 0.00
Medium ($3.2 - $23.6 billion) 4.07
Small (Under $3.2 billion) 95.93
Small-Cap Value Index Fund (as of 6/30/18)
Portfolio Composition (by sector)
Market Cap Breakdown (%)
Top 20 Holdings (% of Portfolio)
Advanced Analytics
Energy 7.6%
Consumer Discretionary 11.4%
Industrials 11.5%
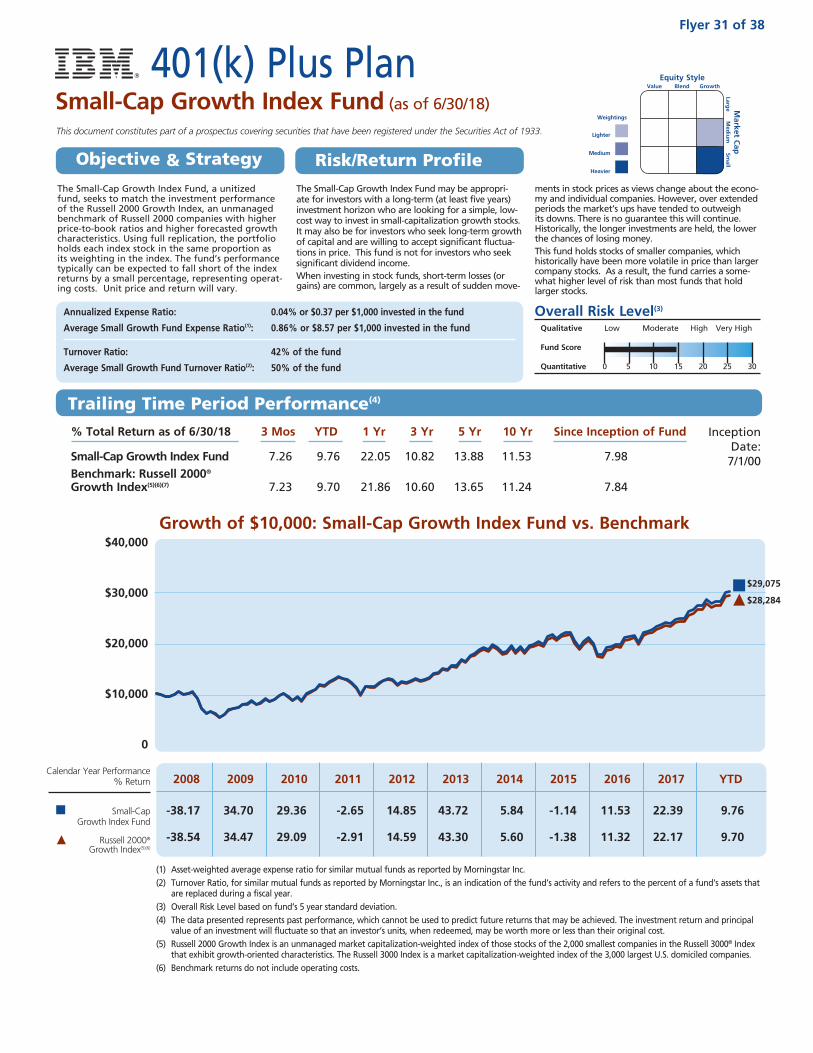
The Small-Cap Growth Index Fund may be appropri-ate for investors with a long-term (at least five years) investment horizon who are looking for a simple, low-cost way to invest in small-capitalization growth stocks. It may also be for investors who seek long-term growth of capital and are willing to accept significant fluctua-tions in price. This fund is not for investors who seek significant dividend income.When investing in stock funds, short-term losses (or gains) are common, largely as a result of sudden move-
ments in stock prices as views change about the econo-my and individual companies. However, over extended periods the market’s ups have tended to outweigh its downs. There is no guarantee this will continue. Historically, the longer investments are held, the lower the chances of losing money.This fund holds stocks of smaller companies, which historically have been more volatile in price than larger company stocks. As a result, the fund carries a some-what higher level of risk than most funds that hold larger stocks.
Annualized Expense Ratio: 0.04% or $0.37 per $1,000 invested in the fund
Average Small Growth Fund Expense Ratio(1): 0.86% or $8.57 per $1,000 invested in the fund
Turnover Ratio: 42% of the fund
Average Small Growth Fund Turnover Ratio(2): 50% of the fund
Overall Risk Level(3)
Qualitative Low Moderate High Very High
Fund Score
Quantitative 0 5 10 15 20 25 30
The Small-Cap Growth Index Fund, a unitized fund, seeks to match the investment performance of the Russell 2000 Growth Index, an unmanaged benchmark of Russell 2000 companies with higher price-to-book ratios and higher forecasted growth characteristics. Using full replication, the portfolio holds each index stock in the same proportion as its weighting in the index. The fund’s performance typically can be expected to fall short of the index returns by a small percentage, representing operat-ing costs. Unit price and return will vary.
Lighter
Medium
Heavier
Weightings
This document constitutes part of a prospectus covering securities that have been registered under the Securities Act of 1933.
Equity Style Value Blend Growth
Market C
ap
Large
Med
ium
Sm
all
Growth of $10,000: Small-Cap Growth Index Fund vs. Benchmark$40,000
$30,000
$20,000
$10,000
0
% Total Return as of 6/30/18 3 Mos YTD 1 Yr 3 Yr 5 Yr 10 Yr Since Inception of Fund
Small-Cap Growth Index Fund 7.26 9.76 22.05 10.82 13.88 11.53 7.98Benchmark: Russell 2000® Growth Index(5)(6)(7) 7.23 9.70 21.86 10.60 13.65 11.24 7.84
Inception Date:
7/1/00
(1) Asset-weighted average expense ratio for similar mutual funds as reported by Morningstar Inc. (2) Turnover Ratio, for similar mutual funds as reported by Morningstar Inc., is an indication of the fund’s activity and refers to the percent of a fund’s assets that
are replaced during a fiscal year. (3) Overall Risk Level based on fund’s 5 year standard deviation. (4) The data presented represents past performance, which cannot be used to predict future returns that may be achieved. The investment return and principal
value of an investment will fluctuate so that an investor’s units, when redeemed, may be worth more or less than their original cost. (5) Russell 2000 Growth Index is an unmanaged market capitalization-weighted index of those stocks of the 2,000 smallest companies in the Russell 3000® Index
that exhibit growth-oriented characteristics. The Russell 3000 Index is a market capitalization-weighted index of the 3,000 largest U.S. domiciled companies. (6) Benchmark returns do not include operating costs.
2008 2009 2010 2011 2012 2013 2014 2015 2016 2017 YTD
-38.17 34.70 29.36 -2.65 14.85 43.72 5.84 -1.14 11.53 22.39 9.76
-38.54 34.47 29.09 -2.91 14.59 43.30 5.60 -1.38 11.32 22.17 9.70
Calendar Year Performance % Return
Small-Cap Growth Index Fund
Russell 2000® Growth Index(5)(6)
401(k) Plus PlanSmall-Cap Growth Index Fund (as of 6/30/18)
Flyer 31 of 38
Objective & Strategy Risk/Return Profile
Trailing Time Period Performance(4)
$29,075
$28,284
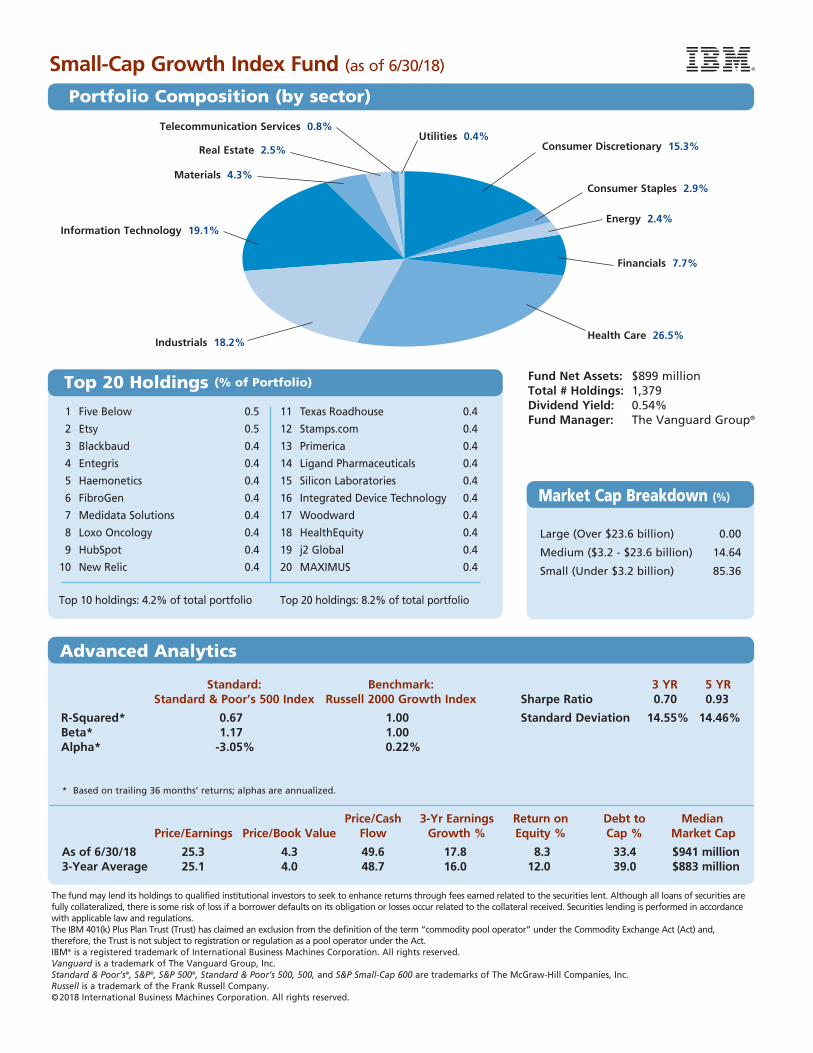
Telecommunication Services 0.8%
Consumer Staples 2.9%
Real Estate 2.5%
Materials 4.3%
Information Technology 19.1%
Consumer Discretionary 15.3%
Energy 2.4%
Industrials 18.2%Health Care 26.5%
Utilities 0.4%
Standard: Benchmark: 3 YR 5 YR Standard & Poor’s 500 Index Russell 2000 Growth Index Sharpe Ratio 0.70 0.93
R-Squared* 0.67 1.00 Standard Deviation 14.55% 14.46% Beta* 1.17 1.00 Alpha* -3.05% 0.22%
* Based on trailing 36 months’ returns; alphas are annualized.
Price/Cash 3-Yr Earnings Return on Debt to Median Price/Earnings Price/Book Value Flow Growth % Equity % Cap % Market Cap
As of 6/30/18 25.3 4.3 49.6 17.8 8.3 33.4 $941 million 3-Year Average 25.1 4.0 48.7 16.0 12.0 39.0 $883 million
The fund may lend its holdings to qualified institutional investors to seek to enhance returns through fees earned related to the securities lent. Although all loans of securities are fully collateralized, there is some risk of loss if a borrower defaults on its obligation or losses occur related to the collateral received. Securities lending is performed in accordance with applicable law and regulations.The IBM 401(k) Plus Plan Trust (Trust) has claimed an exclusion from the definition of the term “commodity pool operator” under the Commodity Exchange Act (Act) and, therefore, the Trust is not subject to registration or regulation as a pool operator under the Act.IBM® is a registered trademark of International Business Machines Corporation. All rights reserved.Vanguard is a trademark of The Vanguard Group, Inc.Standard & Poor’s®, S&P®, S&P 500®, Standard & Poor’s 500, 500‚ and S&P Small-Cap 600 are trademarks of The McGraw-Hill Companies, Inc.Russell is a trademark of the Frank Russell Company.©2018 International Business Machines Corporation. All rights reserved.
1 Five Below 0.5
2 Etsy 0.5
3 Blackbaud 0.4
4 Entegris 0.4
5 Haemonetics 0.4
6 FibroGen 0.4
7 Medidata Solutions 0.4
8 Loxo Oncology 0.4
9 HubSpot 0.4
10 New Relic 0.4
Top 10 holdings: 4.2% of total portfolio
11 Texas Roadhouse 0.4
12 Stamps.com 0.4
13 Primerica 0.4
14 Ligand Pharmaceuticals 0.4
15 Silicon Laboratories 0.4
16 Integrated Device Technology 0.4
17 Woodward 0.4
18 HealthEquity 0.4
19 j2 Global 0.4
20 MAXIMUS 0.4
Top 20 holdings: 8.2% of total portfolio
Fund Net Assets: $899 millionTotal # Holdings: 1,379Dividend Yield: 0.54%Fund Manager: The Vanguard Group®
Large (Over $23.6 billion) 0.00
Medium ($3.2 - $23.6 billion) 14.64
Small (Under $3.2 billion) 85.36
Small-Cap Growth Index Fund (as of 6/30/18)
Portfolio Composition (by sector)
Market Cap Breakdown (%)
Top 20 Holdings (% of Portfolio)
Advanced Analytics
Financials 7.7%
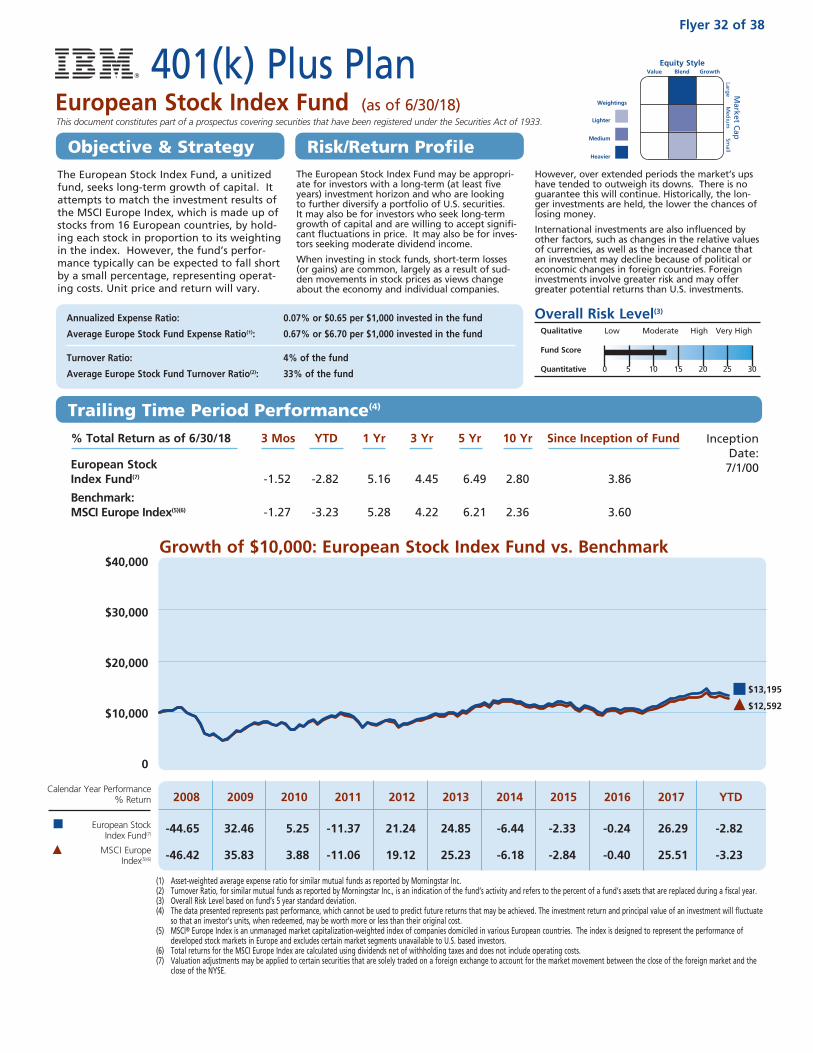
The European Stock Index Fund may be appropri-ate for investors with a long-term (at least five years) investment horizon and who are looking to further diversify a portfolio of U.S. securities. It may also be for investors who seek long-term growth of capital and are willing to accept signifi-cant fluctuations in price. It may also be for inves-tors seeking moderate dividend income.
When investing in stock funds, short-term losses (or gains) are common, largely as a result of sud-den movements in stock prices as views change about the economy and individual companies.
However, over extended periods the market’s ups have tended to outweigh its downs. There is no guarantee this will continue. Historically, the lon-ger investments are held, the lower the chances of losing money.
International investments are also influenced by other factors, such as changes in the relative values of currencies, as well as the increased chance that an investment may decline because of political or economic changes in foreign countries. Foreign investments involve greater risk and may offer greater potential returns than U.S. investments.
Annualized Expense Ratio: 0.07% or $0.65 per $1,000 invested in the fund
Average Europe Stock Fund Expense Ratio(1): 0.67% or $6.70 per $1,000 invested in the fund
Turnover Ratio: 4% of the fund
Average Europe Stock Fund Turnover Ratio(2): 33% of the fund
Overall Risk Level(3)
Qualitative Low Moderate High Very High
Fund Score
Quantitative 0 5 10 15 20 25 30
The European Stock Index Fund, a unitized fund, seeks long-term growth of capital. It attempts to match the investment results of the MSCI Europe Index, which is made up of stocks from 16 European countries, by hold-ing each stock in proportion to its weighting in the index. However, the fund’s perfor-mance typically can be expected to fall short by a small percentage, representing operat-ing costs. Unit price and return will vary.
Lighter
Medium
Heavier
Weightings
This document constitutes part of a prospectus covering securities that have been registered under the Securities Act of 1933.
Equity Style Value Blend Growth
Market C
ap
Large
Med
ium
Sm
all
Growth of $10,000: European Stock Index Fund vs. Benchmark
% Total Return as of 6/30/18 3 Mos YTD 1 Yr 3 Yr 5 Yr 10 Yr Since Inception of Fund
European Stock Index Fund(7) -1.52 -2.82 5.16 4.45 6.49 2.80 3.86
Benchmark: MSCI Europe Index(5)(6) -1.27 -3.23 5.28 4.22 6.21 2.36 3.60
Inception Date:
7/1/00
(1) Asset-weighted average expense ratio for similar mutual funds as reported by Morningstar Inc. (2) Turnover Ratio, for similar mutual funds as reported by Morningstar Inc., is an indication of the fund’s activity and refers to the percent of a fund’s assets that are replaced during a fiscal year. (3) Overall Risk Level based on fund’s 5 year standard deviation. (4) The data presented represents past performance, which cannot be used to predict future returns that may be achieved. The investment return and principal value of an investment will fluctuate
so that an investor’s units, when redeemed, may be worth more or less than their original cost. (5) MSCI® Europe Index is an unmanaged market capitalization-weighted index of companies domiciled in various European countries. The index is designed to represent the performance of
developed stock markets in Europe and excludes certain market segments unavailable to U.S. based investors.(6) Total returns for the MSCI Europe Index are calculated using dividends net of withholding taxes and does not include operating costs. (7) Valuation adjustments may be applied to certain securities that are solely traded on a foreign exchange to account for the market movement between the close of the foreign market and the
close of the NYSE.
2008 2009 2010 2011 2012 2013 2014 2015 2016 2017 YTD
-44.65 32.46 5.25 -11.37 21.24 24.85 -6.44 -2.33 -0.24 26.29 -2.82
-46.42 35.83 3.88 -11.06 19.12 25.23 -6.18 -2.84 -0.40 25.51 -3.23
Calendar Year Performance % Return
European Stock Index Fund(7)
MSCI Europe Index(5)(6)
$40,000
$30,000
$20,000
$10,000
0
401(k) Plus PlanEuropean Stock Index Fund (as of 6/30/18)
Flyer 32 of 38
Objective & Strategy Risk/Return Profile
Trailing Time Period Performance(4)
$12,592
$13,195
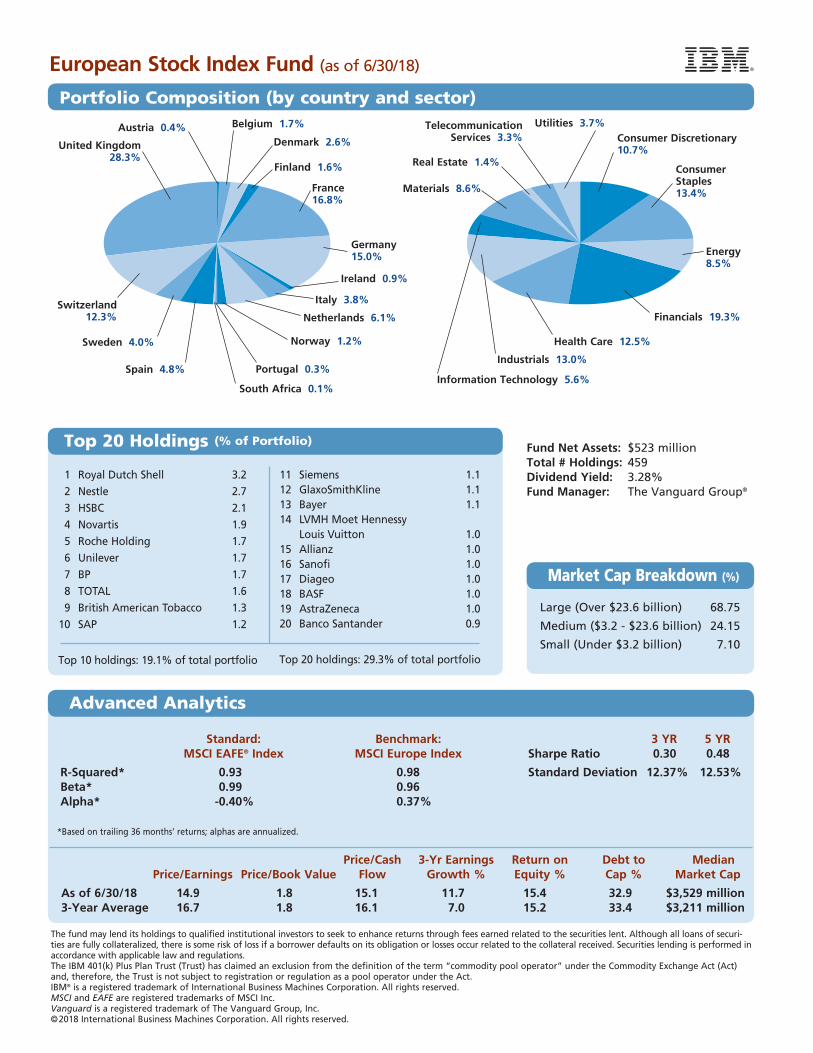
1 Royal Dutch Shell 3.2
2 Nestle 2.7
3 HSBC 2.1
4 Novartis 1.9
5 Roche Holding 1.7
6 Unilever 1.7
7 BP 1.7
8 TOTAL 1.6
9 British American Tobacco 1.3
10 SAP 1.2
Top 10 holdings: 19.1% of total portfolio
11 Siemens 1.1 12 GlaxoSmithKline 1.1 13 Bayer 1.1 14 LVMH Moet Hennessy Louis Vuitton 1.0 15 Allianz 1.0 16 Sanofi 1.0 17 Diageo 1.0 18 BASF 1.0 19 AstraZeneca 1.0 20 Banco Santander 0.9
Top 20 holdings: 29.3% of total portfolio
Standard: Benchmark: 3 YR 5 YR MSCI EAFE® Index MSCI Europe Index Sharpe Ratio 0.30 0.48
R-Squared* 0.93 0.98 Standard Deviation 12.37% 12.53% Beta* 0.99 0.96 Alpha* -0.40% 0.37%
*Based on trailing 36 months’ returns; alphas are annualized.
Price/Cash 3-Yr Earnings Return on Debt to Median Price/Earnings Price/Book Value Flow Growth % Equity % Cap % Market Cap
As of 6/30/18 14.9 1.8 15.1 11.7 15.4 32.9 $3,529 million 3-Year Average 16.7 1.8 16.1 7.0 15.2 33.4 $3,211 million
The fund may lend its holdings to qualified institutional investors to seek to enhance returns through fees earned related to the securities lent. Although all loans of securi-ties are fully collateralized, there is some risk of loss if a borrower defaults on its obligation or losses occur related to the collateral received. Securities lending is performed in accordance with applicable law and regulations.The IBM 401(k) Plus Plan Trust (Trust) has claimed an exclusion from the definition of the term “commodity pool operator” under the Commodity Exchange Act (Act) and, therefore, the Trust is not subject to registration or regulation as a pool operator under the Act.IBM® is a registered trademark of International Business Machines Corporation. All rights reserved.MSCI and EAFE are registered trademarks of MSCI Inc.Vanguard is a registered trademark of The Vanguard Group, Inc.©2018 International Business Machines Corporation. All rights reserved.
Fund Net Assets: $523 millionTotal # Holdings: 459Dividend Yield: 3.28%Fund Manager: The Vanguard Group®
European Stock Index Fund (as of 6/30/18)
Portfolio Composition (by country and sector)
Top 20 Holdings (% of Portfolio)
Advanced Analytics
Large (Over $23.6 billion) 68.75
Medium ($3.2 - $23.6 billion) 24.15
Small (Under $3.2 billion) 7.10
Market Cap Breakdown (%)
Consumer Discretionary 10.7%
Real Estate 1.4%
Materials 8.6%
Telecommunication Services 3.3%
Utilities 3.7%
Energy 8.5%
Financials 19.3%
Health Care 12.5%
Industrials 13.0%
Information Technology 5.6%
Consumer Staples 13.4%
Finland 1.6%
Austria 0.4% Belgium 1.7%
Denmark 2.6%
France 16.8%
Germany 15.0%
Ireland 0.9%
Italy 3.8%
Netherlands 6.1%
Norway 1.2%
Portugal 0.3%Spain 4.8%
South Africa 0.1%
Sweden 4.0%
Switzerland 12.3%
United Kingdom 28.3%
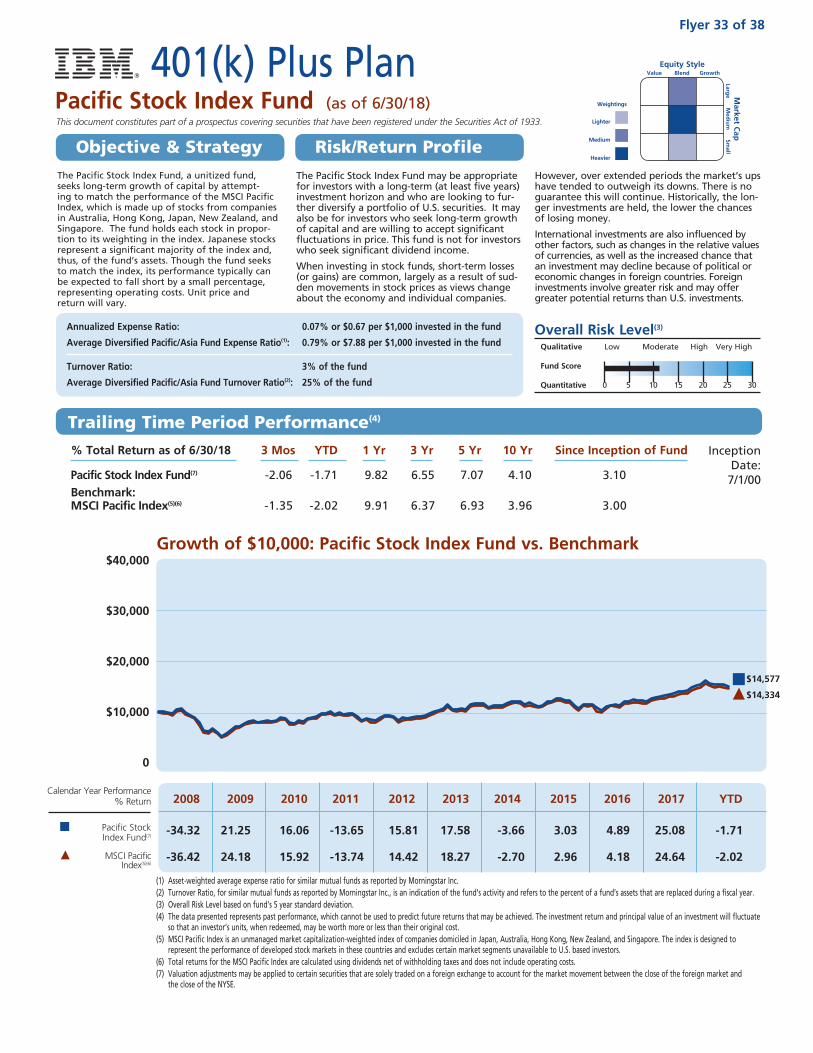
The Pacific Stock Index Fund may be appropriate for investors with a long-term (at least five years) investment horizon and who are looking to fur-ther diversify a portfolio of U.S. securities. It may also be for investors who seek long-term growth of capital and are willing to accept significant fluctuations in price. This fund is not for investors who seek significant dividend income.
When investing in stock funds, short-term losses (or gains) are common, largely as a result of sud-den movements in stock prices as views change about the economy and individual companies.
However, over extended periods the market’s ups have tended to outweigh its downs. There is no guarantee this will continue. Historically, the lon-ger investments are held, the lower the chances of losing money.
International investments are also influenced by other factors, such as changes in the relative values of currencies, as well as the increased chance that an investment may decline because of political or economic changes in foreign countries. Foreign investments involve greater risk and may offer greater potential returns than U.S. investments.
Annualized Expense Ratio: 0.07% or $0.67 per $1,000 invested in the fund
Average Diversified Pacific/Asia Fund Expense Ratio(1): 0.79% or $7.88 per $1,000 invested in the fund
Turnover Ratio: 3% of the fund
Average Diversified Pacific/Asia Fund Turnover Ratio(2): 25% of the fund
Overall Risk Level(3)
Qualitative Low Moderate High Very High
Fund Score
Quantitative 0 5 10 15 20 25 30
The Pacific Stock Index Fund, a unitized fund, seeks long-term growth of capital by attempt-ing to match the performance of the MSCI Pacific Index, which is made up of stocks from companies in Australia, Hong Kong, Japan, New Zealand, and Singapore. The fund holds each stock in propor-tion to its weighting in the index. Japanese stocks represent a significant majority of the index and, thus, of the fund’s assets. Though the fund seeks to match the index, its performance typically can be expected to fall short by a small percentage, representing operating costs. Unit price and return will vary.
Lighter
Medium
Heavier
Weightings
This document constitutes part of a prospectus covering securities that have been registered under the Securities Act of 1933.
Equity Style Value Blend Growth
Market C
ap
Large
Med
ium
Sm
all
Growth of $10,000: Pacific Stock Index Fund vs. Benchmark
% Total Return as of 6/30/18 3 Mos YTD 1 Yr 3 Yr 5 Yr 10 Yr Since Inception of Fund
Pacific Stock Index Fund(7) -2.06 -1.71 9.82 6.55 7.07 4.10 3.10Benchmark: MSCI Pacific Index(5)(6) -1.35 -2.02 9.91 6.37 6.93 3.96 3.00
Inception Date:
7/1/00
2008 2009 2010 2011 2012 2013 2014 2015 2016 2017 YTD
-34.32 21.25 16.06 -13.65 15.81 17.58 -3.66 3.03 4.89 25.08 -1.71
-36.42 24.18 15.92 -13.74 14.42 18.27 -2.70 2.96 4.18 24.64 -2.02
Calendar Year Performance % Return
Pacific Stock Index Fund(7)
MSCI Pacific Index(5)(6)
$40,000
$30,000
$20,000
$10,000
0
(1) Asset-weighted average expense ratio for similar mutual funds as reported by Morningstar Inc. (2) Turnover Ratio, for similar mutual funds as reported by Morningstar Inc., is an indication of the fund’s activity and refers to the percent of a fund’s assets that are replaced during a fiscal year. (3) Overall Risk Level based on fund’s 5 year standard deviation. (4) The data presented represents past performance, which cannot be used to predict future returns that may be achieved. The investment return and principal value of an investment will fluctuate
so that an investor’s units, when redeemed, may be worth more or less than their original cost. (5) MSCI Pacific Index is an unmanaged market capitalization-weighted index of companies domiciled in Japan, Australia, Hong Kong, New Zealand, and Singapore. The index is designed to
represent the performance of developed stock markets in these countries and excludes certain market segments unavailable to U.S. based investors. (6) Total returns for the MSCI Pacific Index are calculated using dividends net of withholding taxes and does not include operating costs. (7) Valuation adjustments may be applied to certain securities that are solely traded on a foreign exchange to account for the market movement between the close of the foreign market and
the close of the NYSE.
401(k) Plus PlanPacific Stock Index Fund (as of 6/30/18)
Flyer 33 of 38
Objective & Strategy Risk/Return Profile
Trailing Time Period Performance(4)
$14,577
$14,334
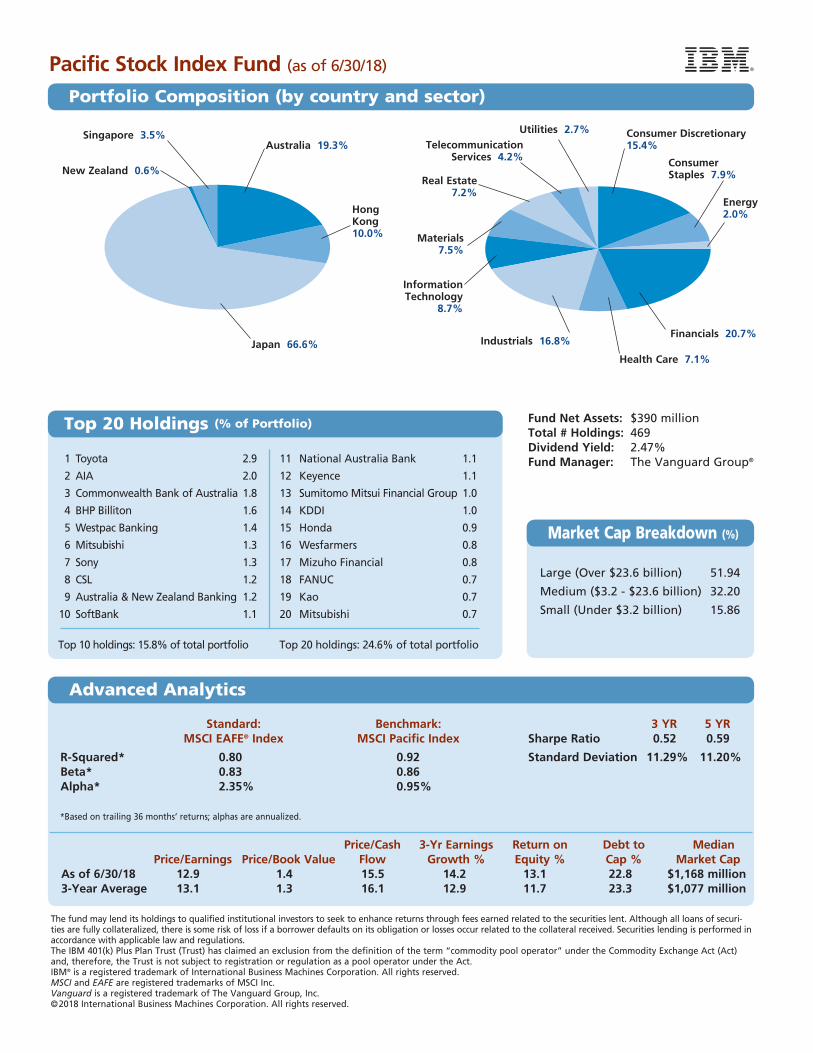
New Zealand 0.6%
Singapore 3.5%
Japan 66.6%
Australia 19.3%Consumer Discretionary 15.4%
Consumer Staples 7.9%
Energy 2.0%
Financials 20.7%Industrials 16.8%
Information Technology
8.7%
Materials 7.5%
Real Estate 7.2%
Telecommunication Services 4.2%
Utilities 2.7%
Health Care 7.1%
Hong Kong 10.0%
1 Toyota 2.9
2 AIA 2.0
3 Commonwealth Bank of Australia 1.8
4 BHP Billiton 1.6
5 Westpac Banking 1.4
6 Mitsubishi 1.3
7 Sony 1.3
8 CSL 1.2
9 Australia & New Zealand Banking 1.2
10 SoftBank 1.1
Top 10 holdings: 15.8% of total portfolio
11 National Australia Bank 1.1
12 Keyence 1.1
13 Sumitomo Mitsui Financial Group 1.0
14 KDDI 1.0
15 Honda 0.9
16 Wesfarmers 0.8
17 Mizuho Financial 0.8
18 FANUC 0.7
19 Kao 0.7
20 Mitsubishi 0.7
Top 20 holdings: 24.6% of total portfolio
Standard: Benchmark: 3 YR 5 YR MSCI EAFE® Index MSCI Pacific Index Sharpe Ratio 0.52 0.59
R-Squared* 0.80 0.92 Standard Deviation 11.29% 11.20% Beta* 0.83 0.86 Alpha* 2.35% 0.95%
*Based on trailing 36 months’ returns; alphas are annualized.
Price/Cash 3-Yr Earnings Return on Debt to Median Price/Earnings Price/Book Value Flow Growth % Equity % Cap % Market Cap As of 6/30/18 12.9 1.4 15.5 14.2 13.1 22.8 $1,168 million 3-Year Average 13.1 1.3 16.1 12.9 11.7 23.3 $1,077 million
Fund Net Assets: $390 millionTotal # Holdings: 469Dividend Yield: 2.47%Fund Manager: The Vanguard Group®
Large (Over $23.6 billion) 51.94
Medium ($3.2 - $23.6 billion) 32.20
Small (Under $3.2 billion) 15.86
Pacific Stock Index Fund (as of 6/30/18)
Portfolio Composition (by country and sector)
Market Cap Breakdown (%)
Top 20 Holdings (% of Portfolio)
Advanced Analytics
The fund may lend its holdings to qualified institutional investors to seek to enhance returns through fees earned related to the securities lent. Although all loans of securi-ties are fully collateralized, there is some risk of loss if a borrower defaults on its obligation or losses occur related to the collateral received. Securities lending is performed in accordance with applicable law and regulations.The IBM 401(k) Plus Plan Trust (Trust) has claimed an exclusion from the definition of the term “commodity pool operator” under the Commodity Exchange Act (Act) and, therefore, the Trust is not subject to registration or regulation as a pool operator under the Act.IBM® is a registered trademark of International Business Machines Corporation. All rights reserved.MSCI and EAFE are registered trademarks of MSCI Inc.Vanguard is a registered trademark of The Vanguard Group, Inc.©2018 International Business Machines Corporation. All rights reserved.
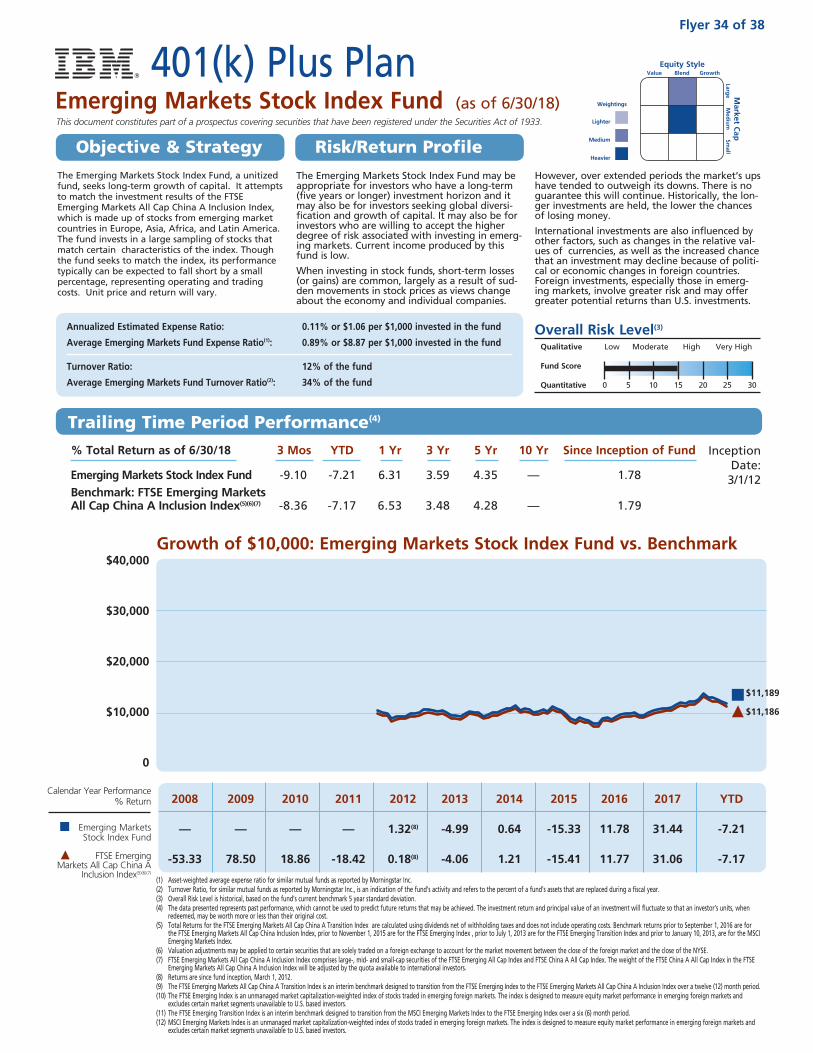
The Emerging Markets Stock Index Fund may be appropriate for investors who have a long-term (five years or longer) investment horizon and it may also be for investors seeking global diversi-fication and growth of capital. It may also be for investors who are willing to accept the higher degree of risk associated with investing in emerg-ing markets. Current income produced by this fund is low.
When investing in stock funds, short-term losses (or gains) are common, largely as a result of sud-den movements in stock prices as views change about the economy and individual companies.
However, over extended periods the market’s ups have tended to outweigh its downs. There is no guarantee this will continue. Historically, the lon-ger investments are held, the lower the chances of losing money.
International investments are also influenced by other factors, such as changes in the relative val-ues of currencies, as well as the increased chance that an investment may decline because of politi-cal or economic changes in foreign countries. Foreign investments, especially those in emerg-ing markets, involve greater risk and may offer greater potential returns than U.S. investments.
Annualized Estimated Expense Ratio: 0.11% or $1.06 per $1,000 invested in the fund
Average Emerging Markets Fund Expense Ratio(1): 0.89% or $8.87 per $1,000 invested in the fund
Turnover Ratio: 12% of the fund
Average Emerging Markets Fund Turnover Ratio(2): 34% of the fund
Overall Risk Level(3)
Qualitative Low Moderate High Very High
Fund Score
Quantitative 0 5 10 15 20 25 30
The Emerging Markets Stock Index Fund, a unitized fund, seeks long-term growth of capital. It attempts to match the investment results of the FTSE Emerging Markets All Cap China A Inclusion Index, which is made up of stocks from emerging market countries in Europe, Asia, Africa, and Latin America. The fund invests in a large sampling of stocks that match certain characteristics of the index. Though the fund seeks to match the index, its performance typically can be expected to fall short by a small percentage, representing operating and trading costs. Unit price and return will vary.
This document constitutes part of a prospectus covering securities that have been registered under the Securities Act of 1933. Lighter
Medium
Heavier
Weightings
Equity Style Value Blend Growth
Market C
ap
Large
Med
ium
Sm
all
Growth of $10,000: Emerging Markets Stock Index Fund vs. Benchmark
% Total Return as of 6/30/18 3 Mos YTD 1 Yr 3 Yr 5 Yr 10 Yr Since Inception of Fund
Emerging Markets Stock Index Fund -9.10 -7.21 6.31 3.59 4.35 — 1.78Benchmark: FTSE Emerging Markets All Cap China A Inclusion Index(5)(6)(7) -8.36 -7.17 6.53 3.48 4.28 — 1.79
Inception Date:
3/1/12
2008 2009 2010 2011 2012 2013 2014 2015 2016 2017 YTD
— — — — 1.32(8) -4.99 0.64 -15.33 11.78 31.44 -7.21
-53.33 78.50 18.86 -18.42 0.18(8) -4.06 1.21 -15.41 11.77 31.06 -7.17
Calendar Year Performance % Return
Emerging Markets Stock Index Fund
FTSE Emerging Markets All Cap China A
Inclusion Index(5)(6)(7)
$40,000
$30,000
$20,000
$10,000
0
(1) Asset-weighted average expense ratio for similar mutual funds as reported by Morningstar Inc. (2) Turnover Ratio, for similar mutual funds as reported by Morningstar Inc., is an indication of the fund’s activity and refers to the percent of a fund’s assets that are replaced during a fiscal year. (3) Overall Risk Level is historical, based on the fund’s current benchmark 5 year standard deviation. (4) The data presented represents past performance, which cannot be used to predict future returns that may be achieved. The investment return and principal value of an investment will fluctuate so that an investor’s units, when
redeemed, may be worth more or less than their original cost. (5) Total Returns for the FTSE Emerging Markets All Cap China A Transition Index are calculated using dividends net of withholding taxes and does not include operating costs. Benchmark returns prior to September 1, 2016 are for
the FTSE Emerging Markets All Cap China Inclusion Index, prior to November 1, 2015 are for the FTSE Emerging Index , prior to July 1, 2013 are for the FTSE Emerging Transition Index and prior to January 10, 2013, are for the MSCI Emerging Markets Index.
(6) Valuation adjustments may be applied to certain securities that are solely traded on a foreign exchange to account for the market movement between the close of the foreign market and the close of the NYSE.(7) FTSE Emerging Markets All Cap China A Inclusion Index comprises large-, mid- and small-cap securities of the FTSE Emerging All Cap Index and FTSE China A All Cap Index. The weight of the FTSE China A All Cap Index in the FTSE
Emerging Markets All Cap China A Inclusion Index will be adjusted by the quota available to international investors.(8) Returns are since fund inception, March 1, 2012.(9) The FTSE Emerging Markets All Cap China A Transition Index is an interim benchmark designed to transition from the FTSE Emerging Index to the FTSE Emerging Markets All Cap China A Inclusion Index over a twelve (12) month period.(10) The FTSE Emerging Index is an unmanaged market capitalization-weighted index of stocks traded in emerging foreign markets. The index is designed to measure equity market performance in emerging foreign markets and
excludes certain market segments unavailable to U.S. based investors. (11) The FTSE Emerging Transition Index is an interim benchmark designed to transition from the MSCI Emerging Markets Index to the FTSE Emerging Index over a six (6) month period.(12) MSCI Emerging Markets Index is an unmanaged market capitalization-weighted index of stocks traded in emerging foreign markets. The index is designed to measure equity market performance in emerging foreign markets and
excludes certain market segments unavailable to U.S. based investors.
401(k) Plus PlanEmerging Markets Stock Index Fund (as of 6/30/18)
Flyer 34 of 38
Objective & Strategy Risk/Return Profile
Trailing Time Period Performance(4)
$11,186
$11,189
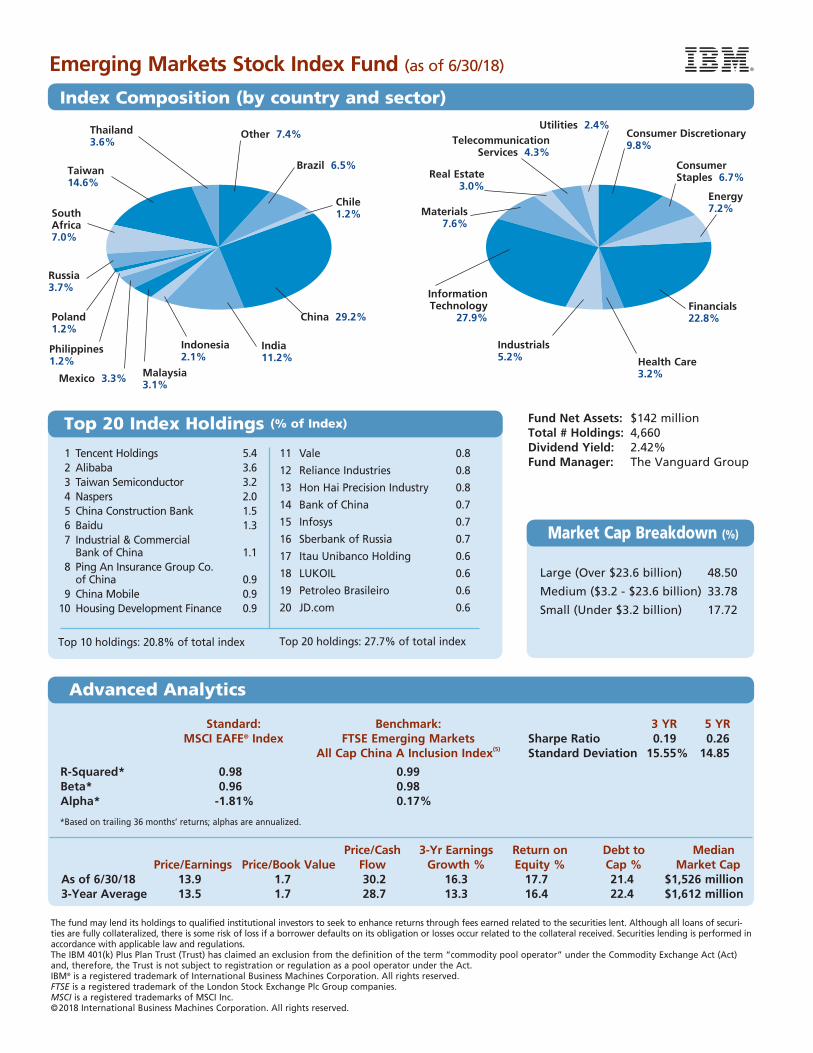
Mexico 3.3%
Poland 1.2%
Consumer Discretionary 9.8%
Consumer Staples 6.7%
Energy 7.2%
Financials 22.8%
Industrials 5.2%
Real Estate 3.0%
Materials 7.6%
Telecommunication Services 4.3%
Utilities 2.4%
Health Care 3.2%
1 Tencent Holdings 5.4 2 Alibaba 3.6 3 Taiwan Semiconductor 3.2 4 Naspers 2.0 5 China Construction Bank 1.5 6 Baidu 1.3 7 Industrial & Commercial Bank of China 1.1 8 Ping An Insurance Group Co. of China 0.9 9 China Mobile 0.9 10 Housing Development Finance 0.9
Top 10 holdings: 20.8% of total index
11 Vale 0.8
12 Reliance Industries 0.8
13 Hon Hai Precision Industry 0.8
14 Bank of China 0.7
1 5 Infosys 0.7
16 Sberbank of Russia 0.7
17 Itau Unibanco Holding 0.6
18 LUKOIL 0.6
19 Petroleo Brasileiro 0.6
20 JD.com 0.6
Top 20 holdings: 27.7% of total index
Standard: Benchmark: 3 YR 5 YR MSCI EAFE® Index FTSE Emerging Markets Sharpe Ratio 0.19 0.26 All Cap China A Inclusion Index(5) Standard Deviation 15.55% 14.85
R-Squared* 0.98 0.99 Beta* 0.96 0.98 Alpha* -1.81% 0.17%
*Based on trailing 36 months’ returns; alphas are annualized.
Price/Cash 3-Yr Earnings Return on Debt to Median Price/Earnings Price/Book Value Flow Growth % Equity % Cap % Market Cap As of 6/30/18 13.9 1.7 30.2 16.3 17.7 21.4 $1,526 million 3-Year Average 13.5 1.7 28.7 13.3 16.4 22.4 $1,612 million
Fund Net Assets: $142 millionTotal # Holdings: 4,660Dividend Yield: 2.42%Fund Manager: The Vanguard Group
Large (Over $23.6 billion) 48.50
Medium ($3.2 - $23.6 billion) 33.78
Small (Under $3.2 billion) 17.72
Emerging Markets Stock Index Fund (as of 6/30/18)
Index Composition (by country and sector)
Market Cap Breakdown (%)
Top 20 Index Holdings (% of Index)
Advanced Analytics
The fund may lend its holdings to qualified institutional investors to seek to enhance returns through fees earned related to the securities lent. Although all loans of securi-ties are fully collateralized, there is some risk of loss if a borrower defaults on its obligation or losses occur related to the collateral received. Securities lending is performed in accordance with applicable law and regulations.The IBM 401(k) Plus Plan Trust (Trust) has claimed an exclusion from the definition of the term “commodity pool operator” under the Commodity Exchange Act (Act) and, therefore, the Trust is not subject to registration or regulation as a pool operator under the Act.IBM® is a registered trademark of International Business Machines Corporation. All rights reserved.FTSE is a registered trademark of the London Stock Exchange Plc Group companies.MSCI is a registered trademarks of MSCI Inc.©2018 International Business Machines Corporation. All rights reserved.
Other 7.4%
Brazil 6.5%
Chile 1.2%
China 29.2%
India 11.2%
Indonesia 2.1%
Philippines 1.2%
Russia 3.7%
South Africa 7.0%
Taiwan 14.6%
Thailand 3.6%
Malaysia 3.1%
Information Technology
27.9%
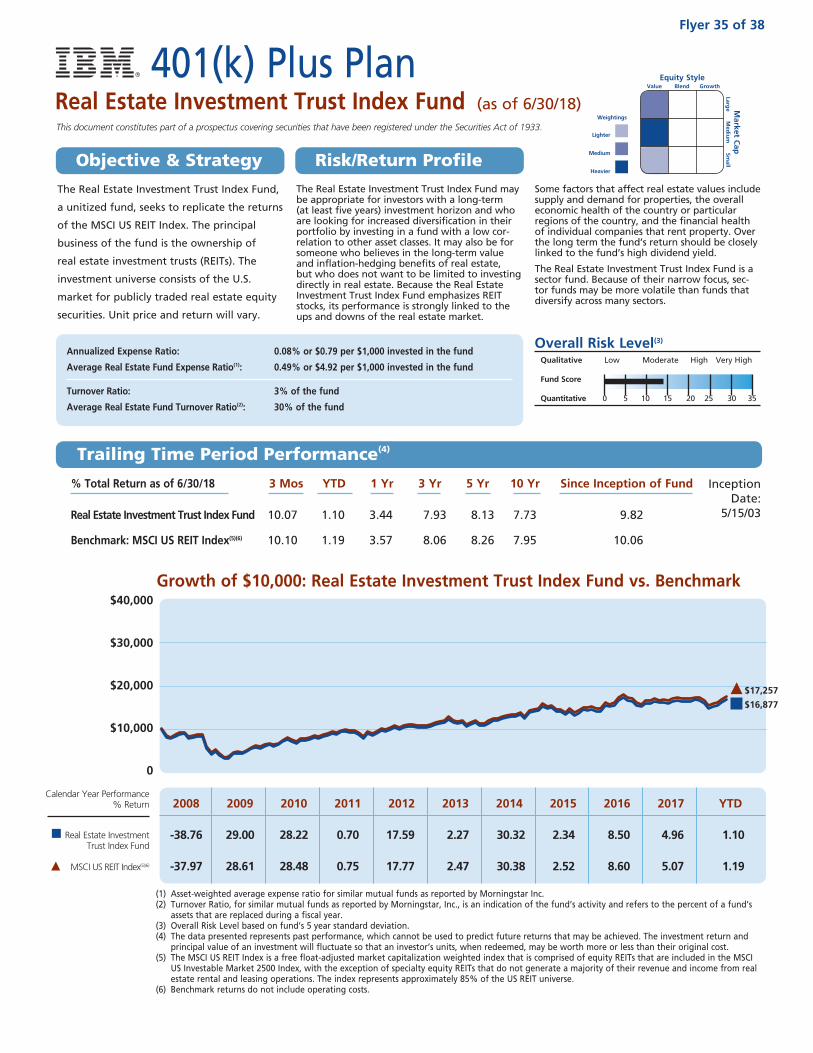
The Real Estate Investment Trust Index Fund may be appropriate for investors with a long-term (at least five years) investment horizon and who are looking for increased diversification in their portfolio by investing in a fund with a low cor-relation to other asset classes. It may also be for someone who believes in the long-term value and inflation-hedging benefits of real estate, but who does not want to be limited to investing directly in real estate. Because the Real Estate Investment Trust Index Fund emphasizes REIT stocks, its performance is strongly linked to the ups and downs of the real estate market.
Some factors that affect real estate values include supply and demand for properties, the overall economic health of the country or particular regions of the country, and the financial health of individual companies that rent property. Over the long term the fund’s return should be closely linked to the fund’s high dividend yield.
The Real Estate Investment Trust Index Fund is a sector fund. Because of their narrow focus, sec-tor funds may be more volatile than funds that diversify across many sectors.
Annualized Expense Ratio: 0.08% or $0.79 per $1,000 invested in the fund
Average Real Estate Fund Expense Ratio(1): 0.49% or $4.92 per $1,000 invested in the fund
Turnover Ratio: 3% of the fund
Average Real Estate Fund Turnover Ratio(2): 30% of the fund
Overall Risk Level(3)
Qualitative Low Moderate High Very High
Fund Score
Quantitative 0 5 10 15 20 25 30 35
The Real Estate Investment Trust Index Fund,
a unitized fund, seeks to replicate the returns
of the MSCI US REIT Index. The principal
business of the fund is the ownership of
real estate investment trusts (REITs). The
investment universe consists of the U.S.
market for publicly traded real estate equity
securities. Unit price and return will vary.
Lighter
Medium
Heavier
Weightings
This document constitutes part of a prospectus covering securities that have been registered under the Securities Act of 1933.
Equity Style Value Blend Growth
Market C
ap
Large
Med
ium
Sm
all
Growth of $10,000: Real Estate Investment Trust Index Fund vs. Benchmark
% Total Return as of 6/30/18 3 Mos YTD 1 Yr 3 Yr 5 Yr 10 Yr Since Inception of Fund
Real Estate Investment Trust Index Fund 10.07 1.10 3.44 7.93 8.13 7.73 9.82
Benchmark: MSCI US REIT Index(5)(6) 10.10 1.19 3.57 8.06 8.26 7.95 10.06
Inception Date:
5/15/03
401(k) Plus PlanReal Estate Investment Trust Index Fund (as of 6/30/18)
Flyer 35 of 38
Objective & Strategy Risk/Return Profile
Trailing Time Period Performance(4)
$40,000
$30,000
$20,000
$10,000
0
Calendar Year Performance % Return
Real Estate Investment Trust Index Fund
MSCI US REIT Index(5)(6)
2008 2009 2010 2011 2012 2013 2014 2015 2016 2017 YTD
-38.76 29.00 28.22 0.70 17.59 2.27 30.32 2.34 8.50 4.96 1.10
-37.97 28.61 28.48 0.75 17.77 2.47 30.38 2.52 8.60 5.07 1.19
(1) Asset-weighted average expense ratio for similar mutual funds as reported by Morningstar Inc. (2) Turnover Ratio, for similar mutual funds as reported by Morningstar, Inc., is an indication of the fund’s activity and refers to the percent of a fund’s
assets that are replaced during a fiscal year. (3) Overall Risk Level based on fund’s 5 year standard deviation. (4) The data presented represents past performance, which cannot be used to predict future returns that may be achieved. The investment return and
principal value of an investment will fluctuate so that an investor’s units, when redeemed, may be worth more or less than their original cost. (5) The MSCI US REIT Index is a free float-adjusted market capitalization weighted index that is comprised of equity REITs that are included in the MSCI
US Investable Market 2500 Index, with the exception of specialty equity REITs that do not generate a majority of their revenue and income from real estate rental and leasing operations. The index represents approximately 85% of the US REIT universe.
(6) Benchmark returns do not include operating costs.
$16,877
$17,257
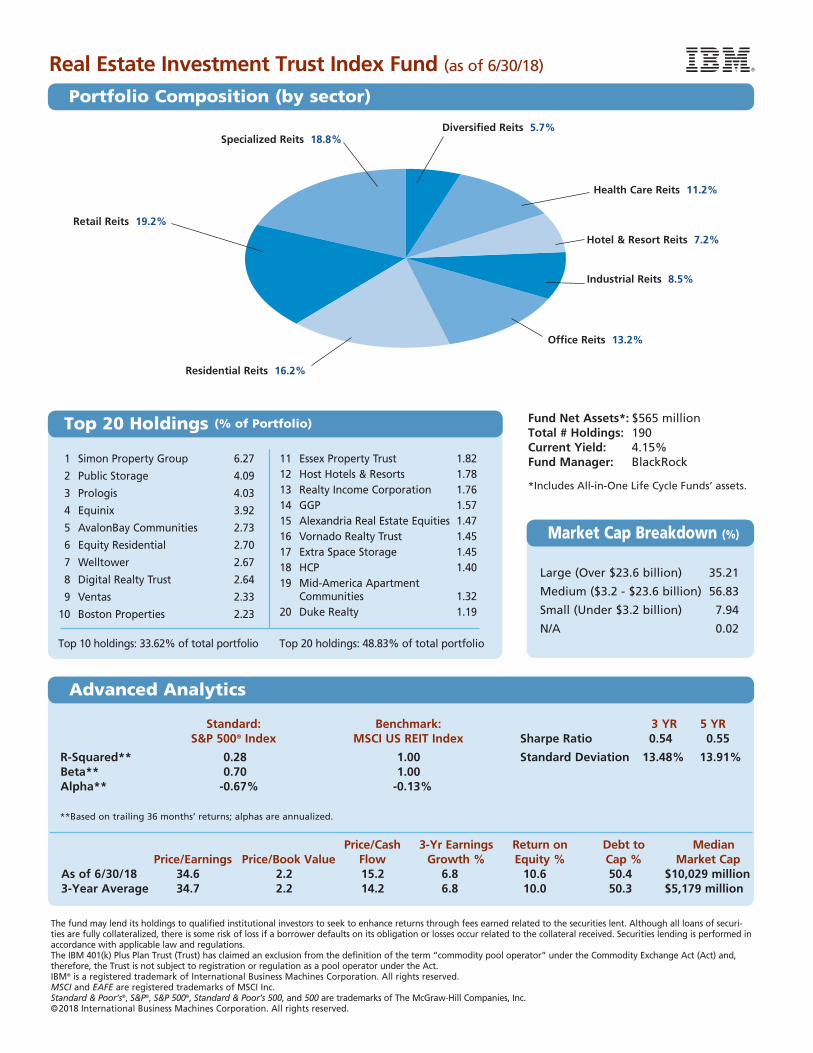
Industrial Reits 8.5%
Office Reits 13.2%
Residential Reits 16.2%
Retail Reits 19.2%
Specialized Reits 18.8%Diversified Reits 5.7%
Health Care Reits 11.2%
Hotel & Resort Reits 7.2%
1 Simon Property Group 6.27
2 Public Storage 4.09
3 Prologis 4.03
4 Equinix 3.92
5 AvalonBay Communities 2.73
6 Equity Residential 2.70
7 Welltower 2.67
8 Digital Realty Trust 2.64
9 Ventas 2.33
10 Boston Properties 2.23
Top 10 holdings: 33.62% of total portfolio
11 Essex Property Trust 1.82 12 Host Hotels & Resorts 1.78 13 Realty Income Corporation 1.76 14 GGP 1.57 15 Alexandria Real Estate Equities 1.47 16 Vornado Realty Trust 1.45 17 Extra Space Storage 1.45 18 HCP 1.40 19 Mid-America Apartment Communities 1.32 20 Duke Realty 1.19
Top 20 holdings: 48.83% of total portfolio
Standard: Benchmark: 3 YR 5 YR S&P 500® Index MSCI US REIT Index Sharpe Ratio 0.54 0.55
R-Squared** 0.28 1.00 Standard Deviation 13.48% 13.91% Beta** 0.70 1.00 Alpha** -0.67% -0.13%
**Based on trailing 36 months’ returns; alphas are annualized.
Price/Cash 3-Yr Earnings Return on Debt to Median Price/Earnings Price/Book Value Flow Growth % Equity % Cap % Market Cap As of 6/30/18 34.6 2.2 15.2 6.8 10.6 50.4 $10,029 million 3-Year Average 34.7 2.2 14.2 6.8 10.0 50.3 $5,179 million
Fund Net Assets*: $565 millionTotal # Holdings: 190Current Yield: 4.15%Fund Manager: BlackRock
*Includes All-in-One Life Cycle Funds’ assets.
The fund may lend its holdings to qualified institutional investors to seek to enhance returns through fees earned related to the securities lent. Although all loans of securi-ties are fully collateralized, there is some risk of loss if a borrower defaults on its obligation or losses occur related to the collateral received. Securities lending is performed in accordance with applicable law and regulations. The IBM 401(k) Plus Plan Trust (Trust) has claimed an exclusion from the definition of the term “commodity pool operator” under the Commodity Exchange Act (Act) and, therefore, the Trust is not subject to registration or regulation as a pool operator under the Act.IBM® is a registered trademark of International Business Machines Corporation. All rights reserved.MSCI and EAFE are registered trademarks of MSCI Inc.Standard & Poor’s®, S&P®, S&P 500®, Standard & Poor’s 500, and 500 are trademarks of The McGraw-Hill Companies, Inc.©2018 International Business Machines Corporation. All rights reserved.
Large (Over $23.6 billion) 35.21
Medium ($3.2 - $23.6 billion) 56.83
Small (Under $3.2 billion) 7.94
N/A 0.02
Real Estate Investment Trust Index Fund (as of 6/30/18)
Portfolio Composition (by sector)
Market Cap Breakdown (%)
Top 20 Holdings (% of Portfolio)
Advanced Analytics
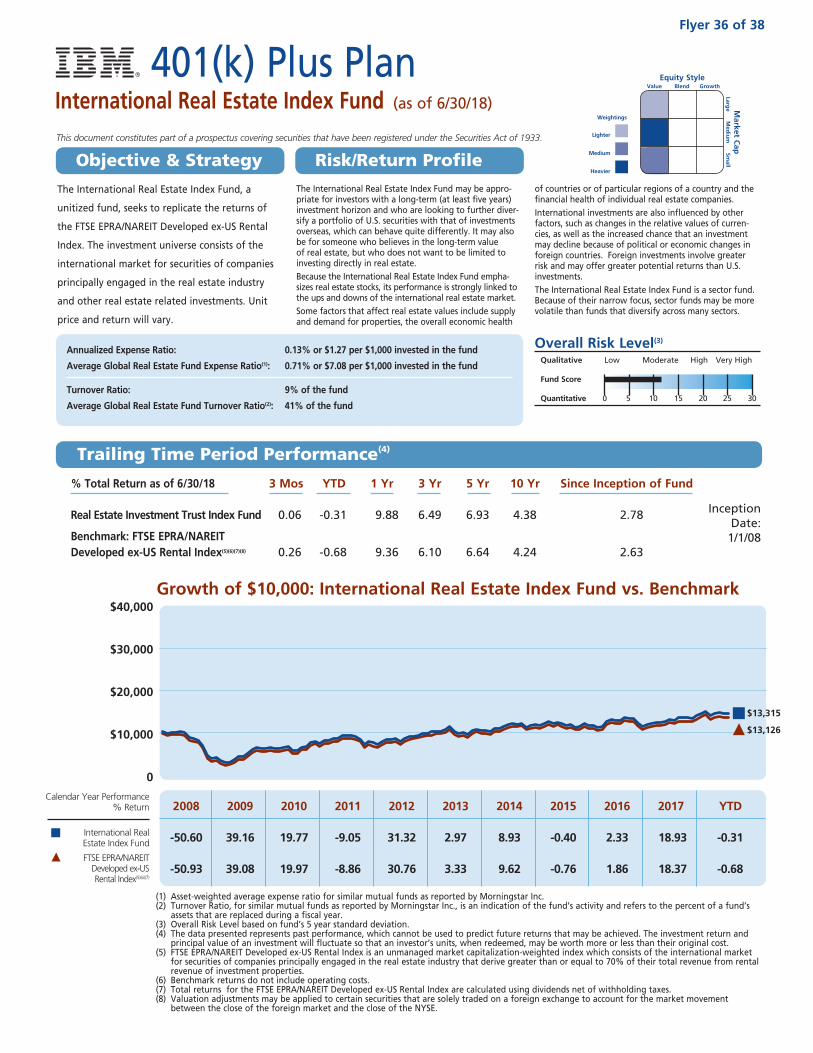
The International Real Estate Index Fund may be appro-priate for investors with a long-term (at least five years) investment horizon and who are looking to further diver-sify a portfolio of U.S. securities with that of investments overseas, which can behave quite differently. It may also be for someone who believes in the long-term value of real estate, but who does not want to be limited to investing directly in real estate. Because the International Real Estate Index Fund empha-sizes real estate stocks, its performance is strongly linked to the ups and downs of the international real estate market. Some factors that affect real estate values include supply and demand for properties, the overall economic health
of countries or of particular regions of a country and the financial health of individual real estate companies. International investments are also influenced by other factors, such as changes in the relative values of curren-cies, as well as the increased chance that an investment may decline because of political or economic changes in foreign countries. Foreign investments involve greater risk and may offer greater potential returns than U.S. investments.The International Real Estate Index Fund is a sector fund. Because of their narrow focus, sector funds may be more volatile than funds that diversify across many sectors.
Annualized Expense Ratio: 0.13% or $1.27 per $1,000 invested in the fund
Average Global Real Estate Fund Expense Ratio(1): 0.71% or $7.08 per $1,000 invested in the fund
Turnover Ratio: 9% of the fund
Average Global Real Estate Fund Turnover Ratio(2): 41% of the fund
Overall Risk Level(3)
Qualitative Low Moderate High Very High
Fund Score
Quantitative 0 5 10 15 20 25 30
The International Real Estate Index Fund, a
unitized fund, seeks to replicate the returns of
the FTSE EPRA/NAREIT Developed ex-US Rental
Index. The investment universe consists of the
international market for securities of companies
principally engaged in the real estate industry
and other real estate related investments. Unit
price and return will vary.
Lighter
Medium
Heavier
Weightings
This document constitutes part of a prospectus covering securities that have been registered under the Securities Act of 1933.
Equity Style Value Blend Growth
Market C
ap
Large
Med
ium
Sm
all
Growth of $10,000: International Real Estate Index Fund vs. Benchmark
% Total Return as of 6/30/18 3 Mos YTD 1 Yr 3 Yr 5 Yr 10 Yr Since Inception of Fund
Real Estate Investment Trust Index Fund 0.06 -0.31 9.88 6.49 6.93 4.38 2.78
Benchmark: FTSE EPRA/NAREIT Developed ex-US Rental Index(5)(6)(7)(8) 0.26 -0.68 9.36 6.10 6.64 4.24 2.63
InceptionDate:
1/1/08
401(k) Plus PlanInternational Real Estate Index Fund (as of 6/30/18)
Flyer 36 of 38
Objective & Strategy Risk/Return Profile
Trailing Time Period Performance(4)
$40,000
$30,000
$20,000
$10,000
0
Calendar Year Performance % Return
International Real Estate Index Fund
FTSE EPRA/NAREIT Developed ex-US Rental Index(5)(6)(7)
2008 2009 2010 2011 2012 2013 2014 2015 2016 2017 YTD
-50.60 39.16 19.77 -9.05 31.32 2.97 8.93 -0.40 2.33 18.93 -0.31
-50.93 39.08 19.97 -8.86 30.76 3.33 9.62 -0.76 1.86 18.37 -0.68
(1) Asset-weighted average expense ratio for similar mutual funds as reported by Morningstar Inc. (2) Turnover Ratio, for similar mutual funds as reported by Morningstar Inc., is an indication of the fund’s activity and refers to the percent of a fund’s
assets that are replaced during a fiscal year. (3) Overall Risk Level based on fund’s 5 year standard deviation. (4) The data presented represents past performance, which cannot be used to predict future returns that may be achieved. The investment return and
principal value of an investment will fluctuate so that an investor’s units, when redeemed, may be worth more or less than their original cost. (5) FTSE EPRA/NAREIT Developed ex-US Rental Index is an unmanaged market capitalization-weighted index which consists of the international market
for securities of companies principally engaged in the real estate industry that derive greater than or equal to 70% of their total revenue from rental revenue of investment properties.
(6) Benchmark returns do not include operating costs. (7) Total returns for the FTSE EPRA/NAREIT Developed ex-US Rental Index are calculated using dividends net of withholding taxes.(8) Valuation adjustments may be applied to certain securities that are solely traded on a foreign exchange to account for the market movement
between the close of the foreign market and the close of the NYSE.
$13,315
$13,126
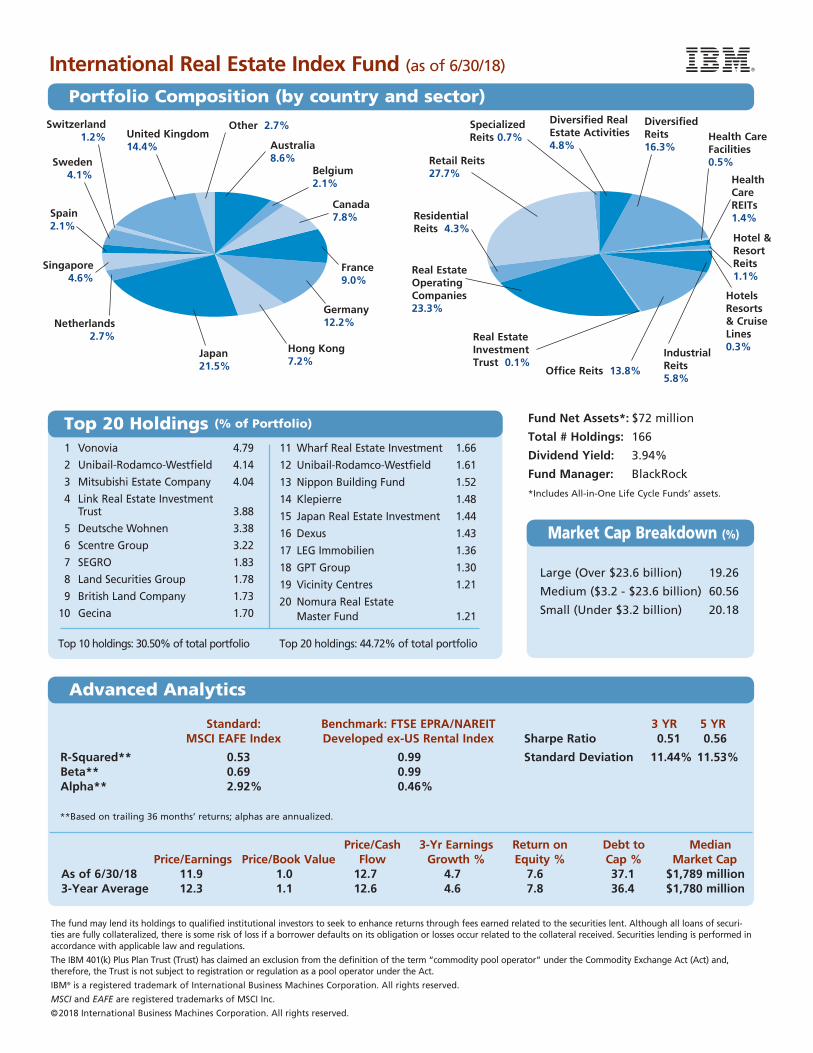
1 Vonovia 4.79
2 Unibail-Rodamco-Westfield 4.14
3 Mitsubishi Estate Company 4.04
4 Link Real Estate Investment Trust 3.88
5 Deutsche Wohnen 3.38
6 Scentre Group 3.22
7 SEGRO 1.83
8 Land Securities Group 1.78
9 British Land Company 1.73
10 Gecina 1.70
Top 10 holdings: 30.50% of total portfolio
11 Wharf Real Estate Investment 1.66
12 Unibail-Rodamco-Westfield 1.61
13 Nippon Building Fund 1.52
14 Klepierre 1.48
15 Japan Real Estate Investment 1.44
16 Dexus 1.43
17 LEG Immobilien 1.36
18 GPT Group 1.30
19 Vicinity Centres 1.21
2 0 Nomura Real Estate Master Fund 1.21
Top 20 holdings: 44.72% of total portfolio
Standard: Benchmark: FTSE EPRA/NAREIT 3 YR 5 YR MSCI EAFE Index Developed ex-US Rental Index Sharpe Ratio 0.51 0.56
R-Squared** 0.53 0.99 Standard Deviation 11.44% 11.53% Beta** 0.69 0.99 Alpha** 2.92% 0.46%
**Based on trailing 36 months’ returns; alphas are annualized.
Price/Cash 3-Yr Earnings Return on Debt to Median Price/Earnings Price/Book Value Flow Growth % Equity % Cap % Market Cap As of 6/30/18 11.9 1.0 12.7 4.7 7.6 37.1 $1,789 million 3-Year Average 12.3 1.1 12.6 4.6 7.8 36.4 $1,780 million
Fund Net Assets*: $72 million
Total # Holdings: 166
Dividend Yield: 3.94%
Fund Manager: BlackRock
*Includes All-in-One Life Cycle Funds’ assets.
The fund may lend its holdings to qualified institutional investors to seek to enhance returns through fees earned related to the securities lent. Although all loans of securi-ties are fully collateralized, there is some risk of loss if a borrower defaults on its obligation or losses occur related to the collateral received. Securities lending is performed in accordance with applicable law and regulations.
The IBM 401(k) Plus Plan Trust (Trust) has claimed an exclusion from the definition of the term “commodity pool operator” under the Commodity Exchange Act (Act) and, therefore, the Trust is not subject to registration or regulation as a pool operator under the Act.
IBM® is a registered trademark of International Business Machines Corporation. All rights reserved.
MSCI and EAFE are registered trademarks of MSCI Inc.
©2018 International Business Machines Corporation. All rights reserved.
Large (Over $23.6 billion) 19.26
Medium ($3.2 - $23.6 billion) 60.56
Small (Under $3.2 billion) 20.18
International Real Estate Index Fund (as of 6/30/18)
Portfolio Composition (by country and sector)
Market Cap Breakdown (%)
Top 20 Holdings (% of Portfolio)
Advanced Analytics
Australia 8.6%
Other 2.7%
Belgium 2.1%
Diversified Real Estate Activities 4.8%
Diversified Reits 16.3%
Health Care Facilities 0.5%
Health Care REITs 1.4%
Hotel & Resort Reits 1.1%
Industrial Reits 5.8%
Hotels Resorts & Cruise Lines 0.3%
Office Reits 13.8%
Real Estate Investment Trust 0.1%
Real Estate Operating Companies 23.3%
Residential Reits 4.3%
Retail Reits 27.7%
Specialized Reits 0.7%
Canada 7.8%
France 9.0%
Germany 12.2%
Hong Kong 7.2%
Singapore 4.6%
Spain 2.1%
Sweden 4.1%
Switzerland 1.2% United Kingdom
14.4%
Japan 21.5%
Netherlands 2.7%
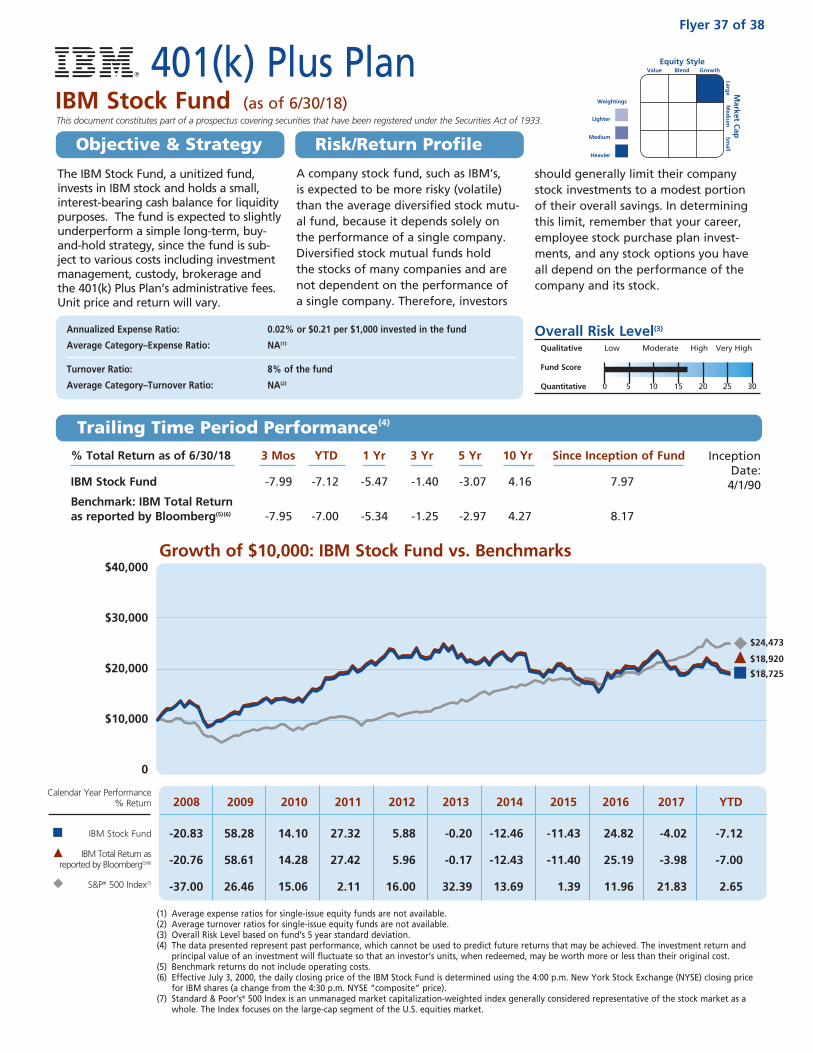
Growth of $10,000: IBM Stock Fund vs. Benchmarks$40,000
$30,000
$20,000
$10,000
0
A company stock fund, such as IBM’s, is expected to be more risky (volatile) than the average diversified stock mutu-al fund, because it depends solely on the performance of a single company. Diversified stock mutual funds hold the stocks of many companies and are not dependent on the performance of a single company. Therefore, investors
should generally limit their company stock investments to a modest portion of their overall savings. In determining this limit, remember that your career, employee stock purchase plan invest-ments, and any stock options you have all depend on the performance of the company and its stock.
Annualized Expense Ratio: 0.02% or $0.21 per $1,000 invested in the fund
Average Category–Expense Ratio: NA(1)
Turnover Ratio: 8% of the fund
Average Category–Turnover Ratio: NA(2)
Overall Risk Level(3)
Qualitative Low Moderate High Very High
Fund Score
Quantitative 0 5 10 15 20 25 30
The IBM Stock Fund, a unitized fund, invests in IBM stock and holds a small, interest-bearing cash balance for liquidity purposes. The fund is expected to slightly underperform a simple long-term, buy-and-hold strategy, since the fund is sub-ject to various costs including investment management, custody, brokerage and the 401(k) Plus Plan’s administrative fees. Unit price and return will vary.
Lighter
Medium
Heavier
Weightings
This document constitutes part of a prospectus covering securities that have been registered under the Securities Act of 1933.
Equity Style Value Blend Growth
Market C
ap
Large
Med
ium
Sm
all
% Total Return as of 6/30/18 3 Mos YTD 1 Yr 3 Yr 5 Yr 10 Yr Since Inception of Fund
IBM Stock Fund -7.99 -7.12 -5.47 -1.40 -3.07 4.16 7.97
Benchmark: IBM Total Return as reported by Bloomberg(5)(6) -7.95 -7.00 -5.34 -1.25 -2.97 4.27 8.17
Inception Date:
4/1/90
(1) Average expense ratios for single-issue equity funds are not available. (2) Average turnover ratios for single-issue equity funds are not available. (3) Overall Risk Level based on fund’s 5 year standard deviation. (4) The data presented represent past performance, which cannot be used to predict future returns that may be achieved. The investment return and
principal value of an investment will fluctuate so that an investor’s units, when redeemed, may be worth more or less than their original cost. (5) Benchmark returns do not include operating costs. (6) Effective July 3, 2000, the daily closing price of the IBM Stock Fund is determined using the 4:00 p.m. New York Stock Exchange (NYSE) closing price
for IBM shares (a change from the 4:30 p.m. NYSE “composite” price). (7) Standard & Poor’s® 500 Index is an unmanaged market capitalization-weighted index generally considered representative of the stock market as a
whole. The Index focuses on the large-cap segment of the U.S. equities market.
Calendar Year Performance % Return
IBM Stock Fund
IBM Total Return as reported by Bloomberg(5)(6)
S&P® 500 Index(7)
2008 2009 2010 2011 2012 2013 2014 2015 2016 2017 YTD
-20.83 58.28 14.10 27.32 5.88 -0.20 -12.46 -11.43 24.82 -4.02 -7.12
-20.76 58.61 14.28 27.42 5.96 -0.17 -12.43 -11.40 25.19 -3.98 -7.00
-37.00 26.46 15.06 2.11 16.00 32.39 13.69 1.39 11.96 21.83 2.65
Flyer 37 of 38
401(k) Plus PlanIBM Stock Fund (as of 6/30/18)
Objective & Strategy Risk/Return Profile
Trailing Time Period Performance(4)
$18,920
$18,725
$24,473

A small, interest-bearing cash balance of approximately 0.35% of fund market value is maintained for liquidity purposes.
This cash will have a slight negative impact on the fund’s performance over time, assuming IBM stock outperforms money market returns. Brokerage commissions needed to buy and sell IBM stock for all participants will also have a slight negative impact on the fund’s long-term performance. As with all 401(k) Plus Plan offerings, general 401(k) Plus Plan administrative costs are also charged to the fund as indicated in the fund’s expense ratio.
Fund Net Assets: $1,161 millionTotal # Holdings: 1Dividend Yield: 4.33%Fund Manager: State Street Bank and Trust Company
Standard: Benchmark: IBM Total Return 3 Yr 5 Yr S&P 500 Index as reported by Bloomberg Sharpe Ratio -0.12 -0.21
R-Squared* 0.36 1.00 Standard Deviation 17.48% 16.98% Beta* 1.03 1.00 Alpha* -13.69% -0.16% *Based on trailing 36 months’ returns; alphas are annualized.
Price/ Price/ Price/Cash 3-Yr Earnings Return on Debt to Median Earnings** Book Value** Flow** Growth %** Equity %** Cap %** Market Cap**
As of 6/30/18 23.0 7.1 13.2 -26.7 32.1 61.8 $128,240 million 3-Year Average 16.0 8.0 10.1 -11.7 65.3 60.3 $138,893 million
**Characteristics are for IBM stock as reported by State Street Bank and Trust Company.
The IBM 401(k) Plus Plan Trust (Trust) has claimed an exclusion from the definition of the term “commodity pool operator” under the Commodity Exchange Act (Act) and, therefore, the Trust is not subject to registration or regulation as a pool operator under the Act.IBM® is a registered trademark of International Business Machines Corporation. All rights reserved.Bloomberg is a registered trademark of Bloomberg L.P.Standard & Poor’s®, S&P®, S&P 500®, Standard & Poor’s 500, and 500 are trademarks of The McGraw-Hill Companies, Inc.© 2018 International Business Machines Corporation. All rights reserved.
IBM Stock Fund (as of 6/30/18)
Fund Composition
Advanced Analytics
IBM Stock Price/Monthly High/Low/Close
HighCloseLow
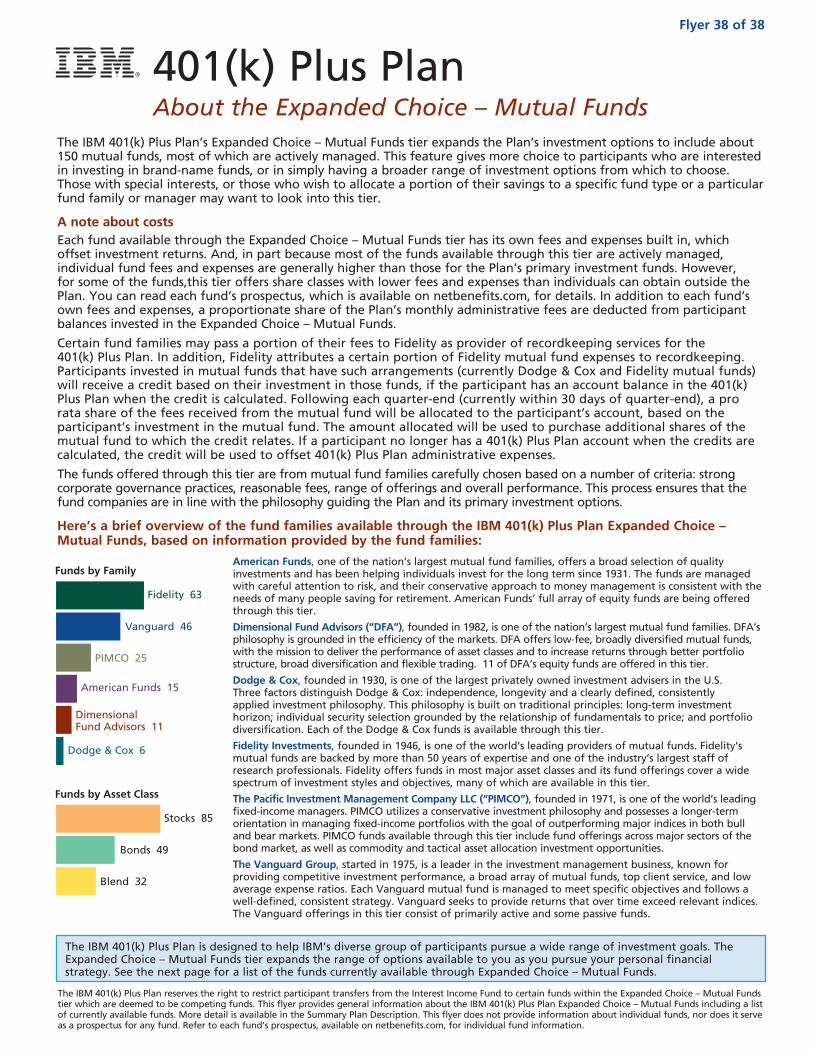
401(k) Plus PlanAbout the Expanded Choice – Mutual Funds
The IBM 401(k) Plus Plan’s Expanded Choice – Mutual Funds tier expands the Plan’s investment options to include about 150 mutual funds, most of which are actively managed. This feature gives more choice to participants who are interested in investing in brand-name funds, or in simply having a broader range of investment options from which to choose. Those with special interests, or those who wish to allocate a portion of their savings to a specific fund type or a particular fund family or manager may want to look into this tier.
A note about costsEach fund available through the Expanded Choice – Mutual Funds tier has its own fees and expenses built in, which offset investment returns. And, in part because most of the funds available through this tier are actively managed, individual fund fees and expenses are generally higher than those for the Plan’s primary investment funds. However, for some of the funds,this tier offers share classes with lower fees and expenses than individuals can obtain outside the Plan. You can read each fund’s prospectus, which is available on netbenefits.com, for details. In addition to each fund’s own fees and expenses, a proportionate share of the Plan’s monthly administrative fees are deducted from participant balances invested in the Expanded Choice – Mutual Funds.
Certain fund families may pass a portion of their fees to Fidelity as provider of recordkeeping services for the 401(k) Plus Plan. In addition, Fidelity attributes a certain portion of Fidelity mutual fund expenses to recordkeeping. Participants invested in mutual funds that have such arrangements (currently Dodge & Cox and Fidelity mutual funds) will receive a credit based on their investment in those funds, if the participant has an account balance in the 401(k) Plus Plan when the credit is calculated. Following each quarter-end (currently within 30 days of quarter-end), a pro rata share of the fees received from the mutual fund will be allocated to the participant’s account, based on the participant’s investment in the mutual fund. The amount allocated will be used to purchase additional shares of the mutual fund to which the credit relates. If a participant no longer has a 401(k) Plus Plan account when the credits are calculated, the credit will be used to offset 401(k) Plus Plan administrative expenses.
The funds offered through this tier are from mutual fund families carefully chosen based on a number of criteria: strong corporate governance practices, reasonable fees, range of offerings and overall performance. This process ensures that the fund companies are in line with the philosophy guiding the Plan and its primary investment options.
Here’s a brief overview of the fund families available through the IBM 401(k) Plus Plan Expanded Choice – Mutual Funds, based on information provided by the fund families:
American Funds, one of the nation’s largest mutual fund families, offers a broad selection of quality investments and has been helping individuals invest for the long term since 1931. The funds are managed with careful attention to risk, and their conservative approach to money management is consistent with the needs of many people saving for retirement. American Funds’ full array of equity funds are being offered through this tier.
Dimensional Fund Advisors (“DFA”), founded in 1982, is one of the nation’s largest mutual fund families. DFA’s philosophy is grounded in the efficiency of the markets. DFA offers low-fee, broadly diversified mutual funds, with the mission to deliver the performance of asset classes and to increase returns through better portfolio structure, broad diversification and flexible trading. 11 of DFA’s equity funds are offered in this tier.
Dodge & Cox, founded in 1930, is one of the largest privately owned investment advisers in the U.S. Three factors distinguish Dodge & Cox: independence, longevity and a clearly defined, consistently applied investment philosophy. This philosophy is built on traditional principles: long-term investment horizon; individual security selection grounded by the relationship of fundamentals to price; and portfolio diversification. Each of the Dodge & Cox funds is available through this tier.
Fidelity Investments, founded in 1946, is one of the world’s leading providers of mutual funds. Fidelity’s mutual funds are backed by more than 50 years of expertise and one of the industry’s largest staff of research professionals. Fidelity offers funds in most major asset classes and its fund offerings cover a wide spectrum of investment styles and objectives, many of which are available in this tier.
The Pacific Investment Management Company LLC (“PIMCO”), founded in 1971, is one of the world’s leading fixed-income managers. PIMCO utilizes a conservative investment philosophy and possesses a longer-term orientation in managing fixed-income portfolios with the goal of outperforming major indices in both bull and bear markets. PIMCO funds available through this tier include fund offerings across major sectors of the bond market, as well as commodity and tactical asset allocation investment opportunities.
The Vanguard Group, started in 1975, is a leader in the investment management business, known for providing competitive investment performance, a broad array of mutual funds, top client service, and low average expense ratios. Each Vanguard mutual fund is managed to meet specific objectives and follows a well-defined, consistent strategy. Vanguard seeks to provide returns that over time exceed relevant indices. The Vanguard offerings in this tier consist of primarily active and some passive funds.
The IBM 401(k) Plus Plan is designed to help IBM’s diverse group of participants pursue a wide range of investment goals. The Expanded Choice – Mutual Funds tier expands the range of options available to you as you pursue your personal financial strategy. See the next page for a list of the funds currently available through Expanded Choice – Mutual Funds.
The IBM 401(k) Plus Plan reserves the right to restrict participant transfers from the Interest Income Fund to certain funds within the Expanded Choice – Mutual Funds tier which are deemed to be competing funds. This flyer provides general information about the IBM 401(k) Plus Plan Expanded Choice – Mutual Funds including a list of currently available funds. More detail is available in the Summary Plan Description. This flyer does not provide information about individual funds, nor does it serve as a prospectus for any fund. Refer to each fund’s prospectus, available on netbenefits.com, for individual fund information.
Flyer 38 of 38
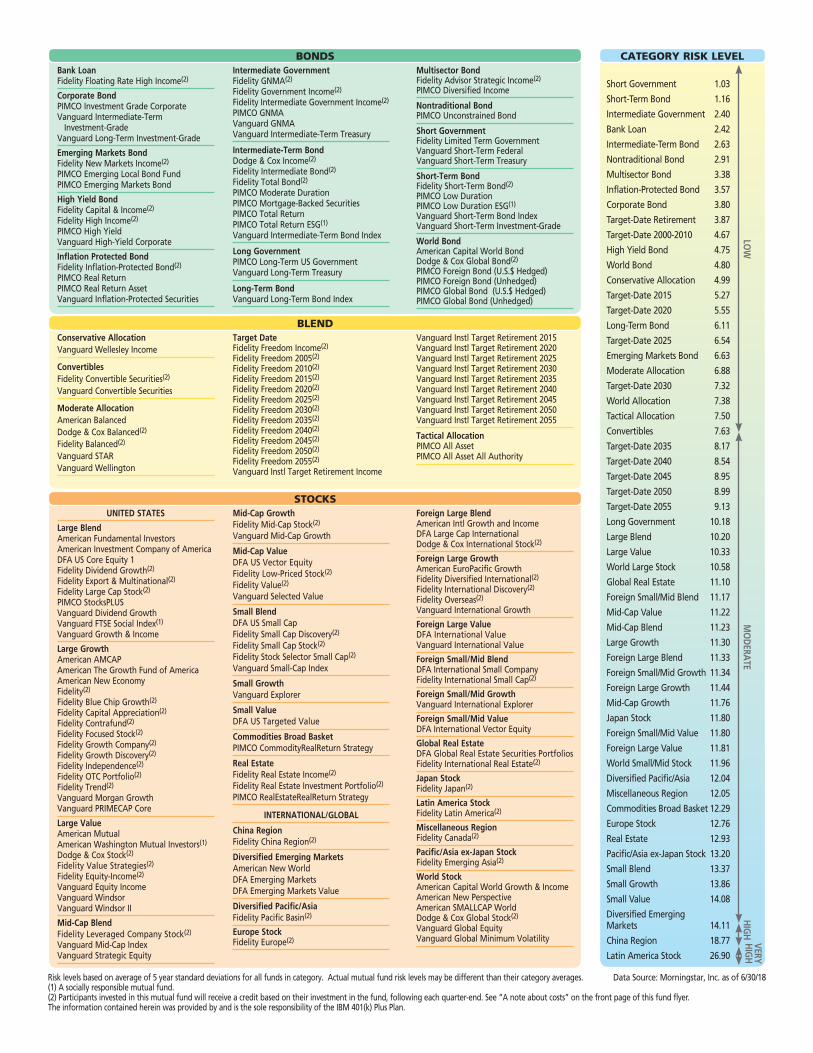
CATEGORY RISK LEVEL
Short Government 1.03
Short-Term Bond 1.16
Intermediate Government 2.40
Bank Loan 2.42
Intermediate-Term Bond 2.63
Nontraditional Bond 2.91
Multisector Bond 3.38
Inflation-Protected Bond 3.57
Corporate Bond 3.80
Target-Date Retirement 3.87
Target-Date 2000-2010 4.67
High Yield Bond 4.75
World Bond 4.80
Conservative Allocation 4.99
Target-Date 2015 5.27
Target-Date 2020 5.55
Long-Term Bond 6.11
Target-Date 2025 6.54
Emerging Markets Bond 6.63
Moderate Allocation 6.88
Target-Date 2030 7.32
World Allocation 7.38
Tactical Allocation 7.50
Convertibles 7.63
Target-Date 2035 8.17
Target-Date 2040 8.54
Target-Date 2045 8.95
Target-Date 2050 8.99
Target-Date 2055 9.13
Long Government 10.18
Large Blend 10.20
Large Value 10.33
World Large Stock 10.58
Global Real Estate 11.10
Foreign Small/Mid Blend 11.17
Mid-Cap Value 11.22
Mid-Cap Blend 11.23
Large Growth 11.30
Foreign Large Blend 11.33
Foreign Small/Mid Growth 11.34
Foreign Large Growth 11.44
Mid-Cap Growth 11.76
Japan Stock 11.80
Foreign Small/Mid Value 11.80
Foreign Large Value 11.81
World Small/Mid Stock 11.96
Diversified Pacific/Asia 12.04
Miscellaneous Region 12.05
Commodities Broad Basket 12.29
Europe Stock 12.76
Real Estate 12.93
Pacific/Asia ex-Japan Stock 13.20
Small Blend 13.37
Small Growth 13.86
Small Value 14.08
Diversified Emerging Markets 14.11
China Region 18.77
Latin America Stock 26.90
Risk levels based on average of 5 year standard deviations for all funds in category. Actual mutual fund risk levels may be different than their category averages.(1) A socially responsible mutual fund.(2) Participants invested in this mutual fund will receive a credit based on their investment in the fund, following each quarter-end. See “A note about costs” on the front page of this fund flyer.The information contained herein was provided by and is the sole responsibility of the IBM 401(k) Plus Plan.
Data Source: Morningstar, Inc. as of 6/30/18
Bank Loan Fidelity Floating Rate High Income(2)
Corporate Bond PIMCO Investment Grade Corporate Vanguard Intermediate-Term Investment-Grade Vanguard Long-Term Investment-Grade
Emerging Markets Bond Fidelity New Markets Income(2) PIMCO Emerging Local Bond Fund PIMCO Emerging Markets Bond
High Yield Bond Fidelity Capital & Income(2) Fidelity High Income(2) PIMCO High Yield Vanguard High-Yield Corporate
Inflation Protected Bond Fidelity Inflation-Protected Bond(2) PIMCO Real Return PIMCO Real Return Asset Vanguard Inflation-Protected Securities
Intermediate Government Fidelity GNMA(2) Fidelity Government Income(2) Fidelity Intermediate Government Income(2) PIMCO GNMA Vanguard GNMA Vanguard Intermediate-Term Treasury
Intermediate-Term Bond Dodge & Cox Income(2) Fidelity Intermediate Bond(2) Fidelity Total Bond(2) PIMCO Moderate Duration PIMCO Mortgage-Backed Securities PIMCO Total Return PIMCO Total Return ESG(1) Vanguard Intermediate-Term Bond Index
Long Government PIMCO Long-Term US Government Vanguard Long-Term Treasury
Long-Term Bond Vanguard Long-Term Bond Index
BONDS
UNITED STATES
Large Blend American Fundamental Investors American Investment Company of America DFA US Core Equity 1 Fidelity Dividend Growth(2) Fidelity Export & Multinational(2) Fidelity Large Cap Stock(2) PIMCO StocksPLUS Vanguard Dividend Growth Vanguard FTSE Social Index(1) Vanguard Growth & Income
Large Growth American AMCAP American The Growth Fund of America American New Economy Fidelity(2) Fidelity Blue Chip Growth(2) Fidelity Capital Appreciation(2) Fidelity Contrafund(2) Fidelity Focused Stock(2) Fidelity Growth Company(2) Fidelity Growth Discovery(2) Fidelity Independence(2) Fidelity OTC Portfolio(2) Fidelity Trend(2) Vanguard Morgan Growth Vanguard PRIMECAP Core
Large Value American Mutual American Washington Mutual Investors(1) Dodge & Cox Stock(2) Fidelity Value Strategies(2) Fidelity Equity-Income(2) Vanguard Equity Income Vanguard Windsor Vanguard Windsor II
Mid-Cap Blend Fidelity Leveraged Company Stock(2) Vanguard Mid-Cap Index Vanguard Strategic Equity
Mid-Cap Growth Fidelity Mid-Cap Stock(2) Vanguard Mid-Cap Growth
Mid-Cap Value DFA US Vector Equity Fidelity Low-Priced Stock(2) Fidelity Value(2) Vanguard Selected Value
Small Blend DFA US Small Cap Fidelity Small Cap Discovery(2) Fidelity Small Cap Stock(2) Fidelity Stock Selector Small Cap(2) Vanguard Small-Cap Index
Small Growth Vanguard Explorer
Small Value DFA US Targeted Value
Commodities Broad Basket PIMCO CommodityRealReturn Strategy
Real Estate Fidelity Real Estate Income(2) Fidelity Real Estate Investment Portfolio(2) PIMCO RealEstateRealReturn Strategy
INTERNATIONAL/GLOBAL
China Region Fidelity China Region(2)
Diversified Emerging Markets American New World DFA Emerging Markets DFA Emerging Markets Value
Diversified Pacific/Asia Fidelity Pacific Basin(2)
Europe Stock Fidelity Europe(2)
Foreign Large Blend American Intl Growth and Income DFA Large Cap International Dodge & Cox International Stock(2)
Foreign Large Growth American EuroPacific Growth Fidelity Diversified International(2) Fidelity International Discovery(2) Fidelity Overseas(2) Vanguard International Growth
Foreign Large Value DFA International Value Vanguard International Value
Foreign Small/Mid Blend DFA International Small Company
Fidelity International Small Cap(2)
Foreign Small/Mid Growth Vanguard International Explorer
Foreign Small/Mid Value DFA International Vector Equity
Global Real Estate DFA Global Real Estate Securities Portfolios Fidelity International Real Estate(2)
Japan Stock Fidelity Japan(2)
Latin America Stock Fidelity Latin America(2)
Miscellaneous Region Fidelity Canada(2)
Pacific/Asia ex-Japan Stock Fidelity Emerging Asia(2)
World Stock American Capital World Growth & Income American New Perspective American SMALLCAP World Dodge & Cox Global Stock(2) Vanguard Global Equity Vanguard Global Minimum Volatility
STOCKS
LO
W
MO
DERA
TE
HIG
HVERY H
IGH
BLENDConservative Allocation Vanguard Wellesley Income
Convertibles Fidelity Convertible Securities(2) Vanguard Convertible Securities
Moderate Allocation American Balanced Dodge & Cox Balanced(2) Fidelity Balanced(2) Vanguard STAR Vanguard Wellington
Target Date Fidelity Freedom Income(2) Fidelity Freedom 2005(2) Fidelity Freedom 2010(2) Fidelity Freedom 2015(2) Fidelity Freedom 2020(2) Fidelity Freedom 2025(2) Fidelity Freedom 2030(2) Fidelity Freedom 2035(2) Fidelity Freedom 2040(2) Fidelity Freedom 2045(2) Fidelity Freedom 2050(2) Fidelity Freedom 2055(2) Vanguard Instl Target Retirement Income
Vanguard Instl Target Retirement 2015 Vanguard Instl Target Retirement 2020 Vanguard Instl Target Retirement 2025 Vanguard Instl Target Retirement 2030 Vanguard Instl Target Retirement 2035 Vanguard Instl Target Retirement 2040 Vanguard Instl Target Retirement 2045 Vanguard Instl Target Retirement 2050 Vanguard Instl Target Retirement 2055
Tactical Allocation PIMCO All Asset
PIMCO All Asset All Authority
Multisector Bond Fidelity Advisor Strategic Income(2) PIMCO Diversified Income
Nontraditional Bond PIMCO Unconstrained Bond
Short Government Fidelity Limited Term Government Vanguard Short-Term Federal Vanguard Short-Term Treasury
Short-Term Bond Fidelity Short-Term Bond(2) PIMCO Low Duration PIMCO Low Duration ESG(1) Vanguard Short-Term Bond Index Vanguard Short-Term Investment-Grade
World Bond American Capital World Bond Dodge & Cox Global Bond(2) PIMCO Foreign Bond (U.S.$ Hedged) PIMCO Foreign Bond (Unhedged) PIMCO Global Bond (U.S.$ Hedged) PIMCO Global Bond (Unhedged)