40031-033: Rajasthan Urban Sector Development Investment ...Rajasthan Urban Sector Development...
80
Completion Report Project Number: 40031-033 Loan Number: 2506 June 2019 India: Rajasthan Urban Sector Development Investment Program (Tranche 2) This document is being disclosed to the public in accordance with ADB’s Access to Information Policy.
Transcript of 40031-033: Rajasthan Urban Sector Development Investment ...Rajasthan Urban Sector Development...

Completion Report
Project Number: 40031-033 Loan Number: 2506 June 2019
India: Rajasthan Urban Sector Development
Investment Program (Tranche 2) This document is being disclosed to the public in accordance with ADB’s Access to Information Policy.


CURRENCY EQUIVALENTS
Currency unit – Indian rupee/s (₹)
At Appraisal At Project Completion
13 August 2008 30 June 2017 ₹1.00 = $0.0236 $0.0154 $1.00 = ₹42.375 ₹64.785
ABBREVIATIONS
ADB – Asian Development Bank CAPP – community action and participation program CFC – Central Finance Commissions CTO – consent to operate DMF – design and monitoring framework DSC – design and construction supervision consultant EIRR – economic internal rate of return EMMP – environmental monitoring and management plan GOR – Government of Rajasthan IEE – initial environmental examination IPIU – investment program implementation unit IPMC – investment program management consultant IPMU – investment program management unit IPPMS – investment program performance and management system MFF – multitranche financing facility O&M – operation and maintenance PHED – Public Health Engineering Department PWD – Public Works Department ROB – rail over bridge RUSDIP – Rajasthan Urban Sector Development Project SFC – State Finance Commission SOE – statement of expenditure STP – sewage treatment plant SWM – solid waste management UFW – unaccounted-for water ULB – urban local body WTP – water treatment plant
WEIGHTS AND MEASURES
km – kilometer lpcd – liters per capita per day m – meter mld – million liters per day

NOTES
(i) The fiscal year (FY) of the Government of India ends on 31 March. FY before a calendar year denotes the year in which the fiscal year ends, e.g., FY2019 ends on 31 March 2019.
(ii) In this report, “$” refers to United States dollars.
Vice-President Shixin Chen, Operations 1 Director General Hun Kim, South Asia Department (SARD) Director Kenichi Yokoyama, India Resident Mission, SARD Team leader Pushkar Srivastava, Senior Project Officer, SARD Team members Bhawna Kulshreshtha, Executive Assistant, SARD
Girish Mahajan, Senior Environment Officer, SARD Suhail Mircha, Safeguard Officer, SARD
In preparing any country program or strategy, financing any project, or by making any designation of or reference to a particular territory or geographic area in this document, the Asian Development Bank does not intend to make any judgments as to the legal or other status of any territory or area.
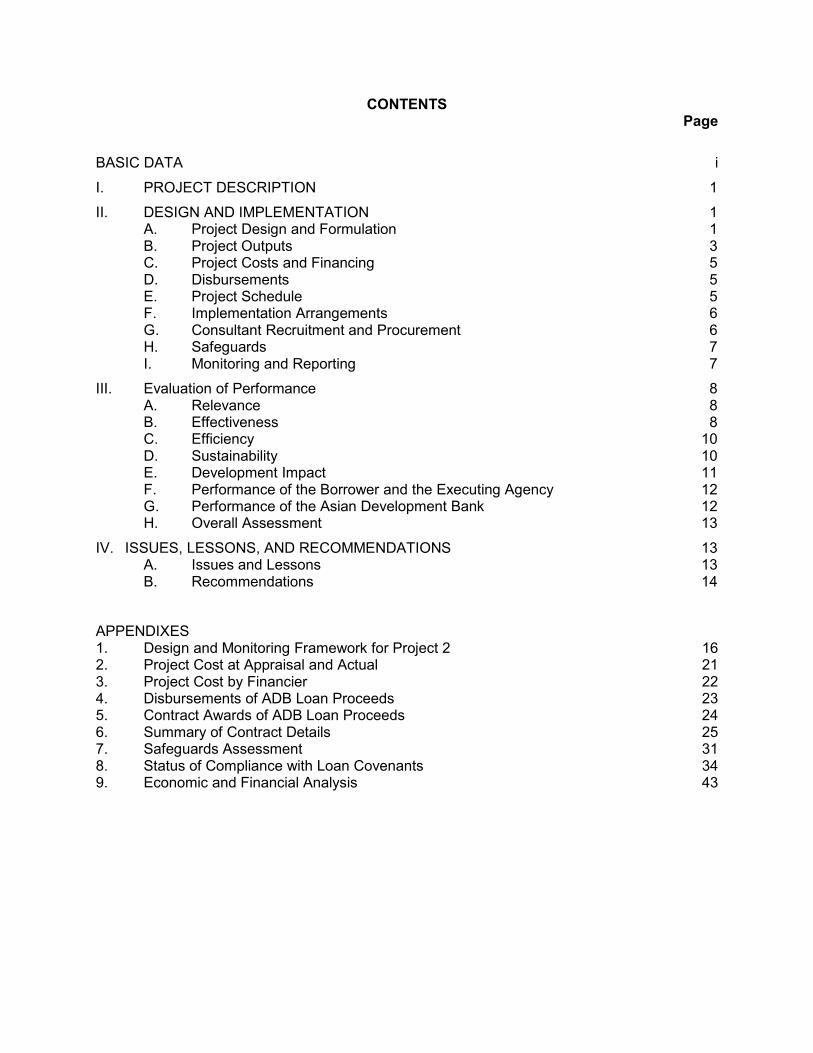
CONTENTS Page
BASIC DATA i
I. PROJECT DESCRIPTION 1
II. DESIGN AND IMPLEMENTATION 1 A. Project Design and Formulation 1 B. Project Outputs 3 C. Project Costs and Financing 5 D. Disbursements 5 E. Project Schedule 5 F. Implementation Arrangements 6 G. Consultant Recruitment and Procurement 6 H. Safeguards 7 I. Monitoring and Reporting 7
III. Evaluation of Performance 8 A. Relevance 8 B. Effectiveness 8 C. Efficiency 10 D. Sustainability 10 E. Development Impact 11 F. Performance of the Borrower and the Executing Agency 12 G. Performance of the Asian Development Bank 12 H. Overall Assessment 13
IV. ISSUES, LESSONS, AND RECOMMENDATIONS 13 A. Issues and Lessons 13 B. Recommendations 14
APPENDIXES 1. Design and Monitoring Framework for Project 2 16 2. Project Cost at Appraisal and Actual 21 3. Project Cost by Financier 22 4. Disbursements of ADB Loan Proceeds 23 5. Contract Awards of ADB Loan Proceeds 24 6. Summary of Contract Details 25 7. Safeguards Assessment 31 8. Status of Compliance with Loan Covenants 34 9. Economic and Financial Analysis 43


BASIC DATA A. Loan Identification 1. Country 2. Loan number and financing source 3. Project title 4. Borrower 5. Executing agency 6. Amount of loan 7. Financing modality
India 2506, ordinary capital resources Rajasthan Urban Sector Development Investment Program (Tranche 2) India Local Self Government Department, Government of Rajasthan $150 million Multitranche financing facility
B. Loan Data 1. Appraisal – Date started – Date completed 2. Loan negotiations – Date started – Date completed 3. Date of Board approval 4. Date of loan agreement 5. Date of loan effectiveness – In loan agreement – Actual – Number of extensions 6. Project completion date – Appraisal – Actual 7. Loan closing date – In loan agreement
– Actual – Number of extensions 8. Financial closing date – Actual 9. Terms of loan –Interest rate – Maturity (number of years) – Grace period (number of years)
25 July 2008 13 August 2008 2 December 2008 3 December 2008 19 January 2009 18 February 2009 19 May 2009 20 April 2009 None 31 December 2013 30 June 2017 30 June 2014 30 June 2017 4 29 November 2017 London interbank offered rate (LIBOR)-based (floating) + 0.60% 25 5
ii
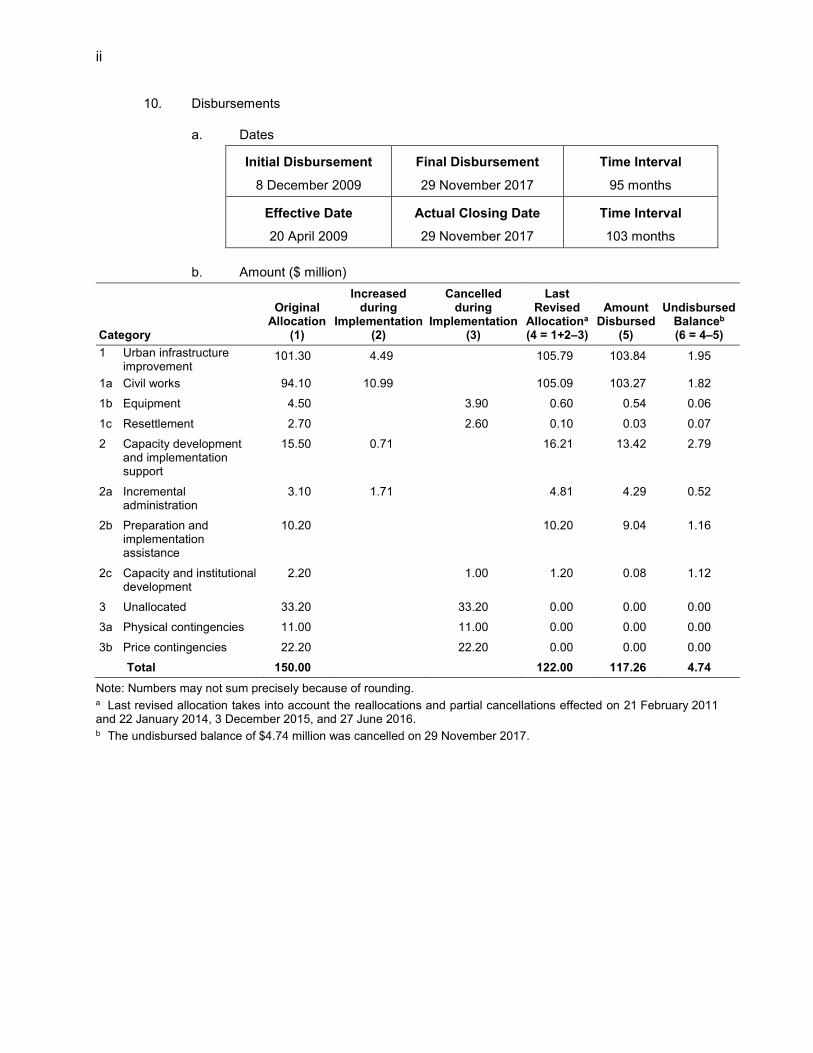
10. Disbursements
a. Dates
Initial Disbursement
8 December 2009
Final Disbursement
29 November 2017
Time Interval
95 months
Effective Date
20 April 2009
Actual Closing Date
29 November 2017
Time Interval
103 months
b. Amount ($ million)
Category
Original Allocation
(1)
Increased during
Implementation (2)
Cancelled during
Implementation (3)
Last Revised
Allocationa (4 = 1+2–3)
Amount Disbursed
(5)
Undisbursed Balanceb (6 = 4–5)
1 Urban infrastructure improvement
101.30 4.49 105.79 103.84 1.95
1a Civil works 94.10 10.99 105.09 103.27 1.82
1b Equipment 4.50 3.90 0.60 0.54 0.06
1c Resettlement 2.70 2.60 0.10 0.03 0.07
2 Capacity development and implementation support
15.50 0.71 16.21 13.42 2.79
2a Incremental administration
3.10 1.71 4.81 4.29 0.52
2b Preparation and implementation assistance
10.20 10.20 9.04 1.16
2c Capacity and institutional development
2.20 1.00 1.20 0.08 1.12
3 Unallocated 33.20 33.20 0.00 0.00 0.00
3a Physical contingencies 11.00 11.00 0.00 0.00 0.00
3b Price contingencies 22.20 22.20 0.00 0.00 0.00
Total 150.00 122.00 117.26 4.74
Note: Numbers may not sum precisely because of rounding. a Last revised allocation takes into account the reallocations and partial cancellations effected on 21 February 2011 and 22 January 2014, 3 December 2015, and 27 June 2016. b The undisbursed balance of $4.74 million was cancelled on 29 November 2017.
iii
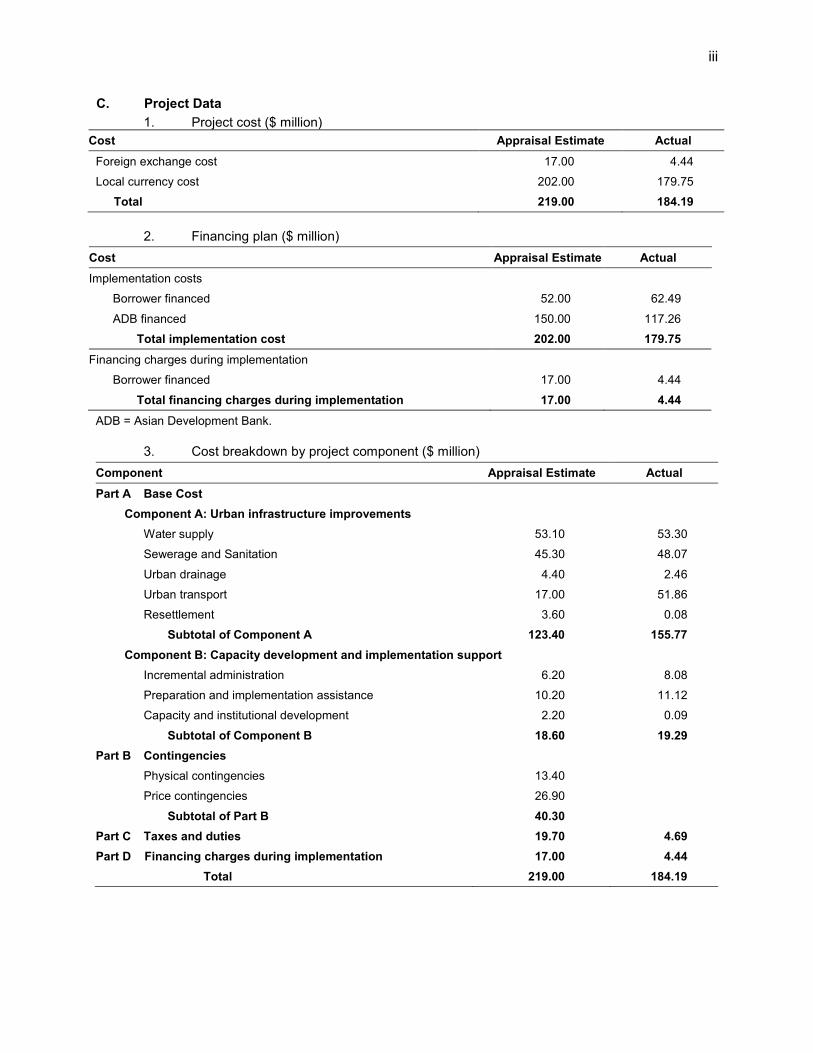
C. Project Data
1. Project cost ($ million)
Cost Appraisal Estimate Actual
Foreign exchange cost 17.00 4.44
Local currency cost 202.00 179.75
Total 219.00 184.19
2. Financing plan ($ million)
Cost Appraisal Estimate Actual
Implementation costs
Borrower financed 52.00 62.49
ADB financed 150.00 117.26
Total implementation cost 202.00 179.75
Financing charges during implementation
Borrower financed 17.00 4.44
Total financing charges during implementation 17.00 4.44
ADB = Asian Development Bank.
3. Cost breakdown by project component ($ million)
Component Appraisal Estimate Actual
Part A Base Cost
Component A: Urban infrastructure improvements
Water supply 53.10 53.30
Sewerage and Sanitation 45.30 48.07
Urban drainage 4.40 2.46
Urban transport 17.00 51.86
Resettlement 3.60 0.08
Subtotal of Component A 123.40 155.77
Component B: Capacity development and implementation support
Incremental administration 6.20 8.08
Preparation and implementation assistance 10.20 11.12
Capacity and institutional development 2.20 0.09
Subtotal of Component B 18.60 19.29
Part B Contingencies
Physical contingencies 13.40
Price contingencies 26.90
Subtotal of Part B 40.30
Part C Taxes and duties 19.70 4.69
Part D Financing charges during implementation 17.00 4.44
Total 219.00 184.19

iv
4. Project Schedule
Item Appraisal Estimate Actual
Date of contract with consultants
Investment program management consultant Continued from project 1 20 April 2009
Design and supervision consultant-I Continued from project 1 20 April 2009
Design and supervision consultant-II Continued from project 1 20 April 2009
Design and supervision consultant-II Continued from project 1 20 April 2009
Investment program performance monitoring system consultant Continued from project 1 20 April 2009
Completion of Engineering Designs 31 March 2009 31 March 2014
Civil works contracts
Date of award 1 April 2008 6 July 2009
Completion of work 31 December 2012 30 June 2017
Equipment and supplies
Dates
First procurement 1 April 2008 11 July 2012
Last procurement 31 December 2010 11 July 2012
Completion of equipment installation 30 September 2011 31 December 2012
Start of operations
Completion of tests and commissioning 31 December 2011 31 March 2013
Beginning of start-up 1 January 2012 1 July 2012
5. Project Performance Report Ratings
Implementation Period
Ratings
Development Objectives Implementation Progress
From 30 Jan 2009 to 31 December 2009 Satisfactory Satisfactory
From 1 Jan 2010 to 31 December 2010 Not available Not available
From 1 Jan 2011 to 31 March 2011 Not available Not available
Single Project Rating
From 1 April to 30 June 2011 On track
From 1 July to 31 December 2011 Potential problem
From 1 January to 30 June 2012 Potential problem
From 1 July to 31 December 2012 On track
From 1 January to 31 December 2012 On track
From 1 January to 31 December 2013 On track
From 1 January to 31 December 2014 On track
From 1 January to 31 December 2015 On track
From 1 January to 31 December 2016 On track
From 1 January to 30 June 2017 On track

v
D. Data on Asian Development Bank Missions
Name of Mission Date No. of
Persons No. of
Person-Days Specialization of
Members
Loan appraisal 24 Jul–12 Aug 2008 10 139 a, b, c, d, e, f, g, h, i, j
Loan review 3–11 Nov 2009 3 21 a, k, l
Loan review 9–15 July 2010 2 12 f, k
Loan review 9–13 Aug 2010 1 4 f
Loan review 16–20 Aug 2011 2 8 m, k
Training and capacity building mission 19–20 Aug 2011 4 8 l, n, o, p
Loan review 29 Aug–2 Sep 2011 2 8 q, r
Loan review 10–14 Oct 2011 2 10 q, r
Safeguard review mission 19–22 Nov 2011 1 4 s
Loan review 28 Nov–5 Dec 2011 2 14 q, r
Special project administration 12–13 Jul 2012 2 4 m, k
Disbursement mission 3–7 Sep 2012 2 10 t, u
Safeguard review mission 4–7 Sep 2012 2 8 q, r
Loan review 29 Nov–5 Dec 2012 3 17 m, c, v
Special project administration 23–31 Jan 2013 3 18 m, c, v
Midterm review 28 Feb–8 Mar 2013 3 18 m, c, s
Special project administration 16–26 Sep 2013 2 10 m, v
Special project administration 4–6 Jun 2014 2 6 m, v
Loan review 1–5 Sep 2014 3 15 m, w, v
Loan review 10–14 Nov 2014 3 15 m, w, v
Loan review 22–27 Apr 2015 3 12 m, w, v
Special project administration 30 Sep–1 Oct 2015 2 4 m, x
Special project administration 2–3 Dec 2015 2 4 m, v
Special project administration 18–29 Feb 2016 2 16 y, z
Loan review 23 Feb–3 Mar 2016 6 36 m, w, aa, ab, ac, x
Loan review 13–14 Jul 2016 2 4 m, ad
Loan review 29 Aug–9 Sep 2016 3 18 m, ab, ad
Review mission 28–30 Jun 2017 2 6 m, ad
Project completion review 17–21 Dec 2018 4 20 m, ad, ae, af
Project completion review 11–15 Feb 2019 4 20 m, ad, ae, af
Project completion review 2–4 Apr 2019 6 18 m, ad, ae, af, ab, ag
a = urban development specialist/mission leader, south Asia urban development division; b = senior counsel, office of general counsel; c = safeguard specialist; d = urban development specialist, south Asia urban development division; e = urban economist, south Asia urban development division; f = project implementation officer, India resident mission; g = project management specialist (staff consultant); h = senior engineer (staff consultant); i = finance specialist (staff consultant); j = environmental specialist (staff consultant); k = assistant project analyst; l = climate change specialist; m = senior project officer (urban); n = capacity development technical advisor; o = capacity development expert; p = capacity development consultant; q = senior safeguards officer; r = senior environmental officer; s = environmental specialist; t = financial control officer; u = associate financial control analyst; v = associate project officer (urban); w = senior safeguards specialist; x = gender consultant; y = operations communications specialist; z = south Asia operation division officer; aa = associate project analyst; ab = social safeguard officer; ac = environmental consultant; ad = project analyst (consultant); ae = consultant, urban development; af = consultant, finance and economics; ag = associate environment officer.

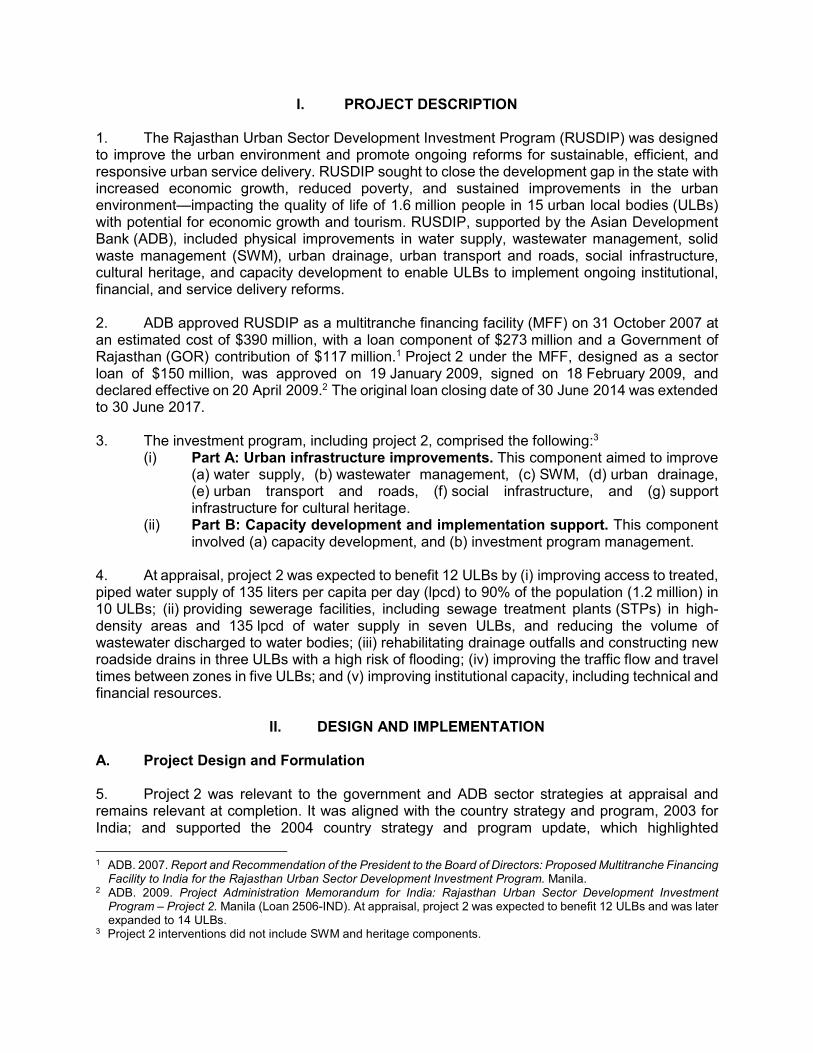
I. PROJECT DESCRIPTION 1. The Rajasthan Urban Sector Development Investment Program (RUSDIP) was designed to improve the urban environment and promote ongoing reforms for sustainable, efficient, and responsive urban service delivery. RUSDIP sought to close the development gap in the state with increased economic growth, reduced poverty, and sustained improvements in the urban environment—impacting the quality of life of 1.6 million people in 15 urban local bodies (ULBs) with potential for economic growth and tourism. RUSDIP, supported by the Asian Development Bank (ADB), included physical improvements in water supply, wastewater management, solid waste management (SWM), urban drainage, urban transport and roads, social infrastructure, cultural heritage, and capacity development to enable ULBs to implement ongoing institutional, financial, and service delivery reforms. 2. ADB approved RUSDIP as a multitranche financing facility (MFF) on 31 October 2007 at an estimated cost of $390 million, with a loan component of $273 million and a Government of Rajasthan (GOR) contribution of $117 million.1 Project 2 under the MFF, designed as a sector loan of $150 million, was approved on 19 January 2009, signed on 18 February 2009, and declared effective on 20 April 2009.2 The original loan closing date of 30 June 2014 was extended to 30 June 2017. 3. The investment program, including project 2, comprised the following:3
(i) Part A: Urban infrastructure improvements. This component aimed to improve (a) water supply, (b) wastewater management, (c) SWM, (d) urban drainage, (e) urban transport and roads, (f) social infrastructure, and (g) support infrastructure for cultural heritage.
(ii) Part B: Capacity development and implementation support. This component involved (a) capacity development, and (b) investment program management.
4. At appraisal, project 2 was expected to benefit 12 ULBs by (i) improving access to treated, piped water supply of 135 liters per capita per day (lpcd) to 90% of the population (1.2 million) in 10 ULBs; (ii) providing sewerage facilities, including sewage treatment plants (STPs) in high-density areas and 135 lpcd of water supply in seven ULBs, and reducing the volume of wastewater discharged to water bodies; (iii) rehabilitating drainage outfalls and constructing new roadside drains in three ULBs with a high risk of flooding; (iv) improving the traffic flow and travel times between zones in five ULBs; and (v) improving institutional capacity, including technical and financial resources.
II. DESIGN AND IMPLEMENTATION A. Project Design and Formulation 5. Project 2 was relevant to the government and ADB sector strategies at appraisal and remains relevant at completion. It was aligned with the country strategy and program, 2003 for India; and supported the 2004 country strategy and program update, which highlighted
1 ADB. 2007. Report and Recommendation of the President to the Board of Directors: Proposed Multitranche Financing
Facility to India for the Rajasthan Urban Sector Development Investment Program. Manila. 2 ADB. 2009. Project Administration Memorandum for India: Rajasthan Urban Sector Development Investment
Program – Project 2. Manila (Loan 2506-IND). At appraisal, project 2 was expected to benefit 12 ULBs and was later expanded to 14 ULBs.
3 Project 2 interventions did not include SWM and heritage components.
2
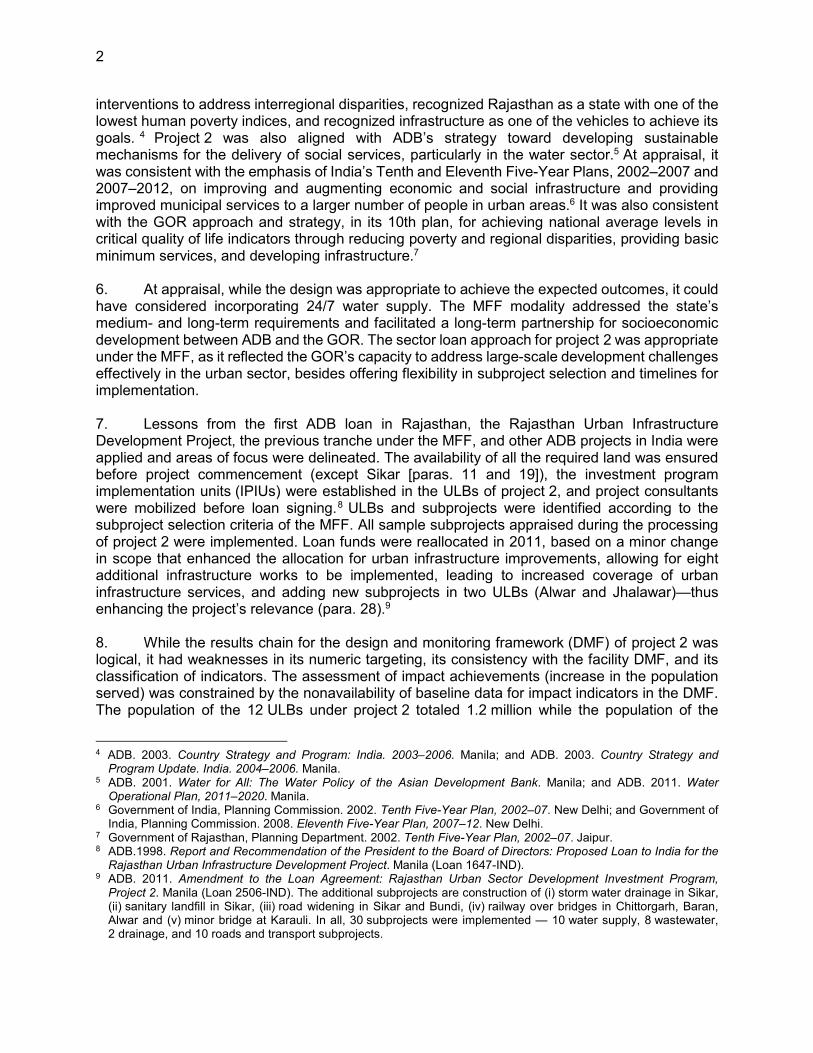
interventions to address interregional disparities, recognized Rajasthan as a state with one of the lowest human poverty indices, and recognized infrastructure as one of the vehicles to achieve its goals. 4 Project 2 was also aligned with ADB’s strategy toward developing sustainable mechanisms for the delivery of social services, particularly in the water sector.5 At appraisal, it was consistent with the emphasis of India’s Tenth and Eleventh Five-Year Plans, 2002–2007 and 2007–2012, on improving and augmenting economic and social infrastructure and providing improved municipal services to a larger number of people in urban areas.6 It was also consistent with the GOR approach and strategy, in its 10th plan, for achieving national average levels in critical quality of life indicators through reducing poverty and regional disparities, providing basic minimum services, and developing infrastructure.7 6. At appraisal, while the design was appropriate to achieve the expected outcomes, it could have considered incorporating 24/7 water supply. The MFF modality addressed the state’s medium- and long-term requirements and facilitated a long-term partnership for socioeconomic development between ADB and the GOR. The sector loan approach for project 2 was appropriate under the MFF, as it reflected the GOR’s capacity to address large-scale development challenges effectively in the urban sector, besides offering flexibility in subproject selection and timelines for implementation. 7. Lessons from the first ADB loan in Rajasthan, the Rajasthan Urban Infrastructure Development Project, the previous tranche under the MFF, and other ADB projects in India were applied and areas of focus were delineated. The availability of all the required land was ensured before project commencement (except Sikar [paras. 11 and 19]), the investment program implementation units (IPIUs) were established in the ULBs of project 2, and project consultants were mobilized before loan signing.8 ULBs and subprojects were identified according to the subproject selection criteria of the MFF. All sample subprojects appraised during the processing of project 2 were implemented. Loan funds were reallocated in 2011, based on a minor change in scope that enhanced the allocation for urban infrastructure improvements, allowing for eight additional infrastructure works to be implemented, leading to increased coverage of urban infrastructure services, and adding new subprojects in two ULBs (Alwar and Jhalawar)—thus enhancing the project’s relevance (para. 28).9 8. While the results chain for the design and monitoring framework (DMF) of project 2 was logical, it had weaknesses in its numeric targeting, its consistency with the facility DMF, and its classification of indicators. The assessment of impact achievements (increase in the population served) was constrained by the nonavailability of baseline data for impact indicators in the DMF. The population of the 12 ULBs under project 2 totaled 1.2 million while the population of the
4 ADB. 2003. Country Strategy and Program: India. 2003–2006. Manila; and ADB. 2003. Country Strategy and
Program Update. India. 2004–2006. Manila. 5 ADB. 2001. Water for All: The Water Policy of the Asian Development Bank. Manila; and ADB. 2011. Water
Operational Plan, 2011–2020. Manila. 6 Government of India, Planning Commission. 2002. Tenth Five-Year Plan, 2002–07. New Delhi; and Government of
India, Planning Commission. 2008. Eleventh Five-Year Plan, 2007–12. New Delhi. 7 Government of Rajasthan, Planning Department. 2002. Tenth Five-Year Plan, 2002–07. Jaipur. 8 ADB.1998. Report and Recommendation of the President to the Board of Directors: Proposed Loan to India for the
Rajasthan Urban Infrastructure Development Project. Manila (Loan 1647-IND). 9 ADB. 2011. Amendment to the Loan Agreement: Rajasthan Urban Sector Development Investment Program,
Project 2. Manila (Loan 2506-IND). The additional subprojects are construction of (i) storm water drainage in Sikar, (ii) sanitary landfill in Sikar, (iii) road widening in Sikar and Bundi, (iv) railway over bridges in Chittorgarh, Baran, Alwar and (v) minor bridge at Karauli. In all, 30 subprojects were implemented — 10 water supply, 8 wastewater, 2 drainage, and 10 roads and transport subprojects.
3
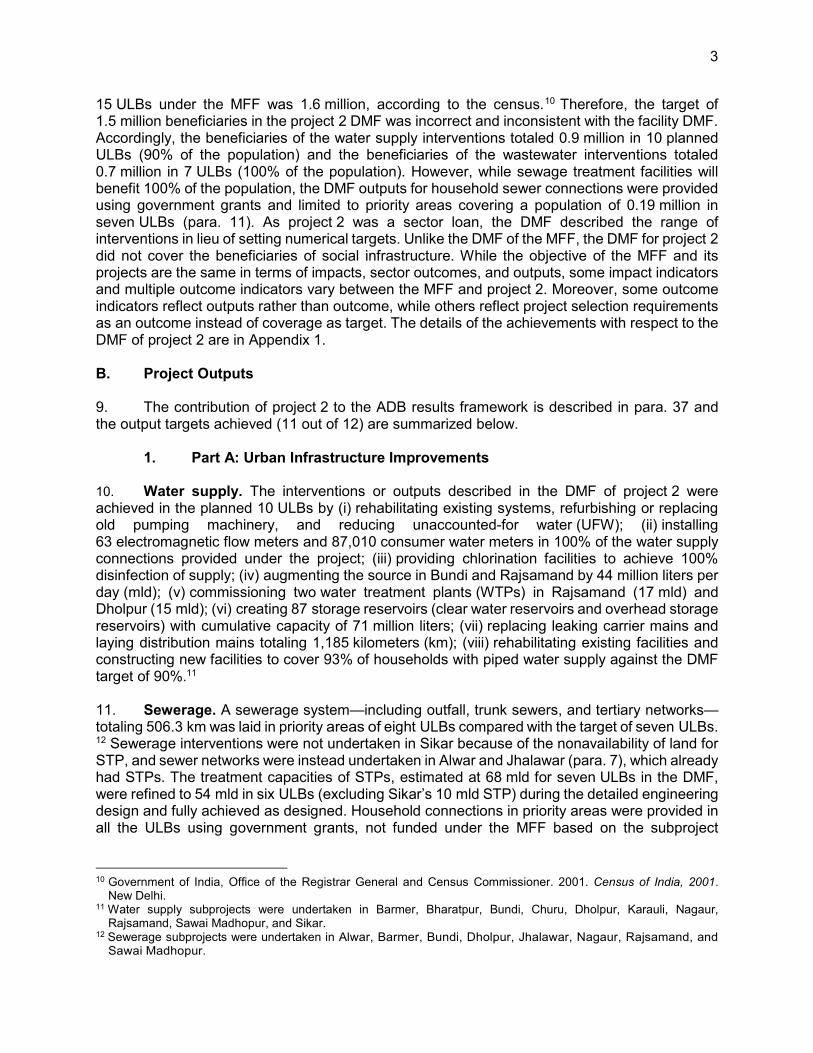
15 ULBs under the MFF was 1.6 million, according to the census.10 Therefore, the target of 1.5 million beneficiaries in the project 2 DMF was incorrect and inconsistent with the facility DMF. Accordingly, the beneficiaries of the water supply interventions totaled 0.9 million in 10 planned ULBs (90% of the population) and the beneficiaries of the wastewater interventions totaled 0.7 million in 7 ULBs (100% of the population). However, while sewage treatment facilities will benefit 100% of the population, the DMF outputs for household sewer connections were provided using government grants and limited to priority areas covering a population of 0.19 million in seven ULBs (para. 11). As project 2 was a sector loan, the DMF described the range of interventions in lieu of setting numerical targets. Unlike the DMF of the MFF, the DMF for project 2 did not cover the beneficiaries of social infrastructure. While the objective of the MFF and its projects are the same in terms of impacts, sector outcomes, and outputs, some impact indicators and multiple outcome indicators vary between the MFF and project 2. Moreover, some outcome indicators reflect outputs rather than outcome, while others reflect project selection requirements as an outcome instead of coverage as target. The details of the achievements with respect to the DMF of project 2 are in Appendix 1. B. Project Outputs 9. The contribution of project 2 to the ADB results framework is described in para. 37 and the output targets achieved (11 out of 12) are summarized below.
1. Part A: Urban Infrastructure Improvements 10. Water supply. The interventions or outputs described in the DMF of project 2 were achieved in the planned 10 ULBs by (i) rehabilitating existing systems, refurbishing or replacing old pumping machinery, and reducing unaccounted-for water (UFW); (ii) installing 63 electromagnetic flow meters and 87,010 consumer water meters in 100% of the water supply connections provided under the project; (iii) providing chlorination facilities to achieve 100% disinfection of supply; (iv) augmenting the source in Bundi and Rajsamand by 44 million liters per day (mld); (v) commissioning two water treatment plants (WTPs) in Rajsamand (17 mld) and Dholpur (15 mld); (vi) creating 87 storage reservoirs (clear water reservoirs and overhead storage reservoirs) with cumulative capacity of 71 million liters; (vii) replacing leaking carrier mains and laying distribution mains totaling 1,185 kilometers (km); (viii) rehabilitating existing facilities and constructing new facilities to cover 93% of households with piped water supply against the DMF target of 90%.11
11. Sewerage. A sewerage system—including outfall, trunk sewers, and tertiary networks—totaling 506.3 km was laid in priority areas of eight ULBs compared with the target of seven ULBs. 12 Sewerage interventions were not undertaken in Sikar because of the nonavailability of land for STP, and sewer networks were instead undertaken in Alwar and Jhalawar (para. 7), which already had STPs. The treatment capacities of STPs, estimated at 68 mld for seven ULBs in the DMF, were refined to 54 mld in six ULBs (excluding Sikar’s 10 mld STP) during the detailed engineering design and fully achieved as designed. Household connections in priority areas were provided in all the ULBs using government grants, not funded under the MFF based on the subproject
10 Government of India, Office of the Registrar General and Census Commissioner. 2001. Census of India, 2001.
New Delhi. 11 Water supply subprojects were undertaken in Barmer, Bharatpur, Bundi, Churu, Dholpur, Karauli, Nagaur,
Rajsamand, Sawai Madhopur, and Sikar. 12 Sewerage subprojects were undertaken in Alwar, Barmer, Bundi, Dholpur, Jhalawar, Nagaur, Rajsamand, and
Sawai Madhopur.

4
selection criteria. Vehicle mounted sewer-suction-cum-jetting machines and sewer-jetting machines were also provided to 12 ULBs. 12. Urban drainage. Drainage master plans were prepared for Baran, Bharatpur, and Sikar. Based on these plans, drainage outfalls and stormwater drains totaling 11.8 km were rehabilitated or constructed to facilitate stormwater runoff. In addition, 15.7 km of roadside drains were constructed in Bundi. Drainage interventions were not undertaken in Baran based on the assessed risks of flooding. 13. Urban roads and transport. The output targets were fully achieved as planned—two-lane road over bridges (ROBs) were constructed in six ULBs (against a target of four ROBs in four ULBs) and two bridges over river were constructed in one ULB. Additionally, 75.1 km of roads were strengthened in four ULBs. 14. Social infrastructure. While the DMF did not define social infrastructure outputs, project 2 interventions provided 0.15 million people living in identified slums in 14 ULBs with access to improved basic urban services, including water supply and sanitation infrastructure—improving the living conditions of the poor and vulnerable.
2. Part B: Capacity Development and Implementation Support 15. Capacity development. A structured institutional and capacity development plan (ICDP) for all program ULBs and concerned state-level bodies was developed based on a detailed study identifying the gaps and measures required for strengthening the institutional structure. Actions under the plan included the use of contractual staff for municipal services such as SWM and urban drainage, and the use of contractors to manage the STPs through provisions for operation and maintenance (O&M) embedded in their contracts—resulting in more effective allocation of human resources. More than 650 trainings were provided to the staff of program ULBs and state-level bodies in municipal services on topics such as responsive grievance redressal, construction management, safeguards, gender mainstreaming, O&M of municipal services, asset management, financial management, urban governance, and service delivery. The assets and responsibilities of sewerage systems were handed over to program ULBs. A sustainable user charge structure was implemented for water supply services across the state and is being levied incrementally for sewerage as and when households are provided with sewer connections. The fee for door-to-door waste collection services, provided to nearly 100% of the population, does not accrue to the program ULBs but to the outsourced agencies. 16. Implementation support. The investment program management consultant (IPMC) and three design and supervision consultants (DSCs) supported program implementation by preparing the design documents, managing the bidding process, and supervising the construction works. The IPMC provided technical support to the investment program management unit (IPMU) in managing contracts, monitoring safeguards, and preparing progress reports. The 15 program ULBs were divided into three groups of five program ULBs, based on their geographical location, and a group was allotted to each of the three DSCs. The community action and participation program (CAPP) consultants delivered information, education, and communication program; assisted in implementing the ICDP; and contributed to the improved acceptability of sewerage services by the residents. Social acceptance of paid sewerage services and community mobilization for SWM were achieved under the CAPP. The investment program performance and management system (IPPMS) consultants monitored program implementation at the baseline, midterm, and end-term.

5
C. Project Costs and Financing 17. The estimated project cost at appraisal was $219.00 million, comprising an ADB loan of $150.00 million and GOR contribution of $69.00 million. At completion, the actual project cost reduced to $184.19 million, without curtailment of the project outcomes or outputs, comprising an ADB loan of $117.26 million and GOR contribution of $66.93 million. Financing charges decreased by $12.56 million because of lower interest rates. Loan savings resulting from the appreciation of the United States dollar and overestimation of contingencies were leveraged to increase the allocation for civil works from $94.10 million to $103.27 million for expanding coverage, adding new subprojects and ULBs (para. 7), and meeting marginal cost overruns in a few contracts. The extended implementation period (36 months) increased the cost of incremental administration by $1.19 million. Costs decreased by (i) $3.96 million for SWM equipment because of the deferment of procurement to project 3, (ii) $2.67 million for resettlement because of the avoidance of social impacts and use of counterpart funds, (iii) $2.12 million for capacity and institutional development as state training resources were used, and (iv) $1.16 million for preparation and implementation assistance. A total of $28.00 million was cancelled and $4.74 million remained unused at loan closing.13 The ratio of the ADB loan to GOR contribution changed from 70:30 at appraisal to 64:36 at completion. Appendix 2 details the project cost at appraisal and actual. Appendix 3 provides the project cost by financier. D. Disbursements 18. A total of $117.2 million (96% of the revised loan amount of $122.0 million) was disbursed by project completion. Loan disbursements were on track from the first disbursement on 8 December 2009, evenly spread out (11% to 19% per year) from 2010 to 2015, and reached 68% of the revised loan amount by the end of the original loan closing date (88% by 2015). This included an imprest advance of $15.00 million, which the GOR availed of in 2010. Following the GOR’s decision to make payments through Treasury procedures, the imprest account was liquidated against claims from the third quarter of 2012 to the first quarter of 2013. Contract award and disbursement achievements fell below 90% of projections from July 2011 to June 2012, resulting in a potential problem project rating for the period. Appendix 4 and Appendix 5 provides the annual and cumulative disbursements and contract awards of the loan proceeds. The statement of expenditure (SOE) procedure allowed up to $100,000 equivalent per individual payment, which could have been enhanced considering the capacity of the IPMU. E. Project Schedule 19. The original loan closing date of 30 June 2014 was extended twice by 1 year each, followed by another two extensions of 6 months each (i) to optimize loan utilization by awarding additional contracts (in 2013 and 2014) to use the additional funds available as a result of the appreciation of the United States dollar, (ii) to enable the completion of works, and (iii) to complete re-tendered and slow-moving contracts. The project had no significant start-up delays, which reflects the state’s preparedness at appraisal, as requisite lands were identified for STPs (except Sikar [paras. 7 and 11]) and other facilities, permission was obtained from the concerned authorities for bridges over river, and detailed project reports were prepared. IPMU’s capacity for implementation and interdepartmental coordination led to the smooth execution of utility shifting and timely issuance of necessary permissions and clearances. However, contract duration affixed for water supply and wastewater works was ambitious considering that works were in existing
13 Partial loan cancellations were made as follows: $18.70 million on 6 August 2013, $7.09 million on 3 December 2015,
and $2.21 million on 27 June 2016. This reduced the net loan amount to $122.00 million.

6
unplanned towns and needed to be executed without undue disruption to service delivery and traffic movement or public inconvenience (para. 22). By loan closure on 30 June 2017, only six of the 57 contracts were ongoing and these were completed using GOR funds (paras. 22 and 38). All contracts were completed at the time of the project completion report mission (Appendix 6). F. Implementation Arrangements 20. The project’s implementation arrangements proved appropriate to achieve the envisaged outputs. The arrangements comprised the Local Self Government Department, GOR as the executing agency; a state-level and interministerial empowered committee; a works finalization committee chaired by the principal secretary for urban governance; the IPMU as the implementing agency for RUSDIP headed by the project director; IPIUs in each project town; and city-level committees, which also functioned as grievance redress committees, chaired by district collectors. The IPMU and IPIUs were assisted by the IPMC, three DSCs, the CAPP, and IPPMS consultants (para. 16). The project assets, once developed, were handed over to line agencies and ULBs for O&M, including the management of extant O&M contracts. Water supply assets are managed by the public Health Engineering Department (PHED) while major roads and transport assets are managed by the Public Works Department (PWD). ULBs manage wastewater, drainage, internal municipal roads and streetlights, and SWM. G. Consultant Recruitment and Procurement 21. Consultants recruited under project 1 following the quality- and cost-based selection procedure and ADB’s Guidelines on the Use of Consultants (2007, as amended from time to time) continued for the subsequent tranches. The IPMU was familiar with ADB procedures for the procurement of civil works and goods and conformed to ADB’s Procurement Guidelines (2007, as amended from time to time). Standard bid documents prepared under project 1 for the procurement of civil works and goods were used in the MFF, leading to standardization and quality control. In October 2012, ADB assessed and approved the GOR e-portal for contracts procured following national competitive bidding and shopping methods under the MFF. Procurement activities were executed smoothly and were among the IPMU’s core strengths. End-to-end e-procurement and contract management systems would have further strengthened IPMU’s capacity. Cumulative contract awards exceeded annual projections throughout the loan period. 22. The overall performance of the consultants is rated generally satisfactory. The performance of the IPMC and DSCs was satisfactory. The performance of the DSCs was initially hampered by slow internal mobilization and frequent replacement of team members, leading to some delays in the planning, design, and implementation of the project. Close monitoring of DSCs and the removal of a few nonperforming DSC personnel by the IPMU led to optimal utilization of the DSC services and improved delivery of outputs by DSCs. The performance of the IPPMS consulting firm engaged to prepare baseline, midterm, and end-term project performance monitoring reports was less than satisfactory and had to be terminated. Following the termination, the performance of the consulting firm appointed to complete the remaining tasks was rated satisfactory. Overall, the performance of the contractors is rated satisfactory. However, the ambitious contract periods exacerbated contractors’ poor mobilization of resources, resulting in six water supply and sewerage contracts (10% of the total contracts) being extended beyond the original contract period (paras. 19 and 38). The performance of the suppliers is rated satisfactory.
7
H. Safeguards 23. Project 2 was classified category B for environment, involuntary resettlement, and indigenous peoples according to the ADB safeguard policies.14 An environmental assessment and review framework, resettlement framework, and indigenous peoples planning framework were prepared during loan processing. ADB approved six sample sector-specific town-specific initial environmental examination (IEE) reports and short resettlement plans, based on which additional IEEs and short resettlement plans were prepared during implementation.15 The IPMU confirmed that no issues and/or court cases related to safeguards were outstanding at completion. The management of safeguard compliance under institutional arrangements—including information disclosure, participation, consultation activities, grievance redressal, and regular submission of semiannual safeguard monitoring reports—was rated effective.16 24. ADB responded to a complaint from an agency by obtaining information from the IPMU and investigating the grievance within a reasonable time, and obtained feedback from the complainant about resolution before closing the grievance log.17 Additional due diligence rectified the omission of an environmentally sensitive area, and four IEEs were updated accordingly and implemented. Three households belonging to the scheduled tribe category suffered temporary income loss during project implementation and were provided compensation for livelihood loss and additional vulnerability assistance. While the implementation of safeguards was initially weak because of lack of specialized personnel, the safeguard implementation and monitoring improved with the engagement of full-time professionals in the IPIUs, DSCs, and contractors. Except for the continued renewal of consents to operate (CTOs) the WTPs and STPs after loan closure, the overall safeguard compliance was found to be satisfactory. The IPMU has agreed to ensure the renewal of CTOs by 30 September 2019 (para. 44). Details on safeguards are in Appendix 7. I. Monitoring and Reporting 25. All but two of the 73 loan covenants were complied with. The covenant on the levy of sustainable user tariffs was partly complied with. Enhanced water tariffs, infrastructure development tax or urban development tax are being levied, while sewerage cess are being levied as household sewer connections are provided (para. 15). However, the fee for door-to-door waste collection services does not accrue to the ULBs but to the outsourced agencies (para. 15). The covenant related to audited project financial statements was partly complied with. Although annual audits were conducted by statutory auditors and furnished to ADB in a timely manner (para. 26), separate accounts for each project were not maintained and reconciled with ADB’s loan financial information services, and the statutory auditor’s opinions were unclear. Monitoring and reporting arrangements, including quarterly progress reports, semiannual safeguard reports, and project completion report, were complied with. Baseline and end-term surveys were also conducted, and reported by IPMU. Appendix 8 provides the status of compliance with loan covenants.
14 ADB. 2002. Environment Policy of the Asian Development Bank. Manila; ADB. 1995. Involuntary Resettlement.
Manila; and ADB. 1998. The Bank’s Policy on Indigenous Peoples. Manila. 15 Two affected households were compensated ₹3.74 million for land and 510 affected households were compensated
₹5.86 million for temporary loss of livelihood. 16 Adequate safeguard monitoring and management was ensured by officers at the IPMU, supported by safeguard
experts of the IPMC. The officers at the IPIU, supported by the social and environmental experts of the concerned design and supervision consultants, were responsible for safeguard implementation, monitoring, and management in the project ULBs. All contractors engaged environment officers during construction.
17 An agency, Gharial Conservation Alliance, claimed in 2012 regulatory noncompliance and inadequate environmental assessment. However, all the requisite regulatory compliances were found to be in place during ground truthing.
8
26. The financial management arrangements of the borrower and the executing agency were robust and included timely counterpart funding. All audited project financial statements (para. 25) were submitted within the specified time, except for delays of (i) 0.4 months in 2011, (ii) 2.6 months in 2014, and (iii) 1.2 months in 2018, which were within the 6-month grace period (para. 25 and Appendix 8; project agreement, section 2.09).
III. EVALUATION OF PERFORMANCE A. Relevance 27. The project is relevant to the government’s development objectives and ADB’s country and sector strategies both at appraisal and completion (para. 6). Although the project predated ADB’s Strategy 2030, it remains relevant to the strategy, with its focus on building livable cities and providing safe and effective water and sanitation services.18 At completion, the project remains relevant to ADB’s policy focus in India on areas of inclusive growth, infrastructure, and environmental sustainability.19 It is aligned with the government’s successive five-year plans; the NITI Aayog three year action agenda, 2017–18 to 2019–20; and the GOR 12th plan, which prioritized the supply of potable water to its urban population, wastewater management, and urban poverty alleviation.20 It is in line with the state’s priorities for poverty reduction through improved access to potable water and sanitation, good governance, and private enterprise participation. 28. Processing the project as a sector loan (para. 6) was relevant and responsive to the state’s agenda. Despite design weaknesses in determining indicators (para. 8), the project results chain was sound—sample subprojects were indicative of project interventions and were appropriate to achieve the intended outcomes. The results chain continued to form the basis for identifying and assessing subsequent subprojects, resulting in realistic numbers of interventions at appropriate locations. Minor changes in the scope of the project (para. 7, footnote 9) were timely and in response to emerging project realities, which optimized the use of loan funds (para. 17) and enhanced the project’s relevance. The project introduced wastewater services in towns that were previously not covered and was instrumental in inducing awareness and raising community demand for such services (para. 16). B. Effectiveness 29. Overall, the project is rated effective as all its outcome targets have been achieved (Appendix 1).21 The water supply component resulted in asset creation; production, pumping and distribution improvements; and UFW and O&M cost reduction, thereby providing all households in project 2 areas with regular and reliable service, and additional quantity of water. The six outcome targets of the water supply subsector have been achieved: (i) an average supply of 137 lpcd of treated piped water to a population of 1.44 million (93%) in the 10 planned ULBs;
(ii) 100% metered connections to all households connected under the project; (iii) bulk water
18 ADB. 2018. Strategy 2030: Achieving a Prosperous, Inclusive, Resilient, and Sustainable Asia and the Pacific.
Manila. 19 ADB. 2018. Country Partnership Strategy: India, 2018–2022—Accelerating Inclusive Economic Transformation.
Manila; and ADB. 2018. Country Operations Business Plan: India, 2018–2020. Manila. 20 Government of India, NITI Aayog. 2017. India Three Year Action Agenda, 2017–18 to 2019–20. New Delhi;
Government of Rajasthan, Planning Department. 2012. Twelfth Five-Year Plan, 2012–17. Jaipur. 21 The outcome pertaining to the provision of toilets and water connections to schools where project facilities are
constructed is not applicable, as the GOR provided such facilities to all schools using national program funds.

9
meters at bulk supply points; (iv) chlorination facilities to ensure the supply of 100% disinfected water to all consumers; (v) adequate storage capacities to ensure a minimum of 20% supply in overhead storage reservoirs and 2 hours of supply in clear water reservoirs (para. 10); and (vi) UFW reduced by 20% (in nine of the 10 ULBs). These also contributed toward the achievement of Goal 6 of the Sustainable Development Goals.22 The wastewater management component resulted in asset creation, systemic improvements, and developed safe disposal systems for sewage and protected water bodies. Sewerage facilities developed in eight hitherto unserved ULBs exceeded the target of seven ULBs, benefiting 0.82 million (100%) of the ULB population, whereas 36,186 of the planned 44,044 households (82%) benefitted in parts of the eight ULBs where sewerage networks were laid (paras. 8 and 11).23 The discharge of untreated wastewater to water bodies has reduced by more than 20 mld (of the 54 mld treatment capacity created). The sewer suction and jetting equipment supplied helped maintain the sewerage network. The detailed project reports for sewerage and drainage, prepared for the entire municipal area of the project ULBs, are being used as the basis for network expansion by the ULBs with state resources. Besides the construction of new roadside drains, the urban drainage component rehabilitated drainage outfalls in two ULBs with high risks of flooding and had drainage master plans—reducing the incidence of flooding and the number of days the ULBs are impacted, and benefitting more than 0.68 million people (para. 12). The urban transport component improved mobility for more than 1.76 million residents in nine ULBs, exceeding the target of five ULBs in the DMF (para. 13 and footnote 9), including access to economic opportunities for the poor, by eliminating vehicle idling time and traffic congestion. It also reduced travel times from an average of 40 minutes per crossing to less than 5 minutes during peak hours, cut travel costs, and reportedly reduced accidents at the intervention sites. ROBs constructed in six ULBs eliminated high-traffic gated railway level crossings (25–40 trains per day). 30. The project design recognized the risk that ULBs might not be able to generate adequate revenues from internal resources to manage and maintain the existing and newly acquired assets. Therefore, it was covenanted that the GOR shall ensure adequate funds toward the O&M of the project facilities through budgetary allocations or other means, to be provided to the IPMU, the appropriate ULB, or line agencies, during and after subproject completion (Appendix 8; Loan Agreement, Schedule 5, para. 9). ULBs and state-level bodies meet the O&M costs of all urban services through well-structured and planned budgetary allocations based on a revenue-sharing model between the three tiers of government (footnote 24), regular transfers from the State Finance Commissions (SFCs) and Central Finance Commissions (CFCs), tariff enhancements, and improved tax collection. The project led to on-the-job learning for IPMU and IPIU staff, consultants, and contractors. The capacities of program ULBs and concerned state-level bodies were also strengthened by implementing a structured ICDP developed under the facility. Actions taken, such as outsourcing the operational functions of some municipal services (SWM and water billing, including sewerage cess) freed up human resources for urban governance and the management of municipal service delivery (para. 15). Financial management systems were improved with double entry accounting systems, municipal asset register management, and structured budgets that are disclosed to the public—improving transparency, accountability, and governance. The training programs effectively reoriented the staff of ULBs and state-level bodies toward the professionalization of municipal services and better urban governance. Safeguard compliance reporting, monitoring, and management were rated effective (para. 23).
22 United Nations, Sustainable Development Goals, Goal 6: Ensure access to water and sanitation for all.
https://www.un.org/sustainabledevelopment/water-and-sanitation/. 23 The beneficiary population and households exclude Alwar, which was included under project 1.

10
C. Efficiency 31. Overall, the project is rated efficient. The economic internal rates of return (EIRRs) of the subprojects identified at appraisal were reevaluated as follows: (i) water supply—Nagaur 23.9% (appraisal 10.8%) and Bundi 22.1% (appraisal 13.0%); (ii) wastewater—Sawai Madhopur 14.9% (appraisal 24.1%) and Bundi 14.6% (appraisal 17.0%); and (iii) urban transport—Sawai Madhopur 24.4% (appraisal 27.9%) (Appendix 9). All subprojects were evaluated at project completion and the EIRRs ranged from 12.9% to 38.1%, all being above the 12% threshold. The estimated EIRRs of the project components at completion were (i) water supply 20.0%, (ii) wastewater 15.3%, and (iii) urban transport 20.9%. The estimated EIRR for the total project combining all subprojects was 19.2%. The project EIRR remained above the threshold with a 20% reduction in future benefits. The economic net present values for selected subprojects at completion were positive, applying a 12% discount rate. The delays in executing some contracts (para. 22) and marginal cost overruns (para. 17) did not affect the EIRR, as they were counterbalanced by efficient contract awards and fund disbursements and increased service area coverage and project ULBs. The institutional efficiencies and grievance redress mechanisms developed in the ULBs and line agencies reduced transaction costs and time, improved the transparency and accountability of governance, and significantly augmented the administrative capacities of the respective institutions (paras. 15 and 30).
D. Sustainability 32. Overall, the project is rated likely sustainable. As it was not designed for capital cost recovery, the operating ratios (revenue to O&M cost ratio) calculated for the five sample ULBs averaged 1.0:0.9, indicating that the ULBs have the financial capacity to meet their operating expenses out of their internal revenues and assigned compensations (para. 30). 24 The Constitution of India (Article 243X) mandates the state to allocate to the ULBs the associated sources of finance and functionaries required to manage the assigned functions and sustain service delivery. ULBs’ finances are structured through fiscal transfers from the state in the form of (i) compensation grants (in lieu of octroi, a tax on goods since abolished, and other taxes subsumed under the Goods and Service Tax Act, 2017); (ii) transfers from CFCs and the SFC; (iii) tariff enhancement; and (iv) improved performance in the collection of taxes and user charges. CFC transfers account for about 30%–40% of ULB finances, of which up to 90% may be used for the O&M of municipal assets. However, less than requisite ownership levels by project ULBs of STPs has led to delayed O&M payments to contractors, resulting in less than optimal maintenance of the STPs. A review of the overall finances of the PHED and PWD indicates the ability of the two departments to meet the O&M requirements of the existing assets and the inclusion of new projects through state budgetary allocations and water and sewerage tariffs.25 Further, the GOR has been consistent and timely in its release of O&M funds, as providing water is a fundamental duty of the state. 33. The institutional capacities of ULBs and state-level bodies were strengthened as part of the ongoing reforms and under the facility (paras. 15 and 30). Systemic improvements in the
24 The CFC allocates 42% of the funds of the general pool to ULBs and Panchayati Raj institutions (rural bodies), which
are distributed based on population (55%), area (15%), and weaker local bodies (30%). The CFC also provides an additional 5% of ULBs’ fund utilization as performance incentives. CFC funds can be used toward O&M (minimum 90%) with a ceiling of 10% toward capital works. The SFC allocates about 7.18% of net state tax revenue to ULBs using the same distribution weightages (e.g., population, area). The SFC funds can be used for capital investments (85%), administration (10%), and management reforms (5%).
25 PHED, GOR. 2019. Notice. http://phedwater.rajasthan.gov.in/content/dam/doitassets/water/Public%20Health%20 Engineering%20Department/pdf2017/citizencorner/water%20tariff.pdf
11
administrative capacities of the ULBs and lines agencies strengthened internal processes (such as accounting systems and grievance redress mechanisms), transparency and accountability of governance (para. 30). PHED has adequate human resources and institutional capacities for the O&M of water supply assets; and the water supply interventions have improved the system efficiency and minimized losses, enabling PHED to manage a more sustainable system focused on service delivery benchmarking and water conservancy. ULBs have benefitted significantly from the finance and urban governance reforms, and need to continue their human resources and institutional capacity augmentation initiatives for better municipal asset management and governance. 34. The project is assessed to be environmentally sustainable as it contributes to water- and fuel-resource conservation; the control of vector-borne diseases; and air, water, and noise pollution abatement—improving the quality of life and the urban environment. The project is also assessed to be socially sustainable, as the infrastructure interventions ensure continuous access to project benefits and economic opportunities. E. Development Impact 35. The development impact is rated satisfactory as the project contributed to the impact indicator of increased economic growth and sustained improvement in the urban environment and quality of life in the project ULBs (Appendix 1). The provision of basic infrastructure and services in the project ULBs contributed significantly to increased access to economic opportunities, inclusive economic growth, social inclusion of the marginalized, and improving the overall quality of life indices of its residents. Urban infrastructure services covered by the project reached an additional 0.5 million people, representing 36% of the population of the 14 project ULBs, against a target of 20%. The project addressed the basic needs of the poor, particularly benefitting women, through reduced time and energy spent on water collection and more time for economic activities. As planned under the MFF, the provision of water connections for the poor and monthly consumption of 15 kiloliters of have been made free, contributing significantly toward achieving Goal 6 of the Sustainable Development Goals (footnote 22). Annual incidence of sanitation-related diseases decreased by nearly 35% against the 20% target in the eight ULBs where sanitation subprojects were undertaken. Improvements in sanitation have led to overall improvements in public health, particularly impacting the poor through a reduced burden of diseases, decreased treatment costs, and a fall in productivity losses. However, the long-term impacts of addressing deficiencies in environmental sanitation on reducing high morbidity and mortality among the poor can be quantified at a later stage. More than 375,547 people living below the poverty line have benefitted from access to improved urban infrastructure services, which constitutes 21% against the 20% target. Drainage interventions significantly reduced flooding in low-lying areas while urban transport interventions improved the riding quality and pedestrian safety; and reduced traffic congestion, travel time, and vehicle operating costs—contributing to improved health and urban environment quality, and thereby helping to achieve the strategic objectives of the project. The environmental impacts of project 2 are assessed in para. 34. 36. The IPMU has developed significant institutional capacities since implementing the first ADB loan for the Rajasthan Urban Infrastructure Development Project and the first tranche of this MFF to plan and formulate projects; procure and manage contracts; and monitor safeguards and implementation. It has consolidated its position in the state as the preeminent organization in managing large-scale externally aided and government-funded projects, and substantially increased contract award and disbursement performance, while enhancing the capacities of other government departments. The IPMU has evolved to manage subsequent ADB loans to the GOR as a combination of policy-based lending and project loan, with greater flexibility to identify

12
infrastructure gaps and capacity building needs, develop and design subprojects, and to support sustainable urban sector reforms at the state level. 26 Enhancing the asset transfer process requires continued support from the IPMU, especially with the exit of the IPIU on completion, which has been well managed by the IPMU. The IPMU is now part of the state-level nodal agency for implementing urban infrastructure projects.27 37. The contributions of project 2 to the ADB results framework are (i) households with new or improved water supply (number) in 10 ULBs = 259,208; (ii) wastewater treatment capacity added or improved (mld) = 54; (iii) water supply pipes installed or upgraded (length of network in km) = 1,185; and (iv) land improved through drainage and/or flood management (hectares) in Bharatpur and Sikar = 400. F. Performance of the Borrower and the Executing Agency 38. The overall performance of the borrower and the executing agency is rated satisfactory. The borrower, represented by the Government of India’s Department of Economic Affairs, provided timely guidance and decisions to GOR on the project and undertook regular tripartite review meetings with ADB, the GOR, and the IPMU, which helped identify bottlenecks, resolve issues, and monitor progress. The GOR provided strong support to the IPMU, including timely counterpart funding (including funds to complete spillover works after loan closure) and adequate human resources throughout the project period. However, the financial management performance of the borrower and the executing agency is rated less than satisfactory, as audit shortcomings persisted over the years and separate project accounts were not maintained by the IPMU (paras. 25 and 26). The IPMU established project implementation procedures for planning and implementation early in the project cycle. It also established effective monitoring and implementing mechanisms through IPIUs in each project ULB, headed by executive engineers. This helped in interagency coordination, monitoring, and progress reporting from the field, and strengthened the information flow to ADB and the project ULBs. The IPMU exhibited strong leadership with the placement of senior officers from the state government in its management, which helped in change management—critical for the implementation of reforms. The contract periods estimated by the IPMU for water supply and sewerage contracts were ambitious and led to contractors exceeding implementation milestones (paras. 19 and 22). Although the IPMU spent considerable time and effort on managing arbitration and other legal issues in the absence of techno-legal personnel, the IPMU was effective in managing the overlapping policy, regulatory, technical, administrative, and financial management aspects of project implementation, including safeguard compliance. G. Performance of the Asian Development Bank 39. The performance of ADB is rated satisfactory. ADB undertook regular review missions, disbursement review missions, midterm review missions, and project completion review missions to assess progress and provide advice on the resolution of outstanding issues. Monitoring, capacity building, and guidance by ADB throughout the project cycle helped define processes, address issues through time-bound actions and targets, and expedite project implementation. However, the financial management performance of ADB is rated less than satisfactory, as audit shortcomings were identified and commented on, but missions were not fielded over the years to
26 ADB. 2014. Report and Recommendation of the President to the Board of Directors: Proposed Loans and Technical
Assistance Grant and Administration of Grant to India for the Rajasthan Urban Sector Development Program. Manila. 27 The GOR has set up the Rajasthan Urban Drinking Water, Sewerage, and Infrastructure Corporation (RUDSICO),
amalgamating the IPMU, the Rajasthan Awas Vikas Nigam, and the Rajasthan Urban Infrastructure Finance and Development Corporation.
13
resolve these issues (paras. 25, 26, and 38). The IPMU found ADB’s support and advice effective in resolving project management issues and safeguard management (para. 24). ADB also provided training and supported the exposure visits of IPMU and IPIU personnel to other ADB-supported projects in India and abroad. ADB monitoring ensured adherence to due processes and transparency in procurement, disbursements, and safeguards, while upholding integrity and ethical standards. H. Overall Assessment 40. Overall, project 2 is rated successful. The project was relevant to the government’s overall development objectives and ADB’s policies at appraisal and continues to remain so at completion. It is assessed effective as all envisaged outcome targets were achieved. The project is rated efficient, as the EIRRs for all the interventions were reassessed to be higher than the economic opportunity cost of capital of 12%. It is rated likely sustainable as the O&M costs of the project assets are met through statutory transfers from the SFC and CFCs, and the collection of municipal taxes and user charges. The development impacts are rated satisfactory, as the project has contributed significantly to all the impact indicators, resulting in improved quality of life indices, poverty reduction, and economic and social inclusion in the project ULBs. The performance of the borrower, the executing agency, and ADB is rated satisfactory. These are summarized in the table:
Overall Ratings Criteria Rating Relevance Relevant Effectiveness Effective Efficiency Efficient Sustainability Likely sustainable Overall assessment Successful Development impacts Satisfactory Borrower and executing agency Satisfactory Performance of Asian Development Bank Satisfactory
Source: Asian Development Bank.
IV. ISSUES, LESSONS, AND RECOMMENDATIONS
A. Issues and Lessons 41. The following important lessons emerge from the project:
(i) While the design was appropriate, it could have been further enhanced by the addition of recent developments and best practices such as 24/7 water supply (para. 6 and footnote 29) while synchronizing the provision for sewer network and household property connections (paras. 8 and 11) to realize the project benefits in a timely manner.
(ii) Continued renewal of CTOs and payment of O&M fees for WTPs and STPs by PHED and project ULBs after the IPMU handed over the assets is necessary for compliance with statutory requirements (para. 24) and optimal maintenance of the plants (para. 32).28
(iii) Having a dedicated cadre in the IPMU, instead of staff on deputation, would have ensured continuity in implementation; and a legal cell in the IPMU would have improved handling of techno-legal cases (para. 38).
28 Under the State AMRUT Action Plan 2015–2016, the GOR is committed to 10-year O&M, the induction of contractual
staff, and e-governance. Eleven of the project towns are part of AMRUT.
14
(iv) The SOE threshold of $100,000 equivalent per individual payment should consider the institutional capacity and the size and nature of contracts (para. 18).
(v) The optimal contingency allocation could have avoided partial loan cancellation or loan extension (para. 17).
(vi) Consistency with the facility DMF, numerical targets, and the classification of indicators would have enabled easy measurement of outputs and outcomes (para. 8).
(vii) The project design was informed by a strong interplay among factors such as (a) the capacity of executing agencies to develop project components, and safeguard management; (b) the scope of project interventions and determination of performance targets; and (c) the selection of implementation arrangements (paras. 7, 16, 20, 23, 26, 28, and 38).
(viii) Close monitoring of consultants’ performance is necessary for optimal use of consulting services and timely delivery of outputs (para. 22).
(ix) Determination of the contract period needs to be realistic to ensure adherence to implementation milestones (paras. 19 and 38).
(x) End-to-end e-procurement and contract management systems would augment the IPMU’s capacity (para. 21).
(xi) Enhancing project preparedness before the contract award (e.g., through the preparation of detailed designs, finalization of the land required, and coordination for utility shifting) helps deliver projects in a timely, responsive, and efficient manner (paras. 7, 16, 19, 20, and 38).
(xii) Emphasis on financial management requirements by the borrower’s auditors, project authorities, and ADB is required for continued compliance with financial covenants (paras. 25, 26, 38, and 39).
B. Recommendations 42. The project-specific recommendations for project implementation are as follows:
(i) The subproject design should incorporate the latest developments (e.g., 24/7, UFW reduction) (para. 6 and footnote 29) and ensure comprehensive end-to-end sector interventions (STPs, sewerage network, and HSCs) (paras. 8 and 11) for maximizing project benefits.29
(ii) The line departments should ensure the renewal of CTOs and payment of O&M fees for WTPs and STPs after taking over the assets (paras. 24 and 32).
(iii) The IPMU should be strengthened with a techno-legal cell to handle contract arbitration (para. 38).
(iv) The SOE threshold may be set based on the institutional capacity of the IPMU to manage funds (para. 17).
(v) The allocation of large sums under contingencies should be rationalized (para. 6). (vi) Consistency with numerical targets and the classification of indicators across
DMFs of the MFF and its component projects should be ensured to assess the respective and cumulative contributions toward overall achievements and objectives (para. 8).
43. General recommendations for future projects are:
(i) A realistic matrix of the executing agency’s capacity and implementation arrangements against the project scope and achievable performance targets
29 This is incorporated into subsequent ADB loans to Rajasthan (footnote 26) and a proposed project for smaller towns,
where property connections are included in the scope of the project to ensure concurrent completion.
15
should be determined at the project design stage for project success (paras. 19, 22, and 38).
(ii) A hybrid payment structure involving deliverable-based payments for designs, reports, and documents, and input-based payments for supervision would improve the accountability and effectiveness of consultants’ performance (para. 22).
(iii) Realistic contract periods should be provided for complex contracts involving multiple stakeholders and implementation complexities (paras. 19 and 38).
(iv) Robust procurement and contract management should be established by extending e-procurement beyond e-submission and establishing a database for contractors’ performance (para. 21).
(v) For improved sustainability and alignment with Strategy 2030, Operational Priorities 6 (Strengthening Governance and Institutional Capacity), future project should strengthen the public financial management at the state and the ULB level (para. 32).
(vi) Clear identification of interventions and the requisite technical detailing and regulatory clearances before the award of contract will ensure smooth and timely execution (paras. 7, 19, and 38).
(vii) ADB should develop a supplementary financial procedures manual with specific sections on project accounting, including reconciliation with ADB’s disbursement records and ADB’s financial reporting and audit requirements. Inclusion and continued capacity building of the executing agency, including its financial management specialists and statutory auditors, in ADB’s financial management requirements from project inception through implementation is necessary (paras. 25, 26, and 38). ADB’s financial management specialist should field regular missions, recommend actions for improvement, and ensure continued compliance (para. 39).
44. Future monitoring. The IPMU should provide details of the renewal of CTOs for STPs and the payment of O&M fees to contractors by 30 September 2019. 45. Covenants. The covenants relating to the levy of SWM charges by ULBs should be ensured. 46. Timing of the project performance evaluation report. The project performance evaluation report should be prepared in 2020, by which time the subprojects will have been operational for more than 3 years.

16 Appendix 1
DESIGN AND MONITORING FRAMEWORK FOR PROJECT 2
Design Summary Performance Indicators/Targets Achievements
Impacts By the end of 2016: By the end of 2018:
Increased economic growth and sustained improvement in the urban environment and quality of life in the identified urban local bodies (ULBs) in Rajasthan (the Project ULBs).
Urban infrastructure services covered by the Project reaching an additional 20% population in the Project ULBs;
Achieved. Urban infrastructure services covered by project reached an additional 619,729 people, representing additional 39% of 14 ULBs’ population, exceeding 20% target;1
Number of sanitation related diseases in Project ULBs taking up sanitation subprojects decreased by 20%; and
Achieved. Annual incidence of sanitation related diseases decreased from 58,669 incidences in 2008 to 37,922 incidences in 2017 –an average 35% decrease in project 2 ULBs exceeding 20% target;2 and
Number of population below poverty line (BPL) with access to improved urban infrastructure services in the Project ULBs increased by 20%.
Achieved. 95% of BPL population (274,937) benefitted with access to improved urban infrastructure services in 10 ULBs.3 It is deemed that increase in access to improved urban infrastructure services to BPL population is proportionate (39%) to overall increase in access to urban services.
Outcomes By the end of 2013: By the end of 2018:4
Increased access to sustainable urban infrastructure and services for approximately 1.5 million people in the identified 12 Project ULBs by the end of the Project (2013).5
Water Supply:
90% population of the project ULBs (approximately 1.2 million people) are provided with treated piped water supply of 135 litres per capita per day (lpcd);
Achieved. 93% population or 1.44 million people in all 10 planned ULBs provided with treated piped water supply of 137 lpcd exceeding targets;
All connected households in the Project ULBs have water meters;
Achieved. 100% households connected under the project provided with water meters;
100% disinfected water supplied to connected consumers;
Achieved. Chlorination facilities provided in all 10 planned ULBs to ensure supply of 100% disinfected water to all connected consumers;
1 Source: PCR Mission. 2 Source: IPPMS Endterm Report. December 2018. 3 Source: Project ULBs. ULB-level baseline data on BPL not available. Current BPL data for Baran and Sikar also not
available. 4 Source: Investment Program Management Unit (IPMU), Government of Rajasthan. 5 Project 2 DMF envisaged to cover 12 ULBs with total population of 1.25 million. Water supply interventions were
planned in 10 ULBs to benefit 1.08 million population while wastewater interventions were planned in 7 ULBs to benefit 0.70 million population. At completion, project 2 covered 14 ULBs as wastewater interventions were dropped in Sikar but undertaken in Alwar and Jhalawar and widening of a railway-over-bridge was included in Alwar.

Appendix 1 17
Design Summary Performance Indicators/Targets Achievements
All water supply points in the Project ULBs connected with bulk meters;
Achieved. Water supply points in project ULBs connected with 63 bulk electro-magnetic flow meters;
Project ULBs have adequate storage facilities for water supply – minimum 20% of supply at the overhead storage reservoirs (OHSRs) and 2 hours supply at the clearwater reservoirs (CWRs); and
Achieved. Adequate storage facilities (87 reservoirs with 71 million liters cumulative capacity) developed and 2 hours supply at the CWRs made available in project ULBs; and
Unaccounted for water (UFW) in the Project ULBs is reduced by 20%.
Achieved. Fully achieved in 9 of the 10 ULBs and yet to be achieved in 1 ULB (Bharatpur).
Sewerage and Sanitation:
Areas with population density of 150 households/hectare & water supply of 135 lpcd are provided with sewerage facilities including sewage treatment plants (STPs) in selected project ULBs;
Achieved. Sewerage facilities provided in 8 ULBs, including STPs in 6 ULBs (STPs existed in remaining 2 ULBs) benefitted over 0.82 million (100%) of the ULB population;
Reduction in the volume of wastewater discharged to water bodies; and
Achieved. Volume of wastewater discharged to water bodies reduced by over 20 million liters per day (mld); and
Schools are provided with toilets and water connections where Project related facilities are constructed.
Toilets and water connections available in 100% schools in all program ULBs using government funds.
Urban Drainage:
Drainage outfalls rehabilitated and newly constructed roadside drains provided in the Project ULBs that are identified as having high risks of flooding and/or have drainage masterplans.
Achieved. Drainage outfalls provided in Bharatpur and Sikar based on the masterplan and assessed risks of flooding. New roadside drains were provided in Bundi and other ULBs where road works were undertaken.
Urban Transport
Improved traffic flow within the Project ULBs and travel times between zones maintained at present levels or reduced in Project ULBs taking up urban roads and transport subprojects.
Achieved. Traffic flow improved and travel times between zones reduced from average 40 minutes per crossing to less than 5 minutes during peak hours in 9 ULBs where transport subprojects were taken up benefiting over 1.76 million residents. Railway-over-bridges constructed in 6 ULBs eliminated high traffic (25-40 trains per day) gated railway level-crossings. Two bridges were constructed over a river in 1 ULB.

18 Appendix 1
Design Summary Performance Indicators/Targets Achievements
Improved capacities of, and sustainable management of urban services by, the Project ULBs by the end of the Project
Improved Institutional Capacity:
Project ULBs meet O&M costs of all urban services and have sound financial management practices; and
Achieved. ULBs and public health engineering department (PHED) meet O&M costs of all urban services through well-structured and planned budgetary allocations based on revenue-sharing model between the three tiers of the government, regularity of transfers from State and Central Finance Commissions, tariff enhancements, and improved tax collections; and
Project ULBs and state-level bodies have adequately trained and skilled human resources to operate and maintain the urban facilities and services.
Achieved. ULBs’ and PHED’s capacities strengthened under a structured capacity building plan; staff effectively reoriented towards professionalization of municipal services and urban governance.
Outputs Water Supply
Water supply subprojects successfully implemented
Existing system rehabilitation and UFW reduction program, including, replacement of excessively leaking carrier mains; distribution mains and house connections, refurbishment/ replacement of pumping machinery, etc.
Achieved. UFW reduction undertaken through rehabilitation of existing system, replacement of leaking carrier mains; distribution mains (totaling 1,185 km), metered house connections, and old pumping machinery in 10 project ULBs;
Installation/ replacement of consumer water meters in 100% of the water supply connections, and installation of flow meters at all supply points;
Achieved. Over 87,000 consumer water meters and 63 bulk electro-magnetic flow meters at water supply points installed in 10 ULBs;
provision of chlorination facilities to achieve 100% disinfection of supply;
Achieved. Chlorinators or online chlorination facilities provided in all 10 planned ULBs to achieve 100% disinfection of supply;
Source augmentation of Bundi and Rajsamand; storage reservoirs (CWRs and OHSRs) and distribution networks in Bharatpur, Bundi, Dholpur, Karauli, Rajsamand, Sawai Madhopur, Churu, Barmer, Nagaur, and Sikar; water treatment plant (WTP) in Dholpur and Rajsamand; and
Achieved. Source augmentation works (44 mld) in Bundi and Rajsamand; 87 storage reservoirs (CWRs and OHSRs) of cumulative 71 million liters storage capacity and 1,185 km of distribution system in the 10 planned ULBs; and 2 WTPs (17 mld in Rajsamand and 15 mld in Dholpur) completed; and
Rehabilitation of existing and construction of new facilities to increase piped water supply coverage to 90% of the households.
Achieved. Rehabilitation of existing and construction of new facilities increased piped water supply coverage to 250,521 households (93%), exceeding target.

Appendix 1 19
Design Summary Performance Indicators/Targets Achievements
Sewerage and sanitation subprojects successfully implemented
Sewerage and Sanitation
Sewerage system – outfall, trunk sewers, tertiary networks and household connection in priority areas – completed and STPs constructed in Bundi (10 mld), Barmer (10 mld), Dholpur (10 mld), Nagaur (10 mld), Sawai Madhopur (10 mld), Rajsamand (8 mld) and Sikar (10 mld).
Achieved. 506.31 km of sewer network, including outfall, trunk sewers and tertiary networks laid in priority areas in 8 ULBs (Alwar, Barmer, Bundi, Dholpur, Jhalawar, Nagaur, Sawai Madhopur and Rajsamand), exceeding the target of 7 ULBs (footnote 5 of Appendix 1);
Substantially achieved. STPs constructed in 6 out of targeted 7 ULBs – Bundi (8 mld), Barmer (10 mld), Dholpur (10 and 3 mld), Nagaur (8 mld), Rajsamand (5 mld) and Sawai Madhopur (10 mld) – based on capacities refined during detailed engineering design totaling 54 mld as against the 68 mld target.
Urban drainage subprojects successfully implemented
Urban Drainage
Storm-water drains constructed in Baran, Bharatpur and Sikar
Achieved. Drainage master plans- based rehabilitation or construction of 11.8 km outfalls and stormwater drains undertaken in Bharatpur and Sikar to facilitate stormwater runoff. Drainage interventions not taken up in Baran based on assessed risks of flooding.
Urban transport subprojects successfully implemented
Urban Transport
Construction of (i) a 2 lane road over bridge (ROB) at Baran, Churu, Sawai Madhopur, and Barmer; and (ii) 2 bridges over river Gambhiri and Bedach in Chittorgarh.
Achieved. (i) 2 lane ROBs constructed in 6 ULBs (Alwar, Baran, Barmer, Bharatpur, Churu and Sawai Madhopur) against the target of 4 ULBs; and (ii) 2 bridges over Gambhiri and Bedach rivers constructed in Chittorgarh; and
Roads of over 75.12 km constructed or strengthened in 4 ULBs (Sikar, Bundi, Bharatpur and Baran).
Capacity development subproject successfully implemented in all Project ULBs
Capacity Building
Gaps and measures identified for strengthening the institutional structure of the ULBs and the state-level bodies
Achieved. Gaps and measures identified through a detailed study and a structured institutional and capacity development plan prepared for all program ULBs and PHED.
Appropriate trainings provided to the Project ULBs and state-level bodies in operations and maintenance (O&M) of services, financial management, etc
Achieved. Over 650 trainings imparted as per the institutional and capacity development plan to staff of program ULBs and PHED in municipal services, such as responsive grievance redressal,

20 Appendix 1
Design Summary Performance Indicators/Targets Achievements
construction management, safeguards, gender mainstreaming, O&M of municipal services, asset management, financial management, urban governance and service delivery, etc.
Hand-over of assets and responsibilities of sewerage systems to Project ULBs
Achieved. Project assets and responsibilities of sewerage systems handed over to all respective project ULBs.
Sustainable user charge structure implemented including solid waste management.
Partly achieved. Sustainable user charge structure implemented for water supply services and being incrementally levied for sewerage as and when households are connected. SWM collection fee charged by the outsourced agencies for door-to-door waste collection service do not accrue to the ULBs.
Note: BPL = below poverty line, CWR = clearwater reservoirs, OHSR = overhead storage reservoirs, PHED = public health engineering department

Appendix 2 21
PROJECT COST AT APPRAISAL AND ACTUAL ($ million)
Item
At Appraisal Actual
Share (%) Foreign
Exchange Local
Currency Total
Foreign Exchange
Local Currency
Total
A. Base Cost
1. Urban Infrastructure Improvement
Water Supply Scheme
53.1 53.10
53.30 53.30 28.94% Sewerage and Sanitation
45.3 45.30
48.07 48.07 26.10%
Urban Drainage
4.4 4.40
2.46 2.46 1.33% Urban Transport
17.0 17.00
51.86 51.86 28.16%
Resettlement
3.5 3.50
0.08 0.08 0.04%
Subtotal (1) 123.3 123.30 155.77 155.77
2. Capacity Development and Implementation Support
Incremental Administration
6.2 6.20
8.09 8.09 4.39% Preparation and Implementation Assistance 10.2 10.20
11.12 11.12 6.04%
Capacity and Institutional Development 2.2 2.20
0.09 0.09 0.05% Subtotal (2)
18.6 18.60
19.29 19.29
Subtotal 142.00 142.00 175.07 175.07
B. Contingency
40.3 40.30
0.00 0.00
Physical Contingencies
13.4 13.40
0.00 0.00
Price Contingencies
26.9 26.90
0.00 0.00
C. Tax and Duties
19.7 19.70
4.69 4.69 2.55%
D. Financing Charges During Implementation
17.0 0.0 17.00 4.44 4.44 2.41%
Grand Total 17.0 202.00 219.00 4.44 179.76 184.19 100.00%
Source: Asian Development Bank (ADB) and Government of Rajasthan (GOR)
Financing Charges during implementation period obtained from http://aaad.gov.in/LoanLedg/A2506_IND.HTM for the L-2506-IND
GOR Expenditure converted at the average exchange rate after 30 June 2017 considered at ₹69.6049 = $1.00 (Dec 2018).

22 Appendix 3
PROJECT COST BY FINANCIER ($ million)
Item
At Appraisal At Completion
ADB Financing
% of Cost Category
GOR Financing
% of Cost Category
Total ADB
Financing % of Cost Category
GOR Financing
% of Cost Category
Total
A. Base Cost
1. Urban infrastructure improvement
Civil work 94.10 82.33% 20.20 17.67% 114.30 103.27 66.55% 51.92 33.45% 155.19
Equipment, materials and furniture
4.50 81.82% 1.00 18.18% 5.50 0.54 72.00% 0.21 28.00% 0.75
Resettlement 2.70 75.00% 0.90 25.00% 3.60 0.03 34.32% 0.05 65.68% 0.08
Subtotal 1 101.30 82.09% 22.10 17.91% 123.40 103.84 66.55% 52.18 33.45% 156.02
2. Capacity development and implementation support
Incremental administration 3.10 50.00% 3.10 50.00% 6.20 4.29 53.10% 3.79 46.90% 8.09
Preparation and implementation assistance
10.20 100.00% 0.00 0.00% 10.20 9.04 83.17% 1.83 16.83% 10.87
Capacity and institutional development
2.20 100.00% 0.00 0.00% 2.20 0.08 98.67% 0.00 1.33% 0.09
Subtotal 2 15.50 83.33% 0.00 0.00% 18.60 13.42 70.47% 5.62 29.53% 19.04
Subtotal base cost 116.80 0.00% 22.10 100.00% 142.00 117.26 66.98% 57.81 33.02% 175.07
B. Contingencies
Physical contingencies 11.00 82.09% 2.40 17.91% 13.40
Price contingencies 22.20 82.53% 4.70 17.47% 26.90
Subtotal contingencies 33.20 82.38% 7.10 17.62% 40.30 0.00 0.00 0.00
Tax and duties 0.00 0.00% 19.70 100.00% 19.70 0.00% 4.69 4.69
Financing charges curing implementation
0.00 0.00% 17.00 100.00% 17.00 0.00% 4.44 4.44
Total 150.00 70.00% 65.90 30.00% 219.00 117.26 63.66% 66.93 36.34% 184.19
Source: Asian Development Bank (ADB) and Government of Rajasthan (GOR)
Financing Charges during implementation period obtained from http://aaad.gov.in/LoanLedg/A2506_IND.HTM for the L-2506-IND
GOR Expenditure converted at the average exchange rate after 30 June 2017 considered at ₹69.6049 = $1.00 (Dec 2018).

Appendix 4 23
DISBURSEMENT OF ADB LOAN PROCEEDS
Table 4.1: Annual and Cumulative Disbursement of ADB Loan Proceeds ($ million)
Year
Annual Projections Annual Disbursement Cumulative Disbursement
Amount % of Total Amount % of Total Amount % of Total
2009 2.66 2.3% 2.66 2.3%
2010 15.50 13.8% 15.24 13.0% 17.90 15.3%
2011 32.30 28.7% 19.05 16.2% 36.95 31.5%
2012 23.70 21.1% 18.01 15.4% 54.96 46.9%
2013 11.94 10.6% 22.26 19.0% 77.22 65.9%
2014 15.10 13.4% 13.17 11.2% 90.39 77.1%
2015 14.03 12.5% 12.76 10.9% 103.15 88.0%
2016 NA 8.65 7.4% 111.80 95.3%
2017 NA 5.46 4.7% 117.26 100.0%
Total 112.57 100.0% 117.26 100.0%
Source: Asian Development Bank.
Figure 4.1: Projection and Cumulative Disbursement of ADB Loan Proceeds
($ million)
Source: Asian Development Bank.
0.00
20.00
40.00
60.00
80.00
100.00
120.00
140.00
2009 2010 2011 2012 2013 2014 2015 2016 2017
Projected Disbursement Annual Disbursement Cumulative Disbursement

24 Appendix 5
CONTRACT AWARDS OF ADB LOAN PROCEEDS
Table 5.1: Annual and Cumulative Contract Awards of ADB Loan Proceeds ($ million)
Year
Annual Projections Annual Contract Awards Cumulative Contract Awards
Amount % of Total Amount % of Total Amount % of Total
2007 8.40 7.2% 8.40 7.2%
2008 0.63 0.5% 9.03 7.7%
2009 33.80 28.8% 42.83 36.5%
2010 42.50 36.7% 26.87 22.9% 69.70 59.4%
2011 17.20 14.9% 8.76 7.5% 78.46 66.9%
2012 25.88 22.4% 18.62 15.9% 97.08 82.8%
2013 16.00 13.8% 7.94 6.8% 105.02 89.6%
2014 2.50 2.2% 5.68 4.8% 110.70 94.4%
2015 11.69 10.1% 6.56 5.6% 117.26 100.0%
Total 115.77 100.0% 117.26 100.0%
Source: Asian Development Bank.
Figure 5.1: Projection and Cumulative Contract Awards of ADB Loan Proceeds
($ million)
Source: Asian Development Bank.
0
20
40
60
80
100
120
140
2007 2008 2009 2010 2011 2012 2013 2014 2015
Projected Contract Award Annual Contract Award Cumulative Contract Award
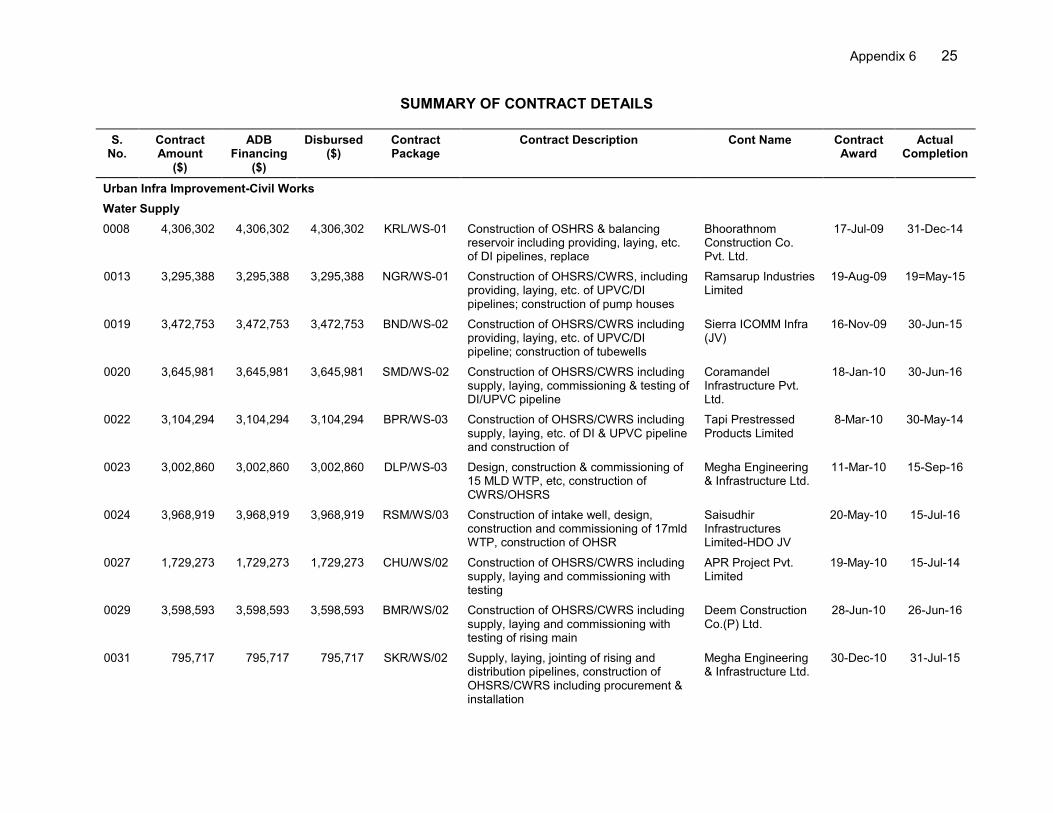
Appendix 6 25
SUMMARY OF CONTRACT DETAILS
S. No.
Contract Amount
($)
ADB Financing
($)
Disbursed ($)
Contract Package
Contract Description Cont Name Contract Award
Actual Completion
Urban Infra Improvement-Civil Works
Water Supply
0008 4,306,302 4,306,302 4,306,302 KRL/WS-01 Construction of OSHRS & balancing reservoir including providing, laying, etc. of DI pipelines, replace
Bhoorathnom Construction Co. Pvt. Ltd.
17-Jul-09 31-Dec-14
0013 3,295,388 3,295,388 3,295,388 NGR/WS-01 Construction of OHSRS/CWRS, including providing, laying, etc. of UPVC/DI pipelines; construction of pump houses
Ramsarup Industries Limited
19-Aug-09 19=May-15
0019 3,472,753 3,472,753 3,472,753 BND/WS-02 Construction of OHSRS/CWRS including providing, laying, etc. of UPVC/DI pipeline; construction of tubewells
Sierra ICOMM Infra (JV)
16-Nov-09 30-Jun-15
0020 3,645,981 3,645,981 3,645,981 SMD/WS-02 Construction of OHSRS/CWRS including supply, laying, commissioning & testing of DI/UPVC pipeline
Coramandel Infrastructure Pvt. Ltd.
18-Jan-10 30-Jun-16
0022 3,104,294 3,104,294 3,104,294 BPR/WS-03 Construction of OHSRS/CWRS including supply, laying, etc. of DI & UPVC pipeline and construction of
Tapi Prestressed Products Limited
8-Mar-10 30-May-14
0023 3,002,860 3,002,860 3,002,860 DLP/WS-03 Design, construction & commissioning of 15 MLD WTP, etc, construction of CWRS/OHSRS
Megha Engineering & Infrastructure Ltd.
11-Mar-10 15-Sep-16
0024 3,968,919 3,968,919 3,968,919 RSM/WS/03 Construction of intake well, design, construction and commissioning of 17mld WTP, construction of OHSR
Saisudhir Infrastructures Limited-HDO JV
20-May-10 15-Jul-16
0027 1,729,273 1,729,273 1,729,273 CHU/WS/02 Construction of OHSRS/CWRS including supply, laying and commissioning with testing
APR Project Pvt. Limited
19-May-10 15-Jul-14
0029 3,598,593 3,598,593 3,598,593 BMR/WS/02 Construction of OHSRS/CWRS including supply, laying and commissioning with testing of rising main
Deem Construction Co.(P) Ltd.
28-Jun-10 26-Jun-16
0031 795,717 795,717 795,717 SKR/WS/02 Supply, laying, jointing of rising and distribution pipelines, construction of OHSRS/CWRS including procurement & installation
Megha Engineering & Infrastructure Ltd.
30-Dec-10 31-Jul-15
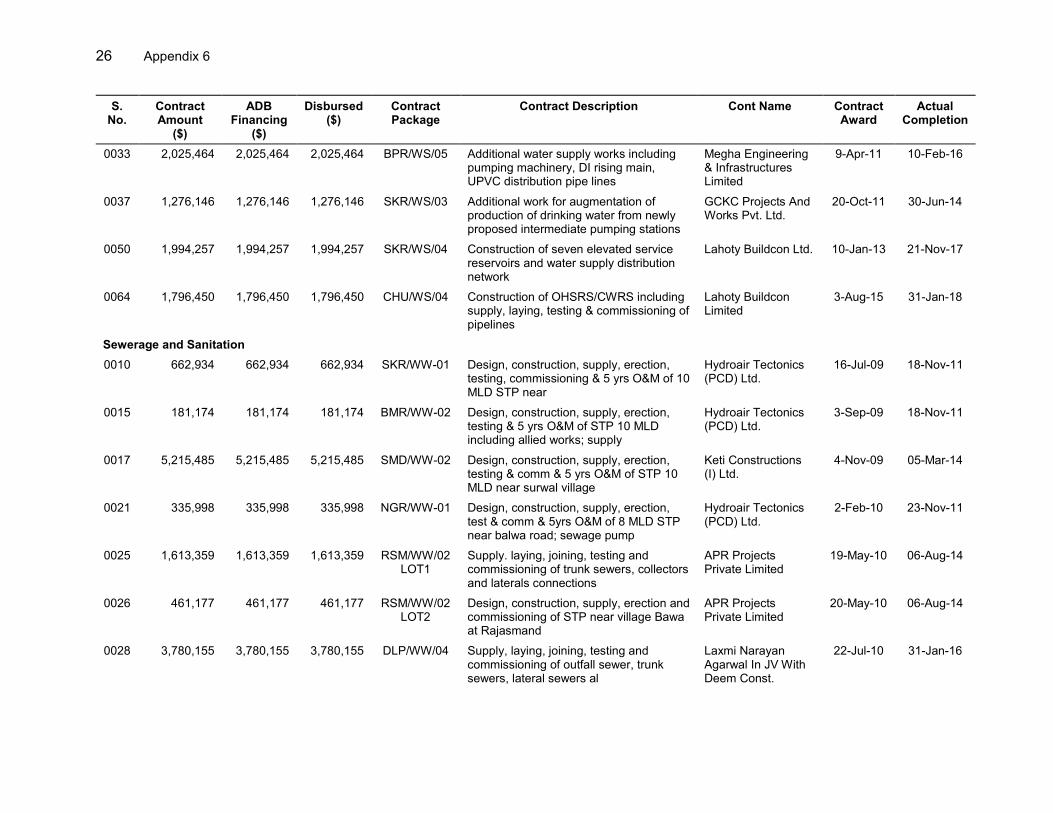
26 Appendix 6
S. No.
Contract Amount
($)
ADB Financing
($)
Disbursed ($)
Contract Package
Contract Description Cont Name Contract Award
Actual Completion
0033 2,025,464 2,025,464 2,025,464 BPR/WS/05 Additional water supply works including pumping machinery, DI rising main, UPVC distribution pipe lines
Megha Engineering & Infrastructures Limited
9-Apr-11 10-Feb-16
0037 1,276,146 1,276,146 1,276,146 SKR/WS/03 Additional work for augmentation of production of drinking water from newly proposed intermediate pumping stations
GCKC Projects And Works Pvt. Ltd.
20-Oct-11 30-Jun-14
0050 1,994,257 1,994,257 1,994,257 SKR/WS/04 Construction of seven elevated service reservoirs and water supply distribution network
Lahoty Buildcon Ltd. 10-Jan-13 21-Nov-17
0064 1,796,450 1,796,450 1,796,450 CHU/WS/04 Construction of OHSRS/CWRS including supply, laying, testing & commissioning of pipelines
Lahoty Buildcon Limited
3-Aug-15 31-Jan-18
Sewerage and Sanitation
0010 662,934 662,934 662,934 SKR/WW-01 Design, construction, supply, erection, testing, commissioning & 5 yrs O&M of 10 MLD STP near
Hydroair Tectonics (PCD) Ltd.
16-Jul-09 18-Nov-11
0015 181,174 181,174 181,174 BMR/WW-02 Design, construction, supply, erection, testing & 5 yrs O&M of STP 10 MLD including allied works; supply
Hydroair Tectonics (PCD) Ltd.
3-Sep-09 18-Nov-11
0017 5,215,485 5,215,485 5,215,485 SMD/WW-02 Design, construction, supply, erection, testing & comm & 5 yrs O&M of STP 10 MLD near surwal village
Keti Constructions (I) Ltd.
4-Nov-09 05-Mar-14
0021 335,998 335,998 335,998 NGR/WW-01 Design, construction, supply, erection, test & comm & 5yrs O&M of 8 MLD STP near balwa road; sewage pump
Hydroair Tectonics (PCD) Ltd.
2-Feb-10 23-Nov-11
0025 1,613,359 1,613,359 1,613,359 RSM/WW/02 LOT1
Supply. laying, joining, testing and commissioning of trunk sewers, collectors and laterals connections
APR Projects Private Limited
19-May-10 06-Aug-14
0026 461,177 461,177 461,177 RSM/WW/02 LOT2
Design, construction, supply, erection and commissioning of STP near village Bawa at Rajasmand
APR Projects Private Limited
20-May-10 06-Aug-14
0028 3,780,155 3,780,155 3,780,155 DLP/WW/04 Supply, laying, joining, testing and commissioning of outfall sewer, trunk sewers, lateral sewers al
Laxmi Narayan Agarwal In JV With Deem Const.
22-Jul-10 31-Jan-16
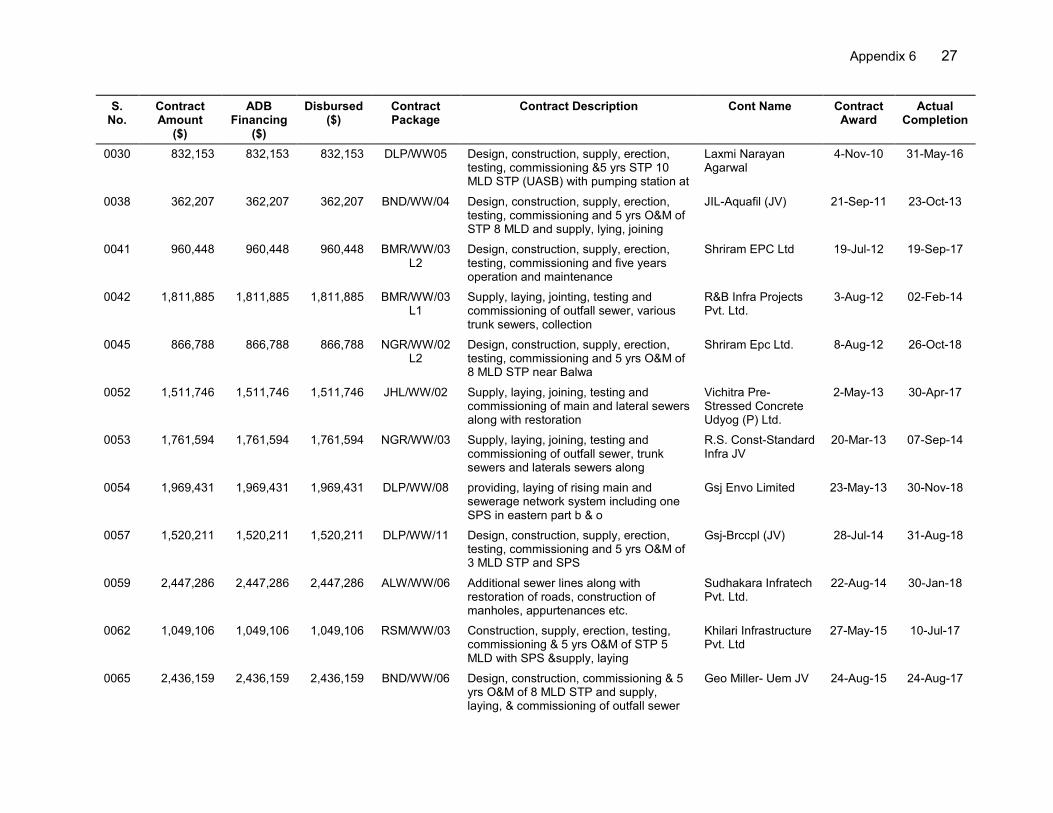
Appendix 6 27
S. No.
Contract Amount
($)
ADB Financing
($)
Disbursed ($)
Contract Package
Contract Description Cont Name Contract Award
Actual Completion
0030 832,153 832,153 832,153 DLP/WW05 Design, construction, supply, erection, testing, commissioning &5 yrs STP 10 MLD STP (UASB) with pumping station at
Laxmi Narayan Agarwal
4-Nov-10 31-May-16
0038 362,207 362,207 362,207 BND/WW/04 Design, construction, supply, erection, testing, commissioning and 5 yrs O&M of STP 8 MLD and supply, lying, joining
JIL-Aquafil (JV) 21-Sep-11 23-Oct-13
0041 960,448 960,448 960,448 BMR/WW/03L2
Design, construction, supply, erection, testing, commissioning and five years operation and maintenance
Shriram EPC Ltd 19-Jul-12 19-Sep-17
0042 1,811,885 1,811,885 1,811,885 BMR/WW/03L1
Supply, laying, jointing, testing and commissioning of outfall sewer, various trunk sewers, collection
R&B Infra Projects Pvt. Ltd.
3-Aug-12 02-Feb-14
0045 866,788 866,788 866,788 NGR/WW/02L2
Design, construction, supply, erection, testing, commissioning and 5 yrs O&M of 8 MLD STP near Balwa
Shriram Epc Ltd. 8-Aug-12 26-Oct-18
0052 1,511,746 1,511,746 1,511,746 JHL/WW/02 Supply, laying, joining, testing and commissioning of main and lateral sewers along with restoration
Vichitra Pre-Stressed Concrete Udyog (P) Ltd.
2-May-13 30-Apr-17
0053 1,761,594 1,761,594 1,761,594 NGR/WW/03 Supply, laying, joining, testing and commissioning of outfall sewer, trunk sewers and laterals sewers along
R.S. Const-Standard Infra JV
20-Mar-13 07-Sep-14
0054 1,969,431 1,969,431 1,969,431 DLP/WW/08 providing, laying of rising main and sewerage network system including one SPS in eastern part b & o
Gsj Envo Limited 23-May-13 30-Nov-18
0057 1,520,211 1,520,211 1,520,211 DLP/WW/11 Design, construction, supply, erection, testing, commissioning and 5 yrs O&M of 3 MLD STP and SPS
Gsj-Brccpl (JV) 28-Jul-14 31-Aug-18
0059 2,447,286 2,447,286 2,447,286 ALW/WW/06 Additional sewer lines along with restoration of roads, construction of manholes, appurtenances etc.
Sudhakara Infratech Pvt. Ltd.
22-Aug-14 30-Jan-18
0062 1,049,106 1,049,106 1,049,106 RSM/WW/03 Construction, supply, erection, testing, commissioning & 5 yrs O&M of STP 5 MLD with SPS &supply, laying
Khilari Infrastructure Pvt. Ltd
27-May-15 10-Jul-17
0065 2,436,159 2,436,159 2,436,159 BND/WW/06 Design, construction, commissioning & 5 yrs O&M of 8 MLD STP and supply, laying, & commissioning of outfall sewer
Geo Miller- Uem JV 24-Aug-15 24-Aug-17

28 Appendix 6
S. No.
Contract Amount
($)
ADB Financing
($)
Disbursed ($)
Contract Package
Contract Description Cont Name Contract Award
Actual Completion
Urban Drainage
0009 716,358 716,358 716,358 SKR/DR-01 Construction of storm water drainage in Sikar
Anandi Lal Lalpuria 6-Jul-09 30-Jun-12
0018 1,190,046 1,190,046 1,190,046 BPR/DR-02 Construction of storm water drainage system of Ramnagar, Domora & Kali Bagichi to Golbagh
Prabhu Dayal Kanojiya
18-Nov-09 30-Nov-12
Urban Roads And Transport
0034 1,395,170 1,395,170 1,395,170 SKR/ST-02 Widening & strengthening of various road in Sikar town
Rajendra Singh Bhamboo
22-Jul-11 31-Oct-15
0043 4,257,283 4,257,283 4,257,283 BPR/ST/01 Widening and strengthening of circular road at Bharatpur
Ganesh Garhia Construction Co.
19-Jul-12 10-Jan-16
0044 1,439,866 1,439,866 1,439,866 SKR/ST/04 Improvement and widening of existing road from Jhunjunu bye pass to bus stand to 4 lane at Sikar
Rajendra Singh Bhamboo Infra Pvt. Ltd.
14-Aug-12 31-Aug-14
0047 2,364,872 2,364,872 2,364,872 BND/ST04 Widening and strengthening of various roads in Bundi city
RPS Infra Projects Pvt. Ltd.
20-Jul-12 04-Jan-18
0049 3,036,757 3,036,757 3,036,757 SKR/ST/05 Widening and strengthening of road and construction of drain work at Sikar town
R.K. Construction Company JV
1-Dec-12 23-Jun-15
0058 874,948 874,948 874,948 BRN/ST/01 City road work at Baran town Deem Construction Co. Pvt. Ltd.
23-Jul-14 22-Nov-15
0007 1,641,153 1,641,153 1,641,153 CHT/BR-01 Construction of 2 high level bridge on river Gambhiri & Bedach in Chittorgarh
Shree Gautam Construction Co. Pvt. Ltd.
13-Jul-09 12-Jul-11
0011 4,185,966 4,185,966 4,185,966 BRN/BR-02 Construction of 2-lane ROB at level crossing No. 37 on NH-76 at Baran
Shree Gautam Construction Co. Pvt. Ltd.
20-Aug-09 30-Nov-13
0012 4,243,091 4,243,091 4,243,091 CHU/BR-01 Construction of 2-lane ROB at level crossing No. 168C on NH-65 at Churu
Shree Gautam Construction Co. Pvt. Ltd.
21-Aug-09 21-Apr-13
0014 3,263,705 3,263,705 3,263,705 SMD/BR-01 Construction of railway over bridge at Kherda railway crossing on NH-116 at level crossing
Keti Construction (i) Ltd.
20-Aug-09 31-03-13
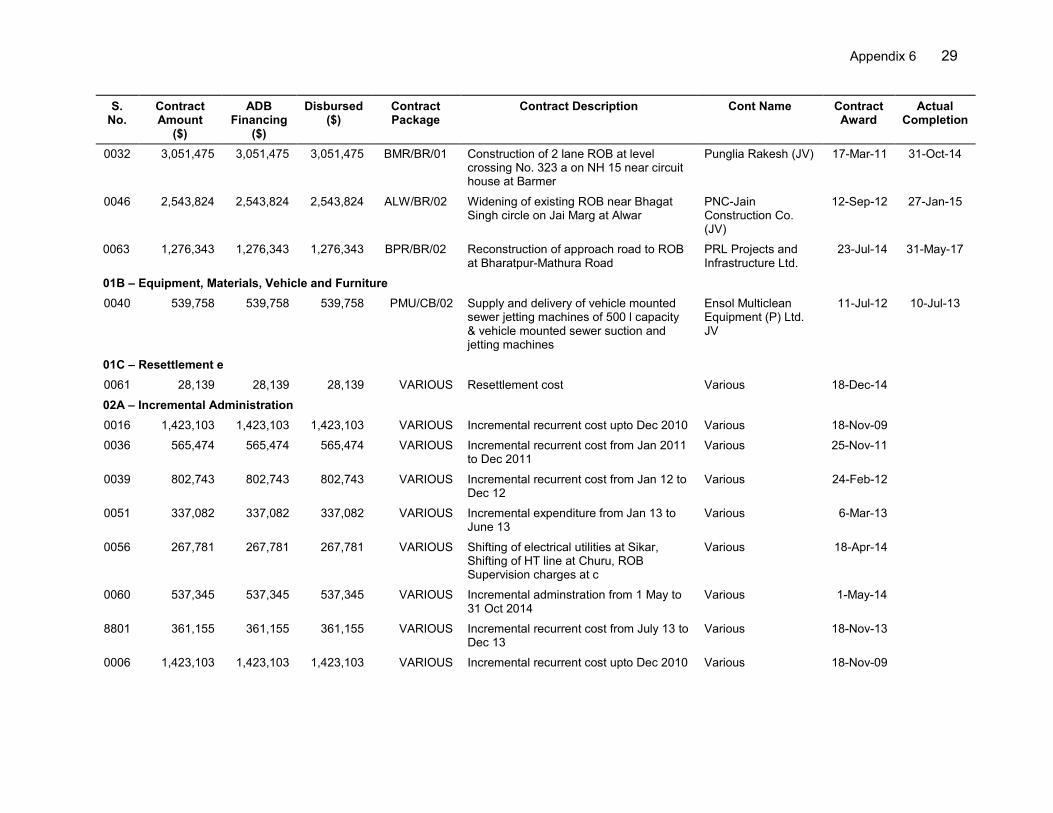
Appendix 6 29
S. No.
Contract Amount
($)
ADB Financing
($)
Disbursed ($)
Contract Package
Contract Description Cont Name Contract Award
Actual Completion
0032 3,051,475 3,051,475 3,051,475 BMR/BR/01 Construction of 2 lane ROB at level crossing No. 323 a on NH 15 near circuit house at Barmer
Punglia Rakesh (JV) 17-Mar-11 31-Oct-14
0046 2,543,824 2,543,824 2,543,824 ALW/BR/02 Widening of existing ROB near Bhagat Singh circle on Jai Marg at Alwar
PNC-Jain Construction Co. (JV)
12-Sep-12 27-Jan-15
0063 1,276,343 1,276,343 1,276,343 BPR/BR/02 Reconstruction of approach road to ROB at Bharatpur-Mathura Road
PRL Projects and Infrastructure Ltd.
23-Jul-14 31-May-17
01B – Equipment, Materials, Vehicle and Furniture
0040 539,758 539,758 539,758 PMU/CB/02 Supply and delivery of vehicle mounted sewer jetting machines of 500 l capacity & vehicle mounted sewer suction and jetting machines
Ensol Multiclean Equipment (P) Ltd. JV
11-Jul-12 10-Jul-13
01C – Resettlement e
0061 28,139 28,139 28,139 VARIOUS Resettlement cost Various 18-Dec-14
02A – Incremental Administration
0016 1,423,103 1,423,103 1,423,103 VARIOUS Incremental recurrent cost upto Dec 2010 Various 18-Nov-09
0036 565,474 565,474 565,474 VARIOUS Incremental recurrent cost from Jan 2011 to Dec 2011
Various 25-Nov-11
0039 802,743 802,743 802,743 VARIOUS Incremental recurrent cost from Jan 12 to Dec 12
Various 24-Feb-12
0051 337,082 337,082 337,082 VARIOUS Incremental expenditure from Jan 13 to June 13
Various 6-Mar-13
0056 267,781 267,781 267,781 VARIOUS Shifting of electrical utilities at Sikar, Shifting of HT line at Churu, ROB Supervision charges at c
Various 18-Apr-14
0060 537,345 537,345 537,345 VARIOUS Incremental adminstration from 1 May to 31 Oct 2014
Various 1-May-14
8801 361,155 361,155 361,155 VARIOUS Incremental recurrent cost from July 13 to Dec 13
Various 18-Nov-13
0006 1,423,103 1,423,103 1,423,103 VARIOUS Incremental recurrent cost upto Dec 2010 Various 18-Nov-09

30 Appendix 6
S. No.
Contract Amount
($)
ADB Financing
($)
Disbursed ($)
Contract Package
Contract Description Cont Name Contract Award
Actual Completion
02B – Consulting Services
0001 1,665,084 1,665,084 1,665,084 IPMC-TR2 Investment program management consulting services
Consulting Engg. Services Pvt. Ltd. consortium
17-Dec-07 18-Dec-17
0002 1,899,472 1,899,472 1,899,472 DSC-I TR2 Design & construction supervision consultancy service-package 1 (Bharatpur)
Wadia Techno-Engineering Services Limited
17-Dec-07 18-Dec-17
0003 2,440,676 2,440,676 2,440,676 DSC-II TR2 Design & construction supervision consultancy services-package II (Nagaur)
SNC-Lavalin Infrastructure Private Limited
17-Dec-07 18-Dec-17
0004 2,396,414 2,396,414 2,396,414 DSC-III TR2 Design & construction supervision consultancy services-package III (Jhalawar)
Shah Technical Consultants Pvt Ltd Assn
17-Dec-07 18-Dec-17
0005 625,663 625,663 625,663 CAPP TR2 Design & implementation of community action participation program (CAPP)
Indian Institute of Rural Management
17-Jul-08
0006 6,966 6,966 6,966 IPPMS TR2 Investment program performance monitoring system (IPPMS)
Tetra tech India ltd. 18-Aug-08
0055 6,560 6,560 6,560 EMETR2 Consultancy services for external monitoring and evaluation of SRP of implementation
IRG system south Asia Pvt. Ltd.
29-Jan-14
02C – Capacity Building and Training
0035 84,056 84,056 84,056 CB&ID TRAINING
Capacity building and institutional development - trainings and workshops of the project staff
Various 4-Nov-11
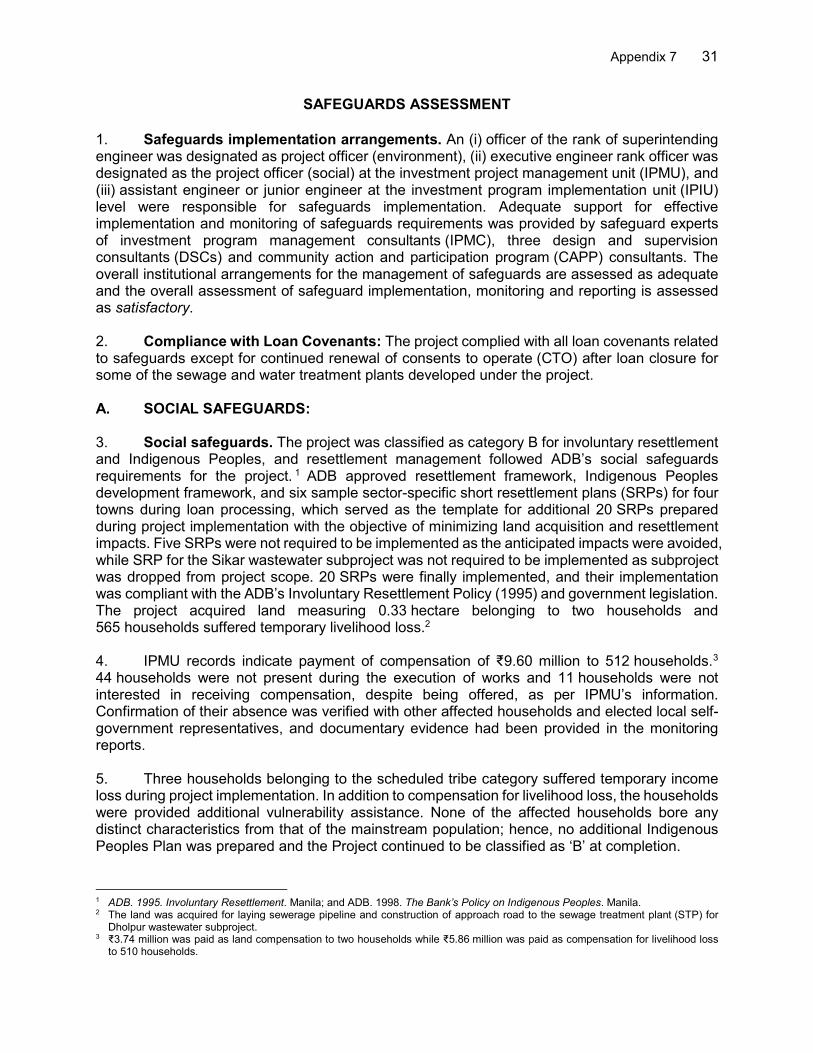
Appendix 7 31
SAFEGUARDS ASSESSMENT
1. Safeguards implementation arrangements. An (i) officer of the rank of superintending engineer was designated as project officer (environment), (ii) executive engineer rank officer was designated as the project officer (social) at the investment project management unit (IPMU), and (iii) assistant engineer or junior engineer at the investment program implementation unit (IPIU) level were responsible for safeguards implementation. Adequate support for effective implementation and monitoring of safeguards requirements was provided by safeguard experts of investment program management consultants (IPMC), three design and supervision consultants (DSCs) and community action and participation program (CAPP) consultants. The overall institutional arrangements for the management of safeguards are assessed as adequate and the overall assessment of safeguard implementation, monitoring and reporting is assessed as satisfactory. 2. Compliance with Loan Covenants: The project complied with all loan covenants related to safeguards except for continued renewal of consents to operate (CTO) after loan closure for some of the sewage and water treatment plants developed under the project. A. SOCIAL SAFEGUARDS: 3. Social safeguards. The project was classified as category B for involuntary resettlement and Indigenous Peoples, and resettlement management followed ADB’s social safeguards requirements for the project. 1 ADB approved resettlement framework, Indigenous Peoples development framework, and six sample sector-specific short resettlement plans (SRPs) for four towns during loan processing, which served as the template for additional 20 SRPs prepared during project implementation with the objective of minimizing land acquisition and resettlement impacts. Five SRPs were not required to be implemented as the anticipated impacts were avoided, while SRP for the Sikar wastewater subproject was not required to be implemented as subproject was dropped from project scope. 20 SRPs were finally implemented, and their implementation was compliant with the ADB’s Involuntary Resettlement Policy (1995) and government legislation. The project acquired land measuring 0.33 hectare belonging to two households and 565 households suffered temporary livelihood loss.2 4. IPMU records indicate payment of compensation of ₹9.60 million to 512 households.3 44 households were not present during the execution of works and 11 households were not interested in receiving compensation, despite being offered, as per IPMU’s information. Confirmation of their absence was verified with other affected households and elected local self-government representatives, and documentary evidence had been provided in the monitoring reports. 5. Three households belonging to the scheduled tribe category suffered temporary income loss during project implementation. In addition to compensation for livelihood loss, the households were provided additional vulnerability assistance. None of the affected households bore any distinct characteristics from that of the mainstream population; hence, no additional Indigenous Peoples Plan was prepared and the Project continued to be classified as ‘B’ at completion.
1 ADB. 1995. Involuntary Resettlement. Manila; and ADB. 1998. The Bank’s Policy on Indigenous Peoples. Manila. 2 The land was acquired for laying sewerage pipeline and construction of approach road to the sewage treatment plant (STP) for
Dholpur wastewater subproject. 3 ₹3.74 million was paid as land compensation to two households while ₹5.86 million was paid as compensation for livelihood loss
to 510 households.

32 Appendix 7
6. Information disclosure and grievance redress. Information disclosure, participation, and consultation activities for the implementation of social safeguards were effectively carried out. Such activities included: (i) distribution and dissemination of resettlement information among affected households in local language (Hindi); (ii) regular consultative meetings with affected households and other stakeholders during project implementation; (iii) publicizing actual resettlement impacts and compensation to affected households; (iv) carrying out monitoring activities; and (v) disclosure of social safeguards documents (SRPs and monitoring reports) on project website. 7. A grievance redress mechanism was set up in accordance with the agreed resettlement framework to address any project-related grievances of affected persons. The project authorities confirmed that no grievances related to social safeguards were received during the implementation of the project. 8. Monitoring and reporting. The internal social safeguards monitoring reports adequately capturing the status of safeguard implementation were periodically submitted. External monitoring of social safeguards requirements was also undertaken during project implementation. The project authorities confirmed that there are no outstanding issues and/or any court cases related to social safeguards at completion. Overall, involuntary resettlement and indigenous peoples safeguard compliance was assessed to be satisfactory. 9. Conclusion and lessons learnt. The resettlement impacts were reduced during the implementation, based on the key ADB principle to avoid and minimize land acquisition and resettlement impacts through detailed technical design such as revision in pipeline alignments or selection of alternative sites for project facilities. Extensive consultations with affected persons and support by the project urban local bodies (ULBs) enabled the successful implementation and completion of the SRPs. All the affected households were appropriately and timely compensated. The suggestions and guidance provided by the Missions were implemented by the project authorities which ensured the proper implementation and documentation of safeguard policy requirements.4
B. ENVIRONMENTAL SAFEGUARDS: 10. Environmental safeguards. The ADB-approved environment category of the Project was “B” in line with ADB’s Environment Policy, 2002. The initial environmental examination (IEE) reports for 48 subprojects spread over 14 project ULBs were developed. The requisite environmental permissions as per India’s environmental regulatory framework such as forest clearances, permissions to cut trees, no objection certificates, etc. were obtained from the respective regulatory agencies. However, the continued renewal of CTOs after loan closure for some of the sewage and water treatment plants developed under the project was not being obtained from the state pollution control board. The IPMU has agreed to expedite the process of achieving regulatory compliance latest by 30 September 2019. 11. The contract documents included the environmental monitoring and management plans (EMMPs). The contractors’ staff were provided training to understand the requirements elaborated in the EMMPs. The overall implementation of EMMPs was improved through systematic execution of corrective actions identified during the review missions and semi-annual environmental monitoring reports. The areas of concern such as safety measures at sites,
4 (i) Inclusion of schedule caste as vulnerable and (ii) procedure for handling resettlement cases where households could not be
compensated due to their absence or refusal to receive compensation.

Appendix 7 33
provision of basic amenities to laborers, housekeeping practices, etc. improved with increased monitoring and coordination. 12. The project facilities contributed towards improved environmental conditions in project ULBs. The commissioned treatment plants are reported to be performing to the desired standards. The project inventions contributed towards improvement in environmental conditions, such as, (i) greater availability and access to safe potable water for over 93% population of project ULBs reducing time for water collection and for productive use of saved time for economic opportunities; (ii) reduced flooding in two project ULBs thereby saving periodic losses; (iii) wastewater and drainage interventions reduced breeding grounds for vectors and reduced incidences of water borne diseases by around 38% and improved health conditions; and (iv) improved riding quality of urban roads with less traffic congestion, and fuel consumption, thus contributing to improved urban environment and quality of life. In the absence of environmental data on the baseline conditions or from the implementation and operation phases, the precise quantification of environmental health and safety benefits accrued cannot be arrived at. 13. Information disclosure and grievance redress: A grievance redress mechanism was set up wherein the city level committees chaired by district collectors also functioned as the grievance redress committees. Routine grievances were mainly related to removal of debris, backfilling of open pits, restoration of roads and footpaths, choking of drains, etc. The Project staff responded to these grievances in a reasonable time frame and obtained feedback from the complainants about resolution prior to closing the grievance log. In 2012, ADB responded to a complaint from an agency, Gharial Conservation Alliance, claiming regulatory non-compliance and inadequate environmental assessment. ADB investigated the complaint by obtaining additional information from IPMU and confirmed during ground truthing that all requisite regulatory compliances were in place. However, additional due diligence indicated the omission of an environmentally sensitive area. Within a reasonable time, ADB consulted and obtained feedback from the complainant about resolution prior to closing the grievance log. The environmental due diligence also indicated that the habitats of protected aquatic species in Chambal river were not expected to be impacted by ADB-financed sub-projects. Accordingly, four IEE reports were updated to reflect the Chambal river as part of the National Chambal Sanctuary. The revised EMMPs were implemented. 14. Monitoring and reporting: The environmental parameter test reports adequately captured the test results of air, water qualities and noise levels parameters and submission of semi-annual environmental monitoring reports were regular. These monitoring reports captured the status of regulatory compliances and implementation of EMMPs, etc. adequately, and were disclosed on ADB website. The project authorities confirmed that there are no outstanding issues and/or any court cases related to environmental safeguards at completion. Overall, environmental safeguard compliance, except for continued renewal of CTOs post-loan closure, was assessed to be satisfactory. 15. Conclusion and lessons learnt. Timely and full compliance to environmental safeguards requirements needs dedicated resources till the closure of the project, and beyond to ensure compliance with statutory requirements (continued CTO renewal after loan closure). The presence of environmentally sensitive areas that was overlooked during appraisal needs to be addressed through appropriate and continued due diligence involving a systematic and continuous approach in developing awareness, periodic capacity enhancement regarding environmental statutory requirements, and its application.

34 Appendix 8
STATUS OF COMPLIANCE WITH LOAN COVENANTS
Covenant Reference in Loan
Agreement
Status of Compliance
Execution and Committees
The Empowered Committee as established by the State shall provide policy guidance and overall coordination across all the State agencies and ULBs, and take decisions on matters related to the Facility and the Project.
LA, Schedule 5, para. 2 (a)
Complied with.
The work finalization committee as established by the State, shall be responsible for reviewing the Subproject appraisal reports for their final approval in accordance with the procedures set forth under schedule 4 to the FFA.
LA, Schedule 5, para. 2 (b)
Complied with.
Implementation
An IPMU as established and fully staffed by the EA that shall be the implementing agency (IA), shall be responsible for overall implementation and management of the Project. The IPMU shall be headed by a Project Director (PD). The PD shall be responsible for overall management of the Facility and the Project and coordination with and reporting to the Empowered Committee, the State and ADB on the same.
LA, Schedule 5, para. 3 (a)
Complied with.
The IPMU, with the assistance of IPMC and DSCs, shall be responsible for detailed appraisal of subprojects and ensure that these meet the selection criteria described in Schedule 4 of the FFA.
LA, Schedule 5, para. 3 (b)
Complied with.
Under the IPMU, IPIUs shall be established by the IPMC at the zonal and sub-division levels of the LSGD (in relation to selected Project ULBs) by no later than January 2009; and a full-time representative of the IPIU shall be appointed in each ULB. These IPIUs shall carry out daily implementation activities of the Project.
LA, Schedule 5, para. 4 (a)
Complied with.
IPMU and IPIUs shall be assisted by the IPMC in managing the Project and assuring the technical quality of design and construction, and the DSCs in preparing the design documents, managing tendering of contractors and supervising the construction works.
LA, Schedule 5, para. 4 (b)
Complied with.
The CLCs as set up by the State, shall review Project activities, identify issues for improvement, and provide guidance to the IPIUs on actions to improve project performance. In ULBs where water source augmentation subprojects are proposed, representatives from State Department of Irrigation shall also be made members of the CLC; and wherever heritage and tourism subprojects are proposed representatives from Archaeological Survey of India or State Department of Archaeology Museum (depending on appropriate jurisdiction), and State Department of Tourism shall be members of the CLC. The CLCs shall meet at least quarterly or more frequently, as required.
LA, Schedule 5, para. 5
Complied with.
Funds
The State shall on-lend the Loan proceeds to the ULBs under appropriate arrangements acceptable to ADB; as also ensure that sufficient counterpart funds are made available from its budget for each fiscal year, in a timely manner for the efficient implementation of the Project towards its contribution and those of the ULBs.
LA, Schedule 5, para. 6
Complied with.
Use of Proceeds of the Loan
The Borrower shall make the proceeds of the Loan available to the State upon terms and conditions mutually agreeable to ADB and the Borrower and shall cause the State to apply such proceeds to the financing of expenditures on the Project in accordance with the provisions of this
LA, Article III, Section 3.01
Complied with.
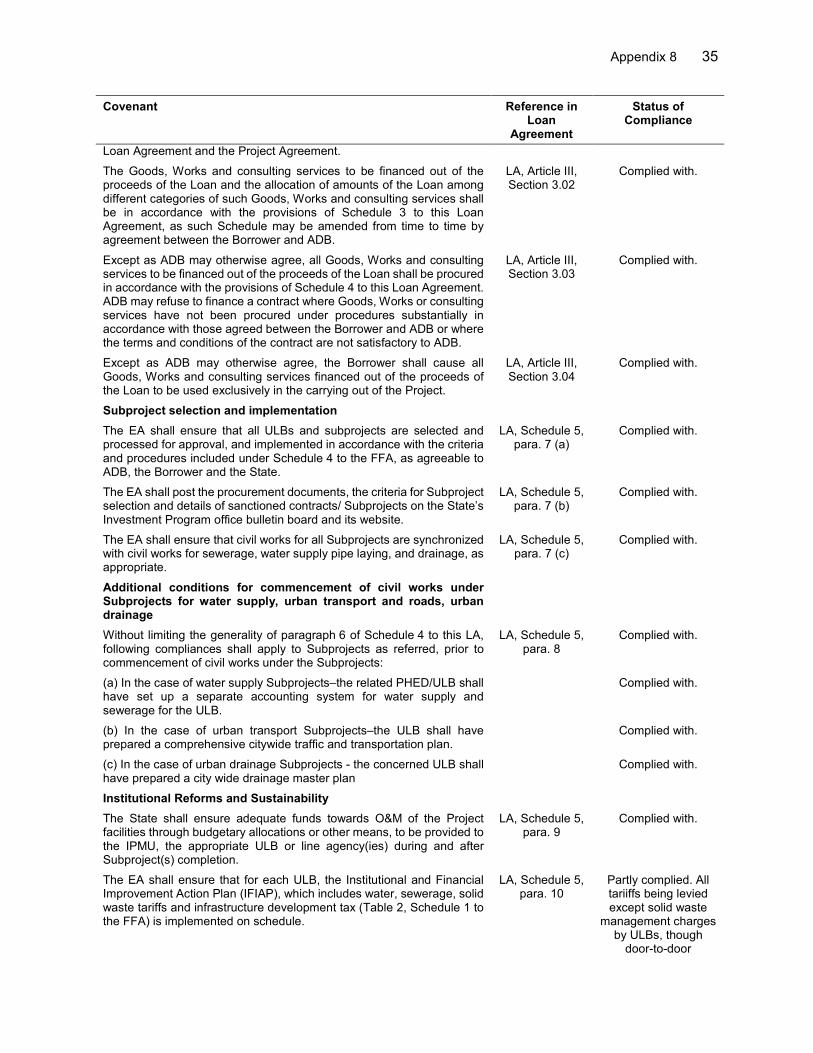
Appendix 8 35
Covenant Reference in Loan
Agreement
Status of Compliance
Loan Agreement and the Project Agreement.
The Goods, Works and consulting services to be financed out of the proceeds of the Loan and the allocation of amounts of the Loan among different categories of such Goods, Works and consulting services shall be in accordance with the provisions of Schedule 3 to this Loan Agreement, as such Schedule may be amended from time to time by agreement between the Borrower and ADB.
LA, Article III, Section 3.02
Complied with.
Except as ADB may otherwise agree, all Goods, Works and consulting services to be financed out of the proceeds of the Loan shall be procured in accordance with the provisions of Schedule 4 to this Loan Agreement. ADB may refuse to finance a contract where Goods, Works or consulting services have not been procured under procedures substantially in accordance with those agreed between the Borrower and ADB or where the terms and conditions of the contract are not satisfactory to ADB.
LA, Article III, Section 3.03
Complied with.
Except as ADB may otherwise agree, the Borrower shall cause all Goods, Works and consulting services financed out of the proceeds of the Loan to be used exclusively in the carrying out of the Project.
LA, Article III, Section 3.04
Complied with.
Subproject selection and implementation
The EA shall ensure that all ULBs and subprojects are selected and processed for approval, and implemented in accordance with the criteria and procedures included under Schedule 4 to the FFA, as agreeable to ADB, the Borrower and the State.
LA, Schedule 5, para. 7 (a)
Complied with.
The EA shall post the procurement documents, the criteria for Subproject selection and details of sanctioned contracts/ Subprojects on the State’s Investment Program office bulletin board and its website.
LA, Schedule 5, para. 7 (b)
Complied with.
The EA shall ensure that civil works for all Subprojects are synchronized with civil works for sewerage, water supply pipe laying, and drainage, as appropriate.
LA, Schedule 5, para. 7 (c)
Complied with.
Additional conditions for commencement of civil works under Subprojects for water supply, urban transport and roads, urban drainage
Without limiting the generality of paragraph 6 of Schedule 4 to this LA, following compliances shall apply to Subprojects as referred, prior to commencement of civil works under the Subprojects:
LA, Schedule 5, para. 8
Complied with.
(a) In the case of water supply Subprojects–the related PHED/ULB shall have set up a separate accounting system for water supply and sewerage for the ULB.
Complied with.
(b) In the case of urban transport Subprojects–the ULB shall have prepared a comprehensive citywide traffic and transportation plan.
Complied with.
(c) In the case of urban drainage Subprojects - the concerned ULB shall have prepared a city wide drainage master plan
Complied with.
Institutional Reforms and Sustainability
The State shall ensure adequate funds towards O&M of the Project facilities through budgetary allocations or other means, to be provided to the IPMU, the appropriate ULB or line agency(ies) during and after Subproject(s) completion.
LA, Schedule 5, para. 9
Complied with.
The EA shall ensure that for each ULB, the Institutional and Financial Improvement Action Plan (IFIAP), which includes water, sewerage, solid waste tariffs and infrastructure development tax (Table 2, Schedule 1 to the FFA) is implemented on schedule.
LA, Schedule 5, para. 10
Partly complied. All tariiffs being levied except solid waste
management charges by ULBs, though
door-to-door

36 Appendix 8
Covenant Reference in Loan
Agreement
Status of Compliance
collection is being charged by the
outsourced agencies
The EA shall ensure that the contractual documents under any PPP modality, in particular the extended O&M, BOT, or PBMC, as applicable, are provided to ADB for prior review and approval, for use under individual Subprojects.
LA, Schedule 5, para. 11(a)
Complied with.
As realized under ADB Loan 2366, the Project shall continue to adopt extended operation and maintenance contracts for sewage treatment plants where operation and maintenance of sewage treatment plant shall be undertaken by a private contractor for 5 years after construction completion as part of contract for construction. PPP for other urban sub-sectors and of other modalities shall be further explored and developed in collaboration with PPP cell established in the State under ADB TA 4890.
LA, Schedule 5, para. 11(a)
Complied with.
Other Subproject specific requirements
The EA shall ensure that
(a) if a Subproject contains augmentation of supply from surface sources that are under the mandate of the State Irrigation Department (ID), the ID shall be included in the relevant CLC and in all decisions regarding the Subproject proposal
LA, Schedule 5, para. 12
Complied with.
(b) in ULBs with proposed heritage and tourism subprojects, representatives from the Archaeological Survey of India and State Department of Tourism shall be made members of the CLC
Complied with.
(c) prior to commencement of water supply Subprojects, the source shall be made secure for the ULBs; where possible, all proposed water supply/source augmentation shall be carried out from surface water sources; for all groundwater supply augmentation proposals, a comprehensive catchment-based water resource plan has been completed, supported by data, in consultation with all users/stakeholders, including the groundwater department of the Borrower and the State.
Complied with.
(d) prior to commencement of distribution network improvement works in water supply Subprojects for the towns, a detailed unaccounted for water (UFW) reduction program, including network maps/plans, showing where rehabilitation is required, has been prepared by the PHED, to be reviewed and approved by the relevant IPIU and CLC.
Complied with.
(e) 90% of water supply service coverage is achieved in selected Project ULBs within four years of the Effective Date.
Complied with.
(f) 90% customer metering is achieved in the respective ULB within three years of the completion of water supply Subprojects in stated ULB
Complied with.
(g) The PHED/ULB shall set up a separate accounting system for water supply and sewerage for the ULB prior to commencement of water supply Subproject in the ULB.
Complied with.
(h) the domestic waste is segregated from the industrial, medical and hazardous waste in the ULBs where solid waste management Subprojects are being implemented, which is to be treated separately as per the prescribed system in the Municipal Solid Wastes (Management and Handling) Rules, 2000, of the Borrower
Complied with.
(i) for water supply, where, through the PHED or other State-level entities, the State is implementing the upstream and/or associated infrastructure works in parallel to a Subproject funded under this Project, the EA shall ensure that the associated works are implemented on
Complied with.
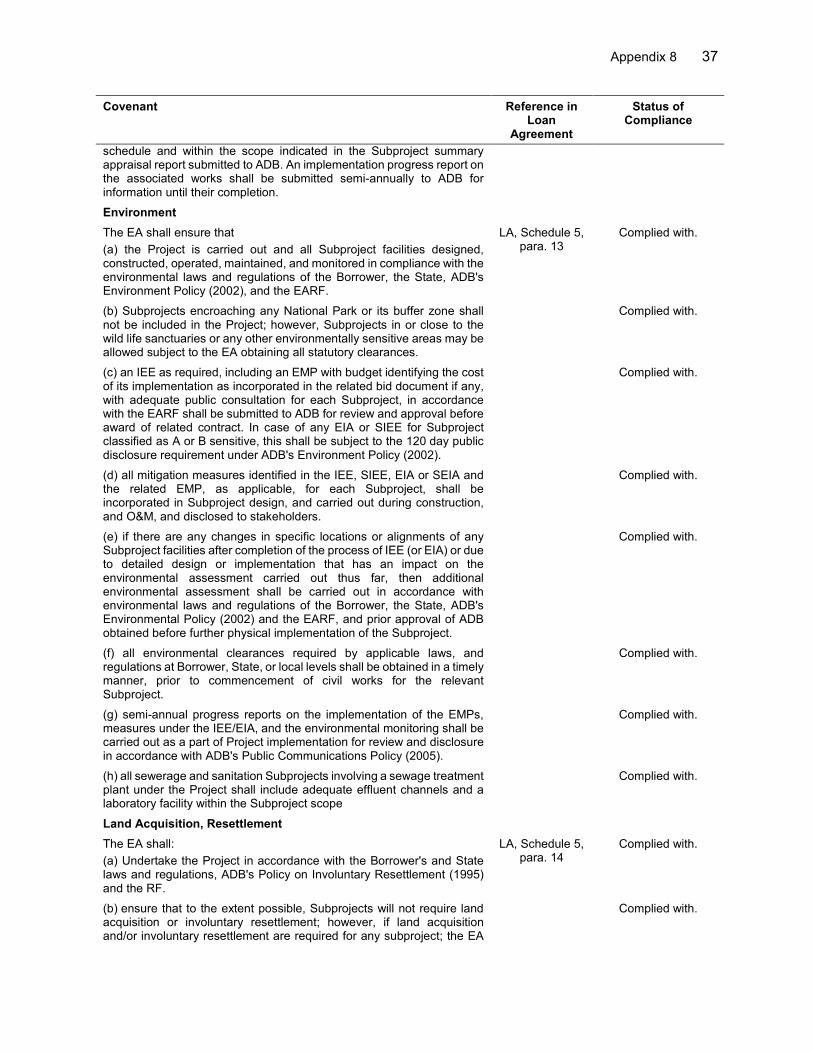
Appendix 8 37
Covenant Reference in Loan
Agreement
Status of Compliance
schedule and within the scope indicated in the Subproject summary appraisal report submitted to ADB. An implementation progress report on the associated works shall be submitted semi-annually to ADB for information until their completion.
Environment
The EA shall ensure that
(a) the Project is carried out and all Subproject facilities designed, constructed, operated, maintained, and monitored in compliance with the environmental laws and regulations of the Borrower, the State, ADB's Environment Policy (2002), and the EARF.
LA, Schedule 5, para. 13
Complied with.
(b) Subprojects encroaching any National Park or its buffer zone shall not be included in the Project; however, Subprojects in or close to the wild life sanctuaries or any other environmentally sensitive areas may be allowed subject to the EA obtaining all statutory clearances.
Complied with.
(c) an IEE as required, including an EMP with budget identifying the cost of its implementation as incorporated in the related bid document if any, with adequate public consultation for each Subproject, in accordance with the EARF shall be submitted to ADB for review and approval before award of related contract. In case of any EIA or SIEE for Subproject classified as A or B sensitive, this shall be subject to the 120 day public disclosure requirement under ADB's Environment Policy (2002).
Complied with.
(d) all mitigation measures identified in the IEE, SIEE, EIA or SEIA and the related EMP, as applicable, for each Subproject, shall be incorporated in Subproject design, and carried out during construction, and O&M, and disclosed to stakeholders.
Complied with.
(e) if there are any changes in specific locations or alignments of any Subproject facilities after completion of the process of IEE (or EIA) or due to detailed design or implementation that has an impact on the environmental assessment carried out thus far, then additional environmental assessment shall be carried out in accordance with environmental laws and regulations of the Borrower, the State, ADB's Environmental Policy (2002) and the EARF, and prior approval of ADB obtained before further physical implementation of the Subproject.
Complied with.
(f) all environmental clearances required by applicable laws, and regulations at Borrower, State, or local levels shall be obtained in a timely manner, prior to commencement of civil works for the relevant Subproject.
Complied with.
(g) semi-annual progress reports on the implementation of the EMPs, measures under the IEE/EIA, and the environmental monitoring shall be carried out as a part of Project implementation for review and disclosure in accordance with ADB's Public Communications Policy (2005).
Complied with.
(h) all sewerage and sanitation Subprojects involving a sewage treatment plant under the Project shall include adequate effluent channels and a laboratory facility within the Subproject scope
Complied with.
Land Acquisition, Resettlement
The EA shall:
(a) Undertake the Project in accordance with the Borrower's and State laws and regulations, ADB's Policy on Involuntary Resettlement (1995) and the RF.
LA, Schedule 5, para. 14
Complied with.
(b) ensure that to the extent possible, Subprojects will not require land acquisition or involuntary resettlement; however, if land acquisition and/or involuntary resettlement are required for any subproject; the EA
Complied with.

38 Appendix 8
Covenant Reference in Loan
Agreement
Status of Compliance
shall ensure following:
(i) a RP for the Subproject, acceptable to ADB is prepared, in accordance with applicable laws and regulations of the Borrower and the State, and the RF, and submitted to ADB for review and approval before award of related civil works contract proper consultation during preparation of the RP with the affected persons, as also disclosure of the RP to the affected persons including information on land acquisition and compensation process undertaken.
(ii) all land, rights of way and other land-related rights required for the Subproject are acquired or made available.
Complied with.
(iii) all affected persons are compensated in accordance with the agreed RP before commencement of civil works of the related subproject including any section-wise handover thereof, strictly in accordance with the stipulation in the related civil works contract. If during detailed design and implementation, any modification and/additional land acquisition or involuntary resettlement impacts are identified, the RP will be prepared (or modified if existing) in accordance with applicable laws and regulations of the Borrower and the State, and the RF and prior approval of ADB obtained before further implementation of RP.
Complied with.
(iv) ensure that efficient grievance redress mechanisms are in place in accordance with the related RP to assist affected persons resolve queries and complaints if any, in a timely manner.
Complied with.
(v) ensure that all affected persons shall be paid compensation in accordance with ADB’s Policy on Involuntary Resettlement (1995), the RF, and laws and regulations of the Borrower’s and State, before commencement of civil works.
Complied with.
Indigenous Peoples
The EA shall ensure that if any impact is identified during planning, design, or implementation of any Subproject on indigenous peoples, that an IPDP or integration of specific actions for the indigenous people in the RP is prepared in accordance with ADB's Policy on Indigenous People (1998) and the IPDF and that the same is further (i) approved by ADB before award of related civil works contract, and (ii) implemented before commencement of related civil works contract. Any updation to the IPDP due to detailed designs or during implementation shall follow requirements similar to the RPs.
LA, Schedule 5, para. 15
Complied with.
Other Social Issues
The EA shall ensure that civil works contracts under the Project follow all applicable labor laws of the Borrower and the State and that these further include provisions to the effect that contractors; (i) carry out HIV/AIDS awareness programs for labor and disseminate information at worksites on risks of sexually transmitted diseases and HIV/AIDS as part of health and safety measures for those employed during construction ; and (ii) follow and implement all statutory provisions on labor (including not employing or using children as labor, equal pay for equal work), health, safety, welfare, sanitation, and working conditions. Such contracts shall also include clauses for termination by the State/EA in case of any breach of the stated provisions by the Contractors.
LA, Schedule 5, para. 16(a)
Complied with.
(b) If any Project related facilities are located within the premises of a public school, the EA shall construct and/or rehabilitate the existing toilet facilities with separate and adequate provision for female and male students
LA, Schedule 5, para. 16(b)
Complied with.

Appendix 8 39
Covenant Reference in Loan
Agreement
Status of Compliance
Performance Monitoring and Evaluation: Reports
In addition to the IPPMS in the process of being established for the Facility, the EA through IPMU shall ensure that within three months of the Effective Date, a project performance monitoring system will be established for the Project, satisfactory to ADB, including key impact and outcome indicators and associated assumptions with corresponding target dates. The IPPMS shall monitor and evaluate the performance of the Investment Program, Facility. The project performance report in respect of the Project will contribute to preparing the IPPMS. For Subprojects under PPP modalities, such as PBMC, or extended O&M contracts, if applicable, key performance indicators satisfactory to ADB will be developed during the preparation of requests for proposals and draft contract documents for each Subproject
LA, Schedule 5, para. 17(a)
Complied with.
Without limiting the generality of Section 2.08 of the Project Agreement the EA shall, after physical completion of the Facility, but in any event not later than three months thereafter or such later date as ADB may agree for this purpose, prepare and furnish to ADB and the Borrower, a report, in such form and in such detail as ADB shall reasonably request on the Facility.
LA, Schedule 5, para. 17(b)
Complied with.
Review
Based on a review of quarterly progress reports provided under section 2.08 of the Project Agreement, ADB, Borrower and State representatives shall meet as required to discuss the progress of the Project, Facility and the Investment Program, any changes to implementation arrangements, or remedial measures required to be undertaken to achieve the overall objectives of specific Subprojects and components and of the overall Facility and Investment Program. In addition to regular reviews, including a midterm review for the Project, a detailed midterm review of the Facility will be undertaken within no later than February 2012. The midterm review shall include a detailed evaluation of the scope of the Facility, implementation arrangements, any outstanding issues, environment, resettlement and other safeguard issues, achievement of scheduled targets, contract management progress, and other issues, as appropriate.
LA, Schedule 5, para. 18
Complied with.
Particular Covenants in Loan Agreement
The Borrower shall cause the State to carry out the Project with due diligence and efficiency and in conformity with sound administrative, financial, engineering, environmental and urban development and public utility practices
LA, Section 4.01(a)
Complied with.
In the carrying out of the Project and operation of the Project facilities, the Borrower shall perform, or cause to be performed, all obligations set forth in Schedule 5 to this Loan Agreement.
LA, Section 4.01(b)
Complied with.
The Borrower shall make available to the State, promptly as needed, the funds, facilities, services and other resources which are required, in addition to the proceeds of the Loan, for the carrying out of the Project
LA, Section 4.02
Complied with.
The Borrower shall cause the State to ensure that the activities of its departments and agencies with respect to the carrying out of the Project and operation of the Project facilities are conducted and coordinated in accordance with sound administrative policies and procedures.
LA, Section 4.03
Complied with.
The Borrower shall take all action which shall be necessary on its part to enable the State to perform its obligations under the Project Agreement, including the establishment and maintenance of tariffs as stipulated in paragraph 10 of Schedule 5 to this Loan Agreement, and shall not take or permit any action which would interfere with the performance of such
LA, Section 4.04
Complied with.

40 Appendix 8
Covenant Reference in Loan
Agreement
Status of Compliance
obligations.
The Borrower shall exercise its rights under the financing arrangements, in relation to the Project, to the State in such a manner as to protect the interests of the Borrower and ADB and to accomplish the purposes of the Loan
LA, Section 4.05(a)
Complied with.
No rights or obligations under the financing arrangements to the State shall be assigned, amended, abrogated or waived without the prior notice to ADB. Rights or obligations under the said financing arrangements shall only be assigned, amended, abrogated or waived, if satisfactory to ADB
LA, Section 4.05(b)
v
Particular Covenants in Project Agreement
The State through the LSGD shall carry out the Project with due diligence and efficiency, and in conformity with sound administrative, financial, engineering, environmental and urban development and public utility practices
PA, Section 2.01(a)
Complied with.
In the carrying out of the Project and operation of the Project facilities, the State shall and shall cause the LSGD and other agencies to perform all obligations set forth in the Loan Agreement to the extent that they are applicable to the State, LSGD and other agencies referred therein.
PA, Section 2.01(b)
Complied with.
The State through the LSGD, shall make available, promptly as needed, the funds, facilities, services, equipment, land and other resources which are required, in addition to the proceeds of the Loan, for the carrying out of the Project
PA, Section 2.02
Complied with.
In the carrying out of the Project, the State through the LSGD, shall employ competent and qualified consultants and contractors, acceptable to ADB, to an extent and upon terms and conditions satisfactory to ADB
PA, Section 2.03(a)
Complied with.
Except as ADB may otherwise agree, all Goods, Works and consulting services to be financed out of the proceeds of the Loan shall be procured in accordance with the provisions of Schedule 4 to the Loan Agreement. ADB may refuse to finance a contract where Goods, Works or consulting services have not been procured under procedures substantially in accordance with those agreed between the Borrower and ADB or where the terms and conditions of the contract are not satisfactory to ADB.
PA, Section 2.03(b)
Complied with.
The State through the LSGD, shall carry out the Project in accordance with plans, design standards, specifications, work schedules and construction methods acceptable to ADB. The State through the LSGD, shall furnish, or cause to be furnished, to ADB, promptly after their preparation, such plans, design standards, specifications and work schedules, and any material modifications subsequently made therein, in such detail as ADB shall reasonably request.
PA, Section 2.04
Complied with.
The State through the LSGD, shall take out and maintain with responsible insurers, or make other arrangements satisfactory to ADB for insurance of Project facilities to such extent and against such risks and in such amounts as shall be consistent with sound practice.
PA, Section 2.05(a)
Complied with.
Without limiting the generality of the foregoing, the State through the LSGD, undertakes to insure, or cause to be insured, the Goods to be imported for the Project and to be financed out of the proceeds of the Loan against hazards incident to the acquisition, transportation and delivery thereof to the place of use or installation, and for such insurance any indemnity shall be payable in a currency freely usable to replace or repair such Goods
PA, Section 2.05(b)
Complied with.
The State through the LSGD, shall maintain, or cause to be maintained, records and accounts adequate to identify the Goods, Works and consulting services financed out of the proceeds of the Loan, to disclose
PA, Section 2.06
Complied with.

Appendix 8 41
Covenant Reference in Loan
Agreement
Status of Compliance
the use thereof in the Project, to record the progress of the Project (including the cost thereof) and to reflect, in accordance with consistently maintained sound accounting principles, its operations and financial condition.
ADB, and the State through the LSGD, shall cooperate fully to ensure that the purposes of the Loan will be accomplished
PA, Section 2.07(a)
Complied with.
The State through the LSGD, shall under intimation to the Borrower, promptly inform ADB of any condition which interferes with, or threatens to interfere with, the progress of the Project, the performance of its obligations under this Project Agreement or the financing arrangements, or the accomplishment of the purposes of the Loan
PA, Section 2.07(b)
Complied with.
ADB and the State through the LSGD, shall from time to time, at the request of either party, exchange views through their representatives with regard to any matters relating to the Project, the State, and the Loan
PA, Section 2.07(c)
Complied with.
The State through the LSGD, shall furnish to ADB all such reports and information as ADB shall reasonably request concerning (i) the Loan and the expenditure of the proceeds thereof; (ii) the Goods, Works and consulting services financed out of such proceeds; (iii) the Project; (iv) the administration, operations and financial condition of the LSGD; and (v) any other matters relating to the purposes of the Loan.
PA, Section 2.08(a)
Complied with.
Without limiting the generality of the foregoing, the State through the LSGD, shall furnish to ADB quarterly reports on the execution of the Project and on the operations and management of the Project facilities. Such reports shall be submitted in such form and in such details and within such a period as ADB shall reasonably request, and shall indicate, among other things, progress made and problems encountered during the quarter under review, steps taken or proposed to be taken to remedy these problems, and proposed program of activities and expected progress during the following quarter.
PA, Section 2.08(b)
Complied with.
Promptly after physical completion of the Project, but in any event not later than three (3) months thereafter or such later date as ADB may agree for this purpose, the State through the LSGD, shall prepare and furnish to ADB a report, in such form and in such detail as ADB shall reasonably request, on the execution and initial operation of the Project, including its cost, the performance by the State through the LSGD, of its obligations under this Project Agreement and the accomplishment of the purposes of the Loan
PA, Section 2.08(c)
Complied with.
The State through LSGD, shall (i) maintain separate accounts for the Project; (ii) have such accounts and related financial statements (balance sheet, statement of income and expenses, and related statements) audited annually, in accordance with appropriate auditing standards consistently applied, by independent auditors whose qualifications, experience and terms of reference are acceptable to ADB; and (iii) furnish to ADB, promptly after their preparation but in any event not later than 9 (nine) months after the close of the fiscal year to which they relate, certified copies of such audited accounts and financial statements and the report of the auditors relating thereto (including auditor’s opinion on the use of the Loan proceeds and compliance with the covenants of the Loan Agreement as well as on the use of the procedures for imprest account/statement of expenditures), all in the English language. The State through LSGD, shall furnish to ADB such further information concerning such accounts and financial statements and the audit thereof as ADB shall from time to time reasonably request.
PA, Section 2.09
Partly complied with. Annual audits were
conducted by statutory auditors and
timely furnished to ADB, except for three
years when it was delayed by up to
2.6 months (but within 6 months grace
period). However, separate accounts for each project were not
maintained and reconciled with LFIS,
and the statutory auditor’s opinions
were unclear.

42 Appendix 8
Covenant Reference in Loan
Agreement
Status of Compliance
The State through the LSGD, shall enable ADB's representatives to inspect the Project, the Goods and Works financed out of the proceeds of the Loan, all other plants, sites, properties and equipment of the State, and any relevant records and documents.
PA, Section 2.10
Complied with.
The State through the LSGD, shall, promptly as required, take all action within its powers to maintain its corporate existence, to carry on its operations, and to acquire, maintain and renew all rights, properties, powers, privileges and franchises which are necessary in the carrying out of the Project or in the conduct of its business.
PA, Section 2.11(a)
Complied with.
In so far as it relates to the Project, the State through the LSGD, shall at all times conduct its business in accordance with sound administrative, financial, environmental and urban development and public utility practices, and under the supervision of competent and experienced management and personnel
PA, Section 2.11(b)
Complied with.
In so far as it relates to the Project, the State through the LSGD, shall at all times operate and maintain its plants, equipment and other property, and from time to time, promptly as needed, make all necessary repairs and renewals thereof, all in accordance with sound administrative, financial, engineering, environmental, urban development and public utility, and maintenance and operational practices
PA, Section 2.11(c)
Complied with.
Except as ADB may otherwise agree, the State shall cause LSGD, not to sell, lease or otherwise dispose of any of its assets which shall be required for the efficient carrying on of its operations or the disposal of which may prejudice its ability to perform satisfactorily any of its obligations under this Project Agreement
PA, Section 2.12
Complied with.
Except as ADB may otherwise agree, the State through the LSGD, shall apply the proceeds of the Loan to the financing of expenditures on the Project in accordance with the provisions of the Loan Agreement and this Project Agreement, and shall ensure that all Goods, Works and consulting services financed out of such proceeds are used exclusively in the carrying out of the Project.
PA, Section 2.13
Complied with.
Except as ADB may otherwise agree, the State shall duly perform all its obligations under the financing arrangements, and shall not take, or concur in, any action which would have the effect of assigning, amending, abrogating or waiving any rights or obligations of the parties under the financing arrangements
PA, Section 2.14
Complied with.
BOT = build, operate and transfer, CLC = city level committee, DSC = design and construction supervision consultants, EA = executing agency, EARF = environmental assessment and review framework, EIA = environmental impact assessment, EMP = environmental management plan, GOR = Government of Rajasthan, GRC = grievance redress committee, IA = implementing agency, ID = irrigation department, IEE = initial environmental examination, IFIAP = institutional and financial improvement action plan, IPDP = indigenous peoples development plan, IPMC = investment program management consultant, IPMU = investment program management unit, IPPMS = investment program performance and management system, ITB = invitation to bid, LA = loan agreement, LSGD = Local Self Government Department, O&M = operation and maintenance, PA = project agreement, PBMC = performance based management contract, PD = project director, PHED = public health engineering department, PPP = public private partnership, RF = resettlement framework, RP = resettlement plan, SEIA = summary environmental impact assessment, SIEE = summary initial environmental examination, UFW = unaccounted-for-water, ULB = urban local body.
Source: ADB.
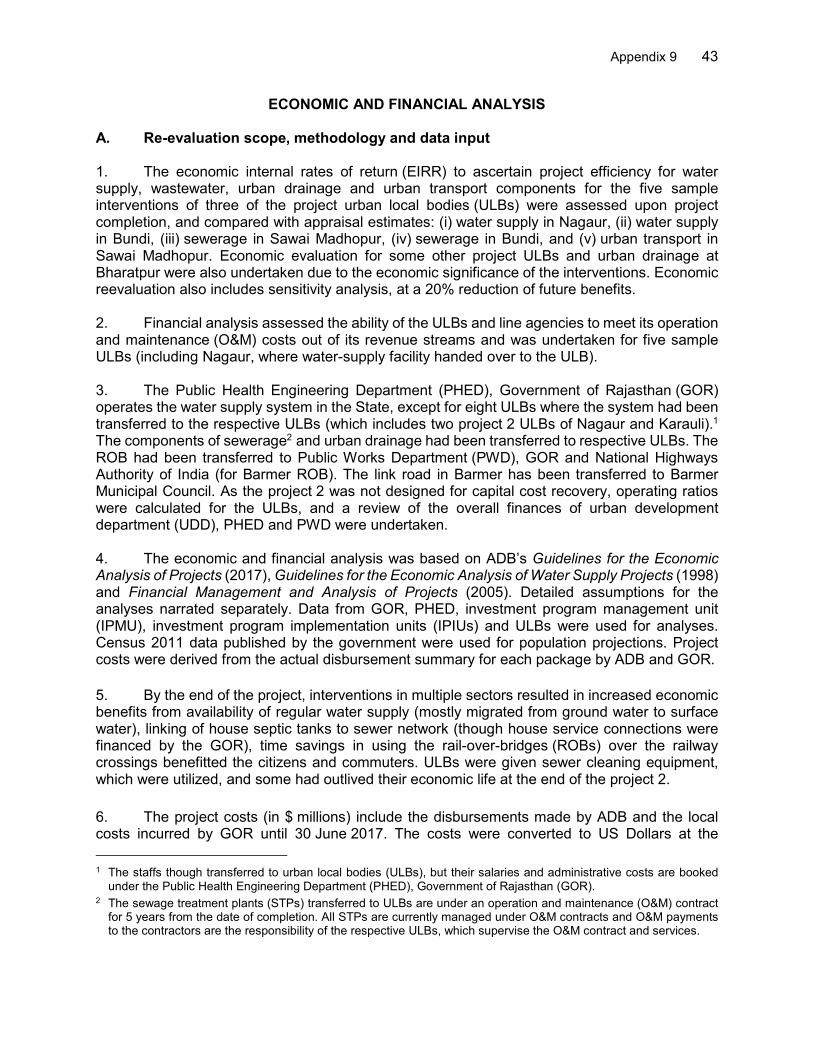
Appendix 9 43
ECONOMIC AND FINANCIAL ANALYSIS A. Re-evaluation scope, methodology and data input 1. The economic internal rates of return (EIRR) to ascertain project efficiency for water supply, wastewater, urban drainage and urban transport components for the five sample interventions of three of the project urban local bodies (ULBs) were assessed upon project completion, and compared with appraisal estimates: (i) water supply in Nagaur, (ii) water supply in Bundi, (iii) sewerage in Sawai Madhopur, (iv) sewerage in Bundi, and (v) urban transport in Sawai Madhopur. Economic evaluation for some other project ULBs and urban drainage at Bharatpur were also undertaken due to the economic significance of the interventions. Economic reevaluation also includes sensitivity analysis, at a 20% reduction of future benefits. 2. Financial analysis assessed the ability of the ULBs and line agencies to meet its operation and maintenance (O&M) costs out of its revenue streams and was undertaken for five sample ULBs (including Nagaur, where water-supply facility handed over to the ULB). 3. The Public Health Engineering Department (PHED), Government of Rajasthan (GOR) operates the water supply system in the State, except for eight ULBs where the system had been transferred to the respective ULBs (which includes two project 2 ULBs of Nagaur and Karauli).1 The components of sewerage2 and urban drainage had been transferred to respective ULBs. The ROB had been transferred to Public Works Department (PWD), GOR and National Highways Authority of India (for Barmer ROB). The link road in Barmer has been transferred to Barmer Municipal Council. As the project 2 was not designed for capital cost recovery, operating ratios were calculated for the ULBs, and a review of the overall finances of urban development department (UDD), PHED and PWD were undertaken. 4. The economic and financial analysis was based on ADB’s Guidelines for the Economic Analysis of Projects (2017), Guidelines for the Economic Analysis of Water Supply Projects (1998) and Financial Management and Analysis of Projects (2005). Detailed assumptions for the analyses narrated separately. Data from GOR, PHED, investment program management unit (IPMU), investment program implementation units (IPIUs) and ULBs were used for analyses. Census 2011 data published by the government were used for population projections. Project costs were derived from the actual disbursement summary for each package by ADB and GOR.
5. By the end of the project, interventions in multiple sectors resulted in increased economic benefits from availability of regular water supply (mostly migrated from ground water to surface water), linking of house septic tanks to sewer network (though house service connections were financed by the GOR), time savings in using the rail-over-bridges (ROBs) over the railway crossings benefitted the citizens and commuters. ULBs were given sewer cleaning equipment, which were utilized, and some had outlived their economic life at the end of the project 2.
6. The project costs (in $ millions) include the disbursements made by ADB and the local costs incurred by GOR until 30 June 2017. The costs were converted to US Dollars at the
1 The staffs though transferred to urban local bodies (ULBs), but their salaries and administrative costs are booked
under the Public Health Engineering Department (PHED), Government of Rajasthan (GOR). 2 The sewage treatment plants (STPs) transferred to ULBs are under an operation and maintenance (O&M) contract
for 5 years from the date of completion. All STPs are currently managed under O&M contracts and O&M payments to the contractors are the responsibility of the respective ULBs, which supervise the O&M contract and services.

44 Appendix 9
exchange value on the date of disbursement and local costs incurred between 01 July 2017 and 30 November 2018 were converted at an average exchange value of ₹69.6049 = $1.3 The project costs at appraisal and at completion are in Table 9.1 below: Table 9.1: L2506: Project cost at appraisal and actual (by sector) (in $ million)
Item
At appraisal Actual
Foreign exchange
Local currency
Total Foreign
exchange Local
currency Total
Share (%)
A. Base cost
1. Urban infrastructure improvement
Water supply scheme 53.1 53.10 53.30 53.30 28.94% Sewerage and sanitation 45.3 45.30 48.07 48.07 26.10% Urban drainage 4.4 4.40 2.46 2.46 1.33% Urban transport 17.0 17.00 51.86 51.86 28.16% Resettlement 3.5 3.50 0.08 0.08 0.04%
Subtotal (1) 123.3 123.30 155.77 155.77
2. Capacity development and implementation support
Incremental administration 6.2 6.20 8.09 8.09 4.39%
Preparation and implementation assistance
10.2 10.20 11.12
11.12 6.04%
Capacity and institutional development
2.2 2.20 0.09
0.09 0.05%
Subtotal (2) 18.6 18.60 19.29 19.29 Subtotal 142.00 142.00 175.07 175.07
B. Contingency 40.3 40.30 0.00 0.00 Physical contingencies 13.4 13.40 0.00 0.00
Price contingencies 26.9 26.90 0.00 0.00
C. Tax and duties 19.7 19.70 4.69 4.69 2.55%
D. Financing charges during implementation
17.0 0.0 17.00 4.44 4.44 2.41%
Grand total 17.0 202.00 219.00 4.44 179.76 184.19 100.00%
Source: Asian Development Bank (ADB) and Government of Rajasthan (GOR)
Financing charges during implementation period obtained from http://aaad.gov.in/LoanLedg/A2506_IND.HTM for the L-2506-IND
B. Economic Evaluation 7. For the purpose of economic analysis, the financial cost has been converted into economic costs by applying prescribed conversion rates, adjusting for contingencies, taxes and duties but excluding the financing costs (interest during construction and commitment charges).
I. At Appraisal 8. The selection criteria for the subprojects require an EIRR exceeding economic opportunity cost of capital (EOCC) of 12% for investments under the project 2. The economic net present value (ENPV) for select subprojects, assessed during loan appraisal in 2008, were positive, applying discount rates of 12%. Sensitivity analysis indicated that EIRR was most sensitive to
3 Rates as of December 2018

Appendix 9 45
delays in realization of benefits, though EIRR remained above 12% in all sensitivity analyses (except for water supply intervention in Nagaur). Negative impact on competing water uses during drought conditions were also considered while computing EIRR. The project life was assumed at 30 years. The shadow wage factor of 0.75 and the shadow exchange factor of 1.1 are applied to convert financial values to economic values. 9. At appraisal, the sample towns and sectors that were considered for the economic evaluation and the resultant EIRR were: (i) 19.80% for water supply in Bundi, (ii) 13.00% for water supply in Nagaur, (iii) 17.00% for sewerage in Bundi, (iv) 24.10% for sewerage in Sawai Madhopur and (v) 27.90% for urban transport in Sawai Madhopur.
II. At Completion 10. The approach used during appraisal was applied for the recalculation of the EIRR and compared with EOCC of 12%. However, the selection of the project towns was widened considering the economic significance of the interventions across the project towns, which includes the towns and sectors evaluated during appraisal. For calculating population growth, the compounded annual growth rate of the population between Census 2001 and Census 2011 was used for projecting the population until 2038. 11. The economic viability of the sector is evaluated over a period of 25 years for water supply, 30 years for urban drainage and urban transport, and 35 years for wastewater, with no salvage value assumed thereafter. Cost benefit analyses were undertaken from completion of each subproject considering the actual cost of interventions. A shadow wage rate factor of 1.11 and shadow conversion factor of 1.0 were applied to convert financial cost to economic cost. The shadow exchange rate factor taken at 1.03.4 Parameters assumed are drawn from the end-term evaluation report of the Investment Program Performance & Monitoring System (IPPMS) Consultants, public surveys, field visits (during the project completion report mission) and discussions with officials and local residents.5 Additional details of the assumptions and summary of calculations are in Annexure 1 of Appendix 9. 12. Water supply: EIRR evaluation considered (i) the economic cost of interventions; (ii) average cost of procuring water from alternate sources; (iii) annual cost incurred for procuring water from alternate sources to meet the demand supply gap; and (iv) savings from water resource cost and health costs. Based on these assumptions the water supply interventions of Nagaur, Bundi, Dholpur, and Karauli were assessed. 13. Wastewater and urban drainage: EIRR evaluation considered (i) the economic cost of interventions, (ii) savings due to avoidance of flooding and attendant loss of livelihood; (iii) amount of loss avoided in managing wastewater, (iv) savings in health costs. 6 Based on these
4 Note: calculation method based on ADB. 2004. Shadow Exchange Rate for Project Economic Analysis. ERD
Technical Note Series No. 11. Manila. Average from 2012-2016 was 1.03. Source: Handbook of Statistics on Indian Economy, 2016; Table:127; Table:100. Shadow wage rate factor is 1.11 = Casual Agricultural Labour Cost (₹ Per Day) or L = ₹213 / National Minimum Wage of Unskilled Labour (₹ per Day) or M = ₹192.00; (Source: Wage Rate for Rajasthan, NREGA and Minimum wage for unskilled labour in Rajasthan (2018), http://www.paycheck.in/main/salary/minimumwages/rajasthan).
5 During the Project Completion Report Missions spread over November 2018 to April 2019; the Mission held consultations with officials of PHED, ULB, and IPMU and with local residents impacted by the project interventions.
6 Avoidance of septic tank construction cost ignored as it was found that sewer connections were given from the existing septic tanks and all residents prefer to construct the septic tanks outside the house;

46 Appendix 9
assumptions the wastewater interventions of Bundi, Dholpur, and Sawai Madhopur and urban drainage at Bharatpur were assessed for economic viability. 14. Urban Transport: Economic evaluation considered avoidance of income loss due to time savings. Data of time savings, movement of vehicles, and avoidance of accidents at railway crossings after completion of the transport interventions for the economic viability of interventions in the transport sector were referred from the end-term evaluation report of the IPPMS consultants that did the survey and held discussions with residents (they have expressed satisfaction due to time-saving during rush school and office hours). In addition, during the field mission, the local officials and residents expressed satisfaction with the transport interventions. Based on these assumptions the urban transport intervention in Sawai Madhopur was assessed.
III. Analysis and re-evaluation of Findings 15. The EIRR to ascertain project efficiency for water supply, wastewater, urban drainage and urban transport components for all project 2 ULBs were assessed upon project completion along with the total intervention cost of the component, and is rated efficient for the project. EIRR calculated at completion is higher than the benchmark value of 12%, justifying project investments. Several indirect and direct benefits could not be quantified and hence have not been captured in the analysis, though qualitative assessments demonstrate their contribution in improving urban environment and quality of life of project 2 ULBs. The summary of EIRR for executed project components at completion is in Table 9.2. Table 9.2. Summary of EIRR at completion
Component ENPV at Completion
EIRR at Appraisal EIRR at Completion
(Base)
EIRR at Completion (20% Reduction of
Benefits)
Water supply
Nagaur 6.49 10.8% 23.9% 19.9%
Dholpur 6.97 Not assessed 21.4% 17.8%
Karauli 3.12 Not assessed 16.9% 13.7%
Bundi 5.85 13.0% 22.1% 18.4%
Barmer 5.06 Not assessed 21.2% 17.8%
Bharatpur 19.08 Not assessed 38.1% 33.7%
Churu 3.55 Not assessed 18.6% 16.1%
Rajsamand 4.36 Not assessed 19.4% 16.1%
Sawai Madhopur 8.70 Not assessed 25.8% 22.2%
Sikar 10.90 Not assessed 24.9% 21.9%
All Towns Combined 73.55 Not assessed 23.5% 20.0%
Wastewater
Dholpur 2.06 Not assessed 13.6% 11.5%
Sawai Madhopur 1.98 24.1% 14.9% 11.9%
Bundi 0.96 17.0% 14.6% 12.3%
Bharatpur (incl. Urban Drainage)
2.60 Not assessed 17.2% 14.3%
Alwar 5.83 Not assessed 22.7% 19.9%
Barmer 0.37 Not assessed 12.9% 10.4%
Jhalwar 1.31 Not assessed 16.8% 14.1%
Nagaur 0.45 Not assessed 13.1% 10.6%
Rajsamand 0.20 Not assessed 12.5% 10.3%

Appendix 9 47
Component ENPV at Completion
EIRR at Appraisal EIRR at Completion
(Base)
EIRR at Completion (20% Reduction of
Benefits)
Sikar (incl. Urban Drainage)
1.28 Not assessed 17.8% 14.6%
All Towns Combined 17.18 Not assessed 15.3% 10.4%
Urban Drainage
Bharatpur (separate) 2.76 Not assessed 26.9% 22.2%
Urban Transport
Sawai Madhopur 6.19 27.9% 24.4% 20.3%
Alwar 7.99 Not assessed 22.2% 19.9%
Baran 1.12 Not assessed 13.1% 11.5%
Barmer 3.74 Not assessed 17.4% 15.4%
Bharatpur 4.70 Not assessed 15.4% 13.6%
Bundi 4.64 Not assessed 18.5% 16.5%
Chittorgarh 9.91 Not assessed 30.4% 26.8%
Churu 1.34 Not assessed 13.3% 11.6%
Sikar 42.35 Not assessed 30.6% 27.7%
All Towns Combined 81.99 Not assessed 20.9% 18.6%
Total Project 124.55 19.2%
EIRR = economic internal rate of return, ENPV = economic net present value
16. EIRR at completion for water supply in Nagaur and Bundi components are higher than appraisal estimates, as beneficiaries’ welfare increased significantly beyond appraisal estimates and considering health benefits during re-evaluation. In case of wastewater components, EIRR is lower than appraisal estimates at Bundi and Sawai Madhopur, as the house sewer connections (HSCs) being provided using GOR’s funds are yet to be completed, and is likely to significantly increase upon completion of the HSCs.7 EIRR for urban transport in Sawai Madhopur is marginally lower than the appraisal estimates as the number of trains crossing the ROB decreased during the period between appraisal and completion. C. Financial Evaluation
I. At Appraisal 17. Financial viability evaluation of the project was considered for the entire MFF and financial sustainability analysis for project 2 ULBs were carried out during loan appraisal.8 The weighted average cost of capital (WACC) was considered at 3.35%. The financial evaluation was carried out for water supply and sewerage projects of three towns – Bundi, Sawai Madhopur and Nagaur. Financial evaluations were not carried out for the urban drainage, urban transport and roads infrastructure components at appraisal and at completion. 18. The financial evaluation at appraisal for water supply and sewerage interventions considered water tariffs, sewerage cess, water demand assessment, the number of connections, and the gradual reduction of non-revenue water. The base financial internal rate of return (FIRR) was assessed to be (i) 17.2% for water supply in Bundi, (ii) -8.3% for sewerage in Bundi, (iii) 17.3% for water supply in Sawai Madhopur, (iv) -8.4% for sewerage in Sawai Madhopur, (v) 13.9% for 7 GOR and ULBs are presently providing property connections in other government programs like AMRUT and other
state programs 8 Source: Periodic Financing Request dated 10 October 2008.

48 Appendix 9
water supply in Nagaur and (vi) -5.4% for sewerage in Nagaur. The evaluation also considered sensitivity analysis under situations of (i) capital cost + 10%, (ii) O&M Cost + 10%, (iii) benefit -10% and (iv) the worst case. 19. The analysis at appraisal concluded that O&M costs for sewerage subprojects would be fully covered by the proposed sewerage tariff. The analysis further concluded that for the water supply systems in the sample ULBs, with the proposed water tariff increase, the target established in the institutional and financial improvement action plan in the framework financing agreement (FFA) requiring water tariff levels to be sufficient to cover full O&M of the water operation of each ULB would be achieved.
II. At Completion 20. Except for the water supply systems in Nagaur and Karauli, the PHED continues to manage the water supply systems in other project towns. Sewerage cess are being collected incrementally as and when HSCs are provided by ULBs. GOR’s notification in 2015 introduced tariffs for water supply and sewerage with a proviso for an automatic annual increment of 10%.9 GOR re-notified water tariffs with effect from 01 April 2019.10 ULBs’ finances are strengthened by compensation grants (in lieu of Octroi-tax on goods, since abolished, and other taxes subsumed under the Goods and Service Tax Act, 2017) and transfers from State Finance Commissions (SFCs) and Central Finance Commissions (CFCs), which account for about 30-40% of ULB finances, of which up to 90% may be used for O&M of municipal assets. 21. The overall performance of five sample ULBs under the project were considered to assess the financial capacity to manage urban infrastructure as exhibited in Table 9.3–9.7. The audited annual financial statements of the ULBs that were prepared as part of the accounting reforms and implementation of double-entry accounting system were used for undertaking the analysis. Table 9.3: Financial Performance of Karauli (in $ Million)
Particulars FY 2014 FY 2015 FY 2016 FY 2017
Own source revenue
Income from taxes 0.03 0.08 0.77 0.21
Fees & user charges 3.30 0.66 1.01 2.40
Other income 0.34 0.44 0.36 0.24
Assigned revenue, compensation, grants, & subsidies
2.43 2.17 2.91 3.03
Total revenue (A) 6.10 3.35 5.05 5.87
Expenditure
Establishment expenses 1.65 1.63 1.78 2.08
General admin expenses 0.22 0.29 0.44 0.53
Other expenses (public works, O&M expenses, programmed expenses)
2.98 1.34 1.65 2.08
9 PHED, GOR Notification No. F/FA&CAO/RWSSMB/Mission/2014-15, dated 05 November 2015 detailed water tariffs
for domestic monthly consumption up to 8,000 litres (₹1.56/KL), for consumption exceeding 8,000 litres up to 15,000 litres (₹2.00/KL), and others.
10 PHED, GOR Notification Np. F/FA&CAO/RWSSMB/Mission/2018-19/1450-1466 dated 08 March 2019. The recent notification revised to levy no water charges up to monthly consumption of 15,000 litres using up to 15 mm diameter pipes (there would be application of nominal fixed charges). For consumers using pipes between 15 MM and 25 MM, monthly charges would be applicable for consumption of more than 15,000 litres and it would be a flat charge.

Appendix 9 49
Particulars FY 2014 FY 2015 FY 2016 FY 2017
Total expenses (B) 4.85 3.26 3.86 4.69
Revenue surplus / (deficit) (A) - (B)
1.25 0.09 1.19 1.18
Operating ratio [operating expense or (B) / revenue receipts or (A)]
0.79 0.97 0.76 0.80
Share of own source revenue of total revenue
60.22% 35.11% 42.32% 48.38%
Table 9.4: Financial Performance of Nagaur (in $ Million)
Particulars FY 2014 FY 2015 FY 2016 FY 2017
Own source revenue
Income from taxes 0.00 0.00 0.00 0.04
Fees & user charges 1.16 0.79 0.52 0.62
Other income 0.90 0.56 0.49 1.03
Assigned revenue, compensation, grants, & subsidies
1.85 1.66 2.41 2.74
Total revenue (A) 3.91 3.02 3.42 4.43
Expenditure
Establishment expenses 1.19 1.24 1.36 1.54
General admin expenses 0.59 0.39 0.58 0.20
Other expenses (public works, O&M expenses, programmed expenses)
1.57 1.33 1.36 2.93
Total expenses (B) 3.35 2.97 3.29 4.67
Revenue surplus / (deficit) (A) - (B)
0.56 0.05 0.13 (0.24)
Operating ratio [operating expense or (B) / revenue receipts or (A)]
0.86 0.98 0.96 1.05
Share of own source revenue of total revenue
52.66% 44.97% 29.57% 38.22%

50 Appendix 9
Table 9.5: Financial Performance of Alwar (in $ Million)
Particulars FY 2014 FY 2015 FY 2016 FY 2017
Own source revenue
Income from taxes 0.27 0.30 0.48 0.14
Fees & user charges 0.35 0.50 0.44 0.65
Other income 0.22 0.14 0.17 0.24
Assigned revenue, compensation, grants, & subsidies
3.50 2.67 3.68 4.26
Total revenue (A) 4.35 3.62 4.77 5.30
Expenditure
Establishment expenses 2.02 2.13 2.20 2.32
General admin expenses 0.14 0.11 0.12 0.14
Other expenses (public works, O&M expenses, programmed expenses)
2.09 1.62 1.83 2.36
Total expenses (B) 4.25 3.86 4.15 4.83
Revenue surplus / (deficit) (A) - (B)
0.10 (0.24) 0.62 0.47
Operating ratio [operating expense or (B) / revenue receipts or (A)]
0.98 1.07 0.87 0.91
Share of own source revenue of total revenue
19.36% 26.13% 22.87% 19.59%
Table 9.6: Financial Performance of Dholpur (in $ Million)
Particulars FY 2014 FY 2015 FY 2016 FY 2017
Own source revenue
Income from taxes 0.00 0.01 0.03 0.02
Fees & user charges 0.55 0.27 0.17 0.24
Other income 0.28 0.17 0.15 0.38
Assigned revenue, compensation, grants, & subsidies
1.13 1.19 1.48 0.95
Total revenue (A) 1.95 1.63 1.82 1.58
Expenditure
Establishment expenses 0.82 0.97 0.99 1.03
General admin expenses 0.20 0.07 0.05 0.03
Other expenses (public works, O&M expenses, programmed expenses)
0.73 0.87 0.82 0.47
Total expenses (B) 1.75 1.91 1.86 1.54
Revenue surplus / (deficit) (A) - (B)
0.20 (0.28) (0.04) 0.04
Operating ratio [operating expense or (B) / revenue receipts or (A)]
0.90 1.17 1.02 0.97
Share of own source revenue of total revenue
42.25% 27.00% 18.97% 40.03%

Appendix 9 51
Table 9.7: Financial Performance of Bundi (in $ Million)
Particulars FY 2014 FY 2015 FY 2016 FY 2017 Own source revenue
Income from taxes 0.00 - 0.12 0.07 Fees & user charges 0.64 0.34 0.19 0.23 Other income 0.38 0.21 0.68 0.28 Assigned revenue, compensation, grants, & subsidies
1.73 1.98 2.72 2.78
Total revenue (A) 2.76 2.53 3.72 3.38 Expenditure
Establishment expenses 1.36 1.45 1.49 1.68 General admin expenses 0.06 0.04 0.23 0.27 Other expenses (public works, O&M expenses, programmed expenses)
1.03 1.26 1.64 1.68
Total expenses (B) 2.45 2.75 3.36 3.63 Revenue surplus / (deficit) (A) - (B)
0.31 (0.22) 0.36 (0.25)
Operating ratio [operating expense or (B) / revenue receipts or (A)]
0.89 1.09 0.90 1.07
Share of own source revenue of total revenue
37.16% 21.66% 26.73% 17.57%
Source: Audited annual financial statements of ULBs and ADB Estimates; Conversion at an average exchange value of ₹69.6049 = $1
22. For the ULBs, in most of the years analyzed the operating ratio is less than 1.0 indicating that the ULBs have the financial capacity to meet its operating expenses out of its internal revenue and assigned compensations. With the implementation of the Fourteenth CFC recommendations, the Centre is transferring 42% of the divisible pool as untied and non-conditional grants, while the share of ULBs from GOR has also increased. The introduction of fiscal reforms in the last two financial years, at Centre and State Government levels in the form of Goods and Service Tax, which subsumed many local body taxes like entry tax, octroi, and advertisement tax (most levied by the ULBs across India), is also being compensated by the Centre and GOR. 23. The financial performance of the Urban Development Department, GOR was considered (refer Table 9.8) to assess the expenditure capacity and the capacity of the Department to support ULBs out of the GOR’s budget allocation.
Table 9.8: Urban Development Department (in $ Million)
Particulars 2012-13 2013-14 2014-15 2015-16 2016-17 2017-18
Revenue & Receipts
1. Revenue Receipts (0217) 0.73 0.76 1.14 0.78 2.63 1.01
2. Loans and Borrowings (6217) 0.37 0.91 5.61 0.38 1.66 0.65
Total Revenue 1.10 1.68 6.75 1.16 4.30 1.65
Expenditure
3. Revenue Expenditure (2217) = A + B + C 357.03 350.43 368.92 460.84 680.18 603.86
A. Non-Plan Expenditure / Out of State Funds/a 206.50 231.08 226.23 297.95 325.06 544.97
B. Plan Expenditure / Out of Central Funds/b 150.44 119.24 142.68 162.89 355.12 58.89
C. Centrally Sponsored Schemes Expenditure 0.09 0.12 - - - -
4. Capital Expenditure (4217) = A + B + C 141.84 154.10 75.34 68.59 127.13 132.69
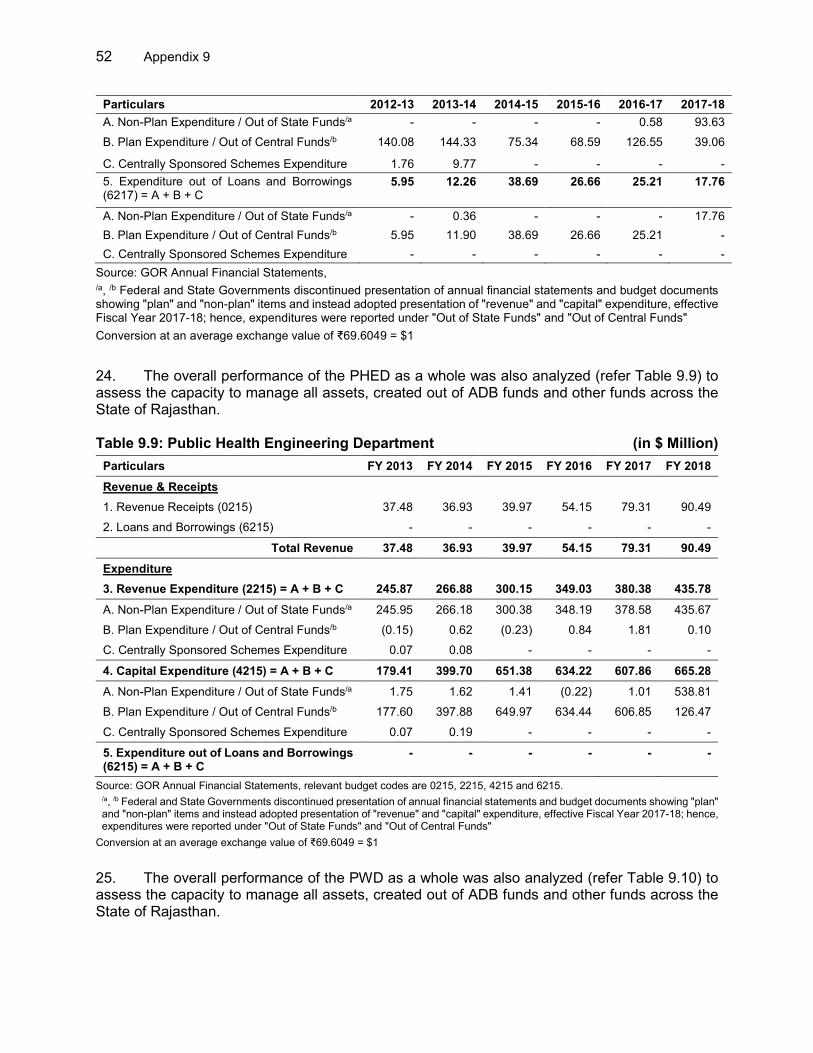
52 Appendix 9
Particulars 2012-13 2013-14 2014-15 2015-16 2016-17 2017-18
A. Non-Plan Expenditure / Out of State Funds/a - - - - 0.58 93.63
B. Plan Expenditure / Out of Central Funds/b 140.08 144.33 75.34 68.59 126.55 39.06
C. Centrally Sponsored Schemes Expenditure 1.76 9.77 - - - -
5. Expenditure out of Loans and Borrowings (6217) = A + B + C
5.95 12.26 38.69 26.66 25.21 17.76
A. Non-Plan Expenditure / Out of State Funds/a - 0.36 - - - 17.76
B. Plan Expenditure / Out of Central Funds/b 5.95 11.90 38.69 26.66 25.21 -
C. Centrally Sponsored Schemes Expenditure - - - - - -
Source: GOR Annual Financial Statements, /a, /b Federal and State Governments discontinued presentation of annual financial statements and budget documents showing "plan" and "non-plan" items and instead adopted presentation of "revenue" and "capital" expenditure, effective Fiscal Year 2017-18; hence, expenditures were reported under "Out of State Funds" and "Out of Central Funds"
Conversion at an average exchange value of ₹69.6049 = $1
24. The overall performance of the PHED as a whole was also analyzed (refer Table 9.9) to assess the capacity to manage all assets, created out of ADB funds and other funds across the State of Rajasthan. Table 9.9: Public Health Engineering Department (in $ Million)
Particulars FY 2013 FY 2014 FY 2015 FY 2016 FY 2017 FY 2018
Revenue & Receipts
1. Revenue Receipts (0215) 37.48 36.93 39.97 54.15 79.31 90.49
2. Loans and Borrowings (6215) - - - - - -
Total Revenue 37.48 36.93 39.97 54.15 79.31 90.49
Expenditure
3. Revenue Expenditure (2215) = A + B + C 245.87 266.88 300.15 349.03 380.38 435.78
A. Non-Plan Expenditure / Out of State Funds/a 245.95 266.18 300.38 348.19 378.58 435.67
B. Plan Expenditure / Out of Central Funds/b (0.15) 0.62 (0.23) 0.84 1.81 0.10
C. Centrally Sponsored Schemes Expenditure 0.07 0.08 - - - -
4. Capital Expenditure (4215) = A + B + C 179.41 399.70 651.38 634.22 607.86 665.28
A. Non-Plan Expenditure / Out of State Funds/a 1.75 1.62 1.41 (0.22) 1.01 538.81
B. Plan Expenditure / Out of Central Funds/b 177.60 397.88 649.97 634.44 606.85 126.47
C. Centrally Sponsored Schemes Expenditure 0.07 0.19 - - - -
5. Expenditure out of Loans and Borrowings (6215) = A + B + C
- - - - - -
Source: GOR Annual Financial Statements, relevant budget codes are 0215, 2215, 4215 and 6215. /a, /b Federal and State Governments discontinued presentation of annual financial statements and budget documents showing "plan" and "non-plan" items and instead adopted presentation of "revenue" and "capital" expenditure, effective Fiscal Year 2017-18; hence, expenditures were reported under "Out of State Funds" and "Out of Central Funds"
Conversion at an average exchange value of ₹69.6049 = $1
25. The overall performance of the PWD as a whole was also analyzed (refer Table 9.10) to assess the capacity to manage all assets, created out of ADB funds and other funds across the State of Rajasthan.

Appendix 9 53
Table 9.10: Public Works Department (in $ Million)
Particulars FY 2013 FY 2014 FY 2015 FY 2016 FY 2017 FY 2018
Revenue & Receipts
1. Revenue Receipts (0059) 8.35 10.02 10.40 14.19 12.22 15.83
2. Revenue Receipts (1054) 0.46 0.60 1.03 0.90 0.95 0.99
3. Loans and Borrowings - - - - - -
8.81 10.63 11.43 15.09 13.17 16.82
Expenditure
3. Revenue Expenditure (2059, 3054) = A + B + C + D + E + F
195.07 218.84 235.21 207.26 225.93 239.48
Code 2059
A. Non-Plan Expenditure / Out of State Funds/a 17.71 11.51 10.83 19.62 21.92 8.56
B. Plan Expenditure / Out of Central Funds/b 0.14 - 0.02 0.06 0.12 -
C. Centrally Sponsored Schemes Expenditure - - - - - -
Code 3054
D. Non-Plan Expenditure / Out of State Funds/a 115.45 135.40 141.42 92.14 85.19 144.51
E. Plan Expenditure / Out of Central Funds/b 61.77 71.93 82.94 95.44 118.70 86.41
F. Centrally Sponsored Schemes Expenditure - - - - - -
4. Capital Expenditure (4059, 5054) = A + B + C + D + E + F
229.61 362.69 454.63 488.68 397.58 708.91
Code 4059
A. Non-Plan Expenditure / Out of State Funds/a 1.51 2.10 - - - -
B. Plan Expenditure / Out of Central Funds/b 23.23 36.96 1.71 0.10 0.13 44.01
C. Centrally Sponsored Schemes Expenditure 0.27 0.86 60.71 48.84 46.60 7.03
Code 5054
D. Non-Plan Expenditure / Out of State Funds/a - - - - - 526.29
E. Plan Expenditure / Out of Central Funds/b 190.14 307.05 392.22 439.74 350.85 131.58
F. Centrally Sponsored Schemes Expenditure 14.47 15.71 - - - -
5. Expenditure out of Loans and Borrowings = A + B + C
- - - - - -
A. Non-Plan Expenditure / Out of State Funds/a - - - - - -
B. Plan Expenditure / Out of Central Funds/b - - - - - -
C. Centrally Sponsored Schemes Expenditure - - - - - -
Source: GOR Annual Financial Statements, relevant budget codes are 0059, 1054, 2059, 3054, 4059 and 5054.
/a, /b Federal and State Governments discontinued presentation of annual financial statements and budget documents showing "plan" and "non-plan" items and instead adopted presentation of "revenue" and "capital" expenditure, effective Fiscal Year 2017-18; hence, expenditures were reported under "Out of State Funds" and "Out of Central Funds"
Conversion at an average exchange value of ₹69.6049 = $1
I. Analysis and Re-evaluation Findings
26. The water supply, sewerage, urban transport, and drainage interventions have been necessary to provide basic services to the citizens and to protect the environment by reducing (i) ground water depletion, (ii) discharge of untreated wastewater to water bodies, and (iii) road traffic accidents and travel time within ULBs. With the recent changes in GOR policies

54 Appendix 9
(implementation of pro-poor water and sewerage tariffs) and introduction of Goods and Service Tax (unified indirect taxes) at the national level, the Centre and GOR duly fulfill their obligations mandated by Article 243X of the Constitution of India, by consistent and timely support toward O&M of municipal assets, including project assets, and ensure citizens have continued access to basic urban services. Fiscal reforms and policies at both the GOR and ULB levels, and innovative taxes and charges at the ULB levels, such as like value capture financing, destination-based charges on display of commercial and non-commercial hoardings/billboards, could be leveraged to strengthen municipal services delivery and governance.

Annexure Appendix 9 55
Summary of EIRR Calculation
1. Water Supply: The assumptions used for EIRR calculations were:
(i) Population coverage based on DMF/IPPMS/field observation.
(ii) Average cost of procuring safe water estimated based on The World Bank (2017): Waterlife - Improving Access to Safe Drinking Water in India.
(iii) Tariff on additional water (assumed based on consultation with officials during field mission).
(iv) Incidence of water/vector borne diseases estimated based on National Health Profile (2016, 2017, 2018) published by Government of India and Saxena & Chabra (2004): A status survey of common water-borne diseases in desert city Bikaner (NW Rajasthan, India), Journal of Communicative Diseases, 36(1).
(v) Average annual income loss of households due to sick days estimated based on The World Bank (2017), KEIIP Study (2008), Government of India (2005): Burden of Diseases, National Commission on Macroeconomics and Health.
EIRR: Nagaur Water Supply ($ million)
Sl. No. Year
Economic cost:
CAPEX O&M cost
Total cost
Benefit: savings in water procurement
cost
Benefit: savings in health cost
Total benefits
Net benefits
1 2007 1.21
1.21
- -1.21
2 2008 1.21
1.21
- -1.21
3 2009 1.21
1.21
- -1.21
4 2010 1.21
1.21
- -1.21
5 2011 1.21
1.21
- -1.21
6 2012
0.35 0.35 0.31 2.09 2.39 2.05
7 2013
0.35 0.35 0.46 2.11 2.58 2.23
8 2014
0.35 0.35 0.47 2.14 2.61 2.27
9 2015
0.35 0.35 0.48 2.17 2.65 2.30
10 2016
0.35 0.35 0.48 2.20 2.69 2.34
11 2017
0.35 0.35 0.49 2.23 2.72 2.38
12 2018
0.35 0.35 0.50 2.26 2.76 2.41
13 2019
0.35 0.35 0.50 2.29 2.80 2.45
14 2020
0.35 0.35 0.51 2.33 2.84 2.49
15 2021
0.35 0.35 0.52 2.36 2.88 2.53
16 2022
0.35 0.35 0.53 2.39 2.91 2.57
17 2023
0.35 0.35 0.53 2.42 2.95 2.61
18 2024
0.35 0.35 0.54 2.46 3.00 2.65
19 2025
0.35 0.35 0.55 2.49 3.04 2.69
20 2026
0.35 0.35 0.55 2.52 3.08 2.73
21 2027
0.35 0.35 0.56 2.56 3.12 2.77
22 2028
0.35 0.35 0.57 2.59 3.16 2.82

56 Appendix 9 Annexure
Sl. No. Year
Economic cost:
CAPEX O&M cost
Total cost
Benefit: savings in water procurement
cost
Benefit: savings in health cost
Total benefits
Net benefits
23 2029
0.35 0.35 0.58 2.63 3.21 2.86
24 2030
0.35 0.35 0.59 2.66 3.25 2.90
25 2031
0.35 0.35 0.59 2.70 3.29 2.95
26 2032
0.35 0.35 0.60 2.74 3.34 2.99
27 2033
0.35 0.35 0.61 2.78 3.39 3.04
28 2034
0.35 0.35 0.62 2.81 3.43 3.09
29 2035
0.35 0.35 0.63 2.85 3.48 3.13
30 2036
0.35 0.35 0.64 2.89 3.53 3.18
Total 6.03 8.66 14.69 13.41 61.68 75.09 60.40
ENPV
6.49
EIRR
23.85%

Annexure Appendix 9 57
EIRR: Dholpur Water Supply ($ million)
Sl. No. Year
Economic cost:
CAPEX O&M cost
Total cost
Benefit: savings in water
procurement cost
Benefit: savings in health cost
Total benefits
Net benefits
1 2007 1.32
1.32
- -1.32
2 2008 1.32
1.32
- -1.32
3 2009 1.32
1.32
- -1.32
4 2010 1.32
1.32
- -1.32
5 2011 1.32
1.32
- -1.32
6 2012 1.32
1.32
- -1.32
7 2013
0.40 0.40 0.40 2.67 3.06 2.67
8 2014
0.60 0.60 0.60 2.74 3.34 2.74
9 2015
0.62 0.62 0.62 2.81 3.42 2.81
10 2016
0.63 0.63 0.63 2.88 3.51 2.88
11 2017
0.65 0.65 0.65 2.95 3.60 2.95
12 2018
0.67 0.67 0.67 3.03 3.69 3.03
13 2019
0.68 0.68 0.68 3.11 3.79 3.11
14 2020
0.70 0.70 0.70 3.19 3.89 3.19
15 2021
0.72 0.72 0.72 3.27 3.99 3.27
16 2022
0.74 0.74 0.74 3.35 4.09 3.35
17 2023
0.76 0.76 0.76 3.44 4.19 3.44
18 2024
0.77 0.77 0.77 3.52 4.30 3.52
19 2025
0.79 0.79 0.79 3.62 4.41 3.62
20 2026
0.82 0.82 0.82 3.71 4.52 3.71
21 2027
0.84 0.84 0.84 3.80 4.64 3.80
22 2028
0.86 0.86 0.86 3.90 4.76 3.90
23 2029
0.88 0.88 0.88 4.00 4.88 4.00
24 2030
0.90 0.90 0.90 4.10 5.01 4.10
25 2031
0.93 0.93 0.93 4.21 5.13 4.21
26 2032
0.95 0.95 0.95 4.32 5.27 4.32
27 2033
0.97 0.97 0.97 4.43 5.40 4.43
28 2034
1.00 1.00 1.00 4.54 5.54 4.54
29 2035
1.02 1.02 1.02 4.66 5.68 4.66
30 2036
1.05 1.05 1.05 4.78 5.83 4.78
Total 7.91 18.93 26.85 18.93 87.00 105.93 79.09
ENPV
6.97
EIRR
21.38%

58 Appendix 9 Annexure
EIRR: Karauli Water Supply ($ million)
Sl. No. Year
Economic cost:
CAPEX O&M cost
Total cost
Benefit: savings in water
procurement cost
Benefit: savings in health cost
Total benefits
Net benefits
1 2007 1.54
1.54
- -1.54
2 2008 1.54
1.54
- -1.54
3 2009 1.54
1.54
- -1.54
4 2010 1.54
1.54
- -1.54
5 2011 1.54
1.54
- -1.54
6 2012
0.44 0.44 0.25 1.68 1.92 1.48
7 2013
0.44 0.44 0.38 1.71 2.09 1.65
8 2014
0.44 0.44 0.39 1.75 2.14 1.70
9 2015
0.44 0.44 0.39 1.79 2.19 1.74
10 2016
0.44 0.44 0.40 1.83 2.24 1.79
11 2017
0.44 0.44 0.41 1.88 2.29 1.85
12 2018
0.44 0.44 0.42 1.92 2.34 1.90
13 2019
0.44 0.44 0.43 1.96 2.39 1.95
14 2020
0.44 0.44 0.44 2.01 2.45 2.01
15 2021
0.44 0.44 0.45 2.05 2.50 2.06
16 2022
0.44 0.44 0.46 2.10 2.56 2.12
17 2023
0.44 0.44 0.47 2.15 2.62 2.18
18 2024
0.44 0.44 0.48 2.20 2.68 2.24
19 2025
0.44 0.44 0.49 2.25 2.74 2.30
20 2026
0.44 0.44 0.50 2.30 2.80 2.36
21 2027
0.44 0.44 0.52 2.35 2.87 2.42
22 2028
0.44 0.44 0.53 2.40 2.93 2.49
23 2029
0.44 0.44 0.54 2.46 3.00 2.55
24 2030
0.44 0.44 0.55 2.51 3.07 2.62
25 2031
0.44 0.44 0.56 2.57 3.14 2.69
26 2032
0.44 0.44 0.58 2.63 3.21 2.76
27 2033
0.44 0.44 0.59 2.69 3.28 2.84
28 2034
0.44 0.44 0.60 2.75 3.35 2.91
29 2035
0.44 0.44 0.62 2.81 3.43 2.99
30 2036
0.44 0.44 0.63 2.88 3.51 3.07
Total 7.69 11.06 18.75 12.11 55.61 67.72 48.97
ENPV
3.12
EIRR
16.95%

Annexure Appendix 9 59
EIRR: Bundi Water Supply ($ million)
Sl. No. Year
Economic cost:
CAPEX O&M cost
Total cost
Benefit: savings in water procurement
cost
Benefit: savings in health cost
Total benefits
Net benefits
1 2007 1.26
1.26
- -1.26
2 2008 1.26
1.26
- -1.26
3 2009 1.26
1.26
- -1.26
4 2010 1.26
1.26
- -1.26
5 2011 1.26
1.26
- -1.26
6 2012
0.36 0.36 0.28 1.89 2.17 1.81
7 2013
0.36 0.36 0.43 1.94 2.36 2.00
8 2014
0.36 0.36 0.44 1.98 2.41 2.05
9 2015
0.36 0.36 0.45 2.02 2.47 2.11
10 2016
0.36 0.36 0.46 2.07 2.53 2.16
11 2017
0.36 0.36 0.47 2.12 2.58 2.22
12 2018
0.36 0.36 0.48 2.17 2.64 2.28
13 2019
0.36 0.36 0.49 2.21 2.70 2.34
14 2020
0.36 0.36 0.50 2.27 2.76 2.40
15 2021
0.36 0.36 0.51 2.32 2.83 2.46
16 2022
0.36 0.36 0.52 2.37 2.89 2.53
17 2023
0.36 0.36 0.53 2.42 2.96 2.59
18 2024
0.36 0.36 0.54 2.48 3.02 2.66
19 2025
0.36 0.36 0.56 2.54 3.09 2.73
20 2026
0.36 0.36 0.57 2.59 3.16 2.80
21 2027
0.36 0.36 0.58 2.65 3.23 2.87
22 2028
0.36 0.36 0.60 2.71 3.31 2.95
23 2029
0.36 0.36 0.61 2.77 3.38 3.02
24 2030
0.36 0.36 0.62 2.84 3.46 3.10
25 2031
0.36 0.36 0.64 2.90 3.54 3.18
26 2032
0.36 0.36 0.65 2.97 3.62 3.26
27 2033
0.36 0.36 0.67 3.04 3.70 3.34
28 2034
0.36 0.36 0.68 3.10 3.79 3.42
29 2035
0.36 0.36 0.70 3.18 3.87 3.51
30 2036
0.36 0.36 0.71 3.25 3.96 3.60
Total 6.31 9.07 15.38 13.67 62.79 76.46 61.08
ENPV
5.85
EIRR
22.07%

60 Appendix 9 Annexure
2. Wastewater and Urban Drainage: The assumptions used for EIRR calculations were:
(i) Population coverage estimated based on DMF/field observations.
(ii) Incidence of water/vector borne diseases estimated based on National Health Profile (2016, 2017, 2018) published by Government of Indiaand Saxena & Chabra (2004): A status survey of common water-borne diseases in desert city Bikaner (NW Rajasthan, India), Journal of Communicative Diseases, 36(1).
(iii) Average expenditure for treating water/vector borne diseases - estimated based on The World Bank (2017): Waterlife - Improving access to safe drinking water in India.
(iv) Number of days by which absence from work is reduced (assumption based on consultation).
(v) Percentage of households affected by flooding/water logging - assumption based on consultation.
EIRR: Dholpur Wastewater ($ million)
Sl. No. Year Economic
cost: CAPEX O&M cost
Total cost
Benefit: savings in health cost
Benefit: avoidance of loss of income
Total benefits
Net benefits
1 2009 2.02
2.02
- -2.02
2 2010 2.02
2.02
- -2.02
3 2011 2.02
2.02
- -2.02
4 2012 2.02
2.02
- -2.02
5 2013 2.02
2.02
- -2.02
6 2014 2.02
2.02
- -2.02
7 2015 2.02
2.02
- -2.02
8 2016 2.02
2.02
- -2.02
9 2017
0.56 0.56 3.31 0.19 3.50 2.94
10 2018
0.56 0.56 3.40 0.19 3.59 3.03
11 2019
0.56 0.56 3.49 0.20 3.68 3.12
12 2020
0.56 0.56 3.58 0.20 3.78 3.22
13 2021
0.56 0.56 3.67 0.21 3.87 3.32
14 2022
0.56 0.56 3.76 0.21 3.97 3.42
15 2023
0.56 0.56 3.86 0.22 4.08 3.52
16 2024
0.56 0.56 3.96 0.22 4.18 3.62
17 2025
0.56 0.56 4.06 0.23 4.29 3.73
18 2026
0.56 0.56 4.16 0.23 4.40 3.84
19 2027
0.56 0.56 4.27 0.24 4.51 3.95
20 2028
0.56 0.56 4.38 0.25 4.63 4.07
21 2029
0.56 0.56 4.49 0.25 4.74 4.19
22 2030
0.56 0.56 4.61 0.26 4.87 4.31
23 2031
0.56 0.56 4.72 0.27 4.99 4.43
24 2032
0.56 0.56 4.85 0.27 5.12 4.56
25 2033
0.56 0.56 4.97 0.28 5.25 4.69
26 2034
0.56 0.56 5.10 0.29 5.38 4.83
27 2035
0.56 0.56 5.23 0.29 5.52 4.97
Annexure Appendix 9 61
Sl. No. Year Economic
cost: CAPEX O&M cost
Total cost
Benefit: savings in health cost
Benefit: avoidance of loss of income
Total benefits
Net benefits
28 2036
0.56 0.56 5.36 0.30 5.66 5.11
29 2037
0.56 0.56 5.50 0.31 5.81 5.25
30 2038
0.56 0.56 5.64 0.32 5.96 5.40
31 2039
0.56 0.56 5.79 0.33 6.11 5.55
32 2040
0.56 0.56 5.93 0.33 6.27 5.71
33 2041
0.56 0.56 6.09 0.34 6.43 5.87
34 2042
0.56 0.56 6.24 0.35 6.59 6.04
35 2043
0.56 0.56 6.40 0.36 6.76 6.21
36 2044
0.56 0.56 6.57 0.37 6.94 6.38
37 2045
0.56 0.56 6.74 0.38 7.11 6.56
38 2046
0.56 0.56 6.91 0.39 7.30 6.74
Total 16.16 16.73 32.89 147.01 8.28 155.29 122.40
ENPV
2.06
EIRR
13.56%
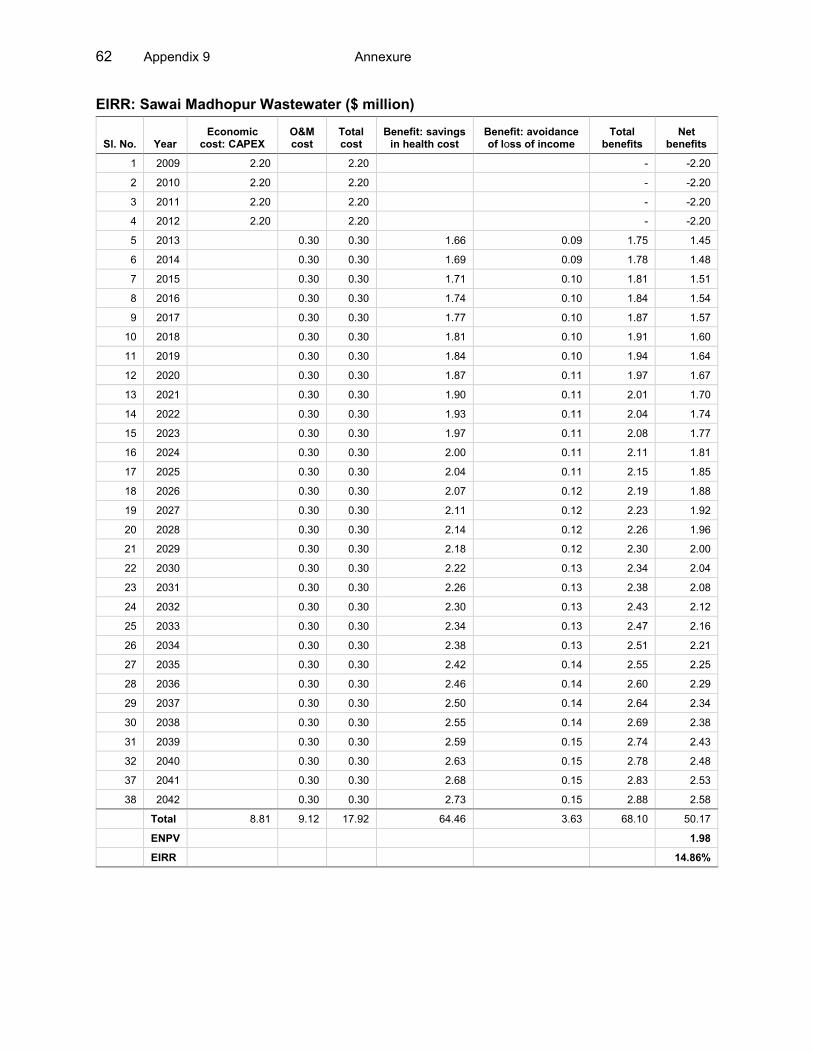
62 Appendix 9 Annexure
EIRR: Sawai Madhopur Wastewater ($ million)
Sl. No. Year Economic
cost: CAPEX O&M cost
Total cost
Benefit: savings in health cost
Benefit: avoidance of loss of income
Total benefits
Net benefits
1 2009 2.20
2.20
- -2.20
2 2010 2.20
2.20
- -2.20
3 2011 2.20
2.20
- -2.20
4 2012 2.20
2.20
- -2.20
5 2013
0.30 0.30 1.66 0.09 1.75 1.45
6 2014
0.30 0.30 1.69 0.09 1.78 1.48
7 2015
0.30 0.30 1.71 0.10 1.81 1.51
8 2016
0.30 0.30 1.74 0.10 1.84 1.54
9 2017
0.30 0.30 1.77 0.10 1.87 1.57
10 2018
0.30 0.30 1.81 0.10 1.91 1.60
11 2019
0.30 0.30 1.84 0.10 1.94 1.64
12 2020
0.30 0.30 1.87 0.11 1.97 1.67
13 2021
0.30 0.30 1.90 0.11 2.01 1.70
14 2022
0.30 0.30 1.93 0.11 2.04 1.74
15 2023
0.30 0.30 1.97 0.11 2.08 1.77
16 2024
0.30 0.30 2.00 0.11 2.11 1.81
17 2025
0.30 0.30 2.04 0.11 2.15 1.85
18 2026
0.30 0.30 2.07 0.12 2.19 1.88
19 2027
0.30 0.30 2.11 0.12 2.23 1.92
20 2028
0.30 0.30 2.14 0.12 2.26 1.96
21 2029
0.30 0.30 2.18 0.12 2.30 2.00
22 2030
0.30 0.30 2.22 0.13 2.34 2.04
23 2031
0.30 0.30 2.26 0.13 2.38 2.08
24 2032
0.30 0.30 2.30 0.13 2.43 2.12
25 2033
0.30 0.30 2.34 0.13 2.47 2.16
26 2034
0.30 0.30 2.38 0.13 2.51 2.21
27 2035
0.30 0.30 2.42 0.14 2.55 2.25
28 2036
0.30 0.30 2.46 0.14 2.60 2.29
29 2037
0.30 0.30 2.50 0.14 2.64 2.34
30 2038
0.30 0.30 2.55 0.14 2.69 2.38
31 2039
0.30 0.30 2.59 0.15 2.74 2.43
32 2040
0.30 0.30 2.63 0.15 2.78 2.48
37 2041
0.30 0.30 2.68 0.15 2.83 2.53
38 2042
0.30 0.30 2.73 0.15 2.88 2.58
Total 8.81 9.12 17.92 64.46 3.63 68.10 50.17
ENPV
1.98
EIRR
14.86%
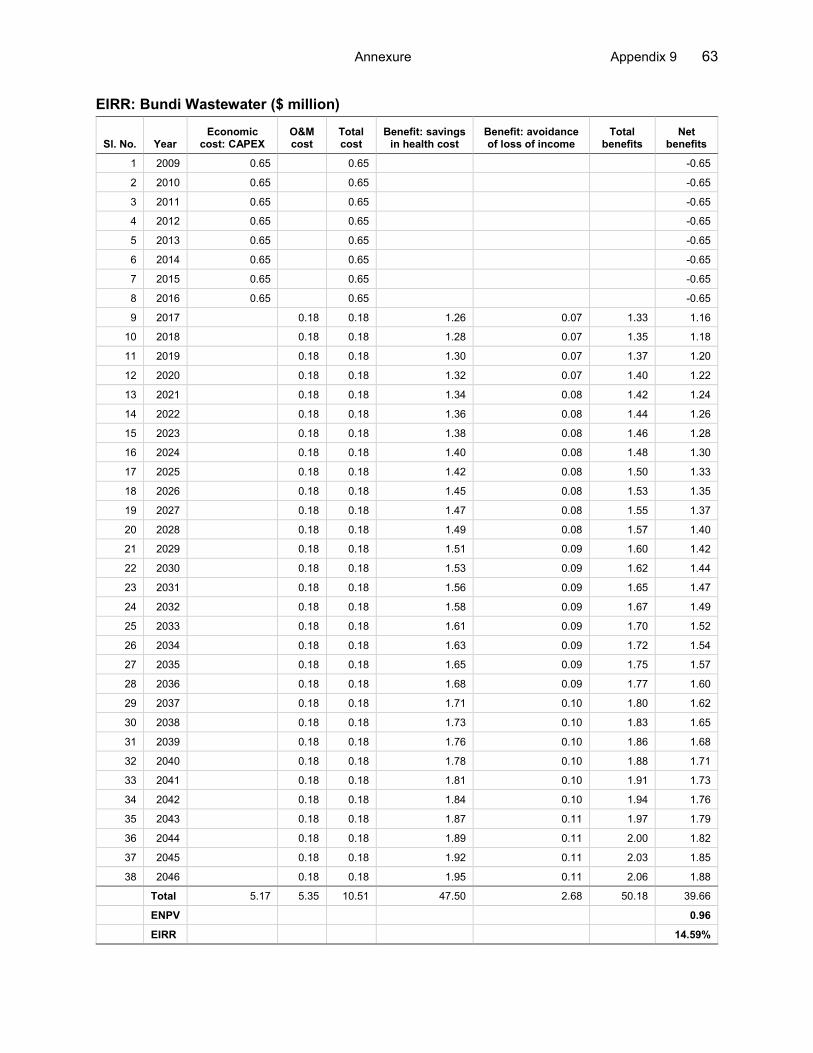
Annexure Appendix 9 63
EIRR: Bundi Wastewater ($ million)
Sl. No. Year Economic
cost: CAPEX O&M cost
Total cost
Benefit: savings in health cost
Benefit: avoidance of loss of income
Total benefits
Net benefits
1 2009 0.65
0.65
-0.65
2 2010 0.65
0.65
-0.65
3 2011 0.65
0.65
-0.65
4 2012 0.65
0.65
-0.65
5 2013 0.65
0.65
-0.65
6 2014 0.65
0.65
-0.65
7 2015 0.65
0.65
-0.65
8 2016 0.65
0.65
-0.65
9 2017
0.18 0.18 1.26 0.07 1.33 1.16
10 2018
0.18 0.18 1.28 0.07 1.35 1.18
11 2019
0.18 0.18 1.30 0.07 1.37 1.20
12 2020
0.18 0.18 1.32 0.07 1.40 1.22
13 2021
0.18 0.18 1.34 0.08 1.42 1.24
14 2022
0.18 0.18 1.36 0.08 1.44 1.26
15 2023
0.18 0.18 1.38 0.08 1.46 1.28
16 2024
0.18 0.18 1.40 0.08 1.48 1.30
17 2025
0.18 0.18 1.42 0.08 1.50 1.33
18 2026
0.18 0.18 1.45 0.08 1.53 1.35
19 2027
0.18 0.18 1.47 0.08 1.55 1.37
20 2028
0.18 0.18 1.49 0.08 1.57 1.40
21 2029
0.18 0.18 1.51 0.09 1.60 1.42
22 2030
0.18 0.18 1.53 0.09 1.62 1.44
23 2031
0.18 0.18 1.56 0.09 1.65 1.47
24 2032
0.18 0.18 1.58 0.09 1.67 1.49
25 2033
0.18 0.18 1.61 0.09 1.70 1.52
26 2034
0.18 0.18 1.63 0.09 1.72 1.54
27 2035
0.18 0.18 1.65 0.09 1.75 1.57
28 2036
0.18 0.18 1.68 0.09 1.77 1.60
29 2037
0.18 0.18 1.71 0.10 1.80 1.62
30 2038
0.18 0.18 1.73 0.10 1.83 1.65
31 2039
0.18 0.18 1.76 0.10 1.86 1.68
32 2040
0.18 0.18 1.78 0.10 1.88 1.71
33 2041
0.18 0.18 1.81 0.10 1.91 1.73
34 2042
0.18 0.18 1.84 0.10 1.94 1.76
35 2043
0.18 0.18 1.87 0.11 1.97 1.79
36 2044
0.18 0.18 1.89 0.11 2.00 1.82
37 2045
0.18 0.18 1.92 0.11 2.03 1.85
38 2046
0.18 0.18 1.95 0.11 2.06 1.88
Total 5.17 5.35 10.51 47.50 2.68 50.18 39.66
ENPV
0.96
EIRR
14.59%

64 Appendix 9 Annexure
EIRR: Bharatpur Urban Drainage ($ million)
Sl. No. Year Economic
cost: CAPEX O&M cost
Total cost
Benefit: savings in health cost
Benefit: avoidance of income loss due
reduction in morbidity Total
benefit Net
benefit
1 2009 0.67
0.67
- (0.67)
2 2010 0.67
0.67
- (0.67)
3 2011 0.67
0.67
- (0.67)
4 2012
0.07 0.07 0.55 0.16 0.71 0.64
5 2013
0.07 0.07 0.56 0.16 0.72 0.65
6 2014
0.07 0.07 0.57 0.16 0.74 0.67
7 2015
0.07 0.07 0.59 0.17 0.75 0.68
8 2016
0.07 0.07 0.60 0.17 0.77 0.70
9 2017
0.07 0.07 0.61 0.17 0.78 0.71
10 2018
0.07 0.07 0.62 0.18 0.80 0.73
11 2019
0.07 0.07 0.64 0.18 0.82 0.75
12 2020
0.07 0.07 0.65 0.18 0.83 0.76
13 2021
0.07 0.07 0.66 0.19 0.85 0.78
14 2022
0.07 0.07 0.68 0.19 0.87 0.80
15 2023
0.07 0.07 0.69 0.20 0.89 0.82
16 2024
0.07 0.07 0.71 0.20 0.91 0.84
17 2025
0.07 0.07 0.72 0.20 0.92 0.86
18 2026
0.07 0.07 0.74 0.21 0.94 0.88
19 2027
0.07 0.07 0.75 0.21 0.96 0.89
20 2028
0.07 0.07 0.77 0.22 0.98 0.91
21 2029
0.07 0.07 0.78 0.22 1.00 0.94
22 2030
0.07 0.07 0.80 0.23 1.03 0.96
23 2031
0.07 0.07 0.82 0.23 1.05 0.98
24 2032
0.07 0.07 0.83 0.23 1.07 1.00
25 2033
0.07 0.07 0.85 0.24 1.09 1.02
26 2034
0.07 0.07 0.87 0.24 1.11 1.04
27 2035
0.07 0.07 0.89 0.25 1.14 1.07
28 2036
0.07 0.07 0.91 0.26 1.16 1.09
29 2037
0.07 0.07 0.92 0.26 1.18 1.12
30 2038
0.07 0.07 0.94 0.27 1.21 1.14
31 2039
0.07 0.07 0.96 0.27 1.23 1.17
32 2040
0.07 0.07 0.98 0.28 1.26 1.19
33 2041
0.07 0.37 1.00 0.28 1.29 0.92
Total 2.00 2.07 4.37 22.69 6.39 29.08 24.70
ENPV
2.76
EIRR
26.90%
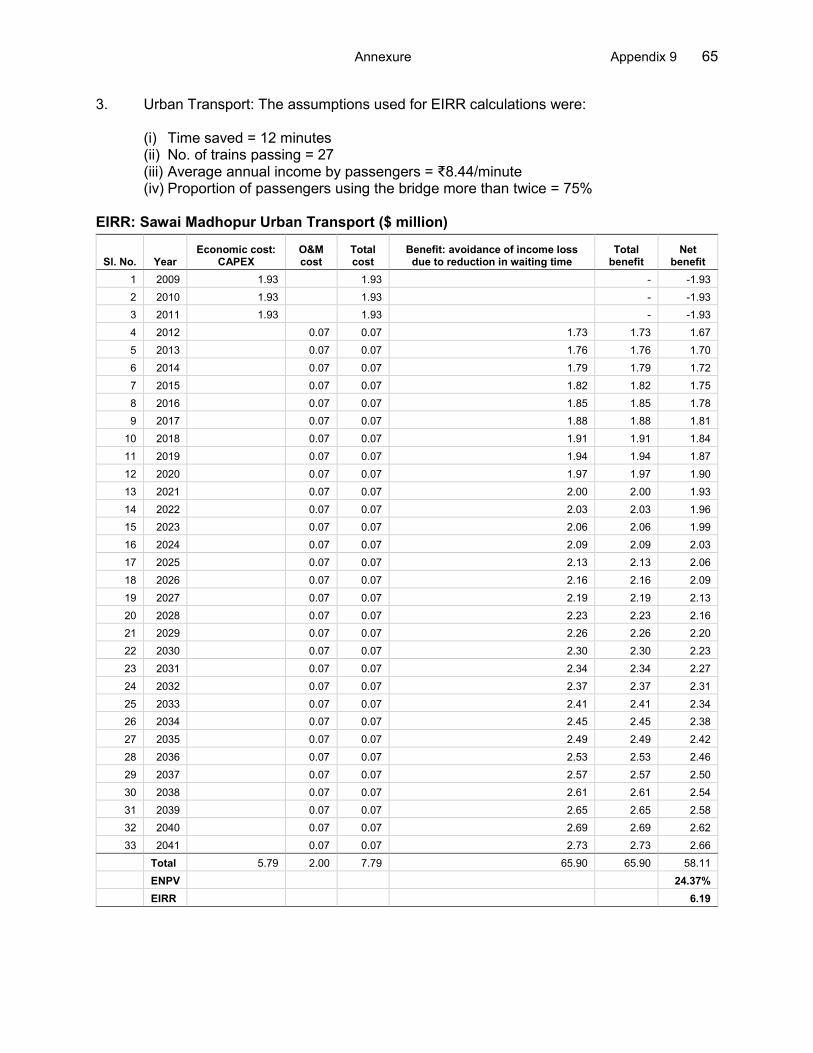
Annexure Appendix 9 65
3. Urban Transport: The assumptions used for EIRR calculations were:
(i) Time saved = 12 minutes (ii) No. of trains passing = 27 (iii) Average annual income by passengers = ₹8.44/minute (iv) Proportion of passengers using the bridge more than twice = 75%
EIRR: Sawai Madhopur Urban Transport ($ million)
Sl. No. Year Economic cost:
CAPEX O&M cost
Total cost
Benefit: avoidance of income loss due to reduction in waiting time
Total benefit
Net benefit
1 2009 1.93
1.93
- -1.93
2 2010 1.93
1.93
- -1.93
3 2011 1.93
1.93
- -1.93
4 2012
0.07 0.07 1.73 1.73 1.67
5 2013
0.07 0.07 1.76 1.76 1.70
6 2014
0.07 0.07 1.79 1.79 1.72
7 2015
0.07 0.07 1.82 1.82 1.75
8 2016
0.07 0.07 1.85 1.85 1.78
9 2017
0.07 0.07 1.88 1.88 1.81
10 2018
0.07 0.07 1.91 1.91 1.84
11 2019
0.07 0.07 1.94 1.94 1.87
12 2020
0.07 0.07 1.97 1.97 1.90
13 2021
0.07 0.07 2.00 2.00 1.93
14 2022
0.07 0.07 2.03 2.03 1.96
15 2023
0.07 0.07 2.06 2.06 1.99
16 2024
0.07 0.07 2.09 2.09 2.03
17 2025
0.07 0.07 2.13 2.13 2.06
18 2026
0.07 0.07 2.16 2.16 2.09
19 2027
0.07 0.07 2.19 2.19 2.13
20 2028
0.07 0.07 2.23 2.23 2.16
21 2029
0.07 0.07 2.26 2.26 2.20
22 2030
0.07 0.07 2.30 2.30 2.23
23 2031
0.07 0.07 2.34 2.34 2.27
24 2032
0.07 0.07 2.37 2.37 2.31
25 2033
0.07 0.07 2.41 2.41 2.34
26 2034
0.07 0.07 2.45 2.45 2.38
27 2035
0.07 0.07 2.49 2.49 2.42
28 2036
0.07 0.07 2.53 2.53 2.46
29 2037
0.07 0.07 2.57 2.57 2.50
30 2038
0.07 0.07 2.61 2.61 2.54
31 2039
0.07 0.07 2.65 2.65 2.58
32 2040
0.07 0.07 2.69 2.69 2.62
33 2041
0.07 0.07 2.73 2.73 2.66
Total 5.79 2.00 7.79 65.90 65.90 58.11
ENPV
24.37%
EIRR
6.19

66 Appendix 9 Annexure
The summary of the component analysis provided in tables below: EIRR: All Towns Combined Water Supply ($ million)
Sl. No.
Year Economic Cost: CAPEX
O&M Cost
Total Cost
Benefit: Savings in
Water Procuremen
t Cost
Benefit: Savings in Health Cost
Total Benefits
Net Benefits
1 2007 10.99 - 10.99 - - - -10.99
2 2008 10.99 - 10.99 - - - -10.99
3 2009 10.99 - 10.99 - - - -10.99
4 2010 10.99 - 10.99 - - - -10.99
5 2011 10.99 - 10.99 - - - -10.99
6 2012 6.98 1.15 8.13 0.67 4.51 5.18 -2.95
7 2013 1.55 2.97 4.52 3.24 15.45 18.70 14.18
8 2014 1.55 3.17 4.72 3.46 15.75 19.21 14.49
9 2015 0.61 3.62 4.23 4.20 19.10 23.30 19.07
10 2016 0.61 3.64 4.24 4.28 19.48 23.76 19.52
11 2017 - 4.00 4.00 4.79 21.79 26.58 22.58
12 2018 - 4.02 4.02 4.89 22.22 27.11 23.09
13 2019 - 4.04 4.04 4.98 22.66 27.64 23.61
14 2020 - 4.05 4.05 5.08 23.11 28.19 24.14
15 2021 - 4.07 4.07 5.18 23.57 28.75 24.68
16 2022 - 4.09 4.09 5.28 24.03 29.32 25.23
17 2023 - 4.11 4.11 5.39 24.51 29.90 25.79
18 2024 - 4.13 4.13 5.50 25.00 30.49 26.36
19 2025 - 4.15 4.15 5.60 25.49 31.10 26.95
20 2026 - 4.17 4.17 5.72 26.00 31.72 27.55
21 2027 - 4.19 4.19 5.83 26.52 32.35 28.16
22 2028 - 4.21 4.21 5.95 27.05 32.99 28.78
23 2029 - 4.23 4.23 6.06 27.58 33.65 29.41
24 2030 - 4.26 4.26 6.18 28.13 34.32 30.06
25 2031 - 4.28 4.28 6.31 28.70 35.00 30.72
26 2032 0% 4.30 4.30 6.43 29.27 35.70 31.40
27 2033 0% 4.33 4.33 6.56 29.85 36.42 32.09
28 2034 0% 4.35 4.35 6.69 30.45 37.14 32.79
29 2035 0% 4.38 4.38 6.83 31.06 37.89 33.51
30 2036 - 4.40 4.40 6.96 31.68 38.65 34.24
Total 66.23 98.31 164.54 132.08 602.98 735.06 570.51
ENPV
73.55
EIRR
23.48%

Annexure Appendix 9 67
EIRR: All Towns Combined Wastewater ($ million)
Sl. No.
Year Economic Cost:
CAPEX
O&M Cost
Total Cost
Benefit: Savings in Health
Cost
Benefit: Avoidance of Income Loss
due reduction in Morbidity
Total Benefit
Net Benefit
1 2009 10.41 - 10.41 - - - (10.41)
2 2010 10.41 - 10.41 - - - (10.41)
3 2011 10.41 - 10.41 - - - (10.41)
4 2012 10.41 - 10.41 - - - (10.41)
5 2013 7.57 0.39 7.97 2.22 0.12 2.34 (5.63)
6 2014 5.83 0.69 6.52 3.92 0.55 4.47 (2.05)
7 2015 3.97 1.08 5.05 6.14 0.64 6.77 1.73
8 2016 3.97 1.08 5.05 6.25 0.65 6.90 1.86
9 2017 - 2.17 2.17 14.40 1.09 15.50 13.32
10 2018 - 2.17 2.17 14.70 1.11 15.81 13.64
11 2019 - 2.17 2.17 15.00 1.14 16.14 13.96
12 2020 - 2.17 2.17 15.31 1.16 16.47 14.29
13 2021 - 2.17 2.17 15.62 1.18 16.81 14.63
14 2022 - 2.17 2.17 15.94 1.21 17.15 14.98
15 2023 - 2.17 2.17 16.27 1.23 17.50 15.33
16 2024 - 2.17 2.17 16.61 1.26 17.87 15.69
17 2025 - 2.17 2.17 16.95 1.29 18.23 16.06
18 2026 - 2.17 2.17 17.30 1.31 18.61 16.44
19 2027 - 2.17 2.17 17.66 1.34 19.00 16.82
20 2028 - 2.17 2.17 18.02 1.37 19.39 17.22
21 2029 - 2.17 2.17 18.40 1.40 19.79 17.62
22 2030 - 2.17 2.17 18.78 1.43 20.20 18.03
23 2031 - 2.17 2.17 19.17 1.45 20.62 18.45
24 2032 - 2.17 2.17 19.57 1.49 21.05 18.88
25 2033 - 2.17 2.17 19.97 1.52 21.49 19.32
26 2034 - 2.17 2.17 20.39 1.55 21.94 19.77
27 2035 - 2.17 2.17 20.82 1.58 22.40 20.22
28 2036 - 2.17 2.17 21.25 1.61 22.87 20.69
29 2037 - 2.17 2.17 21.70 1.65 23.34 21.17
30 2038 - 2.17 2.17 22.15 1.68 23.83 21.66
31 2039 0% 2.17 2.17 22.62 1.72 24.33 22.16
32 2040 0% 2.17
23.09 1.75 24.85 24.85
33 2041 0% 2.17
23.58 1.79 25.37 25.37
34 2042 0 2.17 2.17 24.08 1.83 25.90 23.73
35 2043 0 1.78
20.63 1.66
36 2044 0 1.48 1.48 17.46 0.88 18.35 16.86
37 2045 0 1.29 1.29 16.23 0.84 17.06 15.77
38 2046 0 0.91 0.91 13.00 0.73 13.73 12.82
Total 62.99 65.20 122.06 575.19 43.19 596.08 474.02
ENPV
17.18
EIRR
15.27%

68 Appendix 9 Annexure
EIRR: All Towns Combined Transport ($ million)
Sl. No.
Year Economic Cost: CAPEX
O&M Cost
Total Cost
Benefit: Avoidance of
Income Loss due to Reduction in Waiting Time
Total Benefit
Net Benefit
1 2009 13.16 - 13.16 - - -13.16
2 2010 13.16 - 13.16 - - -13.16
3 2011 13.16 - 13.16 - - -13.16
4 2012 7.60 0.19 7.79 2.99 2.99 -4.80
5 2013 7.60 0.19 7.79 3.15 3.15 -4.64
6 2014 6.57 0.25 6.82 3.96 3.96 -2.87
7 2015 3.11 0.49 3.60 10.78 10.78 7.18
8 2016 - 0.74 0.74 14.04 14.04 13.30
9 2017
0.74 0.74 15.39 15.39 14.65
10 2018
0.74 0.74 16.89 16.89 16.14
11 2019
0.74 0.74 18.54 18.54 17.80
12 2020
0.74 0.74 20.37 20.37 19.63
13 2021
0.74 0.74 22.40 22.40 21.65
14 2022
0.74 0.74 24.64 24.64 23.90
15 2023
0.74 0.74 27.12 27.12 26.38
16 2024
0.74 0.74 29.87 29.87 29.13
17 2025
0.74 0.74 32.91 32.91 32.17
18 2026
0.74 0.74 36.28 36.28 35.54
19 2027
0.74 0.74 40.02 40.02 39.28
20 2028
0.74 0.74 44.15 44.15 43.41
21 2029
0.74 0.74 48.73 48.73 47.99
22 2030
0.74 0.74 53.80 53.80 53.06
23 2031
0.74 0.74 59.42 59.42 58.68
24 2032
0.74 0.74 65.65 65.65 64.91
25 2033
0.74 0.74 72.55 72.55 71.81
26 2034
0.74 0.74 80.19 80.19 79.45
27 2035
0.74 0.74 88.65 88.65 87.91
28 2036
0.74 0.74 98.03 98.03 97.29
29 2037
0.74 0.74 108.42 108.42 107.68
30 2038
0.74 0.74 119.94 119.94 119.20
31 2039
0.74 0.74 132.70 132.70 131.96
32 2040
0.74 0.74 146.84 146.84 146.10
38 2041
0.74 0.74 162.51 162.51 161.77
Total 64.37 20.37 84.74 1,600.93 1,600.93 1,516.19
ENPV
81.99
EIRR
20.88%