4. WHAT ARE THE THREATS TO THE NEARSHORE … ARE THE THREATS TO THE NEARSHORE RESOURES? ESTALISHING...
30
43 4. WHAT ARE THE THREATS TO THE NEARSHORE RESOURCES? ESTABLISHING ECOLOGICAL BASELINES FOR CLIMATE CHANGE What did we do and how did we do it? Interdisciplinary physical, chemical, and ecological observations were collected at Climate Monitoring Sites around Timor-Leste to establish baseline measurements for tracking ecological responses to climate change and ocean acidification projected over the coming decades. Ten Climate Monitoring Sites (Figure 23) were selected in consultation with local resource management agencies as areas of special management interest, such as potential Marine Managed Areas or Marine Protected Areas. At each of these sites, temperature, carbonate chemistry (i.e., ocean acidification), biodiversity, and calcium carbonate accretion rates were measured, providing a foundation to understand present-day spatial patterns and a baseline for monitoring and detecting long-term responses to climate change. The spatial information on the parameters provided here can assist in the development of climate change vulnerability assessments to further inform coastal resource managers and policy makers as they develop climate adaptation plans for the coastal communities of Timor-Leste. Furthermore, these data will be integrated into a broader regional effort focused on establishing baselines and monitoring the ecological impacts of ocean acidification on coral reefs by the Intergovernmental Oceanographic Commission for the Western Pacific region (WESTPAC). In 2015, eight WESTPAC nations (Phillipines, Indonesia, Malaysia, Vietnam, China, Banglesh, Cambodia, and Thailand) committed to the implementation of 21 Climate Monitoring Sites using adopted methodologies that were executed in Timor-Leste. Thus, the Timor-Leste Climate Monitoring Sites, in conjunction with the ~50 Climate Monitoring Sites already established by NOAA-CREP’s Pacific Reef Assessment and Monitoring Program, plus the 21 sites established by WESTPAC nations, will foster important comparative analyses across gradients of biodiversity, human impacts, and oceanographic/environmental conditions for better understanding the impacts of climate change. Climate Monitoring Sites were set up as ~10 m x 5 m rectangular grids on hard-bottom coral reef habitat at depths of 11–15 m. Within each grid, instruments monitoring seawater temperature (subsurface temperature recorder [STR]), reef calcification rate (Calcification Accretion Units [CAUs]), and cryptic marine invertebrate biodiversity (Autonomous Reef Monitoring Structures [ARMS]) were installed and remained affixed to the reef for a period of two years (Figure 19). Approximtely 30 photographs of the seafloor (benthic photoquads) were taken at each Climate Monitoring Site to characterize the benthic community, and seawater samples were collected at the ocean surface and at the reef substrate to evaluate patterns in the carbonate chemisty. The specific field and analytical methodologies used for collection and processing of information for each metric (seawater temperature from STRs, reef calcification rate from CAUs, marine invertebrate biodiversity from ARMS, carbonate chemistry from seawater samples, and benthic cover from photographs of the seafloor) are described in Appendix I.
Transcript of 4. WHAT ARE THE THREATS TO THE NEARSHORE … ARE THE THREATS TO THE NEARSHORE RESOURES? ESTALISHING...

43
4. WHAT ARE THE THREATS TO THE NEARSHORE RESOURCES? ESTABLISHING ECOLOGICAL BASELINES FOR CLIMATE CHANGE
What did we do and how did we do it?
Interdisciplinary physical, chemical, and ecological observations were collected at Climate Monitoring
Sites around Timor-Leste to establish baseline measurements for tracking ecological responses to
climate change and ocean acidification projected over the coming decades. Ten Climate Monitoring Sites
(Figure 23) were selected in consultation with local resource management agencies as areas of special
management interest, such as potential Marine Managed Areas or Marine Protected Areas. At each of
these sites, temperature, carbonate chemistry (i.e., ocean acidification), biodiversity, and calcium
carbonate accretion rates were measured, providing a foundation to understand present-day spatial
patterns and a baseline for monitoring and detecting long-term responses to climate change.
The spatial information on the parameters provided here can assist in the development of climate
change vulnerability assessments to further inform coastal resource managers and policy makers as they
develop climate adaptation plans for the coastal communities of Timor-Leste. Furthermore, these data
will be integrated into a broader regional effort focused on establishing baselines and monitoring the
ecological impacts of ocean acidification on coral reefs by the Intergovernmental Oceanographic
Commission for the Western Pacific region (WESTPAC). In 2015, eight WESTPAC nations (Phillipines,
Indonesia, Malaysia, Vietnam, China, Banglesh, Cambodia, and Thailand) committed to the
implementation of 21 Climate Monitoring Sites using adopted methodologies that were executed in
Timor-Leste. Thus, the Timor-Leste Climate Monitoring Sites, in conjunction with the ~50 Climate
Monitoring Sites already established by NOAA-CREP’s Pacific Reef Assessment and Monitoring Program,
plus the 21 sites established by WESTPAC nations, will foster important comparative analyses across
gradients of biodiversity, human impacts, and oceanographic/environmental conditions for better
understanding the impacts of climate change.
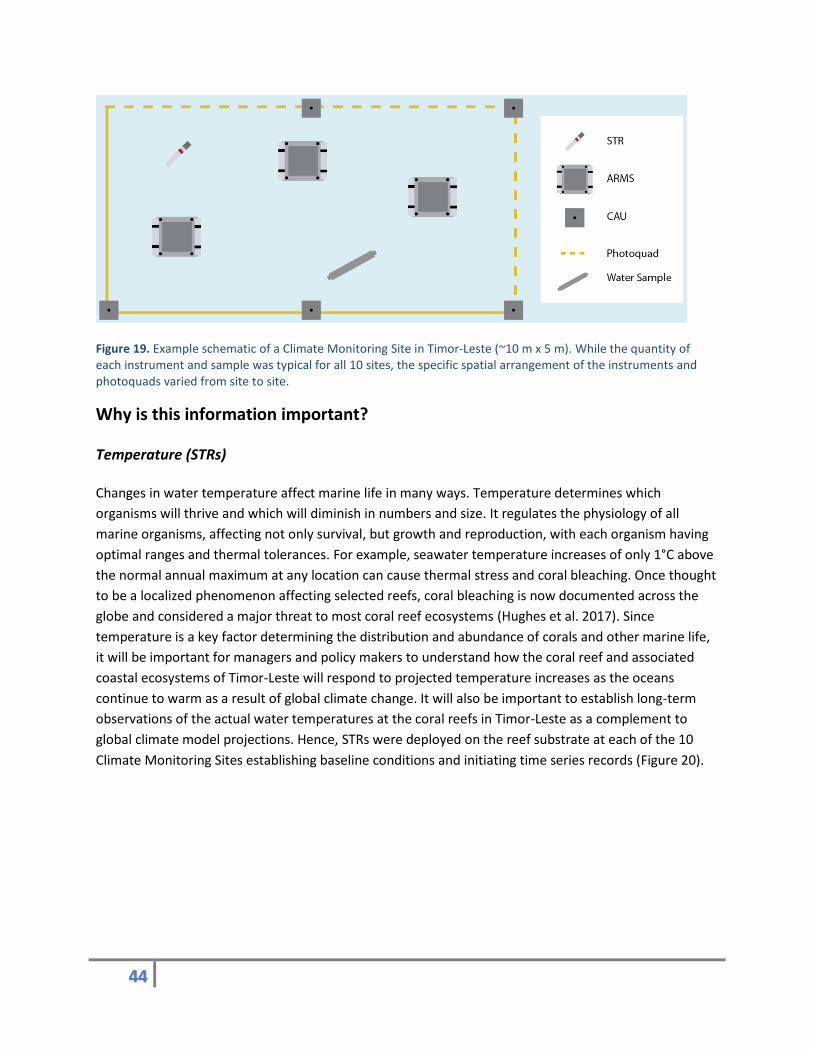
Climate Monitoring Sites were set up as ~10 m x 5 m rectangular grids on hard-bottom coral reef habitat
at depths of 11–15 m. Within each grid, instruments monitoring seawater temperature (subsurface
temperature recorder [STR]), reef calcification rate (Calcification Accretion Units [CAUs]), and cryptic
marine invertebrate biodiversity (Autonomous Reef Monitoring Structures [ARMS]) were installed and
remained affixed to the reef for a period of two years (Figure 19). Approximtely 30 photographs of the
seafloor (benthic photoquads) were taken at each Climate Monitoring Site to characterize the benthic
community, and seawater samples were collected at the ocean surface and at the reef substrate to
evaluate patterns in the carbonate chemisty.
The specific field and analytical methodologies used for collection and processing of information for
each metric (seawater temperature from STRs, reef calcification rate from CAUs, marine invertebrate
biodiversity from ARMS, carbonate chemistry from seawater samples, and benthic cover from
photographs of the seafloor) are described in Appendix I.
44
Figure 19. Example schematic of a Climate Monitoring Site in Timor-Leste (~10 m x 5 m). While the quantity of each instrument and sample was typical for all 10 sites, the specific spatial arrangement of the instruments and photoquads varied from site to site.
Why is this information important?
Temperature (STRs)
Changes in water temperature affect marine life in many ways. Temperature determines which
organisms will thrive and which will diminish in numbers and size. It regulates the physiology of all
marine organisms, affecting not only survival, but growth and reproduction, with each organism having
optimal ranges and thermal tolerances. For example, seawater temperature increases of only 1°C above
the normal annual maximum at any location can cause thermal stress and coral bleaching. Once thought
to be a localized phenomenon affecting selected reefs, coral bleaching is now documented across the
globe and considered a major threat to most coral reef ecosystems (Hughes et al. 2017). Since
temperature is a key factor determining the distribution and abundance of corals and other marine life,
it will be important for managers and policy makers to understand how the coral reef and associated
coastal ecosystems of Timor-Leste will respond to projected temperature increases as the oceans
continue to warm as a result of global climate change. It will also be important to establish long-term
observations of the actual water temperatures at the coral reefs in Timor-Leste as a complement to
global climate model projections. Hence, STRs were deployed on the reef substrate at each of the 10
Climate Monitoring Sites establishing baseline conditions and initiating time series records (Figure 20).
45
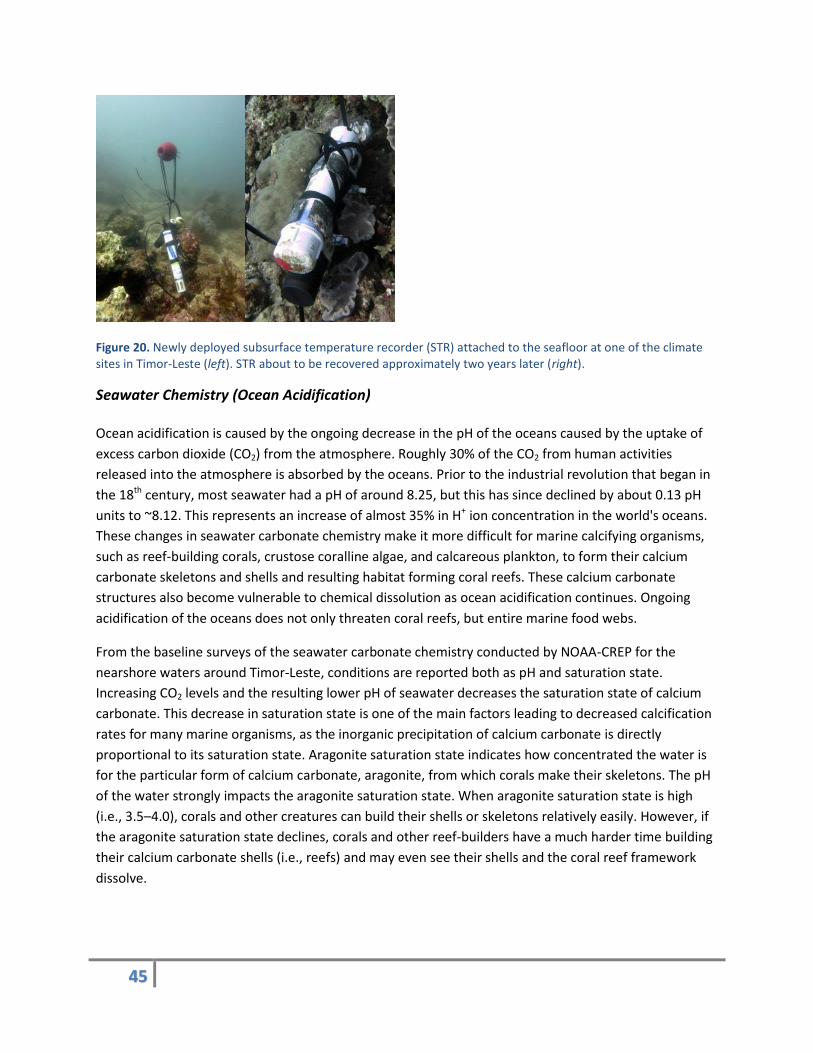
Figure 20. Newly deployed subsurface temperature recorder (STR) attached to the seafloor at one of the climate sites in Timor-Leste (left). STR about to be recovered approximately two years later (right).
Seawater Chemistry (Ocean Acidification)
Ocean acidification is caused by the ongoing decrease in the pH of the oceans caused by the uptake of
excess carbon dioxide (CO2) from the atmosphere. Roughly 30% of the CO2 from human activities
released into the atmosphere is absorbed by the oceans. Prior to the industrial revolution that began in
the 18th century, most seawater had a pH of around 8.25, but this has since declined by about 0.13 pH
units to ~8.12. This represents an increase of almost 35% in H+ ion concentration in the world's oceans.
These changes in seawater carbonate chemistry make it more difficult for marine calcifying organisms,
such as reef-building corals, crustose coralline algae, and calcareous plankton, to form their calcium
carbonate skeletons and shells and resulting habitat forming coral reefs. These calcium carbonate
structures also become vulnerable to chemical dissolution as ocean acidification continues. Ongoing
acidification of the oceans does not only threaten coral reefs, but entire marine food webs.
From the baseline surveys of the seawater carbonate chemistry conducted by NOAA-CREP for the
nearshore waters around Timor-Leste, conditions are reported both as pH and saturation state.
Increasing CO2 levels and the resulting lower pH of seawater decreases the saturation state of calcium
carbonate. This decrease in saturation state is one of the main factors leading to decreased calcification
rates for many marine organisms, as the inorganic precipitation of calcium carbonate is directly
proportional to its saturation state. Aragonite saturation state indicates how concentrated the water is
for the particular form of calcium carbonate, aragonite, from which corals make their skeletons. The pH
of the water strongly impacts the aragonite saturation state. When aragonite saturation state is high
(i.e., 3.5–4.0), corals and other creatures can build their shells or skeletons relatively easily. However, if
the aragonite saturation state declines, corals and other reef-builders have a much harder time building
their calcium carbonate shells (i.e., reefs) and may even see their shells and the coral reef framework
dissolve.
46
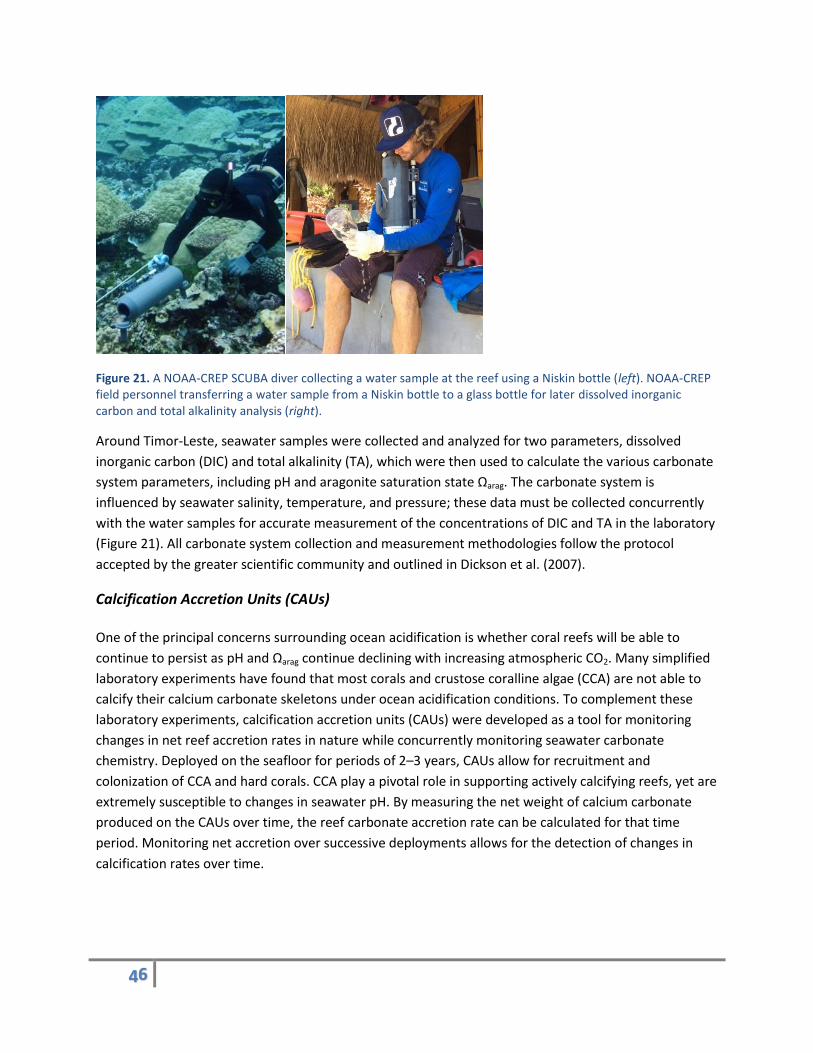
Figure 21. A NOAA-CREP SCUBA diver collecting a water sample at the reef using a Niskin bottle (left). NOAA-CREP field personnel transferring a water sample from a Niskin bottle to a glass bottle for later dissolved inorganic carbon and total alkalinity analysis (right).
Around Timor-Leste, seawater samples were collected and analyzed for two parameters, dissolved
inorganic carbon (DIC) and total alkalinity (TA), which were then used to calculate the various carbonate
system parameters, including pH and aragonite saturation state Ωarag. The carbonate system is
influenced by seawater salinity, temperature, and pressure; these data must be collected concurrently
with the water samples for accurate measurement of the concentrations of DIC and TA in the laboratory
(Figure 21). All carbonate system collection and measurement methodologies follow the protocol
accepted by the greater scientific community and outlined in Dickson et al. (2007).
Calcification Accretion Units (CAUs)
One of the principal concerns surrounding ocean acidification is whether coral reefs will be able to
continue to persist as pH and Ωarag continue declining with increasing atmospheric CO2. Many simplified
laboratory experiments have found that most corals and crustose coralline algae (CCA) are not able to
calcify their calcium carbonate skeletons under ocean acidification conditions. To complement these
laboratory experiments, calcification accretion units (CAUs) were developed as a tool for monitoring
changes in net reef accretion rates in nature while concurrently monitoring seawater carbonate
chemistry. Deployed on the seafloor for periods of 2–3 years, CAUs allow for recruitment and
colonization of CCA and hard corals. CCA play a pivotal role in supporting actively calcifying reefs, yet are
extremely susceptible to changes in seawater pH. By measuring the net weight of calcium carbonate
produced on the CAUs over time, the reef carbonate accretion rate can be calculated for that time
period. Monitoring net accretion over successive deployments allows for the detection of changes in
calcification rates over time.
47
Autonomous Reef Monitoring Structures (ARMS)
Another key question regarding the effects of ocean acidification is how changing carbonate chemistry
will impact the biodiversity of coral reefs. Of the five mass extinction events—defined to periods in
which the biodiversity declined by more than 50%—that have occurred over the Earth’s history, at least
a few coincided with ocean acidification events (Honisch et al. 2012). It is predicted that ocean
acidification, together with temperature stress, will lead to severely reduced diversity, structural
complexity, and resilience on coral reefs (Bellard et al. 2012; Kroeker et al., 2013).
Autonomous reef monitoring structures (ARMS) were developed as long-term sampling devices for
assessing spatial patterns and monitoring long-term trends in the biodiversity of the small and
functionally important group of organisms known as the cryptobiota. Cryptobiota live predominantly
within the complex architecture of the reef matrix. They are important sources of food for many reef
fish and are fundamental to nutrient cycling and the ability of reefs to thrive in nutrient poor
environments. Despite their ecological importance, their diversity and composition has been poorly
understood in part due to their sheer richness and the difficulty in extracting them from the reef to
assess their diversity. However, with the development of ARMS, progress in DNA barcoding and DNA
metabarcoding techniques (see Appendix J for overview), and declining costs in high-throughput DNA
sequencing, examinations into cryptobiota diversity and composition across space and time are now a
reality (Leray and Knowlton 2015).
To date, there have been over 800 ARMS deployed worldwide to examine cryptobiota communities
across not only coral reefs, but temperate coastal habitats, oyster reefs, and deep-sea benthos (Figure
22). Although some of the computational bioinformatic processing techniques continue to be refined
and polished, sequences are being archived until the computational methods are streamlined and
available for more in-depth analyses into the biodiversity and the community composition of the
cryptobiota. The ARMS deployed across Timor-Leste will not only establish baseline assessments of the
spatial patterns of the cryptobiota along the north coast of Timor-Leste, but will also contribute toward
greater insight into regional and global biodiversity patterns and trends.

48
Figure 22. The global array of ARMS that have been deployed and recovered.
Benthic Cover
Benthic photoquads were analyzed to estimate the benthic community composition at each Climate
Monitoring Site and provide site-specific context to the in-situ (stationary) climate survey data. Using
the benthic cover data obtained from the broad-scale spatial surveys in the Coral Reef Ecosystem
Assessments Chapter to contextualize the Climate Monitoring Sites would be inappropriate due to the
natural variability of benthic organisms that exists across sites. Randomized surveys are essential for
characterizing overall resources in a region while standardized stationary sites help contextualize the
finer biophysical relationships when assessing, for example, the ecological impacts of climate change on
coral reefs on a global scale. Thus, integrating a regional benthic cover value to examine biophysical
relationships at a particular site would lead to false interpretations of the data. Similarly, using a site-
specific benthic cover value to contextualize a region would lead to inaccurate conclusions of existing
resources.
The benthic cover data derived from the climate sites are presented in the same manner as the
photoquadrat data obtained from the broad spatial-scale surveys described in the preceding Coral Reef
Ecosystem Assessments Chapter.
Operational logistics
2012 Activities
Climate sites were established at 10 coastal locations around Timor-Leste in October 2012, in the
districts of Bobonaro, Dili, Manatuto, Baucau, Lautem, and Manufahi, as recommended by MAF partners

49
and other stakeholders in Timor-Leste (Figure 23, Appendix E). Sites were initially enumerated in
sequence as TIM-01, TIM-02, etc., and were later renamed to match the site naming convention
established during the reef fish surveys in June 2013 (Table 4).
At the request of Timor-Leste agencies and stakeholders during consultations in 2012, two Climate
Monitoring sites (LAU-07 and MAF-01) were initially established along the south shore (Figure 23).
However, those sites were eliminated due to poor accessibility causing significant logistical and fiscal
constraints, poor SCUBA conditions from heavy rainfall and siltation, and safety concerns (Figure 24).
Figure 23. Map showing the location of the 10 Climate Monitoring sites established in October 2012, and the 2 sites that were not revisited after the first year.
50
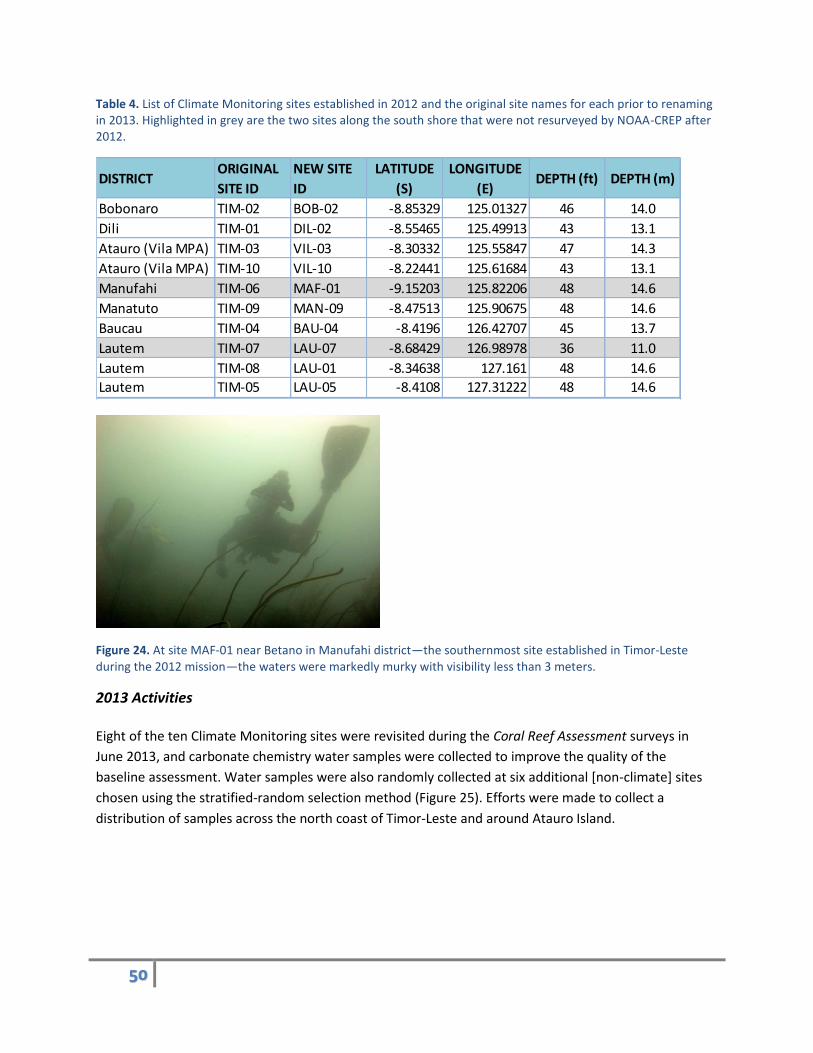
Table 4. List of Climate Monitoring sites established in 2012 and the original site names for each prior to renaming in 2013. Highlighted in grey are the two sites along the south shore that were not resurveyed by NOAA-CREP after 2012.
Figure 24. At site MAF-01 near Betano in Manufahi district—the southernmost site established in Timor-Leste during the 2012 mission—the waters were markedly murky with visibility less than 3 meters.
2013 Activities
Eight of the ten Climate Monitoring sites were revisited during the Coral Reef Assessment surveys in
June 2013, and carbonate chemistry water samples were collected to improve the quality of the
baseline assessment. Water samples were also randomly collected at six additional [non-climate] sites
chosen using the stratified-random selection method (Figure 25). Efforts were made to collect a
distribution of samples across the north coast of Timor-Leste and around Atauro Island.
DISTRICTORIGINAL
SITE ID
NEW SITE
ID
LATITUDE
(S)
LONGITUDE
(E)DEPTH (ft) DEPTH (m)
Bobonaro TIM-02 BOB-02 -8.85329 125.01327 46 14.0
Dili TIM-01 DIL-02 -8.55465 125.49913 43 13.1
Atauro (Vila MPA) TIM-03 VIL-03 -8.30332 125.55847 47 14.3
Atauro (Vila MPA) TIM-10 VIL-10 -8.22441 125.61684 43 13.1
Manufahi TIM-06 MAF-01 -9.15203 125.82206 48 14.6
Manatuto TIM-09 MAN-09 -8.47513 125.90675 48 14.6
Baucau TIM-04 BAU-04 -8.4196 126.42707 45 13.7
Lautem TIM-07 LAU-07 -8.68429 126.98978 36 11.0
Lautem TIM-08 LAU-01 -8.34638 127.161 48 14.6
Lautem TIM-05 LAU-05 -8.4108 127.31222 48 14.6
51
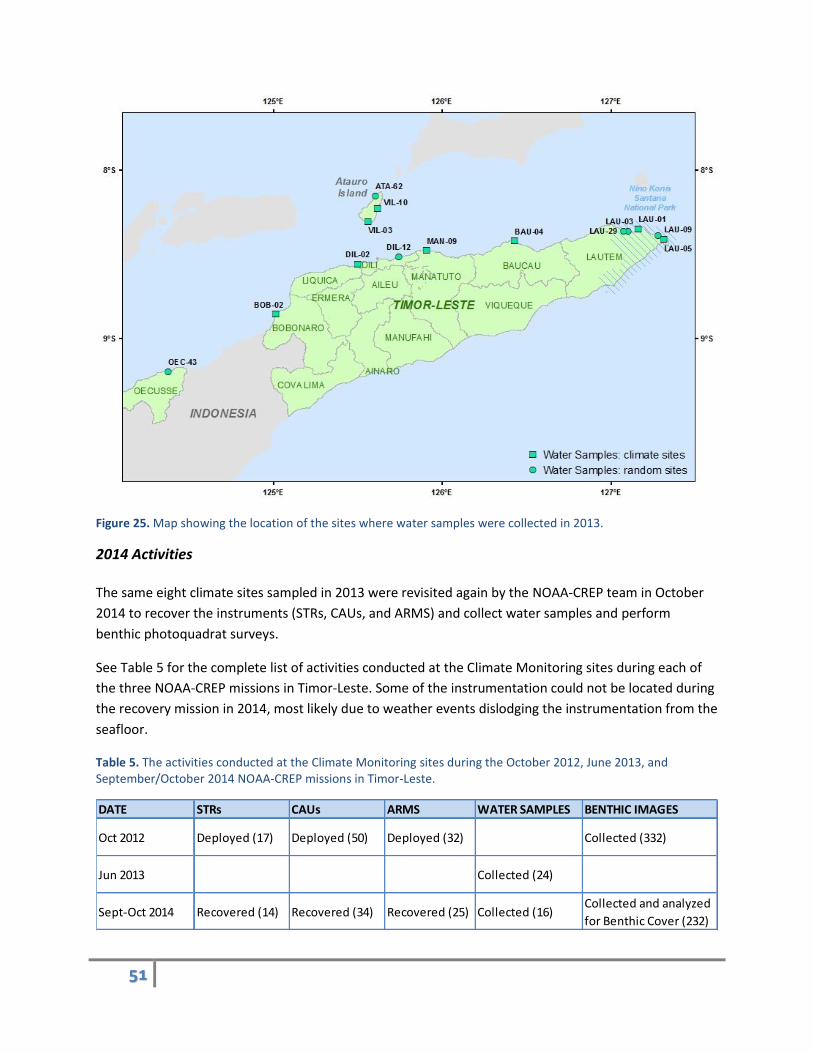
Figure 25. Map showing the location of the sites where water samples were collected in 2013.
2014 Activities
The same eight climate sites sampled in 2013 were revisited again by the NOAA-CREP team in October
2014 to recover the instruments (STRs, CAUs, and ARMS) and collect water samples and perform
benthic photoquadrat surveys.
See Table 5 for the complete list of activities conducted at the Climate Monitoring sites during each of
the three NOAA-CREP missions in Timor-Leste. Some of the instrumentation could not be located during
the recovery mission in 2014, most likely due to weather events dislodging the instrumentation from the
seafloor.
Table 5. The activities conducted at the Climate Monitoring sites during the October 2012, June 2013, and September/October 2014 NOAA-CREP missions in Timor-Leste.
DATE STRs CAUs ARMS WATER SAMPLES BENTHIC IMAGES
Oct 2012 Deployed (17) Deployed (50) Deployed (32) Collected (332)
Jun 2013 Collected (24)
Sept-Oct 2014 Recovered (14) Recovered (34) Recovered (25) Collected (16)Collected and analyzed
for Benthic Cover (232)

52
What did we find?
Temperature (STRs)
Figure 26. Positions (circles) and depths (colors) of subsurface temperature recorders (STR) successfully recovered from Timor-Leste in 2014. Sites with multiple STRs (e.g., LAU-01) represent STR depth transects (i.e., a shallow-, mid-, and deep-depth STR deployed at one site). No data was collected from the mid-depth STR recovered at LAU-01.
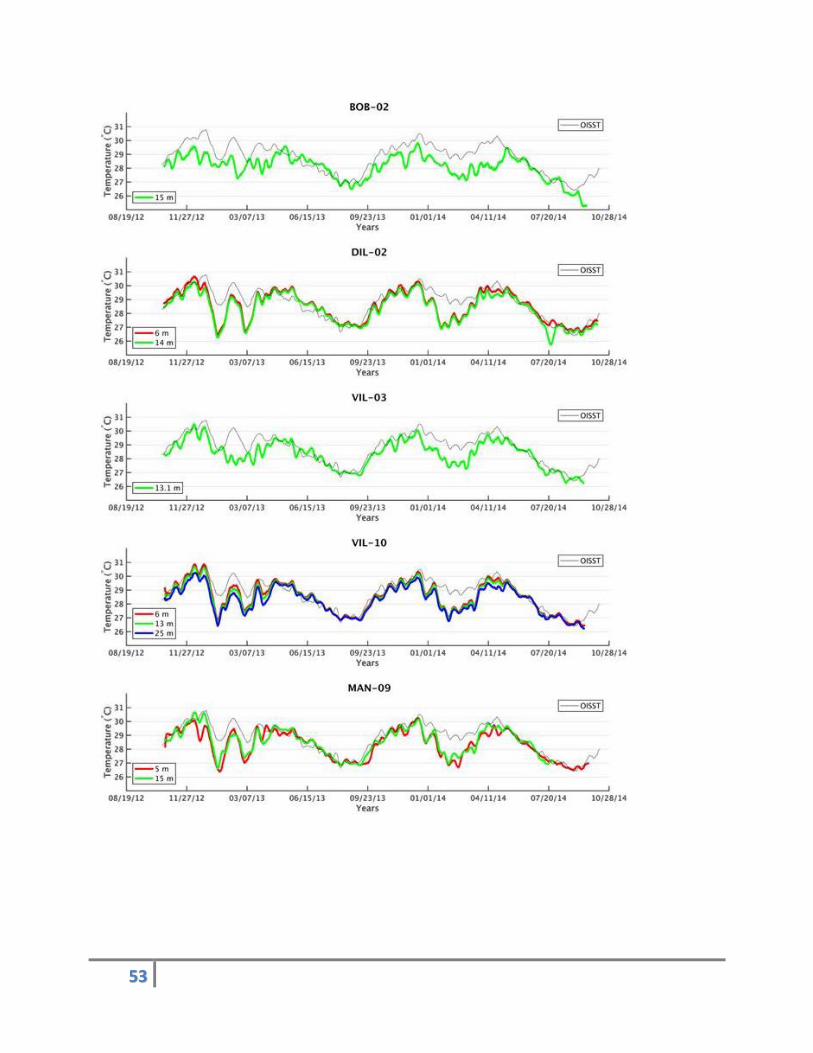
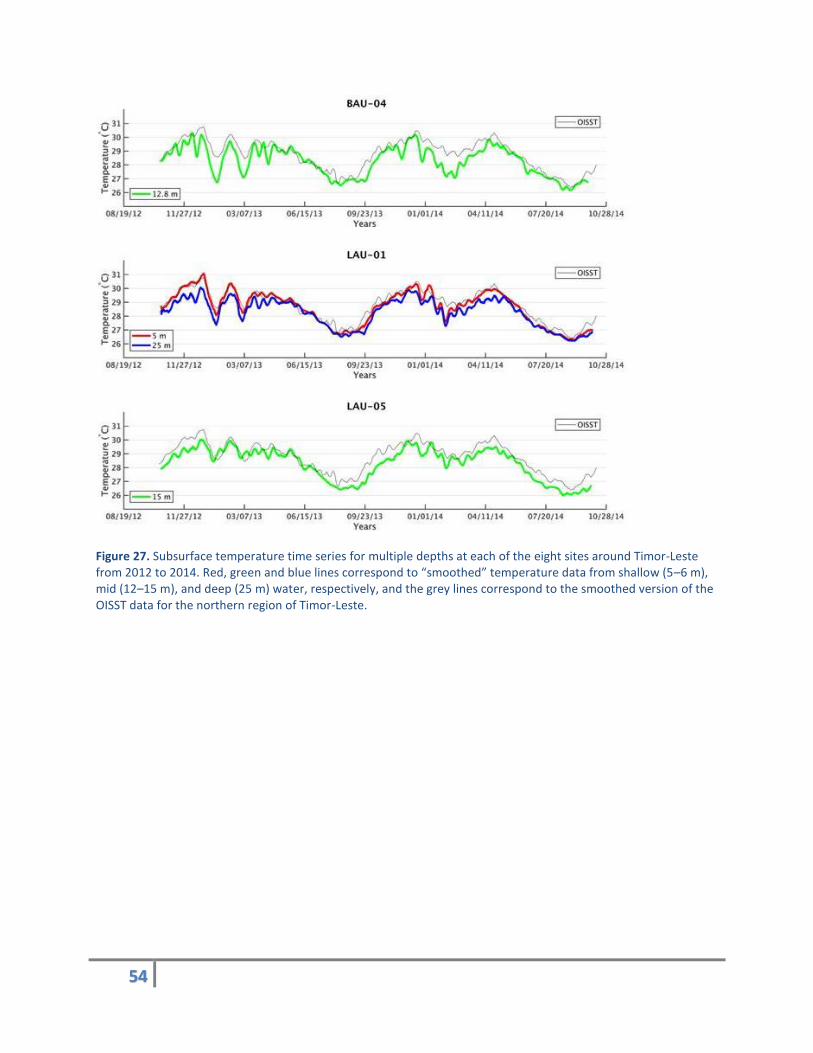
Subsurface temperature data were successfully recorded from 13 locations/depths at 8 sites around
Timor-Leste from October 2012 to October 2014. Temperature data show regionally coherent patterns
of heating and cooling over the recording period, with the hottest periods occurring in November and
December of each year (Figure 27). Similarities between BOB-02 and VIL-03 with respect to the rest of
the sites, some consistent variability among sites, and temporal variability especially between December
and February of each year are also evident.
The daily NOAA Reynolds Optimal Interpolation Sea Surface Temperature (OISST) data for the same time
period as the STRs suggest the mean sea surface temperature values range between 25.86°C and
30.89°C for the north coast of Timor-Leste (Reynolds et al., 2002). However, the in-situ (non-smoothed)
temperature data in both years include values that exceed the 30.89°C threshold at all locations and
depths (Table 6). This indicates that STRs are better at detecting extreme changes in temperature than
the OISST product for this region.
53
54
Figure 27. Subsurface temperature time series for multiple depths at each of the eight sites around Timor-Leste from 2012 to 2014. Red, green and blue lines correspond to “smoothed” temperature data from shallow (5–6 m), mid (12–15 m), and deep (25 m) water, respectively, and the grey lines correspond to the smoothed version of the OISST data for the northern region of Timor-Leste.

55
Table 6. Daily (before smoothing) minimum and maximum temperature values from STRs recovered from multiple depths at eight sites around Timor-Leste from 2012 to 2014, and for the Reynolds Optimal Interpolation Sea Surface Temperature (OISST) data for comparison (grey record). No specific depth is associated with the OISST data as it is an interpolated data product generated from the available satellite, ship and buoy observations for the region.
SITE ID DEPTH (m)MINIMUM
TEMPERATURE (°C)
MAXIMUM
TEMPERATURE (°C)
BOB-02 14.9 21.3087 30.9220
DIL-02 6.1 23.1373 31.8510
DIL-02 14.0 21.4766 31.5859
VIL-03 13.1 22.3787 31.3195
VIL-10 6.1 25.5837 31.8411
VIL-10 13.1 25.2706 31.3198
VIL-10 25.0 23.2996 31.1499
MAN-09 4.9 24.6026 31.6964
MAN-09 14.6 25.2706 31.3198
BAU-04 12.8 23.7113 31.2986
LAU-01 4.6 25.6580 32.2218
LAU-01 25.3 23.8373 31.3182
LAU-05 14.6 23.5564 31.1985
OISST — 25.8610 30.8914
56
Seawater Chemistry
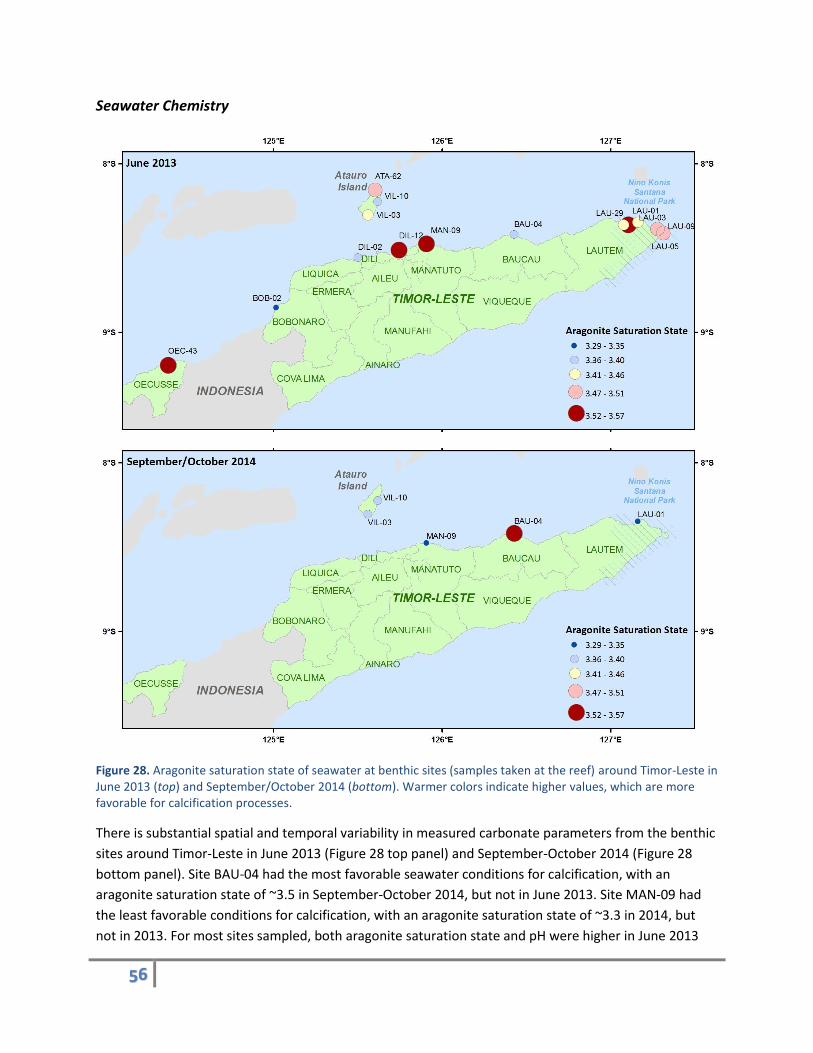
Figure 28. Aragonite saturation state of seawater at benthic sites (samples taken at the reef) around Timor-Leste in June 2013 (top) and September/October 2014 (bottom). Warmer colors indicate higher values, which are more favorable for calcification processes.
There is substantial spatial and temporal variability in measured carbonate parameters from the benthic
sites around Timor-Leste in June 2013 (Figure 28 top panel) and September-October 2014 (Figure 28
bottom panel). Site BAU-04 had the most favorable seawater conditions for calcification, with an
aragonite saturation state of ~3.5 in September-October 2014, but not in June 2013. Site MAN-09 had
the least favorable conditions for calcification, with an aragonite saturation state of ~3.3 in 2014, but
not in 2013. For most sites sampled, both aragonite saturation state and pH were higher in June 2013

57
than in September-October 2014, likely due to seasonal differences in weather and precipitation
patterns (Figure 29). Offshore waters generally had higher aragonite saturation states and pH than
surface waters at the reef, which tended to have higher aragonite saturation states and pH than reef
waters, suggesting the various biogeochemical processes occurring on the reef were changing the
carbonate chemistry. Typically, coral reefs take up carbon during daytime photosynthesis and export
carbon during nighttime respiration; therefore, the observations support this expectation.
Figure 29. Site-by-site carbonate chemistry measurements from water samples collected in June 2013 and September-October 2014 along the north coast of Timor-Leste: aragonite saturation state at the reef (top left), surface (top middle), and 1 km offshore from the site at the surface (top right); pH at the reef (bottom left), surface (bottom middle), and 1 km offshore from the site at the surface (bottom right).
Overall, these baseline observations indicate that the seawater carbonate chemistry along the north
coast of Timor-Leste had relatively low aragonite saturation states, as demonstrated by the median
distributions compared to similar observations made by NOAA-CREP at coral reef sites across the Pacific
(Figure 30 left panel). The median pH for Timor-Leste is nearer the mean of pH observations at coral
reefs across the Pacific (Figure 30 right panel).

58
Figure 30. Pacific-wide distribution of aragonite saturation state (left) and pH (right), showing relative position of Timor-Leste benthic water samples in June 2013 (green line) and September-October 2014 (blue line).
Many factors can contribute to these results, including regional ocean acidification, active respiration on
reefs, or even active drawdown of calcifying material (i.e., carbonate) from rapidly calcifying reefs.
Calcification Accretion Units (CAUs)
Figure 31. Spatial variation in net reef carbonate accretion rates (g CaCO3 cm-2
yr-1
) at Climate Monitoring Sites along the north coast of Timor-Leste measured using calcification accretion units (CAUs) deployed from October 2012 to September-October 2014.
59
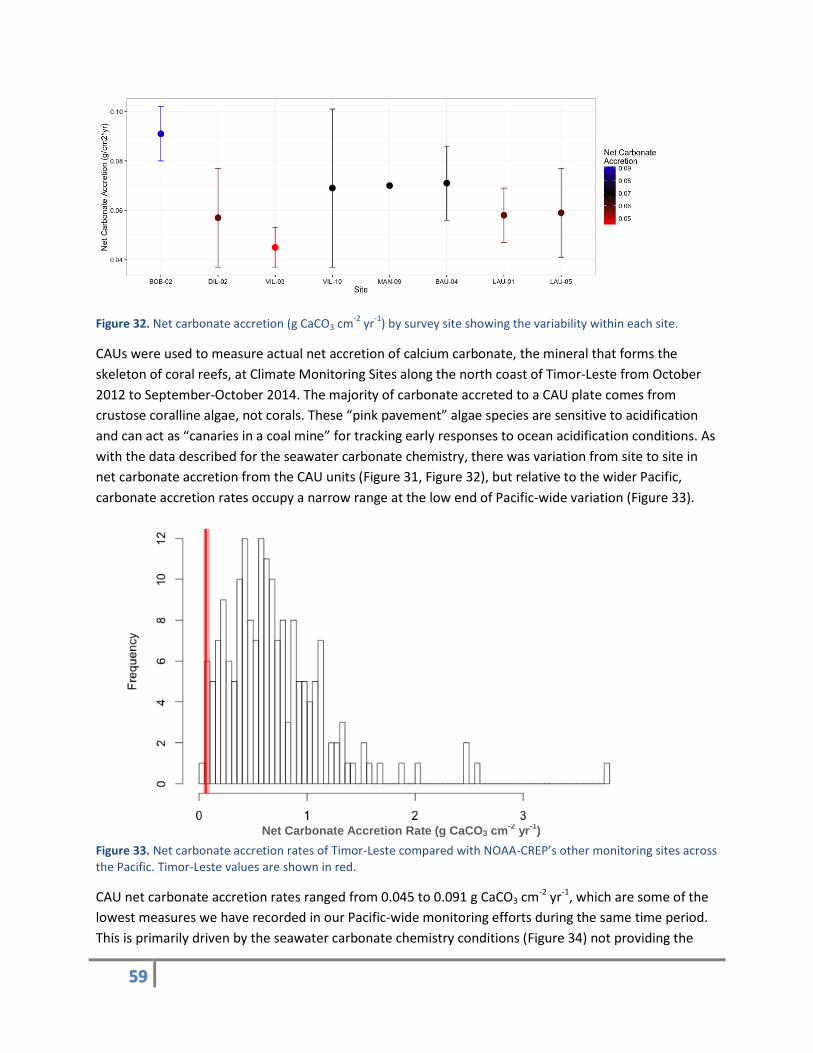
Figure 32. Net carbonate accretion (g CaCO3 cm-2
yr-1
) by survey site showing the variability within each site.
CAUs were used to measure actual net accretion of calcium carbonate, the mineral that forms the
skeleton of coral reefs, at Climate Monitoring Sites along the north coast of Timor-Leste from October
2012 to September-October 2014. The majority of carbonate accreted to a CAU plate comes from
crustose coralline algae, not corals. These “pink pavement” algae species are sensitive to acidification
and can act as “canaries in a coal mine” for tracking early responses to ocean acidification conditions. As
with the data described for the seawater carbonate chemistry, there was variation from site to site in
net carbonate accretion from the CAU units (Figure 31, Figure 32), but relative to the wider Pacific,
carbonate accretion rates occupy a narrow range at the low end of Pacific-wide variation (Figure 33).
Figure 33. Net carbonate accretion rates of Timor-Leste compared with NOAA-CREP’s other monitoring sites across the Pacific. Timor-Leste values are shown in red.
CAU net carbonate accretion rates ranged from 0.045 to 0.091 g CaCO3 cm-2 yr-1, which are some of the
lowest measures we have recorded in our Pacific-wide monitoring efforts during the same time period.
This is primarily driven by the seawater carbonate chemistry conditions (Figure 34) not providing the
Net Carbonate Accretion Rate (g CaCO3 cm-2
yr-1
)
60
CA
U A
cc
reti
on
Ra
te
(g C
aC
O3 c
m-2
yr-1
) environment for calcifying organisms to flourish. Additionally, Timor-Leste’s competing benthic
communities contest calcifying organisms’ success. Figure 35 clearly reveals how dominant other non-
calcifying species can be on CAU recruitment and overall reef community composition. This example of a
non-calcified dominated CAU is not unique to Timor-Leste and reflects the difficulty calcifying organisms
have with recruitment and growth, where benthic calcifiers compete for space against faster growing
species and with seawater carbonate chemistry conditions that do not promote high accretion rates.
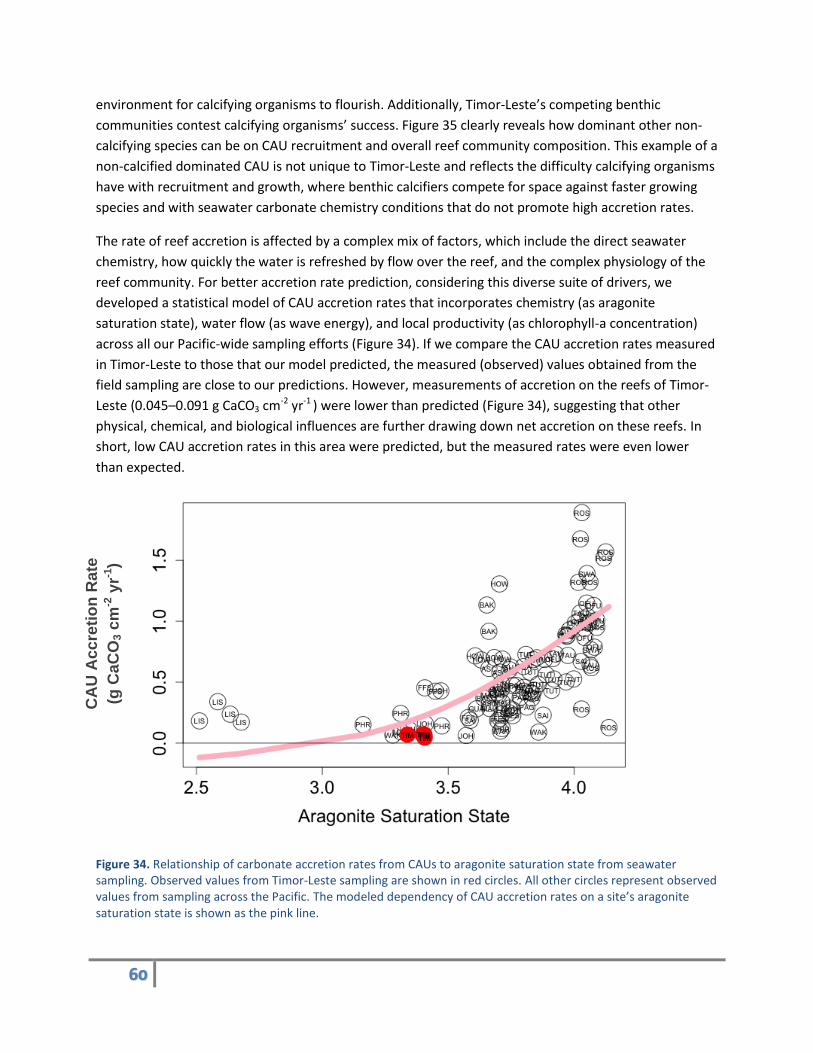
The rate of reef accretion is affected by a complex mix of factors, which include the direct seawater
chemistry, how quickly the water is refreshed by flow over the reef, and the complex physiology of the
reef community. For better accretion rate prediction, considering this diverse suite of drivers, we
developed a statistical model of CAU accretion rates that incorporates chemistry (as aragonite
saturation state), water flow (as wave energy), and local productivity (as chlorophyll-a concentration)
across all our Pacific-wide sampling efforts (Figure 34). If we compare the CAU accretion rates measured
in Timor-Leste to those that our model predicted, the measured (observed) values obtained from the
field sampling are close to our predictions. However, measurements of accretion on the reefs of Timor-
Leste (0.045–0.091 g CaCO3 cm-2 yr-1 ) were lower than predicted (Figure 34), suggesting that other
physical, chemical, and biological influences are further drawing down net accretion on these reefs. In
short, low CAU accretion rates in this area were predicted, but the measured rates were even lower
than expected.
Figure 34. Relationship of carbonate accretion rates from CAUs to aragonite saturation state from seawater sampling. Observed values from Timor-Leste sampling are shown in red circles. All other circles represent observed values from sampling across the Pacific. The modeled dependency of CAU accretion rates on a site’s aragonite saturation state is shown as the pink line.
61
Taken together with the relative seawater chemistry data, the CAU results suggest that the reefs of
Timor-Leste are situated at the low end of both aragonite saturation state (or pH) and carbonate
accretion when compared with other locations across the Western Pacific. While they continue to grow
with a positive reef net accretion (above 0.0 g CaCO3 cm-2 yr-1 suggests growth), the low accretion rates
suggest that ocean acidification impacts should be carefully considered as part of a suite of threats
currently facing the coral reefs of Timor-Leste and the associated ecosystem services they provide to
coastal communities.
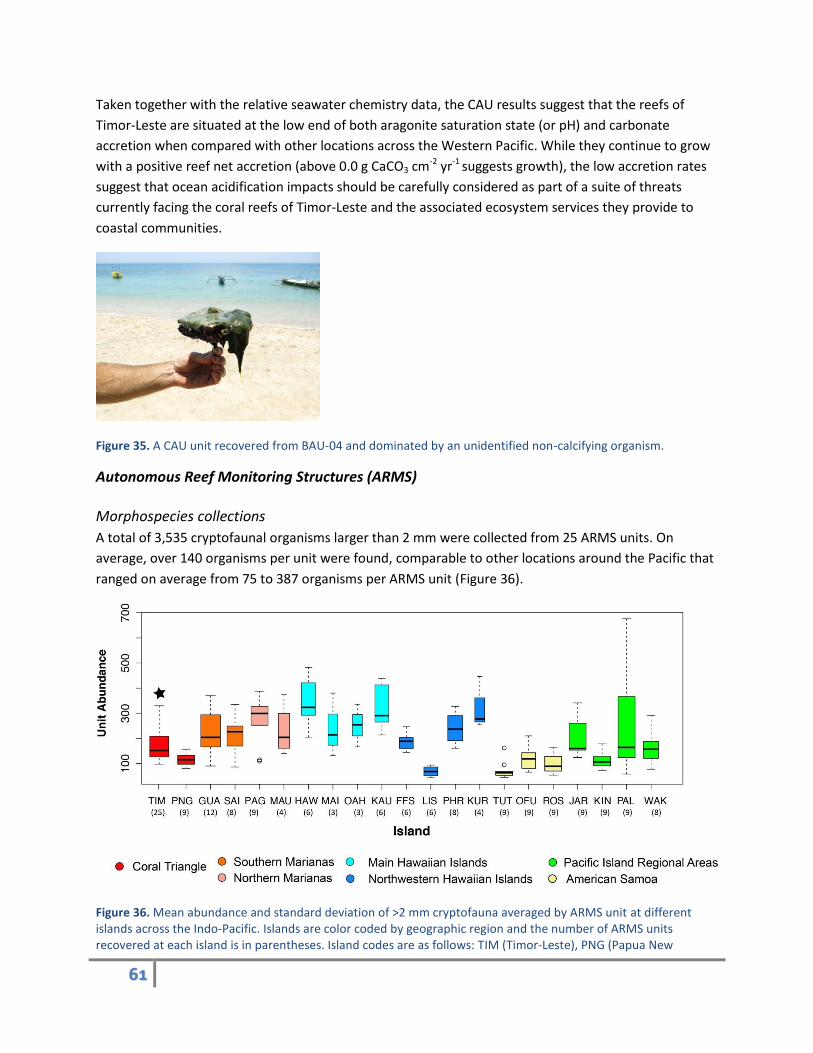
Figure 35. A CAU unit recovered from BAU-04 and dominated by an unidentified non-calcifying organism.
Autonomous Reef Monitoring Structures (ARMS)
Morphospecies collections
A total of 3,535 cryptofaunal organisms larger than 2 mm were collected from 25 ARMS units. On
average, over 140 organisms per unit were found, comparable to other locations around the Pacific that
ranged on average from 75 to 387 organisms per ARMS unit (Figure 36).
Figure 36. Mean abundance and standard deviation of >2 mm cryptofauna averaged by ARMS unit at different islands across the Indo-Pacific. Islands are color coded by geographic region and the number of ARMS units recovered at each island is in parentheses. Island codes are as follows: TIM (Timor-Leste), PNG (Papua New

62
Guinea), GUA (Guam), SAI (Saipan), PAG (Pagan), MAU (Maug), HAW (Hawaii), MAI (Maui), OAH (Oahu), KAU (Kauai), FFS (French Frigate Shoals), LIS (Lisianski), PHR (Pearl and Hermes), KUR (Kure), TUT (Tutuila), OFU (Ofu), ROS (Rose), JAR (Jarvis), KIN (Kingman), PAL (Palmyra), and WAK (Wake).
Sites BOB-02, LAU-05, and MAN-09 had the greatest averaged abundance of >2 mm organisms per
ARMS unit (Figure 37).
Figure 37. Mean abundance and standard deviation of >2 mm cryptofauna average by ARMS unit at each Climate Monitoring site along the north coast of Timor-Leste deployed from October 2012 to September-October 2014.
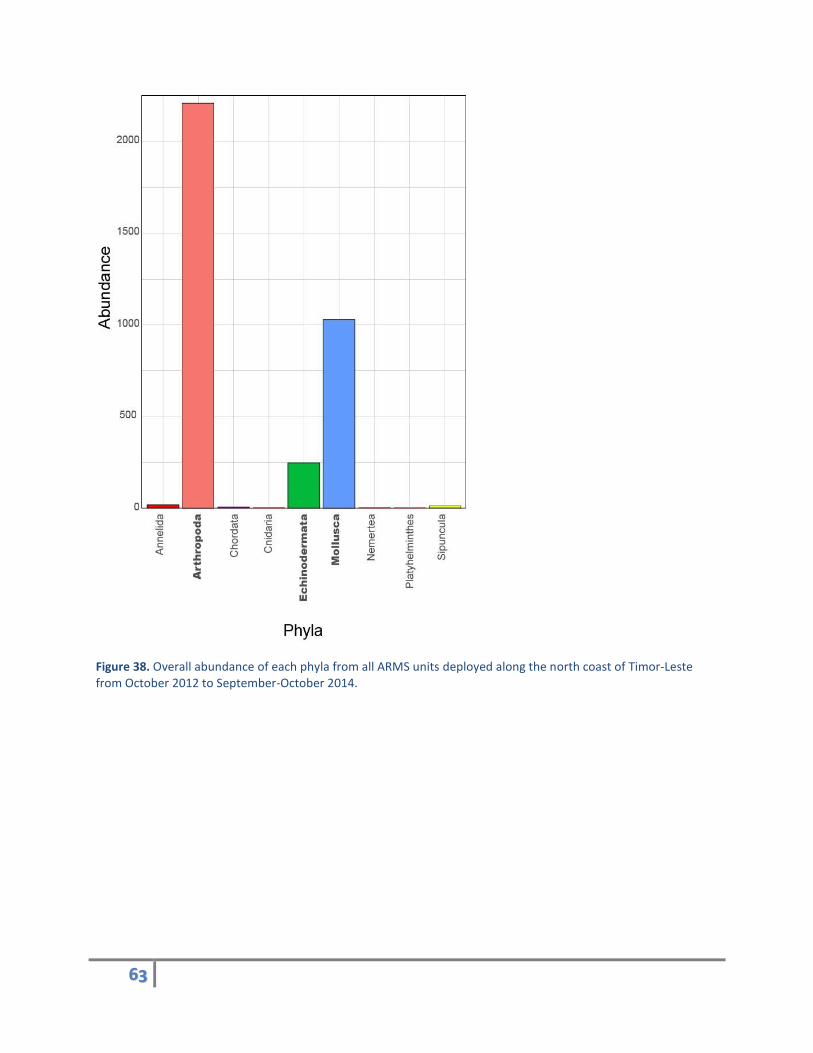
Of the >2 mm motile cryptofauna, a total of nine animal phyla were found on the ARMS units (Figure
38). The three most abundant phyla were Arthropoda (crabs and shrimps), Mollusca (sea slugs, bivalves,
and marine snails), and Echinodermata (sea stars, sea urchins, and sea cucumbers). Abundance of these
three phyla varied among the different sites (Figure 39).
DIL-02 BOB-02 VIL-03 BAU-04 LAU-05 LAU-01 MAN-09 VIL-10
63
Figure 38. Overall abundance of each phyla from all ARMS units deployed along the north coast of Timor-Leste from October 2012 to September-October 2014.

64
Figure 39. Mean abundance and standard deviation of the top three most abundant phyla collected on the ARMS units by site deployed along the north coast of Timor-Leste over the period October 2012 to September-October 2014.
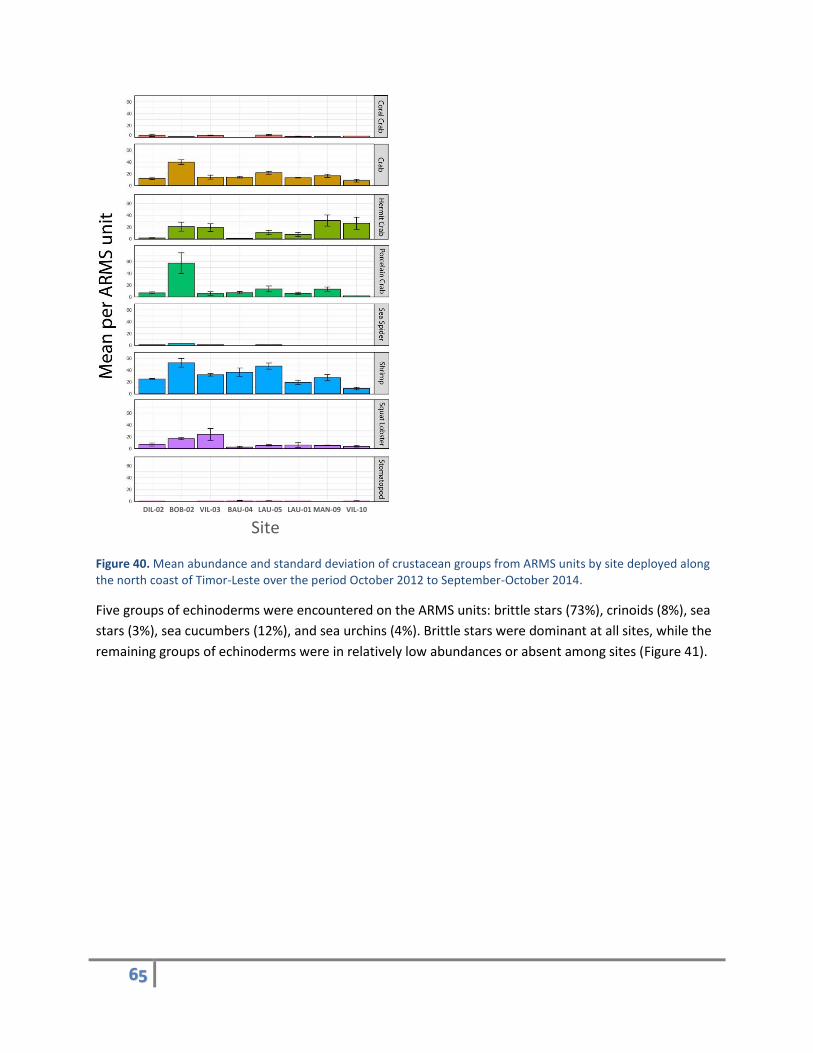
Eight groups of crustaceans (arthropods) were found on the ARMS units: coral guard crabs (2%), crabs
(20%), hermit crabs (16%), porcelain crabs (16%), sea spiders (<1%), shrimps (36%), squat lobsters (9%),
and stomatopods (<1%). The abundance of these groups varied considerably among the sites surveyed
(Figure 40).
DIL-02 BOB-02 VIL-03 BAU-04 LAU-05 LAU-01 MAN-09 VIL-10
Site
65
Figure 40. Mean abundance and standard deviation of crustacean groups from ARMS units by site deployed along the north coast of Timor-Leste over the period October 2012 to September-October 2014.
Five groups of echinoderms were encountered on the ARMS units: brittle stars (73%), crinoids (8%), sea
stars (3%), sea cucumbers (12%), and sea urchins (4%). Brittle stars were dominant at all sites, while the
remaining groups of echinoderms were in relatively low abundances or absent among sites (Figure 41).
DIL-02 BOB-02 VIL-03 BAU-04 LAU-05 LAU-01 MAN-09 VIL-10
Site

66
Figure 41. Mean abundance and standard deviation of echinoderm groups from ARMS units by site by site deployed along the north coast of Timor-Leste over the period October 2012 to September-October 2014.
There were five broad groups of Mollusca found on the ARMS: sea snails, sea slugs, bivalves, chitons,
and octopuses. However, 91% of all Mollusca were gastropod sea snails.
Brachyuran Crab DNA Barcoding Results
A total 494 crabs were recovered from 25 ARMS units, 269 of which were DNA barcoded. Of the 269
crabs, 74 unique Operational Taxonomic Units (OTU) were found. Twenty-six OTUs were identified to
species and 27 OTUs were new barcodes added to the database. Further taxonomic evaluation of these
27 new brachyuran OTUs is needed to determine if they are new species or simply known species that
have not been barcoded.
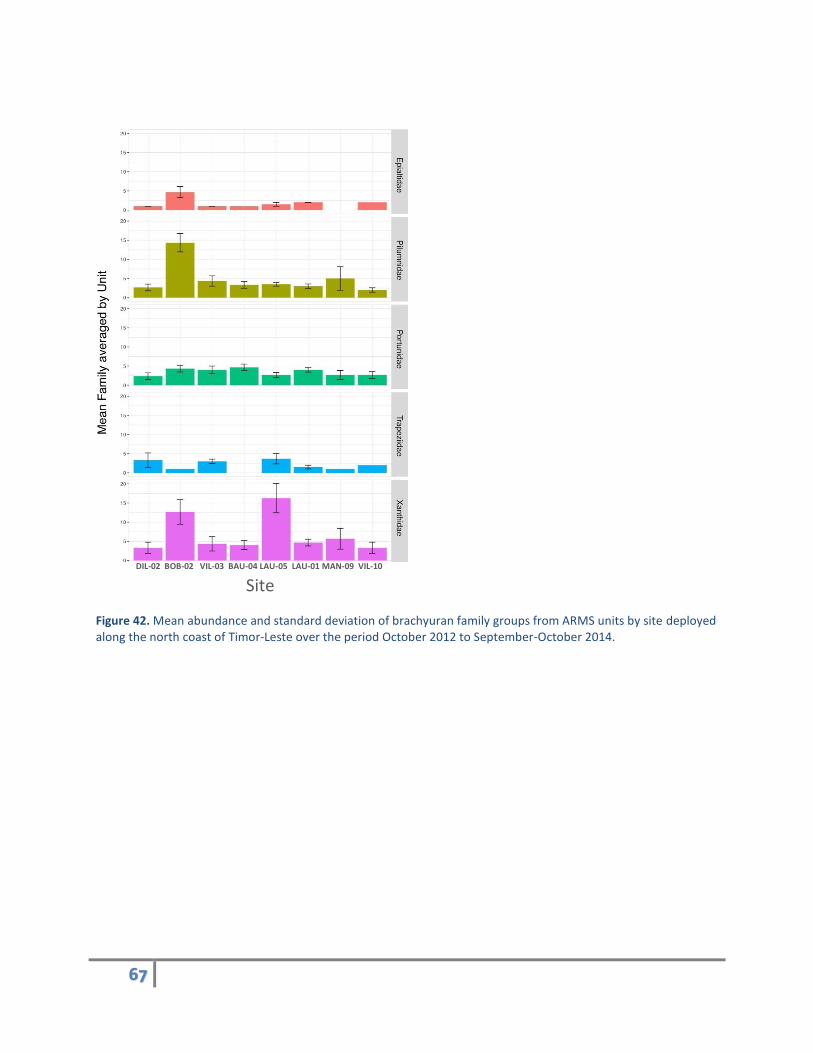
There were 26 brachyuran families in total recorded from the recovered ARMS with 90% of the crabs
from the following five families: Epialtidae, Pilumnidae, Portunidae, Trapezidae, and Xanthidae. Site
BOB-02 had the greatest number of crabs from Epialtidae and Pilumnidae, site BAU-04 had the greatest
number of Portunids and site LAU-05 had the greatest number of Trapezid and Xanthid crabs (Figure
42). Crab OTU richness was greatest at BOB-2 with 33 OTUs, followed by LAU-05 and MAN-09 with 28
and 23 OTUs, respectively. On average, there were approximately 7 crab species per ARMS unit. Other
locations around the Indo-Pacific average from 2 to 16 crab species per ARMS unit.
DIL-02 BOB-02 VIL-03 BAU-04 LAU-05 LAU-01 MAN-09 VIL-10
Site
67
Figure 42. Mean abundance and standard deviation of brachyuran family groups from ARMS units by site deployed along the north coast of Timor-Leste over the period October 2012 to September-October 2014.
DIL-02 BOB-02 VIL-03 BAU-04 LAU-05 LAU-01 MAN-09 VIL-10
Site
68
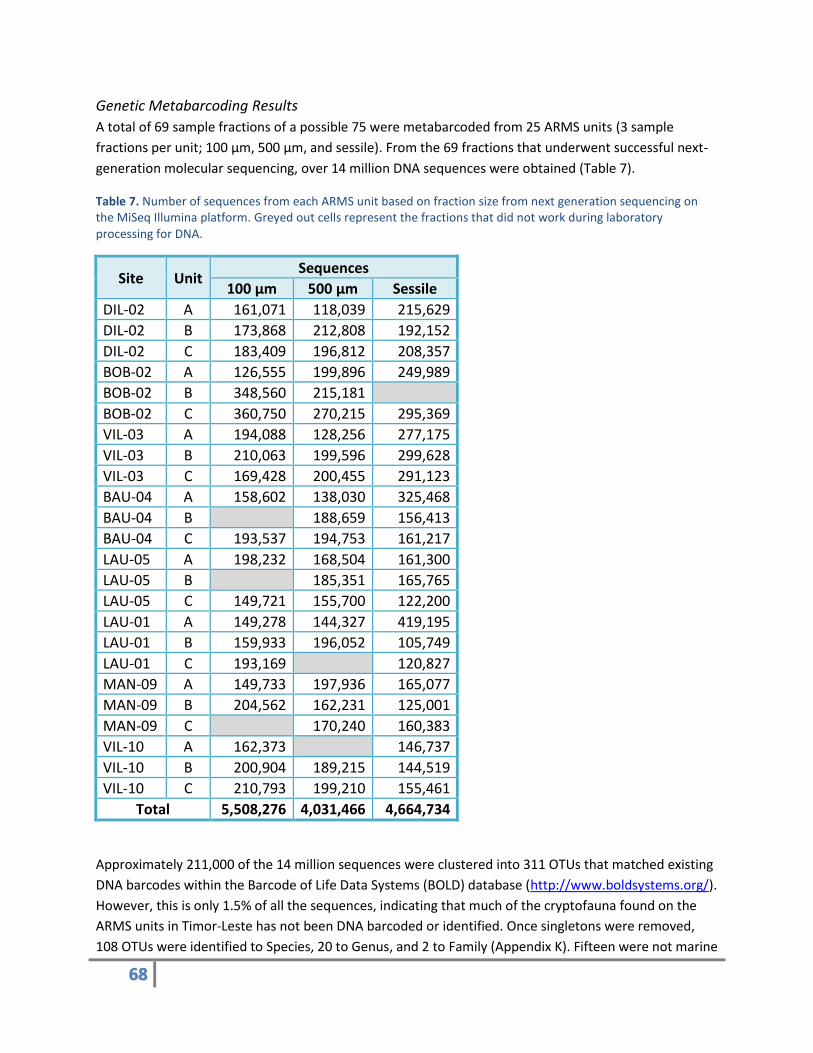
Genetic Metabarcoding Results
A total of 69 sample fractions of a possible 75 were metabarcoded from 25 ARMS units (3 sample
fractions per unit; 100 μm, 500 μm, and sessile). From the 69 fractions that underwent successful next-
generation molecular sequencing, over 14 million DNA sequences were obtained (Table 7).
Table 7. Number of sequences from each ARMS unit based on fraction size from next generation sequencing on the MiSeq Illumina platform. Greyed out cells represent the fractions that did not work during laboratory processing for DNA.
Site Unit Sequences
100 µm 500 µm Sessile
DIL-02 A 161,071 118,039 215,629
DIL-02 B 173,868 212,808 192,152
DIL-02 C 183,409 196,812 208,357
BOB-02 A 126,555 199,896 249,989
BOB-02 B 348,560 215,181
BOB-02 C 360,750 270,215 295,369
VIL-03 A 194,088 128,256 277,175
VIL-03 B 210,063 199,596 299,628
VIL-03 C 169,428 200,455 291,123
BAU-04 A 158,602 138,030 325,468
BAU-04 B 188,659 156,413
BAU-04 C 193,537 194,753 161,217
LAU-05 A 198,232 168,504 161,300
LAU-05 B 185,351 165,765
LAU-05 C 149,721 155,700 122,200
LAU-01 A 149,278 144,327 419,195
LAU-01 B 159,933 196,052 105,749
LAU-01 C 193,169 120,827
MAN-09 A 149,733 197,936 165,077
MAN-09 B 204,562 162,231 125,001
MAN-09 C 170,240 160,383
VIL-10 A 162,373 146,737
VIL-10 B 200,904 189,215 144,519
VIL-10 C 210,793 199,210 155,461
Total 5,508,276 4,031,466 4,664,734
Approximately 211,000 of the 14 million sequences were clustered into 311 OTUs that matched existing
DNA barcodes within the Barcode of Life Data Systems (BOLD) database (http://www.boldsystems.org/).
However, this is only 1.5% of all the sequences, indicating that much of the cryptofauna found on the
ARMS units in Timor-Leste has not been DNA barcoded or identified. Once singletons were removed,
108 OTUs were identified to Species, 20 to Genus, and 2 to Family (Appendix K). Fifteen were not marine
69
organisms but were birds, mammals, or insects. This indicates that samples were slightly contaminated
during the land-based processing. This can happen from not wearing gloves, insects crawling into the
samples during field processing, and eDNA (environmental DNA) from unfiltered salt water used during
processing. Together, these contaminated sequences only represented 6% of the total OTU identified
sequences.
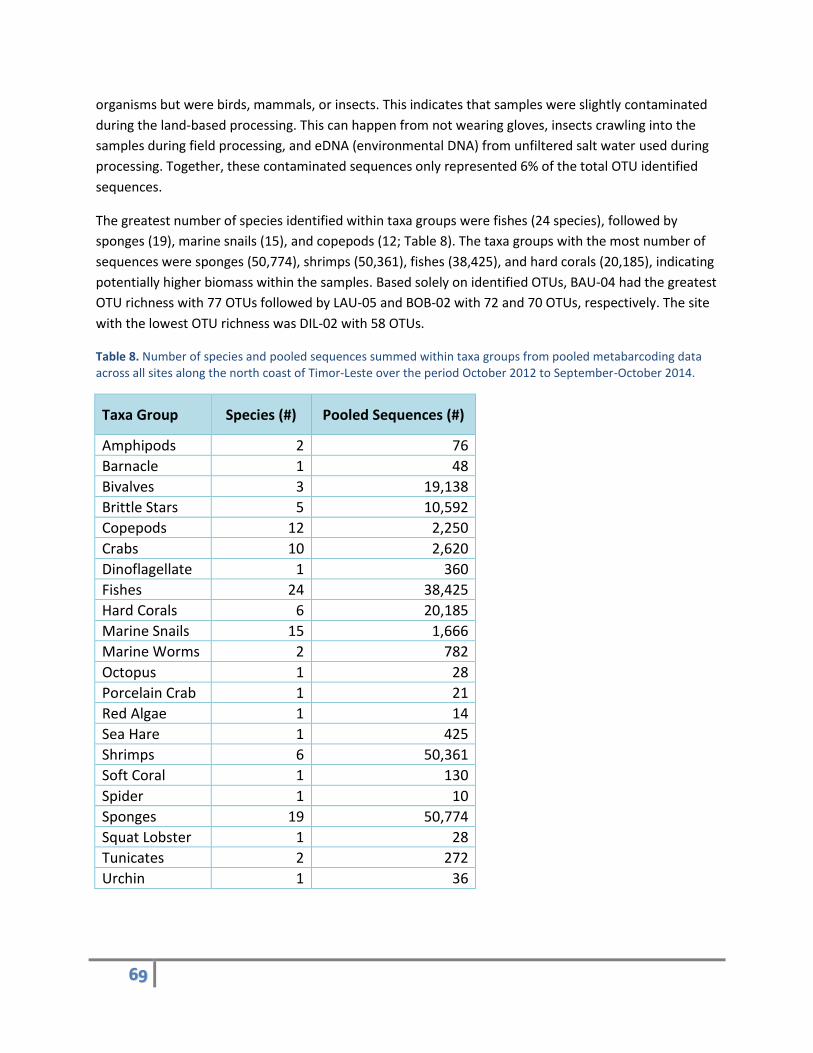
The greatest number of species identified within taxa groups were fishes (24 species), followed by
sponges (19), marine snails (15), and copepods (12; Table 8). The taxa groups with the most number of
sequences were sponges (50,774), shrimps (50,361), fishes (38,425), and hard corals (20,185), indicating
potentially higher biomass within the samples. Based solely on identified OTUs, BAU-04 had the greatest
OTU richness with 77 OTUs followed by LAU-05 and BOB-02 with 72 and 70 OTUs, respectively. The site
with the lowest OTU richness was DIL-02 with 58 OTUs.
Table 8. Number of species and pooled sequences summed within taxa groups from pooled metabarcoding data across all sites along the north coast of Timor-Leste over the period October 2012 to September-October 2014.
Taxa Group Species (#) Pooled Sequences (#)
Amphipods 2 76
Barnacle 1 48
Bivalves 3 19,138
Brittle Stars 5 10,592
Copepods 12 2,250
Crabs 10 2,620
Dinoflagellate 1 360
Fishes 24 38,425
Hard Corals 6 20,185
Marine Snails 15 1,666
Marine Worms 2 782
Octopus 1 28
Porcelain Crab 1 21
Red Algae 1 14
Sea Hare 1 425
Shrimps 6 50,361
Soft Coral 1 130
Spider 1 10
Sponges 19 50,774
Squat Lobster 1 28
Tunicates 2 272
Urchin 1 36

70
Three notable OTUs were detected from the Timor-Leste sequences. All sites contained the OTU
sequence identified as the dinoflagellate, Azadinium spinosum, which is known to produce toxins with
shellfish poisoning (Salas et al. 2011). The tunicate, Symplegma rubra, originally known from the
western Atlantic, was detected at five sites (DIL-02, BOB-02, VIL-03, LAU-01, and VIL-10), and the
sponge, Geodia phlegraei, originally known from the North Atlantic, was found at BAU-04, LAU-05, and
MAN-09.
Benthic Cover
Coral cover was moderate and varied among Climate Monitoring Sites (Figure 43). The greatest levels of
coral cover were reported at sites LAU-01 (40.1%), where branching corals were common, and VIL-10
(38.1%) that was characterized by a variety of massive, encrusting, and branching corals (Appendix E).
Notably, site LAU-01 is located within the recently designated Nino Konis Santana National Park which,
according to Erdmann and Mohan (2013), contains some of the highest biodiversity of all the reefs in the
country and plays an important role in the regional Marine Protected Area Network. Site VIL-10 located
on the Belio Barrier Reef complex off east Atauro Island is also found in a high-quality reef area that
ranked amongst the highest in conservation value (Erdmann and Mohan 2013). Interestingly, these
findings also correspond with the coral cover results by district presented in the benthic community
composition section of the Coral Reef Ecosystem Assessment Chapter in which Atauro and Lautem had
the overall highest hard coral percentages.
Figure 43. Benthic cover (%) based on analyses of benthic photoquadrat images collected at hard-bottom sites around Timor-Leste in September-October 2014. Sites are spatially arranged from west to east. CCA: Crustose coralline algae.
71
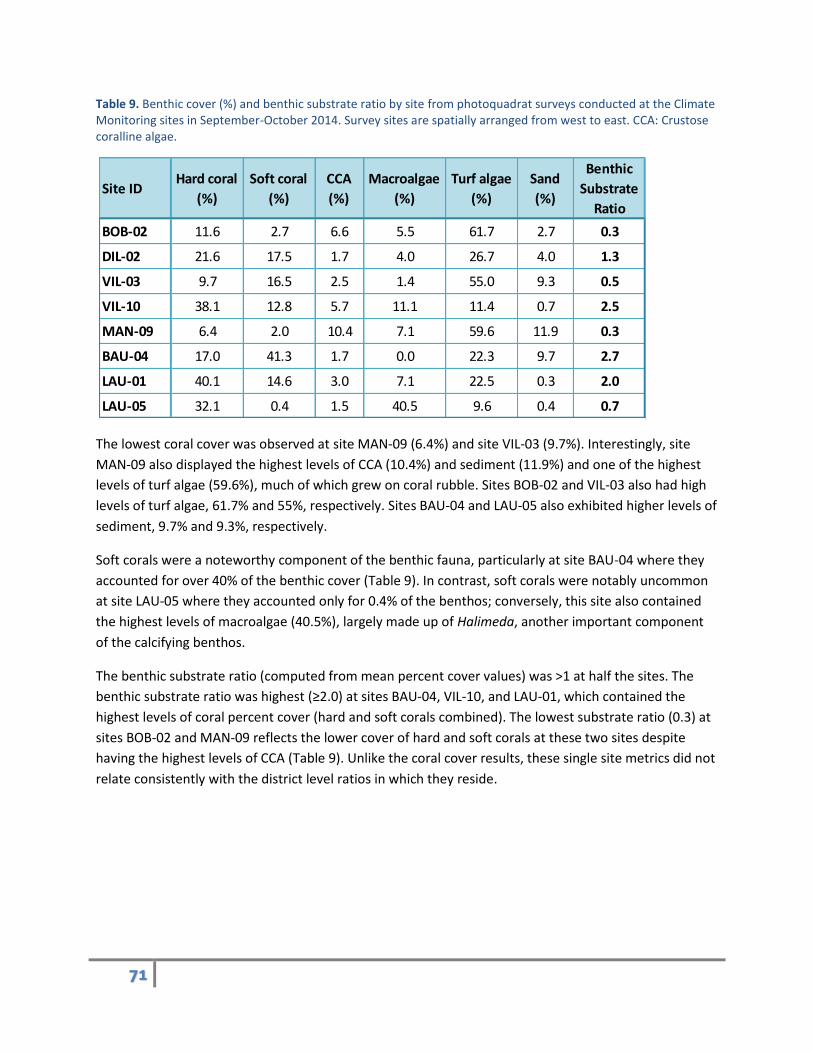
Table 9. Benthic cover (%) and benthic substrate ratio by site from photoquadrat surveys conducted at the Climate Monitoring sites in September-October 2014. Survey sites are spatially arranged from west to east. CCA: Crustose coralline algae.
The lowest coral cover was observed at site MAN-09 (6.4%) and site VIL-03 (9.7%). Interestingly, site
MAN-09 also displayed the highest levels of CCA (10.4%) and sediment (11.9%) and one of the highest
levels of turf algae (59.6%), much of which grew on coral rubble. Sites BOB-02 and VIL-03 also had high
levels of turf algae, 61.7% and 55%, respectively. Sites BAU-04 and LAU-05 also exhibited higher levels of
sediment, 9.7% and 9.3%, respectively.
Soft corals were a noteworthy component of the benthic fauna, particularly at site BAU-04 where they
accounted for over 40% of the benthic cover (Table 9). In contrast, soft corals were notably uncommon
at site LAU-05 where they accounted only for 0.4% of the benthos; conversely, this site also contained
the highest levels of macroalgae (40.5%), largely made up of Halimeda, another important component
of the calcifying benthos.
The benthic substrate ratio (computed from mean percent cover values) was >1 at half the sites. The
benthic substrate ratio was highest (≥2.0) at sites BAU-04, VIL-10, and LAU-01, which contained the
highest levels of coral percent cover (hard and soft corals combined). The lowest substrate ratio (0.3) at
sites BOB-02 and MAN-09 reflects the lower cover of hard and soft corals at these two sites despite
having the highest levels of CCA (Table 9). Unlike the coral cover results, these single site metrics did not
relate consistently with the district level ratios in which they reside.
Site IDHard coral
(%)
Soft coral
(%)
CCA
(%)
Macroalgae
(%)
Turf algae
(%)
Sand
(%)
Benthic
Substrate
Ratio
BOB-02 11.6 2.7 6.6 5.5 61.7 2.7 0.3
DIL-02 21.6 17.5 1.7 4.0 26.7 4.0 1.3
VIL-03 9.7 16.5 2.5 1.4 55.0 9.3 0.5
VIL-10 38.1 12.8 5.7 11.1 11.4 0.7 2.5
MAN-09 6.4 2.0 10.4 7.1 59.6 11.9 0.3
BAU-04 17.0 41.3 1.7 0.0 22.3 9.7 2.7
LAU-01 40.1 14.6 3.0 7.1 22.5 0.3 2.0
LAU-05 32.1 0.4 1.5 40.5 9.6 0.4 0.7

72